the Creative Commons Attribution 4.0 License.
the Creative Commons Attribution 4.0 License.
 | 13 Aug 2025
Water chemistry and greenhouse gas concentrations in waterbodies of a thawing permafrost peatland complex in northern Norway
Jacqueline K. Knutson
François Clayer
Peter Dörsch
Sebastian Westermann
Heleen A. de Wit
Thermokarst ponds in thawing permafrost landscapes play a considerable role in greenhouse gas (GHG) emissions despite their small size, yet they remain underrepresented in Earth system models. Transitions from hydrologically isolated thermokarst ponds in peat plateaus to connected wetlands can substantially alter GHG dynamics. However, the processes and GHG impacts of these shifts are not well understood, particularly in the sporadic permafrost zones of Fennoscandia. To address this, we investigated water chemistry, dissolved organic matter (DOM) processing, and GHG fluxes over two years at the Iškoras site in northern Norway, where a degrading peat plateau includes both thermokarst ponds and an adjacent wetland stream. Thermokarst ponds exhibited low pH, high organic acidity, high oversaturation of dissolved carbon dioxide (CO2), and, especially, high concentrations of dissolved methane (CH4). The adjacent wetland stream, however, with near-neutral pH, showed lower CH4 concentrations and organic acidity but significantly higher CO2 emissions, despite moderate saturations driven by turbulence and bicarbonate replenishment. By contrast, CO2 emissions in ponds were primarily linked to DOM mineralization. Despite differences in chemistry, DOM mineralization rates were similar between ponds and the stream sites, suggesting that environmental factors like pH and microbial community differences counteract DOM lability variations. As permafrost decays and transitions from peat plateaus to wetlands, ponds as hotspots of CH4 emissions will disappear. However, total GHG fluxes across the peatland–wetland continuum will depend on wetland emissions, where CH4 emissions are usually considerable, and the fate of organic matter within the plateau. Lateral DOM fluxes may represent a significant loss of soil organic carbon (OC), highlighting the importance of hydrological connectivity in linking terrestrial and aquatic systems. This study emphasizes the need to account for the relationship between hydrological and chemical processes when assessing C and GHG fluxes in permafrost-impacted regions.
- Article
(3217 KB) - Full-text XML
-
Supplement
(789 KB) - BibTeX
- EndNote


Northern-latitude permafrost regions hold one of the largest terrestrial carbon reservoirs on the planet (Schuur et al., 2008; Schuur et al., 2015; Walter et al., 2006). Although covering only about 15 % of global soils, these regions store an estimated 1400–1600 Pg of organic carbon (OC) (Hugelius et al., 2014; Schuur et al., 2022; Strauss et al., 2025), making them a critical component of the global carbon (C) cycle. Sequestered under cold and oxygen-limited conditions, this C is increasingly vulnerable to release as permafrost thaws due to climate warming, generating significant feedbacks that complicate predictions of future climate trajectories (Hugelius et al., 2020; Schuur et al., 2008, 2015; Walter et al., 2006). As permafrost degrades, the release of greenhouse gases, particularly methane (CH4) and carbon dioxide (CO2), through the microbial decomposition of previously frozen organic matter (OM), can rapidly escalate the impact of this feedback (Schuur et al., 2008; Walter et al., 2008; Wik et al., 2016; Zimov et al., 2006). While the large-scale thaw of permafrost is widely recognized (Leppiniemi et al., 2023) and permafrost regions warm three to four times faster than the global average (Meredith et al., 2019), the timing, magnitude, and pathways of carbon release remain uncertain, influenced by such processes as burial, mobilization, lateral export, and mineralization (Verdonen et al., 2023; Vonk et al., 2015).
Permafrost thaw leads to irreversible landscape transformations. Peatlands in northern Norway are predominantly located in the sporadic permafrost zone, where they form distinctive landscape features, such as peat plateaus and palsas. These are peat uplands and mounds with a frozen core, elevated above the water table by the formation of segregation ice (Alewell et al., 2011; Krüger et al., 2017). As these features degrade, permafrost thaw is often abrupt and subsidence and collapse is to be expected, leading to the formation of thermokarst ponds, as excess ground ice is lost (Martin et al., 2021). More than half of the permafrost areas in the Scandinavian Peninsula are at risk of disappearing under current and projected climate conditions (Gisnås et al., 2017; Schuur et al., 2008). The areal extent of peat plateaus in this region decreased by 33 %–71 % between the 1950s and the 2010s, with rapid degradation observed during the last decade (Borge et al., 2017). This regional degradation mirrors processes observed across the northern hemisphere, including in the Canadian Arctic, European Russia, and the Kola Peninsula, highlighting the vulnerability of sporadic permafrost regions to warming climates (Krutskikh et al., 2023; Payette et al., 2004; Sannel and Kuhry, 2011). While the processes driving permafrost thaw and landscape transformations, such as thermal disturbances, vegetation shifts, and subsidence, are relatively well-studied, their consequences for greenhouse gas (GHG) fluxes and C cycling remain uncertain, limiting our ability to project future climate feedbacks (Holmes et al., 2022; Olefeldt et al., 2021; Turetsky et al., 2020).
Among the new landscape forms that emerge from degrading peat plateaus, thermokarst ponds and wetlands play a critical role in greenhouse gas dynamics. These small aquatic systems, formed by the thaw and collapse of permafrost, are characterized by high concentrations of dissolved organic carbon (DOC) and dissolved inorganic carbon (DIC) (Abnizova et al., 2012; Martin et al., 2021; Matveev et al., 2018). Thermokarst ponds, in particular, act as hotspots for CH4 and CO2 emissions due to unique biogeochemical conditions, including hydrological isolation, anoxic sediments, and high organic matter availability (in 't Zandt et al., 2020; Polishchuk et al., 2018; Vonk et al., 2015; Ward and Cory, 2015). Despite the small size of thermokarst ponds, these waterbodies can contribute significantly to regional C fluxes, with CH4 and CO2 supersaturation levels often surpassing those of larger lakes – whether thermokarst or not – or surrounding tundra ecosystems (Abnizova et al., 2012; Kuhn et al., 2018; Shirokova et al., 2012). However, the contributions of thermokarst ponds are often overlooked in large-scale C assessments, as they remain difficult to detect using satellite-based methods because of their small size (Holgerson and Raymond, 2016; Muster et al., 2017).
As permafrost thaw progresses, the transition of isolated thermokarst ponds to interconnected wetland systems further alters GHG dynamics. While northern permafrost wetlands currently act as a C sink, the inclusion of thaw pond emissions into broader wetland carbon budgets reveals their potential to offset the sink capacity by 39 % (Kuhn et al., 2018). Compared with thermokarst ponds, wetlands have sustained CH4 fluxes over larger areas, due to persistent waterlogging and OM decomposition (Pirk et al., 2024; Swindles et al., 2015; Turetsky et al., 2020), thus constituting important long-term CH4 sources (Bansal et al., 2023). The transformation from stable permafrost to thermokarst landscapes is accompanied by shifts in hydrology, OM lability, and microbial activity, which collectively shape CO2 and CH4 production pathways (Holmes et al., 2022; Laurion et al., 2020). Understanding the dynamics of these evolving permafrost and wetland systems is critical for assessing the broader impacts of permafrost thaw on regional C uptake and emissions, as well as global C cycles.
Northern Norway's sporadic permafrost zone, with its abundant small thermokarst ponds and emerging wetlands, provides a valuable opportunity to investigate carbon cycling in rapidly evolving subarctic landscapes. The region's degrading peat plateaus host significant C stocks, yet small aquatic systems, especially those in Fennoscandia, remain underrepresented in Earth system models (Abnizova et al., 2012; Muster et al., 2019; Muster et al., 2017). While existing studies emphasize the importance of quantifying CH4 and CO2 fluxes in these environments and their implications for C budgets (Abnizova et al., 2012; Matveev et al., 2018), the interactions between hydrology, vegetation, and carbon processing are not well understood. Yet such processes are central to key questions regarding how transitions between permafrost, thermokarst, and wetland systems influence C dynamics and whether these landscapes function as net C sources or sinks under changing climatic conditions (Sim et al., 2021). In particular, peatland ponds and thermokarst waterbodies exhibit unique biogeochemical cycling from lakes, driven more by internal dynamics than external watershed inputs (Arsenault et al., 2022). These differences remain poorly represented in both observational datasets and Earth system models.
This study aims to address these gaps by examining the GHG dynamics and C biogeochemistry of thermokarst ponds and wetland streams in the sporadic permafrost zone of northern Norway. Over two years, we collected a novel dataset combining biogeochemical and dissolved gas measurements with C flux data from thermokarst ponds and a wetland stream within a small permafrost peatland plateau undergoing rapid permafrost degradation. This setting captures a landscape in active transition from isolated thermokarst ponds to interconnected wetlands. We hypothesize that (1) thermokarst ponds serve as hotspots of CH4 and CO2 production, relative to the wetland stream; (2) the transition from isolated ponds to wetlands significantly alters GHG emission pathways, driven by shifts in hydrology and OC availability; and (3) recently mobilized OM from thawing permafrost presents a labile source of C, promoting CO2 production in thermokarst water bodies compared with the wetland stream. By exploring these dynamics, this study provides insights into the role of small water bodies in permafrost-C feedbacks, advancing our understanding of subarctic and boreal C cycling.
2.1 Study area
The Iškoras field site (69.34° N, 25.29° E; 381 m a.s.l.) is a permafrost peatland plateau located in the interior of Finnmark province, northern Norway, on the Finnmarksvidda (Fig. 1). The region of the Finnmarksvidda lies between 300 and 500 m a.s.l. and is characterized by a subarctic continental climate. The topography was shaped by Pleistocene glaciations, which deposited ground moraines and glaciofluvial and glaciolacustrine sediments (Sollid et al., 1973). The depressions in the landscape are commonly filled with peatlands (Borge et al., 2017); peat plateaus underlain by permafrost are common.
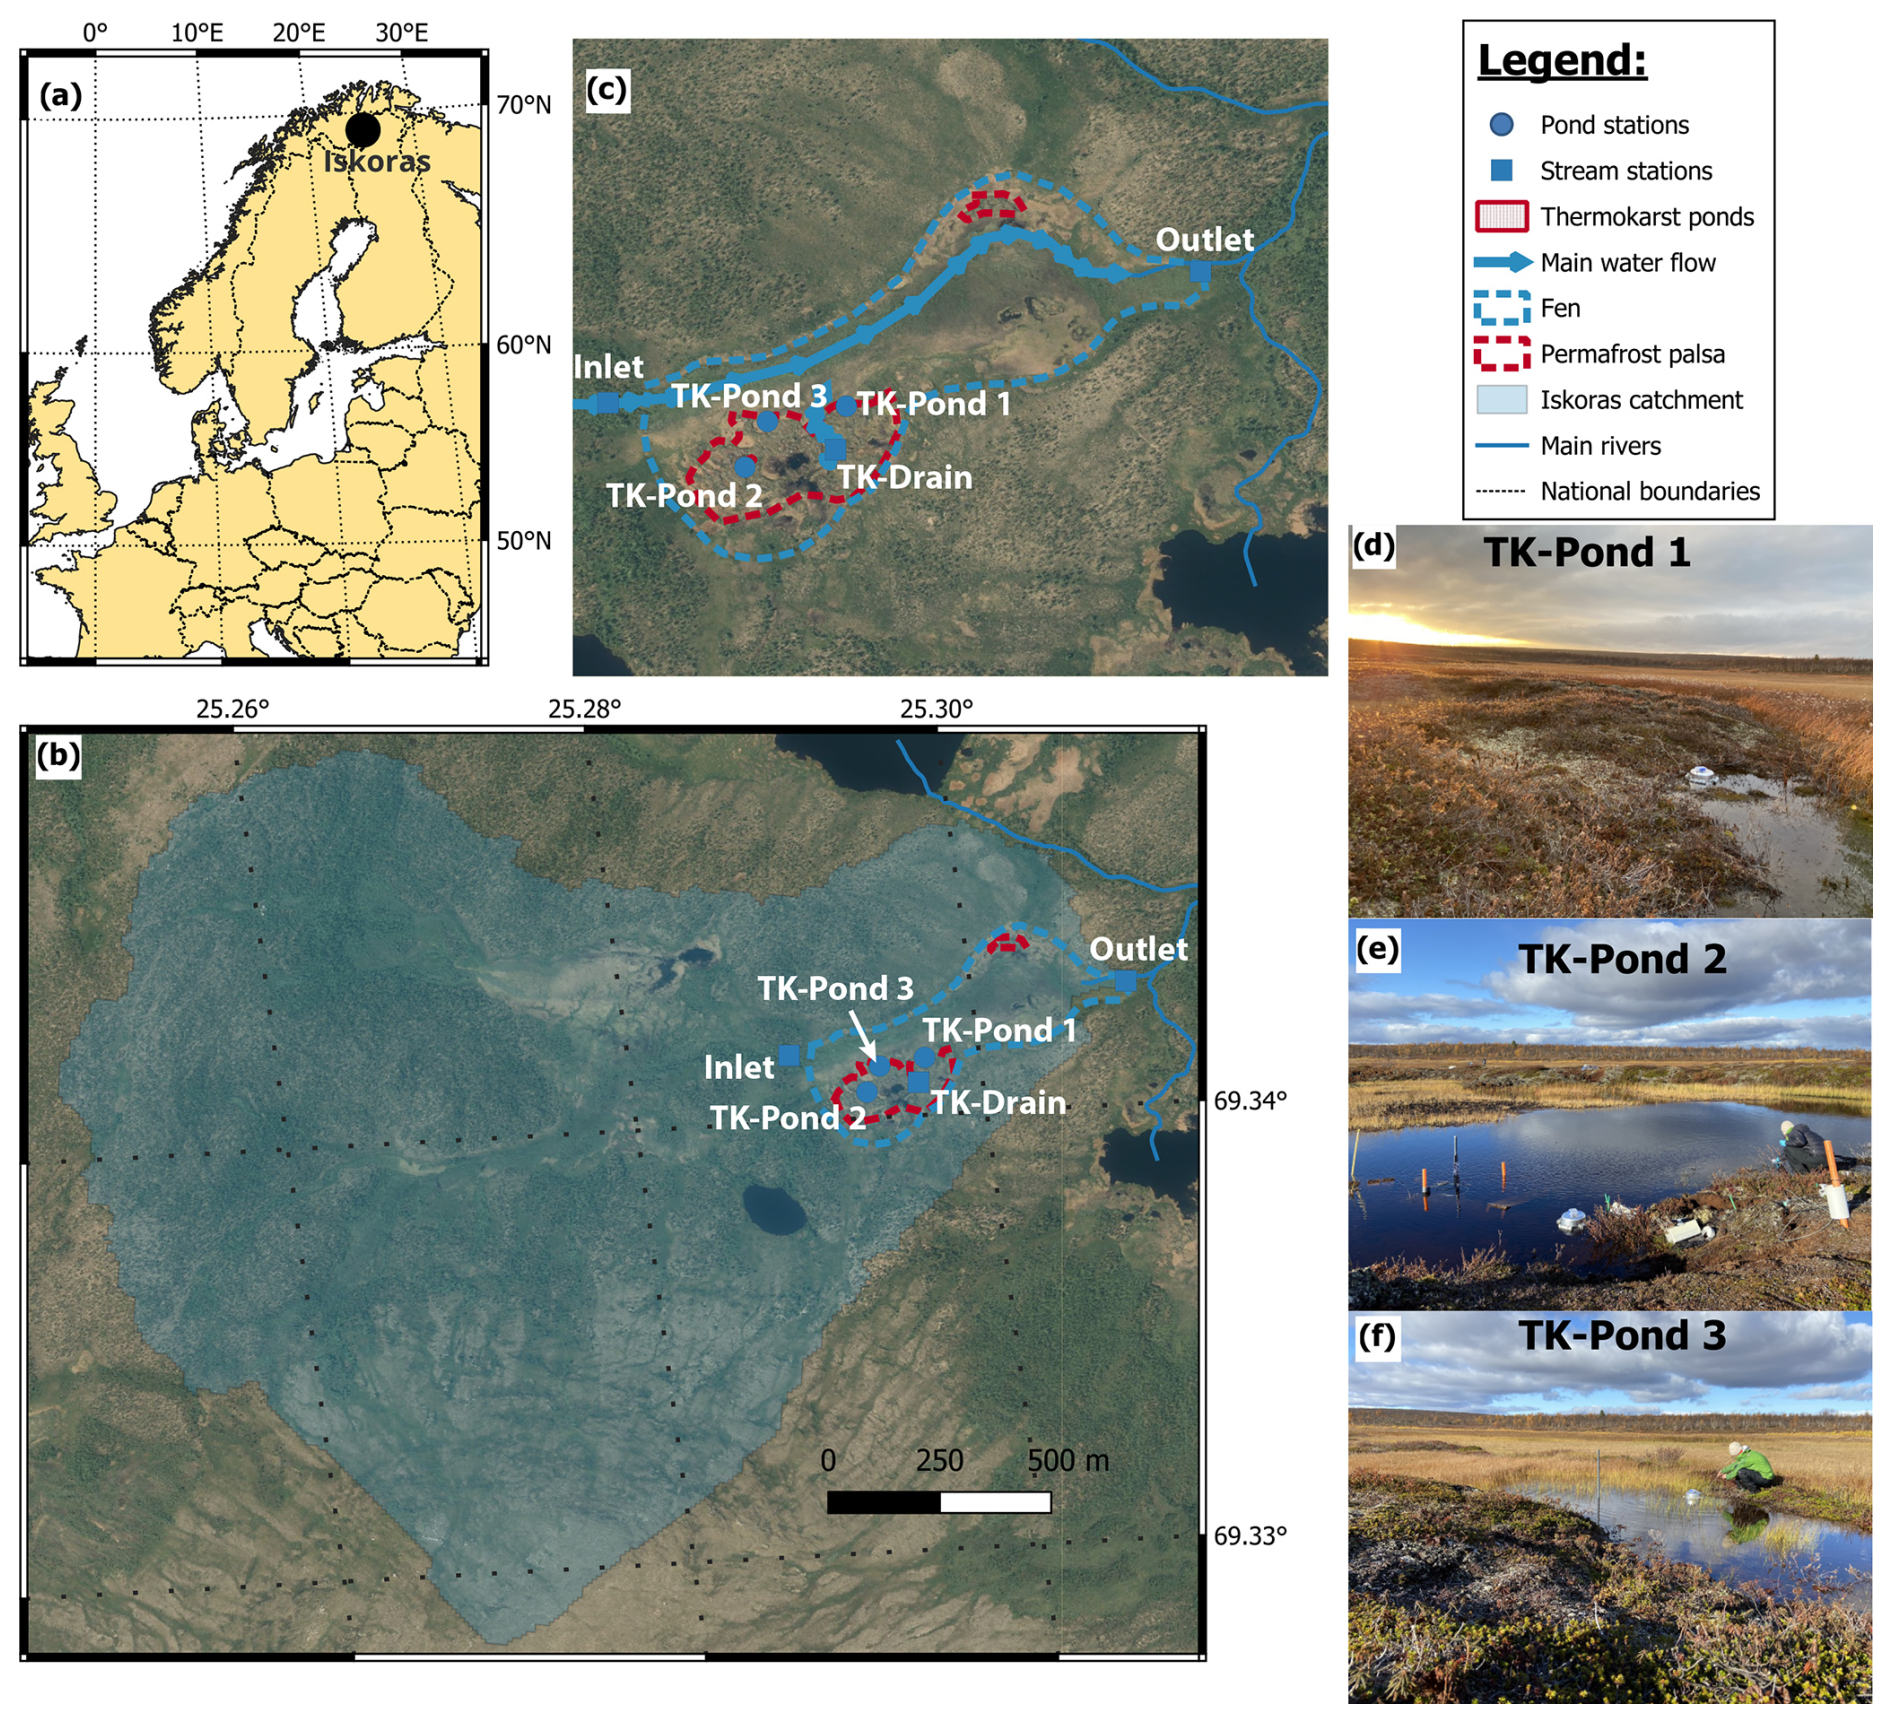
Figure 1Location map of the study area in (a) Europe and (b) the Iškoras catchment (aerial image by the Norwegian Mapping Authority, Norgeibilder, 2024), determined from the outlet station (Outlet). (c) Close-up of the wetland (Norgeibilder, 2024) with regular sampling sites and main water flow direction. (d–f) Pictures of the three main pond sites.
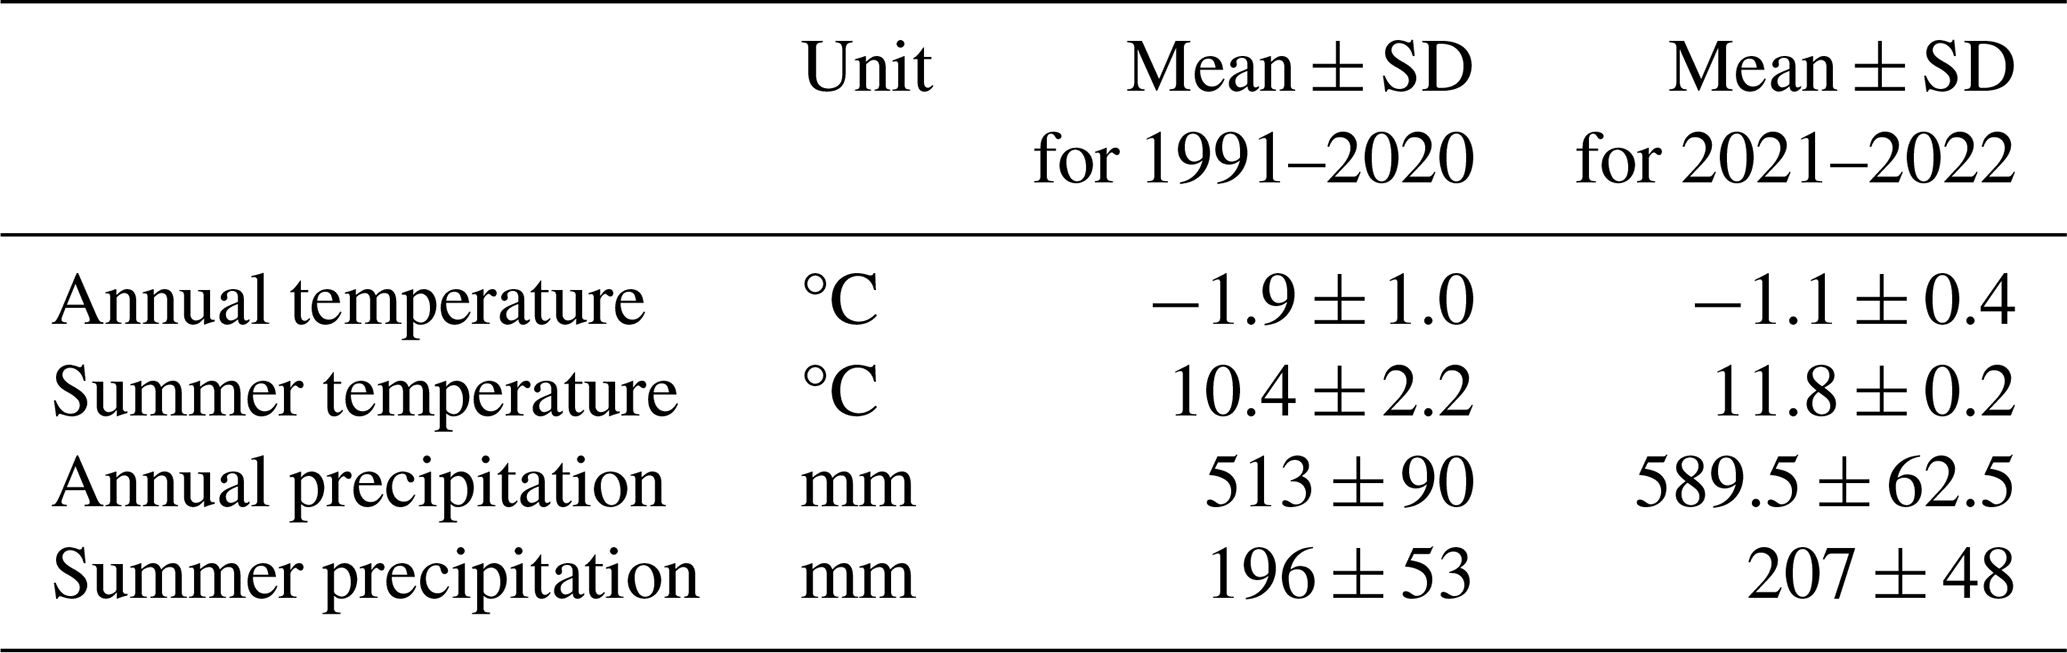
The Iškoras peat plateau covers an area of approximately 4 ha and is part of a 3.3 km2 subarctic headwater catchment that drains into the Báhkiljohka river (91 km2). Mean annual air temperature and precipitation for the 30-year normal (1991–2020) period were −1.9 °C and 513 mm, respectively (Table 1). For our study period, 2021–2022, MAAT and MAP were −1.1 °C and 589.5 mm, respectively (SeNorge, 2023). Iškoras lies within the zone of sporadic permafrost; the peat soils extend down to about 1.5 m in the plateau areas (Kjellman et al., 2018), with active-layer depths up to 90 cm. The plateau exhibits a complex surface of intact and degrading palsas, along with thermokarst ponds, and is surrounded by wetlands and a stream to the northwest (Martin et al., 2019). Between 2019 and 2022, up to 0.8 m of subsidence of palsas was measured at localized sites (Pirk et al., 2024). The site is located about 90 km south of the nearest coastal fjord and is dominated by mountain birch (Betula pubescens) forest and tundra vegetation, including dwarf birch (B. nana). The plateau consists primarily of low heath shrubs, Ericaceae (Empetrum nigrum, Rhododendron tomentosum), lichen crusts, mosses, and cloudberry (Rubus chamaemorus) or bare ground, while the surrounding wetlands are dominated by sphagnum mosses, sedges (Carex spp.), and cotton-grass (Eriophorum spp.) (Kjellman et al., 2018; Martin et al., 2019).
Table 1Mean and interannual standard deviation (shown as mean ± SD) of climate parameters for the Iškoras catchment for the normal period (1991–2020) and the study period (2021–2022). Summer is defined as May to September.
The study area included water bodies within a peat plateau and the adjacent wetland, selected for sampling and monitoring. Measurements and samples were taken approximately monthly in the ice-free season from May until October in 2021 and 2022 (full details in Table S1). The waterbodies consisted of three thermokarst ponds (TK-Pond 1, 2, and 3), a seasonal drainage channel (TK-Drain) connecting the peat plateau to the wetland, and the wetland's inlet and outlet streams (Inlet, Outlet), with the Outlet also marking the terminus of the Iškoras catchment. From mid-May to early November, monitoring showed that the thermokarst ponds and Inlet were ice-free for 170 ± 5 d, while the Outlet remained ice-free for 184 d (Table S2).
The thermokarst ponds varied in hydrological connectivity and permafrost influence, reflecting differences in age and physical characteristics. TK-Pond 1 (0.4 m deep) is small and located at the peat plateau–wetland transition, experiencing periodic hydrological isolation. TK-Pond 2, the largest and deepest (1.5 m deep), lies centrally on the peat plateau, surrounded by degrading palsas. TK-Pond 3 (0.6 m deep) is situated at the plateau's edge and was initially isolated by a surrounding permafrost mound.
The TK-Drain is a shallow, ephemeral drainage channel that provides the primary hydrological connection between the peat plateau and wetland. The wetland's inlet stream (0.6 m wide, 15–40 cm deep) begins approximately 200 m upstream of the plateau, flowing through birch forest and mires without permafrost before entering the wetland, where the channel becomes less defined. The outlet stream (0.8 m wide, 30–60 cm deep) re-emerges approximately 700 m downstream at the far end of the wetland, serving as the catchment outlet.
Between September 2020 and October 2022, a total of nine field campaigns were conducted for regular sampling of water chemistry, dissolved gases, CO2 emissions, GHG production using the dark incubation method, and high-frequency monitoring of water height and temperature.
2.2 Water chemistry
Water samples for chemical analysis were collected using standardized procedures. From each site, 500 mL unfiltered water was collected in rectangular HDPE bottles (Emballator Melledrud AB, Stockholm, Sweden) after rinsing with sample waters three times, kept dark after sampling, carried out of the field, and stored within hours after sampling at 4 °C. The samples were then transported by car and plane back to the laboratory and delivered for chemical analysis; they were kept in the laboratory at 4 °C until analysis. To ensure that our sampling procedures were suitable for the determination of nutrient concentrations, we performed a comparison of different field procedures, including acidification and filtration in the field (see the Supplement). We found no significant differences between procedures (Table S4). Chemical analysis of pH, electrical conductivity (EC), and concentrations of sulfate (SO), silica (SiO2), ammonium (NH), nitrate (NO), total phosphorous (totP), total organic carbon (TOC), DOC, and particulate organic carbon (POC) in the water samples was conducted at accredited laboratories at the Norwegian Institute for Water Research (NIVA); methods for analysis and quality control are described in the ICP Waters Programme Manual (Gundersen et al., 2025). The samples were not fully digested according to standard procedures required for the determination of total nitrogen (totN), hence totN values are expected to be underestimated and are therefore not shown in the manuscript, although the values were sufficient to confirm that the dominant form of N was organic (Thrane et al., 2020)
Absorption spectra of dissolved organic matter (DOM) were measured at NIVA for wavelengths between 200 and 900 nm, using 1 nm intervals, with a 5 cm cuvette length and Milli-Q water as a reference, using a Lambda 40 UV/Vis spectrophotometer (Perkin Elmer, USA) and expressed in absorbance per centimetre. In two samples, incomplete filtration caused excess scattering; these spectra were removed. The absorbance values at 254 nm (Aλ254 nm) were used to calculate specific UV absorbance, expressed as sUVa = Aλ254nm mg C L−1, and the specific UV absorption ratio (SAR = ) was calculated for each sample.
2.3 Dissolved gas analysis
Dissolved gases (CO2, CH4) were sampled in the field using the acidified headspace technique (Åberg and Wallin, 2014). Duplicate gas samples were collected, according to Valiente et al. (2022), with 50 mL syringes. These were filled and sealed underwater without air bubbles to prevent gas loss. Excess water was expelled to retain 30 mL, and 20 mL of ambient air was drawn in to create a headspace. All samples were acidified with 0.6 mL of 3 % HCl to achieve pH<2, ensuring DIC was present as CO2. Equilibrium was reached by shaking for 1 min, followed by a 30 s rest, thrice; then 15 mL of headspace gas was transferred to 12 mL evacuated vials. Water temperature in the syringe was measured immediately after gas transfer. Samples were stored at room temperature and flown to southern Norway for analysis. A 15 mL ambient air sample was taken daily for background correction.
Analysis was performed via automated gas chromatography (GC) at the Norwegian University of Life Sciences (NMBU), as described by Yang et al. (2015). A GC autosampler (GC-Pal, CTC, Switzerland) injected 2 mL headspace samples into an Agilent 7890A GC unit (Santa Clara, CA, USA) with a 20 m wide-bore PoraPLOT Q column at 38 °C, using He as the carrier gas to separate CH4 and CO2 from Ar, N2, and O2. For calibration, certified standards of CO2 and CH4 in He were used (AGA, Germany) and N2, O2, and Ar were calibrated using laboratory air. CH4 was measured with a flame ionization detector (FID). A thermal conductivity detector (TCD) was used to measure all other gases.
Dissolved gas concentrations were calculated from headspace concentrations corrected for background air, applying temperature-adjusted Henry's law constants (Wilhelm et al., 1977) based on the recorded water temperature. At pH>4, a non-negligible amount of DIC is in the form of (bi)carbonates (HCO, CO). The bicarbonate concentrations were calculated based on pH, total dissolved CO2 (after acidification), and the temperature-adjusted first dissociation constant (pK1=6.41 at 25 °C; Stumm and Morgan, 1995) of the carbonic acid equilibrium. Dissolved CO2 was calculated as DIC minus bicarbonate. To facilitate comparisons with existing studies reporting dissolved gases in microatmospheres, we converted dissolved gas concentrations to CO2 or CH4 saturation indices (GHGSI), assuming atmospheric partial pressures of CO2 and CH4 of 400 and 1.9 µatm, respectively:
where [GHG] is the measured dissolved CO2 or CH4 concentration and [GHG]saturation is the concentration of dissolved CO2 or CH4 at equilibrium with the corresponding atmospheric partial pressure.
2.4 Diffusive CO2 fluxes from water to atmosphere
Measurements of CO2 fluxes from water to atmosphere (diffusive CO2 fluxes) were measured at each site for 30–60 min using custom-made opaque flux chambers, as described by Bastviken et al. (2015), at the water–air interface. The chamber consists of a Senseair K30 sensor (Senseair AB, Delsbo, Sweden) housed within a plastic bucket that records pCO2, temperature, and relative humidity every 30 s. Fluxes are calculated from the linear increase in pCO2, corrected for ambient temperature and humidity, in the chamber (Bastviken et al., 2015), considering the internal air volume and the water surface area covered by the chamber. Single measurements with a linear increase in pCO2 with time associated with a coefficient of determination (R2) lower than 0.9 were discarded.
2.5 Dark incubation
Water samples were collected for short-term dark incubations started directly in the field and lasting between 18 and 30 h to estimate DOM mineralization and GHG production rates. Serum flasks (120 mL) were filled with 80 mL of water with a 50 mL syringe equipped with a long tube. The syringe was filled and closed under water and the water was gently pushed to the bottom of the serum flask to prevent gas loss. The remaining 40 mL were left with ambient air as headspace. The flasks were crimp-sealed with gas-tight butyl-rubber septa, sealed, covered with aluminium foil, kept at field temperature (for a maximum of 6 h), and transported back from the field to be stored at room temperature (18–20 °C). The day following the sampling (18 to 30 h after sampling), the incubations were stopped by adding 1.6 mL 3 % HCl to reach a final pH below 2, after which gas samples were taken, following the protocols described previously. Results from the dark incubation were expressed as rates of DIC production over the course of the incubation period by comparison with initial DIC concentrations and reported in units of µM h−1:
where [DIC]f is the final solute concentration in the dark incubation, [DIC]0 is the initial solute concentration taken in the field (µM, see Sect. 2.3), and h is the incubation duration in hours. In addition, we normalized the DIC production rate by DOC concentration to estimate DOM mineralization rates (per time unit). Also, we calculated the first-order DOM decay rate (yr−1) using the exponential decay rate model (Mostovaya et al., 2017). The exponential decay model, based on early studies on sediment diagenesis (Boudreau and Ruddick, 1991; Westrich and Berner, 1984), is often the best model to describe decay rates from bioassays in closed systems (Vähätalo et al., 2010) and has been widely used to describe DOM degradation reactions. Under the exponential decay model, the decay constant (kDOM; yr−1) can be expressed as
where DOC is the DOC concentration (µg L−1), MC is the molecular mass of C (g mol−1), and 8766 is the number of hours in a year. Where [DIC]f was equal to or below [DIC]0, we removed the values from the dataset, assuming that the temperature correction of [DIC]0 was not precise enough (3 of 39 samples) to allow quantification of CO2 processing rates. These occurred in September 2020 and October 2021, under cold field conditions, when [DIC]0 was overestimated because the sample temperature in the field was unknown.
2.6 Statistical methods
Statistical analyses were conducted to evaluate differences between sites for various measured parameters. One-way analysis of variance (ANOVA) was employed to test for differences among groups. Pairwise comparisons of group means were performed using Tukey's t test using JMP 18.0.11 (2024 JMP Statistical Discovery LLC). For data that did not conform to normal distribution assumptions, non-parametric methods were applied, specifically the Wilcoxon rank-sum test, to ensure robust comparisons across sites. Results are displayed in the form of connecting letters reported within the tables. Sites with the same letter (e.g. “A” or “B”) indicate no statistically significant difference in the measured parameter between those groups at the p<0.05 significance level. Groups with different letters (e.g. “A” vs. “B”) are significantly different. When overlapping letters (e.g. “AB”) are reported, those groups are statistically similar to others with at least one shared letter but may differ from groups with entirely distinct letters. Figures were created using the ggplot2 package (Wickham, 2016) using R software (R Core Team, 2021).
3.1 Water chemistry
The thermokarst water bodies were more acidic, richer in DOC and total P, and lower in SO and SiO2, compared with the wetland stream sites (all differences statistically significant; Table 2 and Fig. 2). The low pH of the ponds is consistent with their high DOC, and thus high organic acidity. The water bodies aligned along the inverse DOC–pH relationship, with TK-Pond 3 exhibiting the highest DOC and lowest pH, followed by TK-Pond 2 and TK-Pond 1. TK-Drain usually held an intermediate position between the thermokarst ponds and the Inlet and Outlet, which were found at the high-pH low-DOC end of the DOC–pH relationship. Similar patterns were found for the DOC–SO and DOC–SiO2 relationships (Fig. 2). Particulate OC concentrations were significantly higher and more variable in thermokarst ponds (1.2–3.4 mg L−1), compared with wetland stream sites (0.4–0.6 mg L−1), with greater variability observed at the Outlet than the Inlet (Table 2).
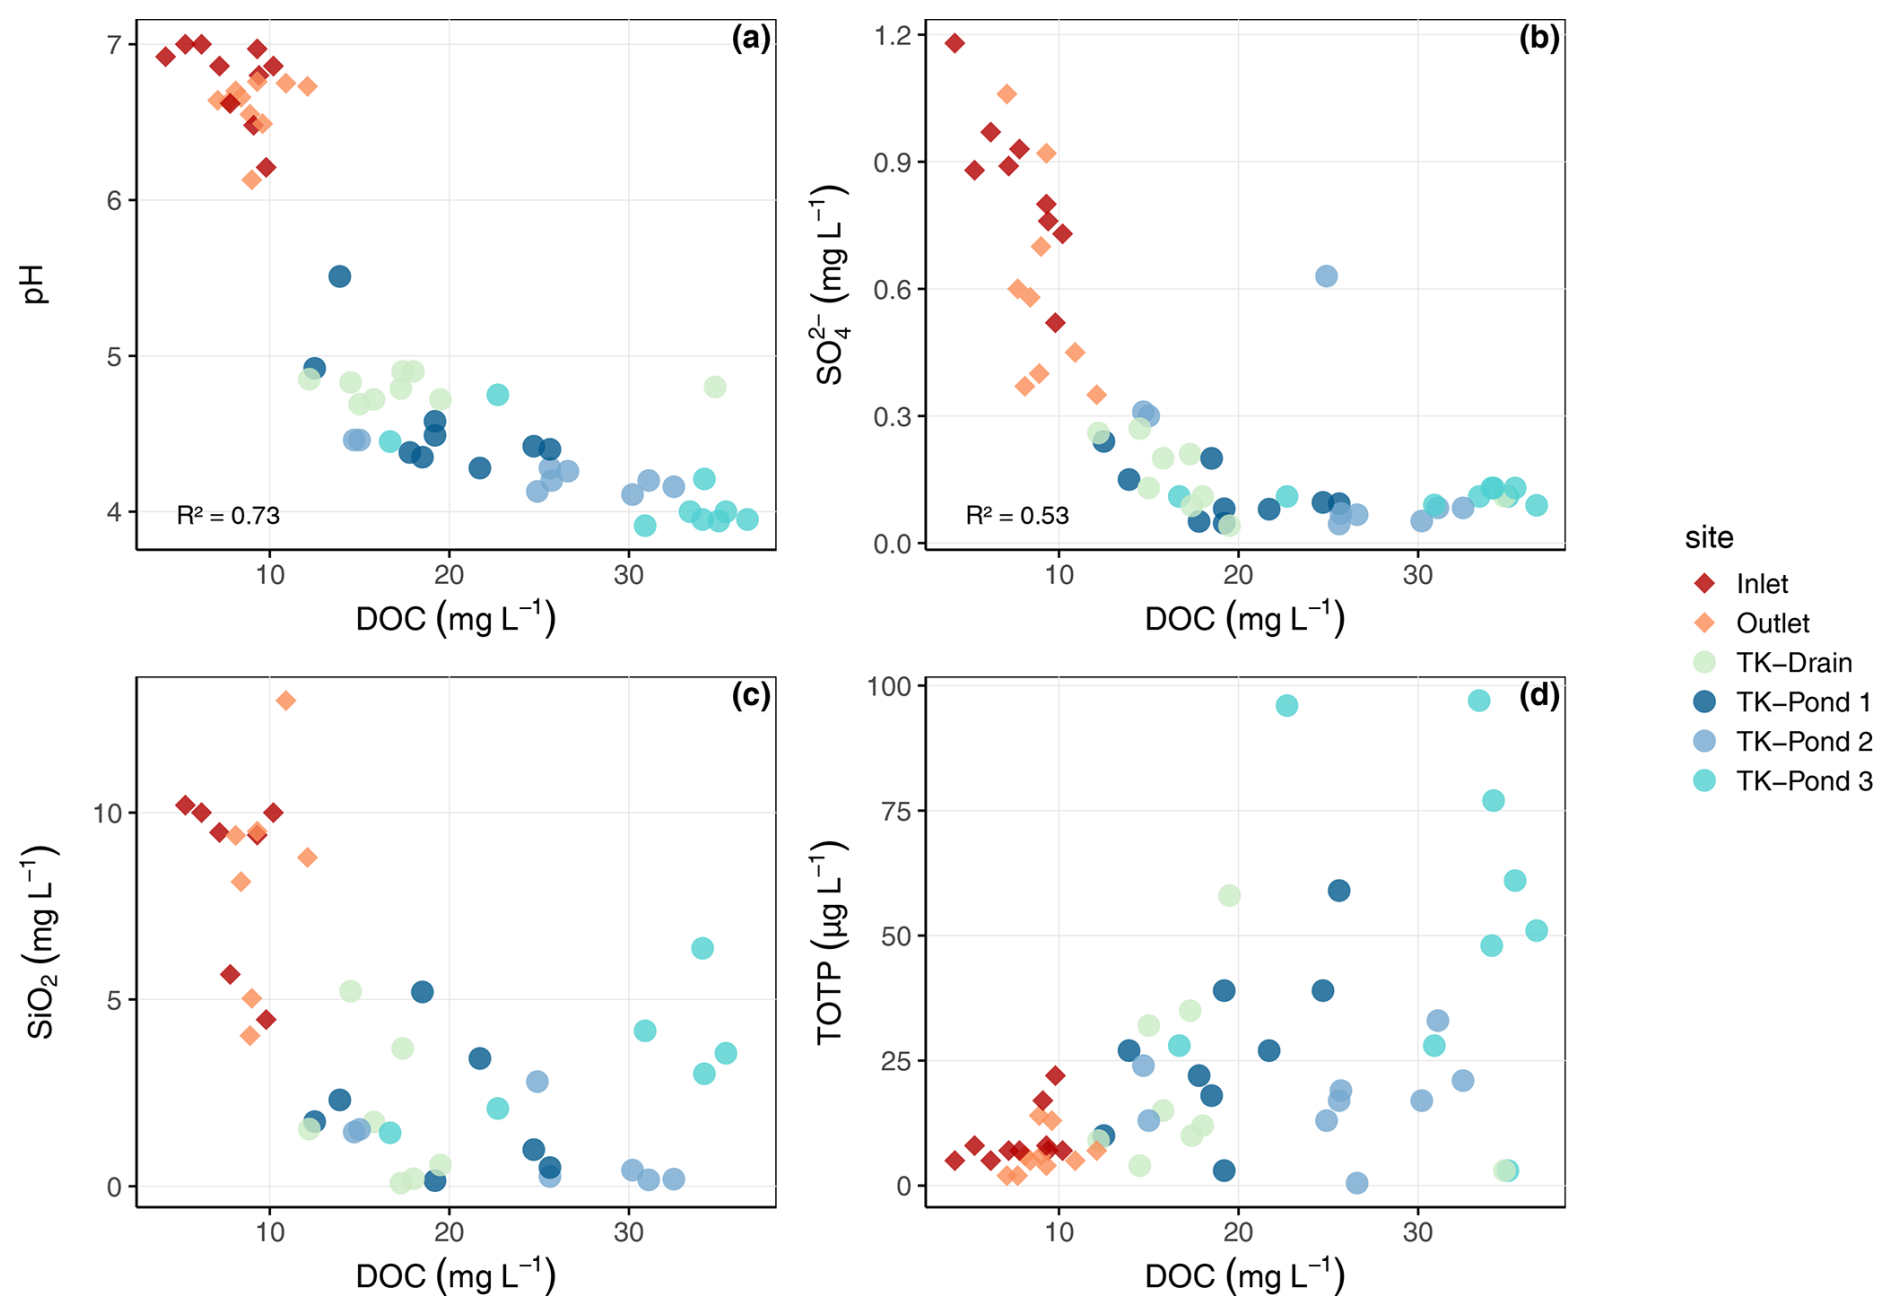
Figure 2Relationships between dissolved organic carbon (DOC) and various water quality parameters across different sites: scatter plots show correlations with (a) pH, (b) sulfate (SO), (c) silica (SiO2), and (d) total organic phosphorus (totP).
Table 2Water chemistry parameters for thermokarst ponds and wetland sites during nine sampling campaigns. Median values with standard deviations are shown for all water chemistry variables, except for pH, which is shown as the median with minimum and maximum values. EC: electrical conductivity; SO: sulfate; SiO2: silica; DOC: dissolved organic carbon; sUVa: specific UV absorbance; SAR: specific UV absorption ratio; TOC: total organic carbon; NH: ammonium; NO: nitrate; totP: total organic phosphorous; POC: particulate organic carbon (% of TOC). Letters indicate significant differences between sites for each variable (Tukey's t test; pairwise comparisons, p<0.05; see Sect. 2.6).
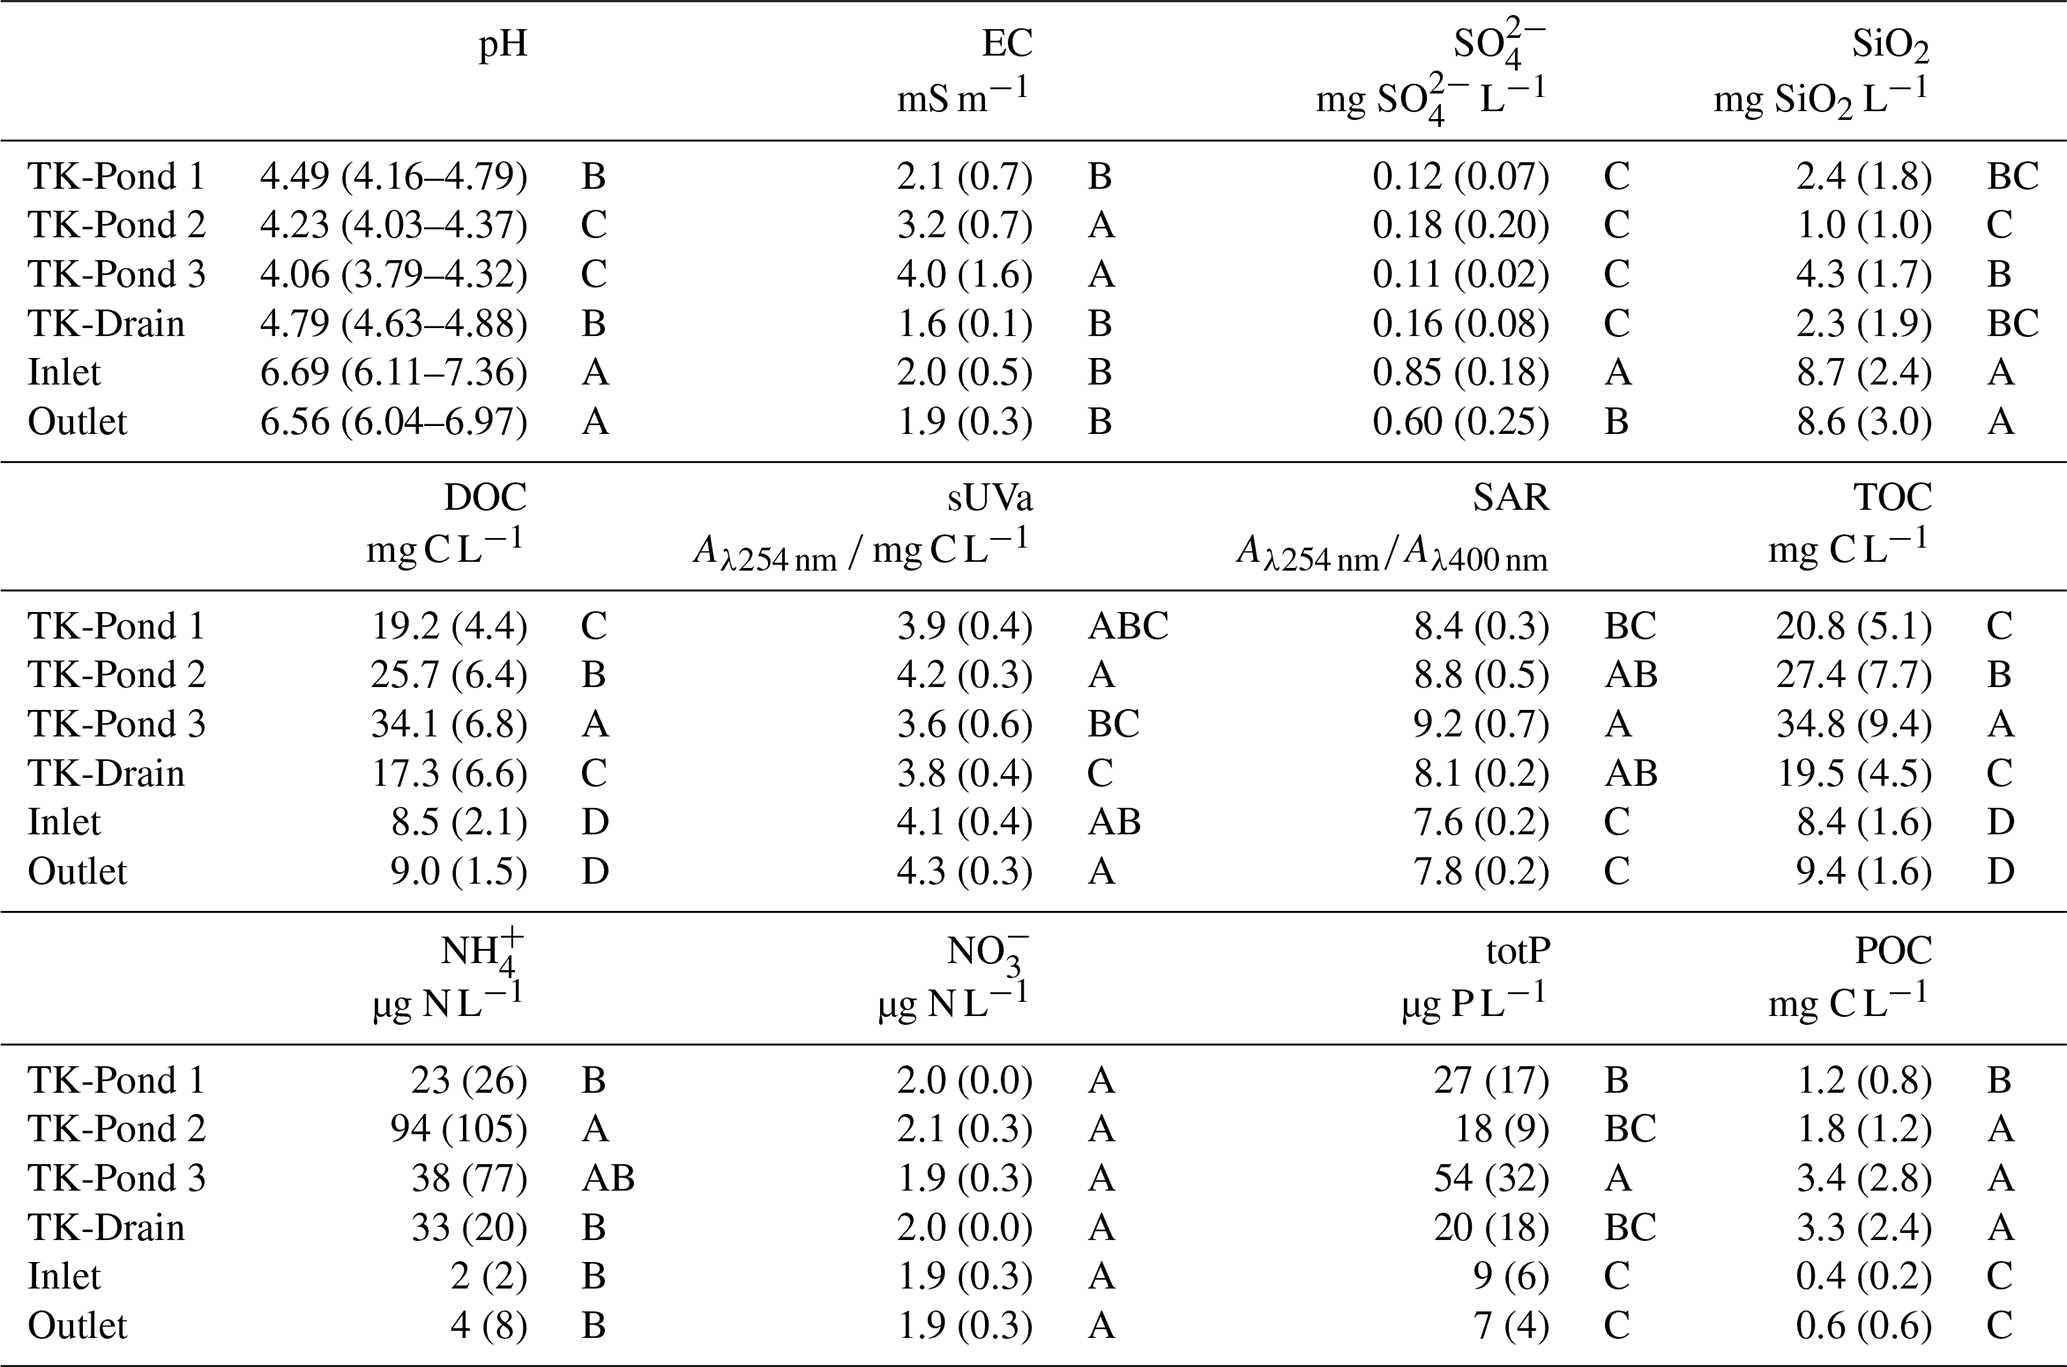
All water bodies had NO concentrations at, or close to, the detection limit, while the thermokarst water bodies had considerable levels of NH, contrary to the wetland stream (Table 2). Total P was highest, and most variable, in the ponds, to some extent mirroring the pattern in DOC, understandably, given that in these nutrient-poor sites most P would be in an organic form, just like N.
The DOM quality indicator SAR was highest in the thermokarst ponds (p<0.03). SAR was positively strongly correlated with DOC concentration (positive, R2=0.57, p<0.0001), implying that lowest SAR was found in the wetland stream. The DOM quality indicator sUVa, a proxy for aromaticity, was slightly higher in the wetland stream than in the thermokarst ponds, although the difference was not significant.
The inverse relationship between DOC and pH points towards organic acidity as a strong driver of pH. Additionally, the near-to-neutral pH in the wetland stream is consistent with groundwater influences from the catchment, as well as the elevated SiO2 and SO concentrations. A limited set of water samples was analysed for base cations (Table S4), confirming that these were highest in the wetland stream.
The water chemical composition of the ponds mirrored the impact of thawing permafrost: the TK-Pond 3 is hydrologically most isolated, with the lowest pH, highest conductivity, and highest DOC. TK-Pond 1, located at the transition from peat plateau to wetland, had a higher pH and lower EC, DOC, and NH than the other ponds; this is consistent with some hydrological influences from the wetland and hence less permafrost impact. TK-Pond 2 is located in the middle of the peat plateau and is by far the largest pond and, under wet conditions, hydrologically connected to neighbouring ponds. The water chemistry of TK-Drain was usually most similar to that of TK-Pond 1. An example of pH and EC gradients from the peat plateau into the wetland is consistent with the influence of thermokarst waterbodies gradually becoming less dominant in the transition from the peat plateau complex to the wetland (Fig. S1).
3.2 Dissolved gases and gas evasion
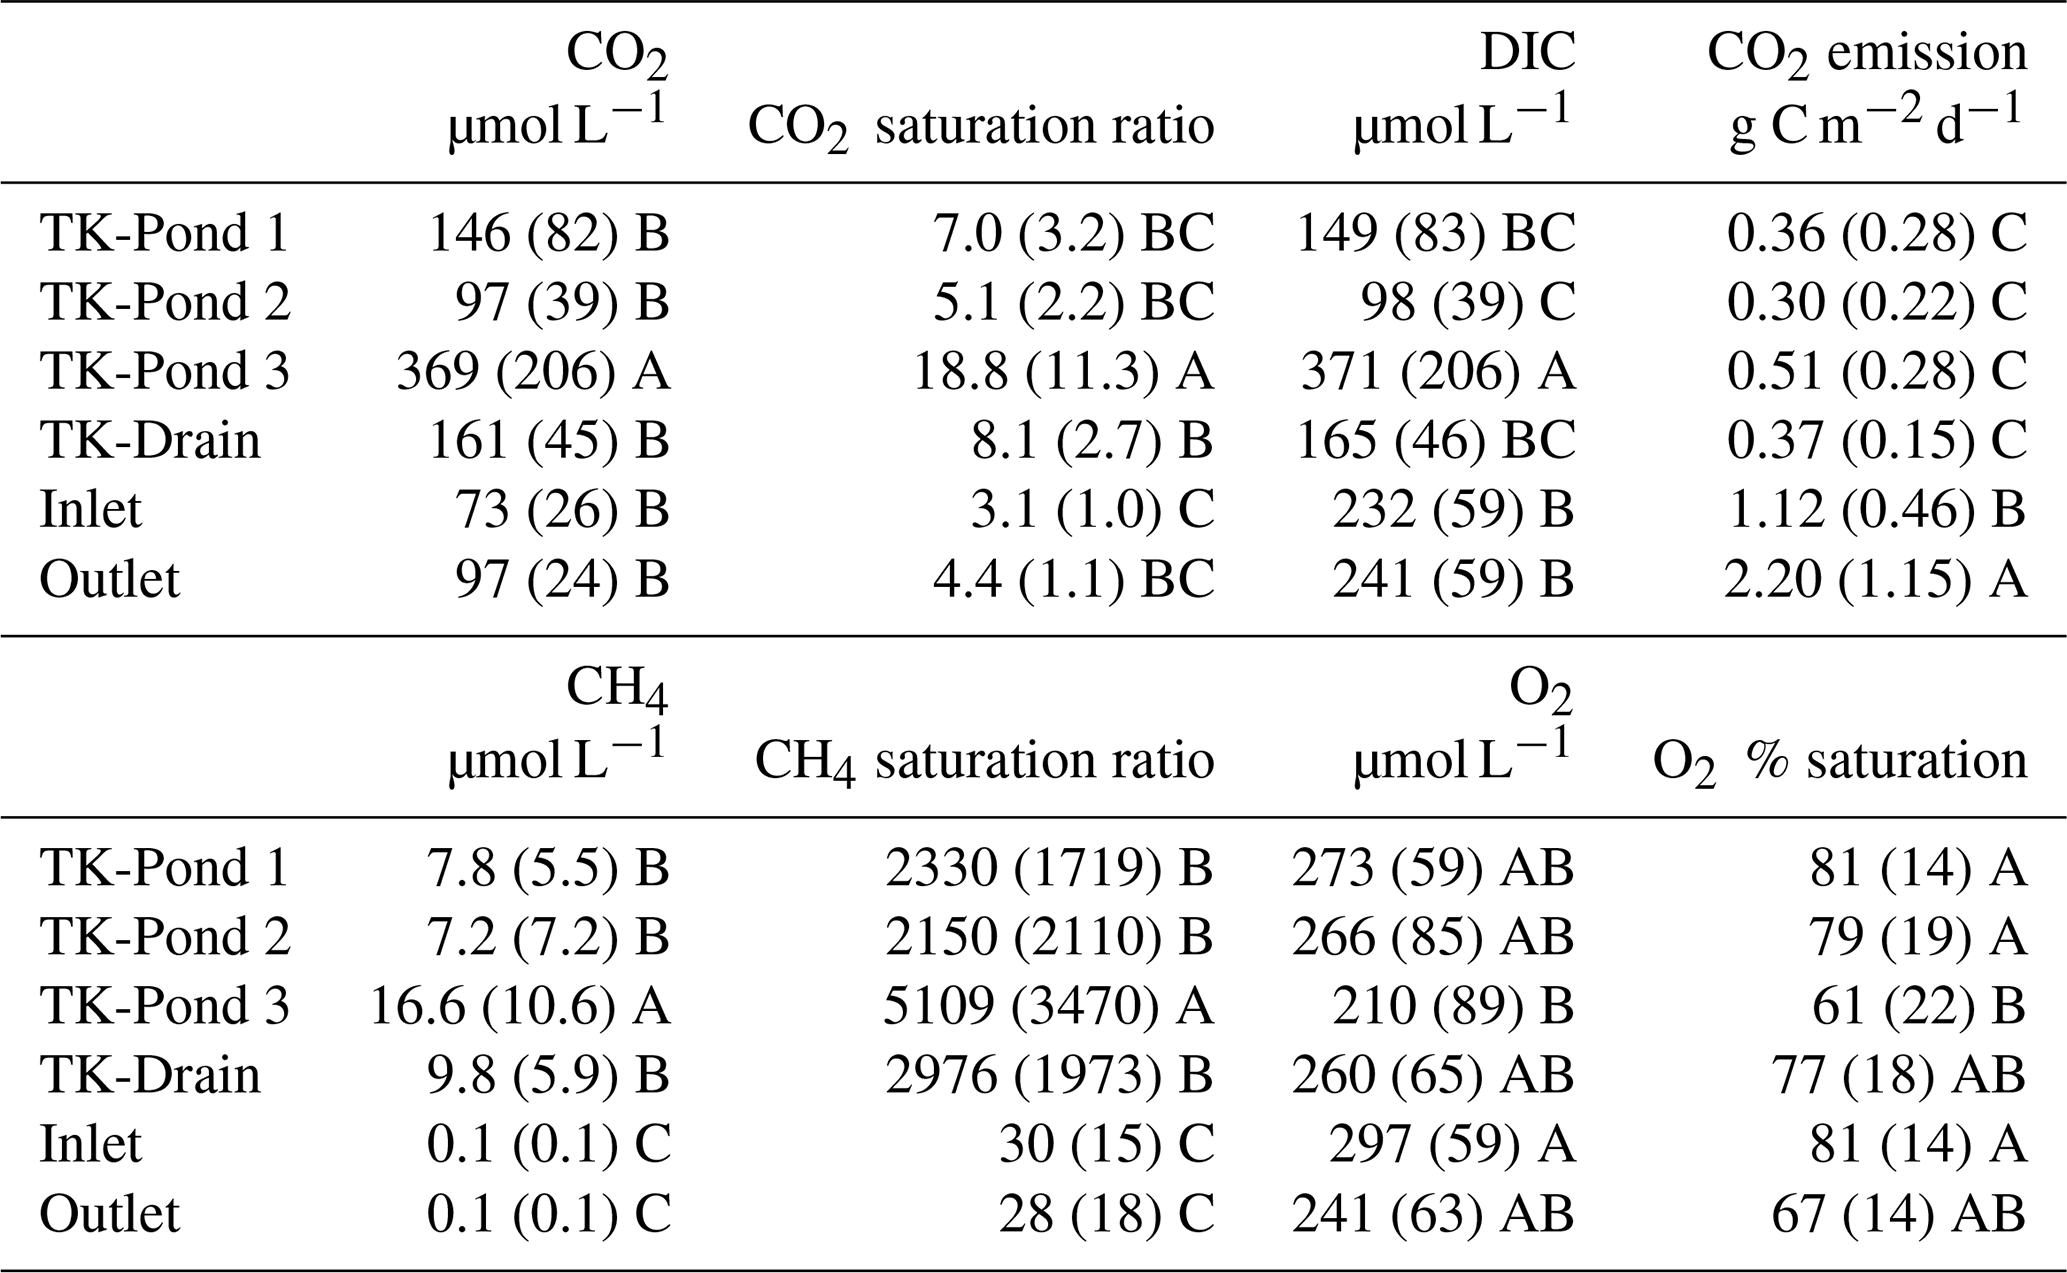
All water bodies were oxygenated and dissolved O2 concentrations were, on average, 61 % to 81 % of water O2 saturation (Table 3). The ponds are shallow, allowing for wind mixing, and they host sphagnum, suggesting active O2 production through photosynthesis. All water bodies were oversaturated with CH4 and CO2. Dissolved CH4 concentrations were 2000–5000 and ≈30 times higher than atmospheric equilibrium, in the ponds and in the wetland stream, respectively, indicating that all water bodies – thermokarst ponds in particular – are net sources of CH4 to the atmosphere. The lower CH4 oversaturation in the stream sites, compared with ponds, is likely to be related to higher CH4 losses caused by stream turbulence and/or higher production rates of CH4 in the thermokarst ponds (Fig. 3).
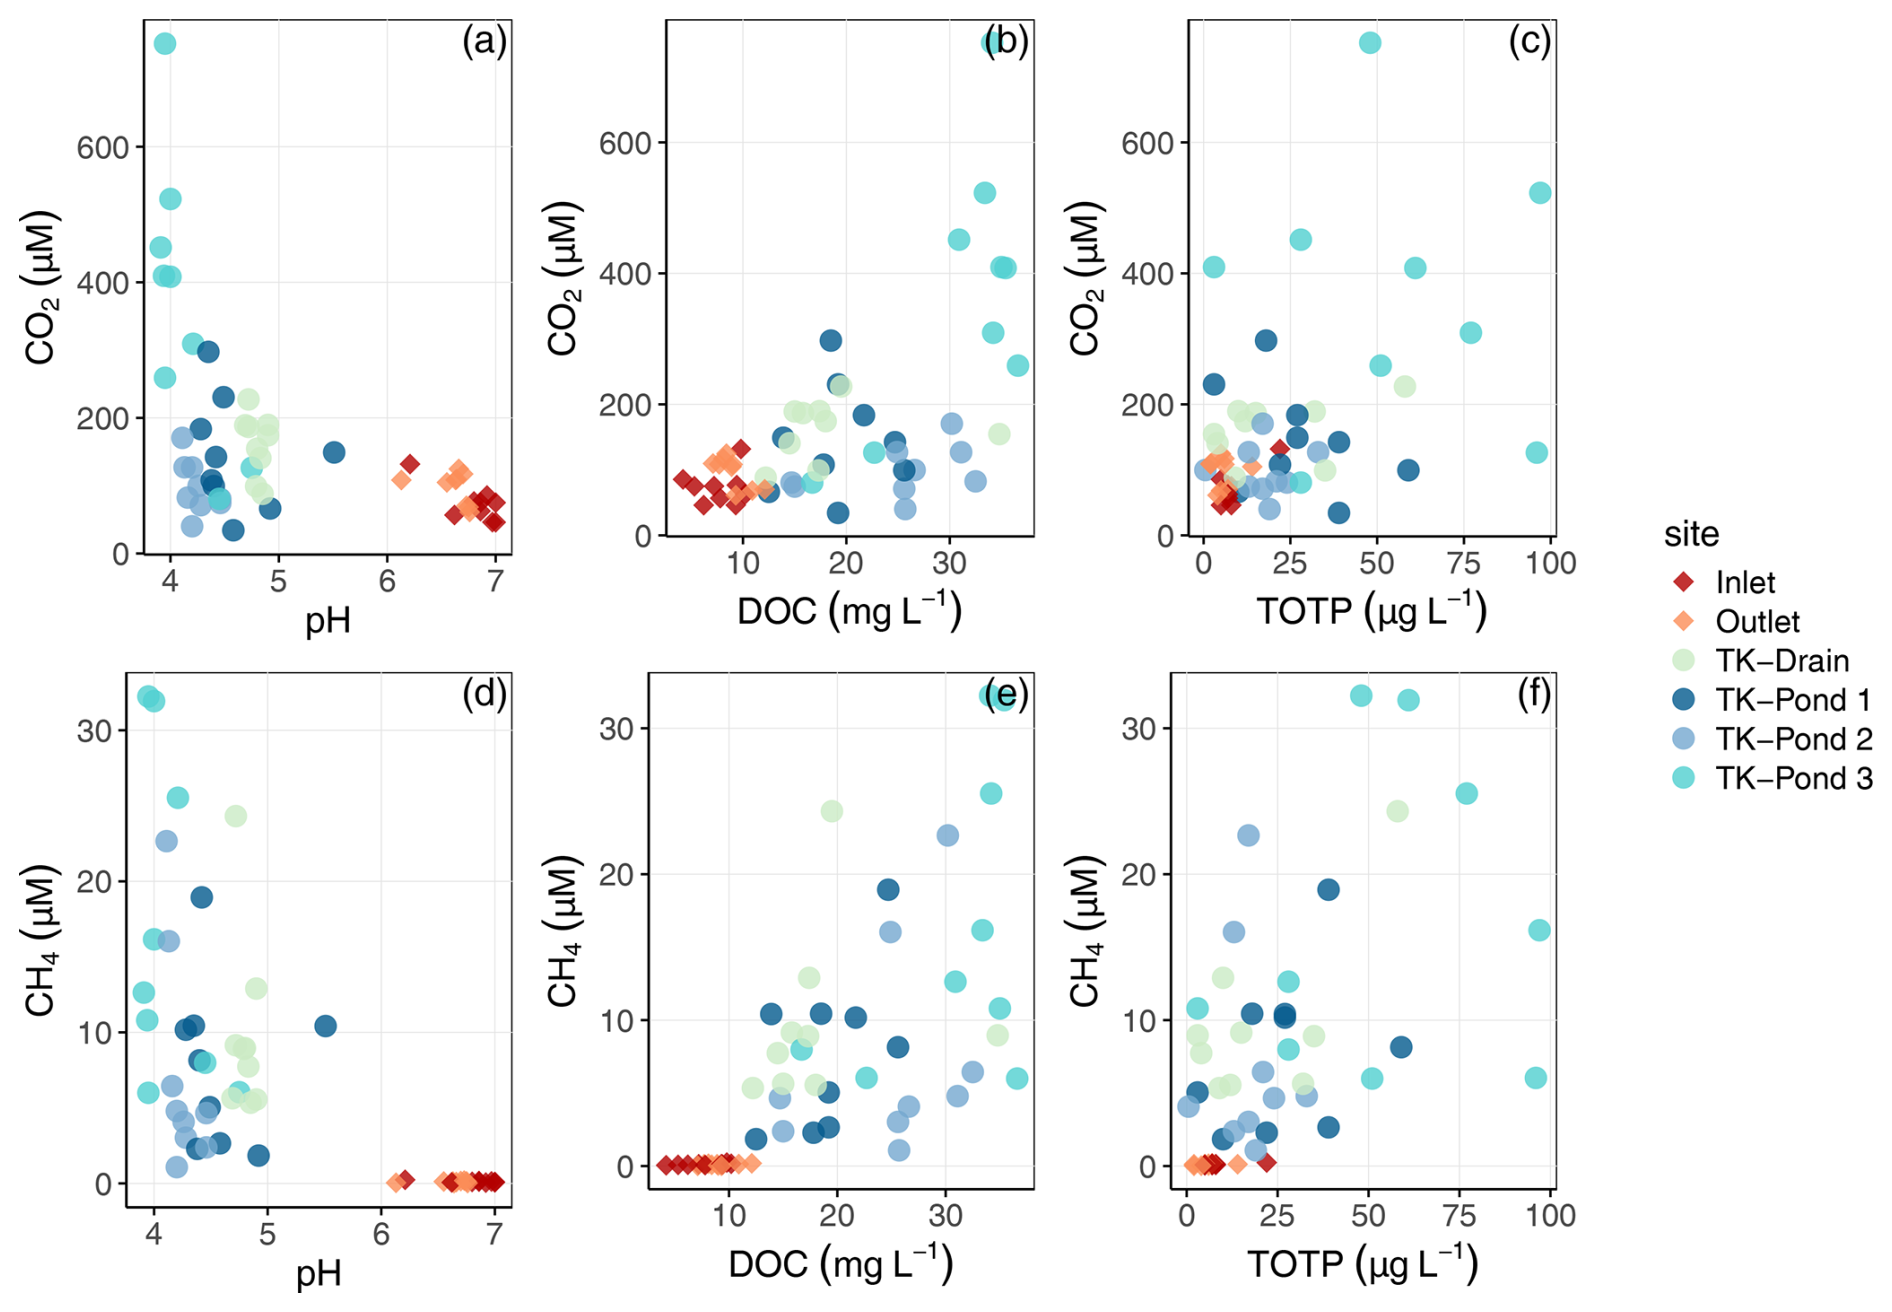
Figure 3Variations in (a)–(c) dissolved carbon dioxide (CO2) and (d)–(f) methane (CH4) concentrations in relation to pH, DOC, and total organic phosphorus (totP) across sampling sites.
CO2 saturation indices in the thermokarst waterbodies reached 5 to 20, while in the stream sites they ranged between 3 and 4 (Table 3). By contrast, the CO2 evasion from the stream sites (e.g. 1–2 g C m−2 d−1) was higher than that from the ponds (0.3–0.5 g C m−2 d−1), consistent with the higher turbulence in the stream and the replenishment of CO2 from bicarbonates from groundwater in the stream, which is a geological rather than a recent source of CO2. Bicarbonates contributed about 60 %–70 % to DIC in the wetland stream (with pH between 6.0 and 7.4), while bicarbonates in thermokarst water bodies were almost negligible (with pH below 4.5); this is consistent with equilibrium between bicarbonates and CO2 over these pH ranges. TK-Pond 3 had the lowest O2 concentrations and the highest CH4 and CO2 concentrations of all thermokarst water bodies. Concentrations of CH4 and CO2 were positively related in the thermokarst water bodies (R2=0.48, p<0.0001, F test) but not in the wetland stream (Fig. 4). Note that DIC in the stream sites is also not correlated with CH4 (Fig. S2).
The CO2 emissions from the stream sites (Inlet and Outlet) were substantially larger than those from the thermokarst waterbodies (Table 3). The mean CO2 emission at the Inlet site was 1.12 ± 0.46 g C m−2 d−1, and that at the Outlet site was 2.20 ± 1.15 g C m−2 d−1. These values are 3 to 7 times higher than the fluxes observed from the thermokarst waterbodies, which ranged from 0.30 ± 0.22 g C m−2 d−1 (TK-Pond 2) to 0.51 ± 0.28 g C m−2 d−1 (TK-Pond 3).
Annual CO2 fluxes for the ice-free period, assuming negligible flux during the ice-covered months, ranged between 51 and 87 g C m−2 yr−1 for the thermokarst ponds, and those for the stream ranged between 190 g C m−2 yr−1 (Inlet) and 405 g C m−2 yr−1 (Outlet).
3.3 DOM processing rates
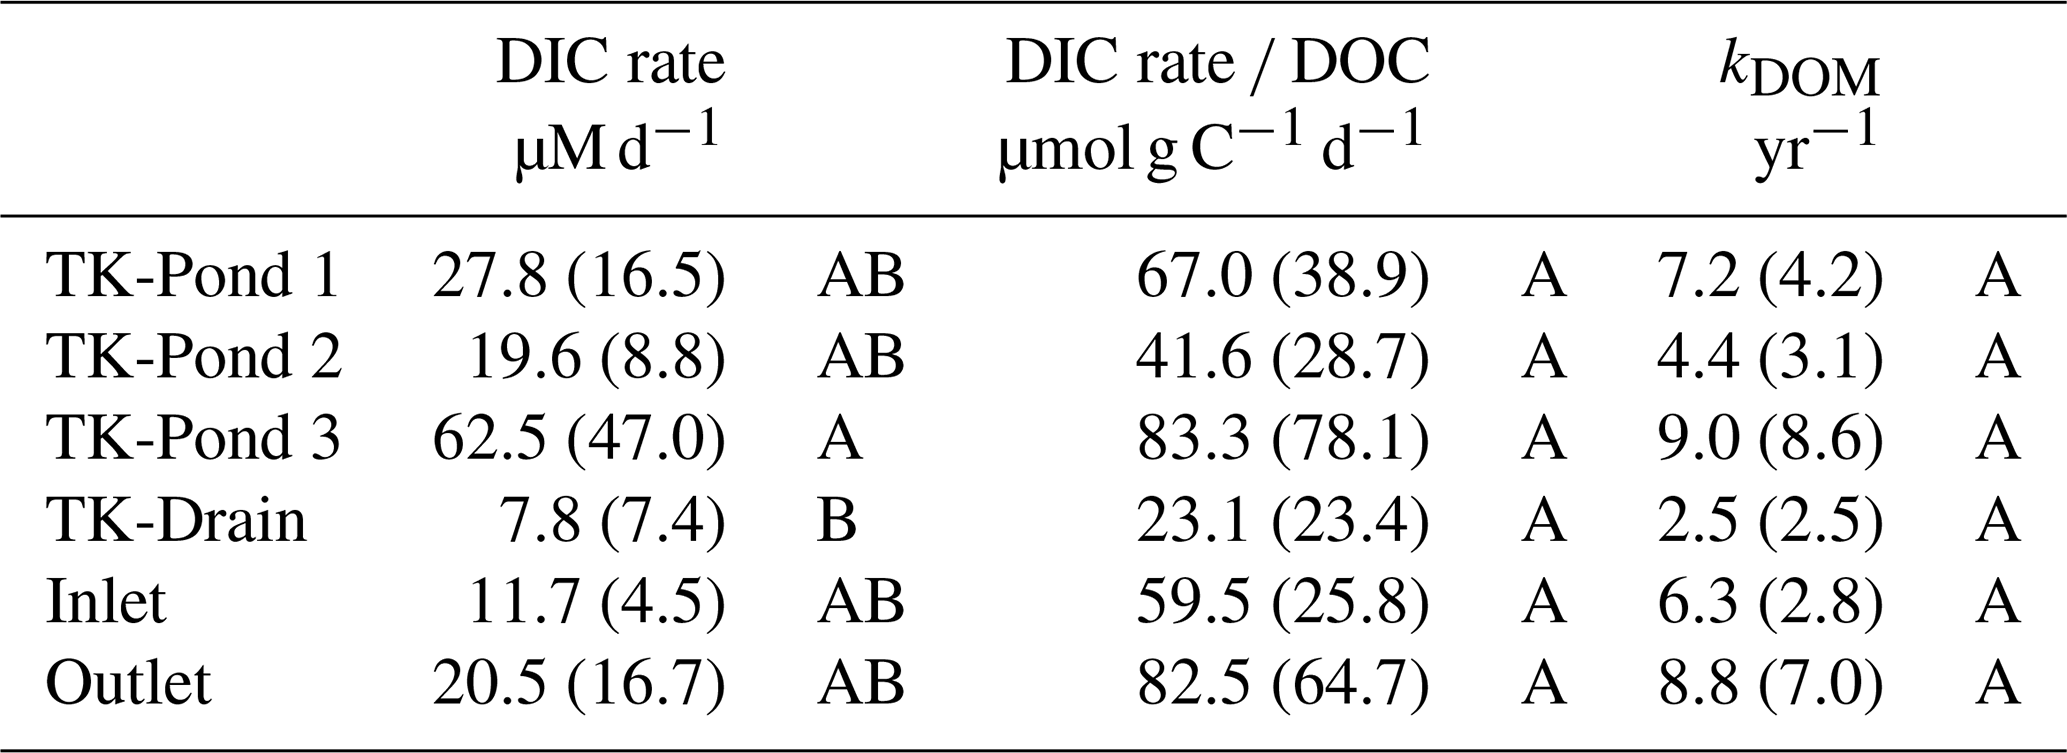
Average DIC production rates in the different water bodies were highly variable (7.8–62.5 µM d−1, Table 4), but tended to be highest in the thermokarst ponds, compared with the wetland stream, while TK-Drain had the lowest rates (Tukey's t test, p<0.05). The non-parametric Wilcoxon tests supported these trends, confirming minimal site-specific effects overall, with TK-Drain showing lower activity. These results reflect the in situ processing of DOM in both thermokarst ponds and stream sites. The DOM mineralization rate did not vary significantly between sites and neither did the exponential decay rate kDOM (Table 4). The value of kDOM in the thermokarst ponds ranged from 4.4 to 9.0 yr−1 (Table 4), while the Outlet showed higher values of kDOM than the Inlet (8.8 and 6.3 yr−1, respectively). The TK-Drain site was substantially lower (2.5 yr−1).
Understanding the GHG source–sink function of degrading permafrost landscapes benefits from an integrated study of water chemistry and GHG fluxes, as hydrological and biogeochemical processes are closely linked (Frey and McClelland, 2009; Vonk et al., 2015). In particular, shifts in OM mobilization, acidity, and nutrient dynamics across different thermokarst pond stages influence C cycling and GHG production. In our study area, isolated thermokarst ponds and the more hydrologically connected wetland stream represent contrasting hydrochemical environments, with ponds reflecting strong permafrost thaw inputs and the stream influenced by the catchment.
4.1 Water chemical contrasts between thermokarst ponds and water chemistry
Thermokarst ponds and the wetland stream exhibit strong contrasts in DOC concentration and acidity, with ponds showing high DOC and low pH. The inverse relationship between DOC and pH (, p<0.001) suggests that organic acidity is a dominant driver of pH in thermokarst ponds. The acidity is probably driven by the leaching of DOM from recently destabilized permafrost, since the ponds are hydrologically isolated from the surrounding wetland. Elevated DOM and leaching from surrounding permafrost are observed in other thawing permafrost landscapes (Holmes et al., 2022; Ward and Cory, 2015). This is consistent with the finding that TK-Pond 3 – hydrologically the most isolated – has, on average, the highest DOC (35 mg L−1) and the lowest pH (4.1), indicating strong organic acidity effects from destabilized permafrost and minimal exchange with the surrounding wetland.
In contrast, the wetland stream exhibits near-neutral pH values, which we attribute to groundwater influence. We found systematically higher concentrations of HCO, SO, and SiO2 in the wetland stream than in the ponds, and also higher concentrations of base cations (Table S3). This geochemical signature is characteristic of carbonate and silicate mineral weathering occurring along subsurface flow paths, which was found in several catchments at Iškorasfjellet, including the Báhkiljohka catchment where our study site is located (Lehmann et al., 2023). Lehmann et al. (2023) documented groundwater-driven alkalinity generation linked to both carbonate vein dissolution and silicate weathering and suggested that carbonate weathering should be considered as a potential CO2 source in the catchment. Groundwater effects on stream waters have also been found elsewhere in permafrost landscapes (Turetsky et al., 2020; Vonk et al., 2015), suggesting that CO2 emissions from high-pH streams can be replenished by geogenic rather than biogenic sources; this is important to account for in GHG budgets from aquatic ecosystems.
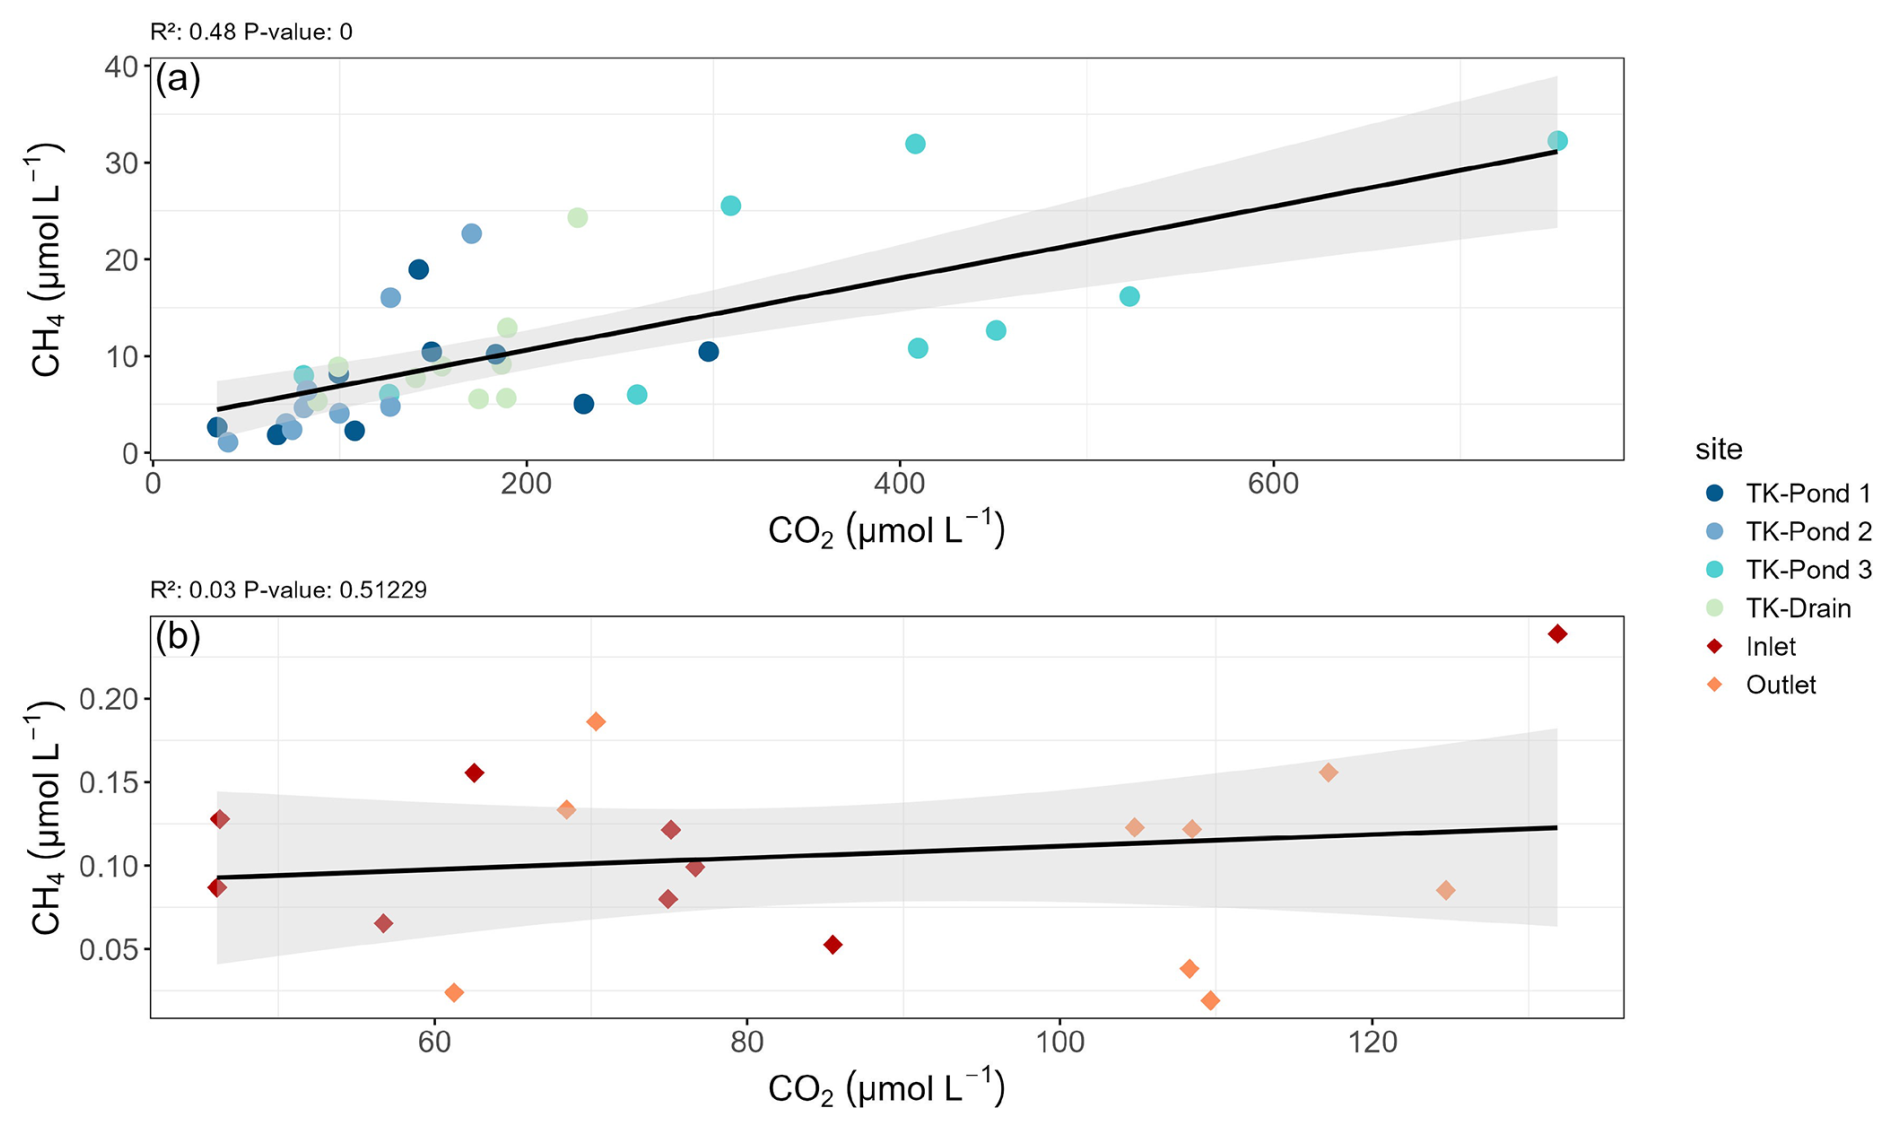
Figure 4Relationships between CH4 and CO2 (a) between thermokarst waterbodies and (b) for Inlet and Outlet sites, including linear regression lines and corresponding R2 and p statistics. Note the scale differences for CH4 between thermokarst waterbodies and the wetland stream.
Table 3Mean concentrations and standard deviations of CO2 (µM) and CH4 (µM), with their respective saturation ratios, along with CO2 emission flux (g C m−2 d−1), DIC (µM), and oxygen concentrations (µM) with percentage saturation. The saturation ratio is defined as the concentration divided by the equilibrium concentration between the atmosphere and water at the given temperature. For this study, DIC is considered to be the sum of dissolved CO2 and bicarbonate. Letters indicate significant differences between sites for each variable.
Levels of totP mirrored the pattern of DOC enrichment in thermokarst ponds (30–70 µg L−1), suggesting that P in these nutrient-poor ponds is primarily organically bound (Frey et al., 2007). In addition to DOC, permafrost thaw releases organic forms of P that can affect downstream nutrient dynamics and carbon cycling (in 't Zandt et al., 2020). In contrast, the lower DOC and totP found in the wetland stream reflected the influence from the catchment upstream, including groundwater inputs. The higher POC concentrations in the thermokarst ponds (1.2–3.4 mg L−1), compared with wetland stream sites (0.4–0.6 mg L−1), further supports that thermokarst ponds are hotspots for OM destabilization, whereas wetland streams are influenced more by lateral transport and groundwater (Olefeldt and Roulet, 2014).
The hydrochemical contrasts between thermokarst ponds and the wetland stream sites at Iškoras, shaped by differences in DOC concentration, acidity, and groundwater influence, are key drivers of spatial variation in GHG production and emissions across the landscape. Given the strong controls of DOC and pH on CH4 dynamics (Shirokova et al., 2012; Segers, 1998), these patterns provide important context for understanding permafrost-C feedbacks.
4.2 Thermokarst ponds as hotspots of methane emissions
Thermokarst ponds in Iškoras display CH4 saturation indices of 2300 to 5000 (Table 3), which are among the highest values reported in the literature for natural waterbodies, particularly in northern permafrost regions. These findings align with Shirokova et al. (2012) and Matveev et al. (2018), who documented saturation indices of 50 to 5000 in Siberian thermokarst depressions and of 5 to 50 in subarctic lithalsa lakes (thermokarst lakes in mineral soils). Such high CH4 concentrations in these poorly connected, small, and relatively protected water bodies are consistent with the established inverse relationship between CH4 concentration and water body size, hydrological connectivity, and turbulence exposure (Abnizova et al., 2012; Kankaala et al., 2013; Polishchuk et al., 2018).
At Iškoras, the smallest pond, TK-Pond 3, exhibited the highest CH4 oversaturation, in combination with the highest DOC and totP values and lowest pH, as mentioned earlier. This could be explained by the creation of anaerobic sediments and C-rich conditions, and low pH, by permafrost thaw and limited hydrological connectivity, that, in concert, enhance CH4 production. The high DOM, originating from destabilized permafrost (Turetsky et al., 2020), is usually associated with low pH and elevated totP (Holmes et al., 2022; Ward and Cory, 2015). Thus, CH4 oversaturation in thermokarst ponds could be related to particularly high DOC availability and to acidic conditions that limit CH4 oxidation (Wik et al., 2016). Despite the presence of dissolved O2 in thermokarst ponds, they remained highly oversaturated in CH4. CH4 production is known to occur mainly in anoxic sediments (Bastviken et al., 2004; Clayer et al., 2016; Wik et al., 2016), from where CH4 is subsequently transported to overlying water. The microbial activity responsible for CH4 production may be enhanced by the release of previously frozen OM from ongoing thermokarst development (Crevecoeur et al., 2017), as recently observed in laboratory incubations with inundated peat from the Iškoras site (Kjær et al., 2024).
As thermokarst ponds evolve into wetlands, CH4 emission patterns may shift, due to changes in hydrological connectivity and biogeochemical cycling. Pirk et al. (2024) used a space-for-time substitution to highlight that the transition from thermokarst ponds to wetlands at Iškoras involves significant changes in GHG fluxes, finding that the degradation of palsas to thermokarst ponds led to a 17-fold increase in local GHG forcing, primarily driven by CH4 and CO2 emissions. This is partly because thermokarst ponds, being spatially isolated, create localized CH4 emission hotspots (Elder et al., 2021). Wetlands, with their larger spatial extent and greater hydrological connectivity, promote slower organic matter mineralization, which can reduce CO2 emissions and increase carbon uptake (Pirk, et al., 2024). Although wetlands continue to emit CH4, these emissions become more diffuse, rather than concentrated at hotspots. At the same time, wetlands can act as net carbon sinks, as CO2 uptake through plant productivity and organic matter accumulation may offset greenhouse gas emissions (Heiskanen et al., 2023; de Wit et al., 2015). This transition represents a fundamental shift from localized CH4-dominated GHG emissions in thermokarst ponds to more spatially diffuse CH4 emissions in wetlands, where increased CO2 uptake and OM accumulation can contribute to a net C sink (Turetsky et al., 2020).
4.3 Carbon dioxide dynamics
Both thermokarst ponds and the stream in Iškoras are oversaturated with CO2 (Table 3), a common feature of Arctic and subarctic aquatic systems (Allesson et al., 2022; Bastviken et al., 2004). However, the mechanisms driving CO2 fluxes differ between ponds and streams. In ponds, despite high CO2 concentrations, CO2 release is lower than in streams and is likely to be limited by the lack of turbulence. In contrast, streams exhibit enhanced CO2 fluxes, probably due to high turbulence and carbonate inputs from groundwater, as described in Sect. 4.1. Others have also found that groundwater influences can contribute both bicarbonate and dissolved CO2 to sustain stream CO2 fluxes (Lehmann et al., 2023; Duvert et al., 2018; Winterdahl et al., 2016). This highlights that groundwater contributions of bicarbonate and dissolved CO2 must be accounted for when interpreting stream CO2 fluxes, as ignoring these inputs could lead to overestimating the importance of recently mineralized DOM or newly produced CO2 from thermokarst ponds.
Quantitatively, CO2 efflux from the stream at Iškoras averages 0.4 g C m−2 d−1 (Table 3), aligning closely with values observed in Siberian permafrost streams (0.3–0.5 g C m−2 d−1; Shirokova et al., 2012). This flux is consistent with the combined influence of turbulent flow and groundwater inputs enriched in DIC, consistent with earlier findings of mineral weathering contributions to DIC at Iškorasfjellet (Lehmann et al., 2023). These findings complement observations from other regions, where turbulence and bicarbonate supply are key drivers of CO2 release in streams (Lundin et al., 2013; Raymond et al., 2013). Streams probably benefit from continuous replenishment of CO2 from bicarbonates, which account for 60 %–70 % of the DIC pool in boreal to Arctic streams and rivers (Wallin et al., 2018; Zolkos and Tank, 2020).
In contrast, CO2 emissions from ponds at Iškoras are notably low (Table 3), similar to findings of Campeau and Del Giorgio (2014), attributed to the ponds' high DOC-to-bicarbonate ratios, which restrict bicarbonate formation and subsequent CO2 production (Abnizova et al., 2012; Bastviken et al., 2004). The limited water mixing in ponds further diminishes CO2 flux, due to low gas exchange rates compared with streams. However, DIC production rates in ponds (26.7–35.7 µM d−1) remain sufficient to sustain CO2 effluxes of 5–10 mol C m−2 yr−1, consistent with findings by Shirokova et al. (2012), who linked DIC production directly to DOC concentrations in Arctic aquatic systems. The relatively high values of kDOM that we observed (4.4–9.0 yr−1; Table 4) indicate faster DOM degradation than the global lake average (2.5±4.0 yr−1), based on Catalán et al. (2016), and are consistent with elevated DIC production rates.
Table 4Rates of production and decay. DIC rates reflect DIC production. The ratio DIC rate DOC indicates the relative efficiency of converting DOC to DIC, while kDOM indicates the exponential decay rate of DOM, showing how quickly DOM is decomposed over time. Letters indicate significant differences between sites for each variable (p<0.05).
High CO2 evasion from lower-order streams is caused by high flow velocities and associated turbulence causing high gas exchanges (Schelker et al., 2016). These drivers probably explain the relatively higher CO2 efflux from the Iškoras stream, compared with ponds. We suggest that mineralization of DOM, influenced by DOM lability, pH, and nutrients, plays a critical role for CO2 emissions of the thermokarst ponds. High-molecular-weight DOM, as indicated by low sUVa and SAR values, can be more resistant to microbial processing than low-molecular-weight DOM, thereby slowing DOM decay rates (Shirokova et al., 2019). Ward and Cory (2015) noted that DOM from thawing permafrost, while less aromatic and more labile, compared with active-layer DOM, may become limited by environmental factors, such as pH and nutrient availability, resulting in lower mineralization rates. The acidic conditions in ponds could shift microbial communities and affect activity (Vigneron et al., 2019), a factor that can further limit CO2 fluxes from ponds, in addition to the low gas exchange rate.
In summary, the higher CO2 fluxes observed in the stream sites at Iškoras are probably driven by the combined effects of turbulent flow, groundwater-derived DIC, and mineral weathering inputs, whereas lower emissions from ponds are shaped by organic acidity, limited hydrological connectivity, and limited surface exchange. These dynamics emphasize the need to account for the interaction of hydrological and chemical factors when assessing the fate of destabilized OM in water bodies in permafrost-impacted regions.
4.4 Climate feedback implications
The transition from thermokarst ponds to wetlands modifies the overall GHG footprint of the peatland–wetland continuum, balancing the loss of localized CH4 emission hotspots with the emergence of sustained long-term CH4 emissions from wetlands, while the fate of organic matter currently stored in permafrost remains uncertain. At the same time, CO2 fluxes from the streams and rivers may increase, due to enhanced hydrological connectivity and increased organic matter input (Zolkos et al., 2019), in agreement with the results of our study. At Iškoras, the small spatial extent of the permafrost area limits its overall impact on the catchment-scale GHG source–sink function. However, in landscapes where peat plateaus occupy a larger area, such transitions may have more significant consequences at the regional scale. These findings reflect the complex interplay of ecological and hydrological factors shaping GHG emissions in permafrost landscapes. Turetsky et al. (2020) and Pirk et al. (2024) both emphasized the need for further research on the spatiotemporal variability of these factors, particularly during thaw cycles, as shifts in hydrological connectivity, OM transport, and microbial activity can significantly influence the GHG emissions and permafrost-C feedbacks. Improving our understanding of these dynamics is essential for refining predictions of permafrost-C feedbacks in a changing climate.
This study highlights the distinct biogeochemical roles of thermokarst ponds and wetland streams in a landscape of sporadic permafrost in subarctic Norway. Thermokarst ponds at the Iškoras site, characterized by low pH, high organic acidity, and elevated DOC concentrations, are currently hotspots for CH4 emissions, with stable DOM lability driving sustained carbon processing. In contrast, the wetland stream exhibits higher CO2 fluxes, largely driven by turbulence and bicarbonate replenishment from groundwater. Despite similarities in DOM mineralization rates between ponds and the stream sites, environmental constraints, such as pH, microbial community composition, and hydrodynamic mixing, are likely controls of the observed differences in GHG fluxes. As thermokarst ponds transition into wetlands, they will no longer function as hotspots for CH4 emissions. Instead, CH4 emissions are likely to increase across the entire landscape, as sustained waterlogging promotes elevated CH4 production. These ecological shifts, coupled with lateral DOC losses from peat plateaus, highlight the importance of hydrological connectivity in linking terrestrial and aquatic C dynamics. Such transitions emphasize the need for integrated C budget models that account for the evolving contributions of small aquatic systems to regional and global C cycles.
Future research should prioritize direct measurements of CH4 fluxes, microbial community contributions to DOM decomposition under varying environmental constraints, and the temporal variability of gas production and emissions. Additionally, exploring seasonal dynamics, lateral carbon transport, and hydrological processes will provide critical insights into C cycling. Investigating catchment-scale signals, such as DOC concentrations across entire river systems and their links to permafrost contributions, can further advance our understanding of landscape-level processes. By addressing these questions, we can better predict the trajectory of permafrost-impacted landscapes and their feedbacks to the global C cycle in a warming climate.
All data presented in this manuscript are publicly available at https://doi.org/10.4211/hs.41faf3d6c3f245259ea820740291789c (Knutson et al., 2025).
The supplement related to this article is available online at https://doi.org/10.5194/bg-22-3899-2025-supplement.
JKK and HAdW conceptualized the study. JKK, HAdW, and FC participated in data collection. JKK, FC, HAdW, and PD conducted the experiments and the data analysis. JKK, HAdW, and FC created the figures. JKK and HAdW drafted the initial manuscript, and HAdW, FC, SW, and PD revised and edited the final version.
The contact author has declared that none of the authors has any competing interests.
Publisher's note: Copernicus Publications remains neutral with regard to jurisdictional claims made in the text, published maps, institutional affiliations, or any other geographical representation in this paper. While Copernicus Publications makes every effort to include appropriate place names, the final responsibility lies with the authors.
This research was supported by NIVA core funding: Global Change at Northern Latitudes and the BioGov project . We thank Uta Brandt, Hanna Lee, Inge Althuizen, and Emelie Forsman for their invaluable assistance with instrumentation, fieldwork, and site access. We are also grateful to the anonymous reviewer and Gerard Rocher-Ros for their constructive and insightful comments, which greatly improved the manuscript.
This research has been supported by the Norges Forskningsråd (Global Change at Northern Latitudes (grant no. 342628/L10) and BioGov (grant no. 323945)).
This paper was edited by Perran Cook and reviewed by Gerard Rocher-Ros and one anonymous referee.
Åberg, J. and Wallin, M. B.: Evaluating a fast headspace method for measuring DIC and subsequent calculation of pCO2 in freshwater systems, Inland Waters, 4, 157–166, https://doi.org/10.5268/IW-4.2.694, 2014.
Abnizova, A., Siemens, J., Langer, M., and Boike, J.: Small ponds with major impact: The relevance of ponds and lakes in permafrost landscapes to carbon dioxide emissions, Global Biogeochem. Cy., 26, GB2041, https://doi.org/10.1029/2011GB004237, 2012.
Alewell, C., Giesler, R., Klaminder, J., Leifeld, J., and Rollog, M.: Stable carbon isotopes as indicators for environmental change in palsa peats, Biogeosciences, 8, 1769–1778, https://doi.org/10.5194/bg-8-1769-2011, 2011.
Allesson, L., Valiente, N., Dorsch, P., Andersen, T., Eiler, A., and Hessen, D. O.: Drivers and variability of CO2 : O2 saturation along a gradient from boreal to Arctic lakes, Sci. Rep., 12, 18989, https://doi.org/10.1038/s41598-022-23705-9, 2022.
Arsenault, J., Talbot, J., Brown, L. E., Holden, J., Martinez-Cruz, K., Sepulveda-Juaregui, A., Swindles, G. T., Wauthy, M., and Lapierre, J.: Biogeochemical distinctiveness of peatland ponds, thermokarst waterbodies, and lakes, Geophys. Res. Lett., 49, e2021GL097492, https://doi.org/10.1029/2021GL097492, 2022.
Bansal, S., Post van der Burg, M., Fern, R. R., Jones, J. W., Lo, R., McKenna, O. P., Tangen, B. A., Zhang, Z., and Gleason, R. A.: Large increases in methane emissions expected from North America's largest wetland complex, Sci. Adv., 9, eade1112, https://doi.org/10.1126/sciadv.ade1112, 2023.
Bastviken, D., Cole, J., Pace, M., and Tranvik, L.: Methane emissions from lakes: Dependence of lake characteristics, two regional assessments, and a global estimate, Global Biogeochem. Cy., 18, GB4009, https://doi.org/10.1029/2004GB002238, 2004.
Bastviken, D., Sundgren, I., Natchimuthu, S., Reyier, H., and Gålfalk, M.: Cost-efficient approaches to measure carbon dioxide (CO2) fluxes and concentrations in terrestrial and aquatic environments using mini loggers, Biogeosciences, 12, 3849–3859, https://doi.org/10.5194/bg-12-3849-2015, 2015.
Borge, A. F., Westermann, S., Solheim, I., and Etzelmüller, B.: Strong degradation of palsas and peat plateaus in northern Norway during the last 60 years, The Cryosphere, 11, 1–16, https://doi.org/10.5194/tc-11-1-2017, 2017.
Boudreau, B. P. and Ruddick, B. R.: On a reactive continuum representation of organic matter diagenesis, Am. J. Sci., 291, 507–538, 1991.
Campeau, A. and Del Giorgio, P. A.: Patterns in CH4 and CO2 concentrations across boreal rivers: Major drivers and implications for fluvial greenhouse emissions under climate change scenarios, Glob. Change Biol., 20, 1075–1088, https://doi.org/10.1111/gcb.12479, 2014.
Catalán, N., Marcé, R., Kothawala, D. N., and Tranvik, L. J.: Organic carbon decomposition rates controlled by water retention time across inland waters, Nat. Geosci., 9, 501–504, https://doi.org/10.1038/ngeo2720, 2016.
Clayer, F., Gobeil, C., and Tessier, A.: Rates and pathways of sedimentary organic matter mineralization in two basins of a boreal lake: Emphasis on methanogenesis and methanotrophy, Limnol. Oceanogr., 61, S131–S149, https://doi.org/10.1002/lno.10323, 2016.
Crevecoeur, S., Vincent, W. F., Comte, J., Matveev, A., and Lovejoy, C.: Diversity and potential activity of methanotrophs in high methane-emitting permafrost thaw ponds, PLoS ONE, 12, e0188223, https://doi.org/10.1371/journal.pone.0188223, 2017.
de Wit, H. A., Austnes, K., Hylen, G., and Dalsgaard, L.: A Carbon Balance of Norway: Terrestrial and Aquatic Carbon Fluxes, Biogeochemistry, 123, 317–342, https://doi.org/10.1007/s10533-014-0060-5, 2015.
Duvert, C., Butman, D. E., Marx, A., Ribolzi, O., and Hutley, L. B.: CO2 Evasion Along Streams Driven by Groundwater Inputs and Geomorphic Controls, Nat. Geosci., 11, 813–818, https://doi.org/10.1038/s41561-018-0245-y, 2018.
Elder, C. D., Thompson, D. R., Thorpe, A. K., Chandanpurkar, H. A., Hanke, P. J., Hasson, N., James, S. R., Minsley, B. J., Pastick, N. J., Olefeldt, D., Walter Anthony, K. M., and Miller, C. E.: Characterizing Methane Emission Hotspots From Thawing Permafrost, Global Biogeochem. Cy., 35, e2020GB006922, https://doi.org/10.1029/2020GB006922, 2021.
Frey, K. E. and McClelland, J. W.: Impacts of permafrost degradation on arctic river biogeochemistry, Hydrol. Process., 23, 169–182, https://doi.org/10.1002/hyp.7196, 2009.
Frey, K. E., McClelland, J. W., Holmes, R. M., and Smith, L. C.: Impacts of Climate Warming and Permafrost Thaw on the Riverine Transport of Nitrogen and Phosphorus to the Kara Sea, J. Geophys. Res.-Biogeo., 112, G04S58, https://doi.org/10.1029/2006JG000369, 2007.
Gisnås, K., Etzelmüller, B., Lussana, C., Hjort, J., Sannel, A. B. K., Isaksen, K., Westermann, S., Kuhry, P., Christiansen, H. H., Frampton, A., and Åkerman, J.: Permafrost Map for Norway, Sweden, and Finland, Permafr. Periglac. Process., 28, 359–378, https://doi.org/10.1002/ppp.1922, 2017.
Gundersen, C. B., Velasco, M. T., Velle, G., Rogora, M., Hawley, K. L., Fölster, J., Nygren, I., Vogt, R. D., Kolado, A., Pasztaleniec, A., and Bryntesen, T.: ICP Waters Programme Manual, NIVA-rapport, https://hdl.handle.net/11250/3178113 (last access: 20 March 2025), 2025.
Heiskanen, L., Tuovinen, J.-P., Vekuri, H., Räsänen, A., Virtanen, T., Juutinen, S., Lohila, A., Mikola, J., and Aurela, M.: Meteorological responses of carbon dioxide and methane fluxes in the terrestrial and aquatic ecosystems of a subarctic landscape, Biogeosciences, 20, 545–572, https://doi.org/10.5194/bg-20-545-2023, 2023.
Holgerson, M. A. and Raymond, P. A.: Large contribution to inland water CO2 and CH4 emissions from very small ponds, Nat. Geosci., 9, 222–226, https://doi.org/10.1038/ngeo2654, 2016.
Holmes, M. E., Crill, P. M., Burnett, W. C., McCalley, C. K., Wilson, R. M., Frolking, S., Chang, K. Y., Riley, W. J., Varner, R. K., Hodgkins, S. B., McNichol, A. P., Saleska, S. R., Rich, V. I., and Chanton, J. P.: Carbon Accumulation, Flux, and Fate in Stordalen Mire, a Permafrost Peatland in Transition, Global Biogeochem. Cy., 36, e2021GB007113, https://doi.org/10.1029/2021GB007113, 2022.
Hugelius, G., Strauss, J., Zubrzycki, S., Harden, J. W., Schuur, E. A. G., Ping, C. L., Schirrmeister, L., Grosse, G., Michaelson, G. J., Koven, C. D., O'Donnell, J. A., Elberling, B., Mishra, U., Camill, P., Yu, Z., Palmtag, J., and Kuhry, P.: Estimated stocks of circumpolar permafrost carbon with quantified uncertainty ranges and identified data gaps, Biogeosciences, 11, 6573–6593, https://doi.org/10.5194/bg-11-6573-2014, 2014.
Hugelius, G., Loisel, J., Chadburn, S., Jackson, R. B., Jones, M., Macdonald, G., Marushchak, M., Olefeldt, D., Packalen, M., Siewert, M. B., Treat, C., Turetsky, M., Voigt, C., and Yu, Z.: Large stocks of peatland carbon and nitrogen are vulnerable to permafrost thaw, P. Natl. Acad. Sci. USA, 117, 20438–20446, https://doi.org/10.1073/pnas.1916387117, 2020.
in 't Zandt, M. H., Liebner, S., and Welte, C. U.: Roles of Thermokarst Lakes in a Warming World, Trends Microbiol., 28, 769–779, https://doi.org/10.1016/j.tim.2020.04.002, 2020.
Kankaala, P., Huotari, J., Tulonen, T., and Ojala, A.: Lake-size dependent physical forcing drives carbon dioxide and methane effluxes from lakes in a boreal landscape, Limnol. Oceanogr., 58, 1915–1930, https://doi.org/10.4319/lo.2013.58.6.1915, 2013.
Kjær, S. T., Westermann, S., Nedkvitne, N., and Dörsch, P.: Carbon degradation and mobilisation potentials of thawing permafrost peatlands in northern Norway inferred from laboratory incubations, Biogeosciences, 21, 4723–4737, https://doi.org/10.5194/bg-21-4723-2024, 2024.
Kjellman, S. E., Axelsson, P. E., Etzelmüller, B., Westermann, S., and Sannel, A. B. K.: Holocene development of subarctic permafrost peatlands in Finnmark, northern Norway, Holocene, 28, 1855–1869, https://doi.org/10.1177/0959683618798126, 2018.
Knutson, J., Clayer, F., Dörsch, P., Westermann, S., and de Wit, H.: Dataset for “Water chemistry and greenhouse gas concentrations in waterbodies of a thawing permafrost peatland complex in northern Norway” Knutson et al., HydroShare [data set], https://doi.org/10.4211/hs.41faf3d6c3f245259ea820740291789c, 2025.
Krutskikh, N., Ryazantsev, P., Ignashov, P., and Kabonen, A.: The Spatial Analysis of Vegetation Cover and Permafrost Degradation for a Subarctic Palsa Mire Based on UAS Photogrammetry and GPR Data in the Kola Peninsula, Remote Sens., 15, 1896, https://doi.org/10.3390/rs15071896, 2023.
Krüger, J. P., Conen, F., Leifeld, J., and Alewell, C.: Palsa Uplift Identified by Stable Isotope Depth Profiles and Relation of δ15N to C N Ratio, Permafr. Periglac. Process., 28, 485–492, https://doi.org/10.1002/ppp.1936, 2017.
Kuhn, M., Lundin, E. J., Giesler, R., Johansson, M., and Karlsson, J.: Emissions from thaw ponds largely offset the carbon sink of northern permafrost wetlands, Sci. Rep., 8, 9535, https://doi.org/10.1038/s41598-018-27770-x, 2018.
Laurion, I., Massicotte, P., Mazoyer, F., Negandhi, K., and Mladenov, N.: Weak mineralization despite strong processing of dissolved organic matter in Eastern Arctic tundra ponds, Limnol. Oceanogr., 66, S47–S63, https://doi.org/10.1002/lno.11634, 2020.
Lehmann, N., Lantuit, H., Böttcher, M. E., and Hartmann, J.: Alkalinity Generation from Carbonate Weathering in a Silicate-Dominated Headwater Catchment at Iskorasfjellet, Northern Norway, Biogeosciences, 20, 3459–3478, https://doi.org/10.5194/bg-20-3459-2023, 2023.
Leppiniemi, O., Karjalainen, O., Aalto, J., Luoto, M., and Hjort, J.: Environmental spaces for palsas and peat plateaus are disappearing at a circumpolar scale, The Cryosphere, 17, 3157–3176, https://doi.org/10.5194/tc-17-3157-2023, 2023.
Lundin, E. J., Giesler, R., Persson, A., Thompson, M. S., and Karlsson, J.: Integrating carbon emissions from lakes and streams in a subarctic catchment, J. Geophys. Res.-Biogeo., 118, 1200–1207, https://doi.org/10.1002/jgrg.20092, 2013.
Martin, L. C. P., Nitzbon, J., Aas, K. S., Etzelmüller, B., Kristiansen, H., and Westermann, S.: Stability Conditions of Peat Plateaus and Palsas in Northern Norway, J. Geophys. Res.-Earth, 124, 705–719, https://doi.org/10.1029/2018JF004945, 2019.
Martin, L. C. P., Nitzbon, J., Scheer, J., Aas, K. S., Eiken, T., Langer, M., Filhol, S., Etzelmüller, B., and Westermann, S.: Lateral thermokarst patterns in permafrost peat plateaus in northern Norway, The Cryosphere, 15, 3423–3442, https://doi.org/10.5194/tc-15-3423-2021, 2021.
Matveev, A., Laurion, I., and Vincent, W. F.: Methane and carbon dioxide emissions from thermokarst lakes on mineral soils, Arct. Sci., 4, 584–604, https://doi.org/10.1139/as-2017-0047, 2018.
Meredith, M., Sommerkorn, M., Cassotta, S., Derksen, C., Ekaykin, A., Hollowed, A., Kofinas, G., Mackintosh, A., Melbourne-Thomas, J., Muelbert, M. M. C., Ottersen, G., Pritchard, H., and Schuur, E. A. G.: Polar Regions, in: IPCC Special Report on the Ocean and Cryosphere in a Changing Climate, United States National Marine Fisheries Service, United States National Oceanic and Atmospheric Administration Office of Oceanic and Atmospheric Research, and Intergovernmental Panel on Climate Change, IPCC, https://repository.library.noaa.gov/view/noaa/27411 (last access: 27 February 2025), 2019.
Mostovaya, A., Hawkes, J. A., Dittmar, T., and Tranvik, L. J.: Molecular Determinants of Dissolved Organic Matter Reactivity in Lake Water, Front. Earth Sci., 5, 106, https://doi.org/10.3389/feart.2017.00106, 2017.
Muster, S., Roth, K., Langer, M., Lange, S., Cresto Aleina, F., Bartsch, A., Morgenstern, A., Grosse, G., Jones, B., Sannel, A. B. K., Sjöberg, Y., Günther, F., Andresen, C., Veremeeva, A., Lindgren, P. R., Bouchard, F., Lara, M. J., Fortier, D., Charbonneau, S., Virtanen, T. A., Hugelius, G., Palmtag, J., Siewert, M. B., Riley, W. J., Koven, C. D., and Boike, J.: PeRL: A Circum-Arctic Permafrost Region Pond and Lake Database, Earth Syst. Sci. Data, 9, 317–348, https://doi.org/10.5194/essd-9-317-2017, 2017.
Muster, S., Riley, W. J., Roth, K., Langer, M., Cresto Aleina, F., Koven, C. D., Lange, S., Bartsch, A., Grosse, G., Wilson, C. J., Jones, B. M., and Boike, J.: Size Distributions of Arctic Waterbodies Reveal Consistent Relations in Their Statistical Moments in Space and Time, Front. Earth Sci., 7, 5, https://doi.org/10.3389/feart.2019.00005, 2019.
Norgeibilder: Flybilder, http://norgeibilder.no, last access: 21 December 2024.
Olefeldt, D., Heffernan, L., Jones, M. C., Sannel, A. B. K., Treat, C. C., and Turetsky, M. R.: Permafrost Thaw in Northern Peatlands: Rapid Changes in Ecosystem and Landscape Functions, in: Ecosystem Collapse and Climate Change, edited by: Canadell, J. G. and Jackson, R. B., Ecological Studies, Vol 241, Springer, Cham, https://doi.org/10.1007/978-3-030-71330-0_3, 2021.
Olefeldt, D. and Roulet, N. T.: Permafrost Conditions in Peatlands Regulate Magnitude, Timing, and Chemical Composition of Catchment Dissolved Organic Carbon Export, Glob. Change Biol., 20, 3122–3136, https://doi.org/10.1111/gcb.12607, 2014.
Payette, S., Delwaide, A., Caccianiga, M., and Beauchemin, M.: Accelerated Thawing of Subarctic Peatland Permafrost over the Last 50 Years, Geophys. Res. Lett., 31, L18208, https://doi.org/10.1029/2004GL020358, 2004.
Pirk, N., Aalstad, K., Mannerfelt, E. S., Clayer, F., de Wit, H., Christiansen, C. T., Althuizen, I., Lee, H., and Westermann, S.: Disaggregating the Carbon Exchange of Degrading Permafrost Peatlands Using Bayesian Deep Learning, Geophys. Res. Lett., 51, e2024GL109283, https://doi.org/10.1029/2024GL109283, 2024.
Polishchuk, Y. M., Bogdanov, A. N., Muratov, I. N., Polishchuk, V. Y., Lim, A., Manasypov, R. M., Shirokova, L. S., and Pokrovsky, O. S.: Minor Contribution of Small Thaw Ponds to the Pools of Carbon and Methane in the Inland Waters of the Permafrost-Affected Part of the Western Siberian Lowland, Environ. Res. Lett., 13, 045002, https://doi.org/10.1088/1748-9326/aab046, 2018.
R Core Team: R: A Language and Environment for Statistical Computing, R Foundation for Statistical Computing, Vienna, Austria, https://www.R-project.org/ (last access: 27 May 2025), 2021.
Raymond, P. A., Hartmann, J., Lauerwald, R., Sobek, S., McDonald, C., Hoover, M., Butman, D., Striegl, R., Mayorga, E., Humborg, C., Kortelainen, P., Dürr, H., Meybeck, M., Ciais, P., and Guth, P.: Global Carbon Dioxide Emissions from Inland Waters, Nature, 503, 355–359, https://doi.org/10.1038/nature12760, 2013.
Sannel, A. B. K. and Kuhry, P.: Warming-Induced Destabilization of Peat Plateau/Thermokarst Lake Complexes, J. Geophys. Res.-Biogeo., 116, G03035, https://doi.org/10.1029/2010JG001635, 2011.
Schelker, J., Singer, G. A., Ulseth, A. J., Hengsberger, S., and Battin, T. J.: CO2 Evasion from a Steep, High Gradient Stream Network: Importance of Seasonal and Diurnal Variation in Aquatic pCO2 and Gas Transfer, Limnol. Oceanogr., 61, 1826–1838, https://doi.org/10.1002/lno.10339, 2016.
Schuur, E. A. G., Bockheim, J., Canadell, J. G., Euskirchen, E., Field, C. B., Goryachkin, S. V., Hagemann, S., Kuhry, P., Lafleur, P. M., Lee, H., Mazhitova, G., Nelson, F. E., Rinke, A., Romanovsky, V. E., Shiklomanov, N., Tarnocai, C., Venevsky, S., Vogel, J. G., and Zimov, S. A.: Vulnerability of Permafrost Carbon to Climate Change: Implications for the Global Carbon Cycle, Bioscience, 58, 701–714, https://doi.org/10.1641/B580807, 2008.
Schuur, E. A. G., McGuire, A. D., Schädel, C., Grosse, G., Harden, J. W., Hayes, D. J., Hugelius, G., Koven, C. D., Kuhry, P., Lawrence, D. M., Natali, S. M., Olefeldt, D., Romanovsky, V. E., Schaefer, K., Turetsky, M. R., Treat, C. C., and Vonk, J. E.: Climate Change and the Permafrost Carbon Feedback, Nature, 520, 171–179, https://doi.org/10.1038/nature14338, 2015.
Schuur, E. A., Abbott, B. W., Commane, R., Ernakovich, J., Euskirchen, E., Hugelius, G., Grosse, G., Jones, M., Koven, C., Leshyk, V., and Lawrence, D.: Permafrost and climate change: Carbon cycle feedbacks from the warming Arctic, Annu. Rev. Environ. Res., 47, 343–371, https://doi.org/10.1146/annurev-environ-012220-011847, 2022.
Segers, R.: Methane Production and Methane Consumption: A Review of Processes Underlying Wetland Methane Fluxes, Biogeochemistry, 41, 23–51, https://doi.org/10.1023/A:1005929032764, 1998.
SeNorge: Norges vassdragsog energidirektorat, Norsk, https://www.senorge.no/ (last access: 22 November 2024), 2023.
Shirokova, L. S., Pokrovsky, O. S., Kirpotin, S. N., Desmukh, C., Pokrovsky, B. G., Audry, S., and Viers, J.: Biogeochemistry of organic carbon, CO2, CH4, and trace elements in thermokarst water bodies in discontinuous permafrost zones of Western Siberia, Biogeochemistry, 113, 573–593, https://doi.org/10.1007/s10533-012-9790-4, 2012.
Shirokova, L. S., Chupakov, A. V., Zabelina, S. A., Neverova, N. V., Payandi-Rolland, D., Causserand, C., Karlsson, J., and Pokrovsky, O. S.: Humic surface waters of frozen peat bogs (permafrost zone) are highly resistant to bio- and photodegradation, Biogeosciences, 16, 2511–2526, https://doi.org/10.5194/bg-16-2511-2019, 2019.
Sim, T. G., Swindles, G. T., Morris, P. J., Baird, A. J., Cooper, C. L., Gallego-Sala, A. V., Charman, D. J., Roland, T. P., Borken, W., Mullan, D. J., Aquino-López, M. A., and Gałka, M.: Divergent responses of permafrost peatlands to recent climate change, Environ. Res. Lett., 16, 035003, https://doi.org/10.1088/1748-9326/abe00b, 2021.
Sollid, J. L., Andersen, S., Hamre, N., Kjeldsen, O., Salvigsen, O., Sturød, S., Tveitå, T., and Wilhelmsen, A.: Deglaciation of Finnmark, North Norway, Norsk Geografisk Tidsskr., 27, 233–325, https://doi.org/10.1080/00291957308551960, 1973.
Strauss, J., Fuchs, M., Hugelius, G., Miesner, F., Nitze, I., Opfergelt, S., Schuur, E., Treat, C., Turetsky, M., Yang, Y., and Grosse, G.: Organic matter storage and vulnerability in the permafrost domain, in: Encyclopedia of Quaternary Science, edited by: Elias, S., 3rd Edn., Elsevier, 399–410, https://doi.org/10.1016/B978-0-323-99931-1.00164-1, 2025.
Stumm, W. and Morgan, J. J.: Aquatic Chemistry: Chemical Equilibria and Rates in Natural Waters, 3rd Edn., Wiley-Interscience, New York, 1040 pp., ISBN 978-0-471-51185-4, 1995.
Swindles, G. T., Morris, P. J., Mullan, D., Watson, E. J., Turner, T. E., Roland, T. P., Amesbury, M. J., Kokfelt, U., Schoning, K., Pratte, S., Gallego-Sala, A., Charman, D. J., Sanderson, N., Garneau, M., Carrivick, J. L., Woulds, C., Holden, J., Parry, L., and Galloway, J. M.: The long-term fate of permafrost peatlands under rapid climate warming, Sci. Rep., 5, 17951, https://doi.org/10.1038/srep17951, 2015.
Thrane, J.-E., de Wit, H., Blakseth, T. A., Skancke, L. B., and Garmo, Ø. A.: Correcting for bias in freshwater total nitrogen concentrations obtained with a modified standard (NS4743) 35 method, NIVA-rapport, ISBN 978-82-577-7273-4, 2020.
Turetsky, M. R., Abbott, B. W., Jones, M. C., Anthony, K. W., Olefeldt, D., Schuur, E. A. G., Grosse, G., Kuhry, P., Hugelius, G., Koven, C., Lawrence, D. M., Gibson, C., Sannel, A. B. K., and McGuire, A. D.: Carbon release through abrupt permafrost thaw, Nat. Geosci., 13, 138–143, https://doi.org/10.1038/s41561-019-0526-0, 2020.
Valiente, N., Eiler, A., Allesson, L., Andersen, T., Clayer, F., Crapart, C., Dörsch, P., Fontaine, L., Heuschele, J., Vogt, R. D., Wei, J., de Wit, H. A., and Hessen, D. O.: Catchment properties as predictors of greenhouse gas concentrations across a gradient of boreal lakes, Front. Environ. Sci., 10, 880619, https://doi.org/10.3389/fenvs.2022.880619, 2022.
Verdonen, M., Störmer, A., Lotsari, E., Korpelainen, P., Burkhard, B., Colpaert, A., and Kumpula, T.: Permafrost degradation at two monitored palsa mires in north-west Finland, The Cryosphere, 17, 1803–1819, https://doi.org/10.5194/tc-17-1803-2023, 2023.
Vigneron, A., Cruaud, P., Bhiry, N., Lovejoy, C., and Vincent, W. F.: Microbial community structure and methane cycling potential along a thermokarst pond-peatland continuum, Microorganisms, 7, 1–16, https://doi.org/10.3390/microorganisms7110486, 2019.
Vonk, J. E., Tank, S. E., Bowden, W. B., Laurion, I., Vincent, W. F., Alekseychik, P., Amyot, M., Billet, M. F., Canário, J., Cory, R. M., Deshpande, B. N., Helbig, M., Jammet, M., Karlsson, J., Larouche, J., MacMillan, G., Rautio, M., Walter Anthony, K. M., and Wickland, K. P.: Reviews and syntheses: Effects of permafrost thaw on Arctic aquatic ecosystems, Biogeosciences, 12, 7129–7167, https://doi.org/10.5194/bg-12-7129-2015, 2015.
Vähätalo, A. V., Aarnos, H., and Mäntyniemi, S.: Biodegradability continuum and biodegradation kinetics of natural organic matter described by the beta distribution, Biogeochemistry, 100, 227–240, https://doi.org/10.1007/s10533-010-9419-4, 2010.
Wallin, M. B., Campeau, A., Audet, J., Bastviken, D., Bishop, K., Kokic, J., Laudon, H., Lundin, E., Löfgren, S., Natchimuthu, S., Sobek, S., Teutschbein, C., Weyhenmeyer, G. A., and Grabs, T.: Carbon dioxide and methane emissions of Swedish low-order streams: A national estimate and lessons learnt from more than a decade of observations, Limnol. Oceanogr. Lett., 3, 156–167, https://doi.org/10.1002/lol2.10061, 2018.
Walter, K. M., Zimov, S. A., Chanton, J. P., Verbyla, D., and Chapin, F. S.: Methane bubbling from Siberian thaw lakes as a positive feedback to climate warming, Nature, 443, 71–75, https://doi.org/10.1038/nature05040, 2006.
Walter, K. M., Chanton, J. P., Chapin, F. S. III, Schuur, E. A. G., and Zimov, S. A.: Methane production and bubble emissions from arctic lakes: Isotopic implications for source pathways and ages, J. Geophys. Res.-Biogeo., 113, G03001, https://doi.org/10.1029/2007JG000569, 2008.
Ward, C. P. and Cory, R. M.: Chemical composition of dissolved organic matter draining permafrost soils, Geochim. Cosmochim. Ac., 167, 63–79, https://doi.org/10.1016/j.gca.2015.07.001, 2015.
Westrich, J. T. and Berner, R. A.: The role of sedimentary organic matter in bacterial sulfate reduction: The G model tested, Limnol. Oceanogr., 29, 236–249, https://doi.org/10.4319/lo.1984.29.2.0236, 1984.
Wickham, H.: ggplot2: Elegant Graphics for Data Analysis, Springer-Verlag New York, ISBN 978-3-319-24277-4, https://ggplot2.tidyverse.org (last access: 29 April 2025), 2016.
Wik, M., Varner, R. K., Anthony, K. W., MacIntyre, S., and Bastviken, D.: Climate-sensitive northern lakes and ponds are critical components of methane release, Nat. Geosci., 9, 99–105, https://doi.org/10.1038/ngeo2578, 2016.
Wilhelm, E., Battino, R., and Wilcock, R. J.: Low-pressure solubility of gases in liquid water, Chem. Rev., 77, 219–262, https://doi.org/10.1021/cr60306a003, 1977.
Winterdahl, M., Wallin, M. B., Karlsen, R. H., Laudon, H., Öquist, M., and Lyon, S. W.: Decoupling of carbon dioxide and dissolved organic carbon in boreal headwater streams, J. Geophys. Res.-Biogeo., 121, 2630–2651, https://doi.org/10.1002/2016JG003420, 2016.
Yang, H., Andersen, T., Dörsch, P., Tominaga, K., Thrane, J.-E., and Hessen, D. O.: Greenhouse gas metabolism in Nordic boreal lakes, Biogeochemistry, 126, 211–225, https://doi.org/10.1007/s10533-015-0154-8, 2015.
Zimov, S. A., Davydov, S. P., Zimova, G. M., Davydova, A. I., Schuur, E. A. G., Dutta, K., and Chapin, F. S. III: Permafrost carbon: Stock and decomposability of a globally significant carbon pool, Geophys. Res. Lett., 33, L20502, https://doi.org/10.1029/2006GL027484, 2006.
Zolkos, S. and Tank, S. E.: Experimental evidence that permafrost thaw history and mineral composition shape abiotic carbon cycling in thermokarst-affected stream networks, Front. Earth Sci., 8, 1–11, https://doi.org/10.3389/feart.2020.00152, 2020.
Zolkos, S., Tank, S. E., and Kokelj, S. V., Mineral weathering and the permafrost carbon-climate feedback, Geophys. Res. Lett., 45, 9623–9632, https://doi.org/10.1029/2018GL078748, 2018.
Zolkos, S., Tank, S. E., Striegl, R. G., and Kokelj, S. V.: Thermokarst effects on carbon dioxide and methane fluxes in streams on the Peel Plateau (NWT, Canada), J. Geophys. Res.-Biogeo., 124, 1781–1798, https://doi.org/10.1029/2019JG005038, 2019.