the Creative Commons Attribution 4.0 License.
the Creative Commons Attribution 4.0 License.
 | 25 Aug 2025
Drivers of soil organic carbon from temperate to alpine forests: a model-based analysis of the Swiss forest soil inventory with Yasso20
Sia Gosheva-Oney
Markus Didion
Roman Flury
Lorenz Walthert
Stephan Zimmermann
Brian J. Oney
Pascal A. Niklaus
Esther Thürig
Toni Viskari
Jari Liski
Frank Hagedorn
Predicting soil organic carbon (SOC) stocks and their dynamics in forest ecosystems is crucial for assessing forest C balance, but the relative importance of key controls – litter inputs, climate, and soil properties – remains uncertain. Here, we linked SOC stocks at 556 old-growth Swiss forest sites from 350 to 2000 m a.s.l. to a comprehensive set of environmental variables, encompassing climate (mean annual precipitation, MAP: 700–2100 mm, mean annual temperature, MAT: 0–12 °C), soil properties, and forest types. In addition, we compared measured SOC stocks with stocks simulated by the Yasso20 model, which is widely used for reporting SOC stock changes. Since Yasso20 is driven solely by litter inputs and climate, deviations between modeled and measured stocks can reveal the significance of additional factors such as organo-mineral interactions that we hypothesized to be crucial for SOC stocks.
Total SOC stocks exhibited distinct regional patterns, with the highest values in the Southern Alps, where soils are rich in Fe and Al oxides and receive high MAP. On average, total SOC stocks simulated by Yasso20 aligned well with measured SOC stocks (13.7 vs. 13.2 kg C m−2). However, the model did not capture regional SOC variability, underestimating SOC stocks by up to 7 kg C m−2 in the Southern Alps. The underestimation was primarily explained by soil mineral properties, with their influence depending on soil pH. In soils with pH ≤ 5, exchangeable Fe had the strongest effect on Yasso20 deviations from measured stocks, while in soils with pH > 5, exchangeable Ca had the strongest effect on model deviations. Beyond Fe and Ca, MAP emerged as an important driver of total SOC stocks, with SOC stocks increasing with MAP. At higher elevations, this coincided with low MAT and a high share of conifers. While Yasso20 accounted for MAT, Yasso20 underestimated SOC stocks for MAP > 1400 mm.
Overall, our results indicate that mineral-driven SOC stabilization and climate are the primary drivers of Yasso20 deviations from measured SOC stocks. Incorporating mineral-driven soil organic matter stabilization and coupling to a soil water model can improve the modeling of SOC stocks. However, further studies are needed to verify how C stabilization mechanisms and soil moisture can be included in model-based estimates of SOC stock changes, which is the primary application of Yasso in greenhouse gas inventories.
- Article
(3116 KB) - Full-text XML
-
Supplement
(1742 KB) - BibTeX
- EndNote


Soils are the largest C pool in terrestrial ecosystems, with forest soils storing over 40 % of terrestrial ecosystem organic C as soil organic matter (SOM) (Prescott and Grayston, 2023). The complex nature of SOM – comprising a heterogeneous mixture of components that turn over on daily to millennial time scales (Sierra et al., 2017; van der Voort et al., 2017) – and of processes driving SOM stabilization (Schmidt et al., 2011; Kleber et al., 2015; Lehmann and Kleber, 2015) makes it difficult to accurately estimate and predict soil organic carbon (SOC) stocks and their responses to environmental changes (Schrumpf et al., 2011; Smith et al., 2020).
SOC storage is considered to depend mostly on the C inputs to soils and their transformation and stabilization processes, which are controlled by environmental and biological drivers (Chen et al., 2013; Angst et al., 2018). In temperate forests, SOC storage was shown to be linked to climate, with greater SOC stocks in cool and humid mountainous regions and smaller stocks in warmer and drier regions, as shown in Bavaria (Wiesmeier et al., 2013) and Switzerland (Gosheva et al., 2017). In the German Alps, the increased temperatures during the last three decades have driven topsoil organic C losses in forests with larger losses at low-elevation sites (Prietzel et al., 2016). However, geochemical factors may exert a strong additional control on SOC stocks by binding SOC to mineral surfaces, leading to long-term stabilization and SOC accumulation (Hagedorn et al., 2003; Doetterl et al., 2015; Doetterl et al., 2018; Reichenbach et al., 2023). In temperate forest soils, the type and reactivity of soil minerals interacting with SOM were shown to be the principal factors driving SOC accumulation and formation of mineral-associated organic matter, with oxide-dominated soils having a higher capacity to accumulate soil C than soils dominated by phyllosilicate clays (Bramble et al., 2023). For carbonate-containing soils, SOC interactions with Ca2+, occlusion within aggregates in Ca-rich substrates, and inclusion into carbonates have been identified as primary SOC stabilization mechanisms (Rowley et al., 2018). In addition to geochemical factors, SOC accumulation is modulated by forest productivity, management intensity, and tree species (Bramble et al., 2023), which affect the quantity and quality of litter inputs entering the soil (Vesterdal et al., 2013; Mayer et al., 2020).
While process-based models increasingly integrate SOM-mineral interactions (Abramoff et al., 2018; Abramoff et al., 2022; Brunmayr et al., 2024), SOM stabilization processes are poorly incorporated into models that are used for greenhouse gas (GHG) accounting of the forest soil C balance, which are generally based on data from National Forest Inventories or NFI (Didion et al., 2016; Hernández et al., 2017). Reasons include the poor quantitative knowledge of the complex processes driving SOM storage and the limited data availability of soil properties at the national scale. Simpler soil C models, in contrast, typically assume that SOC storage is primarily determined by the quantity and quality of litter inputs and climatic conditions, regulating decomposition and stabilization of organic matter (Liski et al., 2005; Ågren et al., 2008). This facilitates their broader applicability. In several European countries including Switzerland, GHG reporting of SOC stock changes in forests is based on model simulations using the soil C cycling model Yasso (Tuomi et al., 2009; Didion et al., 2016; Hernández et al., 2017). The Yasso model was originally developed for forestry applications, relying on data available in forest inventories and basic climate data, without incorporating soil properties (Liski et al., 2005; Tuomi et al., 2009). Currently, the new version of the model (Yasso20) has been calibrated with a more advanced method and using a global SOC dataset (> 4000 measurements), which resulted in an overall better model performance compared to Yasso07 (Viskari et al., 2022).
Here, we aimed to identify the main factors controlling SOC stocks in Swiss forest soils across a large gradient of climate, soil biogeochemistry, and forest types. To disentangle the main drivers of SOC stocks, our main approach was to (1) simulate SOC stocks in forest soils by Yasso20, driven by litter input and climate, and (2) statistically analyze the deviations between Yasso20-simulated and measured SOC stocks. This allows us to evaluate the importance of mineral-driven SOC stabilization, since mineral soil properties are not implemented in Yasso. For this, we analyzed a comprehensive dataset including measured SOC stocks in the organic layers and mineral soil up to 100 cm depth as well as soil physico-chemical properties for 556 soil profiles located in forests older than 120 years (Gosheva et al., 2017), with an elevation ranging from 370 to 1960 m a.s.l. The dataset covered a wide range of climatic conditions (mean annual precipitation of 700–2100 mm, mean annual temperature of 0–12 °C), soil properties (i.e., pH 3–8), and forest types. The dataset included soil physico-chemical characteristics such as clay content, pH, exchangeable Fe, Al, and Ca, topographic attributes, tree species composition, and satellite-derived net primary production (NPP). Given that the soil C model Yasso20 accounts only for litter inputs and climatic conditions, we hypothesized that mineral soil components driving SOM stabilization (e.g., Fe, Al, and Ca content) would largely explain the deviations between simulated and measured SOC stocks. In turn, this would imply that mineral-driven C stabilization is a key process for soil C storage at the regional and national scale, which should be considered in models used for GHG reporting.
2.1 Study area and sampling sites
For our study, we considered 556 sites in old-growth forests, i.e., forests older than 120 years (Fig. 1; 52 % broadleaf- vs. 48 % conifer-dominated sites) from a soil database encompassing approximately 1000 soil profiles (Gosheva et al., 2017). In combination with the typically small-scale management in Switzerland, which includes planned logging of single trees with harvesting residues (e.g., fine branches, foliage, belowground parts with trunk to approx. 30 cm aboveground) normally left in the stand (Brändli et al., 2020), the focus on old forests ensures that there have been only reduced disturbances in the forest cover over the past decades. Although natural disturbances such as windthrows occurred in Swiss forests (e.g., Vivian in 1990 and Lothar in 1999) with possible impacts on SOC stocks (Mayer et al., 2023), none of the forest sites was affected as sampling excluded windthrow sites. Forests in Switzerland can be divided into five major regions (Fig. 1) according to Fischer and Traub (2019), with relatively uniform growth, specific soil properties, and forest types (Gosheva et al., 2017).
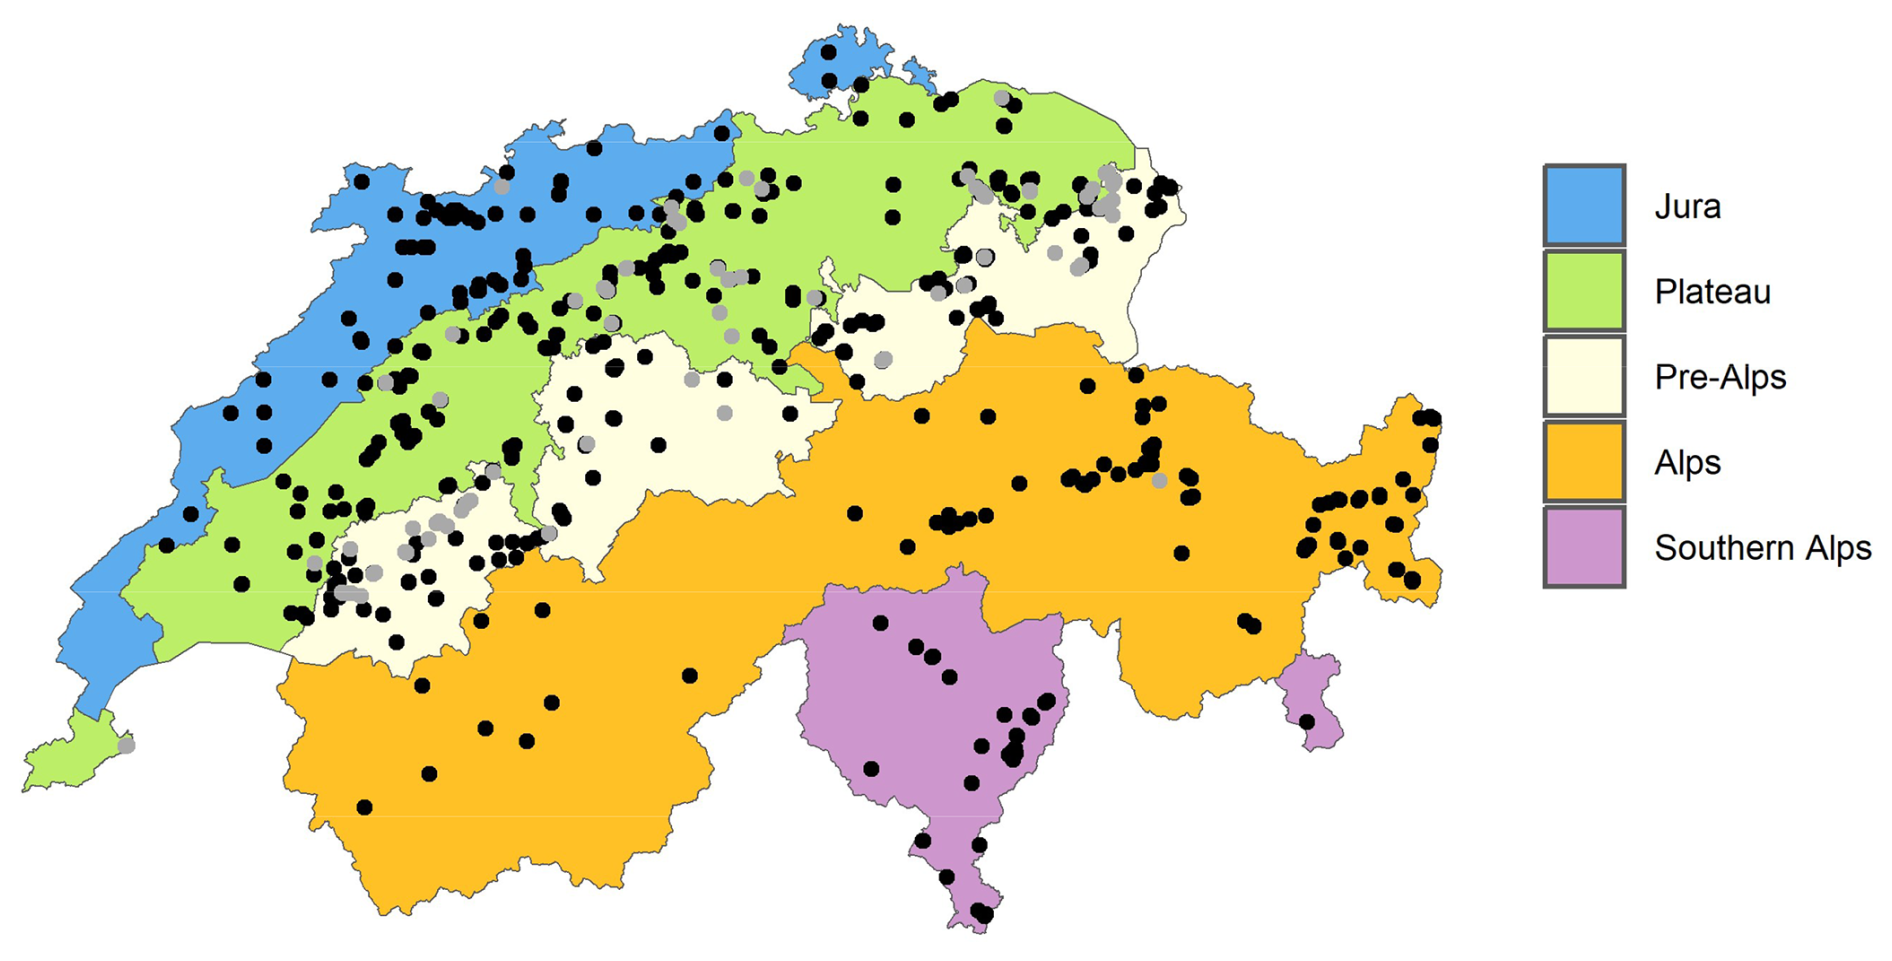
Figure 1Distribution of the sampled forest sites (total n = 556 sites, of which n= 88 waterlogged soils are shown in gray) in the five regions of Switzerland. Note that the Alps have fewer sites since they are largely unforested (i.e., above the treeline).
Most of our sites are located in the Swiss Plateau (n= 164), a region characterized by more or less deeply decarbonated soils from still calcareous moraines and tertiary sediments (molasse), followed by sites in the Pre-Alps (n= 138), a region consisting of soils with highly variable weathering and decalcification depths from very different types of sediments (Gnägi and Labhart, 2015). The remaining sites are in the Alps (n= 81) on heterogeneous bedrock, in the Jura (n= 54), dominated by limestone or marl, and in the Southern Alps (n= 31) with mainly gneiss as bedrock (Gnägi and Labhart, 2015). Waterlogged soils (i.e., redoximorphic soils, characterized by periodic or permanent oxygen shortage) were studied separately (n= 88), since excess moisture dominates soil development and SOM stabilization mechanisms in these soils.
2.2 Soil sampling and analysis, climate, and topography
The 556 soil profiles were sampled from 1989 to 2004 by genetic horizons up to the parent material. Composite soil samples were taken from the front wall of the soil profiles (over an average width of 70 cm). Samples were dried at 60 °C and sieved with a 2 mm mesh before chemical analysis. Soil type was classified according to the World Reference Base (IUSS Working Group WRB, 2007).
Total and organic C contents were measured in ground samples by dry combustion using an elemental analyzer (NC 2500, CE Instruments, Italy). Soil samples with pH > 6 were first treated with HCl to remove inorganic C prior to dry combustion (Walthert et al., 2010). Soil texture was characterized by measuring the clay, silt, and sand contents using the sedimentation method according to Gee and Bauder (1986). Soil pH was measured potentiometrically in a 0.01 M CaCl2 solution. Contents of exchangeable Al, Fe, and Ca (mmolc kg−1) were obtained by 1 M ammonium chloride extraction (Walthert et al., 2004). Soil properties were calculated for 0–30 and 0–100 cm depth intervals of the mineral soil by weighted averages of their contents according to the amount of fine earth in the various soil horizons.
Data on elevation and slope were determined from a 25 m digital elevation model for all sites (Swisstopo, 2011). Slope orientation and topography were assessed during the soil surveys. Annual climate data for each site (mean monthly temperature and mean monthly precipitation for the period 1961–1990) were obtained from the gridded data produced by the Swiss Federal Office of Meteorology and Climatology (MeteoSwiss, 2024). The Braun-Blanquet cover abundance scale (Braun-Blanquet, 1964) was used to quantify plant species cover in an area ranging from 100 to 500 m2 (Walthert et al., 2013). Percentage of broadleaf tree species was calculated as the sum of the cover of all broadleaf species divided by the sum of the cover of all tree species at the tree level. Only for visualization purposes, the forest sites were subdivided into two types based on the broadleaf percentage: coniferous (0 %–50 %) and broadleaf (51 %–100 %) forests.
2.3 Calculation of SOC stocks from sampled soil profiles
SOC stocks were calculated separately for the organic layers, including L (undecomposed litter), F (fermentation), and H (humified) horizons, and the mineral soil at 0–100 cm depth. Total SOC stock is the sum of stocks in the organic layers and in the mineral soil. SOC stocks in the organic layer were calculated according to Hagedorn et al. (2010), with the mass of the organic layer calculated as the product of the density (L: 0.10 g cm−3, F: 0.15 g cm−3, H: 0.20 g cm−3) and the volume (based on measured thickness), multiplied by the percentage of C content obtained by dry combustion (see Sect. 2.2). Mineral SOC stocks were calculated using the following Eq. (1):
where SOC(h,z) represents SOC stocks (kg C m−2) of all the z mineral soil horizons, Ci represents the organic carbon content of the horizon i (kg kg−1 of C) obtained by dry combustion, ρi is the density of the fine earth (g cm−3), θi is the volumetric stone content (m3 m−3) visually estimated from the soil profile (Richard et al., 1978), and hi is the horizon thickness (m). A pedotransfer function (PTF) based on a calibration dataset of 559 mineral soil horizons from 134 different Swiss forest sites and a validation set of 131 horizons from 34 sites was used to estimate the density of the fine earth fraction (Nussbaum et al., 2016). Covariates used in this PTF are sampling depth, slope, field estimates of stone content and soil density, region, and organic C content.
2.4 Input derivation and SOC stock simulations with Yasso20
SOC stock simulations were conducted with the soil C cycling model Yasso20. The model was calibrated by Viskari et al. (2022) using several datasets describing different processes of the soil C cycle, including litterbag decomposition time series, a woody decomposition dataset, and global SOC stock measurements, which make Yasso20 potentially suitable for a wide range of environmental conditions. Based on litter input data (i.e., foliage, deadwood, etc.), Yasso20 simulates flows of C between four chemical classes of C compounds and a humus (“H”) pool representing long-lived, stable SOC as a function of temperature and precipitation. Litter inputs are subdivided into the following four different chemical C compounds that are the same as the SOC classes in the model: “A” represents hydrolyzable compounds in acid, “W” represents water-soluble compounds, “E” represents ethanol-soluble compounds, and “N” represents non-soluble compounds. Each of these compounds has different C decomposition rates. The sum of the AWEN compound classes (representing the “labile” C pools) and the H pool (the “stable” C pools) corresponds to the total “simulated” SOC stocks, including the SOC stored in the organic layers plus in the mineral soil up to 100 cm depth. Parameters defining C decomposition rates and C cycling between C compartments and to a more stable H pool are obtained probabilistically using Markov Chain Monte Carlo sampling (Viskari et al., 2022) and are fitted based on data from several litterbag studies (Berg et al., 1991; Trofymow, 1998; Gholz et al., 2000), woody litter decomposition experiments (Mäkinen et al., 2006), and global SOC measurements from Oak Ridge National Laboratory (Zinke et al., 1986).
To obtain a proxy of site-specific litter inputs for Yasso20 simulations, we derived the average net primary production (NPP) for the period 2001–2022 from Terra and Aqua MODIS satellites at 500 m resolution (Running and Zhao, 2021a, b), with a maximum NPP-to-GPP (gross primary production) ratio of 0.5 (Viskari et al., 2022). We partitioned the NPP into broadleaf and conifer species, multiplying the NPP by the percentage of broadleaf and conifer species recorded by field assessments at each site. Then, we divided the NPP into different tree components, multiplying the NPP by average tree allocation factors (stem: 0.30; branches: 0.04; twigs: 0.03; coarse roots: 0.11; fine roots: 0.15; foliage: 0.27; seeds: 0.10) derived from 15 years of tree growth data at 18 long-term forest ecosystem research (LWF) sites across Switzerland (Etzold et al., 2014). Fine roots and foliage represented the group of non-woody litter, whereas woody litter included stem wood, branches, twigs, coarse roots, and seeds. The C inputs for each pool were separated into the four AWEN components according to the percentage of broadleaf and conifer species at each site, using the functions and approach adopted in the Swiss GHG inventory (Didion, 2023) based on measured fractions at sites of the long-term forest monitoring program LWF (Didion et al., 2014). Data for observed climate were obtained for each site (30-year average climate, 1961–1990) from spatially gridded data of the Federal Office of Meteorology and Climatology MeteoSwiss (MeteoSwiss, 2024); see Sect. 2.2.
The Yasso20 simulations were performed in R version 4.2.2 (R Core Team, 2022) with the package Ryassofortran, version 0.4.0 (Pusa, 2023). Average litter inputs derived from NPP and climate data were used with spin-up simulations to reach theoretical steady-state SOC stocks (Mao et al., 2019), assuming that current SOC stocks have accumulated over centuries (Gimmi et al., 2013). At each site, independent simulations were based on 500 randomly sampled parameter vectors to represent uncertainty related to model parameters (Viskari et al., 2022).
2.5 Statistical analysis
All statistical analyses were performed with R version 4.2.2 (R Core Team, 2022). To summarize the correlated numerical explanatory variables into larger groups, we performed a principal component analysis (PCA) including all the numerical variables (pH, clay content, exchangeable contents of Fe, Al, and Ca, mean annual temperature or MAT, mean annual precipitation or MAP, NPP, percentage of broadleaves, and slope) with scaled variables. Only principal components with eigenvalues > 1 were retained (Kaiser–Guttman criterion).
The effects of (i) main principal components and (ii) soil physico-chemical properties (pH, clay content, exchangeable contents of Fe, Al, and Ca) in the upper 30 cm mineral soil – the most relevant depth for tree rooting, litter decomposition processes, and organic layer development – and site variables (MAT, MAP, NPP, percentage of broadleaves, and slope) on total SOC stocks and Yasso20 deviations (simulated minus measured values of total SOC stocks) were tested using linear mixed-effect models with the nlme package, version 3.1–160 (Pinheiro et al., 2022). Statistical analysis of Yasso20 deviations allowed us to assess the effects of the main drivers of SOC stocks on model discrepancies from measured values. In order to account for a small spatial autocorrelation in the model residuals, the region was included as a random intercept in the model, which allowed us to estimate an overall effect of the linear model (i.e., model estimate). Effects of explanatory variables on SOC stocks were also tested for each region using linear models. The numerical explanatory variables were log- or square-root transformed when the relationship between the explanatory and the response variables was non-linear or when the residuals showed signs of heteroscedasticity or non-normality. Then, all explanatory variables were centered to a mean of 0. The assumption of normal distribution of residuals was verified through quantile–quantile plots and plots of residuals vs. fitted values. Based on existing literature, the variables pH, clay content, exchangeable Fe, Al, and Ca, MAT, MAP, NPP, percentage of broadleaves, and slope were identified as key drivers of SOC stocks and thus as explanatory variables. Exchangeable Al was excluded from the final statistical model due to its strong correlation with pH and exchangeable Fe ( and +0.87). Exchangeable Fe was retained as the primary proxy for pedogenic oxides (Fig. S6 in the Supplement). For the statistical analysis of Yasso20 deviations, NPP was excluded from the final model since it was used as a main input of the soil C cycling model Yasso20. Two-way interactions between climate and soil properties (i.e., exchangeable contents of Fe, Ca, clay content, and pH) and between soil properties and pH were also tested (Supplement Tables S2, S3) since interactions of climate and geochemical factors are known to drive SOC storage (Doetterl et al., 2015).
Measured vs. simulated SOC stocks by regions and forest types were compared using Welch's t-tests, after verifying the normality assumptions. Correlations between simulated and measured SOC stocks were tested using Pearson's product–moment correlation coefficient (r), which agreed well with Spearman's rank correlation coefficient (not shown).
3.1 Site characteristics
Distinct site characteristics were found in each of the five regions of Switzerland (Fig. 1, Table 1). Topsoils in the Jura showed the highest pH as well as contents of clay and Ca, while the most acidic soils were found in the Southern Alps, with the highest contents of exchangeable Fe, oxalate-extractable Fe, and Al (Table 1). MAP was highest in the Southern Alps and the Pre-Alps, whereas the Plateau had the highest MAT (Table 1) and NPP (Fig. S1a). Under conifer-dominated forests, topsoils were more acidic (average pH ± standard error at 0–30 cm depth, conifers: 4.7±0.1 vs. broadleaves: 5.2 ± 0.1) and had higher contents of exchangeable Fe and Al than broadleaf-dominated forests (data not shown).
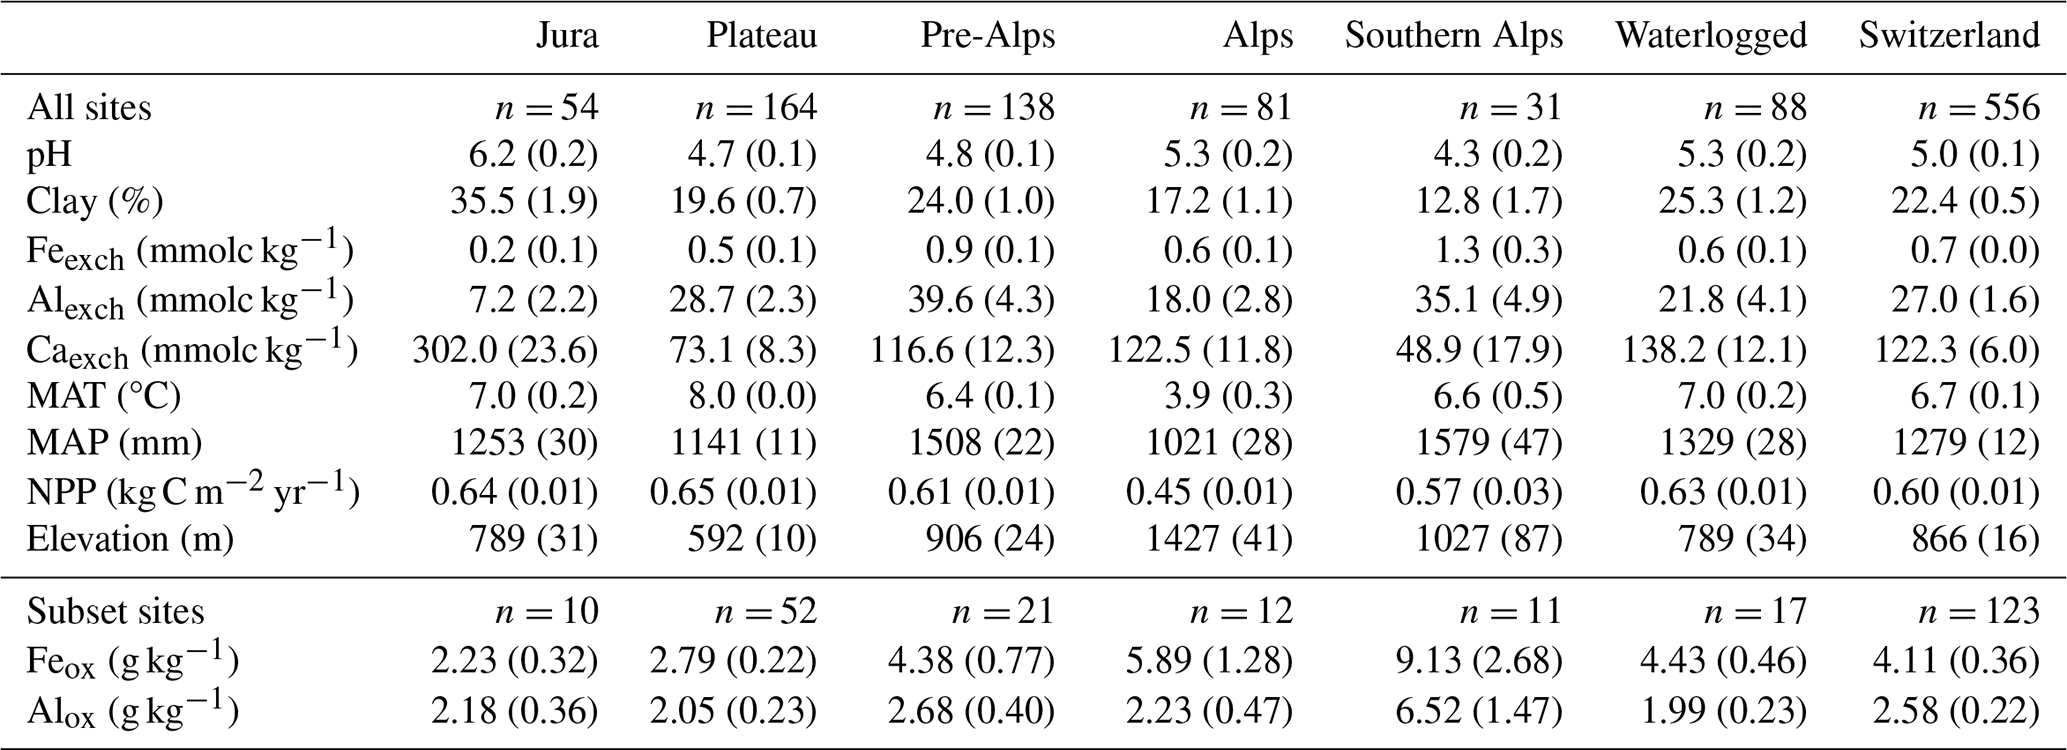
Table 1Average values of soil properties (pH, clay content, exchangeable contents of Fe, Al, and Ca) in the upper 30 cm of mineral soil, annual climate data (MAT = mean annual temperature, MAP = mean annual precipitation), net primary production (NPP) from MODIS (average 2001–2022), and elevation in the 556 sites across the five regions of Switzerland, with waterlogged soils shown separately. For a subset of sites (n= 123), oxalate-extractable Fe and Al (Feox and Alox) in the upper 30 cm of mineral soil are reported. Values are means with standard errors in brackets.
NPP peaked at an elevation of about 700 m a.s.l., then decreased with increasing elevation (linear model fit for elevation > 700 m: kg C m−2 yr−1 per 1000 m elevation gain; R2= 0.65, P < 0.001, Fig. 2a). In contrast to NPP, SOC stocks in the organic layer increased with elevation (3.5±0.4 kg C m−2 per 1000 m increase in elevation; R2= 0.14, P < 0.001; Fig. 2b) in sites excluding waterlogged soils (n= 468). In the mineral soil, SOC stocks were not related to elevation (Fig. 2c); thus, the ratio between SOC stored in the organic layer and in the mineral soil increased with elevation. NPP was negatively correlated with organic layer SOC stocks (with Pearson correlation coefficient , P < 0.001), while it was positively but weakly related to mineral SOC stocks (, P= 0.006).
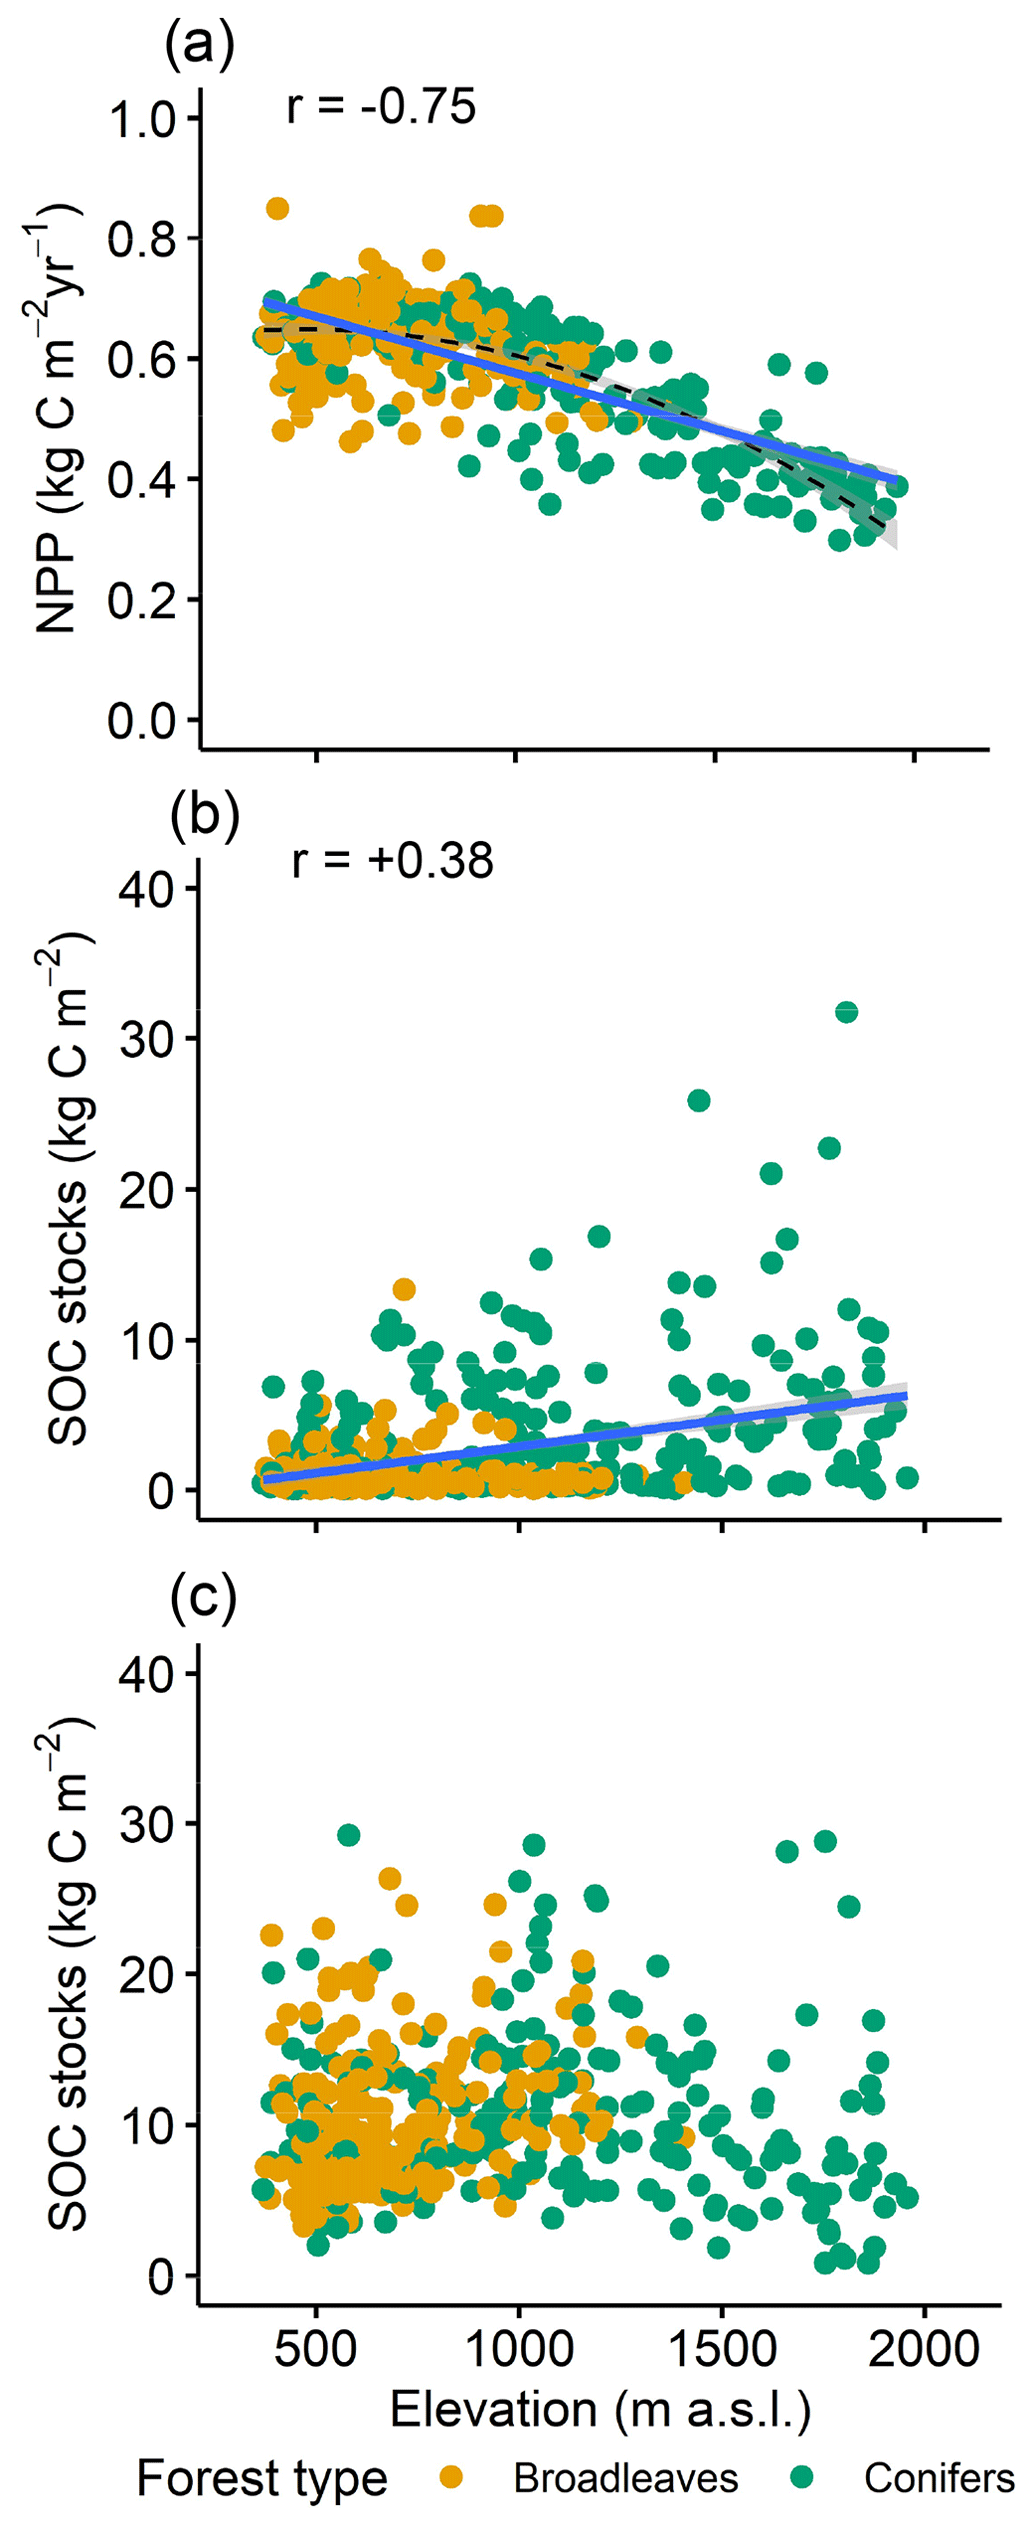
Figure 2Net primary production (NPP) from MODIS (average 2001–2022) (a), SOC stocks in the organic layers (b) and in the mineral soil at 0–100 cm depth (c) against elevation in 468 forest sites across Switzerland (excluding waterlogged soils). Plotted lines show significant linear correlations (P < 0.05) with 95 % confidence intervals in gray and the Pearson correlation coefficient (r). A polynomial regression is also shown as a dotted line in (a).
The first three principal components of the PCA with soil physico-chemical variables and site properties explained 74 % of the variance in the data (Table S1a). The first PC (PC1) was characterized by high loadings of soil chemical parameters: pH (0.48), Ca (0.47), Al (−0.43), and Fe (−0.40), explaining 35 % of the variance. PC2 (24 % of variance) showed high loadings of MAT (0.58), NPP (0.58), and broadleaf percentage (0.44), whereas PC3 (15 % of variance) showed high loadings of MAP (0.63) and clay content (0.44) (Table S1a).
3.2 Measured and simulated SOC stocks
Measured SOC stocks were highest in the Southern Alps (19.5±1.7 kg C m−2) followed by the Pre-Alps, Jura, and the Alps, while they were lowest in the Plateau (10.2±0.3 kg C m−2, Fig. 3a). On average, the Yasso20-simulated SOC stocks were similar to the measured stocks at the 556 sites including waterlogged soils (average ± standard error; simulated 13.7±0.1 vs. measured 13.2±0.3 kg C m−2, Welch's t-test: P= 0.16). Waterlogged soils had SOC stocks of 15.9±1.2 kg C m−2 and were considered separately in further analyses. In comparison to measured stocks and despite the large NPP range across regions (Fig. S1a), simulated SOC stocks differed only a little among the regions (Fig. 3a, Fig. S1b). The largest deviations between simulated and measured SOC stocks were observed in the Southern Alps, where Yasso20 underestimated stocks by almost 7 kg C m−2 (−35 % of measured SOC stocks, Welch's t-test: P < 0.001, Fig. 3a). In contrast, Yasso20 overestimated SOC stocks by about 3 kg C m−2 in the Plateau (+33 % of measured SOC stocks, P < 0.001). The simulations for the Jura, Pre-Alps, and Alps agreed well with SOC measurements, with average deviations below 1 kg C m−2 (2 %–4 % of measured SOC stocks, P > 0.05). In waterlogged soils, Yasso20 underestimated SOC stocks by about 2 kg C m−2 (−13 % of measured SOC stocks, P= 0.08).
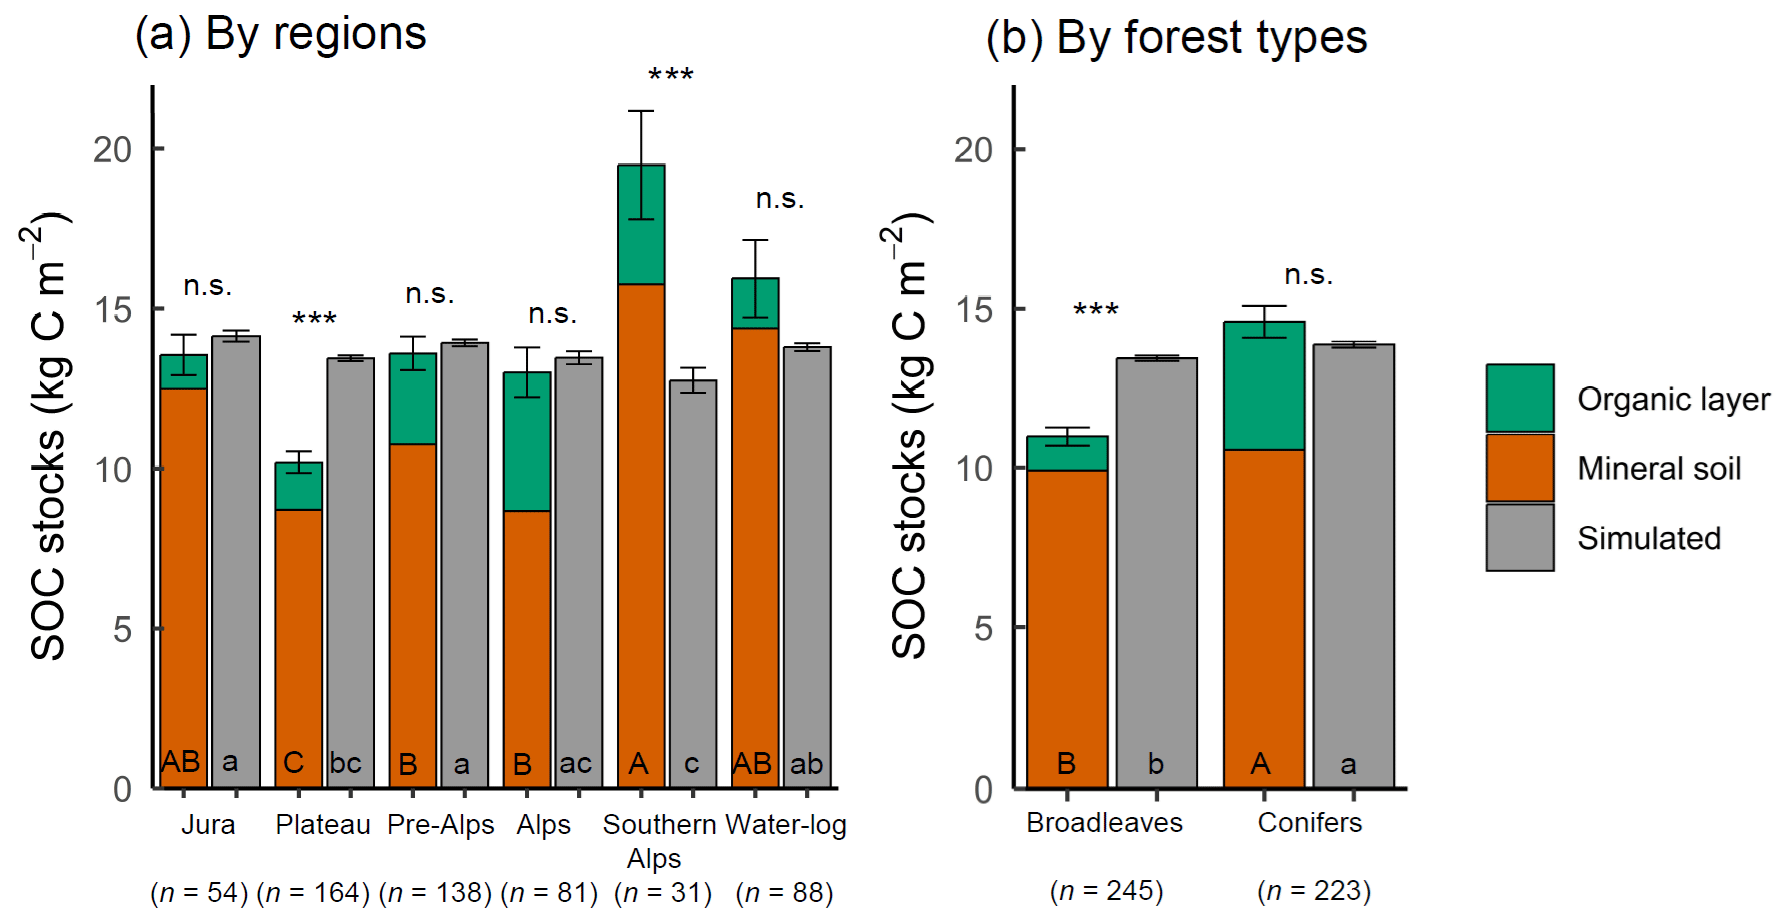
Figure 3Comparison between measured SOC stocks and Yasso20-simulated stocks by (a) regions of Switzerland, with waterlogged soils shown separately, and (b) forest types, excluding waterlogged soils. The measured stocks are shown as organic layers and mineral soils to 100 cm depth (total n = 556 sites; excluding waterlogged soils, n = 468 sites). The simulated stocks at each site are based on the mean of 500 replicate simulations, representing uncertainty of model parameters. SOC stocks are represented as means ± standard errors. P values are calculated with Welch's t-tests: P≥ 0.05 (n.s., not significant), P < 0.001 (). Capital letters indicate significantly different means among measured SOC stocks, while lowercase letters indicate significantly different means among Yasso20-simulated SOC stocks, based on ANOVA followed by Tukey's test (Fig. 3a) and Welch's t-tests (Fig. 3b) with P < 0.05.
Measured SOC stocks were greater in conifer- than in broadleaf-dominated stands (14.6±0.5 vs. 11.0±0.3 kg C m−2, without waterlogged soils; Fig. 3b), mostly due to higher SOC stocks in the organic layers (+3 kg C m−2). However, differences in Yasso20-simulated SOC stocks between conifer- and broadleaf-dominated forests were more limited (13.9±0.1 vs. 13.4±0.1 kg C m−2, respectively), with an overestimation of SOC stocks in broadleaf forests by 2.5 kg C m−2 (Welch's t-test: P < 0.001, Fig. 3b) and a slight underestimation of SOC stocks in conifer forests by less than 1 kg C m−2 (P= 0.16, Fig. 3b).
3.3 Drivers of SOC stocks and Yasso20 deviations
SOC stocks were positively correlated with MAP (, P < 0.001, Fig. 4f) and negatively correlated with MAT (, P < 0.001, Fig. 4g). We separated the dataset into soils with pH ≤ 5 and with pH > 5, since pH is recognized as a predictor of SOC stabilization mechanisms, mediated by Al or Fe under acidic conditions, while Ca exerts a dominant influence under increasing pH (Rowley et al., 2018). Consistently, for pH ≤ 5, SOC stocks increased with increasing content of exchangeable Fe and Al (0.60 and , with P < 0.001, Fig. 4b, c), while when pH was above 5, SOC stocks increased with increasing exchangeable Ca (, P < 0.001, Fig. 4d).
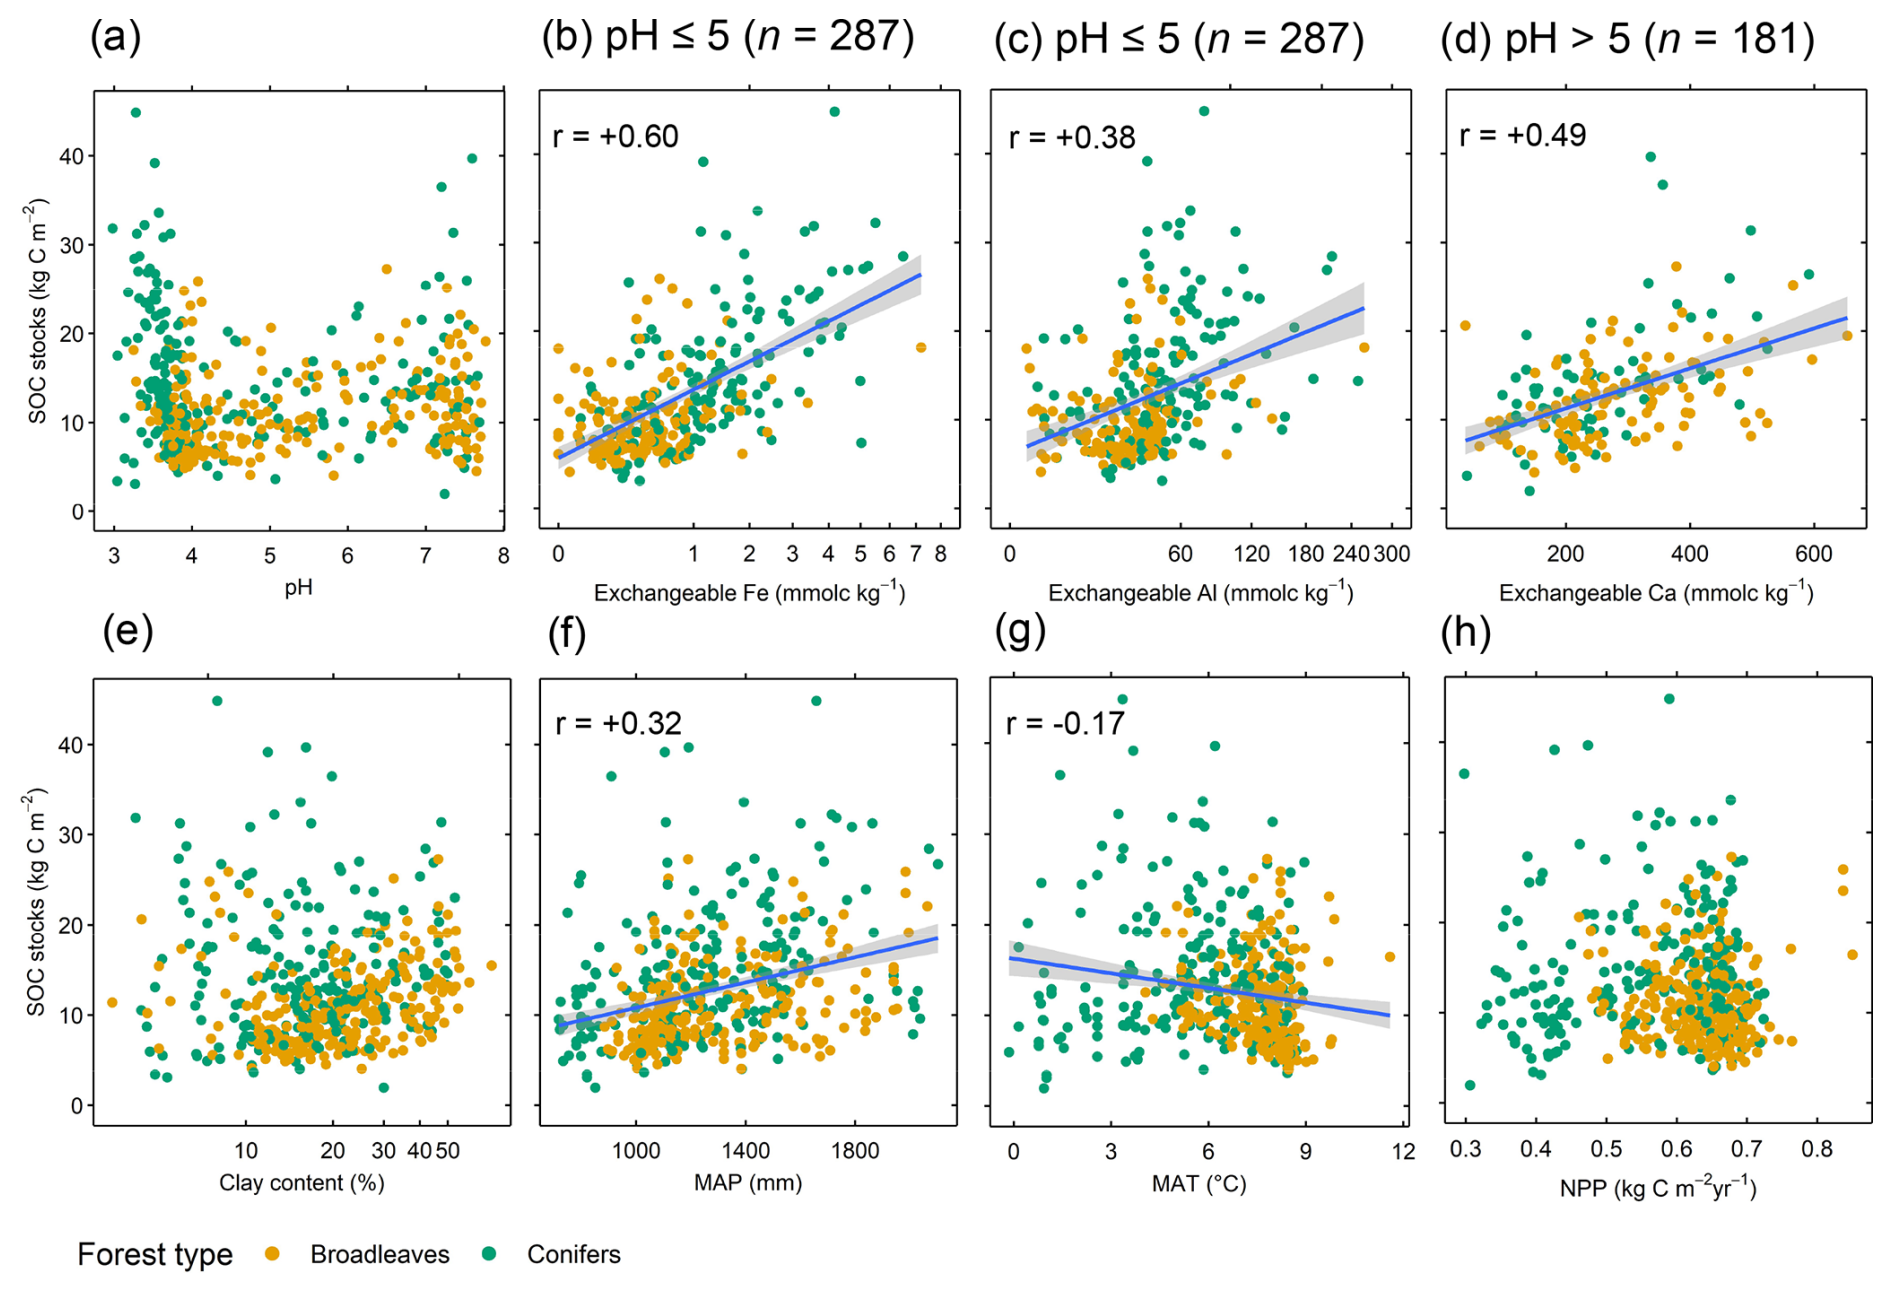
Figure 4Correlations between total SOC stocks and selected soil properties (exchangeable Fe and Al are shown on a square-root scale axis, clay is shown on a natural-logarithm scale axis) and site variables (MAP = mean annual precipitation; MAT = mean annual temperature; NPP = net primary production). Total n = 468 sites (waterlogged soils excluded). Plotted lines show significant linear correlations (P < 0.05) with 95 % confidence intervals in gray and the Pearson correlation coefficient (r).
The principal components PC1 (including primarily soil chemical parameters) and PC3 (including MAP and clay) had a significant effect on SOC stocks (Table S1b). In comparison, PC2 (with MAT, NPP, and forest type) was statistically unrelated to SOC stocks (Table S1b). We then tested the effects of soil properties and site variables on SOC stocks (n= 468 sites, waterlogged soils excluded, Table 2). Linear mixed-effect models, which included a random intercept for the region, showed a significant overall effect of exchangeable Fe, pH, MAP, broadleaf percentage, and slope on total SOC stocks. We found a positive interaction between pH and exchangeable Ca (Table S2, model with interactions), with exchangeable Ca enhancing SOC stocks at pH > 5 (Fig. S4b). Additionally, there was a significant, negative interaction between clay and MAP (Table S2, Fig. S4a) that mostly reflected SOC-rich soils in the Southern Alps with high MAP but low clay content (Table 1). In soils with pH ≤ 5 (n= 287), exchangeable Fe and MAP had a positive effect on SOC stocks, while slope and clay content had a negative effect on SOC stocks (Table 2). In soils with pH > 5 (n= 181), exchangeable Ca and MAP had a positive impact on SOC stocks, while broadleaf percentage and slope decreased SOC stocks. Analysis of drivers of SOC stocks within regions (Table S5) indicated that exchangeable Fe explained the largest proportion of model variance (from 30 % to 46 % of total R2) for all regions except the Jura, characterized by average pH > 6, where exchangeable Ca explained the highest amount of variation (44 % of total R2).
Table 2Drivers of total SOC stocks. Effects of soil properties in the upper 30 cm of mineral soil (i.e., pH, clay content, exchangeable contents of Fe and Ca), MAT (mean annual temperature), MAP (mean annual precipitation), NPP (net primary production), percentage of broadleaves, and slope on total SOC stocks (kg C m−2). Linear mixed-effect models with region as random intercept were developed for (i) all sites excluding waterlogged soils, (ii) sites with pH ≤ 5, and (iii) sites with pH > 5.
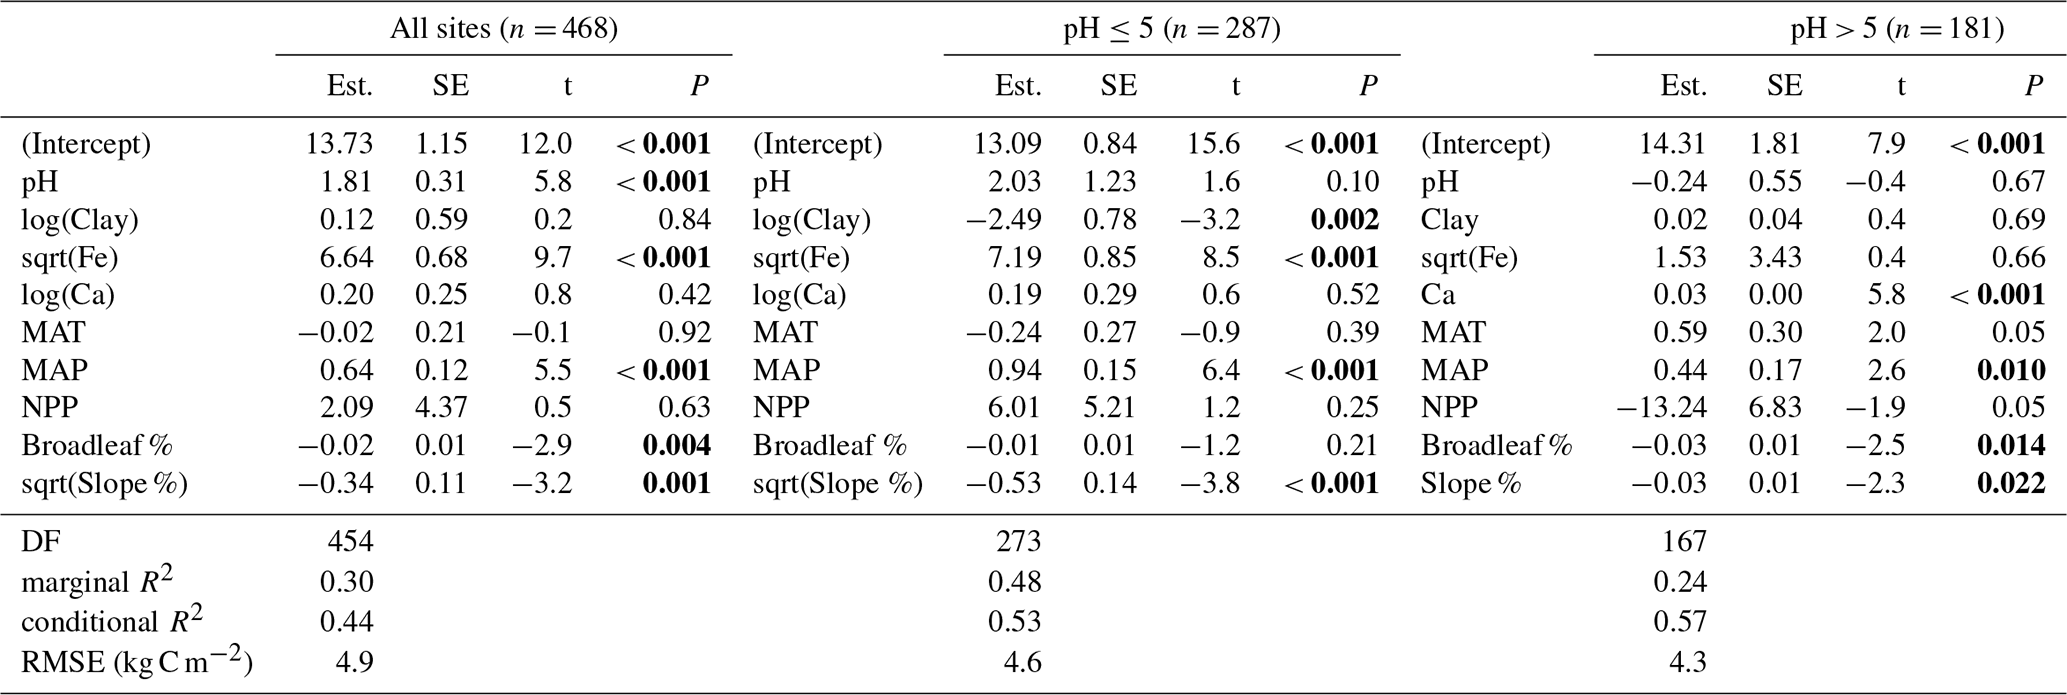
Model estimates (Est.), standard errors (SE), t statistic and P-values are reported (P < 0.05 highlighted in bold). Measurement units of independent variables are reported in Table 1. For result interpretation, MAP is here reported in 100 mm unit. DF is the degrees of freedom. Marginal R2 includes the variance of the fixed effects, while conditional R2 both the fixed and random effects calculated with the R package performance (Lüdecke et al., 2021). RMSE is the root mean squared error.
Similar to SOC stocks, Yasso20 deviations (i.e., difference between Yasso20-simulated and measured SOC stocks, with positive deviations indicating a model overestimation of SOC stocks and negative deviations indicating a model underestimation of SOC stocks, n= 468 sites, Table 3) were significantly affected by exchangeable Fe, pH, MAP, broadleaf percentage, and slope. Although the correlation between MAT and the Yasso20 deviations was overall positive (r , see Fig. S5g), the random intercept for the different regions – which accounts for the regional variability – led to a negative estimated linear effect of MAT on Yasso20 deviations.
Table 3Drivers of Yasso20 deviations. Effects of soil properties in the upper 30 cm of mineral soil (i.e., pH, clay content, exchangeable contents of Fe and Ca), MAT (mean annual temperature), MAP (mean annual precipitation), percentage of broadleaves, and slope on Yasso20 deviations (simulated minus measured values of total SOC stocks) in kg C m−2. Linear mixed-effect models with region as a random intercept were developed for (i) all sites excluding waterlogged soils, (ii) sites with pH ≤ 5, and (iii) sites with pH > 5.
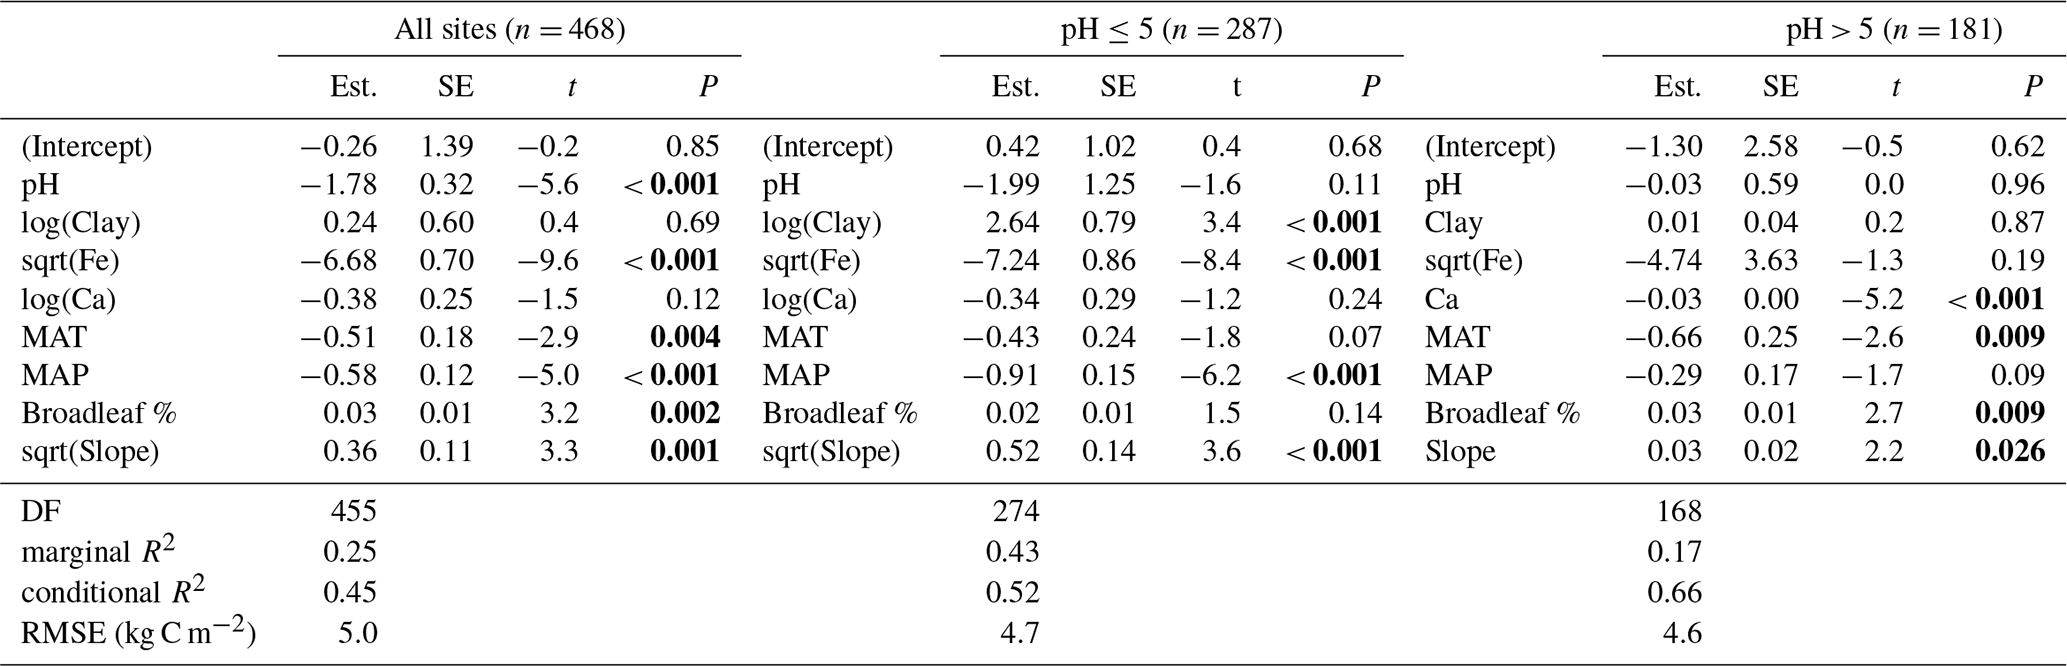
Model estimates (Est.), standard errors (SE), t statistic and P-values are reported (P < 0.05 highlighted in bold). Measurement units of independent variables are reported in Table 1. For result interpretation, MAP is here reported in 100 mm unit. DF is the degrees of freedom. Marginal R2 includes the variance of the fixed effects, while conditional R2 both the fixed and random effects calculated with the R package performance (Lüdecke et al., 2021). RMSE is the root mean squared error.
4.1 Soil properties are the primary drivers of SOC stocks
Our study along large environmental gradients from temperate to alpine old forest stands across Switzerland indicated that soil mineral properties, together with climate, play a dominant role in controlling SOM stabilization and SOC stocks. This finding aligns with a global-scale study that demonstrated the primary influence of soil properties, alongside climate, in driving SOC stocks across whole-soil profiles (Luo et al., 2021). Overall, exchangeable Fe was the predictor with the strongest effect on SOC stocks within regions with acidic topsoil (Table S5). The SOC stocks were greatest in the Southern Alps, with a slightly lower NPP than the Swiss average but higher contents of exchangeable Fe and Al (Table 1). Moreover, the comparison of SOC stocks simulated with the Yasso20 model – which does not account for physico-chemical soil properties – and measured SOC stocks showed the largest deviations in soils with a high content of stabilizing minerals (Figs. 3, S5). The importance of different cations in stabilizing SOC depended on soil pH – confirmed by the significant interaction between pH and Ca (P < 0.001, Table S2, Fig. S4b) – which agrees with process-based studies (Rowley et al., 2018). In forest soils with pH ≤ 5, exchangeable Fe had a significant positive effect on SOC stocks (Table 2) and was the strongest predictor of SOC stocks in regions with acidic conditions (Table S5), with Yasso20 underestimating SOC stocks at high exchangeable Fe contents (Table 3, Fig. S5b). In soils with pH > 5, high exchangeable Ca was associated with underestimates of SOC stocks by Yasso20 (Table 3, Fig. S5d). Clay content – regarded as a key property for SOM stabilization (Rasmussen et al., 2018) – appeared to be weakly associated with SOC stocks in Swiss forest soils (Table 2, Fig. 4e), most likely due to the overarching effect of Fe (and Al) driving the high SOC stocks in acidic, sandy soils under high MAP (Table 1). Although clay normally regulates SOC storage because of the stabilizing effect of clays on organic compounds (Alvarez and Lavado, 1998; Wiesmeier et al., 2019), we found a positive effect of clay on SOC stocks only in the Plateau region (Table S5). The negative interaction between MAP and clay content (P < 0.001, Table S2, Fig. S4a) was likely driven by the high SOC stocks in the Southern Alps, with high MAP, acidic conditions, and sandy soils (Solly et al., 2020).
Due to the low solubility product of Fe oxides, Fe extracted with NH4Cl comprises Fe2+ and/or organically bound, colloidal Fe(III) cations (Schwertmann et al., 1987). Exchangeable Fe may, however, serve as an indicator for the content of Fe oxides, as indicated by significant correlations of NH4Cl-extractable Fe with organically bound Fe (pyrophosphate-extractable, , P < 0.001, n= 62) and poorly crystalline Fe oxides (oxalate-extractable, , P < 0.001, n= 123) for a subset of surface soils where Fe oxides have been measured (Fig. S6). Deviations between modeled and measured SOC stocks were also related to exchangeable Al under acidic conditions (Fig. S5c). Since exchangeable Al was strongly correlated with exchangeable Fe (), the effect of Al on model deviations could not be disentangled from that of Fe and was thus excluded from the full statistical model. The dominant role of pedogenic oxides for SOM stabilization arises from their large and highly reactive mineral surfaces and positive charge under acidic and neutral conditions (Kaiser and Guggenberger, 2003), which allow interactions with SOM through cation bridging, electrostatic interactions, or the formation of inner- and outer-sphere complexes (Kleber et al., 2015; Rasmussen et al., 2018). Beyond its relation to pedogenic oxides, exchangeable Fe and Al – more often available for large data sets – may represent a proxy for the weathering status of soils (Eimil-Fraga et al., 2015), which is crucial for providing reactive surfaces stabilizing SOM.
In calcareous soils, Ca-mediated SOM stabilization is linked to the ability of Ca2+ to bridge negatively charged organic matter surfaces when pH is above neutrality, through inner- and outer-sphere interactions and Ca-mediated aggregation (Rowley et al., 2018), which limit decomposer activity and thus lead to preferential stabilization of organic compounds (Gocke et al., 2011; Rowley et al., 2021). However, exchangeable Ca is (similar to exchangeable Fe for pedogenic oxides) only an indirect measure for CaCO3. In our dataset, there was a highly significant correlation between exchangeable and HNO3-extractable Ca for a subset of soils (0–30 cm depth, , P < 0.001, n= 181; Fig. S7), and exchangeable Ca can be considered a representative measure for the carbonate content in the soil.
The pH-dependent influence of SOM-stabilizing minerals can also explain the observed differences between simulated and measured SOC stocks at the regional scale (Figs. 3a, S3a). The largest differences, with underestimates of SOC stocks by 7 kg C m−2, were found in the Southern Alps. The Southern Alps are characterized by high contents of Fe and Al oxides (Table 1) that are considered the main drivers of the large SOC storage in this region (Blaser et al., 1997). The high SOC stocks (Fig. 3a) can additionally be related to the black carbon accumulated in these soils due to frequent forest fires and charcoal production (Eckmeier et al., 2010). Here, we could not quantify fire-derived black carbon and its potential contribution to SOM stabilization. Even when the Southern Alps were excluded from the statistical analysis, exchangeable Fe was a significant predictor of SOC stocks (Table S4a), as well as of Yasso20 deviations (Table S4b), being the predictor explaining the largest portion of SOC stock model variance in all regions with mostly acidic soils (Table S5). This confirms the key role of pedogenic oxides in SOM stabilization at low pH conditions.
4.2 Climatic influences on SOC stocks
Beyond soil parameters, precipitation was a key driver of SOC stocks, with SOC stocks increasing as MAP increased (Table 2, Fig. 4f). This pattern likely resulted from a number of mechanisms: (i) retarded decomposition at anaerobic microsites (Keiluweit et al., 2017), (ii) reduced litter quality due to an increasing contribution of conifers toward higher MAP, which also coincides with low MAT at high altitudes, as confirmed by a negative correlation of MAP with MAT for elevation > 1000 m (r= −0.43, P < 0.001) that is typical for alpine regions (Prietzel and Christophel, 2014), (iii) a higher transfer of dissolved organic matter into the mineral soil with increasing soil water fluxes, and (iv) enhanced weathering in moister climates that fosters mineral surface reactivity (Doetterl et al., 2015). Precipitation was also a significant driver of Yasso20 deviations (Tables 3, S4), with MAP accounting for up to 20 %–25 % of SOC stock variance in the Alps and Plateau (Table S5). Yasso20 underestimated SOC stocks when MAP exceeded 1400 mm yr−1 (Fig. S5f). Consistently, Viskari et al. (2022) reported that Yasso20 underestimated SOC amounts at higher precipitation, given that increasing precipitation over a certain threshold does not reduce the SOC decomposition rates in Yasso20. Current Earth System Models also tend to overestimate heterotrophic respiration fluxes where precipitation levels are high (Guenet et al., 2024). Our analysis of Yasso20 deviations, showing that SOC stocks were underestimated in waterlogged soils with macroscopic signs of anaerobic conditions (Fig. 3a), confirms that anaerobic conditions at the microscale or the impeded drainage at the profile or plot scale lead to a drastic decline in SOC mineralization rates (Hagedorn et al., 2000; Keiluweit et al., 2017). These conditions are not captured by the Yasso20 model, as soil moisture is currently not included as a model driver (Viskari et al., 2022), but could be resolved in the future by including soil moisture at monthly time steps as a model driver, by applying a moisture modifier as in a boreal forest–mire ecotone in Finland for Yasso07 (Ťupek et al., 2024),or by coupling Yasso to a soil water model (Guenet et al., 2024). Large differences between simulated and measured SOC stocks were also found in poorly drained soils of Norway and Finland using the previous version, Yasso07, with soil moisture regimes overruling the importance of tree productivity (Dalsgaard et al., 2016). The model deviations were additionally attributed to the high contribution of understory vegetation in high rainfall areas (de Wit et al., 2006; Lehtonen et al., 2016). Understory including herb and shrub layers is normally not accounted for in forest inventories or satellite-based NPP data (Mao et al., 2019), though it can contribute significantly to the annual litter production (Didion, 2020). In addition to its effect on the biological activity of the plant–soil system, precipitation is linked to mineral weathering, forming reactive mineral surfaces (Kramer and Chadwick, 2018). In Swiss forest soils, MAP was indeed in the same principal component (PC3) as clay (Table S1a), positively correlating with clay (r= +0.21, P < 0.001) as well as with exchangeable Fe and Al (with Fe: , P= 0.019, with Al: , P < 0.001), which supports the idea that high MAP may indirectly influence SOC stabilization through its effects on the reactivity of mineral surfaces. At the other extreme, at low precipitation, Lehtonen et al. (2016) observed an underestimation of SOC stocks by Yasso07, which was attributed to the poor representation of drought effects on SOM decomposition. In fact, Yasso07 (but also Yasso20) simulations are based on yearly time steps using annual precipitation, which does not capture seasonally extreme dry or moist conditions (Lehtonen et al., 2016; Viskari et al., 2022) and the uneven distribution of summer precipitation (Thürig et al., 2005), thereby leading to misestimates of soil C stocks.
Across Swiss forests, organic layer C stocks increased with the contribution of conifers (Table S6), likely caused by a slower decomposition of the more recalcitrant litter inputs (Heim and Frey, 2004) and fostered by the colder conditions at higher elevations where conifers are more abundant. In our study, MAT did not significantly influence the organic layer as well as total SOC stocks (Tables 2, S6), possibly due to the positive correlation of MAT with the share of broadleaves (, P < 0.001), which did not allow us to fully disentangle the specific effects of forest types and MAT. Accounting for the regional variability in the linear mixed-effect model, an overall negative effect of MAT was estimated for Yasso20 deviations (Table 3). This finding is in agreement with the tendency of Yasso20 to underestimate SOC with increasing temperatures (Viskari et al., 2022). The Yasso model generally captures well the effects of temperature and vegetation type, as shown across regional environmental gradients in Swiss forests (Didion et al., 2014). Since Yasso20 deviations slightly increased with temperature (Fig. S5g), with Yasso20 overestimating SOC stocks in low-elevation broadleaf forests of the Swiss Plateau but not in coniferous stands at higher elevation (Figs. 3b, S3c), we interpret this overestimation as an indication of an impact of past land use and current land management. The Plateau has intensively been used for agriculture since Roman times (Haas et al., 2020), which depleted soils in SOC (Thürig et al., 2005). It is still Switzerland's most intensively managed region, with harvesting exceeding tree growth increments (Thürig et al., 2021). This intensive management, particularly harvesting, may not be adequately captured by Yasso20 simulations. Similarly, simulations with Yasso07 in French temperate forests tended to overestimate SOC stocks in broadleaf stands while underestimating them in coniferous ones, which was attributed to historical differences in land use and stand age between broadleaf and coniferous sites (Mao et al., 2019). Here, on the one hand, harvesting depletes soil C stocks by changing the microclimate, reducing the litter inputs, and leading to physical soil disturbances (Mayer et al., 2024). On the other hand, timber removal or other small-scale forest disturbances may be poorly detected by NPP estimates from MODIS satellite data, as discussed below.
Since measurements of forest stands and soil C inputs are often lacking at larger scales – as in this study – the satellite-derived NPP is here used as a proxy for long-term litter C input to the soil, consistent with SOC model applications at the regional and global scales (Abramoff et al., 2022; Pierson et al., 2022) as well as with the calibration of Yasso20 (Viskari et al., 2022). Uncertainty in litter inputs potentially contributed to the observed discrepancies between simulated and measured SOC stocks at the site level (Fig. S2). The fine-scale variability in litter inputs cannot be captured by satellite-derived NPP estimates, given (1) the larger pixel size of MODIS (500 m × 500 m) compared to the site scale of the soil sampling and (2) the partitioning into tree components using average allocation factors, due to the lack of site-level data. NPP estimates from MODIS may overestimate the litter input in regions with intensive forest management, as in the Plateau, since small-scale disturbances such as thinning are not well detected by satellites (Neumann et al., 2015; Park et al., 2021). Lastly, forests allocate a portion of NPP not only to fast-cycling components that are annually returned to the soil (i.e., fine roots and foliage) but also to components with slower turnover times, such as stems and branches. Nevertheless, the satellite approach proves to be a reasonable proxy for the large range of forest productivity across Swiss forests, i.e., ranging from 0.3 kg C m−2 yr−1 in the Alps to 0.8 kg C m−2 yr−1 at the warmest sites (see Fig. S1a), which is consistent with differences in wood increments across regions as shown in the Swiss NFI (Brändli et al., 2020). Moreover, at the 18 sites of the long-term forest monitoring program LWF, the mean NPP over the period 2001–2010 estimated by MODIS satellite amounted to 0.49±0.04 kg C m−2 yr−1 as compared to 0.46±0.05 kg C m−2 yr−1 estimated by a terrestrial approach for the same period (Etzold et al., 2014). Terrestrial methods based on forest inventories may also produce uncertain estimates of litter inputs. These uncertainties mostly relate to (1) country-specific allometries and expansion factors used to estimate tree biomass, (2) turnover times applied to derive the annual litter inputs, and (3) failure to appropriately estimate inputs from fine roots and understory vegetation, which remain severely unconstrained despite their major contribution to forest soil C inputs (Didion, 2020; Neumann et al., 2020).
4.3 Performance and potential improvements of Yasso20
Despite the local and regional deviations between SOC stocks simulated with Yasso20 and the measured ones (Fig. S2), our study showed that, averaged across Swiss forests and thus at the national scale, Yasso20 reproduced measured SOC stocks (Fig. 3), confirming the wide applicability of the Yasso20 model (Viskari et al., 2022). The Yasso model was developed for general use on primarily forest land, including GHG reporting at the national level, and requires less input information (no soil data) compared to more detailed soil C models (Liski et al., 2005). Yasso is compatible with biomass data from National Forest Inventories, where soil parameters are often not measured, allowing estimation of soil C stock changes (Hernández et al., 2017). Our study indicates that implementing SOM stabilization mechanisms would improve the Yasso model and potentially also other similar soil C models such as the RothC model that accounts only for clay content (Coleman and Jenkinson, 1996). However, detailed soil information controlling SOM stabilization is often missing at larger scales. We therefore suggest to further explore commonly available soil parameters, potentially by simple pedotransfer functions (e.g., based on exchangeable Fe and Ca) capturing SOC stabilization at different pH levels. A combined approach – directly coupling Yasso with a statistical model – would allow to account for additional parameters (such as mineral soil properties) that are currently not included as model drivers but are known to be important factors controlling SOC stabilization. We also showed that Yasso did not capture SOC stocks (and potentially SOC stock changes) at high precipitation levels (here MAP > 1400 mm yr−1) in Swiss forests. This hampers predictions especially under extreme or variable intra-annual precipitation patterns that will become more frequent under climate change. Obviously, linking Yasso20 to a soil water model accounting for drought and waterlogging processes would have high potential for improving estimates of SOC stocks. However, a robust modeling of waterlogging would also require spatially highly resolved soil information.
Our study does not inform on the performance of Yasso20 in estimating SOC stock changes, which is the primary application of Yasso for GHG reporting. However, it seems likely that SOC stock changes will also be affected by soil physico-chemical properties, due to the importance of organo-mineral interactions for SOC stabilization and thus long-term C sequestration (Wiesmeier et al., 2019; Bramble et al., 2023). This would be congruent with the concept of soil C saturation, suggesting that effects of C inputs on soil C storage depend upon inherent physico-chemical limitations (Stewart et al., 2007; Six et al., 2024).
Our study demonstrates that soil mineral properties controlling SOM stabilization play a dominant role for SOC stocks across Swiss forest soils. The control appears to be pH dependent, with Fe (and Al) having a major influence in acidic soils, while interactions with Ca are most important in soils with pH values above 5. Not accounting for these processes in a soil C model designed to estimate national scale SOC stocks and their changes – based solely on litter inputs and climate – can lead to underestimating SOC stocks in certain regions, particularly those rich in SOM stabilizing minerals. Despite its simple model structure, our results show that Yasso20 yielded on average SOC stocks comparable to measured values at 556 forest sites across Switzerland. This supports Yasso20's broad applicability for predicting forest SOC stocks at larger national scales, although the model does not capture the variability in SOC stocks at the site level. Including SOM stabilization and linking soil C models to soil water models have high potential to improve the accuracy of the estimates. It remains uncertain, however, whether the model's lack of representation of mineral-driven SOM stabilization and of varying soil moisture regimes will not only affect SOC stock estimates but also expected changes in SOC stocks, the primary application of Yasso in GHG inventories.
All data used in this study are available online through EnviDat at https://doi.org/10.16904/envidat.443 (Guidi et al., 2024). The code can be made available upon request.
The supplement related to this article is available online at https://doi.org/10.5194/bg-22-4107-2025-supplement.
FH and PN conceived and designed the study. CG and SG performed data analysis and visualization and wrote the manuscript with contributions from all co-authors. All authors contributed to the interpretation of the findings; they read and approved the submitted version.
At least one of the (co-)authors is a member of the editorial board of Biogeosciences. The peer-review process was guided by an independent editor, and the authors also have no other competing interests to declare.
Publisher’s note: Copernicus Publications remains neutral with regard to jurisdictional claims made in the text, published maps, institutional affiliations, or any other geographical representation in this paper. While Copernicus Publications makes every effort to include appropriate place names, the final responsibility lies with the authors.
This study (SNF 406840_143025) was funded by the Swiss National Fond (SNF) within the National Research Programme 68 (Sustainable Use of Soil as a Resource). Evaluations were based on data from the Swiss Long-term Forest Ecosystem Research program (LWF), which is part of the UNECE Co-operative Programme on Assessment and Monitoring of Air Pollution Effects on Forests (ICP Forests). We are particularly grateful to Peter Waldner for the provision of the LWF data, to Oliver Schramm for the collection of the data, and to Peter Jakob for the technical support on the database. The authors also especially acknowledge Flurin Sutter for helping with the preparation of Fig. 1, Achilleas Psomas for the support with obtaining NPP data, and Sophia Etzold for providing long-term tree allocation data in LWF. We also acknowledge Jürgen Zell and Sebastian Doetterl for fruitful discussions on the statistical analysis of an earlier version of the manuscript.
This research has been supported by the Schweizerischer Nationalfonds zur Förderung der Wissenschaftlichen Forschung (grant no. SNF 406840_143025).
This paper was edited by Bertrand Guenet and reviewed by two anonymous referees.
Abramoff, R., Xu, X., Hartman, M., O'Brien, S., Feng, W., Davidson, E., Finzi, A., Moorhead, D., Schimel, J., and Torn, M.: The Millennial model: in search of measurable pools and transformations for modeling soil carbon in the new century, Biogeochemistry, 137, 51–71, 2018.
Abramoff, R. Z., Guenet, B., Zhang, H., Georgiou, K., Xu, X., Rossel, R. A. V., Yuan, W., and Ciais, P.: Improved global-scale predictions of soil carbon stocks with Millennial Version 2, Soil Biol. Biochem., 164, 108466, https://doi.org/10.1016/j.soilbio.2021.108466, 2022.
Ågren, G. I., Hyvönen, R., and Nilsson, T.: Are Swedish forest soils sinks or sources for CO2–model analyses based on forest inventory data, Biogeochemistry, 89, 139-149, 2008.
Alvarez, R. and Lavado, R. S.: Climate, organic matter and clay content relationships in the Pampa and Chaco soils, Argentina, Geoderma, 83, 127–141, 1998.
Angst, G., Messinger, J., Greiner, M., Häusler, W., Hertel, D., Kirfel, K., Kögel-Knabner, I., Leuschner, C., Rethemeyer, J., and Mueller, C. W.: Soil organic carbon stocks in topsoil and subsoil controlled by parent material, carbon input in the rhizosphere, and microbial-derived compounds, Soil Biol. Biochem., 122, 19–30, 2018.
Berg, B., Booltink, H., Breymeyer, A., Ewertsson, A., Gallardo, A., Holm, B., Johansson, M. B., Koivuoja, S., Meentemeyer, V., Nyman, P., Olofsson, J., Pettersson, A. S., Reurslag, A., Staaf, H., Staaf, I., and Uba, L.: Data on Needle Litter Decomposition and Soil Climate as well as Site Characteristics for Some Coniferous Forest Sites, Part II, Decomposition Data. Report 42, Swedish University of Agricultural Sciences, Department of Ecology and Environmental Research, Uppsala, ISBN 91-576-4341-5, 1991.
Blaser, P., Kernebeek, P., Tebbens, L., Van Breemen, N., and Luster, J.: Cryptopodzolic soils in Switzerland, Eur. J. Soil Sci., 48, 411–423, 1997.
Bramble, D. S. E., Ulrich, S., Schöning, I., Mikutta, R., Brandt, L., Poll, C., Kandeler, E., Mikutta, C., Konrad, A., and Siemens, J.: Formation of mineral-associated organic matter in temperate soils is primarily controlled by mineral type and modified by land use and management intensity, Glob. Change Biol., 30, e17024, https://doi.org/10.1111/gcb.17024, 2023.
Brändli, U. B., Abegg, M., and Allgaier Leuch, B. (Eds.): Schweizerisches Landesforstinventar. Ergebnisse der vierten Erhebung 2009–2017, Birmensdorf; Bern: Eidgenössische Forschungsanstalt für Wald, Schnee und Landschaft WSL, Bundesamt für Umwelt BAFU, 341 pp., https://doi.org/10.16904/envidat.146, 2020.
Braun-Blanquet, J.: Pflanzensoziologie. Grundzüge der Vegetationskunde, Springer Vienna, Vienna, 865, https://doi.org/10.1007/978-3-7091-8110-2, 1964.
Brunmayr, A. S., Hagedorn, F., Moreno Duborgel, M., Minich, L. I., and Graven, H. D.: Radiocarbon analysis reveals underestimation of soil organic carbon persistence in new-generation soil models, Geosci. Model Dev., 17, 5961–5985, https://doi.org/10.5194/gmd-17-5961-2024, 2024.
Chen, S., Huang, Y., Zou, J., and Shi, Y.: Mean residence time of global topsoil organic carbon depends on temperature, precipitation and soil nitrogen, Global Planet. Change, 100, 99–108, 2013.
Coleman, K. and Jenkinson, D. S.: RothC-26.3 – A Model for the turnover of carbon in soil, in: Evaluation of Soil Organic Matter Models, edited by: Powlson, D. S., Smith, P., and Smith, J. U., NATO ASI Series, vol. 38, Springer, Berlin, Heidelberg, https://doi.org/10.1007/978-3-642-61094-3_17, 1996.
Dalsgaard, L., Lange, H., Strand, L. T., Callesen, I., Borgen, S. K., Liski, J., and Astrup, R.: Underestimation of boreal forest soil carbon stocks related to soil classification and drainage, Can. J. Forest Res., 46, 1413–1425, 2016.
de Wit, H. A., Palosuo, T., Hylen, G., and Liski, J.: A carbon budget of forest biomass and soils in southeast Norway calculated using a widely applicable method, Forest Ecol. Manag., 225, 15–26, 2006.
Didion, M.: Extending harmonized national forest inventory herb layer vegetation cover observations to derive comprehensive biomass estimates, Forest Ecosystems, 7, 1–14, 2020.
Didion, M.: Data on soil carbon stock change, carbon stock and stock change in surface litter and in coarse dead wood prepared for the Swiss NIR 2024 (GHGI 1990–2022), Swiss Federal Institute for Forest, Snow and Landscape Research WSL, Birmensdorf, 2023.
Didion, M., Frey, B., Rogiers, N., and Thürig, E.: Validating tree litter decomposition in the Yasso07 carbon model, Ecol. Model., 291, 58–68, 2014.
Didion, M., Blujdea, V., Grassi, G., Hernández, L., Jandl, R., Kriiska, K., Lehtonen, A., and Saint-André, L.: Models for reporting forest litter and soil C pools in national greenhouse gas inventories: methodological considerations and requirements, Carbon Manag., 7, 79–92, 2016.
Doetterl, S., Berhe, A. A., Arnold, C., Bodé, S., Fiener, P., Finke, P., Fuchslueger, L., Griepentrog, M., Harden, J., and Nadeu, E.: Links among warming, carbon and microbial dynamics mediated by soil mineral weathering, Nat. Geosci., 11, 589–593, 2018.
Doetterl, S., Stevens, A., Six, J., Merckx, R., Van Oost, K., Casanova Pinto, M., Casanova-Katny, A., Muñoz, C., Boudin, M., and Zagal Venegas, E.: Soil carbon storage controlled by interactions between geochemistry and climate, Nat. Geosci., 8, 780–783, 2015.
Eckmeier, E., Egli, M., Schmidt, M., Schlumpf, N., Nötzli, M., Minikus-Stary, N., and Hagedorn, F.: Preservation of fire-derived carbon compounds and sorptive stabilisation promote the accumulation of organic matter in black soils of the Southern Alps, Geoderma, 159, 147–155, 2010.
Eimil-Fraga, C., Álvarez-Rodríguez, E., Rodríguez-Soalleiro, R., and Fernández-Sanjurjo, M. J.: Influence of parent material on the aluminium fractions in acidic soils under Pinus pinaster in Galicia (NW Spain), Geoderma, 255, 50–57, 2015.
Etzold, S., Waldner, P., Thimonier, A., Schmitt, M., and Dobbertin, M.: Tree growth in Swiss forests between 1995 and 2010 in relation to climate and stand conditions: Recent disturbances matter, Forest Ecol. Manag., 311, 41–55, 2014.
Fischer, C. and Traub, B.: Swiss National Forest Inventory – Methods and Models of the Fourth assessment, Managing forest ecosystems, 35, Springer, 431 pp., https://doi.org/10.1007/978-3-030-19293-8, 2019.
Gee, G. W. and Bauder, J. W.: Particle-size Analysis, in: Methods of Soil Analysis, edited by: Klute, A., https://doi.org/10.2136/sssabookser5.1.2ed.c15, 1986.
Gholz, H. L., Wedin, D. A., Smitherman, S. M., Harmon, M. E., and Parton, W. J.: Long-term dynamics of pine and hardwood litter in contrasting environments: toward a global model of decomposition, Glob. Change Biol., 6, 751–765, 2000.
Gimmi, U., Poulter, B., Wolf, A., Portner, H., Weber, P., and Bürgi, M.: Soil carbon pools in Swiss forests show legacy effects from historic forest litter raking, Landscape Ecol., 28, 835–846, 2013.
Gnägi, C. and Labhart, T.: Geologie der Schweiz, Ott Verlag, ISBN 978-3-7225-0167-3, 2015.
Gocke, M., Pustovoytov, K., and Kuzyakov, Y.: Pedogenic carbonate recrystallization assessed by isotopic labeling: a comparison of 13C and 14C tracers, J. Plant Nutr. Soil Sc., 174, 809–817, 2011.
Gosheva, S., Walthert, L., Niklaus, P. A., Zimmermann, S., Gimmi, U., and Hagedorn, F.: Reconstruction of historic forest cover changes indicates minor effects on carbon stocks in Swiss forest soils, Ecosystems, 20, 1512–1528, 2017.
Guenet, B., Orliac, J., Cécillon, L., Torres, O., Sereni, L., Martin, P. A., Barré, P., and Bopp, L.: Spatial biases reduce the ability of Earth system models to simulate soil heterotrophic respiration fluxes, Biogeosciences, 21, 657–669, https://doi.org/10.5194/bg-21-657-2024, 2024.
Guidi, C., Zimmermann, S., Walthert, L., Didion, M., Gosheva-Oney, S., and Hagedorn, F.: Soil organic carbon drivers in the Swiss forest soil inventory, EnviDat [data set], https://doi.org/10.16904/envidat.443, 2024.
Haas, M., Kaltenrieder, P., Ladd, S. N., Welte, C., Strasser, M., Eglinton, T. I., and Dubois, N.: Land-use evolution in the catchment of Lake Murten, Switzerland, Quaternary Sci. Rev., 230, 106154, https://doi.org/10.1016/j.quascirev.2019.106154, 2020.
Hagedorn, F., Kaiser, K., Feyen, H., and Schleppi, P.: Effects of Redox Conditions and Flow Processes on the Mobility of Dissolved Organic Carbon and Nitrogen in a Forest Soil, J. Environ. Qual., 29, 288–297, https://doi.org/10.2134/jeq2000.00472425002900010036x, 2000.
Hagedorn, F., Moeri, A., Walthert, L., and Zimmermann, S.: Kohlenstoff in Schweizer Waldböden–bei Klimaerwärmung eine potenzielle CO2-Quelle [Soil organic carbon in Swiss forest soils–a potential CO2 source in a warming climate], Schweizerische Zeitschrift für Forstwesen, 161, 530–535, 2010.
Hagedorn, F., Spinnler, D., Bundt, M., Blaser, P., and Siegwolf, R.: The input and fate of new C in two forest soils under elevated CO2, Glob. Change Biol., 9, 862–872, 2003.
Heim, A. and Frey, B.: Early stage litter decomposition rates for Swiss forests, Biogeochemistry, 70, 299–313, 2004.
Hernández, L., Jandl, R., Blujdea, V. N., Lehtonen, A., Kriiska, K., Alberdi, I., Adermann, V., Cañellas, I., Marin, G., and Moreno-Fernández, D.: Towards complete and harmonized assessment of soil carbon stocks and balance in forests: The ability of the Yasso07 model across a wide gradient of climatic and forest conditions in Europe, Sci. Total Environ., 599, 1171–1180, 2017.
IUSS Working Group WRB: World Reference Base for Soil Resources 2006, World Soil Resources Reports No. 103. FAO, Rome, https://www.fao.org/fileadmin/templates/nr/images/resources/pdf_documents/wrb2007_red.pdf (last access: 23 November 2024), 2007.
Kaiser, K. and Guggenberger, G.: Mineral surfaces and soil organic matter, Eur. J. Soil Sci., 54, 219–236, 2003.
Keiluweit, M., Wanzek, T., Kleber, M., Nico, P., and Fendorf, S.: Anaerobic microsites have an unaccounted role in soil carbon stabilization, Nat. Commun., 8, 1771, https://doi.org/10.1038/s41467-017-01406-6,1771, 2017.
Kleber, M., Eusterhues, K., Keiluweit, M., Mikutta, C., Mikutta, R., and Nico, P. S.: Mineral–organic associations: formation, properties, and relevance in soil environments, Adv. Agron., 130, 1–140, 2015.
Kramer, M. G. and Chadwick, O. A.: Climate-driven thresholds in reactive mineral retention of soil carbon at the global scale, Nat. Clim. Change, 8, 1104–1108, 2018.
Lehmann, J. and Kleber, M.: The contentious nature of soil organic matter, Nature, 528, 60–68, 2015.
Lehtonen, A., Linkosalo, T., Peltoniemi, M., Sievänen, R., Mäkipää, R., Tamminen, P., Salemaa, M., Nieminen, T., Ťupek, B., Heikkinen, J., and Komarov, A.: Forest soil carbon stock estimates in a nationwide inventory: evaluating performance of the ROMULv and Yasso07 models in Finland, Geosci. Model Dev., 9, 4169–4183, https://doi.org/10.5194/gmd-9-4169-2016, 2016.
Liski, J., Palosuo, T., Peltoniemi, M., and Sievänen, R.: Carbon and decomposition model Yasso for forest soils, Ecol. Model., 189, 168–182, 2005.
Lüdecke, D., Ben-Shachar, M. S., Patil, I., Waggoner, P., and Makowski, D.: performance: An R package for assessment, comparison and testing of statistical models, Journal of Open Source Software, 6, 3139, https://doi.org/10.21105/joss.03139, 2021.
Luo, Z., Viscarra-Rossel, R. A., and Qian, T.: Similar importance of edaphic and climatic factors for controlling soil organic carbon stocks of the world, Biogeosciences, 18, 2063–2073, https://doi.org/10.5194/bg-18-2063-2021, 2021.
Mäkinen, H., Hynynen, J., Siitonen, J., and Sievänen, R.: Predicting the decomposition of Scots pine, Norway spruce, and birch stems in Finland, Ecol. Appl., 16, 1865–1879, 2006.
Mao, Z., Derrien, D., Didion, M., Liski, J., Eglin, T., Nicolas, M., Jonard, M., and Saint-André, L.: Modeling soil organic carbon dynamics in temperate forests with Yasso07, Biogeosciences, 16, 1955–1973, https://doi.org/10.5194/bg-16-1955-2019, 2019.
Mayer, M., Baltensweiler, A., James, J., Rigling, A., and Hagedorn, F.: A global synthesis and conceptualization of the magnitude and duration of soil carbon losses in response to forest disturbances, Global Ecol. Biogeogr., 33, 141–150, 2024.
Mayer, M., Rusch, S., Didion, M., Baltensweiler, A., Walthert, L., Ranft, F., Rigling, A., Zimmermann, S., and Hagedorn, F.: Elevation dependent response of soil organic carbon stocks to forest windthrow, Sci. Total Environ., 857, 159694, https://doi.org/10.1016/j.scitotenv.2022.159694, 2023.
Mayer, M., Prescott, C. E., Abaker, W. E., Augusto, L., Cécillon, L., Ferreira, G. W., James, J., Jandl, R., Katzensteiner, K., and Laclau, J.-P.: Tamm Review: Influence of forest management activities on soil organic carbon stocks: A knowledge synthesis, Forest Ecol. Manag., 466, 118127, https://doi.org/10.1016/j.foreco.2020.118127, 2020.
MeteoSwiss: Federal Office of Meteorology and Climatology, Spatial Climate Analyses, https://www.meteoswiss.admin.ch/home/climate/swiss-climate-in-detail/raeumliche-klimaanalysen.html (last access: 19 January 2024), 2024.
Neumann, M., Godbold, D. L., Hirano, Y., and Finér, L.: Improving models of fine root carbon stocks and fluxes in European forests, J. Ecol., 108, 496–514, 2020.
Neumann, M., Zhao, M., Kindermann, G., and Hasenauer, H.: Comparing MODIS net primary production estimates with terrestrial national forest inventory data in Austria, Remote Sensing, 7, 3878–3906, 2015.
Nussbaum, M., Papritz, A., Zimmermann, S., and Walthert, L.: Pedotransfer function to predict density of forest soils in Switzerland, J. Plant Nutr. Soil Sc., 179, 321–326, 2016.
Park, J. H., Gan, J., and Park, C.: Discrepancies between global forest net primary productivity estimates derived from MODIS and forest inventory data and underlying factors, Remote Sensing, 13, 1441, https://doi.org/10.3390/rs13081441, 2021.
Pierson, D., Lohse, K. A., Wieder, W. R., Patton, N. R., Facer, J., de Graaff, M.-A., Georgiou, K., Seyfried, M. S., Flerchinger, G., and Will, R.: Optimizing process-based models to predict current and future soil organic carbon stocks at high-resolution, Sci. Rep., 12, 10824, https://doi.org/10.1038/s41598-022-14224-8, 2022.
Pinheiro, J., Bates, D., and R Core Team: nlme: Linear and Nonlinear Mixed Effects Models, R package version 3.1-160, https://CRAN.R-project.org/package=nlme (last access: 10 October 2022), 2022.
Prescott, C. E. and Grayston, S. J.: TAMM review: Continuous root forestry – Living roots sustain the belowground ecosystem and soil carbon in managed forests, Forest Ecol. Manag., 532, 120848, https://doi.org/10.1016/j.foreco.2023.120848, 2023.
Prietzel, J. and Christophel, D.: Organic carbon stocks in forest soils of the German Alps, Geoderma, 221, 28–39, 2014.
Prietzel, J., Zimmermann, L., Schubert, A., and Christophel, D.: Organic matter losses in German Alps forest soils since the 1970s most likely caused by warming, Nat. Geosci., 9, 543–548, 2016.
Pusa, J.: Ryassofortran: R-package for calling the YASSO20 Fortran-release, R package version 0.4.0, GitHub [code], https://github.com/YASSOmodel/Ryassofortran (last access: 29 August 2023), 2023.
R Core Team: R: A language and environment for statistical computing. R Foundation for Statistical Computing, Vienna, Austria, https://www.R-project.org/ (last access: 31 October 2022), 2022.
Rasmussen, C., Heckman, K., Wieder, W. R., Keiluweit, M., Lawrence, C. R., Berhe, A. A., Blankinship, J. C., Crow, S. E., Druhan, J. L., and Hicks Pries, C. E.: Beyond clay: towards an improved set of variables for predicting soil organic matter content, Biogeochemistry, 137, 297–306, 2018.
Reichenbach, M., Fiener, P., Hoyt, A., Trumbore, S., Six, J., and Doetterl, S.: Soil carbon stocks in stable tropical landforms are dominated by geochemical controls and not by land use, Glob. Change Biol., 29, 2591–2607, 2023.
Richard, F., Lüscher, P., and Strobel, T.: Physikalische Eigenschaften von Böden der Schweiz, Eidgenössischen Anstalt für das forstliche Versuchswesen, 1978.
Rowley, M. C., Grand, S., and Verrecchia, É. P.: Calcium-mediated stabilisation of soil organic carbon, Biogeochemistry, 137, 27–49, 2018.
Rowley, M. C., Grand, S., Spangenberg, J. E., and Verrecchia, É. P.: Evidence linking calcium to increased organo-mineral association in soils, Biogeochemistry, 153, 223–241, 2021.
Running, S. and Zhao, M.: MODIS/Aqua Net Primary Production Gap-Filled Yearly L4 Global 500m SIN Grid V061, Distributed by NASA EOSDIS Land Processes Distributed Active Archive Center [data set], https://doi.org/10.5067/MODIS/MYD17A3HGF.061, 2021a.
Running, S. and Zhao, M.: MODIS/Terra Net Primary Production Gap-Filled Yearly L4 Global 500m SIN Grid V061, Distributed by NASA EOSDIS Land Processes Distributed Active Archive Center [data set], https://doi.org/10.5067/MODIS/MOD17A3HGF.061, 2021b.
Schmidt, M. W., Torn, M. S., Abiven, S., Dittmar, T., Guggenberger, G., Janssens, I. A., Kleber, M., Kögel-Knabner, I., Lehmann, J., and Manning, D. A.: Persistence of soil organic matter as an ecosystem property, Nature, 478, 49–56, 2011.
Schrumpf, M., Schulze, E. D., Kaiser, K., and Schumacher, J.: How accurately can soil organic carbon stocks and stock changes be quantified by soil inventories?, Biogeosciences, 8, 1193–1212, https://doi.org/10.5194/bg-8-1193-2011, 2011.
Schwertmann, U., Süsser, P., and Nätscher, L.: Protonenpuffersubstanzen in Böden, Z. Pflanz. Bodenkunde, 150, 174–178, 1987.
Sierra, C. A., Müller, M., Metzler, H., Manzoni, S., and Trumbore, S. E.: The muddle of ages, turnover, transit, and residence times in the carbon cycle, Glob. Change Biol., 23, 1763–1773, 2017.
Six, J., Doetterl, S., Laub, M., Müller, C. R., and Van de Broek, M.: The six rights of how and when to test for soil C saturation, SOIL, 10, 275–279, https://doi.org/10.5194/soil-10-275-2024, 2024.
Smith, P., Soussana, J. F., Angers, D., Schipper, L., Chenu, C., Rasse, D. P., Batjes, N. H., Van Egmond, F., McNeill, S., and Kuhnert, M.: How to measure, report and verify soil carbon change to realize the potential of soil carbon sequestration for atmospheric greenhouse gas removal, Glob. Change Biol., 26, 219–241, 2020.
Solly, E. F., Weber, V., Zimmermann, S., Walthert, L., Hagedorn, F., and Schmidt, M. W.: A critical evaluation of the relationship between the effective cation exchange capacity and soil organic carbon content in Swiss forest soils, Frontiers in Forests and Global Change, 3, 98, https://doi.org/10.3389/ffgc.2020.00098, 2020.
Stewart, C. E., Paustian, K., Conant, R. T., Plante, A. F., and Six, J.: Soil carbon saturation: concept, evidence and evaluation, Biogeochemistry, 86, 19–31, 2007.
Swisstopo: DEM, Swiss Federal Office of Topography, https://www.swisstopo.admin.ch/de/home.html (last access: 22 November 2016), 2011.
Thürig, E., Stadelmann, G., and Didion, M.: Estimating carbon stock changes in living and dead biomass and soil for the technical correction of Switzerland's Forest Management Reference Level for the Swiss NIR 2021 (1990–2019) – modeling methodology and results. Forest Resources and Management, Swiss Federal Institute for Forest, Snow and Landscape Research WSL, 2021.
Thürig, E., Palosuo, T., Bucher, J., and Kaufmann, E.: The impact of windthrow on carbon sequestration in Switzerland: a model-based assessment, Forest Ecol. Manag., 210, 337–350, 2005.
Trofymow, J. A.: The Canadian Intersite Decomposition Experiment (CIDET): project and site establishment report, BC-X-378, Natural Resources Canada, ISBN 0-662-26870-9, 1998.
Tuomi, M., Thum, T., Järvinen, H., Fronzek, S., Berg, B., Harmon, M., Trofymow, J., Sevanto, S., and Liski, J.: Leaf litter decomposition – Estimates of global variability based on Yasso07 model, Ecol. Model., 220, 3362–3371, 2009.
Ťupek, B., Lehtonen, A., Yurova, A., Abramoff, R., Guenet, B., Bruni, E., Launiainen, S., Peltoniemi, M., Hashimoto, S., Tian, X., Heikkinen, J., Minkkinen, K., and Mäkipää, R.: Modelling boreal forest's mineral soil and peat C dynamics with the Yasso07 model coupled with the Ricker moisture modifier, Geosci. Model Dev., 17, 5349–5367, https://doi.org/10.5194/gmd-17-5349-2024, 2024.
van der Voort, T. S., Zell, C., Hagedorn, F., Feng, X., McIntyre, C., Haghipour, N., Graf Pannatier, E., and Eglinton, T. I.: Diverse soil carbon dynamics expressed at the molecular level, Geophys. Res. Lett., 44, 11840–811850, 2017.
Vesterdal, L., Clarke, N., Sigurdsson, B. D., and Gundersen, P.: Do tree species influence soil carbon stocks in temperate and boreal forests?, Forest Ecol. Manag., 309, 4–18, 2013.
Viskari, T., Pusa, J., Fer, I., Repo, A., Vira, J., and Liski, J.: Calibrating the soil organic carbon model Yasso20 with multiple datasets, Geosci. Model Dev., 15, 1735–1752, https://doi.org/10.5194/gmd-15-1735-2022, 2022.
Walthert, L., Pannatier, E. G., and Meier, E. S.: Shortage of nutrients and excess of toxic elements in soils limit the distribution of soil-sensitive tree species in temperate forests, Forest Ecol. Manag., 297, 94–107, 2013.
Walthert, L., Zimmermann, S., Blaser, P., Luster, J., and Lüscher, P.: Waldböden der Schweiz, Band 1. Grundlagen und Region Jur [Forest soils of Switzerland Vol. 1, Basics and the Jura Region], Birmensdorf, Eidg. Forschungsanstalt WSL, Bern, Hep Verlag, 768 pp., ISBN 3-03905-130-X, 2004.
Walthert, L., Graf, U., Kammer, A., Luster, J., Pezzotta, D., Zimmermann, S., and Hagedorn, F.: Determination of organic and inorganic carbon, δ13C, and nitrogen in soils containing carbonates after acid fumigation with HCl, J. Plant Nutr. Soil Sc., 173, 207–216, 2010.
Wiesmeier, M., Prietzel, J., Barthold, F., Spörlein, P., Geuß, U., Hangen, E., Reischl, A., Schilling, B., von Lützow, M., and Kögel-Knabner, I.: Storage and drivers of organic carbon in forest soils of southeast Germany (Bavaria)–Implications for carbon sequestration, Forest Ecol. Manag., 295, 162–172, 2013.
Wiesmeier, M., Urbanski, L., Hobley, E., Lang, B., von Lützow, M., Marin-Spiotta, E., van Wesemael, B., Rabot, E., Ließ, M., and Garcia-Franco, N.: Soil organic carbon storage as a key function of soils – A review of drivers and indicators at various scales, Geoderma, 333, 149–162, 2019.
Zinke, P. J., Millemann, R. E., and Boden, T. A.: Worldwide organic soil carbon and nitrogen data, Carbon Dioxide Information Center, Environmental Sciences Division, https://doi.org/10.3334/CDIAC/LUE.NDP018, 1986.