the Creative Commons Attribution 4.0 License.
the Creative Commons Attribution 4.0 License.
 | 27 Aug 2025
Annual net CO2 fluxes from drained organic soils used for agriculture in the hemiboreal region of Europe
Arta Bārdule
Raija Laiho
Jyrki Jauhiainen
Kaido Soosaar
Andis Lazdiņš
Kęstutis Armolaitis
Aldis Butlers
Dovilė Čiuldienė
Andreas Haberl
Milda Muraškienė
Ivika Ostonen
Gristin Rohula-Okunev
Muhammad Kamil-Sardar
Thomas Schindler
Hanna Vahter
Egidijus Vigricas
Ieva Līcīte
Carbon dioxide (CO2) emissions from drained organic soils used for agriculture contribute significantly to the overall anthropogenic greenhouse gas budget in the land use, land use change, and forestry (LULUCF) sector. To justify the implementation of climate change mitigation measures on these lands, it is important to estimate at least the regional variation in annual net CO2 fluxes. This study presents the first estimates of annual net CO2 fluxes from drained nutrient-rich organic soils in croplands (8 sites) and grasslands (12 sites) in the hemiboreal region of Europe, represented by Estonia, Latvia, and Lithuania. The study sites represented both deep and shallow highly decomposed, organic soils, categorised based on the concentration of organic carbon in the top 20 cm soil layer. CO2 flux measurements were conducted over at least 2 years at each site. To estimate annual net CO2 fluxes, ecosystem respiration (Reco) and soil heterotrophic respiration (Rhet) were measured using a manual dark-chamber technique, and carbon (C) input into soil through plant residues was estimated. Reco was strongly dependent on temperature, particularly soil temperature at 10 cm depth, but was rather independent of the soil water table level and soil moisture. The overall mean annual net soil CO2 fluxes, calculated as the difference between annual output (Rhet) and input (plant residues), were 4.8 ± 0.8 for croplands and 3.8 ± 0.7 for grasslands, while the means for “true” or deep organic soil were 4.1 ± 0.7 in croplands and 3.2 ± 0.6 in grasslands (mean ± standard error). Both the annual Reco and net CO2 fluxes for shallow highly decomposed organic soils, currently not recognised as organic soil by the Intergovernmental Panel on Climate Change (IPCC), were of similar magnitude to or even higher than those from deep organic soil, suggesting a need to separate them from mineral soils in emission estimation.
- Article
(2843 KB) - Full-text XML
-
Supplement
(2381 KB) - BibTeX
- EndNote


Organic soils drained for agriculture contribute significantly to anthropogenic greenhouse gas (GHG) emissions and are carbon dioxide (CO2) emission hotspots in the agricultural and land use, land use change, and forestry (LULUCF) sectors in many countries (Tubiello et al., 2015, 2016; Tiemeyer et al., 2016; Säurich et al., 2019b; European Environment Agency, 2023). When evaluating the overall impact of drained organic soils used for agricultural production on the greenhouse effect, CO2 is considered to be the most important GHG (Houghton et al., 2001; Maljanen et al., 2007). Maljanen et al. (2007) reported that CO2 emissions accounted for around 80 % of the total emissions of CO2, methane (CH4), and nitrous oxide (N2O) in drained organic cropland soils in the boreal region. The soil CO2 emissions result from two main processes: autotrophic respiration, which is the respiration of living plant roots, and heterotrophic respiration (Rhet), which involves the respiration of soil biota such as microorganisms and soil fauna responsible for decomposing litter and soil organic matter (SOM) (Kuzyakov, 2006; Berglund et al., 2011; Bader et al., 2017; Tang et al., 2020a, b). SOM-derived CO2 emissions, along with estimates of C input into soil by vegetation, are key components in the assessment of soil as a source or sink of atmospheric CO2 (Kuzyakov, 2006; Tiemeyer et al., 2016).
According to the European Union (EU) GHG inventory for the year 2021, 4.1 Mha or 1 % of the total land area in the EU comprised managed organic soils under croplands and grasslands, corresponding to emissions of 76 Mt of CO2 (European Environment Agency, 2023). Thus, these soils were responsible for the largest share (∼70 %) of GHG emissions from managed organic soils in the EU (European Environment Agency, 2024). The largest area of drained organic soils used for agriculture is in eastern and northern Europe. As of 2019, this region comprised 45 % of the worldwide agricultural land on organic soil (FAO, 2020). In order to achieve international climate change mitigation goals, like the Paris Agreement (UNFCCC, 2015) and the European Green Deal (Fetting, 2020), an increase in the sequestration of atmospheric CO2 and a reduction in GHG emissions from organic soils, especially from soils drained for agricultural use, are urgently required. To take effective and practical measures to reduce emissions, it is necessary to know where and why the emissions are highest and to understand how they respond to changes in the environmental variables regulating them.
It is well documented that improved soil aeration caused by lowering the soil water table level (WTL) through ditch drainage, along with mechanical practices (e.g. repeated ploughing), as well as the application of lime and fertilisers, enhances the conditions for SOM mineralisation and the associated CO2 production (Nykänen et al., 1995; Lohila et al., 2004; Maljanen et al., 2007). However, CO2 emissions from drained organic soils vary considerably. They depend on complex interactions of many physical and chemical variables, including local climate and physical soil conditions (mainly temperature, moisture, and WTL); soil properties (e.g. peat type, composition, degree of decomposition); and the type and intensity of management, including the type of vegetation (Oleszczuk et al., 2008; Norberg et al., 2016; Tiemeyer et al., 2016; Minasny et al., 2017, Bader et al., 2018; Fairbairn et al., 2023).
Relative to the number of the affecting variables and their interactions, as well as the variation in management practices and intensity, there is still a rather limited number of studies that provide comprehensive information on the annual net CO2 fluxes from drained organic soils used for agriculture. For instance, the IPCC (Hiraishi et al., 2014) default CO2 emission factors for drained nutrient-rich organic soils in the temperate and boreal regions are based on data from 39 sites for croplands and 60 sites for grasslands. The categories of temperate and boreal are broad and comprise a lot of variation in climatic, hydrological, and geomorphological conditions that are likely to shape the emissions. Still, there is too little data to adjust the emission factors correspondingly. Further, many studies have focused on deep peat soils known as Histosols, which have high soil organic carbon (SOC) content. Yet, some studies have highlighted that soils with comparatively low SOC concentrations (<15.0 %, Tiemeyer et al., 2016), which do not fall under the definition of organic soils by the IPCC (Eggleston et al., 2006), may also have high CO2 emissions (Leiber-Sauheitl et al., 2014; Eickenscheidt et al., 2015; Liang et al., 2024). These soils include formerly drained peatlands that have transformed into organo-mineral soils due to prolonged agricultural activities. Thus, the total GHG emissions from soils used in agriculture may be underestimated if such soils are treated as mineral soils in the estimation despite having higher emissions.
In the Baltic countries, which, according to the vegetation zone classification (Ahti et al., 1968), fall within the hemiboreal region of Europe, the shares of croplands and grasslands with organic soils comprise 3 %–6 % and 5 %–19 % of the total land area and produce up to 156 % and 75 % of total net GHG emissions (including CO2 removals) in croplands and grasslands, respectively (Estonia's National GHG inventory, 2023; Latvia's National GHG inventory, 2023; Lithuania's National GHG inventory, 2023). To provide knowledge-based recommendations for land use and climate policymakers regarding the management of organic soils, the magnitude of ecosystem CO2 fluxes and the variables affecting them need to be quantified under climatic and management conditions that are pertinent at a national or regional level (Wüst-Galley et al., 2020). In the hemiboreal region of Europe that falls between the boreal and temperate regions, region-specific CO2 emission factors for croplands and grasslands with drained organic soils have not been elaborated upon so far due to limited data.
The primary aims of this study were to produce the first estimates of annual net CO2 fluxes from drained organic soils in croplands and grasslands in the Baltic countries and to elaborate upon the corresponding CO2 emission factors for this hemiboreal region of Europe. In addition, we evaluated the impacts of the organic carbon (OC) concentration in topsoil and other potentially controlling environmental variables in relation to the magnitude of the CO2 fluxes. The study was conducted at 20 sites covering managed grasslands and croplands with both deep and shallow highly decomposed organic soils, grouped depending on the OC concentration in the topsoil layer.
2.1 Study sites
The study was conducted in Estonia, Latvia, and Lithuania, which are part of the hemiboreal vegetation region of Europe. In total, 20 sites were included in the study (Fig. 1; Table 1 and Table S1 in the Supplement): 8 croplands (arable land) and 12 grasslands with low management intensity (grazing or fodder production with up to two grass cuttings per year). The sites, established on formerly drained peatlands, included both (i) deep organic soils with an OC concentration above 12 % in the 0–20 cm soil layer and (ii) shallow highly decomposed organic soils with an OC concentration below 12 % in the 0–20 cm soil layer. In the current classification, the latter type of soil does not meet the IPCC criterion for organic soils (Eggleston et al., 2006). The thickness of the soil organic layer ranged from 16 to 72 cm (mean 43 ± SD 19 cm) in croplands and from 17 to 95 cm (mean 46 ± SD 25 cm) in grasslands (Table 1). All cropland sites were deep drained (mean WTL>30 cm) according to the IPCC (Hiraishi et al., 2014), while the grassland sites included both deep- (n=10) and shallow-drained (mean WTL <30 cm, n=2) sites (Table 1, Fig. S1 in the Supplement). A description of the vegetation species composition at the grassland sites is provided in Table S2 in the Supplement. All study sites represented a steady-state level of land use; i.e. the land had been used for agricultural production for at least the past 20 years. The long-term mean (1991–2020) annual air temperature was 6.3 °C in Estonia, 6.9 °C in Latvia, and 7.4 °C in Lithuania, while the mean annual precipitation was 665 mm in Estonia, 681 mm in Latvia, and 679 mm in Lithuania (Climate Change Knowledge Portal, 2024).
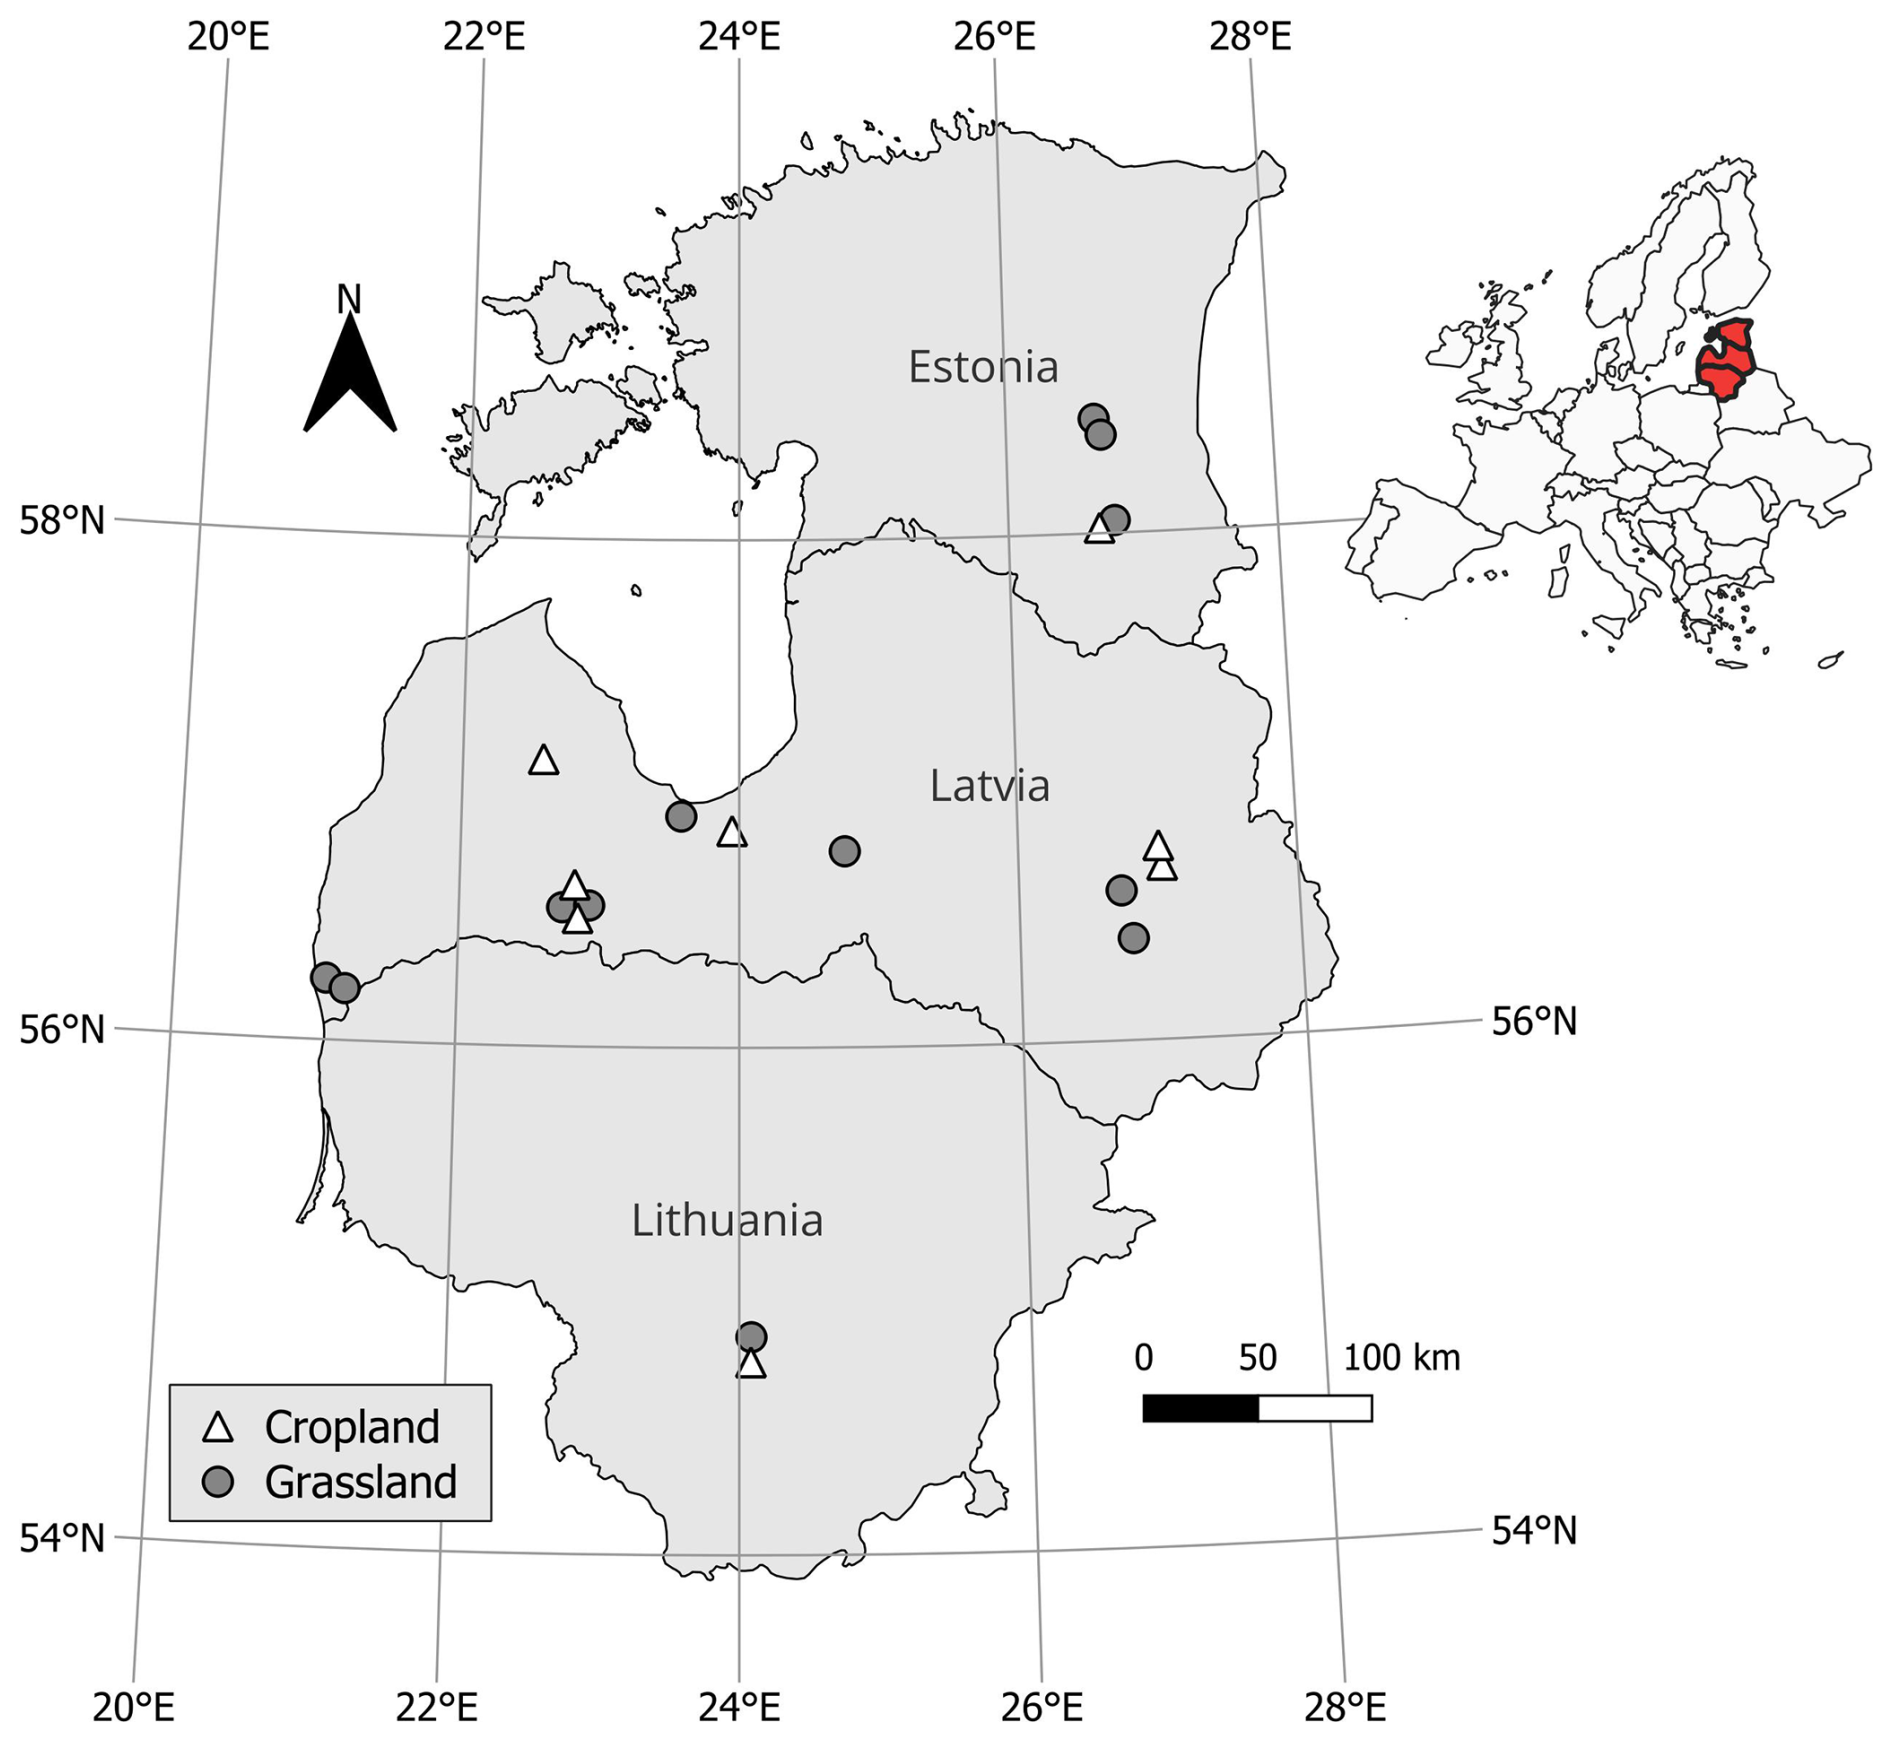
Figure 1Location of the study sites in the Baltic countries (Estonia, Latvia, and Lithuania) belonging to the hemiboreal vegetation region of Europe (maps prepared using QGIS 3.34.4).
Table 1Description of the study sites with drained nutrient-rich organic soil in agricultural land in the Baltic countries.
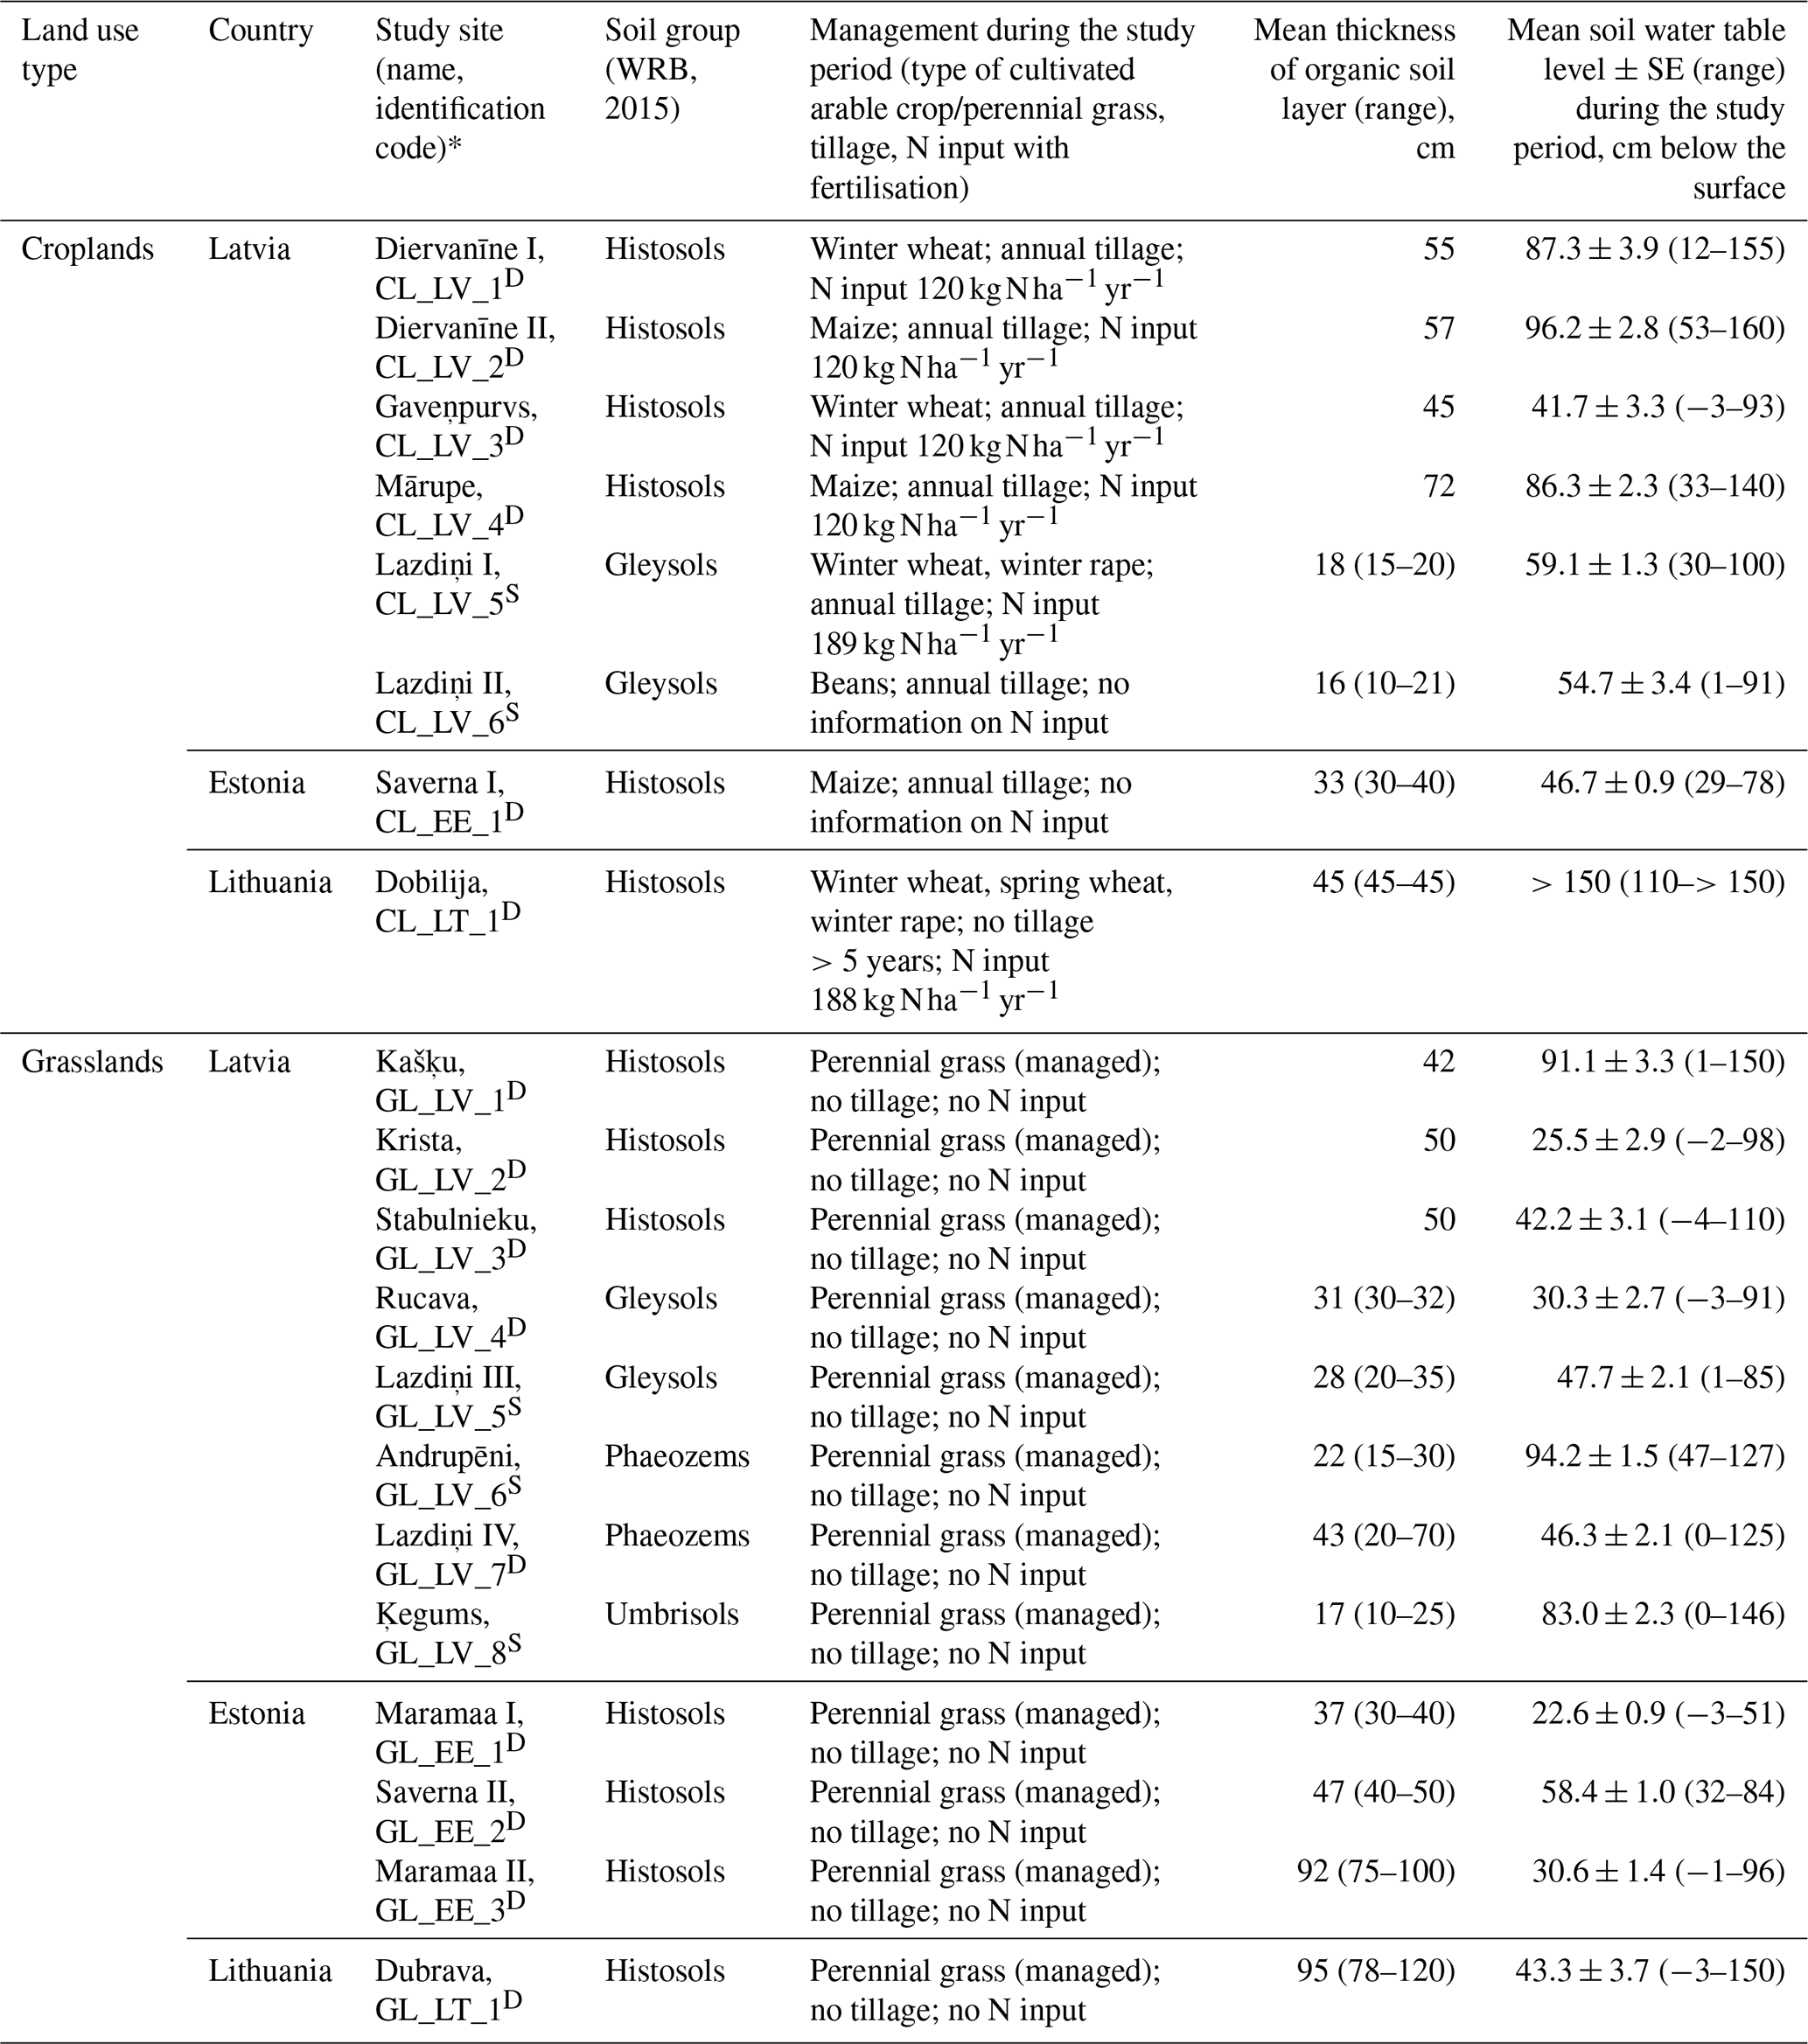
∗ Sites characterised as “deep organic soils” are marked with an upper index D, while sites characterised as “shallow highly decomposed organic soils” are marked with an upper index S.
2.2 Measurements of ecosystem respiration
To estimate ecosystem respiration (Reco), which includes both soil heterotrophic (Rhet) respiration from organic matter decomposition (including decomposition of the plant residues specific to the study site) and autotrophic respiration of aboveground and belowground plant biomass, gas sampling was conducted once or twice a month (Table S1). The measurement periods varied between sites, as shown in Table S1, falling between December 2016 and June 2023. One to three plots per site (Table S1) were prepared for gas sampling by installing permanent circular collars (area of 0.1995 m2) in the soil (one to five collars per plot, Table S1), extending down to 5 cm depth, at least 1 month before the first gas sampling to avoid the disturbance to the vegetation affecting the results. Gas sampling was conducted using manually operated closed static opaque chambers (volume of 0.0655 m3). The chambers were positioned air-tightly on the collars, and during the next 30 (Latvia) or 60 min (Estonia, Lithuania) period, four consecutive gas samples (50 mL) were taken in 10 (Latvia) or 20 min (Estonia, Lithuania) intervals, respectively, using pre-evacuated (0.3 mbar) glass vials. All measurements were made during the daytime, and the time of measurement events was randomised among sites and plots.
The CO2 concentration in the Reco gas samples was determined using a gas chromatography (GC) method. The gas samples were analysed using the Shimadzu GC-2014 (Shimadzu Corporation, Kyoto, Japan) at the Laboratory of the Geography Department of the University of Tartu in Estonia or the Shimadzu Nexis GC-230 (Shimadzu U.S.A Manufacturing, Inc., Canby, OR, USA) at the Latvian State Forest Research Institute Silava (LVS EN ISO 17025:2018-accredited laboratory) in Latvia. Both instruments were equipped with an electron capture detector (ECD). The expanded uncertainty (equal to two times the combined uncertainty) of the method was estimated to be 4.8 % (Magnusson et al., 2017).
Quality control of the data involved the assessment of the fit of the CO2 concentrations in the gas samples to a linear regression representing the gas concentration change in time within the closed chamber. Data were excluded from further processing if the coefficient of determination (R2) of the regression was lower than 0.9, except when the difference between the maximum and minimum CO2 concentration in the four consecutive gas samples of a measurement event was lower than the respective method uncertainty (20 ppm of CO2). In total, 6.5 % of all instantaneous Reco results were excluded from further data processing based on the data quality check.
Instantaneous Reco was calculated based on the equation of the ideal gas law using the slope of the linear regression describing the change in the CO2 concentration over time, as in Eq. (1):
where Reco is instantaneous ecosystem respiration (), M is the molar mass of CO2-C (12.01 g mol−1), P is air pressure in the chamber during sampling (assumption) (101 300 Pa), V is the chamber volume (0.0655 m3), “slope” is the slope of the constructed linear regression describing the change in CO2 concentration over time (ppm h−1), R is the universal gas constant (8.314 ), T is air temperature (K), and A is collar area (0.1995 m2).
2.3 Measurements of soil heterotrophic respiration
At 13 study sites (four croplands and nine grasslands), soil heterotrophic respiration (Rhet) was measured to allow for a comparison between the use of direct Rhet measurements versus Rhet estimates derived from Reco measurements in the estimation of annual net CO2 fluxes. Three measurement points with an area of 0.36 m2 were established per plot (a total of nine measurement points per study site, Table S1) during the previous growing season before the commencement of Rhet measurements. Vegetation was removed, soil trenching to a depth of at least 40 cm was done to exclude autotrophic respiration from roots, and a geotextile was installed to prevent new root ingrowth into the measurement points. Soil Rhet was measured once or twice a month during the vegetation periods (April–November), and the measurement periods varied between sites, as shown in Table S1, falling between April 2021 and October 2023. Soil Rhet was measured using a portable CO2 gas analyser (EGM-5; P.P. Systems, Amesbury, MA, USA) and opaque fan-equipped chambers with a volume of 0.021 m3 that covered an area of 0.07 m2. The chamber was positioned air-tightly on bare soil without a collar.
The duration of each Rhet measurement was 180 s, during which the CO2 concentration in the closed chamber was recorded every second. Measurement results (CO2 concentration, ppm) were used to construct linear regressions reflecting changes in CO2 concentration over time. To avoid the impacts of mechanical disturbances (chamber placement and removal, movement near the chamber), the concentration values recorded during the first 15 s and the last 30 s of the 180 s measurement period were excluded from the regression based on the results of the method validation. Similarly to Reco, instantaneous Rhet was calculated based on the equation of the ideal gas law using the slope of the constructed linear regression (Eq. 1).
2.4 Estimation of C stock in aboveground and belowground parts of vegetation
To estimate the vegetation C stocks, aboveground and belowground plant biomass was sampled in each plot with at least three replicates (1 m distance between replicates) one to three times per study period. The biomass sampling dates for each study site are summarised in Table S1. The sampling areas represented each Reco measurement plot, avoiding atypical microrelief and vegetation disturbance in the CO2 flux measurement points (permanent circular collars). The sampling area of aboveground biomass was 625 cm2 in Latvia, 1600 cm2 in Lithuania, and 10 000 cm2 in Estonia, and the sampling area of belowground biomass was 625 cm2 in Latvia and 1600 cm2 in Lithuania, and 15 soil cores (diameter of 48 mm) were randomly sampled per each site in Estonia. The belowground biomass was sampled down to 20–30 cm depth. The samples were brought to the laboratory, where their dry mass was determined after drying at 65–70 °C temperature for 48 h or until a constant mass. Before drying, the belowground biomass samples were cleaned of soil particles by washing with cold tap water and using wet sieving. Total C and nitrogen (N) concentrations in all biomass samples were determined with the elementary analysis method (elemental analyser Elementar El Cube) according to the LVS ISO 10694:2006 and LVS ISO 13878:1998, respectively.
2.5 Soil sampling and analyses
At each plot, the soil was sampled in one to three replicates using a soil sample probe (diameter of 5 cm) from the following depths: 0–10 cm, 10–20 cm, 20–30 cm, 30–40 cm, 40–50 cm, 50–75 cm, and 75–100 cm. The soil samples were first pre-treated for physico-chemical analyses, including drying at a temperature not exceeding 40 °C and sieving (aperture size of 2 mm) according to LVS ISO 11464:2005. The following soil variables were then determined: soil pH according to LVS EN ISO 10390:2021 (suspension of soil in 1 mol L−1 potassium chloride (KCl) solution, pH KCl; pH meter Adrona AM 1605); total C (TC) and total N (TN) concentrations by dry combustion according to LVS ISO 10694:2006 and LVS ISO 13878:1998 (elemental analyser Elementar El Cube); carbonate concentration using a digital soil calcimeter (UGT/BD Inventions FOG II Calcimeter Field Kit); ash content according to LVS EN ISO 18122:2022; and concentrations of HNO3-extractable potassium (K), calcium (Ca), magnesium (Mg), and phosphorus (P) according to LVS EN ISO 11885:2009 with the inductively coupled plasma–optical emission spectrometry (ICP-OES) method (Thermo Fisher Scientific iCAP 7200 Duo). Organic C (OC) concentration was calculated as the difference between TC and inorganic C (carbonate) concentration or by multiplying the SOM content derived using results of ash content by a factor of 0.5, thus assuming that SOM is 50 % carbon (Pribyl, 2010). In addition, the soil ratio ( ratio) was calculated.
2.6 Other environmental variables
Concurrently with the soil respiration measurements, the following environmental variables were measured in each plot: air temperature; soil temperature at depths of 10, 20, 30, and 40 cm using the COMET data logger (COMET SYSTEM, s.r.o., 756 61 Roznov pod Radhostem, Czech Republic) equipped with Pt1000 temperature probes; soil moisture (volumetric water content) and soil temperature at 5 cm depth using the ProCheck meter (Decagon Devices, Pulman, WA, USA) equipped with a moisture sensor (in Estonia and Latvia) and an HH2 Hand Held Moisture Meter (Delta-T Devices, Burwell, UK) with a SM150T moisture sensor (in Lithuania); and soil water table level (WTL) using groundwater wells (piezometer tubes, 5–7.5 cm in diameter, perforated and coated with nylon mesh) installed vertically down to a depth of 1.5–2.0 m. In addition, continuous soil temperature measurements at a depth of 10 cm were carried out at 10 study sites (four croplands and six grasslands) at 30 min intervals using Maxim Integrated DS1922L2F loggers (iButtonLink Technology, Whitewater, WI 53190 USA).
2.7 Estimation of annual soil net CO2 fluxes and CO2 emission factors
Annual net CO2 fluxes from soil were calculated as the difference between annual CO2 output (annual soil Rhet) and annual C input into the soil with aboveground and belowground parts of vegetation (plant residues). We initially intended to utilise the directly measured Rhet values for these calculations; however, preliminary analyses showed that the directly measured Rhet values, which, unlike Reco, do not include autotrophic respiration, were higher than Reco at several study sites (Figs. S2 and S3 in the Supplement). Under similar conditions, Rhet should not be higher than Reco. Using the directly measured Rhet values would thus overestimate the CO2 output. The discrepancy between Rhet and Reco indicates that the variables regulating respiration, such as soil temperature and moisture, critically differed between the respective measurement locations. Also, unlike Rhet, Reco data were available over the whole year, including during the winter season.
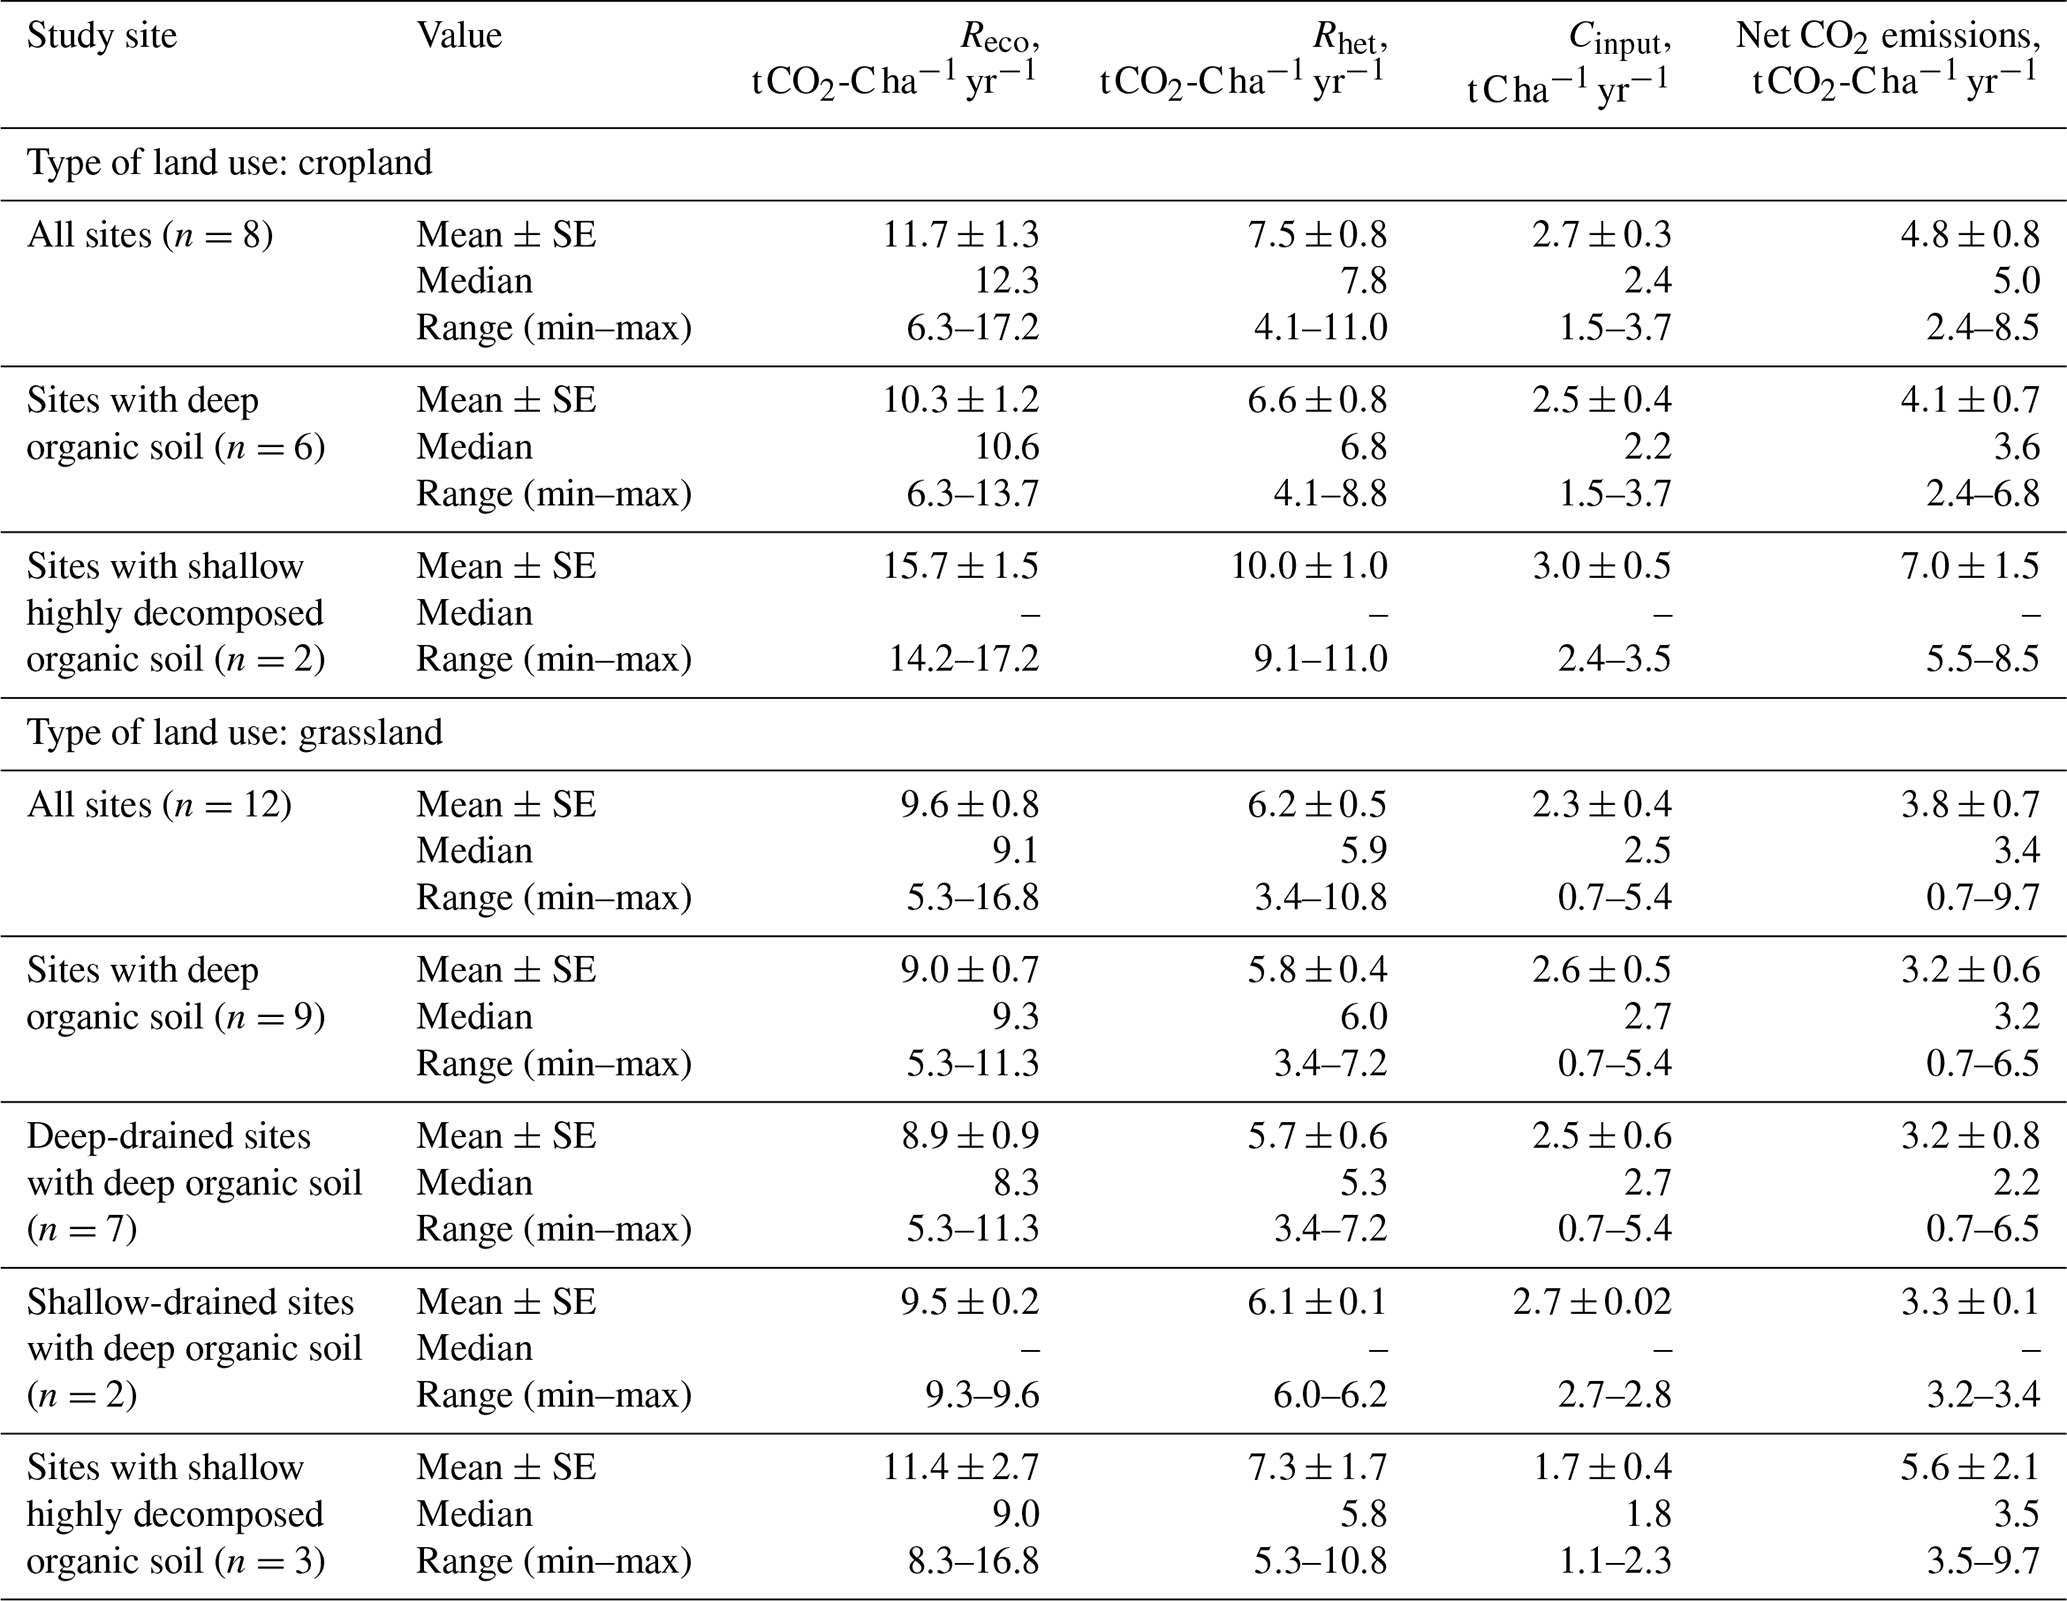
Consequently, mean annual soil Rhet was calculated assuming that (i) our Reco is equal to soil surface respiration (Rs), which includes Rhet and the dark respiration of the belowground plant biomass, and (ii) the proportion of annual soil Rhet from Rs is 64 % based on the results of previous studies (n=61, Fig. S4 in the Supplement) conducted in temperate and boreal regions (Jian et al., 2021). These assumptions were consistent with the most conservative approach and should clearly avoid an underestimation of Rhet since our Reco values additionally included the dark respiration of the aboveground plant biomass, which was not included in the Rs. The measured Reco values include the CO2 output due to decomposition of the plant residues specific to the study site. Thus, we did not need to consider the decomposition rates of the plant residues separately and did not overestimate the C input into the soil by the vegetation.
Annual Reco was calculated for each study site individually as a cumulative value consisting of mean hourly values of Reco multiplied by the number of hours in a day and the days in the each month, covering all months of the calendar year, and the final result is expressed in . The annual CO2 output from soil (annual soil Rhet) was then estimated as the 64 % value of the annual Reco.
To assess the potential overestimation of annual Reco due to measurements conducted during only the daytime, when the temperature is usually higher than the daily mean temperature, a study-site-specific comparison of the applied method and modelling approach based on continuous soil temperature measurements at depths of 10 cm at 10 study sites was conducted. The modelling approach included constructing study-site-specific models to describe the relationships between logarithmically or Box–Cox-transformed (data normalisation, Box and Cox, 1964) instantaneous Reco and soil temperature at 10 cm depth (Figs. S5 and S6 in the Supplement). Hourly Reco estimates were then calculated using the models (Figs. S5 and S6) with the continuous soil temperature data.
For croplands, the annual C input into the soil by the vegetation was divided into three components: aboveground harvest residues, belowground harvest residues, and belowground biomass litter. C input from aboveground harvest residues was calculated as the difference between the C stock in the total aboveground biomass and the C stock in harvested products, which was calculated using a harvest index (HI, Table 2), i.e. the ratio of harvested product to the total aboveground biomass (Palosuo et al., 2015):
where annual C inputAGBHR is the annual C input from aboveground harvest residue (), C stockAGB is the C stock in the total aboveground biomass (t C ha−1), and HI is the harvest index (Table 2).
Table 2The estimated annual C inputs into the soil with aboveground and belowground parts of vegetation (arable crops, perennial grass) for cases where data were not collected in this study.
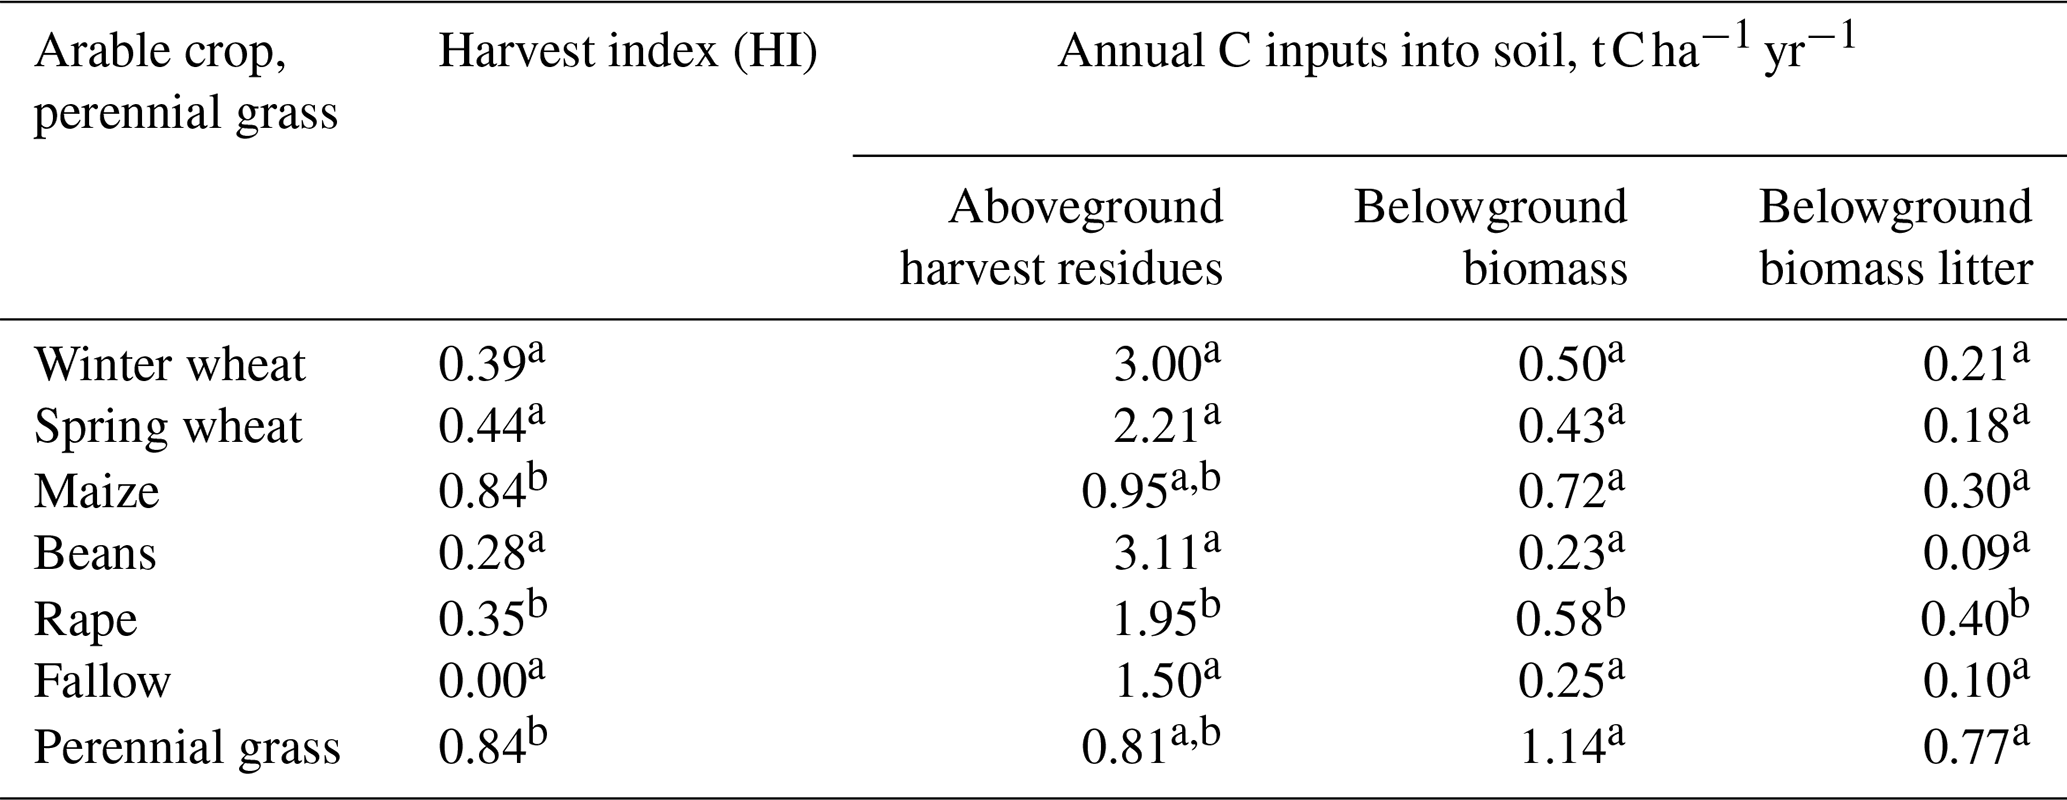
a Source: Latvian State Forest Research Institute “Silava”, 2024a. b Source: Palosuo et al., 2015.
For croplands, C input from belowground harvest residues was assumed to equal the C stock in the belowground biomass.
For study sites where aboveground and/or belowground biomass (including belowground biomass litter) was not measured, values derived from earlier research were used (Table 2).
For grassland sites where aboveground biomass was left on the field, the C input into soil with aboveground vegetation was assumed to equal the C stock in aboveground biomass measured at the end of the vegetation season. For grassland sites where aboveground biomass was harvested and removed from the field after biomass measurements were taken, the C input was calculated using the harvest index (HI, Table 2). The C input into the soil with belowground parts of vegetation was calculated assuming that the root turnover rate is 0.41, in accordance with to Palosuo et al. (2015). For study sites where data on aboveground and/or belowground biomass were not available, the values summarised in Table 2 were used.
Mean annual net CO2 fluxes from the soil, corresponding to emission factors as outlined by the IPCC, were calculated from the site-level annual net fluxes.
2.8 Statistical analysis
Statistical analyses and visualisation were conducted using the software environment R (version 4.3.3) and RStudio 2023.12.1 (R Core Team, 2024). The datasets of CO2 fluxes (both Reco and Rhet) were not normally distributed according to the Shapiro–Wilk normality test; this remained the case when all study sites were pooled and when each study site was tested separately (p<0.001).
To evaluate the differences between independent variables, for instance, differences in soil physico-chemical variables, Reco, Rhet, and annual net CO2 fluxes between different types of land use (croplands, grasslands), soil types (deep organic soil, shallow highly decomposed organic soil), or drainage (deep drained, shallow drained), the Wilcoxon rank sum exact test was used. Plot-level mean values were used when differences in soil physico-chemical variables, Reco, and Rhet between different soil types (deep organic soil, shallow highly decomposed organic soil) or drainage (deep drained, shallow drained) within the same type of land use were estimated. Site-level mean values were used when differences in independent variables between different types of land use (croplands, grasslands) were evaluated, as well as when differences in annual net CO2 fluxes were estimated between different types of land use, soil type, or drainage.
Spearman's correlation coefficient (ρ) was used to assess the degree of dependence between pairs of variables.
For assessing the variation in Reco among sites, the plot-level mean instantaneous Reco (Y) was first calculated from means of instantaneous Reco for each month, covering all months of the calendar year. A partial least-square (PLS) regression, a multivariate method suitable for dealing with variables that are linearly correlated to each other, such as soil physico-chemical variables, was then used. PLS regression analysis includes the evaluation of X variables depending on their importance in explaining Y, expressed as variables important for the projection (VIP values). X variables with VIP values below the threshold of 0.5 were considered to be insignificant and were not retained in the PLS regression, while X variables with VIP values exceeding 1.0 were considered to be important.
All statistical analyses were carried out with a significance level of 95 % (α=0.05). Results are expressed as arithmetic mean values ± standard error (SE) unless stated otherwise.
3.1 Soil physical and chemical variables
The soils of the study sites were characterised by high variation in both the thickness of the soil organic layer (Table 1) and the soil OC concentration, as well as in other physico-chemical variables (Figs. 2, S7, and S8). In the topsoil (0–20 cm layer), OC concentrations ranged from <120 g kg−1 at sites with shallow highly decomposed organic soils to 527 g kg−1 at sites with deep organic soil. In the topsoil of deep organic soils, the mean OC concentration in croplands was 365 ± 59 g kg−1, and, in grasslands, it was 276 ± 37 g kg−1. In the topsoil of shallow highly decomposed organic soils, the mean OC concentration was significantly lower in both croplands (48 ± 26 g kg−1) and grasslands (69 ± 8 g kg−1). Similarly, significantly higher TN concentrations were found in the topsoil of deep organic soils compared to shallow highly decomposed organic soils (25.7 ± 3.9 vs. 3.6 ± 2.3 g kg−1 in croplands and 20.0 ± 2.4 vs. 5.7 ± 0.8 g kg−1 in grasslands, respectively). The mean P concentration was higher in deep organic soils, with a significant difference being observed only for grassland. No significant differences in the soil ratio were found between deep organic and shallow highly decomposed organic soils; the overall mean soil ratio in the topsoil was 14.4 ± 0.6 in croplands and 13.6 ± 0.8 in grasslands. In both croplands and grasslands, significantly higher Ca concentrations were observed in the topsoil of deep organic soils compared to in shallow highly decomposed organic soils. In contrast, higher K and Mg concentrations were found in the topsoil of shallow highly decomposed organic soils, although a significant difference was observed only for croplands. The mean topsoil bulk density also tended to be higher in shallow highly decomposed organic soils, and a significant difference was observed both for croplands and grasslands. The mean pH of the topsoil was 6.1 ± 0.3 at cropland sites and 5.9 ± 0.1 at grassland sites, with no statistically significant differences being observed between the two soil types. Similar tendencies in terms of the differences in soil physico-chemical variables between deep organic soil and shallow highly decomposed organic soil were also observed for the 20–40 cm and 40–80 cm soil layers (Figs. S7 and S8).
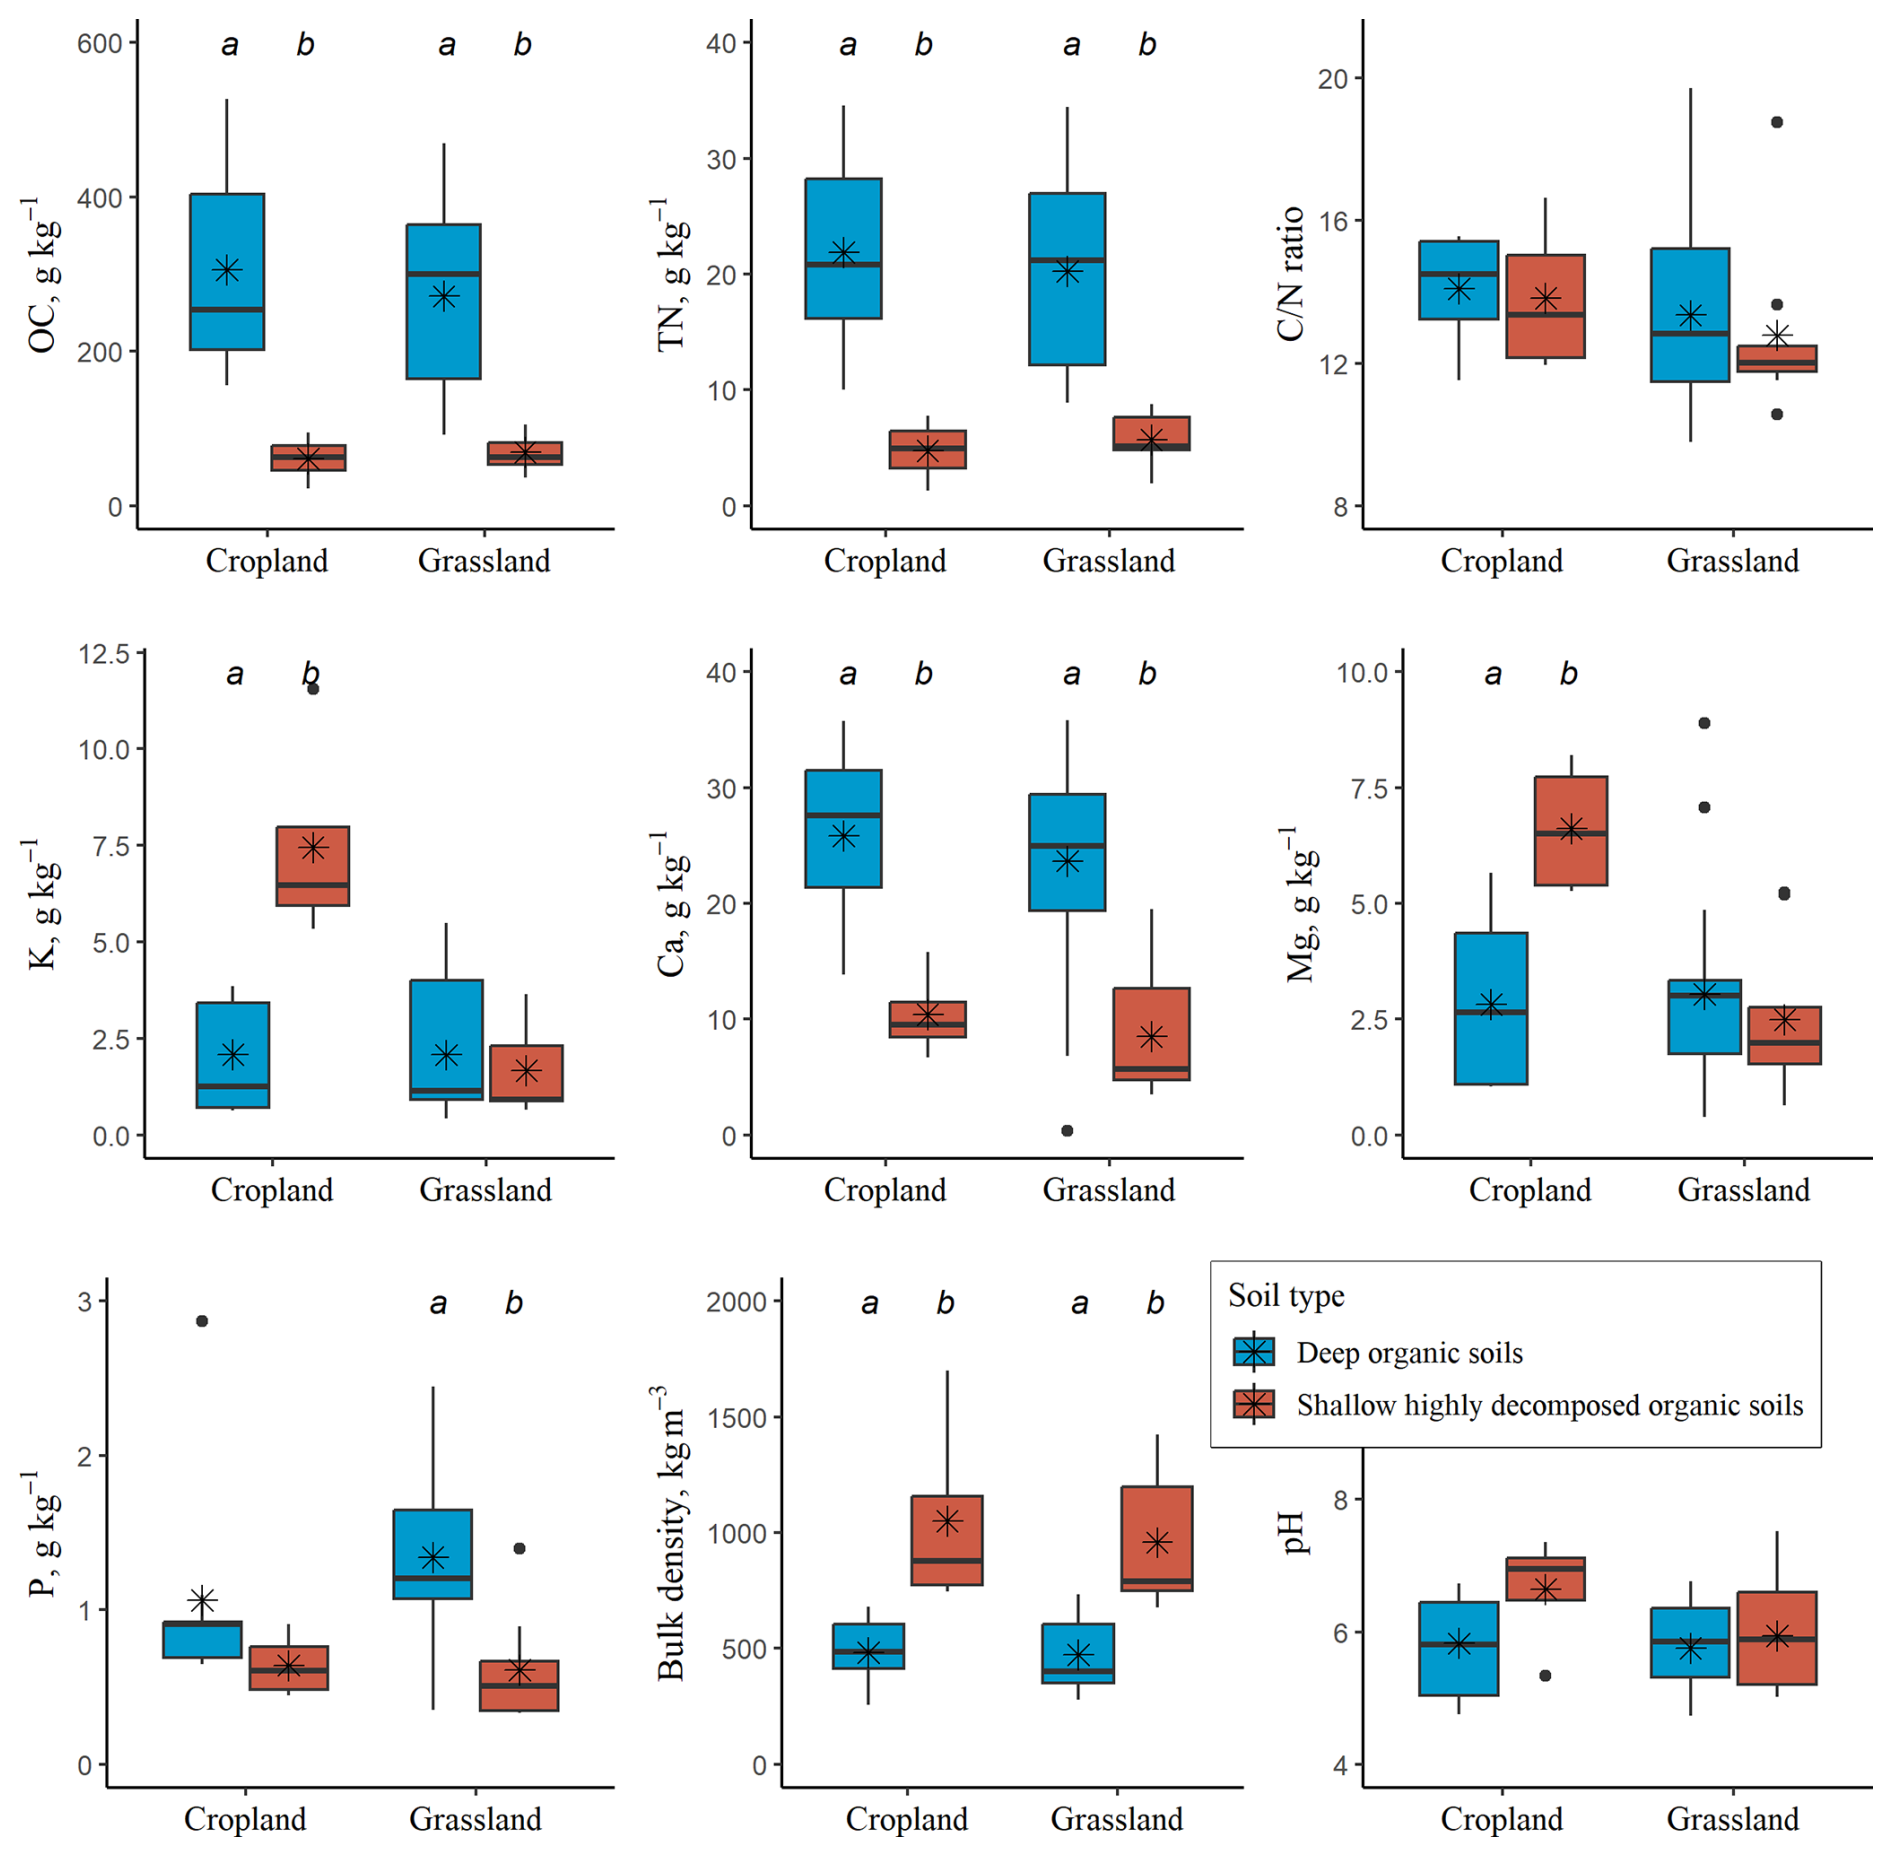
Figure 2Variation in topsoil (0–20 cm soil layer) characteristics (organic carbon (OC), total nitrogen (TN), organic carbon total nitrogen () ratio, HNO3-extractable potassium (K), calcium (Ca), magnesium (Mg) and phosphorus (P) concentration, soil bulk density, soil pH) at the cropland and grassland sites, shown separately for the two soil types (deep organic soil and shallow highly decomposed organic soil). In the boxplots, median and mean values are presented as bold horizontal lines and asterisks, respectively; the plot-level mean values were used. The boxes indicate the interquartile range (from the 25th to 75th percentile), the whiskers denote the minimum and maximum values, and the black dots show outliers. Statistically significant differences (p<0.05, Wilcoxon rank sum exact test) between deep organic soil and shallow highly decomposed organic soil within the type of land use are denoted by the lowercase letters a and b.
3.2 Ecosystem respiration (instantaneous)
Across the different seasons, the widest variation and the highest (p<0.001) mean intensity of instantaneous Reco was observed in summer (Figs. 3 and S9 in the Supplement). In both croplands and grasslands, mean instantaneous Reco decreased in the following order: summer (June–August) > spring (March–May) ≈ autumn (September–November) > winter (December–February). The mean instantaneous Reco (mean of monthly means) reflected emissions (CO2 release into the atmosphere) that ranged from 71.9 ± 21.0 to 194.8 ± 79.0 among the different cropland sites and from 59.9 ± 15.4 to 190.9 ± 60.4 among the different grassland sites. No statistically significant difference in terms of mean instantaneous Reco between the study sites of croplands and grasslands was observed (p=0.181).
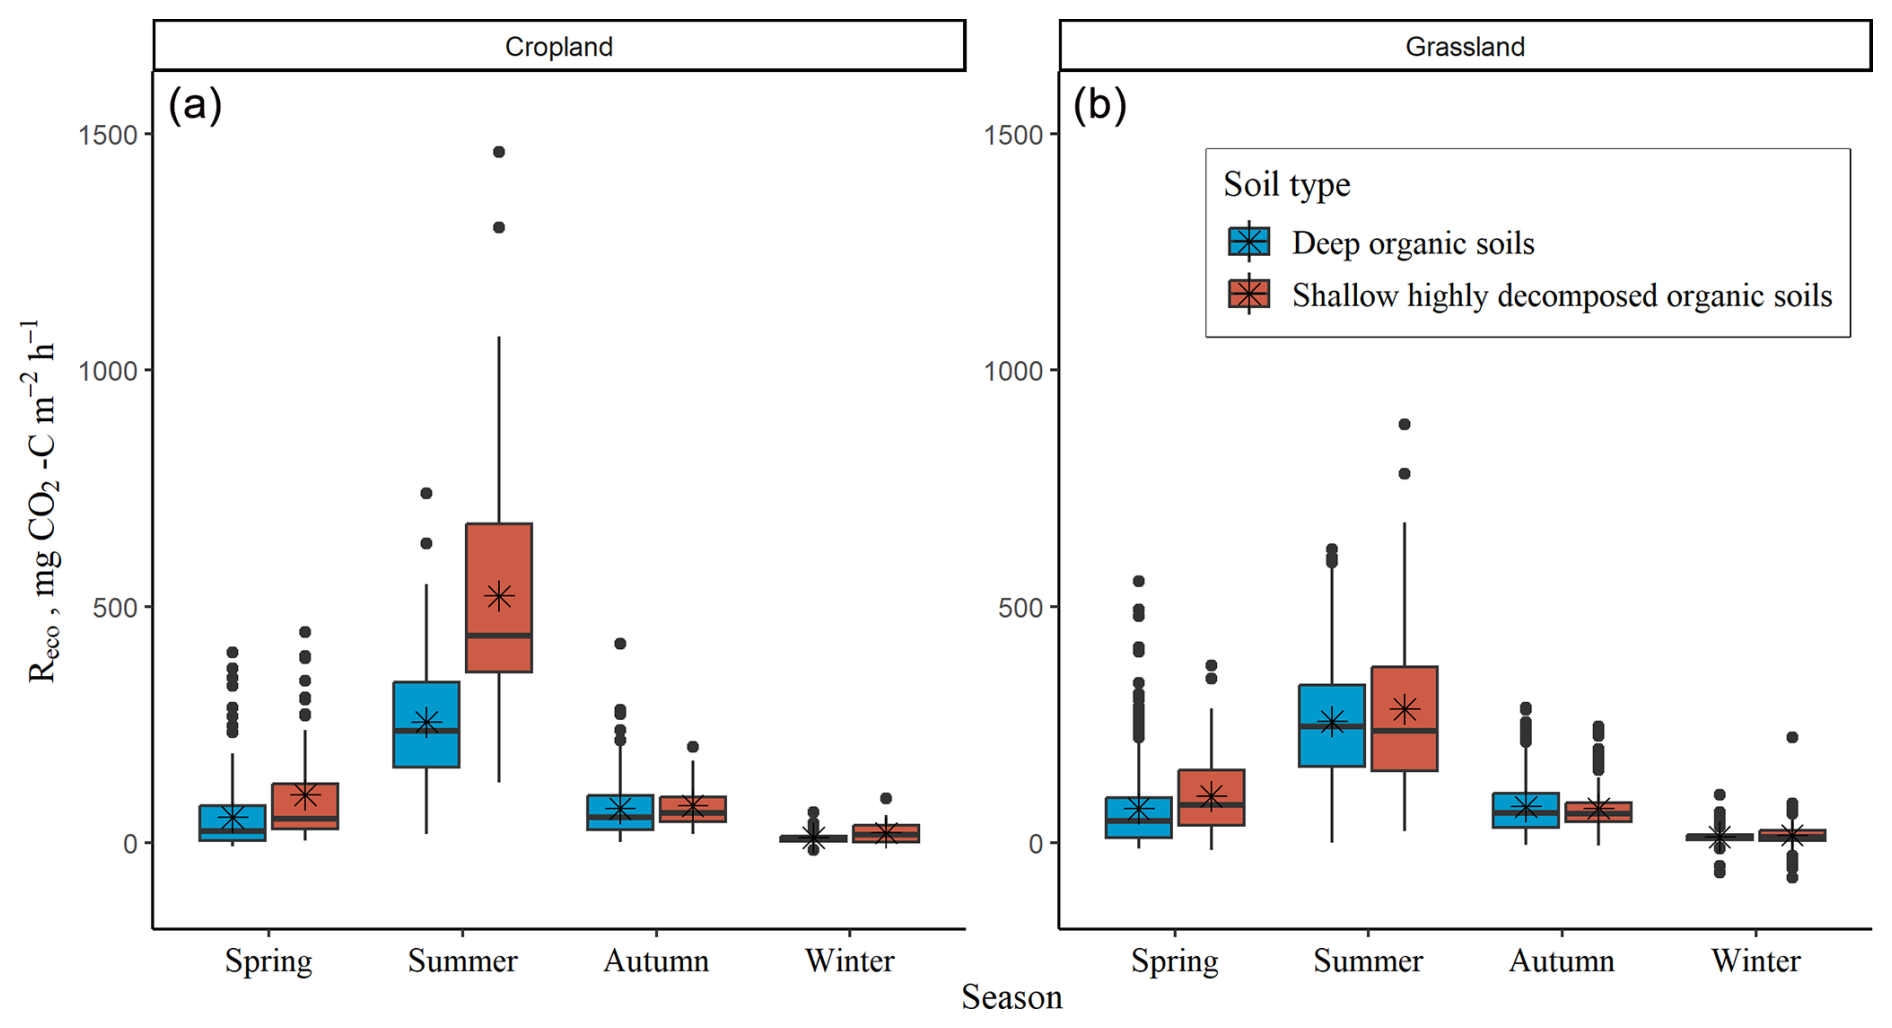
Figure 3Variation in instantaneous ecosystem respiration (Reco) among different seasons at the cropland (a) and grassland (b) sites, shown separately for the two soil types (deep organic soil and shallow highly decomposed organic soil). In the boxplots, median and mean values (bold horizontal lines and asterisks, respectively) calculated from all Reco measurements from all study sites are presented. The boxes indicate the interquartile range (from the 25th to 75th percentile), the whiskers denote the minimum and maximum values, and black dots show outliers. Spring – March, April, May; summer – June, July, August; autumn – September, October, November; winter – December, January, February (relevant environmental variable data in Figs. S10–S12 in the Supplement).
In croplands, higher (p<0.001) mean instantaneous Reco was observed in sites with shallow highly decomposed organic soils (mean 177.7 ± 17.0 ) compared to sites with deep organic soils (mean 117.1 ± 13.5 ). In grasslands, the difference between sites with shallow highly decomposed organic soil (129.4 ± 30.8) and sites with deep organic soil (102.5 ± 7.7 ) was not statistically significant (p=0.689). Additionally, in grasslands, the difference in terms of mean instantaneous Reco at deep-drained sites (mean WTL>30 cm) compared to at shallow-drained sites (mean WTL<30 cm) (109.6 ± 11.4 vs. 107.4 ± 2.1 ) was not statistically significant (p=0.924).
In general, among the environmental variables measured during each gas sampling event (WTL, soil moisture, air and soil temperatures), variation in instantaneous Reco was best described by a polynomial regression where the independent variable was soil temperature at 10 cm depth in both croplands and grasslands (47 %–66 % of the variation explained depending on the type of land use and soil, Fig. 4). Although WTL varied widely during the study period from slightly above the soil surface (3–4 cm) to >150 cm below the soil surface (Fig. S10), no clear relationship between WTL and instantaneous Reco was observed; this remained the case when data from all study sites were pooled (Fig. S13 in the Supplement) and at the level of a single study site. The response of instantaneous Reco to WTL was highly site-specific, and the R2 of site-level polynomial regressions was mostly below 0.25, with some exceptions of higher R2 showing an increase in instantaneous Reco with higher WTL. Similarly, no clear relationship between soil moisture and instantaneous Reco was observed. However, there were some indications of comparatively lower instantaneous Reco under both very dry and water-saturated conditions (Reco as a function of WTL reflected as a downward-opening parabola, Fig. S13).
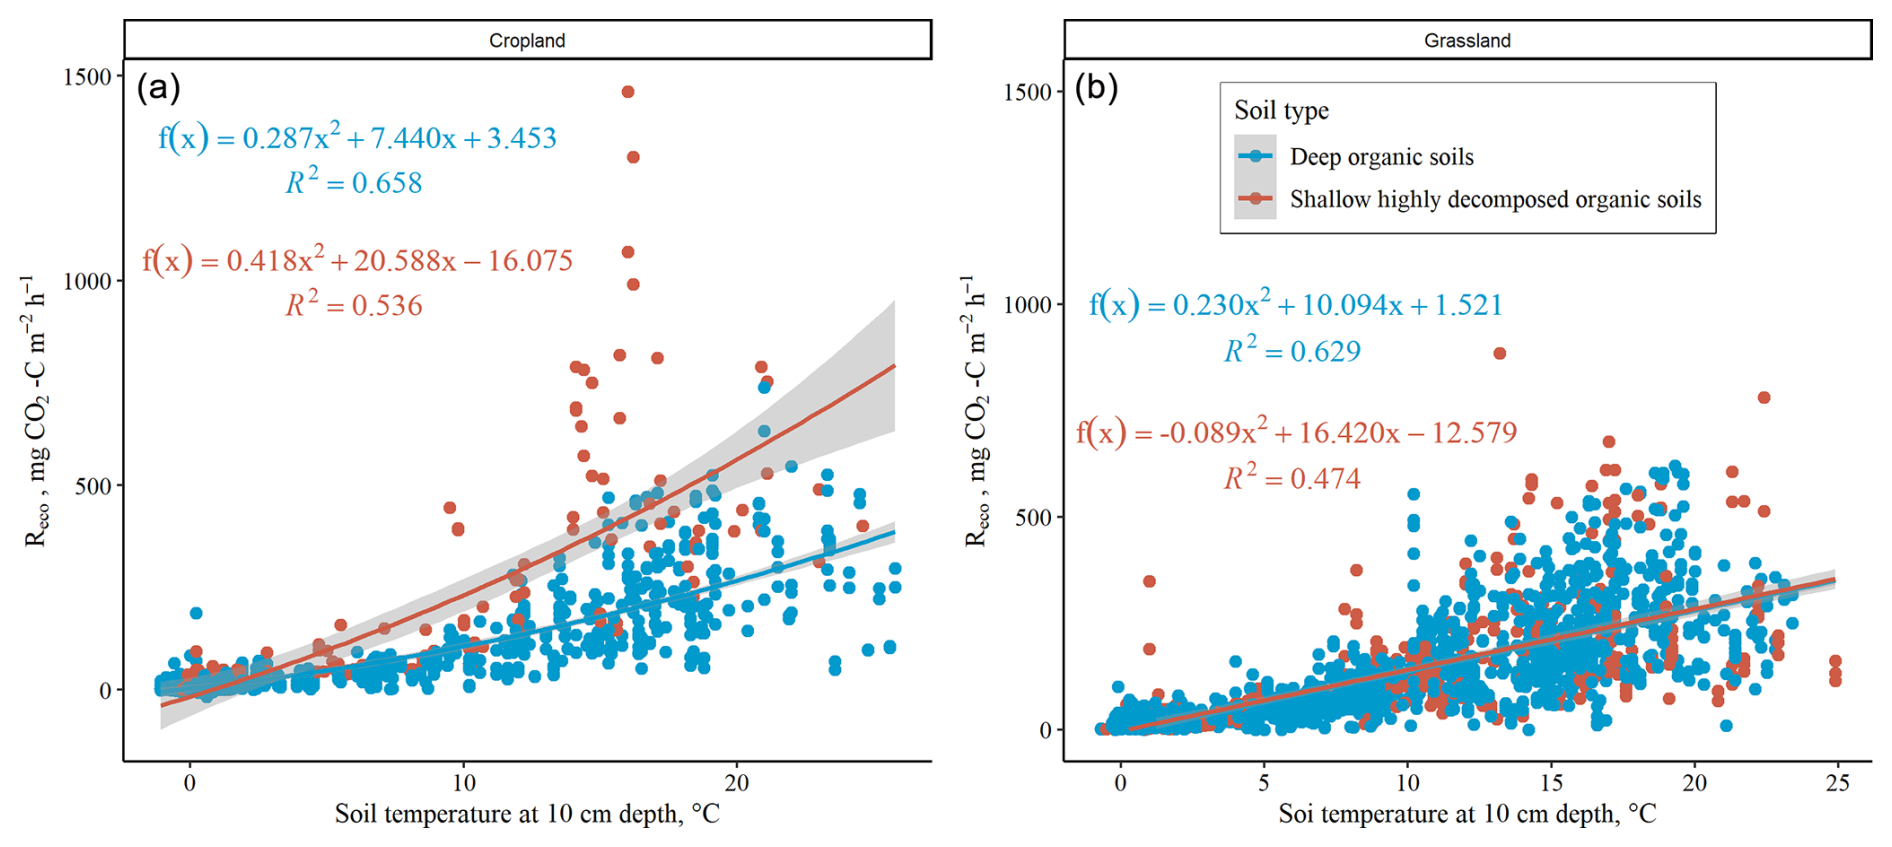
Figure 4Instantaneous ecosystem respiration (Reco) in croplands (a) and grasslands (b) as a function (polynomial regression) of soil temperature at 10 cm depth measured during each gas sampling event. Data of instantaneous ecosystem respiration are grouped by soil type (deep organic soil is denoted by the blue colour, and shallow highly decomposed organic soil is denoted by the red colour). The grey area around the regression line reflects the 95 % confidence interval of regression.
In croplands, mean instantaneous Reco was negatively correlated with soil Ca concentration and was positively correlated with soil K and Mg concentrations (Table S3 in the Supplement). Although a moderate negative correlation between mean instantaneous Reco and soil TC, OC, and TN concentrations and a moderate positive correlation between mean instantaneous Reco and soil bulk density were also found, these correlations were not statistically significant (Table S3). The PLS analyses that attempted to explain the variation in mean instantaneous Reco among the study sites with the soil physico-chemical variables resulted in a strong model for croplands (number of selected components is four), with a goodness of fit (R2) of 0.95 and a goodness of prediction of 0.66 (Q2, full cross-validation). The soil physico-chemical variables that best explained the variation (VIP>1) were the concentrations of K and Ca in the 0–20 and 20–40 cm soil layers. The PLS model also included variables with a VIP>0.5 (TC, OC, TN, Mg, P concentration, ratio, pH, soil bulk density, and thickness of the organic soil layer; Table S4 in the Supplement). The soil physico-chemical variables that were positively related to the mean instantaneous Reco were K, Mg, and P concentration, as well as pH and soil bulk density, while the other soil physico-chemical variables were related negatively.
In contrast, for grasslands, no significant correlations between mean instantaneous Reco and soil physico-chemical variables were found (Table S3). Also, the PLS analyses using soil variables resulted in weak models (R2<0.25).
3.3 Soil heterotrophic respiration (instantaneous)
During the period covered by the measurements (April–November), the widest variation and highest mean intensity of instantaneous Rhet were observed in the summer months (June–August) in both croplands and grasslands (Figs. 5 and S14 in the Supplement). Monthly mean instantaneous Rhet among different study sites ranged from 41.1 ± 5.2 in November to 662.6 ± 69.6 in July in croplands and from 18.6 ± 3.2 in November to 652.3 ± 58.1 in July in grasslands. The mean instantaneous Rhet (mean of monthly means) ranged from 158.4 ± 30.7 to 295.8 ± 72.9 among different cropland sites and from 90.0 ± 19.8 to 291.8 ± 56.6 among different grassland sites. No statistically significant difference in mean instantaneous Rhet between croplands and grasslands was observed (p=0.825).
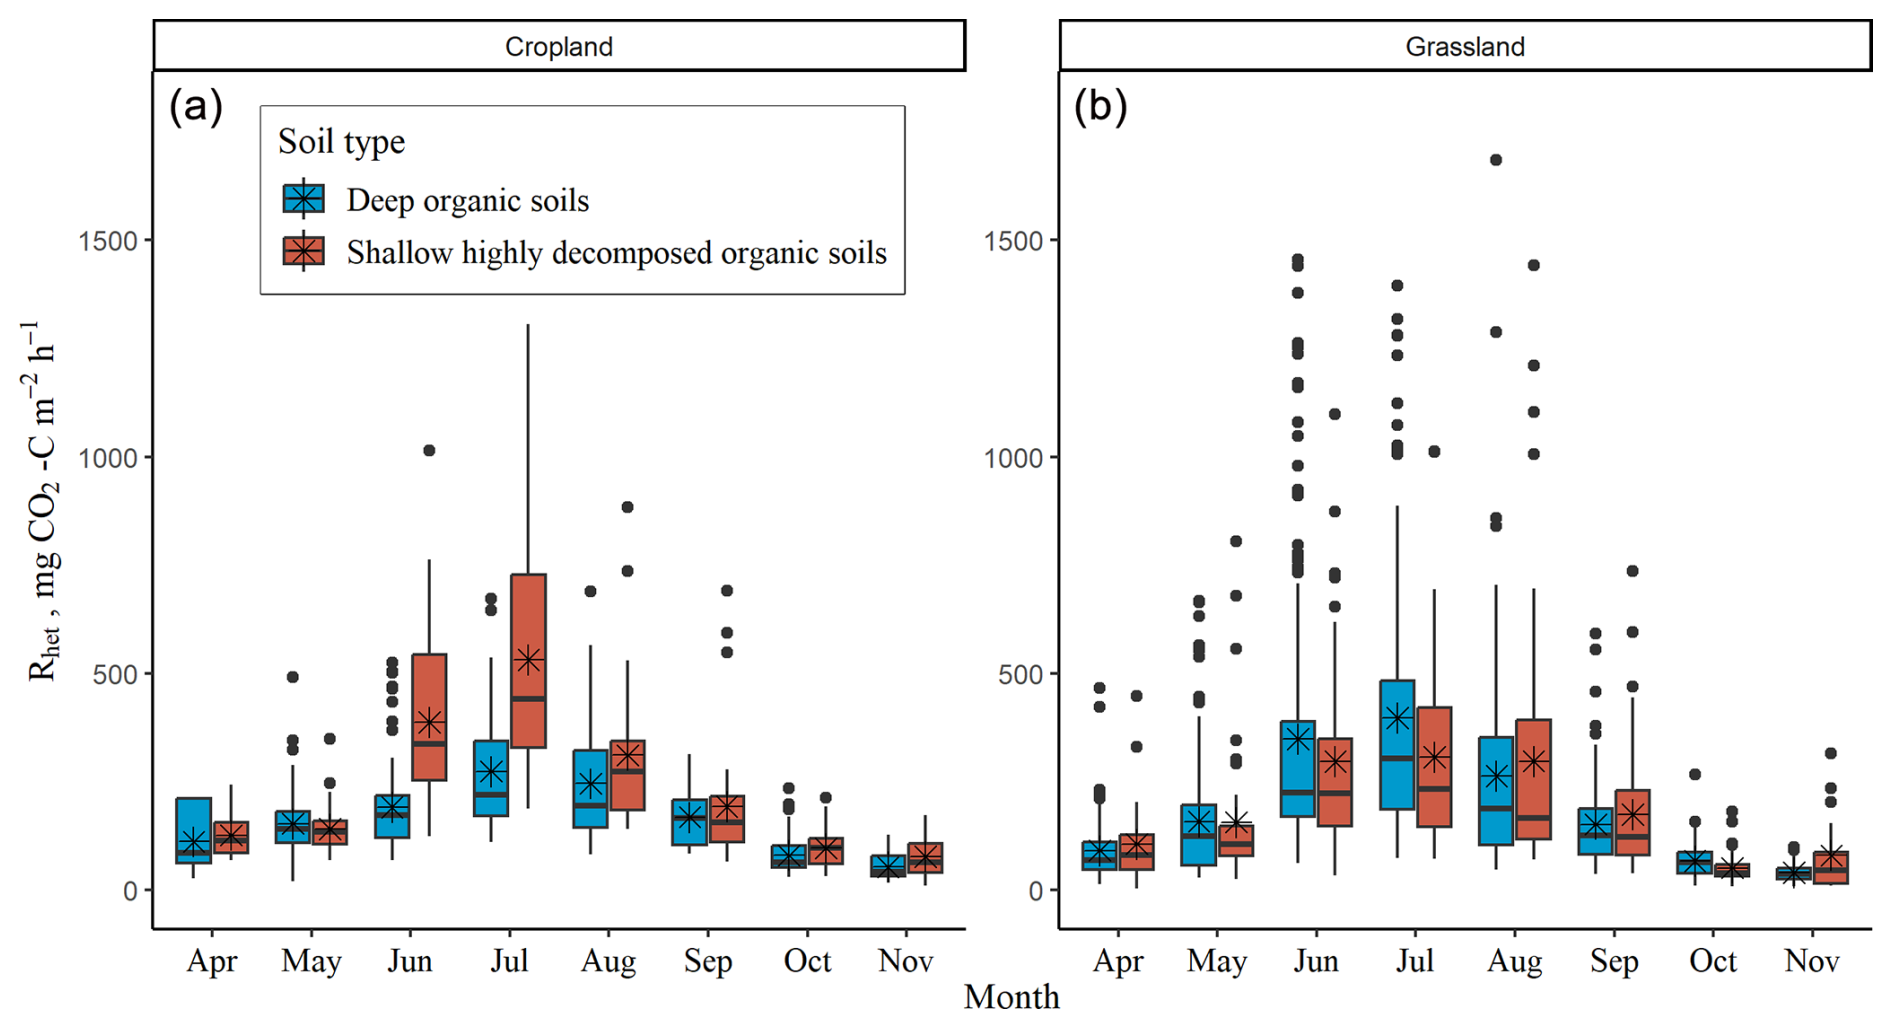
Figure 5Variation of instantaneous soil heterotrophic respiration (Rhet) in croplands (a) and grasslands (b) from April to November grouped depending on soil type (deep organic soil and shallow highly decomposed organic soil). In the boxplots, median and mean values (bold horizontal lines and asterisks, respectively) calculated from all performed Rhet measurements at four study sites for croplands and nine study sites for grasslands are presented. The boxes indicate the interquartile range (from the 25th to 75th percentile), the whiskers denote the minimum and maximum values, and the black dots show outliers.
In croplands, the overall mean instantaneous Rhet (mean of monthly means) was significantly higher (p=0.009) at the study sites with shallow highly decomposed organic soils (mean 237.3 ± 58.5 ) compared to at the study sites with deep organic soils (mean 158.8 ± 0.4 ). No statistically significant differences in mean instantaneous Rhet were observed for grasslands; this remained the case between soil types and between deep- or shallow-drained sites (p=0.495 and p=0.743, respectively). The mean instantaneous Rhet in grasslands was 192.3 ± 25.5 .
The relationship between instantaneous Rhet and soil temperature at 10 cm depth differed somewhat between the two soil types (Fig. 6). Further, it was found in several cases to be different from that of Reco (Figs. S2 and S3). Comparison of instantaneous soil Reco and Rhet as a function of soil temperature at 10 cm depth showed that instantaneous Rhet tended to exceed Reco at several study sites.
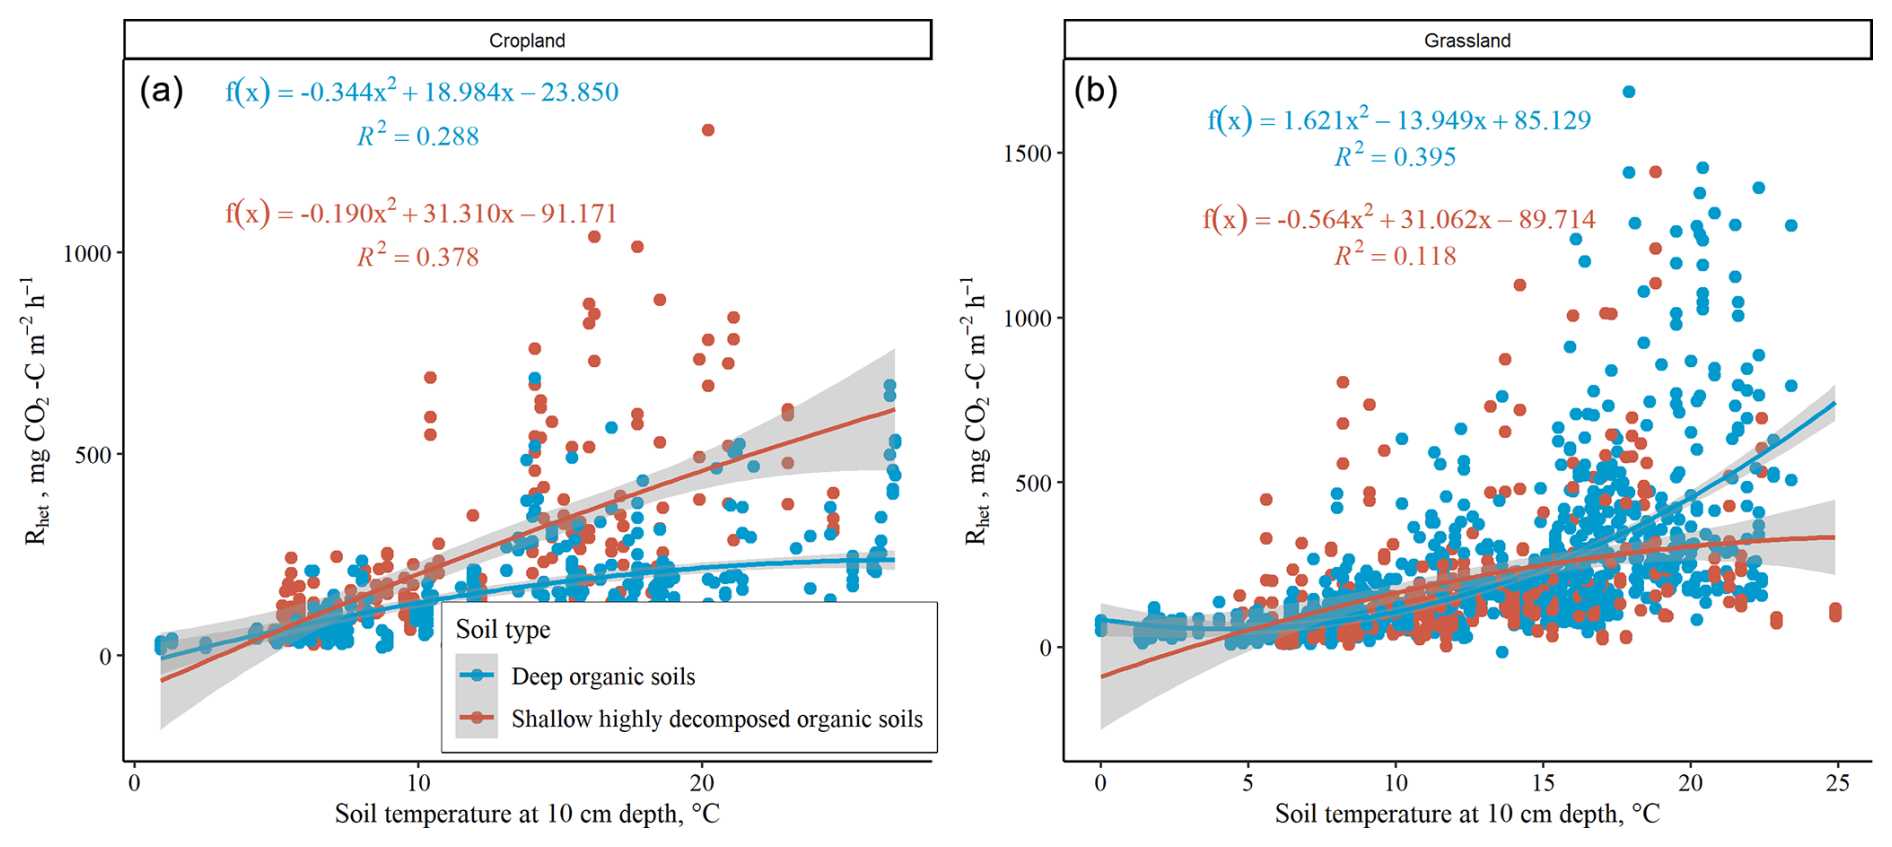
Figure 6Instantaneous soil heterotrophic respiration (Rhet) in croplands (a) and grasslands (b) as a function (polynomial regression) of the soil temperature at 10 cm depth. Data of instantaneous soil heterotrophic respiration are grouped depending on soil type (deep organic soil is denoted by the blue colour, and shallow highly decomposed organic soil is denoted by the red colour). The grey area around the regression line reflects the 95 % confidence interval.
3.4 Carbon stocks in and inputs into soil through vegetation
At the end of the growing season, the mean C stock in plant biomass (total including aboveground and belowground parts) was 4.94 ± 0.55 t C ha−1 in croplands and 3.65 ± 0.97 t C ha−1 in grasslands (Fig. 7). In croplands, the largest part of the C stock was in the aboveground biomass (91 % of total C stock; 4.50 ± 0.49 t C ha−1), while, in grasslands, a larger C stock was found in the belowground biomass (63 % of total C stock; 2.31 ± 0.78 t C ha−1) than in the aboveground part (1.26 ± 0.26 t C ha−1). Among the studied arable crops, the largest C stock in plant biomass (total) was estimated for maize (6.7 t C ha−1), and the lowest was estimated for spring wheat (2.3 t C ha−1, Fig. S15 in the Supplement).
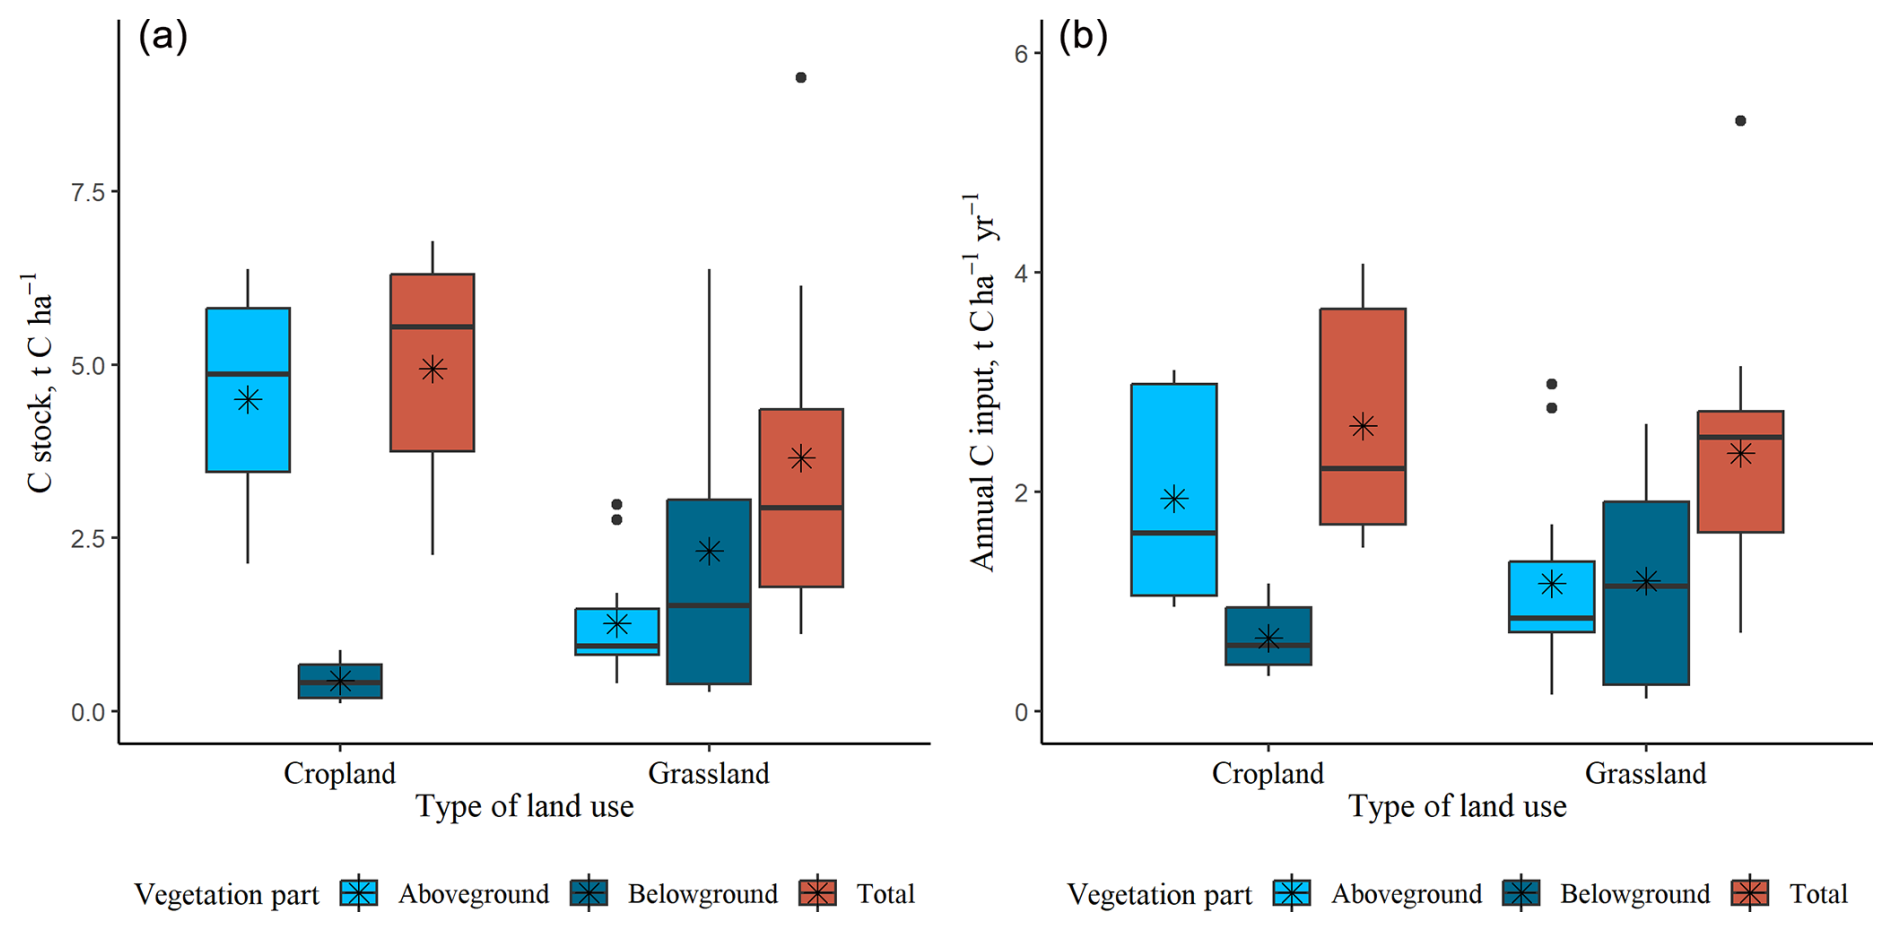
Figure 7Carbon (C) stock in aboveground and belowground plant biomass at the end of the growing season (a) and annual C inputs into the soil (b) in cropland and grassland ecosystems. In the boxplots, the median and mean values are presented by bold lines and asterisks, respectively. The boxes indicate the interquartile range (from 25th to 75th percentiles), the whiskers denote the minimum and maximum values, and the black dots show outliers.
The estimated mean annual C input (total including aboveground and belowground parts) was 2.65 ± 0.31 in croplands and 2.35 ± 0.36 in grasslands (Fig. 7). In croplands, the largest annual C input was aboveground harvest residues (74 % of total annual C input; 1.97 ± 0.34 ), while, in grasslands, the amount of belowground input (1.19 ± 0.27 ) was similar to the aboveground input (1.16 ± 0.26 ). The largest annual C input (total) was estimated for rape (4.1 ), and the lowest was estimated for spring wheat (1.5 , Fig. S15).
The mean concentrations of both C and N were higher in aboveground biomass compared to in belowground biomass, while the ratio was higher in belowground biomass for both arable crops and perennial grass (Table S5 in the Supplement).
3.5 Annual net CO2 fluxes
The annual net CO2 fluxes depended equally on both C losses and C inputs into soil, which both varied widely, though this was particularly the case with the C losses. The studied drained organic agricultural soils were all net sources of CO2; i.e. C losses due to the estimated soil heterotrophic respiration exceeded C inputs into the soil as plant residues (Table 3). The mean annual net CO2 emissions in croplands and grasslands were, overall, quite similar (p=0.270). In croplands, the mean annual net CO2 emissions were 4.8 ± 0.8 (all sites pooled); higher net emissions were observed for sites with shallow highly decomposed organic soils (7.0 ± 1.5 ) compared to for deep organic soils (4.1 ± 0.7 ). In grasslands, the mean annual net CO2 emissions were 3.8 ± 0.7 (all sites pooled), while, similarly to croplands, higher net emissions were observed for sites with shallow highly decomposed organic soils (mean 5.6 ± 2.1 ) compared to for deep organic soils (mean 3.2 ± 0.6 ). However, the differences in mean annual net CO2 emissions between deep organic soils and shallow highly decomposed organic soils were not statistically significant (p=0.143 for cropland sites and p=0.209 for grassland sites). It should be noted, however, that sites with shallow highly decomposed organic soil were relatively less represented in the study. The mean annual net CO2 emissions from deep-drained and shallow-drained study sites of grasslands were similar as well (p=0.889).
Table 3Annual ecosystem respiration (Reco), heterotrophic soil respiration (Rhet) estimated from Reco (64 % of annual Reco as described in Sect. 2.7), C input into soil as plant residues, and the estimated net soil CO2 emissions in croplands and grasslands in the Baltic countries in the hemiboreal region of Europe. The deep organic soils of the sites were either Histosols, Gleysols, or Phaeozems, while the shallow highly decomposed organic soils were either Gleysols, Phaeozems, or Umbrisols (WRB, 2015).
The contribution of winter (December–February) CO2 emissions to total annual Reco was, on average, 2.4 % in croplands and 3.2 % in grasslands, while the contribution of summer (June–August) CO2 emissions was, on average, 63.9 % in croplands and 60.3 % in grasslands.
Based on the comparative analysis done for the 10 study sites for which continuous temperature data were available, our annual Reco estimates were overestimated by a mean of 9 % because of the flux measurements all being done during the daytime (Fig. S16 in the Supplement).
This is the first regional study to estimate annual net soil CO2 fluxes from croplands and grasslands on drained organic soils in the hemiboreal region. Our study sites covered organic soils with a wide range in terms of both the thickness of the organic soil layer and the OC concentration in the topsoil (0–20 cm). Thus, we could examine separately deep organic soils and soils that we defined as shallow highly decomposed organic soils. Based on existing soil information, we argue that the soils of all our sites were originally (before drainage) deep peat soils. An OC concentration of 12 % in the 0–20 cm soil layer was set as the threshold value for the definition of organic soils by the IPCC (Eggleston et al., 2006), and so our soils with a shallow organic layer would not be classified as organic soils according to this definition. Yet, we recorded as high CO2 emissions from them as from the deep organic soils meeting this threshold. This supported the recent finding by Liang et al. (2024) of global underestimation of area-scaled CO2 emissions from drained organic soils undergoing the transition from organic to organo-mineral soils due to agricultural management.
All of the studied drained organic soils in croplands and grasslands were sources of CO2 emission into the atmosphere. In general, our results are in line with the tendency stated by the IPCC (Eggleston et al., 2006; Hiraishi et al., 2014) and several previous studies (Kasimir-Klemedtsson et al., 1997; Alm et al., 2007; Elsgaard et al., 2012; Fell et al., 2016) for mean annual net CO2 emissions in croplands to exceed the net emissions in grasslands. Within our study, this tendency was mainly related to the higher mean annual Reco and, subsequently, the estimated annual Rhet in croplands compared to in grasslands. Further, the belowground C inputs tended to be higher and the growing period tended to be longer under grass compared with arable crops. The slightly higher total C input into the soil as plant residues in croplands did not compensate for the higher Rhet. However, there was overlap in terms of the site-level values in croplands and grasslands, as has been noted in previous studies as well (Couwenberg, 2011).
Although our estimates may contain slight overestimations rather than underestimations, the mean annual net CO2 emissions of both croplands and grasslands with deep-drained organic soil were generally lower than the emission factors provided by the IPCC (Hiraishi et al., 2014) for nutrient-rich soils in the temperate and boreal zones (Table 4). The net CO2 emissions from shallow highly decomposed organic soils were, instead, rather similar to the IPCC emission factors. Our estimates of annual net CO2 emissions for grasslands with shallow-drained organic soils were in line with the IPCC emission factor, while, for deep-drained sites, our estimate was lower but within the confidence interval (Table 4). Interestingly, we found no difference in terms of annual net CO2 emissions between deep- and shallow-drained organic soils in grasslands, although the WTL was <30 cm in 69 % and <20 cm in 50 % of all measurement events in shallow-drained sites. Distinguishing between these is suggested by the IPCC (Hiraishi et al., 2014). Logically, WTL should regulate the thickness of the soil layer where efficient aerobic decomposition may take place and, thus, the CO2 flux. However, we only had two grassland sites with shallow-drained organic soils, which increases uncertainty in the respective emission estimates. Yet, based on current data, the same emission factor could be used for both deep- and shallow-drained grasslands in the hemiboreal region.
Table 4Comparison of estimated and IPCC (Hiraishi et al., 2014) default net CO2 emissions expressed as emission factors for drained nutrient-rich organic soils in croplands and grasslands.
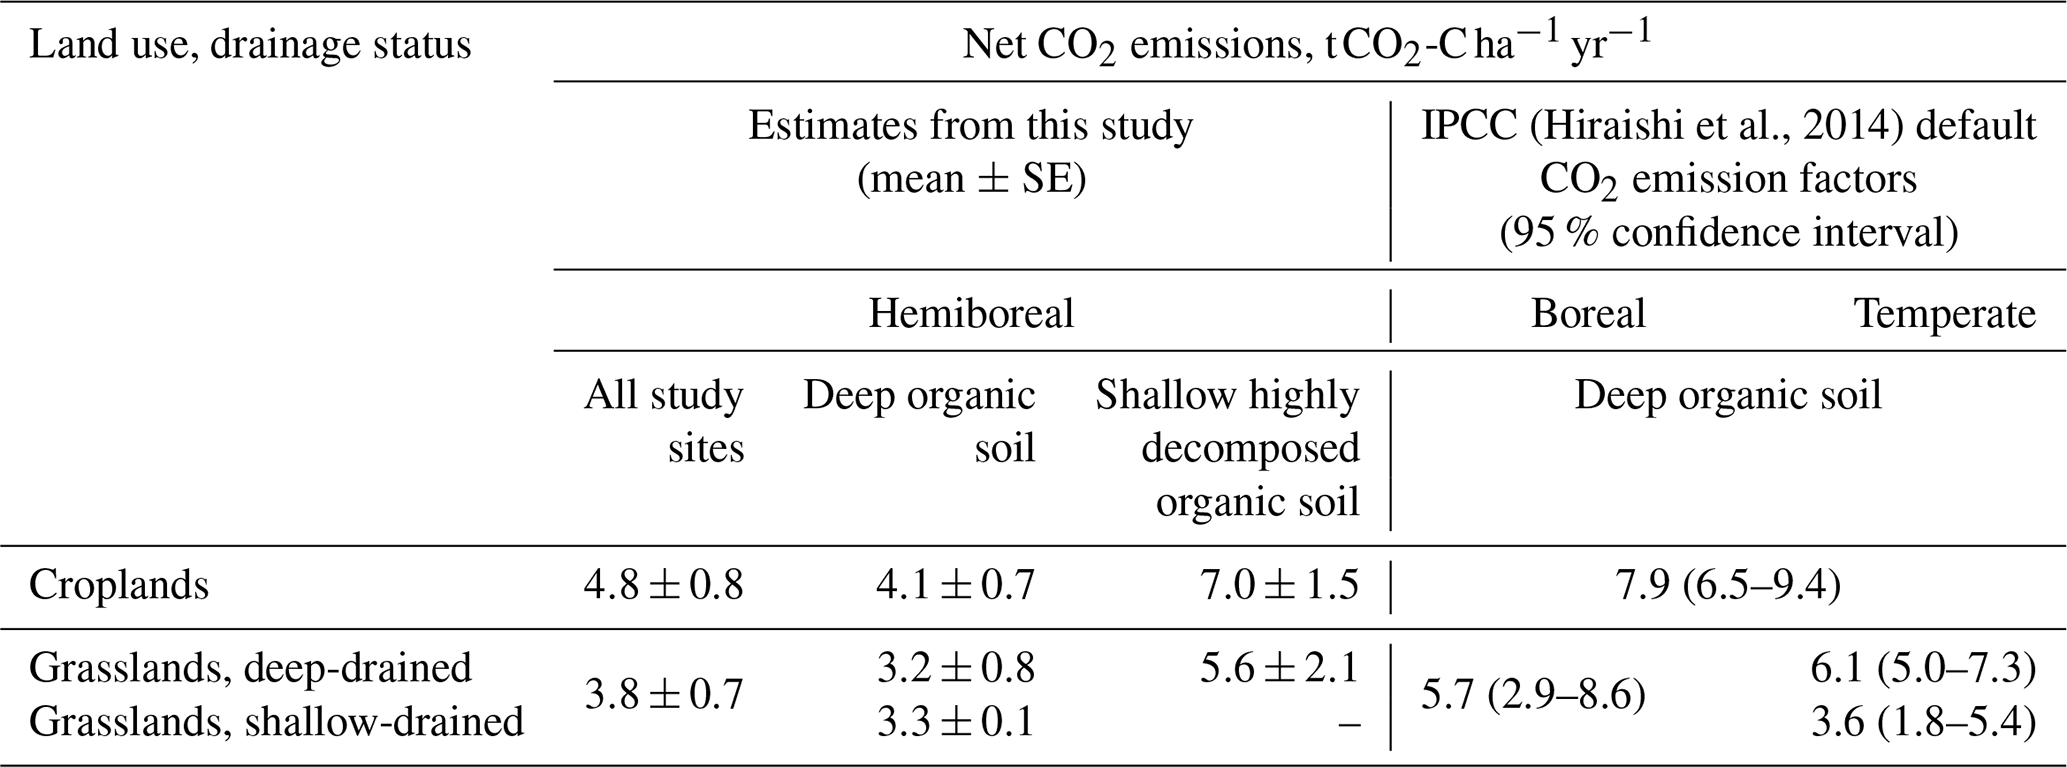
In the past decade, following the development of the latest IPCC default emission factors, several studies have been carried out in temperate and boreal regions, specifically in central and northern Europe. These studies have reported CO2 emission values that fall within or just beyond the 95 % confidence interval of the IPCC default CO2 emission factors (Hiraishi et al., 2014). For instance, mean C losses from drained organic soils of 6.45 were reported for arable land in Germany (Fell et al., 2016), while values between 3.1 and 7.55 were reported for drained organic soils in grasslands in Switzerland and Germany (Fell et al., 2016; Tiemeyer et al., 2016; Wang et al., 2021). In general, recent studies consistently underscored a notable variability, which can be attributed to the variations in climate and weather conditions; the peat chemistry and degree of decomposition; the time since establishment; and the maintenance measures of the drainage systems, WTL, and land management practices and their intensity, including cultivation methods and types of crops grown (Maljanen et al., 2010; Leifeld et al., 2011, Tiemeyer et al., 2016). However, it should also be noted that various methods for measuring or estimating soil C losses are employed across studies, including estimation of peatland subsidence, measuring CO2 fluxes using chamber methods or eddy covariance, and modelling (Kasimir-Klemedtsson et al., 1997; Fell et al., 2016), and all approaches contain some assumptions, advantages, and disadvantages which have to be considered (Kasimir-Klemedtsson et al., 1997; Maljanen et al., 2010; Phillips et al., 2017).
Although the CO2 emission factors elaborated upon here for croplands and grasslands with drained organic soils are regional in nature, covering the Baltic countries, they provide a general opportunity to improve national GHG inventories and fill knowledge gaps regarding the hemiboreal region of Europe. Further research is needed to elaborate upon dynamic temperature-dependent CO2 emission factors considering the fact that differences in terms of the responses of CO2 fluxes to temperature in different climatic subregions, even within the same region or country, are possible (Alm et al., 2007). In addition, elaboration upon CO2 emission factors in terms of accuracy would benefit from quantitative separation of Rhet from Reco in croplands and grasslands, where the annual production, rotation, and management of plant biomass are highly dynamic and where differences in the proportion of Rhet may be expected. Another aspect to pay attention to when assessing CO2 emissions in the long term, specifically in grasslands, is the impact of periodical ploughing of grasslands for renovation by reseeding – a widely used grassland management practice in the hemiboreal region of Europe. Such practices result in additional C inputs into the soil with belowground biomass (plant residues) and, consequently, can lead to increased Rhet (Reinsch et al., 2018). In our study, we did not assess the effects of grassland renovation on CO2 fluxes.
Our flux measurements covered both ecosystem respiration (Reco) and heterotrophic respiration (Rhet). Reco represented the gross respiration rate: CO2 produced by the plant–soil system, including soil heterotrophic respiration (aerobic and anaerobic decomposition processes and respiration of soil microorganisms and animals) and autotrophic respiration (CO2 produced by living plant roots and the associated rhizosphere, as well as by dark respiration of the plants' aboveground parts) (e.g. Maljanen et al., 2002, 2007). Both Reco and Rhet were primarily regulated by temperature, especially soil temperature at 10 cm depth. Thus, our results align with previous research indicating that soil temperature is the main driver of both ecosystem respiration (Nieveen et al., 2005; Elsgaard et al., 2012) and heterotrophic respiration derived from peat decomposition (Mäkiranta et al., 2009). For Reco, we were able to continue the measurements over the winter seasons. Due to cold temperatures, the contribution of winter (December–February) fluxes was minor, averaging 2 %–3 % in both grasslands and croplands. Nevertheless, CO2 released during winter cannot be disregarded when annual CO2 emissions are estimated, especially when the soil C balance is close to neutral.
Soil WTL has previously been found to be the overriding variable explaining GHG emissions when examining a wide range of unmanaged and managed peatlands (Evans et al., 2021). Somewhat surprisingly, we found no clear evidence that the variations in WTL and soil moisture would have an impact on the magnitude of CO2 fluxes. Yet, there were some indications of comparatively lower instantaneous Reco and Rhet under both very dry and water-saturated conditions as the relationship between Reco and WTL exhibited a downward-opening parabola. Similarly, no clear quantitative CO2 response to WTL among study sites with drained organic soils under agricultural management was found in some previous studies (Nieveen et al., 2005; Elsgaard et al., 2012; Tiemeyer et al., 2016), being explained by the rather deep WTL in the sites, indicating that a lack of moisture in the topmost soil layers may restrict Rhet. There is also some earlier evidence that soil moisture may have a parabolic influence on CO2 fluxes (e.g. Säurich et al., 2019a). Inconsistent results regarding WTL as a controlling variable of soil respiration can also be obtained due to different hydraulic conductivities of the studied soils (Parmentier et al., 2009). Soil moisture could, then, in principle, be a more suitable variable; however, our results do not support that either. Put together, our findings, along with those of previous studies, suggest that among drained and managed sites – where the mean WTL is generally deeper than 30 cm – WTL may not be the sole linear factor regulating the soil CO2 fluxes (Figs. S17 and S18 in the Supplement). However, several studies that include study sites with a wider range of mean WTL, including sites where WTL fluctuates close to the soil surface, present WTL-driven response functions (asymptotic relations) for CO2 emissions (Tiemeyer et al., 2020; Koch et al., 2023). These studies showed that CO2 emissions increase almost linearly with deeper WTL under shallow drainage (down to around the 40 cm threshold) before reaching an asymptotic level (Tiemeyer et al., 2020; Koch et al., 2023).
Higher Reco and Rhet were observed in shallow highly decomposed organic soil with OC concentrations of <12 % at the 0–20 cm soil layer compared to in deep organic soils meeting the threshold. This was particularly the case in croplands, where the difference was statistically significant. At the same time, no clear (strong and significant) correlation between mean Reco and Rhet and OC content in soil was identified. In general, our finding of higher Reco and Rhet in soils with a highly decomposed soil organic matter layer is not surprising because some previous studies have highlighted similar tendencies. For instance, Säurich et al. (2019b) concluded that the magnitude of soil-specific basal respiration (CO2 flux per unit SOC) increased with increasing soil disturbance caused by drainage-induced mineralisation and organic soil layer mixing with mineral soil (i.e. with lower soil OC concentration). Also, other previous studies (Leiber-Sauheitl et al., 2014; Eickenscheidt et al., 2015; Liang et al., 2024) highlighted that the magnitude of CO2 emissions from drained organic soils used for agriculture was not affected by OC concentration in the soil histic horizon. In contrast, Norberg et al. (2016) found significantly lower CO2 emissions from peaty marls with low total C concentrations (9.5 %–12.2 %) compared to from peats with much higher total C concentrations (27.2 %–42.8 %). However, our study improves the knowledge on soils that may have fulfilled the criteria of organic soil in the past but do not do so any more after long-term land use.
Based on the comparative analysis done at 10 sites, our annual Reco estimates were overestimated by a mean of 9 % as the flux measurements were all done during the daytime (Fig. S16). Previous studies have concluded that the mean CO2 flux during the daytime is 14 %–23 % higher than the mean daily fluxes (Maljanen et al., 2002). This is largely caused by diurnal variations in air temperature and, consequently, in soil temperature, which are intercorrelated variables. Thus, a regression describing variations in Reco depending on soil temperature could be used for further evaluations to avoid overestimation of Reco due to a lack of measurements during the nighttime. We did not revise our estimates as the comparison could only be done at 10 sites.
Contrarily to expectations, the magnitude of instantaneous Rhet tended to exceed the Reco at several study sites. This is inconsistent with the theoretical basis that Rhet is a part of Reco and that recorded values should thus be lower than those of Reco simultaneously. The observed inconsistency is most likely to be explained by methodological challenges. Measurement points established for Rhet involved trenching, vegetation removal, and keeping the soil surface bare. This may elevate the magnitude of Rhet firstly as a result of the higher temperature in bare soil than under vegetation. Further, soil moisture conditions may differ from those of vegetated soil. In permanent grasslands, emissions from decomposition of the roots killed by the trenching are likely to further contribute to Rhet. These aspects have also been discussed as challenges of root exclusion before (Hanson et al., 2000; Kuzyakov, 2006; Norberg et al., 2016; Savage et al., 2018). In general, previous studies on cultivated peat soils in central and southern Sweden suggest that the contribution of Rhet to cumulative total CO2 emission (ecosystem respiration) is in the range of 37 % to 73 % depending on the soil type, crop type, and season (Berglund et al., 2011, 2021; Norberg et al., 2016), while the mean proportion of Rhet from soil surface respiration is 64 % based on previous studies (n=61) conducted on agricultural land in temperate and boreal regions (Jian et al., 2021). Considering the above, we used Rhet values derived from the results of Reco for the estimation of annual Rhet and, subsequently, annual net CO2 emission from soil. Such an approach was applied to avoid overestimation of Rhet or C losses from soil. Yet, even the method that we used may result in overestimates as our Reco values exceed the soil surface respiration because they also account for the dark respiration of the aboveground plant biomass. This “additional” CO2 flux should logically be at its highest during late summer when the plants are fully developed. However, the share of aboveground autotrophic respiration in ecosystem respiration in croplands or grasslands has rarely been reported, and the published results vary widely and have relatively large uncertainties (Phillips et al., 2017). Consequently, we could not estimate how much it contributed to our ecosystem flux. The estimated mean annual C input into the soil with vegetation (residues of aboveground and belowground parts returned to the soil) was comparatively similar in croplands and grasslands, while the proportion of C input with aboveground and belowground litter differed – in croplands, significantly higher C input was from residues of the aboveground part of plants, while, in grasslands, even slightly higher C input was from belowground plant residues. Concerning plant residue inputs into soil, our results follow the previous finding that plant aboveground biomass tends to have a lower ratio and, therefore, tends to be more labile and decompose faster than its belowground counterparts (Almagro et al., 2021). At the same time, both the aboveground and belowground biomass of arable crops had a higher ratio than grass biomass, potentially indicating slower decomposition of residues in arable crops. Thus, differences in terms of the ratio of plant residues, as well as the proportion of residues of the plant aboveground and belowground parts, may introduce differences in terms of the response of soil microbial communities through altering decomposition and consequent OC incorporation in stable soil aggregates (Almagro et al., 2021). Nevertheless, previous findings have indicated that the total variation of CO2 emissions from drained organic soil exceeds the variation between different cropping systems, and, thus, the selection of certain arable crops has not become a viable option to reduce CO2 emissions from cultivated organic soils thus far (Norberg et al., 2016).
This study examined the CO2 fluxes and estimated annual net CO2 emissions from drained nutrient-rich organic soils (both deep organic soils and shallow highly decomposed organic soils) in croplands and grasslands in the Baltic countries (hemiboreal region of Europe). The intensity of both Reco and Rhet was strongly dependent on temperature (particularly soil temperature at 10 cm depth), while it was rather independent of water table fluctuations and soil moisture. Although the results obtained within this study may contain slight overestimations rather than underestimations, our estimates of annual net CO2 emissions in both croplands and grasslands were lower than the IPCC default emission factors for the temperate climate and/or vegetation zone (Hiraishi et al., 2014). This highlights the need to specify emission factors for smaller, climatically and perhaps geomorphologically more uniform regions rather than for the very wide regions for which the current emission factors are available. Mean annual net CO2 emissions from pooled data recorded in our study were 4.8 ± 0.8 in croplands and 3.8 ± 0.7 in grasslands, while the mean annual net CO2 emissions specifically for deep organic soil were 4.1 ± 0.7 in croplands and 3.2 ± 0.6 in grasslands. Both annual Reco and Rhet and the net CO2 emissions from shallow highly decomposed organic soils were of similar magnitude to or higher than those from deep organic soils. This result highlights the need to estimate the emissions from these highly transformed soils as organic soils rather than as mineral soils, even though they do not fulfil the current IPCC definition of organic soils (Eggleston et al., 2006). A clear advantage of our study was that we were able to include several sites where comparable measurements were carried out, which allows for rigorous inter-site comparison and a search for explanatory variables. However, we recommend both the continuation of data acquisition, including higher measurement intensity, and consequent further refinement of the first hemiboreal region-specific CO2 emission factors that we defined here for national GHG inventories.
Data used for the estimation of annual net CO2 fluxes are available at the following DOI: https://doi.org/10.5281/zenodo.14988737 (Latvian State Forest Research Institute “Silava”, 2024b). Additional data can be provided by the corresponding authors upon request.
The supplement related to this article is available online at https://doi.org/10.5194/bg-22-4241-2025-supplement.
Conceptualisation: AL, RL, JJ, and KS. Methodology: KS, JJ, AL, IO, and KA. Formal analysis: ArB and AlB. Investigation: AlB, DČ, AK, MM, IO, GRO, MKS, TS, HV, and EV. Resources: AL, KS, and KA. Writing (original draft): ArB. Writing (review and editing): all authors. Visualisation: ArB. Supervision: RL, JJ, KS, AL, KA, and IL. Project administration: IL. Funding acquisition: AL, KS, RL, JJ, KA, and IL.
The contact author has declared that none of the authors has any competing interests.
Publisher's note: Copernicus Publications remains neutral with regard to jurisdictional claims made in the text, published maps, institutional affiliations, or any other geographical representation in this paper. While Copernicus Publications makes every effort to include appropriate place names, the final responsibility lies with the authors.
The research was conducted within the framework of the project “Demonstration of climate change mitigation potential of nutrients-rich organic soils in the Baltic States and Finland” (grant no. LIFE OrgBalt, LIFE18 CCM/LV/001158). Additional data were acquired within the scope of the Norwegian Financial Mechanism 2014–2021 Program “Mitigation of Climate Change, Adaptation to Climate Change, and the Environment” under the pre-defined project “Enhancement of sustainable soil resource management in agriculture” (grant no. 2021/6e-JP/SAD (ZM NO. 2021/20)) and the European Union LIFE Programme project “Sustainable and responsible management and re-use of degraded peatlands in Latvia” (grant no. LIFE REstore, LIFE14 CCM/LV/001103). Ivika Ostonen was supported by the Estonian Research Council under grant no. PRG916. We thank all of the involved field work and laboratory teams for the work done to obtain the data and for the technical support.
This research has been supported by the LIFE programme (grant no. LIFE OrgBalt, LIFE18 CCM/LV/001158).
This paper was edited by Lutz Merbold and reviewed by Lars Elsgaard and one anonymous referee.
Ahti, T., Hämet-Ahti, L., and Jalas, J.: Vegetation zones and their sections in northwestern Europe, Ann. Bot. Fenn., 5, 169–211, 1968.
Alm, J., Shurpali, N. J., Minkkinen, K., Aro, L., Hytönen, J., Laurila, T., Lohila, A., Maljanen, M., Martikainen, P. J., Mäkiranta, P., Penttilä, T., Saarnio, S., Silvan, N., Tuittila, E.-S., and Laine, J.: Emission factors and their uncertainty for the exchange of CO2, CH4 and N2O in Finnish managed peatlands, Boreal Environ. Res., 12, 191–209, 2007.
Almagro, M., Ruiz-Navarro, A., Díaz-Pereira, E., Albaladejo, J., and Martínez-Mena, M.: Plant residue chemical quality modulates the soil microbial response related to decomposition and soil organic carbon and nitrogen stabilisation in a rainfed Mediterranean agroecosystem, Soil Biol. Biochem., 156, 108198, https://doi.org/10.1016/j.soilbio.2021.108198, 2021.
Bader, C., Müller, M., Schulin, R., and Leifeld, J.: Amount and stability of recent and aged plant residues in degrading peatland soils, Soil Biol. Biochem., 109, 167–175, https://doi.org/10.1016/j.soilbio.2017.01.029, 2017.
Bader, C., Müller, M., Schulin, R., and Leifeld, J.: Peat decomposability in managed organic soils in relation to land use, organic matter composition and temperature, Biogeosciences, 15, 703–719, https://doi.org/10.5194/bg-15-703-2018, 2018.
Berglund, Ö., Berglund, K., and Klemedtsson, L.: Plant-derived CO2 flux from cultivated peat soils, Acta Agr. Scand. B-S. P., 61, 508–513, https://doi.org/10.1080/09064710.2010.510121, 2011.
Berglund, Ö., Kätterer, T., and Meurer, K. H. E.: Emissions of CO2, N2O and CH4 from cultivated and set aside drained peatland in Central Sweden, Front. Environ. Sci., 9, 630721, https://doi.org/10.3389/fenvs.2021.630721, 2021.
Box, G. E. P. and Cox, D. R.: An analysis of transformations, J. R. Stat. Soc. B, 26, 211–243, https://doi.org/10.1111/j.2517-6161.1964.tb00553.x, 1964.
Climate Change Knowledge Portal: https://climateknowledge portal.worldbank.org/country/lithuania/climate-data-historical, last access: 7 July 2024.
Couwenberg, J.: Greenhouse gas emissions from managed peat soils: is the IPCC reporting guidance realistic?, Mires Peat, 8, 1–10, 2011.
Eggleston, H. S., Buendia, L., Miwa, K., Ngara, T., and Tanabe, K. (Eds.): 2006 IPCC Guidelines for National Greenhouse Gas Inventories, Prepared by the National Greenhouse Gas Inventories Programme, IGES, Japan, ISBN 4-88788-032-4, 2006.
Eickenscheidt, T., Heinichen, J., and Drösler, M.: The greenhouse gas balance of a drained fen peatland is mainly controlled by land-use rather than soil organic carbon content, Biogeosciences, 12, 5161–5184, https://doi.org/10.5194/bg-12-5161-2015, 2015.
Elsgaard, L., Gorres, C.-M., Hoffmann, C. C., Blicher-Mathiesen, G., Schelde, K., and Petersen, S. O.: Net ecosystem exchange of CO2 and carbon balance for eight temperate organic soils under agricultural management, Agr. Ecosyst. Environ., 162, 52–67, https://doi.org/10.1016/j.agee.2012.09.001, 2012.
Estonia's National GHG inventory: https://unfccc.int/ghg-inventories-annex-i-parties/2023 (last access: 22 July 2024), 2023.
European Environment Agency: Annual European Union greenhouse gas inventory 1990–2021 and inventory report 2023. Submission to the UNFCCC Secretariat, European Commission, DG Climate Action, European Environment Agency, Copenhagen, Denmark, 732 pp., 2023.
European Environment Agency: https://www.eea.europa.eu/publications/soil-carbon, last access: 23 July 2024.
Evans, C. D., Peacock, M., Baird, A. J., Artz, R. R. E., Burden, A., Callaghan, N., Chapman, P. J., Cooper, H. M., Coyle, M., Craig, E., Cumming, A., Dixon, S., Gauci, V., Grayson, R. P., Helfter, C., Heppell, C. M., Holden, J., Jones, D. L., Kaduk, J., Levy, P., Matthews, R., McNamara, N. P., Misselbrook, T., Oakley, S., Page, S. E., Rayment, M., Ridley, L. M., Stanley, K. M., Williamson, J. L., Worrall, F., and Morrison, R.: Overriding water table control on managed peatland greenhouse gas emissions, Nature, 593, 548–552, https://doi.org/10.1038/s41586-021-03523-1, 2021.
Fairbairn, L., Rezanezhad, F., Gharasoo, M., Parsons, C. T., Macrae, M. L., Slowinski, S., and Van Cappellen, P.: Relationship between soil CO2 fluxes and soil moisture: Anaerobic sources explain fluxes at high water content, Geoderma, 434, 116493, https://doi.org/10.1016/j.geoderma.2023.116493, 2023.
FAO: Drained organic soils 1990–2019. Global, regional and country trends, FAOSTAT Analytical Brief Series No. 4, Rome, Italy, 9 pp., 2020.
Fell, H., Roßkopf, N., Bauriegel, A., and Zeitz, J.: Estimating vulnerability of agriculturally used peatlands in north-East Germany to carbon loss based on multi-temporal subsidence data analysis, Catena, 137, 61–69, https://doi.org/10.1016/j.catena.2015.08.010, 2016.
Fetting, C.: The European Green Deal, ESDN Report, ESDN Office, Vienna, Austria, 22 pp., 2020.
Hanson, P. J., Edwards, N. T., Garten, C. T., and Andrews, J. A.: Separating root and soil microbial contributions to soil respiration: A review of methods and observations, Biogeochemistry, 48, 115–146, https://doi.org/10.1023/A:1006244819642, 2000.
Hiraishi, T., Krug, T., Tanabe, K., Srivastava, N., Baasansuren, J., Fukuda, M., and Troxler, T. (Eds.): 2013 Supplement to the 2006 IPCC Guidelines for National Greenhouse Gas Inventories: Wetlands, IPCC, Switzerland, ISBN 978-92-9169-139-5, 2014.
Houghton, J. T., Ding, Y., Griggs, D. J., Noguer, M., van der Linden, P. J., Dai, X., Maskell, K., and Johnson, C. A. (Eds.): Climate Change 2001: The scientific basis. Contribution of working group I to the third assessment report of the Intergovernmental Panel on Climate Change, Cambridge University Press, Cambridge, United Kingdom, New York, 881 pp., ISBN 0521807670 (hardback), ISBN 0521014956 (paperback), 2001.
Jian, J., Vargas, R., Anderson-Teixeira, K. J., Stell, E., Herrmann, V., Horn, M., Kholod, N., Manzon, J., Marchesi, R., Paredes, D., and Bond-Lamberty, B. P.: A709 Global Database of Soil Respiration Data, Version 5.0, Oak Ridge, Tennessee, USA, https://doi.org/10.3334/ORNLDAAC/1827, 2021.
Kasimir-Klemedtsson, Å., Klemedtsson, L., Berglund, K., Martikainen, P. J., Silvola, J., and Oenema, O.: Green-house gas emissions from farmed organic soils: a review, Soil Use Manage., 13, 245–250, https://doi.org/10.1111/j.1475-2743.1997.tb00595.x, 1997.
Koch, J., Elsgaard, L., Greve, M. H., Gyldenkærne, S., Hermansen, C., Levin, G., Wu, S., and Stisen, S.: Water-table-driven greenhouse gas emission estimates guide peatland restoration at national scale, Biogeosciences, 20, 2387–2403, https://doi.org/10.5194/bg-20-2387-2023, 2023.
Kuzyakov, Y.: Sources of CO2 efflux from soil and review of partitioning methods, Soil Biol. Biochem., 38, 425–448, https://doi.org/10.1016/j.soilbio.2005.08.020, 2006.
Latvian State Forest Research Institute “Silava”: Above and below ground biomass and carbon content in the most common farm crops in Latvia, Zenodo [data set], https://doi.org/10.5281/zenodo.12820657, 2024a.
Latvian State Forest Research Institute “Silava”: Annual net CO2 fluxes from drained organic soils used for agriculture in the hemiboreal region of Europe, Zenodo [data set], https://doi.org/10.5281/zenodo.14988737, 2024b.
Latvia's National GHG inventory: https://unfccc.int/ghg-inventories-annex-i-parties/2023 (last access: 22 July 2024), 2023.
Leiber-Sauheitl, K., Fuß, R., Voigt, C., and Freibauer, A.: High CO2 fluxes from grassland on histic Gleysol along soil carbon and drainage gradients, Biogeosciences, 11, 749–761, https://doi.org/10.5194/bg-11-749-2014, 2014.
Leifeld, J., Müller, M., and Fuhrer, J.: Peatland subsidence and carbon loss from drained temperate fens, Soil Use Manage., 27, 170–176, https://doi.org/10.1111/j.1475-2743.2011.00327.x, 2011.
Liang, Z., Hermansen, C., Weber, P. L. Pesch, C., Greve, M. H., de Jonge, L. W., Mäenpää, M., Leifeld, J., and Elsgaard, L.: Underestimation of carbon dioxide emissions from organic-rich agricultural soils, Commun. Earth Environ., 5, 286, https://doi.org/10.1038/s43247-024-01459-8, 2024.
Lithuania's National GHG inventory: https://unfccc.int/ghg-inventories-annex-i-parties/2023 (last access: 22 July 2024), 2023.
Lohila, A., Aurela, M., Tuovinen, J.-P., and Laurila, T.: Annual CO2 exchange of a peat field growing spring barleyor perennial forage grass, J. Geophys. Res., 109, D18116, https://doi.org/10.1029/2004JD004715, 2004.
Magnusson, B., Näykki, T., Hovind, H., Krysell, M., and Sahlin, E.: Handbook for Calculation of Measurement Uncertainty in Environmental Laboratories, Nordtest Report TR 537, 4th edn., 2017.
Mäkiranta, P., Laiho, R., Fritze, H., Hytönen, J., Laine, J., and Minkkinen, K.: Indirect regulation of heterotrophic peat soil respiration by water level via microbial community structure and temperature sensitivity, Soil Biol. Biochem., 41, 695–703, https://doi.org/10.1016/j.soilbio.2009.01.004, 2009.
Maljanen, M., Martikainen, P. J., Aaltonen, H., and Silvola, J.: Short-term variation in fluxes of carbon dioxide, nitrous oxide and methane in cultivated and forested organic boreal soils, Soil Biol. Biochem., 34, 577–584, https://doi.org/10.1016/S0038-0717(01)00213-9, 2002.
Maljanen, M., Hytönen, J., Mäkiranta, P., Alm, J., Minkkinen, K., Laine, J., and Martikainen, P. J.: Greenhouse gas emissions from cultivated and abandoned organic croplands in Finland, Boreal Environ. Res., 12, 133–140, 2007.
Maljanen, M., Sigurdsson, B. D., Guðmundsson, J., Óskarsson, H., Huttunen, J. T., and Martikainen, P. J.: Greenhouse gas balances of managed peatlands in the Nordic countries – present knowledge and gaps, Biogeosciences, 7, 2711–2738, https://doi.org/10.5194/bg-7-2711-2010, 2010.
Minasny, B., Malone, B. P., McBratney, A. B., Angers, D. A., Arrouays, D., Chambers, A., Chaplot, V., Chen, Z.-S., Cheng, K., Das, B. S., Field, D. J., Gimona, A., Hedley, C. B., Hong, S. Y., Mandal, B., Marchant, B. P., Martin, M., McConkey, B. G., Mulder, V. L., O'Rourke, S., Richer-de-Forges, A. C., Odeh, I., Padarian, J., Paustian, K., Pan, G., Poggio, L., Savin, I., Stolbovoy, V., Stockmann, U., Sulaeman, Y., Tsui, C.-C., Vågen, T.-G., van Wesemael, B., and Winowiecki, L.: Soil carbon 4 per mille, Geoderma, 292, 59–86, https://doi.org/10.1016/j.geoderma.2017.01.002, 2017.
Nieveen, J. P., Campbell, D. I., Schipper, L. A., and Blair, I. J.: Carbon exchange of grazed pasture on a drained peat soil, Glob. Change Biol., 11, 607–618, https://doi.org/10.1111/j.1365-2486.2005.00929.x, 2005.
Norberg, L., Berglund, Ö., and Berglund, K.: Seasonal CO2 emission under different cropping systems on Histosols in southern Sweden, Geoderma Regional, 7, 338–345, https://doi.org/10.1016/j.geodrs.2016.06.005, 2016.
Nykänen, H., Alm, J., Lång, K., Silvola, J., and Martikainen, P. J.: Emissions of CH4, N2O and CO2 from a virgin fen and a fen drained for grassland in Finland, J. Biogeogr., 22, 351–357, 1995.
Oleszczuk, R., Regina, K., Szajdak, L., Höper, H., and Maryganova, V.: Impact of agricultural utilisation of peat soils on the greenhouse gas balance, in: Peatlands and climate change, edited by: Strack, M., International Peat Society, Jyväskylä, Finland, 70–91, ISBN 978-952-99401-1-0, 2008.
Palosuo, T., Heikkinen, J., and Regina, K.: Method for estimating soil carbon stock changes in Finnish mineral cropland and grassland soils, Carbon Manag., 6, 207–220, https://doi.org/10.1080/17583004.2015.1131383, 2015.
Parmentier, F. J. W., van der Molen, M. K., de Jeu, R. A. M., Hendriks, D. M. D., and Dolman, A. J.: CO2 fluxes and evaporation on a peatland in the Netherlands appear not affected by water table fluctuations, Agr. Forest Meteorol., 149, 1201–1208, https://doi.org/10.1016/j.agrformet.2008.11.007, 2009.
Phillips, C. L., Bond-Lamberty, B., Desai, A. R. Lavoie, M., Risk, D., Tang, J., Todd-Brown, K., and Vargas, R.: The value of soil respiration measurements for interpreting and modeling terrestrial carbon cycling, Plant Soil, 413, 1–25, https://doi.org/10.1007/s11104-016-3084-x, 2017.
Pribyl, D. W.: A critical review of the conventional SOC to SOM conversion factor, Geoderma, 156, 75–83, https://doi.org/10.1016/j.geoderma.2010.02.003, 2010.
R Core Team: https://www.r-project.org/contributors.html, last access: 23 July 2024.
Reinsch, T., Loges, R., Kluß, C., and Taube, F.: Effect of grassland ploughing and reseeding on CO2 emissions and soil carbon stocks, Agr. Ecosyst. Environ., 265, 374–383, https://doi.org/10.1016/j.agee.2018.06.020, 2018.
Säurich, A., Tiemeyer, B., Dettmann, U., and Don, A.: How do sand addition, soil moisture and nutrient status influence greenhouse gas fluxes from drained organic soils?, Soil Biol. Biochem., 135, 71–84, https://doi.org/10.1016/j.soilbio.2019.04.013, 2019a.
Säurich, A., Tiemeyer, B., Don, A., Fiedler, S., Bechtold, M., Amelung, W., and Freibauer, A.: Drained organic soils under agriculture – The more degraded the soil the higher the specific basal respiration, Geoderma, 355, 113911, https://doi.org/10.1016/j.geoderma.2019.113911, 2019b.
Savage, K. E., Davidson, E. A., Abramoff, R. Z., Finzi, A. C., and Giasson, M.-A.: Partitioning soil respiration: quantifying the artifacts of the trenching method, Biogeochemistry, 140, 53–63, https://doi.org/10.1007/s10533-018-0472-8, 2018.
Tang, X., Du, J., Shi, Y., Lei, N., Chen, G., Cao, L., and Pei, X.: Global patterns of soil heterotrophic respiration – A meta-analysis of available dataset, Catena, 191, 104574, https://doi.org/10.1016/j.catena.2020.104574, 2020a.
Tang, X., Pei, X., Lei, N., Luo, X., Liu, L., Shi, L., Chen, G., and Liang, J.: Global patterns of soil autotrophic respiration and its relation to climate, soil and vegetation characteristics, Geoderma, 369, 114339, https://doi.org/10.1016/j.geoderma.2020.114339, 2020b.
Tiemeyer, B., Albiac Borraz, E., Augustin, J., Bechtold, M., Beetz, S., Beyer, C., Drösler, M., Ebli, M., Eickenscheidt, T., Fiedler, S., Förster, C., Freibauer, A., Giebels, M., Glatzel, S., Heinichen, J., Hoffmann, M., Höper, H., Jurasinski, G., Leiber-Sauheitl, K., Peichl-Brak, M., Roßkopf, N., Sommer, M., and Zeitz, J.: High emissions of greenhouse gases from grasslands on peat and other organic soils, Glob. Change Biol., 22, 4134–4149, https://doi.org/10.1111/gcb.13303, 2016.
Tiemeyer, B., Freibauer, A., Albiac Borraz, E., Augustin, J., Bechtold, M., Beetz, S., Beyer, C., Ebli, M., Eickenscheidt, T., Fiedler, S., Förster, C., Gensior, A., Giebels, M., Glatzel, S., Heinichen, J., Hoffmann, M., Höper, H., Jurasinski, G., Laggner, A., Leiber-Sauheitl, K., Peichl-Brak, M., and Drösler, M.: A new methodology for organic soils in national greenhouse gas inventories: Data synthesis, derivation and application, Ecol. Indic., 109, 105838, https://doi.org/10.1016/j.ecolind.2019.105838, 2020.
Tubiello, F. N., Salvatore, M., Ferrara, A. F., House, J., Federici, S., Rossi, S., Biancalani, R., Golec, R. D. C., Jacobs, H., Flammini, A., Prosperi, P., Cardenas-Galindo, P., Schmidhuber, J., Sanz Sanchez, M. J., Srivastava, N., and Smith, P.: The contribution of agriculture, forestry and other land use activities to global warming, 1990–2012, Glob. Change Biol., 21, 2655–2660, https://doi.org/10.1111/gcb.12865, 2015.
Tubiello, F. N., Biancalani, R., Salvatore, M., Rossi, S., and Conchedda, G.: A worldwide assessment of greenhouse gas emissions from drained organic soils, Sustainability-Basel, 8, 371, https://doi.org/10.3390/su8040371, 2016.
UNFCCC: Adoption of the Paris Agreement, the 21st Conference of the Parties, United Nations, Paris, France, 2015.
Wang, Y., Paul, S. M., Jocher, M., Espic, C., Alewell, C., Szidat, S., and Leifeld, J.: Soil carbon loss from drained agricultural peatland after coverage with mineral soil, Sci. Total Environ., 800, 149498, https://doi.org/10.1016/j.scitotenv.2021.149498, 2021.
WRB: World Reference Base for Soil Resources 2014, update 2015, International soil classification system for naming soils and creating legends for soil maps, World Soil Resources Reports No. 106, FAO, Rome, Italy, 192 pp., ISBN 978-92-5-108369-7, e-ISBN 978-92-5-108370-3, 2015.
Wüst-Galley, C., Grünig, A., and Leifeld, J.: Land use-driven historical soil carbon losses in Swiss peatlands, Landscape Ecol., 35, 173–187, https://doi.org/10.1007/s10980-019-00941-5, 2020.