the Creative Commons Attribution 4.0 License.
the Creative Commons Attribution 4.0 License.
 | 01 Sep 2025
Triple oxygen isotope evidence for the pathway of nitrous oxide production in a forested soil with increased emission on rainy days
Urumu Tsunogai
Tianzheng Huang
Takashi Sambuichi
Wenhua Ruan
Masanori Ito
Hao Xu
Yongwon Kim
Fumiko Nakagawa
Continuous increases in atmospheric nitrous oxide (N2O) concentrations are a global concern. Both nitrification and denitrification are the major pathways of N2O production in soil, one of the most important sources of tropospheric N2O. The 17O excess (Δ17O) of N2O can be a promising signature for identifying the main pathway of N2O production in soil. However, reports on Δ17O are limited. Thus, we determined temporal variations in the Δ17O of N2O emitted from forested soil for more than one year and that of soil nitrite (NO), which is a possible source of O atoms in N2O. We found that N2O emitted from the soil exhibited significantly higher Δ17O values on rainy days (+0.12 ± 0.13 ‰) than on fine days (−0.30 ± 0.09 ‰), and the emission flux of N2O was significantly higher on rainy days (38.8 ± 28.0 µg N m−2 h−1) than on fine days (3.8 ± 3.1 µg N m−2 h−1). Because the Δ17O values of N2O emitted on rainy and fine days were close to those of soil NO (+0.23 ± 0.12 ‰) and O2 (−0.44 ‰), we concluded that although nitrification was the main pathway of N2O production in the soil on fine days, denitrification became active on rainy days, resulting in a significant increase in the emission flux of N2O. This study reveals that the main pathway of N2O production can be identified by precisely determining the Δ17O values of N2O emission from soil and by comparing the Δ17O values with those of NO, O2, and H2O in the soil.
- Article
(3416 KB) - Full-text XML
-
Supplement
(1014 KB) - BibTeX
- EndNote


Nitrous oxide (N2O) is a strong greenhouse gas and an essential substance in stratospheric ozone depletion (Dickinson and Cicerone, 1986). Since pre-industrial times, the atmospheric N2O level has increased by 24 % to 335.8 ppb, with an average growth rate of 1.05 ppb yr−1 in the last decade (WMO, 2023). Terrestrial soils account for approximately 60 % of total N2O emissions (Tian et al., 2020). Therefore, better knowledge of the pathways of N2O production in soils is required to establish mitigation measures.
Both nitrification and denitrification are representative microbial pathways of N2O production in soils (Wrage et al., 2001). Nitrification is the oxidation of ammonium (NH) to nitrate (NO) via aerobic microbial activity, during which N2O is produced as a byproduct of hydroxylamine (NH2OH) oxidation to nitrite (NO), while denitrification is the reduction of NO to NO and then to N2O which is further reduced to nitrogen (N2) via facultative anaerobes (Fig. 1). Soil conditions such as moisture content, O2 availability (Bateman and Baggs, 2005; Zhu et al., 2013), temperature (Luo et al., 2007), and fertilizer types (Zhu et al., 2013) have been proposed as parameters to determine the pathways of N2O production in soils.
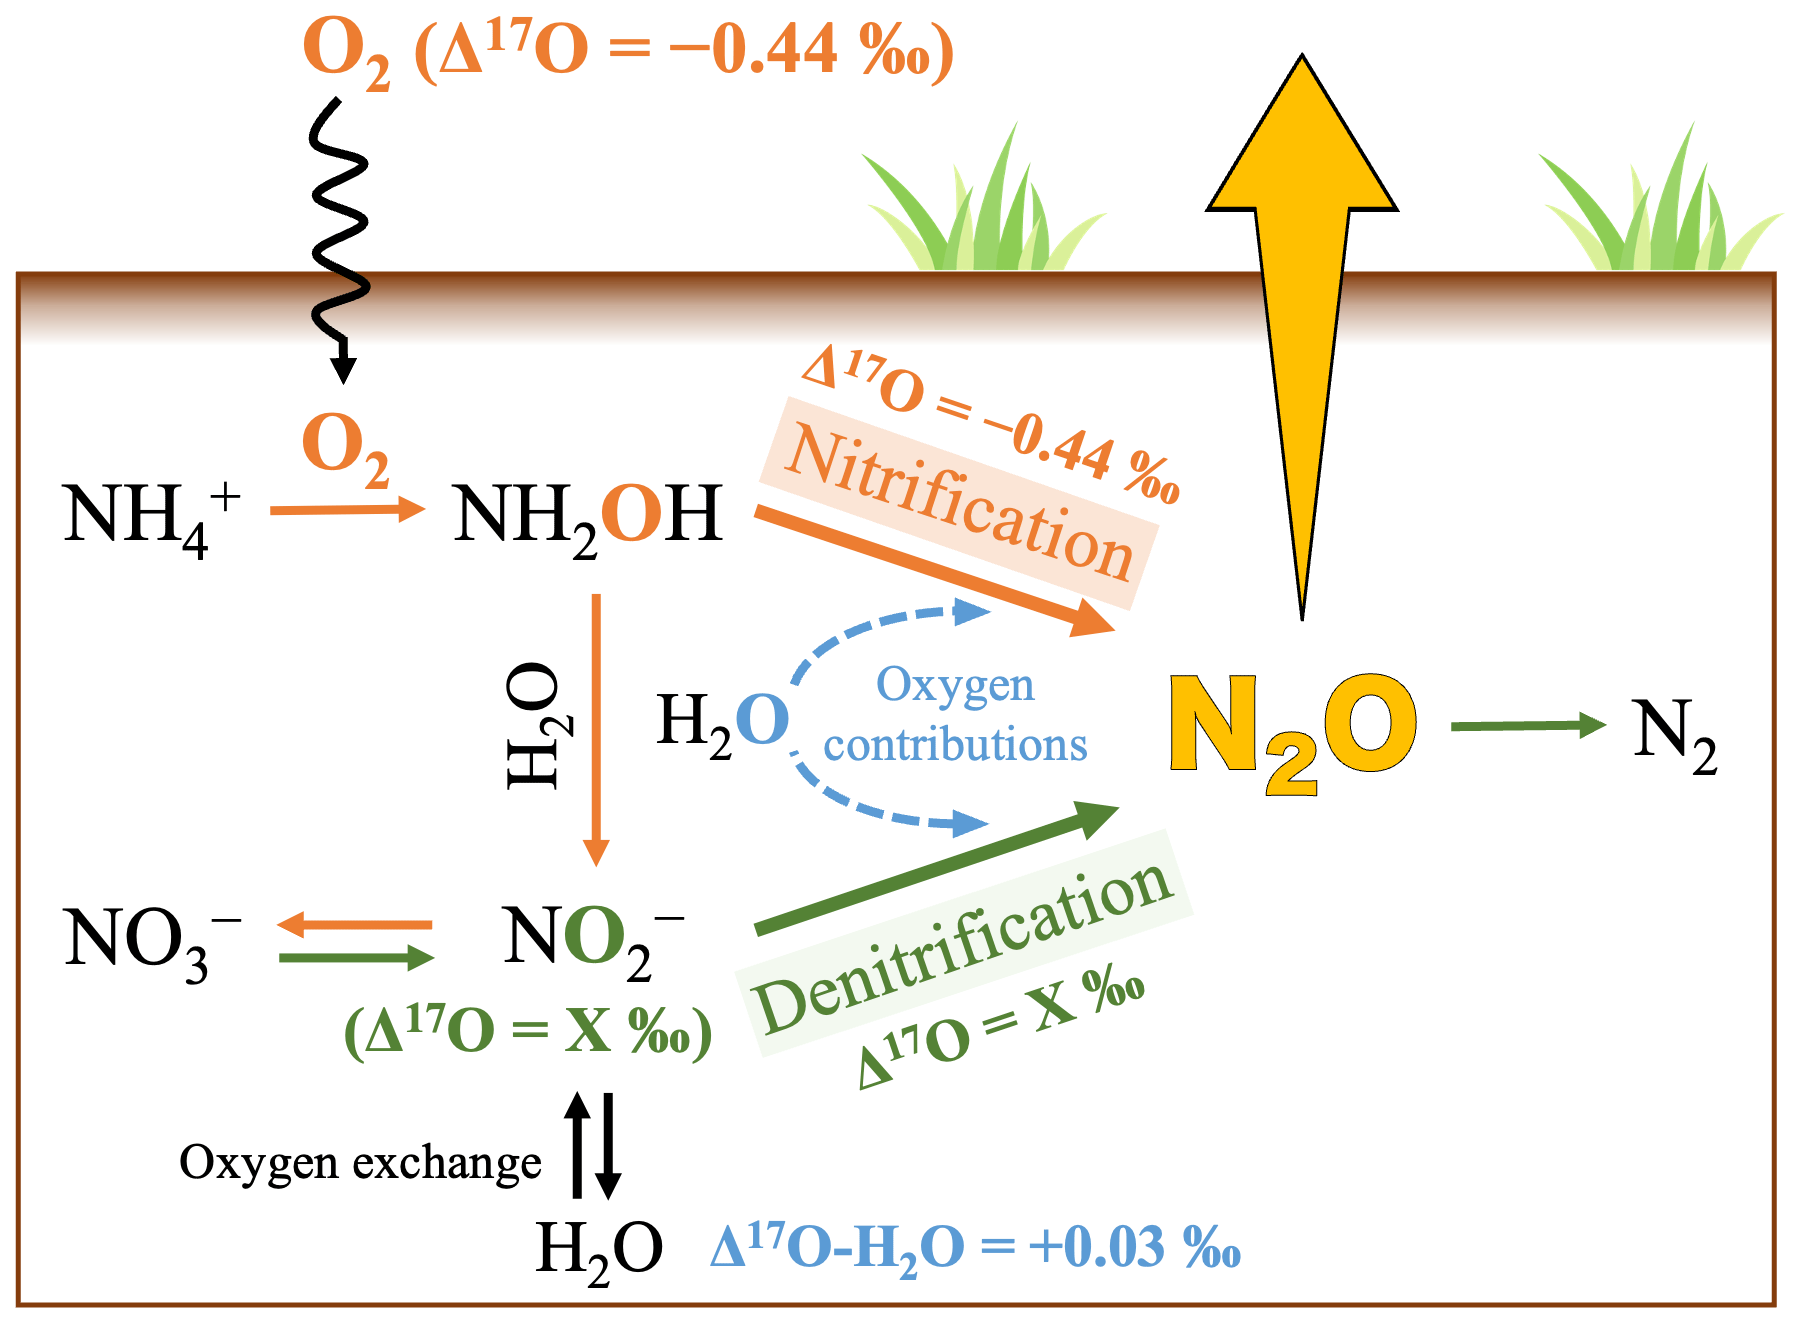
Figure 1Schematic showing the pathways of N2O production in soil (Kool et al., 2007, 2011; Wankel et al., 2017; Wrage et al., 2005) and the Δ17O values of O2 (Sharp et al., 2016), NO, and H2O (Uechi and Uemura, 2019). The orange lines, green lines, and blue dash lines indicate the processes of nitrification, denitrification, and the possible contributions of O atoms derived from soil H2O through nitrification and denitrification, respectively.
Techniques such as acetylene blockage (Balderston et al., 1976; Lin et al., 2019), artificial isotope tracers (15N and 18O) (Mulvaney and Kurtz, 1982; Wrage et al., 2004), and natural stable isotopes (Toyoda et al., 2013; Yu et al., 2020) are conventionally used to identify the pathways of N2O production via nitrification and denitrification. Both acetylene blockage and artificial isotope tracers are mostly performed in laboratory (in vitro) incubations because they are costly, complicated, and time-consuming in field research. Natural stable isotopes such as δ15N, δ18O, and SP (15N site preference) can be used to identify the pathways of N2O production in soils (Decock and Six, 2013; Toyoda et al., 2017; Verhoeven et al., 2019). However, further reduction of N2O to N2 after the production of N2O until emission from soil to air results in significant changes in the δ15N, δ18O, and SP values of N2O due to the fractionation of isotopes, which makes the identification process difficult (Ostrom et al., 2007).
Recent studies on the Δ17O value of NO (the definition detailed in Sect. 2.4) have reported that Δ17O is a useful natural signature for clarifying the complicated biogeochemical processes in terrestrial ecosystems (Ding et al., 2022, 2023, 2024; Michalski et al., 2004; Tsunogai et al., 2010). Although the values of δ15N, δ18O, and SP can vary during various fractionation processes of isotopes within terrestrial ecosystems, the Δ17O value remains almost stable because possible variations in δ17O and δ18O values during the processes of biogeochemical isotope fractionation follow the relation of δ17O ≈ 0.5 δ18O, which cancels out the variations in the Δ17O value (Young et al., 2002). Consequently, the mixing of the same oxygen compounds with different Δ17O values is the primary cause of variations in Δ17O values throughout the biogeochemical processes in terrestrial ecosystems.
Because N2O produced through nitrification is a byproduct of the oxidation reaction between NH (to NH2OH) and O2, the Δ17O value of N2O produced through nitrification is expected to be close to that of tropospheric O2 (Fig. 1) (Kool et al., 2007, 2011; Wrage et al., 2005), with previous studies reporting a Δ17O value of −0.44 ‰ (Sharp and Wostbrock, 2021). Conversely, the Δ17O value of N2O produced through denitrification is expected to be close to that of NO (Fig. 1) (Kool et al., 2007, 2011; Wankel et al., 2017; Wrage et al., 2005). Because O atoms in NO are derived from either soil NO (Δ17O = from 0 ‰ to +20 ‰) or H2O (Δ17O = +0.03 ± 0.01 ‰) (Hattori et al., 2019; Nakagawa et al., 2018; Uechi and Uemura, 2019), significant differences in Δ17O values between N2O produced through nitrification and that produced through denitrification are expected if the additional contributions of O atoms derived from soil H2O are insignificant in N2O during the processes of N2O production in soils through nitrification and denitrification (Fig. 1) (Kool et al., 2007).
Previous studies have identified the elevated Δ17O values in atmospheric N2O (Δ17O ≈ +0.9 ‰), observed in both stratospheric and tropospheric air (Cliff et al., 1999; Kaiser et al., 2003; Thiemens and Trogler, 1991). Komatsu et al. (2008) subsequently conducted the first Δ17O measurements of N2O emitted from a soil to assess whether soil N2O could be the source of elevated Δ17O values of atmospheric N2O. However, the temporal variations of the Δ17O values for N2O emitted from soil remain unknown. Whether Δ17O values of N2O can be used to identify the pathways of N2O production in soils has not been discussed. In addition, the advantages of Δ17O signature, relative to other natural stable isotopes, for identifying the pathways of N2O production remain unclear. To address these, in this study, we measured precise Δ17O values for N2O emitted from forested soil and those for NO in the soil. Further, we conducted similar observations in the same soil artificially fertilized with Chile saltpeter or urea to investigate the possible contributions of O atoms derived from soil H2O in N2O during N2O production.
2.1 Study site
The study site was located in a secondary warm-temperate forest within an urban area (35°10′ N, 136°58′ E, Fig. 2), approximately 50 m from the common building of the Graduate School of Environmental Studies at Nagoya University. The lowest, highest, and mean monthly temperatures recorded at the nearest meteorological station (Nagoya station) were 5.2 °C (in January), 28.9 °C (in July), and 18.5 °C, respectively, from April 2022 to July 2023. The annual mean precipitation was approximately 1800 mm. The soil stratum in the forested field possessed an approximate depth of 20 cm, characterized by a bulk density of 1.12 g cm−3. Details of the forest have been described in the previous study (Hiyama et al., 2005).
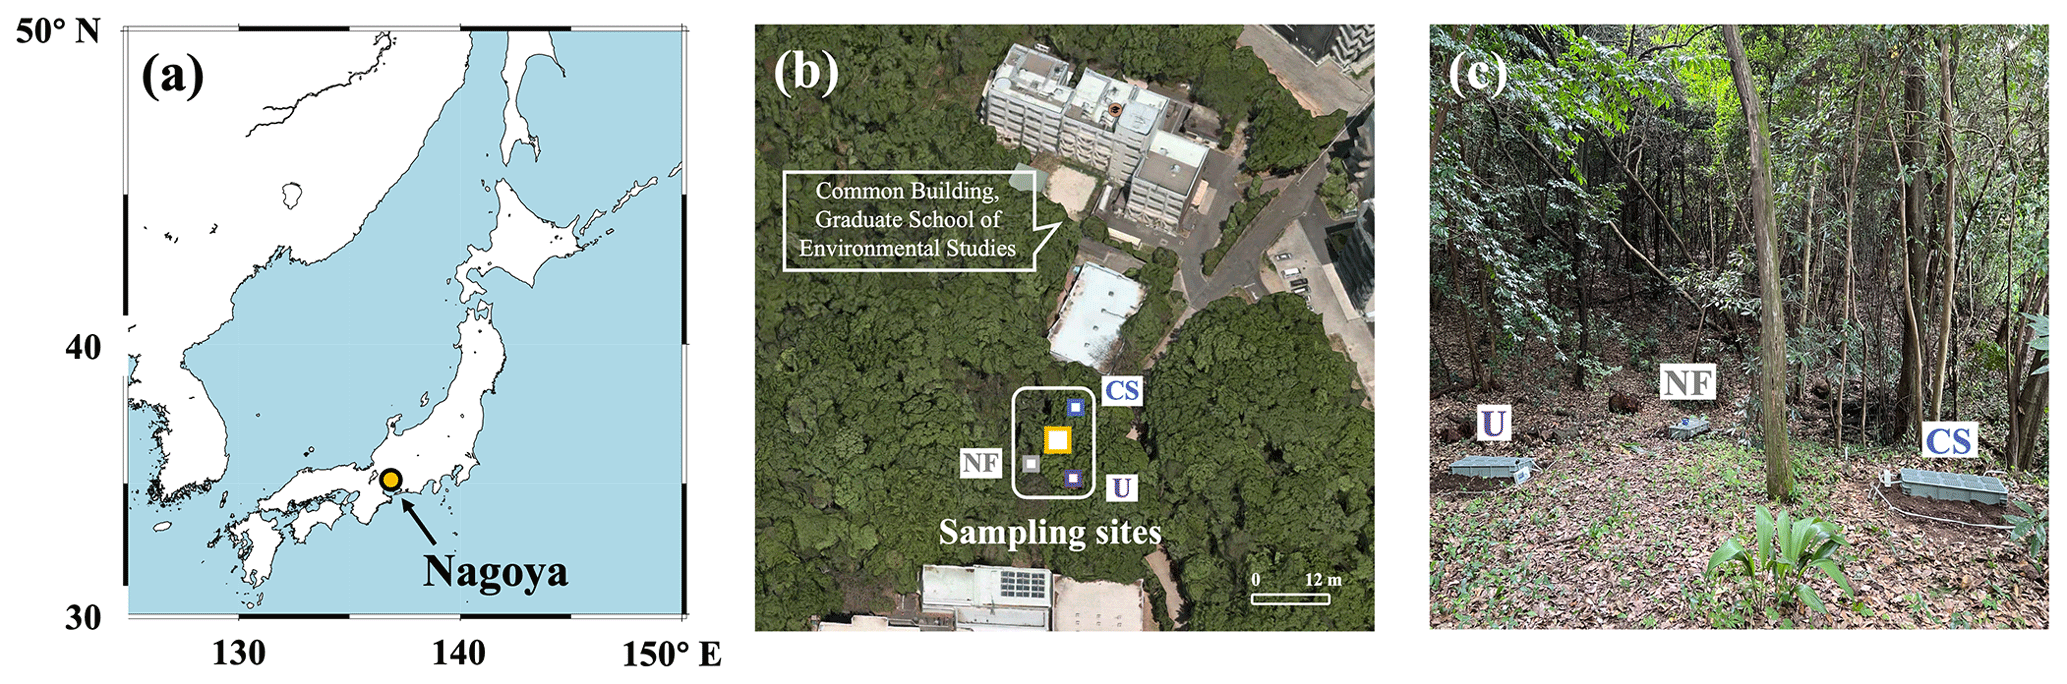
Figure 2Map showing the location of Nagoya, Japan, where the studied site is located (a). Map showing the monitoring site of N2O emitted from forested soil in a secondary warm-temperate forest (yellow square) and the plots fertilized with Chile saltpeter (CS, blue square), urea (U, purple square), and no fertilizer (NF, gray square) (b). Photo showing the plots and flow chambers set on the plots (c).
2.2 Sampling of N2O
Samples of N2O emitted from the forested soil under natural conditions were collected 18 times (n=18) from April 2022 to July 2023 in a field with an area of 5 m2 (Fig. 2b). Among the samples, 12 were collected on fine days, whereas 6 were collected on rainy days. A fine day is defined as a day without precipitation for 48 h prior to the end of each sampling. The total precipitation within 12 h at the end of each sampling of the rainy days exceeded 12 mm.
The sampling of N2O emitted from the artificially fertilized soil was performed during a period of fine weather in three plots (1 m2 for each located more than 5 m away from each other) within the same forested field, located approximately 3 m away from the plot where we conducted the sampling under natural conditions (Fig. 2b and c). Either urea (CO(NH2)2, 46 % TN) or Chile saltpeter (KNO3, 14 % TN) was applied to two of the plots (U and CS plots) on 16 July 2023 at the same N amount of 250 kg N ha−1. Urea is a synthetic N fertilizer (Sun and Hope Ltd., Japan), and Chile saltpeter (SQM Ltd., USA) contains NO with a high Δ17O value of +19 ‰ (determined through the internationally distributed isotope reference materials USGS-34 and USGS-35). The third plot was blank, meaning no fertilizer was added (NF plot). Sampling of N2O from each plot was performed twice on days 2 and 6 after the addition of each fertilizer.
To precisely determine Δ17O of N2O, more than 60 nmol of N2O is required (Komatsu et al., 2008), which corresponds to more than 4 L of air containing N2O at atmospheric concentrations. Accordingly, in this study, a flow chamber made of polypropylene with dimensions of 0.8 m × 0.3 m × 0.18 m was deployed onto the sampling site throughout each day of sampling (Fig. S1). This chamber has an inlet and outlet port with an inner diameter of 1 cm. The outlet port was connected to an air pump using Tygon tubing, and the inlet port was open to ambient air. Using the air pump, the air in the chamber was taken into a 5 L aluminum bag, along with the gases emitted by the soil, as illustrated in Fig. S1. The flow rate of the air pump was set at 100 mL min−1 throughout the deployment of the chamber; thus, each sampling lasted 45 min until 4.5 L of gas was collected into the aluminum bag. Each gas sampling was started 2 h after deployment of the flow chamber; thus, it took more than 8 h to collect four samples. In addition to the gas samples emitted from the soil, ambient air in the forest was sampled into two 3 L vacuum stainless steel canisters (SilcoCan, Restek).
2.3 Sampling and analysis of forested soil
After collecting the gas samples to determine N2O, a soil sample (approximately 150 g) was randomly collected from more than four places beneath the chamber. Approximately 20 g of the soil sample was heated at 80 °C for 48 h to estimate the water content from the weight loss and water-filled pore space (WFPS; the calculation was detailed in Text S1 in the Supplement). Using the remaining soil sample (120 g), NH, NO, and NO in each soil sample were extracted into 120 mL of a 2 M KCl solution, and their concentrations were determined using a high performance microflow analyzer (QuAAtro 39 Autoanalyzer, BLTEC, Osaka, Japan).
2.4 Concentration and isotopic compositions of N2O
The gas samples collected in aluminum bags or stainless canisters were subsampled into a 100 mL pre-evacuated glass bottle to determine the concentration ([N2O]), δ15N, and δ18O of N2O simultaneously. The remaining samples were further subsampled to either 1 or 2 L pre-evacuated glass bottles to determine the Δ17O of N2O. The concentration and isotopic compositions (δ15N, δ18O, and Δ17O) of N2O were determined using a continuous flow isotope ratio mass spectrometry (CF-IRMS; Finnigan MAT252, Thermo Fisher Scientific, Waltham, MA, USA) system that consists of an original pre-concentrator system, chemical traps, and gas chromatograph at Nagoya University (Komatsu et al., 2008). The analytical procedures using the CF-IRMS system were the same as those detailed in previous studies (Hirota et al., 2010; Komatsu et al., 2008).
The isotopic ratios of 15N 14N, 17O 16O, and 18O 16O are expressed in the δ notations:
where R denotes 15N 14N, 17O 16O, or 18O 16O ratios of the sample and each standard reference material.
The Δ17O of N2O, including NO, NO, H2O, and O2, is defined by Eq. (2) (Kaiser et al., 2007; Miller, 2002):
where β denotes the slope of the reference line in the δ17O−δ18O space. Previous studies have proposed values ranging from 0.525 to 0.5305 for β during the various processes of isotope fractionation through experimental measurements and/or theoretical calculations (Cao and Liu, 2011; Matsuhisa et al., 1978; Pack and Herwartz, 2014; Sharp and Wostbrock, 2021). In this study, we adopted a value of 0.528 for β to define Δ17O. The details of the ranges of the possible Δ17O variations due to the ranges of β are presented in Sect. 4.1.
To calibrate the δ15N and δ18O of N2O to the international scale, N2O in a tropospheric air sample collected at Hateruma Island in 2010 (Japan) was used as the standard with a δ15N value of +6.5 ‰ and a δ18O value of +44.3 ‰ (Toyoda et al., 2013). To calibrate the Δ17O of N2O on the international Vienna Standard Mean Ocean Water (VSMOW) scale, we prepared two kinds of N2O standards with different Δ17O values calibrated using a conventional method (Thiemens and Trogler, 1991). The procedures for this calibration are presented in Sect. 2.6, with the details of the N2O standards. Through repeated measurements of N2O in a tropospheric air sample collected at Nagoya University, the analytical precisions (1σ) of the measurements were estimated to be ± 10.0 ppb, ± 0.5 ‰, ± 0.6 ‰, and ± 0.11 ‰ for concentration, δ15N, δ18O, and Δ17O, respectively (Fig. S2). To achieve higher precision, analyses of Δ17O were performed at least three times for each sample, resulting in a standard error (SE) of ± 0.06 ‰.
2.5 Emission flux
Based on the change in the concentration of N2O from the inlet to the outlet, the emission flux of N2O from the soil was calculated using Eq. (3):
where Flux denotes the emission flux of N2O (µg N m−2 h−1), P denotes the pressure (Pa), V represents the volume of the gas sample in the aluminum bag (0.0045 m3), Cfinal denotes the concentration of N2O in the gas sample taken at the end of each deployment of the chamber (µmol mol−1), Cair denotes the concentration of N2O in the ambient air (µmol mol−1), M represents the molecular weight of N in N2O (28 µg N µmol−1), R represents the universal gas constant (8.314 m3 Pa K−1 mol−1), T represents the air temperature in the forest (K), t represents the duration of each gas sampling (45 min), and A represents the surface area of soil covered by the chamber (0.24 m2).
2.6 Calibration of the Δ17O values of N2O
To determine the Δ17O values of N2O in the samples on the VSMOW scale, we prepared two standards (STD1 and STD2) containing N2O. The Δ17O values of N2O in the standards were calibrated to the VSMOW scale using the conventional method reported in Thiemens and Trogler (1991), where N2O was quantitatively converted to O2 using BrF5 and a Ni catalytic container. The details are presented below.
A calibrated quantity of N2O (50–170 µmol) was subsampled and transferred into a nickel tube (approximately 60 cm3) under liquid N2 temperature. The coexisting components of N2O, such as helium in the case of STD2, were evacuated from the nickel tube after N2O was trapped in the nickel tube under liquid N2 temperature. The nickel tube was then heated at 725 °C for 2.5 h to convert N2O to NiO and N2. After evacuating N2 from the nickel tube, a 10-fold quantity of BrF5 was introduced into the nickel tube and heated at 725 °C for 12 h to convert NiO to O2 and NiF2. After the purification of O2, both δ18O and Δ17O of O2 were determined on the VSMOW scale using IRMS, with the quantity of O2 evolved from N2O. Details on the procedures of O2 purification and the measurement of O2 using IRMS on the VSMOW scale have been described in previous studies (Sambuichi et al., 2021, 2023). STD1 is pure N2O gas prepared from N2O in a gas cylinder (more than 99.9 %; Koike Medical Ltd., Japan). The yield ratios of O2 and Δ17O of STD1 were 103 ± 7 % and −0.22 ± 0.07 ‰, respectively (Fig. S3). The N2O in STD2 is a mixture of helium and N2O (N2O He ≈ 1.5) produced from NO that had been under oxygen isotope exchange equilibrium with H2O with a Δ17O value of +1.2 ‰ originally, under a pH of 1.2. NO was then converted to N2O through a reaction with hydrazoic acid (N3H), as described by Tsunogai et al. (2008). The reaction product (N2O) was purged from the vial using pure helium (more than 99.9 %). After the removal of H2O by passing a trap under the temperature of dry ice + ethanol, N2O was captured in a trap at the temperature of liquid O2 and then transported into a 1 L stainless steel canister together with helium. The yield of O2 and Δ17O of STD2 were 97 ± 5 % and +1.13 ± 0.02 ‰, respectively (Fig. S3). To calibrate the Δ17O values of the samples measured using CF-IRMS, approximately 1 mL of each STD was subsampled into a 200-mL pre-evacuated glass bottle and diluted using pure helium to 1 atm. The Δ17O values of N2O in the diluted standards were then determined using CF-IRMS like the procedure used on the samples before the sample measurements by introducing 30–60 nmol of N2O. This allowed us to calibrate the Δ17O values of the samples to the VSMOW scale (Fig. S4).
2.7 Isotopic composition of NO
To determine the δ18O and Δ17O values of soil NO that had been extracted in the KCl solution, the NO in the KCl solution was chemically converted to N2O using the method originally developed to determine the δ18O of NO (McIlvin and Altabet, 2005), with several modifications for Δ17O (Xu et al., 2021), as explained below. Approximately 40 mL of each solution was pipetted into a glass vial (66.7 mL) and sealed with a butyl rubber septum cap. After purging the solution using high-purity helium for 45 min, 1.8 mL of an azide-acetic acid buffer (0.1 mol L−1 NaN3 in 1 vol % acetic acid), which had been purged using pure helium as well, was added to the solution to convert NO to N2O:
After the vials were shaken for 1 h at a rate of 2 cycles s−1, 0.9 mL of 6 M NaOH was added to each vial and shaken for 15 min.
The δ18O and Δ17O of N2O converted from NO in each vial were determined using the CF-IRMS system. We repeated the analyses for each solution sample at least three times to obtain better precision for Δ17O.
The δ18O values of NO were calibrated to the VSMOW scale using three in-house nitrite standards (STD10, STD11, and STD12), the δ18O values of which had been determined using a thermal conversion elemental analyzer IRMS system, where oxygen atoms in each nitrite nitrate had been converted into CO using a glassy carbon tube at 1400 °C (Xu et al., 2021) and calibrated to the VSMOW scale using the international nitrate standards USGS34 (δ18O = −27.9 ‰) and IAEA-NO-3 (δ18O = +25.6 ‰) as the primary standards. Isotope fractionations during chemical conversion into N2O were corrected by measuring the nitrite standards in the same way as samples were measured using the CF-IRMS system. In addition, the extent of oxygen isotope exchange between NO and H2O during the conversion was quantified using the relation between δ18O of the nitrite standards and that of N2O (Xu et al., 2021). The Δ17O values of NO were calibrated to the VSMOW scale by comparing N2O derived from NO with N2O standards (STD1 and STD2) while assuming that the changes in Δ17O were negligible during the conversion from NO into N2O, except for the oxygen isotope exchange reaction between NO and H2O during the conversion to N2O. The progress of oxygen isotope exchange between NO and H2O was calibrated from the Δ17O values of NO using the exchange rate estimated by calculating δ18O values while assuming that the Δ17O value of H2O was 0 ‰.
While the KCl solutions were widely used for the extraction of soil NO (e.g., Lewicka-Szczebak et al., 2021; Shen et al., 2003), Homyak et al. (2015) raised the concerns that the recovery of soil NO could be low when using KCl solutions compared to deionized water. Therefore, we conducted a comparative experiment to evaluate this potential issue and concluded that the use of KCl solution introduced negligible bias in terms of soil NO recovery or Δ17O measurements compared to deionized water extraction for the soil type and experimental conditions in this study. The details are described in the Supplement (Text S2).
3.1 Flux and isotopic compositions of N2O emitted from forested soil
Almost all of the concentrations of N2O ([N2O]) in the samples collected in aluminum bags were higher than that of N2O in ambient air (Figs. 3a and S5), implying that N2O in the aluminum bags was a mixture of N2O in ambient air and N2O emitted from the forested soil. To determine the isotopic compositions (δ15N, δ18O, and Δ17O) of N2O emitted from the soil, N2O derived from ambient air was excluded using the linear correlation between [N2O] and the isotopic compositions (δ15N, δ18O, and Δ17O) during mixing (Figs. 3b, c, d, and S5), also was known as Keeling plot approach (Keeling, 1958; Tsunogai et al., 1998, 2003). This method assumes that the concentrations of N2O (N2O (N2O + N2)) in the gases emitted from the soil were more than 3 %, allowing [N2O] to be approximated to be 0 (Text S3). The uncertainties associated with the isotopic compositions of N2O emitted from soil (i.e., the intercept) were estimated by applying the York method (Tsunogai et al., 2011; York et al., 2004) to the obtained relationship between [N2O] as the independent variable and the isotopic compositions as the dependent variable in which uncertainties of both independent and dependent variables for individual data are considered.
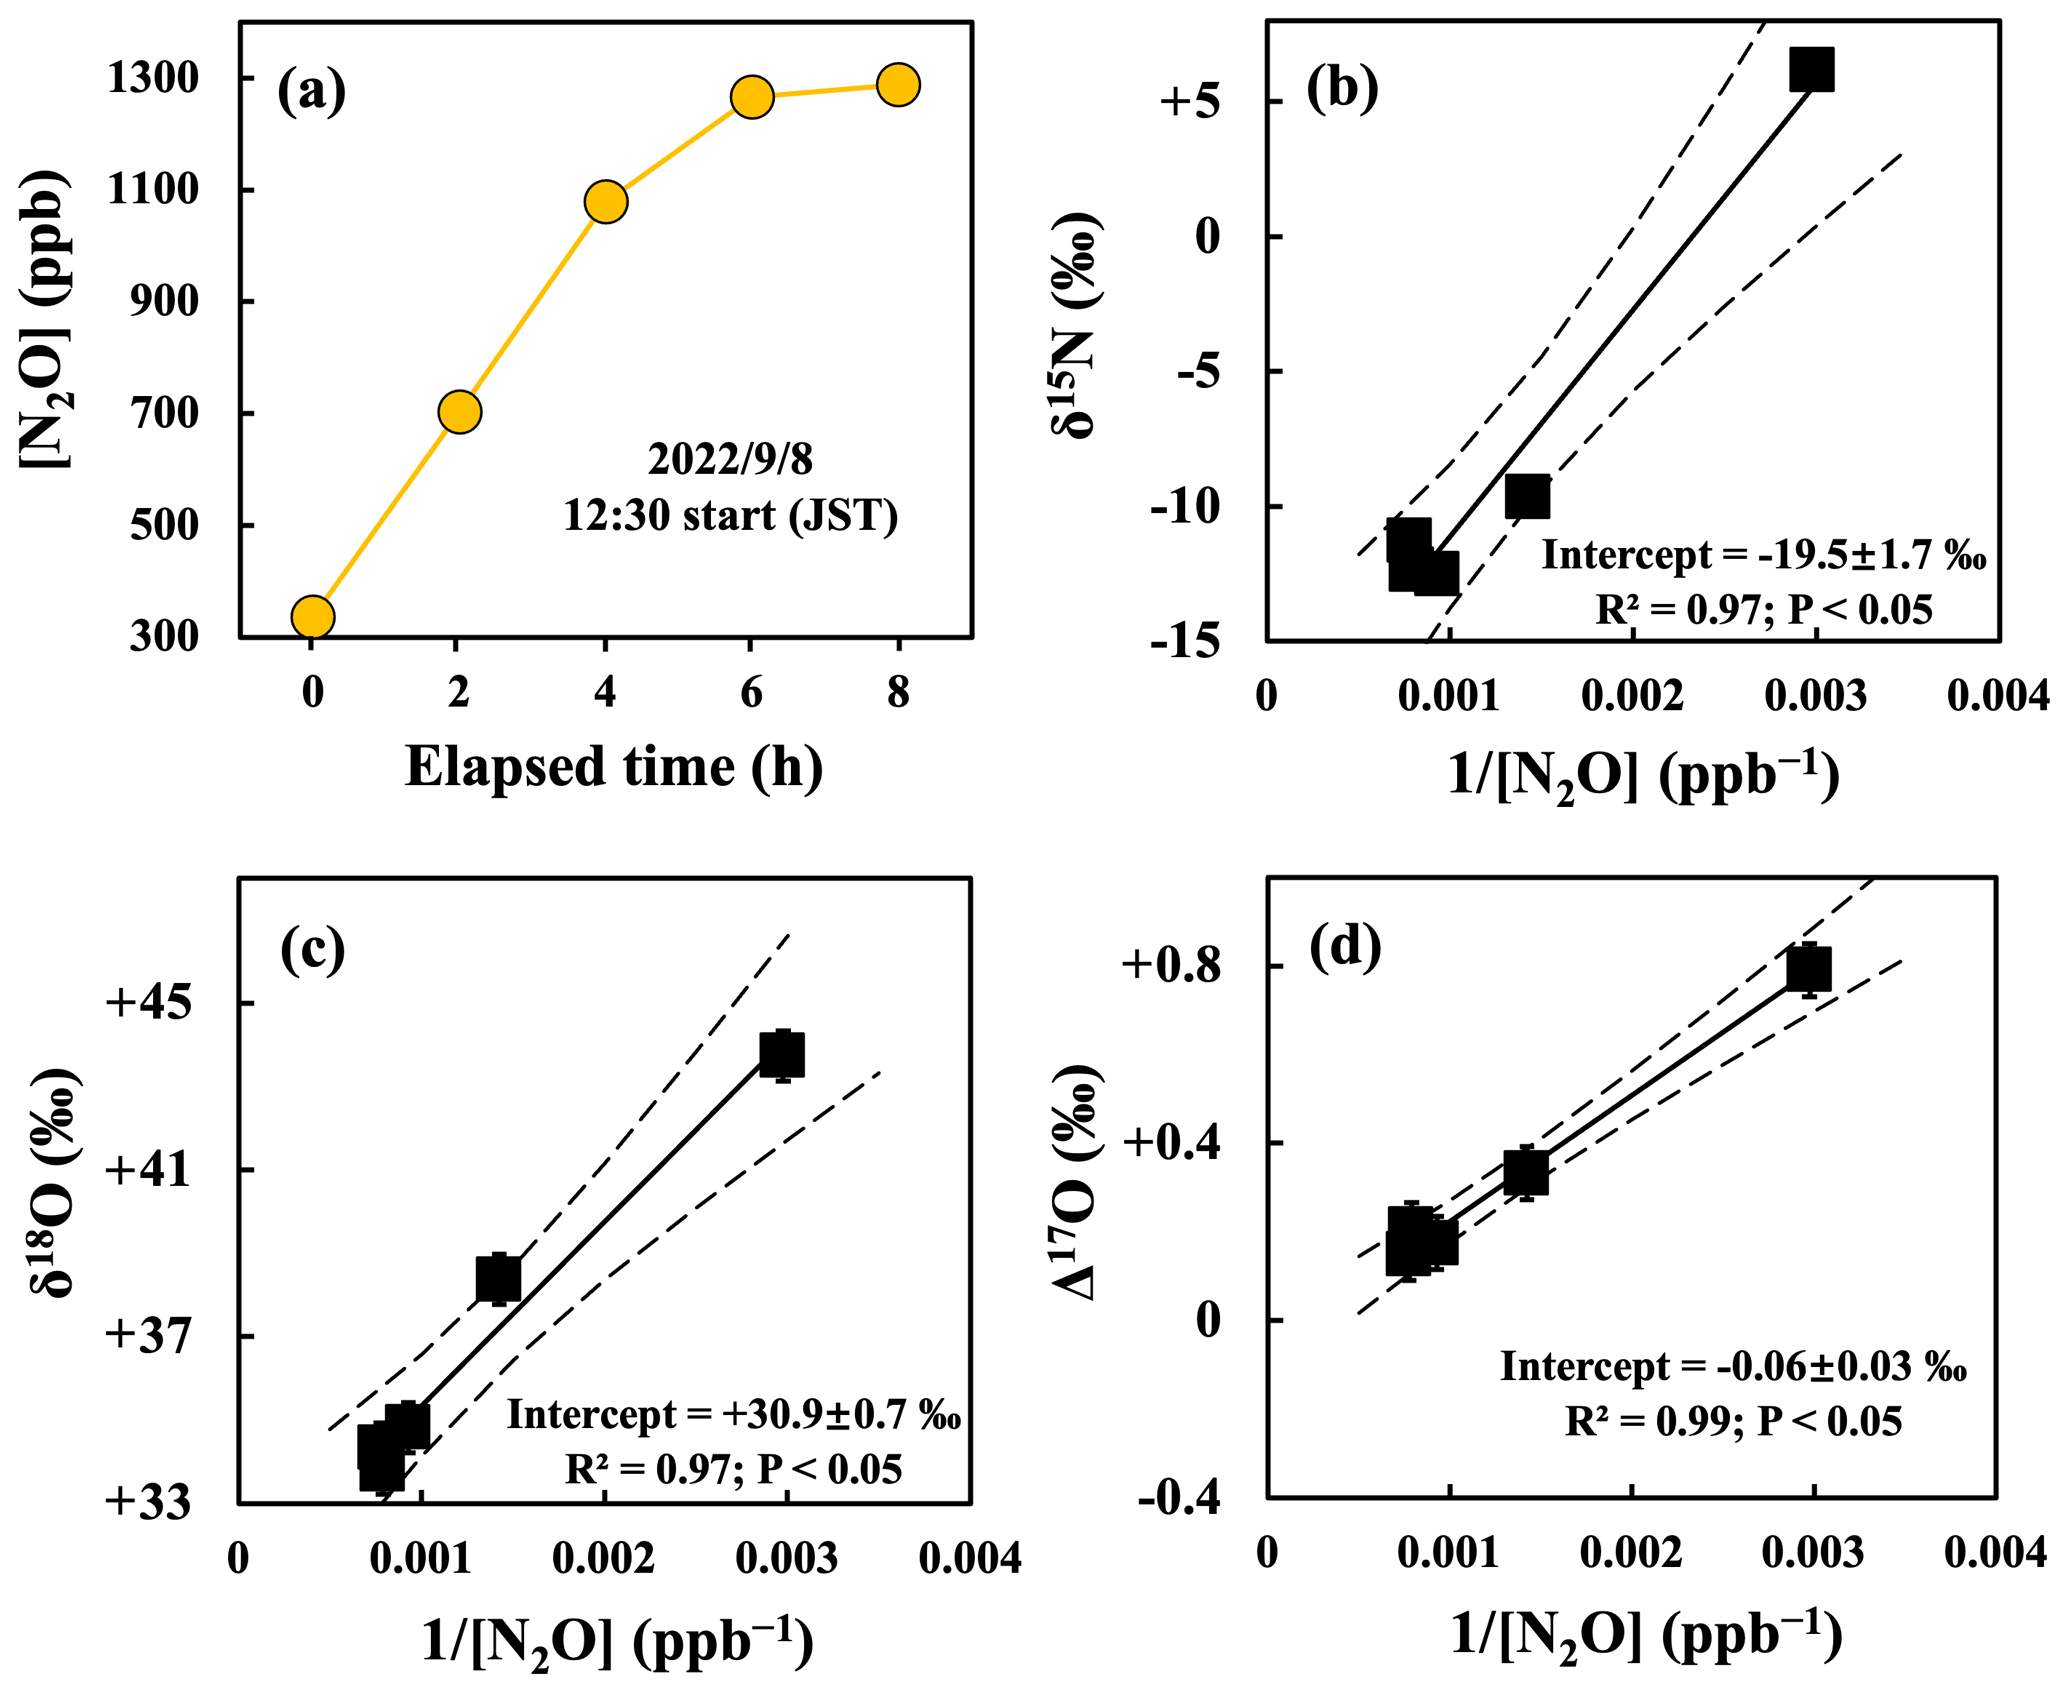
Figure 3An example of changes in the concentration of N2O ([N2O]) in gas samples during the observation on 8 September 2022, plotted as a function of the elapsed time since the deployment of the flow chamber on the forested soil (a), and the δ15N (b), δ18O (c), and Δ17O (d) values of N2O plotted as a function of the reciprocal of [N2O] ( [N2O]) during the observation. Each solid line is the least squares fitting of the samples, while each dotted line is the 2σ confidence interval of the fitting line. Error bars smaller than the sizes of the symbols are not shown.
The flux of N2O emitted from the forested soil determined on fine days varied from −0.2 to 9.8 µg N m−2 h−1, with an average of 3.8 ± 3.1 µg N m−2 h−1 (1 SD; n=12). In addition, the emission flux during the warm seasons (from April to October; 5.1 ± 2.8 µg N m−2 h−1) was significantly higher than that during the cold seasons (from November to March; 1.0 ± 1.1 µg N m−2 h−1) (Fig. 4a; Table S1), implying that the emission flux of N2O on fine days exhibited clear seasonal variation. Furthermore, the average emission flux of N2O determined on rainy days (38.8 ± 28.0 µg N m−2 h−1; n=6) was significantly higher than that determined on fine days (3.8 ± 3.1 µg N m−2 h−1) (Fig. 4a and b). These patterns of N2O emissions were in accordance with those of agricultural and forested soils reported in previous studies (Anthony et al., 2023; Chen et al., 2012; Choudhary et al., 2002; Yan et al., 2008).
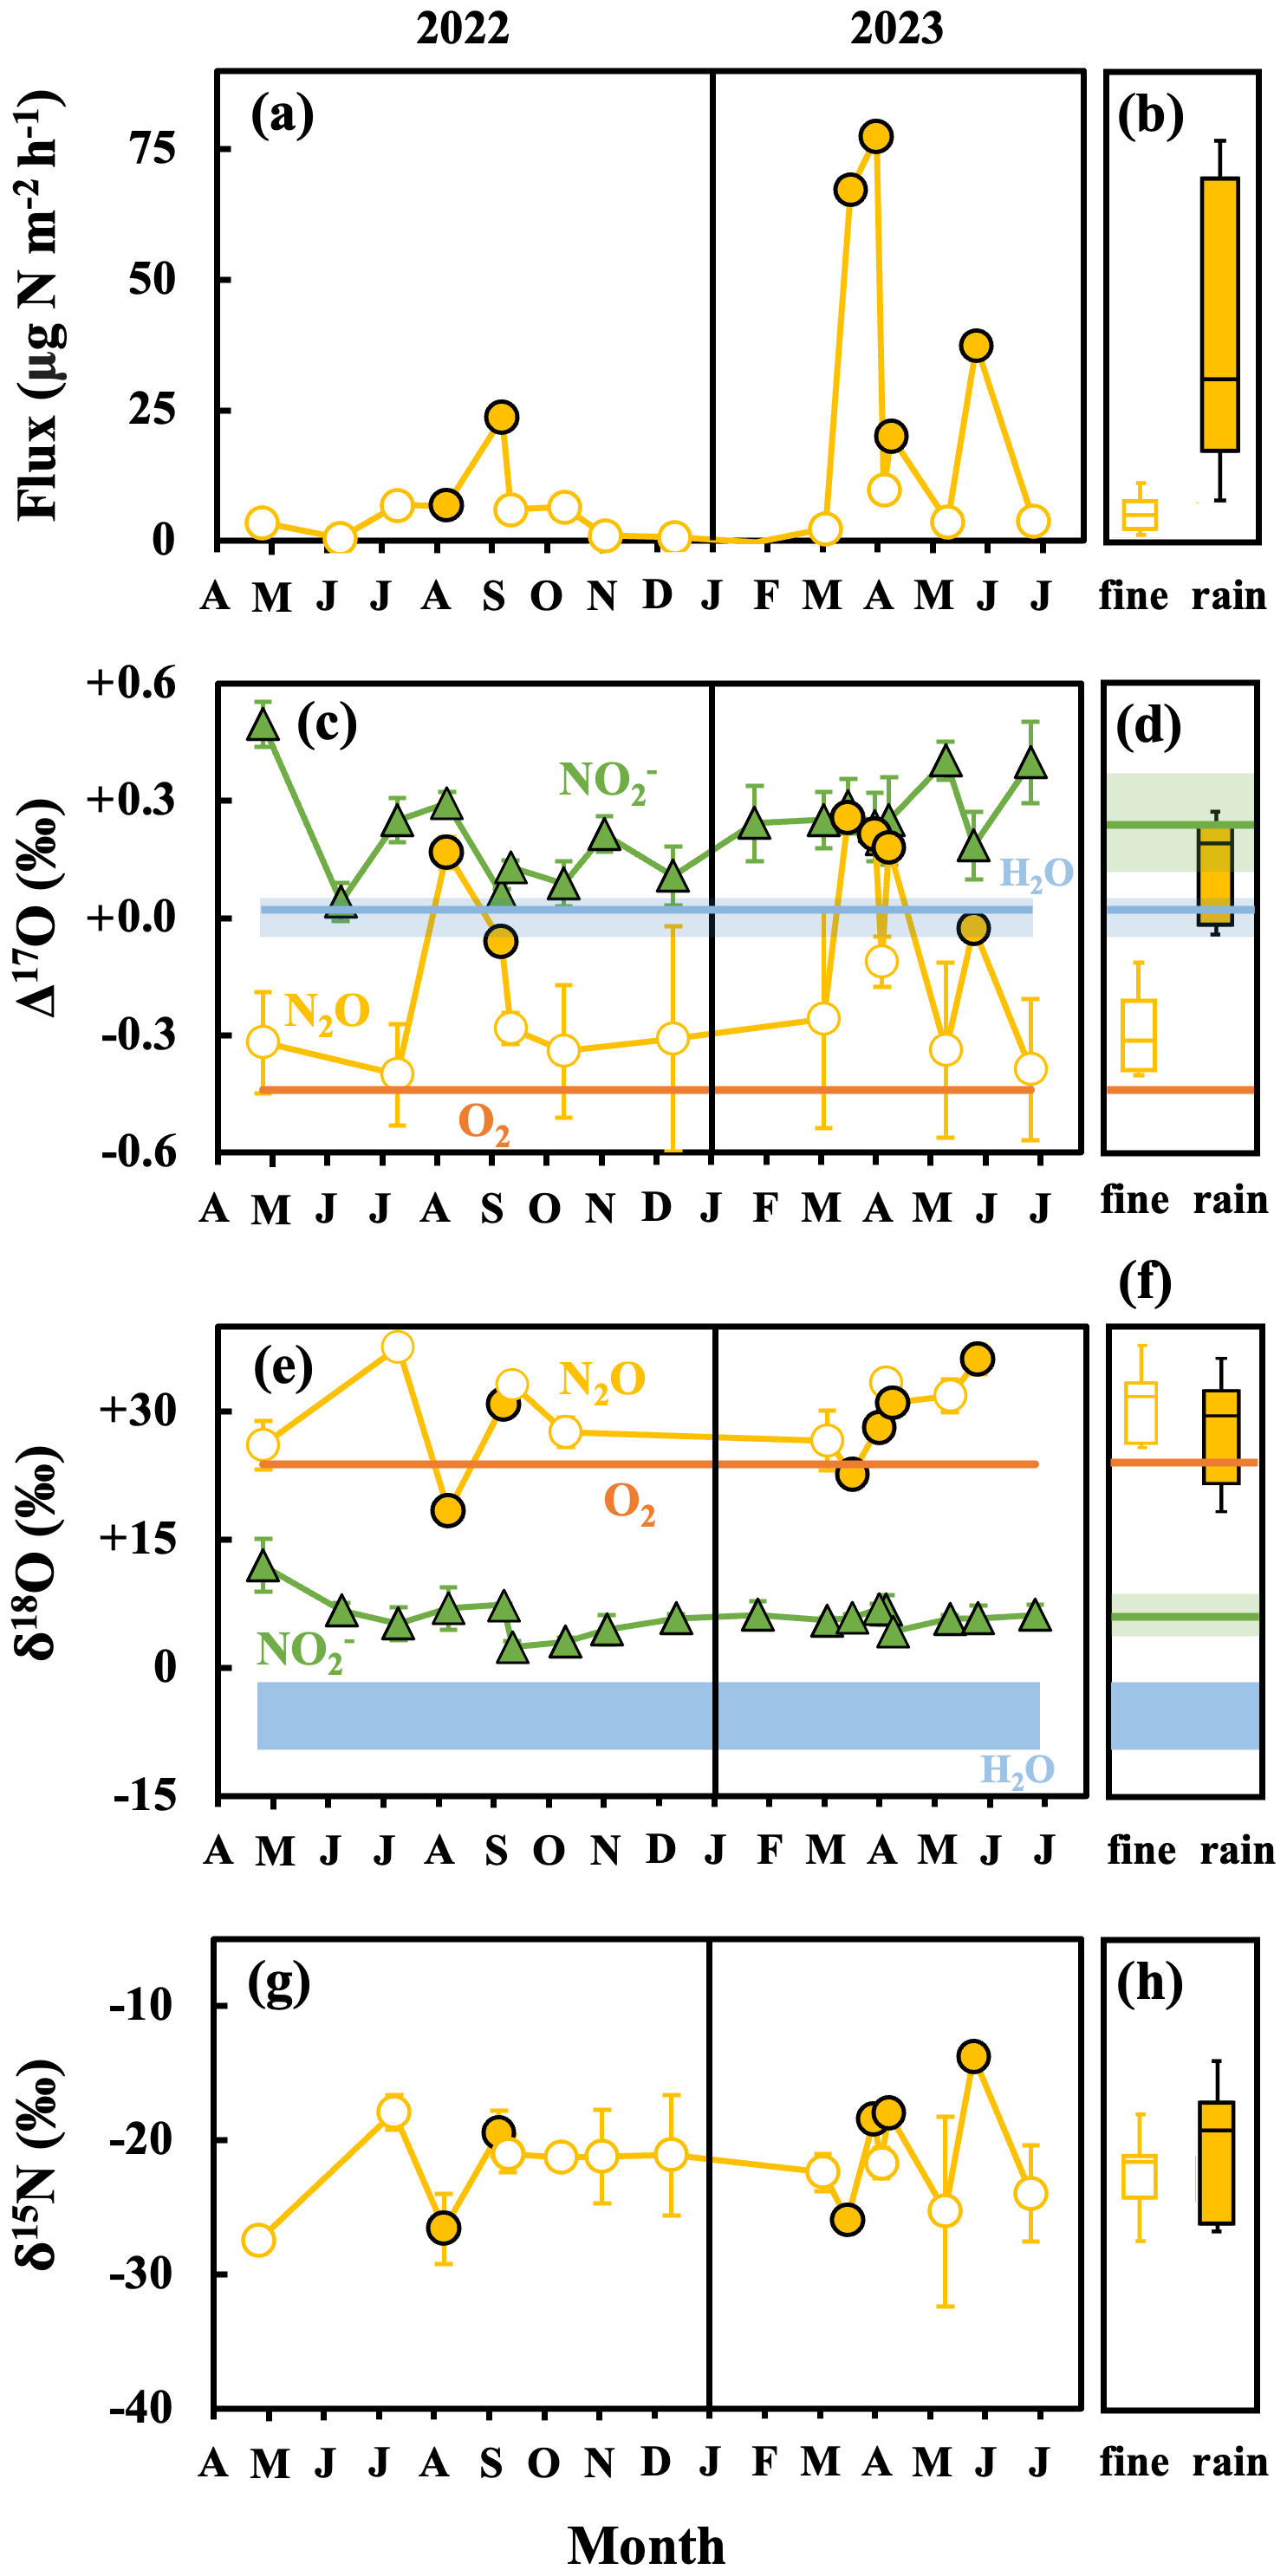
Figure 4Temporal variations in the flux (a), Δ17O (c), δ18O (e), and δ15N (g) values of N2O emitted from the forested soil, and the δ18O and Δ17O values of soil NO (green triangles), O2 (orange lines), and soil H2O (blue area or line). Sampling performed on fine and rainy days is indicated by the open (white) and solid (yellow) circles, respectively, with the box plots of the emission flux (b), Δ17O (d), δ18O (f), and δ15N (h) of N2O on fine and rainy days. The black lines of the box plots indicate the median values. The lower and upper boundaries of the box plots indicate the lower (25 %) and upper (75 %) quartiles of data for each component, respectively. The whiskers of the box plots denote the entire range of values for each component. Error bars smaller than the sizes of the symbols are not shown.
Because of the small emission flux of N2O during the cold seasons, the linear relationships between the isotopic compositions and [N2O] became insignificant in some of the observations performed during the cold seasons (Fig. S5, from November 2022 to January 2023). Thus, the uncertainties associated with the isotopic compositions estimated for N2O emitted from the soil became enormous. Consequently, the isotopic compositions of N2O emitted from the soil are not shown under the following conditions: (1) the [N2O] in the gas sample collected at the end of each deployment of the chamber did not exceed 130 % of that of ambient air, and (2) the linear correlation between [N2O] and the isotopic compositions was statistically insignificant (P>0.05). Similar criteria have been adopted in previous studies (Kaushal et al., 2022; Opdyke et al., 2009).
The N2O emitted from the forested soil on fine days exhibited δ15N, δ18O, and Δ17O values ranging from −27.5 ‰ to −17.9 ‰, from +26.1 ‰ to +37.6 ‰, and from −0.40 ‰ to −0.11 ‰, respectively, with average values and standard deviations (1 SD) of −22.5 ± 2.8 ‰, +30.9 ± 4.3 ‰, and −0.30 ± 0.09 ‰, respectively (Fig. 4g, e, and c). On the other hand, N2O emitted from the forested soil on rainy days exhibited δ15N, δ18O, and Δ17O values ranging from −26.6 ‰ to −13.8 ‰, from +18.4 ‰ to +36.2 ‰, and from −0.06 ‰ to +0.26 ‰, respectively, with average values and standard deviations (1SD) of −20.4 ± 5.0 ‰, +27.9 ± 6.4 ‰, and +0.12 ± 0.13 ‰, respectively (Fig. 4g, e, and c).
The NO exhibited δ18O and Δ17O values ranging from +2.4 ‰ to +12.0 ‰ and from +0.04 ‰ to +0.50 ‰, respectively, with average values of +6.0 ± 2.0 ‰ and +0.23 ± 0.12 ‰, respectively (n=18, Fig. 4e and c). These δ18O values of NO coincided well with those determined in a previous study (Lewicka-Szczebak et al., 2021).
3.2 Flux and isotopic compositions of N2O emitted from artificially fertilized soils
The fluxes of N2O emitted from the NF (no fertilizer), U (fertilized with urea, CO(NH2)2), and CS (fertilized with Chile saltpeter, KNO3) plots were 5.2, 70.6, and 112.3 µg N m−2 h−1, respectively, 2 d after fertilization and 4.2, 56.7, and 39.4 µg N m−2 h−1, respectively, 6 d after fertilization (Table S1). The fluxes of N2O emitted from the U and CS plots were significantly higher than that from the NF plot, indicating that the flux of N2O emitted from the soil increased significantly because of fertilization, supporting the results reported in previous studies (Kaushal et al., 2022; McKenney et al., 1978; Toyoda et al., 2011, 2017).
The δ15N, δ18O, and Δ17O values of N2O emitted from the NF plot 2 d after fertilization were −17.1 ± 6.4 ‰, +36.1 ± 6.7 ‰, and −0.37 ± 0.20 ‰, respectively, whereas those emitted from the NF plot 6 d after fertilization were −12.2 ± 3.2 ‰, +40.0 ± 13.3 ‰, and −0.32 ± 0.23 ‰, respectively. The δ15N, δ18O, and Δ17O values of N2O emitted from the U plot 2 d after fertilization were −39.3 ± 0.7 ‰, +34.4 ± 0.4 ‰, and −0.14 ± 0.06 ‰, respectively, whereas those emitted from the U plot 6 d after fertilization were −33.3 ± 0.5 ‰, +25.7 ± 0.6 ‰, and −0.16 ± 0.05 ‰, respectively. The δ15N, δ18O, and Δ17O values of N2O emitted from the CS plot 2 d after fertilization were −19.3 ± 0.6 ‰, +54.1 ± 0.8 ‰, and +8.22 ± 0.03 ‰, respectively, whereas those emitted from the CS plot 6 d after fertilization were −11.3 ± 0.7 ‰, +58.7 ± 1.2 ‰, and +7.36 ± 0.17 ‰, respectively (Fig. 5). These flux, δ15N, and δ18O of N2O emitted from the NF, U, and CS plots correspond well with the results of many previous studies on forested and artificial soils (or agricultural soils) (Kaushal et al., 2022; Kim and Craig, 1993; Snider et al., 2009; Toyoda et al., 2017; Wrage et al., 2004).
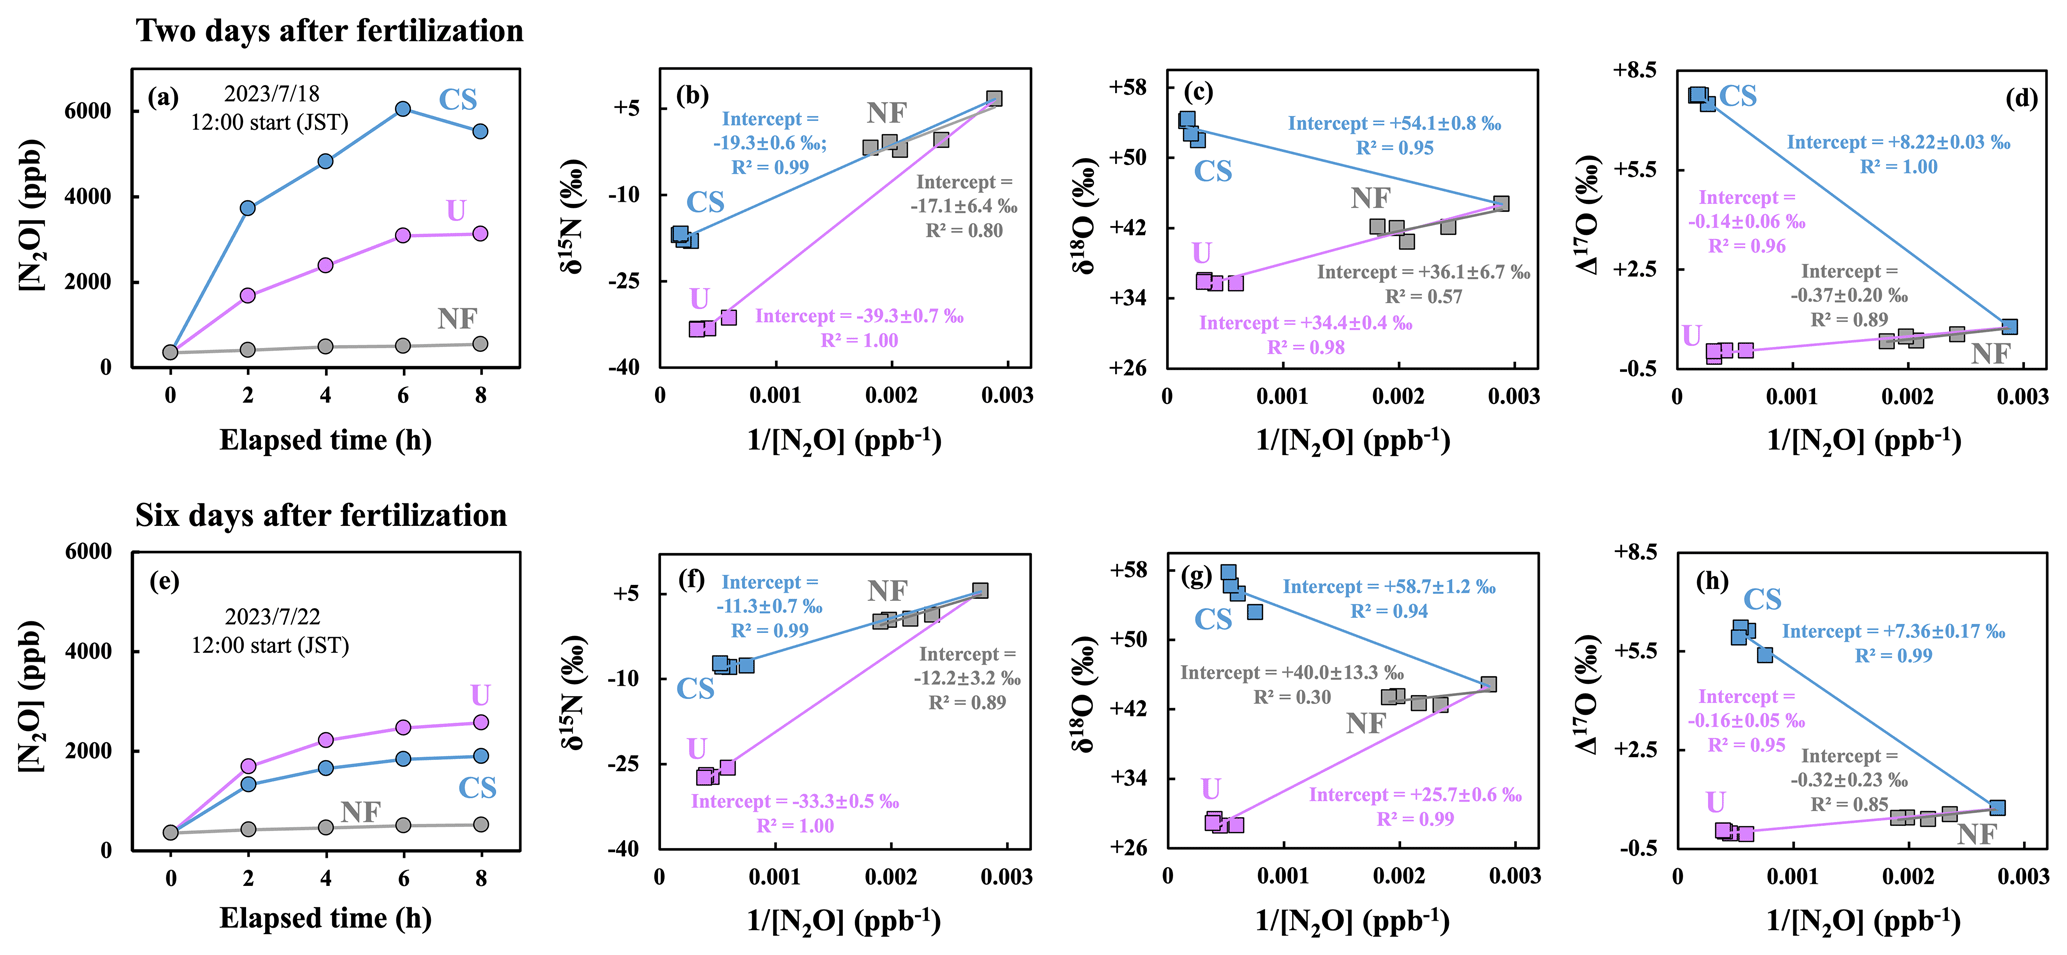
Figure 5Changes in [N2O] of gas samples collected from the plots of NF (gray), U (purple), and CS (blue) 2 d after fertilization (a) and 6 d after fertilization (e) and plotted as a function of the elapsed time since the deployment of the flow chamber; the δ15N (b, f), δ18O (c, g), and Δ17O (d, h) values of N2O plotted as a function of the reciprocal of [N2O] ( [N2O]). Error bars smaller than the sizes of the symbols are not shown.
The δ18O and Δ17O values of NO in the NF plot 2 d after fertilization were +2.7 ‰ and +0.42 ‰, respectively, whereas those in the NF plot 6 d after fertilization were +1.3 ‰ and +0.35 ‰, respectively. The δ18O and Δ17O values of NO in the U plot 2 d after fertilization were +7.6 ‰ and +0.31 ‰, respectively, whereas those in the U plot 6 d after fertilization were +5.4 ‰ and +0.17 ‰, respectively. The δ18O and Δ17O values of NO in the CS plot 2 d after fertilization were +29.0 ‰ and +8.26 ‰, respectively, whereas those in the CS plot 6 d after fertilization were +45.2 ‰ and +12.32 ‰, respectively (Fig. 6).
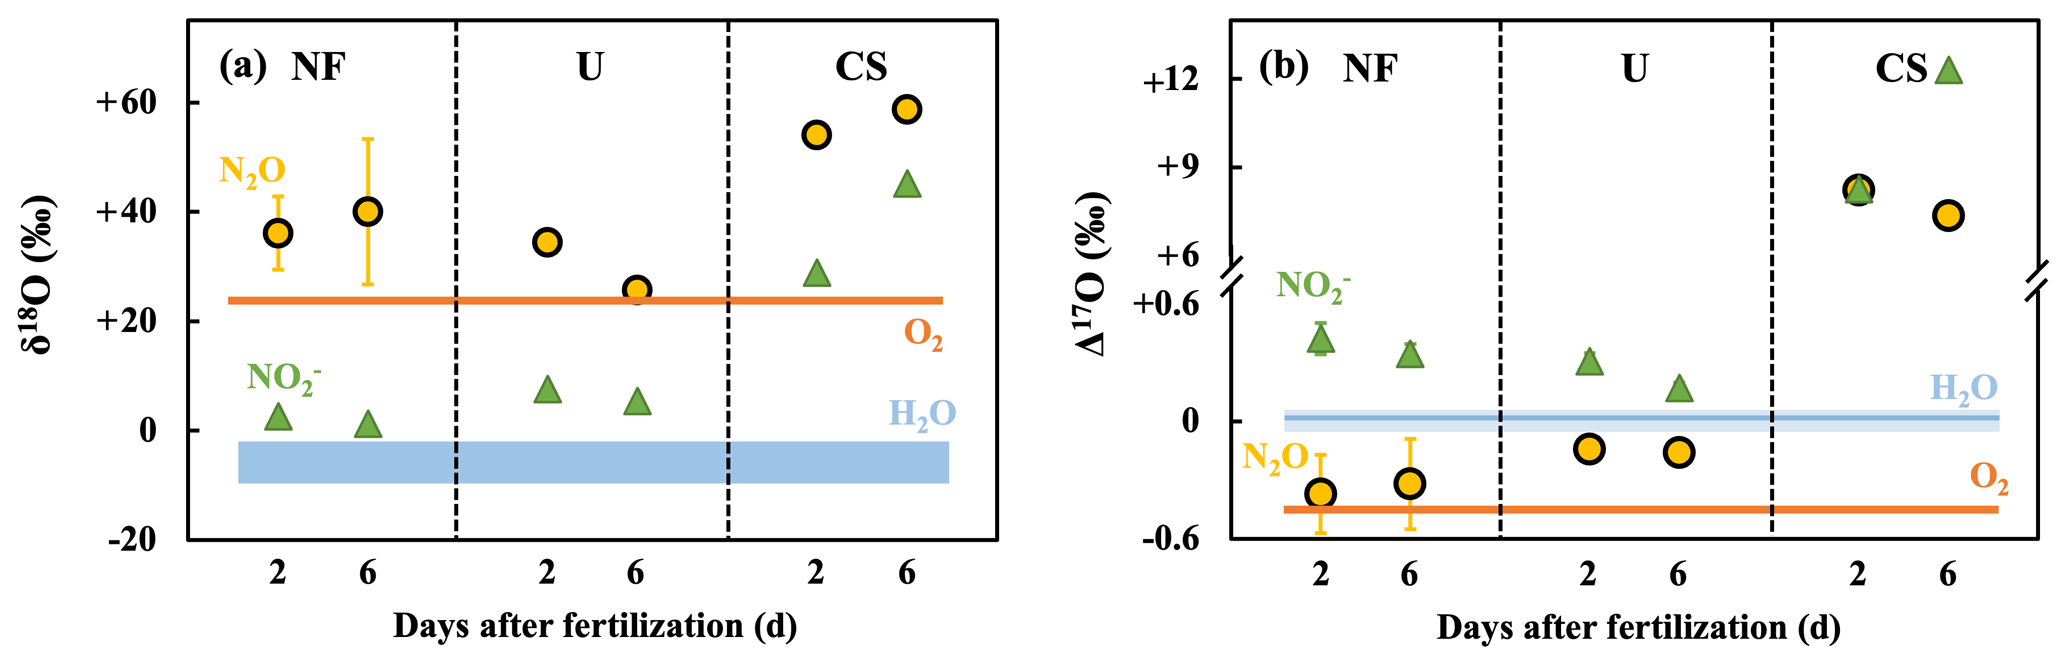
Figure 6The δ18O (a) and Δ17O (b) values of N2O (yellow circles) and NO (green triangles) in NF, U, and CS plots determined 2 and 6 d after fertilization, and the δ18O and Δ17O values of O2 (orange lines) and soil H2O (blue area or line). Error bars smaller than the sizes of the symbols are not shown.
4.1 Identification of N2O production pathways in forested soil using Δ17O signature
Because O atoms in N2O emitted from soil can be derived from those in NO, O2, or H2O in soil (Fig. 1), we can constrain the pathways of N2O production by comparing the δ18O and Δ17O values of N2O with those of NO, O2, and H2O in soil. Consequently, we compiled the δ18O and Δ17O values of atmospheric O2 (+23.88 ‰ for δ18O and −0.44 ‰ for Δ17O, Sharp and Wostbrock, 2021) and rainwater (ranging from −2 ‰ to −10 ‰ for δ18O in Japan, Nakagawa et al., 2018; Takahashi, 1998; Uechi and Uemura, 2019; Zou et al., 2015; +0.03 ‰ for Δ17O in Japan, Uechi and Uemura, 2019), as shown in Figs. 4 and 6, along with those of soil NO measured in this study.
The Δ17O of N2O produced in the soil may differ from that of the source of O atoms (O2, NO, H2O) because of oxygen isotope fractionation during nitrification and denitrification, as the value of β in Eq. (2) may vary depending on the reactions. Thus, prior to using Δ17O values to identify the pathways of N2O production in soils, we quantified the possible variations in the Δ17O values of N2O during each reaction. The details are presented below.
The fractionation of oxygen isotopes during the transformation of the O atoms in O2 to those in N2O through nitrification accompanies significant variations in the value of δ18O from O2 to N2O (Figs. 4e and 6a). In addition to δ18O, the Δ17O value of N2O produced through nitrification could be somewhat different from that of O2, even if all O atoms in N2O were derived from O2, due to the possible differences in β from 0.528 during the reaction (Fig. 7). The average variation in δ18O from O2 to N2O due to nitrification (Δδ18O (N2O−O2)) was estimated to be 9 ‰ on average (Figs. 4e and 6a) based on the difference in δ18O values between N2O emitted from the soil in this study (+33 ± 10 ‰; n=19) and O2 in the literature (Sharp and Wostbrock, 2021). Conversely, we can expect values from 0.525 to 0.5305 for β in the various reactions (Cao and Liu, 2011; Matsuhisa et al., 1978; Pack and Herwartz, 2014; Sharp and Wostbrock, 2021), where the β of nitrification may be included. Thus, we quantified the possible range of variations in the Δ17O value of N2O from that of O2 to be less than 0.027 ‰ (Fig. 7), based on the observed Δδ18O(N2O−O2) and the possible variation range of β.
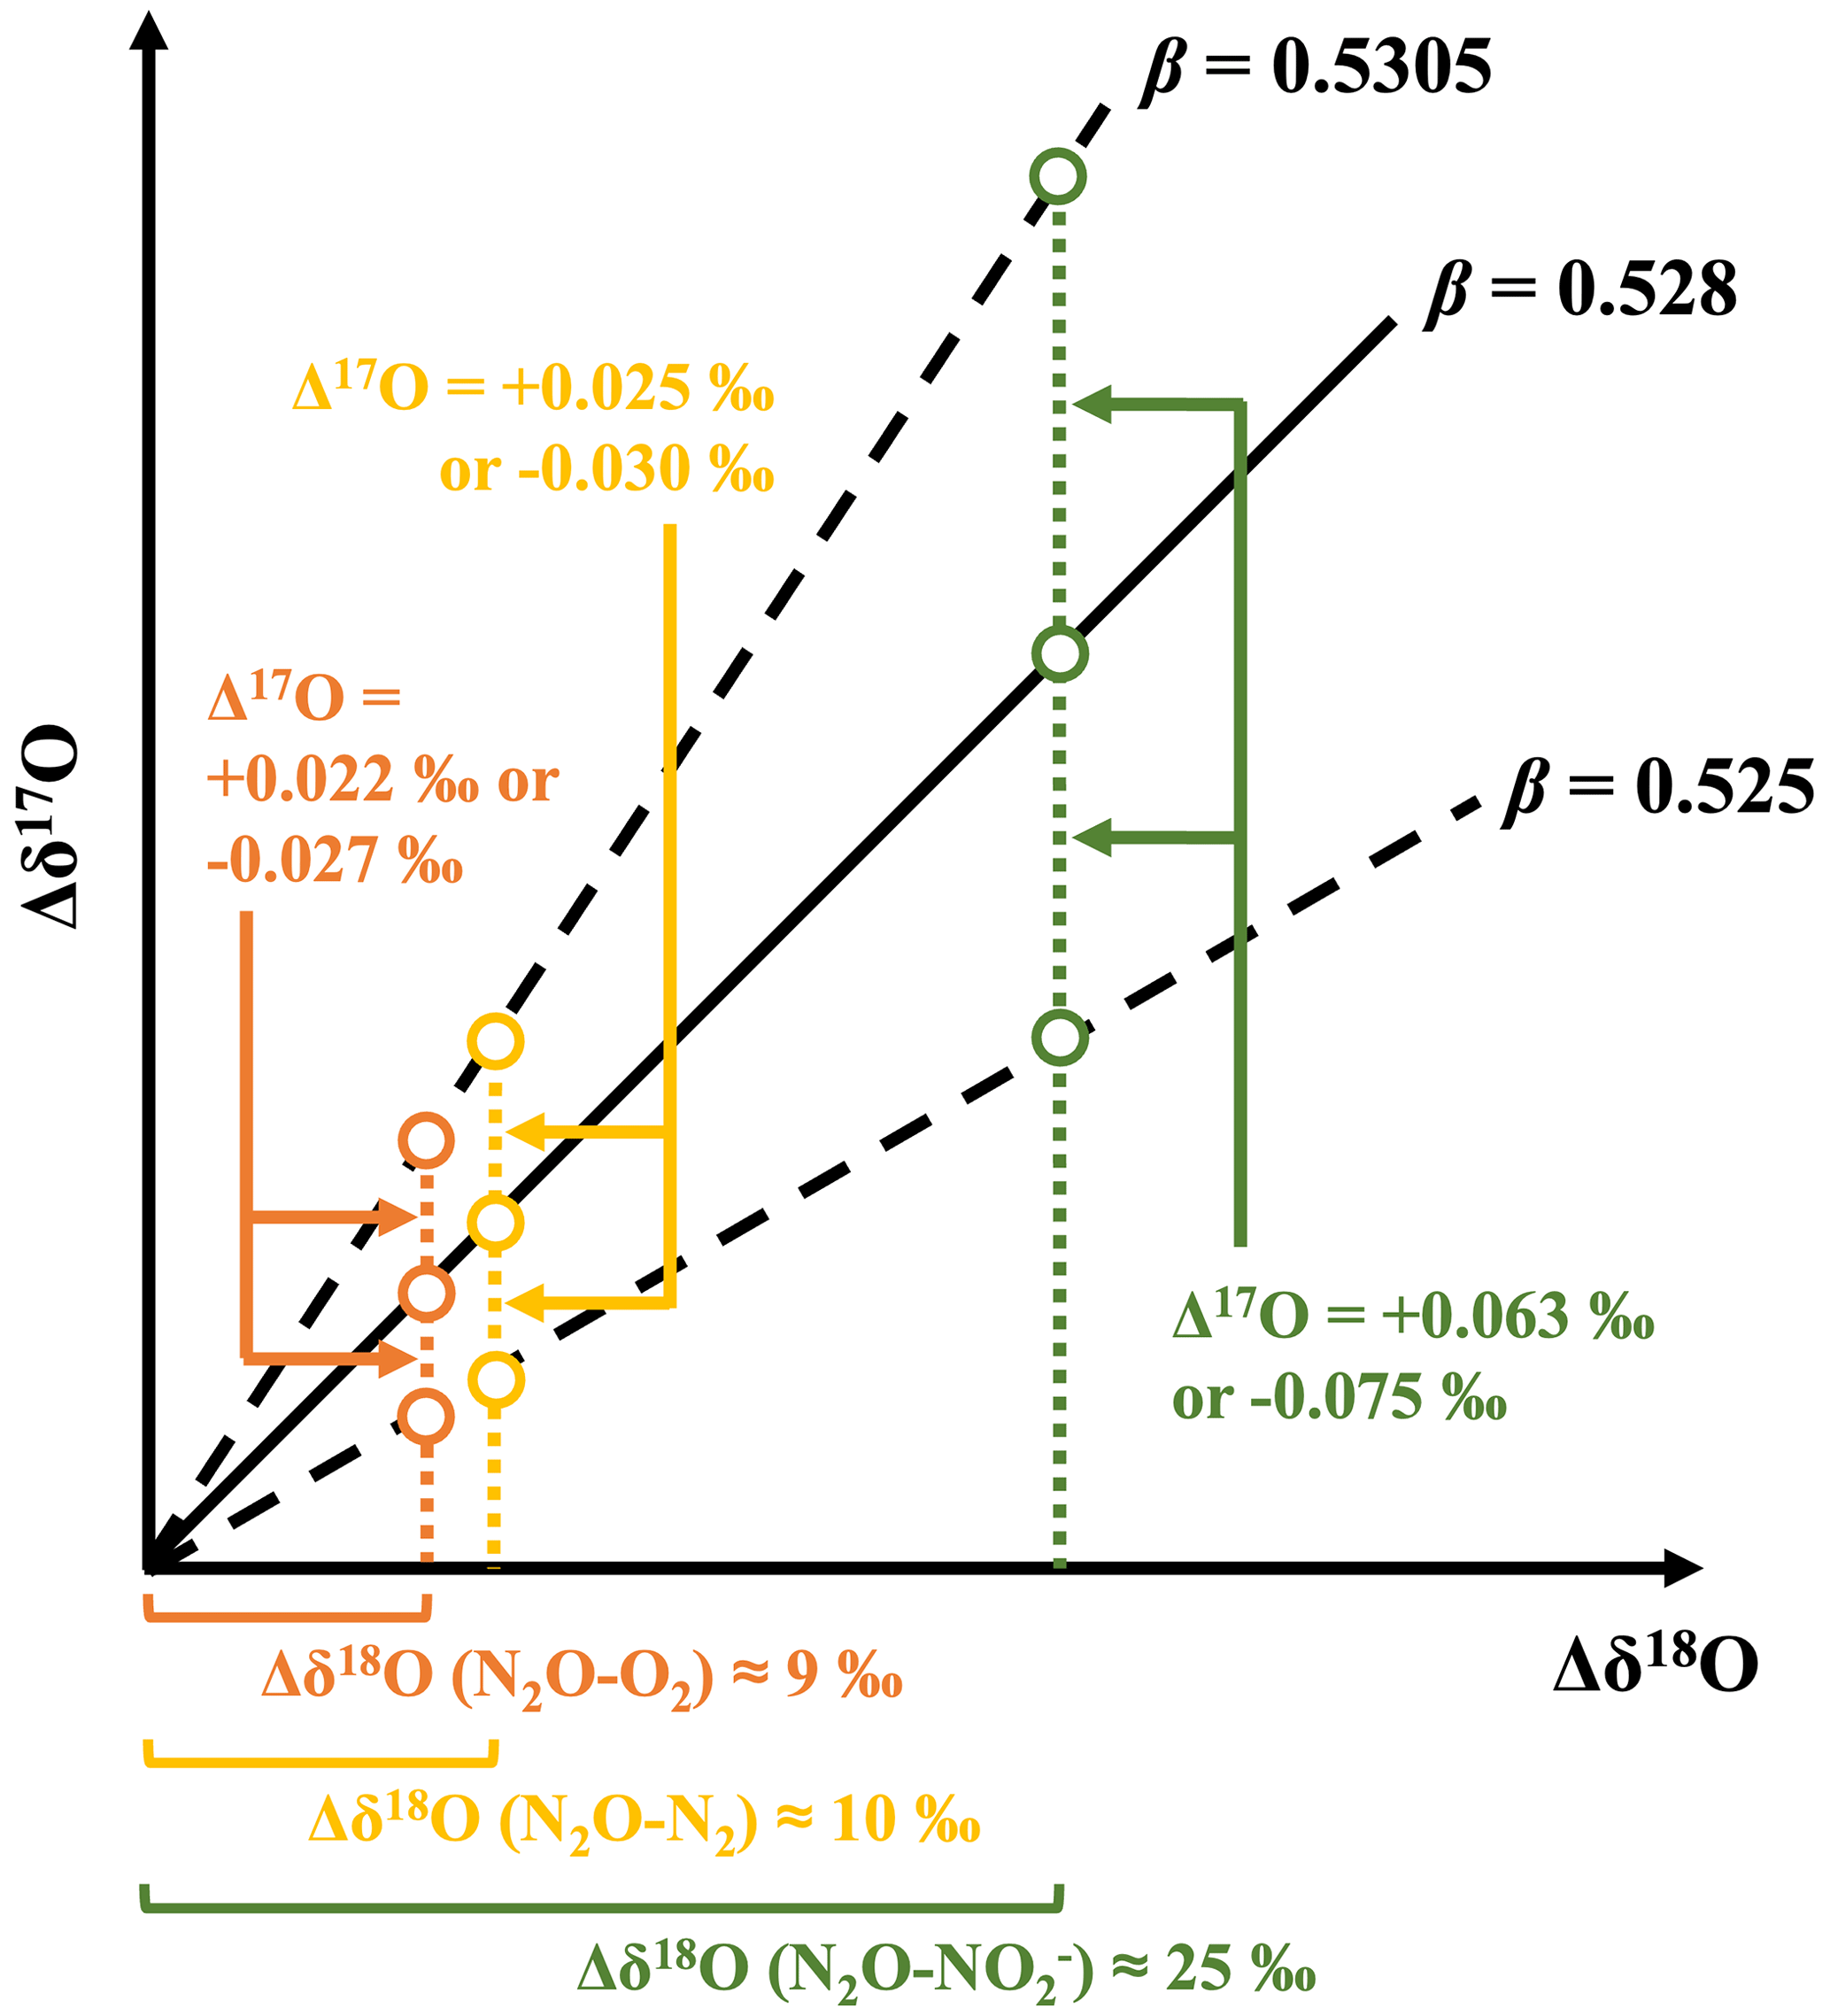
Figure 7Schematic showing the possible variations in the Δ17O value of N2O from that of the source of O atoms (O2 and NO) during transformations, including nitrification (orange circles), denitrification (green circles), and reduction (yellow circles), due to variations in isotope fractionation and β from 0.525 to 0.5305.
Similarly, the fractionation of oxygen isotopes during the transformation of O atoms in NO to those in N2O through denitrification accompanies significant variations in δ18O from NO to N2O as well. The Δ17O value of N2O produced through NO reduction could be somewhat different from that of NO, even if all O atoms in N2O were derived from NO, due to the possible differences in β from 0.528 during the reaction (Fig. 7). The average variation in δ18O from NO to N2O due to fractionation (Δδ18O (N2O−NO)) was estimated to be 25 ‰ on average (Figs. 4e and 6a) based on the difference in δ18O values between N2O (+33 ± 10 ‰; n=19) and NO in this study (+8 ± 9 ‰; n=24). Thus, we quantified the possible range of variations in the Δ17O value of N2O from that of NO to be less than 0.075 ‰ (Fig. 7), based on the observed Δδ18O (N2O–NO) and the possible variation range of β, from 0.525 to 0.5305.
Similarly, kinetic fractionation during the reduction of N2O to N2 accompanies variation in δ18O from original N2O to residual N2O as well. The Δ17O value of residual N2O could somewhat differ from that of the original N2O. Previous studies have reported the range of variations in δ18O from original N2O to residual N2O due to kinetic fractionation to be less than 10 ‰ on average through incubation experiments (Lewicka-Szczebak et al., 2014, 2015). Thus, we quantified the possible range of variations in the Δ17O value of residual N2O from that of original N2O to be less than 0.03 ‰ (Fig. 7), based on Δδ18O (less than 10 ‰) and the variation range of β, from 0.525 to 0.5305.
These possible variations in Δ17O (less than 0.075 ‰) were much less than the difference in Δ17O values between O2 and NO in the forested soil (0.7 ‰ on average; Fig. 4c). In addition, the possible variation ranges in Δ17O become much smaller if the differences in β from 0.528 were smaller than those used in the calculations (from 0.525 to 0.5305). Thus, we concluded that the possible variations in the Δ17O value of N2O from that of the source molecules of O atoms (O2, H2O, and NO) during the transformations, including nitrification, denitrification, and reduction, were negligible.
While the Δ17O values of soil O2 and H2O used in this study were referred from atmospheric O2 and rainwater, respectively, the processes in soil, including diffusion and respiration of O2 and evaporation and infiltration of rainwater, may cause significant isotopic fractionations of δ18O, which could consequently alter the Δ17O values of atmospheric O2 and rainwater. Thus, prior to using Δ17O values to identify the pathways of N2O production in soils, we evaluated the possible variations in the Δ17O values of O2 and H2O in soil compared to those of atmospheric O2 and rainwater. The details are presented below.
For soil O2, Aggarwal and Dillon (1998) measured the δ18O values in soil gas at a depth of 3–4 m at a site near Lincoln, Nebraska, USA ranged from +23.3 ‰ to +27.2 ‰, showing the values were comparable with that of atmospheric O2 (+23.5 ‰ after adjustment in Aggarwal and Dillon, 1998). This confirms that the isotopic fractionations of soil O2 induced from soil respiration and diffusion processes were not significant. Because the maximum variation in δ18O from atmospheric O2 to soil O2 was less than 3.7 ‰ (27.2 ‰–23.5 ‰), using the method presented in Fig. 7, we quantified the possible variations in the Δ17O value of soil O2 from that of atmospheric O2 to be less than 0.01 ‰. Thus, we ignored the negligible variations in this study.
Similarly, for soil H2O, Lyu (2021) observed that δ18O values in soil H2O at the depths of 0–5, 15–20, and 40–45 cm in a subtropical forest plantation ranged from −4 ‰ to −10 ‰, which fully overlapped with local rainwater (−1 ‰ to −16 ‰), indicating insignificant isotopic fractionations of soil H2O during hydrological processes such as infiltration and evaporation. In addition, Aron et al. (2021) compiled Δ17O values of terrestrial H2O including rainwater, surface, and subsurface water in earth, ranging from +0.06 ‰ to −0.06 ‰ which did not show significant differences with each other, also indicating that the possible variations of Δ17O values of soil H2O compared to that of rainwater should be negligible. Finally, we added the variations of Δ17O values (+0.06 ‰ to −0.06 ‰) of terrestrial H2O reported in Aron et al. (2021) to Figs. 4 and 6 as the uncertainties of Δ17O values of soil H2O.
In the forested soil, N2O exhibited Δ17O values (−0.30 ± 0.09 ‰ on average) that were close to that of O2 (−0.44 ‰) but deviated from those of soil NO on fine days (+0.24 ± 0.14 ‰; Fig. 4c and d), implying that nitrification was the main pathway to produce N2O in the soil on fine days. Conversely, N2O emitted from the soil on rainy days exhibited Δ17O values (+0.12 ± 0.13 ‰) that were close to those of soil NO (+0.22 ± 0.09 ‰) and soil H2O (+0.03 ‰) but deviated from that of O2 (Fig. 4c and d), implying that (1) the main pathway to produce N2O changed from nitrification on fine days to denitrification on rainy days and/or (2) the possible contribution of O atoms derived from soil H2O became more active during the production of N2O in the soil on rainy days.
4.2 Changes in the Δ17O of N2O emitted from artificially fertilized soils
To quantitatively constrain the possible contributions of O atoms derived from soil H2O during the production of N2O in the soil, we observed changes in the isotopic compositions of N2O from the same soil in response to artificial fertilization. In the plot fertilized with CS, the Δ17O value of N2O emitted from the soil (+7.79 ± 0.61 ‰ on the average of 2 and 6 d after the fertilization) became significantly closer to that of soil NO (+10.3 ± 2.9 ‰) compared with that of atmospheric O2 (−0.44 ‰; Fig. 6b). This suggested that denitrification became the main pathway of N2O production, probably because of fertilization, which resulted in a significantly higher concentration of NO (278.4 ± 43.2 mg N kg−1; Table S1) than that of NH (15.8 ± 4.1 mg N kg−1) in the CS plot. In addition, N2O emitted from the CS plot exhibited Δ17O values that were significantly different from those of soil H2O (+0.03 ‰; Fig. 6b), implying that the contribution of O atoms derived from soil H2O was minor during the reduction of NO to produce N2O. If all the O atoms with low Δ17O values in N2O were derived from soil H2O (+0.03 ‰) in the CS plot, the contribution of O atoms derived from soil H2O was calculated to be 24 % ((10.30 ‰–7.79 ‰) (10.30 ‰–0.03 ‰)), based on the isotopic mass balance. If the O2 also contributed to the N2O production in the CS plot, the contribution of O atoms derived from soil H2O should be further reduced. As a result, we determined that the maximum possible contribution of O atoms derived from soil H2O during the reduction of NO to N2O was 24 %.
On the other hand, in the plot fertilized with urea (U plot), the Δ17O value of N2O (−0.15 ± 0.01 ‰) was close to that of O2 (−0.44 ‰) compared with that of soil NO (+0.24 ± 0.10 ‰). This suggested that nitrification was the main pathway of N2O production (Fig. 6b), probably due to the enhancement of NH concentration (423.1 ± 18.2 mg N kg−1; Table S1) compared with that of NO (13.0 ± 10.7 mg N kg−1) in the U plot. In addition, N2O emitted from the U plot exhibited Δ17O values that were significantly different from that of soil H2O (+0.03 ‰; Fig. 6b), implying that the contribution of O atoms derived from soil H2O was also minor during the oxidation of NH to produce N2O. Consequently, the contribution of O atoms derived from soil H2O was minor in the soil during N2O production, irrespective of the pathways of N2O production being either nitrification or denitrification. In addition, it is difficult to explain the observed increases in the emission flux of N2O from the soil on rainy days based only on the active contribution of O atoms derived from soil H2O. Consequently, we concluded that N2O production through denitrification became active in the soil on rainy days, which resulted in increased N2O emission and higher Δ17O values.
4.3 Verification of active N2O emission by denitrification on rainy days
The forested soil exhibited significantly lower WFPS on fine days (66.1 ± 6.2 %; Table S1) than on rainy days (95.6 ± 19.1 %), implying that the O2 concentration in the soil was higher on fine days than on rainy days. Using the isotope tracer enriched in 15N (15NO or 15NH), Mathieu et al. (2006) estimated the relative importance of nitrification and denitrification to produce N2O in soil. They found that nitrification produced the majority of N2O under low WFPS conditions (75 %), whereas denitrification accounted for more than 85 % of N2O produced under high WFPS conditions (150 %). Similarly, using natural stable isotopes (SP), Ibraim et al. (2019) reported the primary pathway for N2O production in a grassland shifted from nitrification to denitrification as increasing WFPS, when WFPS was below 90 %. Thus, we conclude that the lower WFPS in the soil caused oxic conditions on fine days, resulting in nitrification as the primary pathway for N2O production in the soil. Conversely, the higher WFPS caused redox conditions in the soil on rainy days, resulting in active N2O production through denitrification in the soil (Fig. 4a and b).
During continuous monitoring of the emission flux of N2O from an agricultural soil for four years, Anthony et al. (2023) found short-term increases in the emission flux during or immediately after rainfall or irrigation. They referred to this high emission flux as “hot moments” and defined it as exceeding four standard deviations of that of normal periods. They also found significant correlations between the emission flux and WFPS, leading to the conclusion that variations in the concentrations of O2 in surface soils were responsible for the hot moments of N2O emissions. Although the hot moments accounted for 1 % of all measurements, they contributed up to 57 % of the annual emissions, indicating their significance as a source of atmospheric emissions. In this study, the emission flux of N2O on rainy days also exceeded four standard deviations of that on fine days (Fig. 4a and b). The Δ17O evidence of N2O found in this study further verified that denitrification was mainly responsible for the enhancement of N2O production during the hot moments.
4.4 Changes in the pathway of N2O production due to fertilization with urea
During our observation on the plot fertilized with urea (U plot), N2O emitted from the plot exhibited Δ17O values (−0.15 ± 0.01 ‰ on average; Fig. 6b) that were significantly higher than those of the plot without fertilization (NF plot; −0.35 ± 0.04 ‰ on average). Although an increase in the contribution of O atoms derived from soil H2O could be responsible for the Δ17O values in addition to an increase in N2O production through nitrification, we concluded that an increase in N2O production through NO reduction was responsible for the Δ17O values (−0.15 ± 0.01 ‰ on average) of N2O produced in the plot in response to fertilization of urea NH for the following reasons.
Avrahami et al. (2002) reported that fertilization with urea NH in soil promoted the oxidation of NH and thus provided electron acceptors for denitrification. That is, the enrichment of nitrate through nitrification also promotes denitrification. Based on the stable isotopes of N2O (δ15N, δ18O, and SP), along with in vitro acetylene blockage experiments on agricultural soils fertilized with NH, Zhang et al. (2016) reported that while 50 %–70 % of N2O was produced through nitrification, nitrifier denitrification (NH NO N2O) and/or heterotrophic denitrification (NH NO NO N2O) accounted for 30 %–50 % of N2O production. Similar results have also been reported in previous studies. Although N2O production through nitrification was simulated by fertilization with urea NH in various soils, denitrification also accounted for a significant portion of N2O production (Kaushal et al., 2022; Khalil et al., 2004; Zhu et al., 2013). In addition to nitrifier and heterotrophic denitrification, N2O produced through the anammox process (NH NO N2O, Okabe et al., 2011; Tang et al., 2011; Tsushima et al., 2007) can be responsible for the reduction of NO as well. Zhu et al. (2011) found that the highest rate of anammox was comparable with that of denitrification in soils fertilized with NH (6.2–178.8 mg N kg−1). These previous experiments support our observation on the U plot that the addition of urea NH stimulates N2O production through nitrifier denitrification and/or heterotrophic denitrification, and/or anammox reaction in addition to nitrification. The increased NO concentration in the U plot (13.0 ± 10.7 mg N kg−1) compared with those in the NF plot (2.3 ± 0.5 mg N kg−1) probably due to nitrification stimulated by the addition of NH may be responsible for the active reduction of NO.
4.5 Stable Δ17O as a natural signature for identifying N2O production pathways
Although the δ18O values of N2O emitted from the soil were significantly higher than those of the sources of O atoms in N2O (NO, O2, and H2O; Figs. 4e and 6a) due to the fractionations of oxygen isotopes during the production and/or reduction of N2O, the Δ17O values of N2O remained within the range of these sources. This indicates that Δ17O primarily reflects the pathways of N2O production, providing information distinct from the δ18O signature because Δ17O is stable during the processes of biogeochemical isotope fractionation. Moreover, while N2O emission from the forested soil did not show significant differences in δ15N and δ18O values between fine and rainy days due to the fractionations of nitrogen and oxygen isotopes (Fig. 4f and h), the significant difference in the Δ17O values of N2O between fine and rainy days (Fig. 4d) highlights Δ17O to be a promising natural signature for identifying the pathways of N2O production in soils.
In addition to natural soils, the stable Δ17O signature is expected to be useful for identifying the pathways of N2O production in various ecosystems, such as agricultural soils and aquatic environments, where the isotopic fractionations of nitrogen and oxygen isotopes involving biogeochemical processes are significant as well. However, to identify the pathways of N2O production quantitatively, the uncertainties, including the β values of each reaction during N2O production and the contributions of O atoms derived from soil H2O during N2O production, should be quantified precisely in the future studies.
Temporal variations in Δ17O of N2O emitted from forested soil were determined to identify the main pathway of N2O production. Both Δ17O values and fluxes of N2O were significantly higher on rainy days compared to fine days. In addition, the Δ17O values of N2O emitted on rainy and fine days were close to those of soil NO and O2, respectively. Because NO and O2 were the source of O-atoms in N2O production through denitrification and nitrification, respectively, we concluded that while nitrification dominated N2O production on fine days, denitrification became active on rainy days, resulting in the N2O flux increasing. In addition, the Δ17O of N2O emitted from the same soil fertilized with either Chile saltpeter or urea exhibited values that were significantly different from those of soil H2O, implying that the contributions of O atoms derived from soil H2O during N2O production were minor. Furthermore, while N2O emitted from the forested soil did not show significant differences in δ15N and δ18O values between fine and rainy days, the significant difference in the Δ17O values of N2O highlights Δ17O to be a promising natural signature for identifying the pathways of N2O production in soils, because Δ17O is almost stable during isotope fractionation processes such as N2O production and reduction.
All the primary data are presented in the Supplement.
The supplement related to this article is available online at https://doi.org/10.5194/bg-22-4333-2025-supplement.
WD, UT, and FN designed the study. WD, TH, WR, MI, HX, and YK performed the field observations. WD, UT, TS and FN determined the concentrations and isotopic compositions of the samples. WD, TS, FN, and UT performed data analysis.
The contact author has declared that none of the authors has any competing interests.
Publisher's note: Copernicus Publications remains neutral with regard to jurisdictional claims made in the text, published maps, institutional affiliations, or any other geographical representation in this paper. While Copernicus Publications makes every effort to include appropriate place names, the final responsibility lies with the authors.
We thank the anonymous referees for their valuable remarks on an earlier version of this paper. We are grateful to the members of the Biogeochemistry Group at Nagoya University for their valuable support throughout this study.
This research has been supported by the Grant-in-Aid for Scientific Research from the Ministry of Education, Culture, Sports, Science, and Technology of Japan (grant nos. 22H00561, 17H00780, and 22K19846); the Grant-in-Aid for Japan Society for the Promotion of Science Fellows (grant no. 23KJ1088); the Yanmar Environmental Sustainability Support Association; the River Fund of the River Foundation, Japan; the Reiwa Environmental Foundation; and the National Research Foundation of Korea Grant from the South Korean Government (MSIT; the Ministry of Science and ICT, grant nos. NRF-2021M1A5A1065425, KOPRI-PN24011).
This paper was edited by David McLagan and reviewed by two anonymous referees.
Aggarwal, P. K. and Dillon, M. A.: Stable Isotope Composition of Molecular Oxygen in Soil Gas and Groundwater: A Potentially Robust Tracer for Diffusion and Oxygen Consumption Processes, Geochim. Cosmochim. Ac., 62, 577–584, https://doi.org/10.1016/S0016-7037(97)00377-3, 1998.
Anthony, T. L., Szutu, D. J., Verfaillie, J. G., Baldocchi, D. D., and Silver, W. L.: Carbon-sink potential of continuous alfalfa agriculture lowered by short-term nitrous oxide emission events, Nat. Commun., 14, 1926, https://doi.org/10.1038/s41467-023-37391-2, 2023.
Aron, P. G., Levin, N. E., Beverly, E. J., Huth, T. E., Passey, B. H., Pelletier, E. M., Poulsen, C. J., Winkelstern, I. Z., and Yarian, D. A.: Triple oxygen isotopes in the water cycle, Chem. Geol., 565, 120026, https://doi.org/10.1016/j.chemgeo.2020.120026, 2021.
Avrahami, S., Conrad, R., and Braker, G.: Effect of Soil Ammonium Concentration on N2O Release and on the Community Structure of Ammonia Oxidizers and Denitrifiers, Appl. Environ. Microbiol., 68, 5685–5692, https://doi.org/10.1128/AEM.68.11.5685-5692.2002, 2002.
Balderston, W. L., Sherr, B., and Payne, W. J.: Blockage by acetylene of nitrous oxide reduction in Pseudomonas perfectomarinus, Appl. Environ. Microbiol., 31, 504–508, https://doi.org/10.1128/aem.31.4.504-508.1976, 1976.
Bateman, E. J. and Baggs, E. M.: Contributions of nitrification and denitrification to N2O emissions from soils at different water-filled pore space, Biol. Fert. Soils, 41, 379–388, https://doi.org/10.1007/s00374-005-0858-3, 2005.
Cao, X. and Liu, Y.: Equilibrium mass-dependent fractionation relationships for triple oxygen isotopes, Geochim. Cosmochim. Ac., 75, 7435–7445, https://doi.org/10.1016/j.gca.2011.09.048, 2011.
Chen, G. C., Tam, N. F. Y., and Ye, Y.: Spatial and seasonal variations of atmospheric N2O and CO2 fluxes from a subtropical mangrove swamp and their relationships with soil characteristics, Soil Biol. Biochem., 48, 175–181, https://doi.org/10.1016/j.soilbio.2012.01.029, 2012.
Choudhary, M. A., Akramkhanov, A., and Saggar, S.: Nitrous oxide emissions from a New Zealand cropped soil: tillage effects, spatial and seasonal variability, Agr. Ecosyst. Environ., 93, 33–43, https://doi.org/10.1016/S0167-8809(02)00005-1, 2002.
Cliff, S. S., Brenninkmeijer, C. A. M., and Thiemens, M. H.: First measurement of the 18O 16O and 17O 16O ratios in stratospheric nitrous oxide: A mass-independent anomaly, J. Geophys. Res.-Atmos., 104, 16171–16175, https://doi.org/10.1029/1999JD900152, 1999.
Decock, C. and Six, J.: An assessment of N-cycling and sources of N2O during a simulated rain event using natural abundance 15N, Agr. Ecosyst. Environ., 165, 141–150, https://doi.org/10.1016/j.agee.2012.11.012, 2013.
Dickinson, R. E. and Cicerone, R. J.: Future global warming from atmospheric trace gases, Nature, 319, 109–115, https://doi.org/10.1038/319109a0, 1986.
Ding, W., Tsunogai, U., Nakagawa, F., Sambuichi, T., Sase, H., Morohashi, M., and Yotsuyanagi, H.: Tracing the source of nitrate in a forested stream showing elevated concentrations during storm events, Biogeosciences, 19, 3247–3261, https://doi.org/10.5194/bg-19-3247-2022, 2022.
Ding, W., Tsunogai, U., Nakagawa, F., Sambuichi, T., Chiwa, M., Kasahara, T., and Shinozuka, K.: Stable isotopic evidence for the excess leaching of unprocessed atmospheric nitrate from forested catchments under high nitrogen saturation, Biogeosciences, 20, 753–766, https://doi.org/10.5194/bg-20-753-2023, 2023.
Ding, W., Tsunogai, U., and Nakagawa, F.: Bias in calculating gross nitrification rates in forested catchments using the triple oxygen isotopic composition (Δ17O) of stream nitrate, Biogeosciences, 21, 4717–4722, https://doi.org/10.5194/bg-21-4717-2024, 2024.
Hattori, S., Nuñez Palma, Y., Itoh, Y., Kawasaki, M., Fujihara, Y., Takase, K., and Yoshida, N.: Isotopic evidence for seasonality of microbial internal nitrogen cycles in a temperate forested catchment with heavy snowfall, Sci. Total Environ., 690, 290–299, https://doi.org/10.1016/j.scitotenv.2019.06.507, 2019.
Hirota, A., Tsunogai, U., Komatsu, D. D., and Nakagawa, F.: Simultaneous determination of δ15N and δ18O of N2O and δ13C of CH4 in nanomolar quantities from a single water sample, Rapid Commun. Mass Sp., 24, 1085–1092, https://doi.org/10.1002/rcm.4483, 2010.
Hiyama, T., Kochi, K., Kobayashi, N., and Sirisampan, S.: Seasonal variation in stomatal conductance and physiological factors observed in a secondary warm-temperate forest, Ecol. Res., 20, 333–346, https://doi.org/10.1007/s11284-005-0049-6, 2005.
Homyak, P. M., Vasquez, K. T., Sickman, J. O., Parker, D. R., and Schimel, J. P.: Improving Nitrite Analysis in Soils: Drawbacks of the Conventional 2 M KCl Extraction, Soil Sci. Soc. Am. J., 79, 1237–1242, https://doi.org/10.2136/sssaj2015.02.0061n, 2015.
Ibraim, E., Wolf, B., Harris, E., Gasche, R., Wei, J., Yu, L., Kiese, R., Eggleston, S., Butterbach-Bahl, K., Zeeman, M., Tuzson, B., Emmenegger, L., Six, J., Henne, S., and Mohn, J.: Attribution of N2O sources in a grassland soil with laser spectroscopy based isotopocule analysis, Biogeosciences, 16, 3247–3266, https://doi.org/10.5194/bg-16-3247-2019, 2019.
Kaiser, J., Röckmann, T., and Brenninkmeijer, C. A. M.: Complete and accurate mass spectrometric isotope analysis of tropospheric nitrous oxide, J. Geophys. Res.-Atmos., 108, 4476, https://doi.org/10.1029/2003JD003613, 2003.
Kaiser, J., Hastings, M. G., Houlton, B. Z., Röckmann, T., and Sigman, D. M.: Triple Oxygen Isotope Analysis of Nitrate Using the Denitrifier Method and Thermal Decomposition of N2O, Anal. Chem., 79, 599–607, https://doi.org/10.1021/ac061022s, 2007.
Kaushal, R., Hsueh, Y.-H., Chen, C.-L., Lan, Y.-P., Wu, P.-Y., Chen, Y.-C., and Liang, M.-C.: Isotopic assessment of soil N2O emission from a sub-tropical agricultural soil under varying N-inputs, Sci. Total Environ., 827, 154311, https://doi.org/10.1016/j.scitotenv.2022.154311, 2022.
Keeling, C. D.: The concentration and isotopic abundances of atmospheric carbon dioxide in rural areas, Geochim. Cosmochim. Ac., 13, 322–334, https://doi.org/10.1016/0016-7037(58)90033-4, 1958.
Khalil, K., Mary, B., and Renault, P.: Nitrous oxide production by nitrification and denitrification in soil aggregates as affected by O2 concentration, Soil Biol. Biochem., 36, 687–699, https://doi.org/10.1016/j.soilbio.2004.01.004, 2004.
Kim, K.-R. and Craig, H.: Nitrogen-15 and Oxygen-18 Characteristics of Nitrous Oxide: A Global Perspective, Science, 262, 1855–1857, https://doi.org/10.1126/science.262.5141.1855, 1993.
Komatsu, D. D., Ishimura, T., Nakagawa, F., and Tsunogai, U.: Determination of the 15N 14N, 17O 16O, and 18O 16O ratios of nitrous oxide by using continuous-flow isotope-ratio mass spectrometry, Rapid Commun. Mass Sp., 22, 1587–1596, https://doi.org/10.1002/rcm.3493, 2008.
Kool, D. M., Wrage, N., Oenema, O., Dolfing, J., and Van Groenigen, J. W.: Oxygen exchange between (de)nitrification intermediates and H2O and its implications for source determination of NO and N2O: a review, Rapid Commun. Mass Sp., 21, 3569–3578, https://doi.org/10.1002/rcm.3249, 2007.
Kool, D. M., Dolfing, J., Wrage, N., and Van Groenigen, J. W.: Nitrifier denitrification as a distinct and significant source of nitrous oxide from soil, Soil Biol. Biochem., 43, 174–178, https://doi.org/10.1016/j.soilbio.2010.09.030, 2011.
Lewicka-Szczebak, D., Well, R., Köster, J. R., Fuß, R., Senbayram, M., Dittert, K., and Flessa, H.: Experimental determinations of isotopic fractionation factors associated with N2O production and reduction during denitrification in soils, Geochim. Cosmochim. Ac., 134, 55–73, https://doi.org/10.1016/j.gca.2014.03.010, 2014.
Lewicka-Szczebak, D., Well, R., Bol, R., Gregory, A. S., Matthews, G. P., Misselbrook, T., Whalley, W. R., and Cardenas, L. M.: Isotope fractionation factors controlling isotopocule signatures of soil-emitted N2O produced by denitrification processes of various rates, Rapid Commun. Mass Sp., 29, 269–282, https://doi.org/10.1002/rcm.7102, 2015.
Lewicka-Szczebak, D., Jansen-Willems, A., Müller, C., Dyckmans, J., and Well, R.: Nitrite isotope characteristics and associated soil N transformations, Sci. Rep., 11, 5008, https://doi.org/10.1038/s41598-021-83786-w, 2021.
Lin, W., Ding, J., Li, Y., Zhang, W., Ahmad, R., Xu, C., Mao, L., Qiang, X., Zheng, Q., and Li, Q.: Partitioning of sources of N2O from soil treated with different types of fertilizers by the acetylene inhibition method and stable isotope analysis, Europ. J. Soil Sci., 70, 1037–1048, https://doi.org/10.1111/ejss.12782, 2019.
Luo, J., Ledgard, S. F., and Lindsey, S. B.: Nitrous oxide emissions from application of urea on New Zealand pasture, New Zeal. J. Agr. Res., 50, 1–11, https://doi.org/10.1080/00288230709510277, 2007.
Lyu, S.: Variability of δ2H and δ18O in Soil Water and Its Linkage to Precipitation in an East Asian Monsoon Subtropical Forest Plantation, Water, 13, 2930, https://doi.org/10.3390/w13202930, 2021.
Mathieu, O., Hénault, C., Lévêque, J., Baujard, E., Milloux, M.-J., and Andreux, F.: Quantifying the contribution of nitrification and denitrification to the nitrous oxide flux using 15N tracers, Environ. Pollut., 144, 933–940, https://doi.org/10.1016/j.envpol.2006.02.005, 2006.
Matsuhisa, Y., Goldsmith, J. R., and Clayton, R. N.: Mechanisms of hydrothermal crystallization of quartz at 250 °C and 15 kbar, Geochim. Cosmochim. Ac., 42, 173–182, https://doi.org/10.1016/0016-7037(78)90130-8, 1978.
McIlvin, M. R. and Altabet, M. A.: Chemical Conversion of Nitrate and Nitrite to Nitrous Oxide for Nitrogen and Oxygen Isotopic Analysis in Freshwater and Seawater, Anal. Chem., 77, 5589–5595, https://doi.org/10.1021/ac050528s, 2005.
McKenney, D. J., Wade, D. L., and Findlay, W. I.: Rates of N2O evolution from N-fertilized soil, Geophys. Res. Lett., 5, 777–780, https://doi.org/10.1029/GL005i009p00777, 1978.
Michalski, G., Böhlke, J. K., and Thiemens, M.: Long term atmospheric deposition as the source of nitrate and other salts in the Atacama Desert, Chile: New evidence from mass-independent oxygen isotopic compositions, Geochim. Cosmochim. Ac., 68, 4023–4038, https://doi.org/10.1016/j.gca.2004.04.009, 2004.
Miller, M. F.: Isotopic fractionation and the quantification of 17O anomalies in the oxygen three-isotope system: an appraisal and geochemical significance, Geochim. Cosmochim. Ac., 66, 1881–1889, https://doi.org/10.1016/S0016-7037(02)00832-3, 2002.
Mulvaney, R. L. and Kurtz, L. T.: A New Method for Determination of 15N-Labeled Nitrous Oxide, Soil Sci. Soc. Am. J., 46, 1178–1184, https://doi.org/10.2136/sssaj1982.03615995004600060012x, 1982.
Nakagawa, F., Tsunogai, U., Obata, Y., Ando, K., Yamashita, N., Saito, T., Uchiyama, S., Morohashi, M., and Sase, H.: Export flux of unprocessed atmospheric nitrate from temperate forested catchments: a possible new index for nitrogen saturation, Biogeosciences, 15, 7025–7042, https://doi.org/10.5194/bg-15-7025-2018, 2018.
Okabe, S., Oshiki, M., Takahashi, Y., and Satoh, H.: N2O emission from a partial nitrification–anammox process and identification of a key biological process of N2O emission from anammox granules, Water Res., 45, 6461–6470, https://doi.org/10.1016/j.watres.2011.09.040, 2011.
Opdyke, M. R., Ostrom, N. E., and Ostrom, P. H.: Evidence for the predominance of denitrification as a source of N2O in temperate agricultural soils based on isotopologue measurements, Global Biogeochem. Cy., 23, GB4018, https://doi.org/10.1029/2009GB003523, 2009.
Ostrom, N. E., Pitt, A., Sutka, R., Ostrom, P. H., Grandy, A. S., Huizinga, K. M., and Robertson, G. P.: Isotopologue effects during N2O reduction in soils and in pure cultures of denitrifiers, J. Geophys. Res.-Biogeo., 112, G02005, https://doi.org/10.1029/2006JG000287, 2007.
Pack, A. and Herwartz, D.: The triple oxygen isotope composition of the Earth mantle and understanding Δ17O variations in terrestrial rocks and minerals, Earth Planet. Sc. Lett., 390, 138–145, https://doi.org/10.1016/j.epsl.2014.01.017, 2014.
Sambuichi, T., Tsunogai, U., Kura, K., Nakagawa, F., and Ohba, T.: High-precision Δ'17O measurements of geothermal H2O and MORB on the VSMOW-SLAP scale: evidence for active oxygen exchange between the lithosphere and hydrosphere, Geochem. J., 55, e25–e33, https://doi.org/10.2343/geochemj.2.0644, 2021.
Sambuichi, T., Tsunogai, U., Ito, M., and Nakagawa, F.: First Measurements on Triple Oxygen Isotopes of Dissolved Inorganic Phosphate in the Hydrosphere, Environ. Sci. Technol., 57, 3415–3424, https://doi.org/10.1021/acs.est.2c08520, 2023.
Sharp, Z. D. and Wostbrock, J. A. G.: Standardization for the Triple Oxygen Isotope System: Waters, Silicates, Carbonates, Air, and Sulfates, Rev. Mineral. Geochem., 86, 179–196, https://doi.org/10.2138/rmg.2021.86.05, 2021.
Sharp, Z. D., Gibbons, J. A., Maltsev, O., Atudorei, V., Pack, A., Sengupta, S., Shock, E. L., and Knauth, L. P.: A calibration of the triple oxygen isotope fractionation in the SiO2–H2O system and applications to natural samples, Geochim. Cosmochim. Ac., 186, 105–119, https://doi.org/10.1016/j.gca.2016.04.047, 2016.
Shen, Q. R., Ran, W., and Cao, Z. H.: Mechanisms of nitrite accumulation occurring in soil nitrification, Chemosphere, 50, 747–753, https://doi.org/10.1016/S0045-6535(02)00215-1, 2003.
Snider, D. M., Schiff, S. L., and Spoelstra, J.: 15N 14N and 18O 16O stable isotope ratios of nitrous oxide produced during denitrification in temperate forest soils, Geochim. Cosmochim. Ac., 73, 877–888, https://doi.org/10.1016/j.gca.2008.11.004, 2009.
Takahashi, K.: Oxygen isotope ratios between soil water and stem water of trees in pot experiments, Ecol. Res., 13, 1–5, https://doi.org/10.1046/j.1440-1703.1998.00240.x, 1998.
Tang, C.-J., Zheng, P., Wang, C.-H., Mahmood, Q., Zhang, J.-Q., Chen, X.-G., Zhang, L., and Chen, J.-W.: Performance of high-loaded ANAMMOX UASB reactors containing granular sludge, Water Res., 45, 135–144, https://doi.org/10.1016/j.watres.2010.08.018, 2011.
Thiemens, M. H. and Trogler, W. C.: Nylon Production: An Unknown Source of Atmospheric Nitrous Oxide, Science, 251, 932–934, https://doi.org/10.1126/science.251.4996.932, 1991.
Tian, H., Xu, R., Canadell, J. G., Thompson, R. L., Winiwarter, W., Suntharalingam, P., Davidson, E. A., Ciais, P., Jackson, R. B., Janssens-Maenhout, G., Prather, M. J., Regnier, P., Pan, N., Pan, S., Peters, G. P., Shi, H., Tubiello, F. N., Zaehle, S., Zhou, F., Arneth, A., Battaglia, G., Berthet, S., Bopp, L., Bouwman, A. F., Buitenhuis, E. T., Chang, J., Chipperfield, M. P., Dangal, S. R. S., Dlugokencky, E., Elkins, J. W., Eyre, B. D., Fu, B., Hall, B., Ito, A., Joos, F., Krummel, P. B., Landolfi, A., Laruelle, G. G., Lauerwald, R., Li, W., Lienert, S., Maavara, T., MacLeod, M., Millet, D. B., Olin, S., Patra, P. K., Prinn, R. G., Raymond, P. A., Ruiz, D. J., van der Werf, G. R., Vuichard, N., Wang, J., Weiss, R. F., Wells, K. C., Wilson, C., Yang, J., and Yao, Y.: A comprehensive quantification of global nitrous oxide sources and sinks, Nature, 586, 248–256, https://doi.org/10.1038/s41586-020-2780-0, 2020.
Toyoda, S., Yano, M., Nishimura, S., Akiyama, H., Hayakawa, A., Koba, K., Sudo, S., Yagi, K., Makabe, A., Tobari, Y., Ogawa, N. O., Ohkouchi, N., Yamada, K., and Yoshida, N.: Characterization and production and consumption processes of N2O emitted from temperate agricultural soils determined via isotopomer ratio analysis, Global Biogeochem. Cy., 25, GB2008, https://doi.org/10.1029/2009GB003769, 2011.
Toyoda, S., Kuroki, N., Yoshida, N., Ishijima, K., Tohjima, Y., and Machida, T.: Decadal time series of tropospheric abundance of N2O isotopomers and isotopologues in the Northern Hemisphere obtained by the long-term observation at Hateruma Island, Japan, J. Geophys. Res.-Atmos., 118, 3369–3381, https://doi.org/10.1002/jgrd.50221, 2013.
Toyoda, S., Yoshida, N., and Koba, K.: Isotopocule analysis of biologically produced nitrous oxide in various environments, Mass Spectrom. Rev., 36, 135–160, https://doi.org/10.1002/mas.21459, 2017.
Tsunogai, U., Ishibashi, J., Wakita, H., and Gamo, T.: Methane-rich plumes in the Suruga Trough (Japan) and their carbon isotopic characterization, Earth Planet. Sc. Lett., 160, 97–105, https://doi.org/10.1016/S0012-821X(98)00075-2, 1998.
Tsunogai, U., Hachisu, Y., Komatsu, D. D., Nakagawa, F., Gamo, T., and Akiyama, K.: An updated estimation of the stable carbon and oxygen isotopic compositions of automobile CO emissions, Atmos. Environ., 37, 4901–4910, https://doi.org/10.1016/j.atmosenv.2003.08.008, 2003.
Tsunogai, U., Kido, T., Hirota, A., Ohkubo, S. B., Komatsu, D. D., and Nakagawa, F.: Sensitive determinations of stable nitrogen isotopic composition of organic nitrogen through chemical conversion into N2O, Rapid Commun. Mass Sp., 22, 345–354, https://doi.org/10.1002/rcm.3368, 2008.
Tsunogai, U., Komatsu, D. D., Daita, S., Kazemi, G. A., Nakagawa, F., Noguchi, I., and Zhang, J.: Tracing the fate of atmospheric nitrate deposited onto a forest ecosystem in Eastern Asia using Δ17O, Atmos. Chem. Phys., 10, 1809–1820, https://doi.org/10.5194/acp-10-1809-2010, 2010.
Tsunogai, U., Kamimura, K., Anzai, S., Nakagawa, F., and Komatsu, D. D.: Hydrogen isotopes in volcanic plumes: Tracers for remote temperature sensing of fumaroles, Geochim. Cosmochim. Ac., 75, 4531–4546, https://doi.org/10.1016/j.gca.2011.05.023, 2011.
Tsushima, I., Ogasawara, Y., Kindaichi, T., Satoh, H., and Okabe, S.: Development of high-rate anaerobic ammonium-oxidizing (anammox) biofilm reactors, Water Res., 41, 1623–1634, https://doi.org/10.1016/j.watres.2007.01.050, 2007.
Uechi, Y. and Uemura, R.: Dominant influence of the humidity in the moisture source region on the 17O-excess in precipitation on a subtropical island, Earth Planet. Sc. Lett., 513, 20–28, https://doi.org/10.1016/j.epsl.2019.02.012, 2019.
Verhoeven, E., Barthel, M., Yu, L., Celi, L., Said-Pullicino, D., Sleutel, S., Lewicka-Szczebak, D., Six, J., and Decock, C.: Early season N2O emissions under variable water management in rice systems: source-partitioning emissions using isotope ratios along a depth profile, Biogeosciences, 16, 383–408, https://doi.org/10.5194/bg-16-383-2019, 2019.
Wankel, S. D., Ziebis, W., Buchwald, C., Charoenpong, C., de Beer, D., Dentinger, J., Xu, Z., and Zengler, K.: Evidence for fungal and chemodenitrification based N2O flux from nitrogen impacted coastal sediments, Nat. Commun., 8, 15595, https://doi.org/10.1038/ncomms15595, 2017.
WMO: WMO greenhouse gas bulletin (GHG Bulletin), https://library.wmo.int/records/item/68532-no-19-15-november-2023 (last access: 14 June 2025), 2023.
Wrage, N., Velthof, G. L., van Beusichem, M. L., and Oenema, O.: Role of nitrifier denitrification in the production of nitrous oxide, Soil Biol. Biochem., 33, 1723–1732, https://doi.org/10.1016/S0038-0717(01)00096-7, 2001.
Wrage, N., Lauf, J., del Prado, A., Pinto, M., Pietrzak, S., Yamulki, S., Oenema, O., and Gebauer, G.: Distinguishing sources of N2O in European grasslands by stable isotope analysis, Rapid Commun. Mass Sp., 18, 1201–1207, https://doi.org/10.1002/rcm.1461, 2004.
Wrage, N., Groenigen, J. W. van, Oenema, O., and Baggs, E. M.: A novel dual-isotope labelling method for distinguishing between soil sources of N2O, Rapid Commun. Mass Sp., 19, 3298–3306, https://doi.org/10.1002/rcm.2191, 2005.
Xu, H., Tsunogai, U., Nakagawa, F., Li, Y., Ito, M., Sato, K., and Tanimoto, H.: Determination of the triple oxygen isotopic composition of tropospheric ozone in terminal positions using a multistep nitrite-coated filter-pack system, Rapid Commun. Mass Sp., 35, e9124, https://doi.org/10.1002/rcm.9124, 2021.
Yan, Y., Sha, L., Cao, M., Zheng, Z., Tang, J., Wang, Y., Zhang, Y., Wang, R., Liu, G., Wang, Y., and Sun, Y.: Fluxes of CH4 and N2O from soil under a tropical seasonal rain forest in Xishuangbanna, Southwest China, J. Environ. Sci., 20, 207–215, https://doi.org/10.1016/S1001-0742(08)60033-9, 2008.
York, D., Evensen, N. M., Martıìnez, M. L., and De Basabe Delgado, J.: Unified equations for the slope, intercept, and standard errors of the best straight line, Am. J. Phys., 72, 367–375, https://doi.org/10.1119/1.1632486, 2004.
Young, E. D., Galy, A., and Nagahara, H.: Kinetic and equilibrium mass-dependent isotope fractionation laws in nature and their geochemical and cosmochemical significance, Geochim. Cosmochim. Ac., 66, 1095–1104, https://doi.org/10.1016/S0016-7037(01)00832-8, 2002.
Yu, L., Harris, E., Lewicka-Szczebak, D., Barthel, M., Blomberg, M. R. A., Harris, S. J., Johnson, M. S., Lehmann, M. F., Liisberg, J., Müller, C., Ostrom, N. E., Six, J., Toyoda, S., Yoshida, N., and Mohn, J.: What can we learn from N2O isotope data? – Analytics, processes and modelling, Rapid Commun. Mass Sp., 34, e8858, https://doi.org/10.1002/rcm.8858, 2020.
Zhang, W., Li, Y., Xu, C., Li, Q., and Lin, W.: Isotope signatures of N2O emitted from vegetable soil: Ammonia oxidation drives N2O production in NH-fertilized soil of North China, Sci. Rep., 6, 29257, https://doi.org/10.1038/srep29257, 2016.
Zhu, G., Wang, S., Wang, Y., Wang, C., Risgaard-Petersen, N., Jetten, M. S., and Yin, C.: Anaerobic ammonia oxidation in a fertilized paddy soil, ISME J., 5, 1905–1912, https://doi.org/10.1038/ismej.2011.63, 2011.
Zhu, X., Burger, M., Doane, T. A., and Horwath, W. R.: Ammonia oxidation pathways and nitrifier denitrification are significant sources of N2O and NO under low oxygen availability, P. Natl. Acad. Sci. USA, 110, 6328–6333, https://doi.org/10.1073/pnas.1219993110, 2013.
Zou, Y., Hirono, Y., Yanai, Y., Hattori, S., Toyoda, S., and Yoshida, N.: Rainwater, soil water, and soil nitrate effects on oxygen isotope ratios of nitrous oxide produced in a green tea (Camellia sinensis) field in Japan, Rapid Commun. Mass Sp., 29, 891–900, https://doi.org/10.1002/rcm.7176, 2015.