the Creative Commons Attribution 4.0 License.
the Creative Commons Attribution 4.0 License.
 | 02 Oct 2025
Photosynthetic electron, carbon, and oxygen fluxes within a mosaic of Fe limitation in the California Current upwelling system
Kate Schuler
Emily Speciale
Adrian Marchetti
Claire Till
Ralph Till
Philippe Tortell
We compare primary productivity estimates based on different photosynthetic “currencies” (electrons, O2, and carbon) measured in the dynamic coastal upwelling waters of the California Current. Fast repetition rate fluorometry and O2 measurements were used to collect high-resolution underway estimates of photosynthetic electron transport rates and net community productivity, respectively, alongside on-station 14C uptake experiments to measure gross carbon fixation rates. Our survey captured two upwelling filaments at Cape Blanco and Cape Mendocino with distinct biogeochemical signatures and iron availabilities, enabling us to examine photosynthetic processes along a natural iron gradient. Significant differences in photophysiology, cell sizes, Si: draw-down ratios, and molecular markers of Fe stress indicated that phytoplankton assemblages near Cape Mendocino were Fe stressed, while those near Cape Blanco were Fe replete. Upwelling of O2-poor deep water to the surface complicated O2-based net community productivity estimates, but we were able to correct for these vertical mixing effects using continuous [N2O] surface measurements and depth-profiles of . Vertical mixing corrections were strongly correlated to sea surface temperature, which serves as an N2O-independent proxy for upwelling. All three productivity estimates reflected trends in Fe-stress physiology, indicating greater productivity near Cape Blanco compared to Cape Mendocino. For all phytoplankton assemblages, carbon fixation varied as a hyperbolic function of photosynthetic electron transport rates, but the derived parameters of this relationship were variable and significantly correlated with physiological indicators of Fe stress (σPSII, , Si : , and diatom-specific PSI gene expression), suggesting that iron availability influenced the coupling between photosynthetic electron transport and carbon fixation. Net community productivity showed strong coherence with daily integrated photosynthetic electron transport rates across the entire cruise track, with no apparent relationship with Fe stress. This result suggests that fluorescence-based estimates of gross photochemistry are still a good indicator for bulk primary productivity, even if Fe limitation influences the stoichiometric relationship between different productivity currencies.
- Article
(7195 KB) - Full-text XML
- BibTeX
- EndNote


Along the eastern boundaries of ocean basins, coastal upwelling delivers nutrient-rich deep water to the euphotic zone, sustaining high phytoplankton growth rates and primary productivity (PP; Bograd et al., 2023). Despite representing less than 1 % of the surface ocean, these productive upwelling ecosystems support ∼20 % of global fishery catches (Pauly and Christensen, 1995) and play a disproportionate role in ocean carbon uptake through the “biological carbon pump” (Mathis et al., 2024). Quantifying rates of PP within eastern boundary currents is thus vital for accurate carbon budgeting and fishery yield predictions (Marshak and Link, 2021), yet this remains challenging due to the highly dynamic nature of these systems.
The California Current system (CCS) is one of the best-studied eastern boundary currents, extending from British Columbia, Canada, to Baja California, Mexico. Upwelling in the CCS occurs during spring and summer when northerly winds drive Ekman transport of surface water offshore. Within the upwelling season, short-term changes in wind speed and direction can dampen or reverse upwelling signals on the scale of hours to days, while complex coastline geometry directs wind flow, creating upwelling hotspots in the lee of capes (Castelao and Luo, 2018). Underlying bathymetric features and deep-water composition further influence the nature of upwelling filaments and the availability of macro- and micronutrients. In regions with shallow and wide continental shelves, sediment deposition provides a primary source of Fe and other micronutrients (Deutsch et al., 2021). In contrast, waters overlying steep narrow shelves retain less Fe, and PP in these regions can be limited by Fe availability despite the presence of upwelling conditions (Biller et al., 2013). The resulting “mosaic of Fe limitation” influences the distribution of phytoplankton biomass and productivity across the CCS (Till et al., 2019; Hutchins et al., 1998). Resolving ecosystem responses to such a heterogenous environment requires high-resolution measurements.
Traditionally, PP has been measured using discrete bottle incubations where the net change in dissolved O2 or particulate organic carbon is measured over time. Shorter incubations approximate gross primary productivity (GPP), whereas longer incubations allow time for respiration to act upon tracers, yielding estimates somewhere between GPP and net PP (). Although bottle incubations are still widely used to directly observe carbon fixation rates, the resulting measurements can be ambiguous in terms of GPP vs. NPP, while also providing low sampling resolution and posing potential containment artifacts (Banse, 2002). To avoid these challenges, a number of high-throughput PP proxies have been developed based on advances in dissolved gas measurements, bio-optical techniques, and satellite-based ocean color observations (IOCCG Protocol Series, 2022). These diverse PP methodologies target different photosynthetic processes, from subcellular light absorption to ecosystem-scale carbon export.
At the smallest spatial and temporal scales, photosystem II (PSII) electron transport rates (ETRPSII) quantify light absorption and conversion to chemical energy for a variety of metabolic activities including carbon fixation. Measurements of ETRPSII can be obtained from active chlorophyll fluorescence techniques, which exploit the inverse relationship between PSII fluorescence and photochemical yields to enable noninvasive and high-frequency measurement from underway seawater lines (Kranz et al., 2020; Sezginer et al., 2023) or autonomous platforms (e.g., Carvalho et al., 2020). Downstream of ETRPSII, carbon fixation can be directly measured using bottle incubations or approximated from empirical algorithms relating NPP to remotely sensed chlorophyll (Chl) concentration, sea surface temperature (SST), and photosynthetically available radiation (PAR) (Behrenfeld et al., 2005; Saba et al., 2011; Behrenfeld and Falkowski, 1997). Finally, net community productivity (NCP) represents the difference between GPP and community-wide respiration and can be equated to carbon export out of the mixed layer. This term can be derived from measurements of biological oxygen saturation, , using Ar normalization of O2 to correct for physical influences on gas disequilibria (e.g., temperature or salinity changes or bubble injection) to isolate the biological signal (Cassar et al., 2009; Craig and Hayward, 1987). Assuming steady-state conditions, O2 fluxes from the mixed layer represent a balance between net biological production and sea–air exchange, allowing the calculation of NCP from sea–air flux estimates. Steady state assumptions are violated in upwelling systems, such as the CCS, where O2 fluxes in the mixed layer are also affected by vertical mixing. However, such vertical mixing effects can be corrected using N2O as a tracer of O2-depleted deep water given the strong stoichiometric relationship between N2O and O2 ratios in subsurface waters (Cassar et al., 2014).
The various measurement techniques described above yield PP estimates in a number of different “currencies,” i.e., carbon, oxygen, and electrons, each with different integration timescales (seconds to weeks). In theory, combining PP quantification approaches can fill data gaps (e.g., cloud or ice interference with satellite data, or missing years in time series operations), and provide deeper understanding of ocean metabolism. In practice, incorporating alternative measurement approaches requires understanding of conversion rates between the various PP currencies. Predicting these conversion factors is challenging as they vary in response to environmental conditions and phytoplankton taxonomy and physiology (Hughes et al., 2021, 2018a; Schuback et al., 2017; Halsey and Jones, 2015). For example, the ETRPSII:GPP ratio often exceeds the theoretical stoichiometry of 4 (Halsey and Jones, 2015), implying that redox potential generated at PSII is used for functions other than carbon fixation, such as nitrogen uptake or cyclic electron transport. Similarly, differences between ETRPSII and NCP represent combined O2 consumption pathways, including community-wide respiration, chloro- and photorespiration, and pseudocyclic electron transport. Investigating the drivers of decoupling between currencies can thus improve conversion rate estimates and also provide insights into energy transfer efficiencies between different components of the photosynthetic process.
Here we present simultaneous PP measurements in the CCS collected using high-resolution, underway sampling techniques along a cruise track between Newport, OR, and San Francisco, CA. Underway measurements of ETRPSII and NCP conducted during the May–June upwelling season of 2023 were complemented with parallel measurements of ETRPSII and 14C-GPP collected at oceanographic stations. Our results demonstrate fine-scale spatial patterns in GPP and NCP associated with variability in localized upwelling filaments, with particularly notable differences observed across gradients of dissolved iron concentrations resulting from variable coastal bathymetry. These results enable us to examine variability in productivity currency conversion factors across natural Fe availability gradients within the CCS, with potential application to other complex coastal waters.
2.1 Sampling sites
Measurements were collected along the Oregon and Northern California coast during the Phytoplankton UPwelling Cycle (PUPCYCLE II) expedition, onboard the R/V Sally Ride from 27 May to 11 June 2023. A key objective of the program was to examine the evolution of phytoplankton blooms in recently upwelled waters, and we specifically targeted two upwelling plumes off Cape Blanco and Cape Mendocino, which were identified by low sea surface temperature (SST <12 °C; Fig. 1). Along the cruise track, temperature, salinity, and chlorophyll fluorescence were monitored by the ship's underway system, supplied by a seawater supply line with a nominal intake depth of approximately 5 m. Nitrate concentrations were measured continuously with a Seabird SUNA sensor calibrated against NaNO3 standards immediately prior to the cruise. In addition to standard oceanographic variables, the seawater supply line was also used for continuous underway measurements of phytoplankton photophysiology and ETRPSII using a fast repetition rate fluorometer (FRRF; Soliense Inc.), and NCP using a custom-built pressure in situ gas instrument (PIGI), as described in Sect. 2.6.
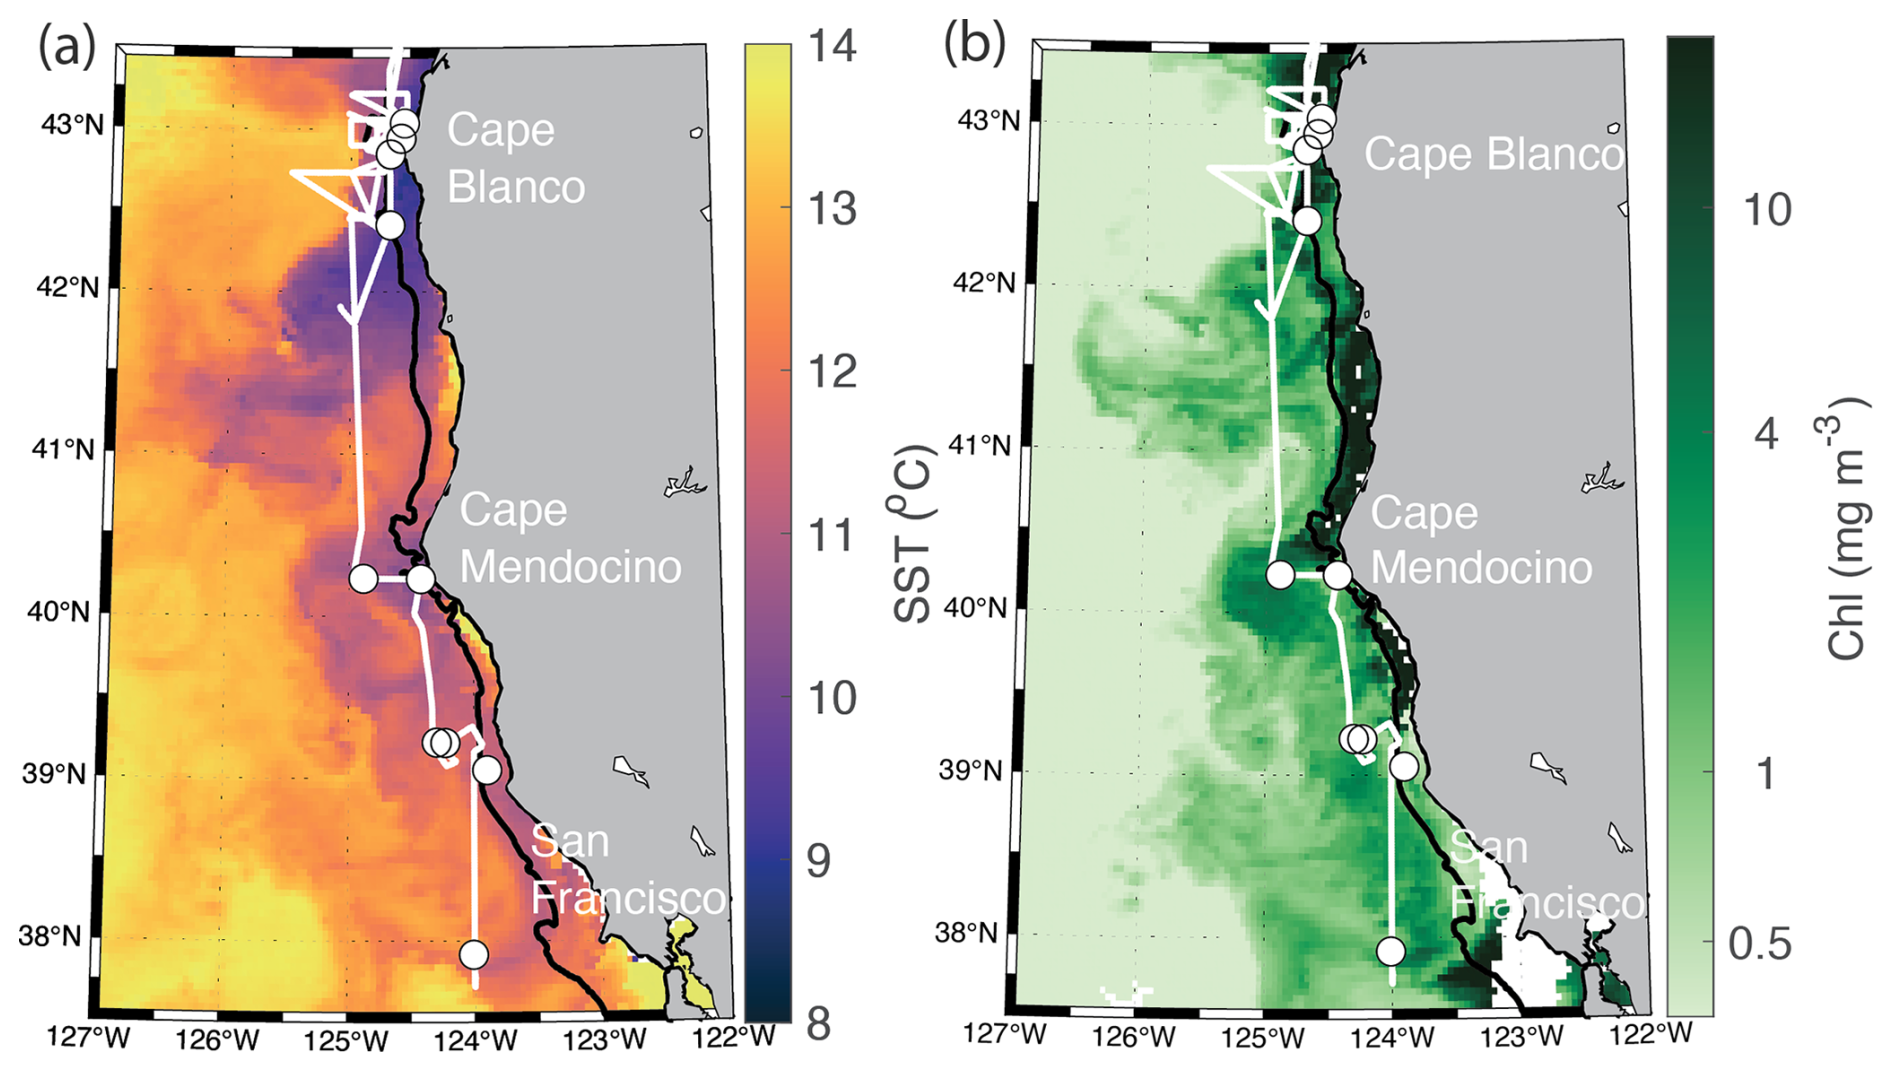
Figure 1Study site map. Location of the cruise track (white line) and discrete sampling stations (white circles) during the PUPCYCLE II expedition. The black bathymetric contour line represents the 200 m isobath. The study region and surrounding waters are colored by (a) daily NASA Aqua Modis Level 3 satellite retrievals of sea surface temperature (SST) averaged over the cruise period (27 May–11 June 2024), and (b) NASA Aqua Modis Level 3 satellite retrievals of chlorophyll a (Chl) averaged over the cruise period.
Daily CTD and rosette casts were conducted 1 h before local sunrise, and samples were collected at four depths targeting 1 %, 10 %, 22 %, and 46 % of surface solar irradiance levels. Photosynthesis-irradiance (PI) curves (measured with fast repetition rate fluorometry; see Sect. 2.2), chlorophyll a (Chl), and nutrient concentrations (, Si, , Fe) were measured at all four depths. Samples collected from 1 % and 46 % irradiance levels were also incubated for 14C-based PI curves (see Sect. 2.5), with subsamples collected for high-performance liquid chromatography (HPLC)-based analysis of phytoplankton pigments.
2.2 Fast repetition rate fluorometry
A bench-top Soliense Inc. FRRF was configured for underway collection of chlorophyll a fluorescence transients following Sezginer et al. (2021). Samples were introduced to the measurement cuvette by an integrated peristaltic pump. The pump was used to flush the measurement cuvette for 2.5 min before isolating a sample for analysis. Following a 1 min dark period to relax short-lived non-photochemical quenching, five single-turnover fluorescence transients were collected from each sample in the dark. Each single-turnover transient included a sequence of 100 subsaturating excitation light pulses of 1.5 µs duration, with a 1 µs interval between pulses. The excitation phase is designed to induce photochemistry and gradually reduce the pool of primary electron acceptor molecules, Qa (Kolber et al., 1998). As the Qa pool is reduced, further electron exchange between PSII and Qa is prevented, closing the photochemistry pathway and causing a concurrent increase in PSII fluorescence yields. The excitation phase is followed by a relaxation sequence consisting of 127 light pulses with an initial 20 µs interval. During the relaxation phase, the interval between light pulses increases exponentially, enabling Qa reoxidation between pulses to gradually reopen the photochemistry pathway such that fluorescence yields return to their basal levels. The biophysical model described by Kolber et al. (1998) was fit to the resulting fluorescence transient to derive the maximum quantum yield of PSII (), functional absorption area of PSII (σPSII), and turnover rate of the primary electron acceptor Qa (τQa).
2.3 Electron transport rates, ETRPSII
Continuous FRRF sampling was interrupted every 12 samples (∼3 h) to conduct a PI curve characterizing light-dependent changes in photophysiology and photochemistry. Across the entire cruise, we collected 91 PI curves. Each PI curve was initiated with a fresh sample and consisted of 11 light levels, increasing from 0 to 850 . Light was supplied evenly by the five actinic LEDs within the FRRF (445, 470, 505, 530, and 590 nm) calibrated against a handheld WALZ ULM-500 PAR meter prior to deployment. At each light level, ETRPSII was calculated following Suggett and Moore (2010):
In this formulation, the rate of photon delivery to the pool of PSII reaction centers (RCII) is derived as the product of photosynthetically active radiation (PAR; units ) supplied by the LED lamps, and the wavelength-specific functional absorption area of RCII ( units of Å2 PSII−1). The conversion efficiency from light to photochemical energy depends on the fraction of open RCII, measured as the dimensionless ratio between the fluorescence amplitude measured under actinic light when photochemistry is active () and that measured under actinic light if all RCII were oxidized (). In practice, measuring the minimum fluorescence when the RCII pool is completely open () is challenging, as actinic light always drives some degree of photochemistry and reduction of RCII. Alternatively, can be derived as ), following Oxborough et al., (2012).
The prime notation (′) refers to FRRF parameters derived under actinic light. The constant converts PAR to units of quanta , and to units of m2 RCII−1, yielding ETRPSII units of quanta . For a complete description of FRRF-derived parameters, see Schuback et al. (2021) and Berman-Frank et al. (2023).
For each light curve measured, ETRPSII was plotted against PAR and fit with the PI model of Platt et al. (1980):
During the initial light-limiting part of the curve, ETRPSII increases linearly with PAR with a slope of α. As PAR increases to saturating levels, ETRPSII stabilizes at maximum levels, Pmax. The light saturation index Ek is derived as . When phytoplankton are affected by photoinhibition, β describes the decrease in ETRPSII at high light levels (i.e., ≫Ek). In the absence of photoinhibition, Ps=Pmax. When photoinhibition is present (β>0), Ps represents the theoretical maximum potential ETRPSII. When β>0, Pmax is derived as
To evaluate ETRPSII over the cruise track, we linearly interpolated derived values of α, β, and Ps to the sampling resolution of continuous PAR measurements from the ship's meteorological tower (Biospherical Inst. QSR-240P). The mean light intensity in the mixed layer (PARin situ) was estimated by accounting for light attenuation with depth, quantified by the diffuse attenuation coefficient (), where PAR0 is PAR measured at the surface and PARmld is PAR measured at the mixed layer depth (mld) (Domingues and Barbosa, 2023). For each CTD cast (n=28), mld was determined using a density difference criterion of 0.125 kg m−3, and PARmld was measured with a Biospherical QSP-200 PAR sensor mounted to the CTD rosette. Both Kd and mld were linearly interpolated to the resolution of continuous PAR measurements. Finally, in situ PAR was estimated following Domingues and Barbosa (2023) as
To compare ETRPSII with NCP (Sect. 2.6), we converted ETRPSII from to volumetric units of . This conversion requires an estimate of the chlorophyll content of RCII, which is known to vary significantly across phytoplankton in response to taxonomic and environmental influences (Greene et al., 1992; Murphy et al., 2017; Aardema et al., 2024). Following previous authors (Schuback et al., 2015; Kolber and Falkowski, 1993), we assumed a possible range of Chl to RCII ratios of 400–700, yielding upper and lower bounds of Chl-normalized ETRPSII:
To obtain volumetric units, Chl-normalized ETR was multiplied by mixed-layer Chl concentrations (mmol Chl m−3 mld), assuming homogenous [Chl] throughout the mixed layer. Multiplying by 86 400 converts from s−1 to d−1. Given that four charge separation events are required per O2 evolved, ETR was divided by 4 for final gross photochemistry (GP) estimates in terms of .
2.4 Non-photochemical quenching (NPQ)
Under excess irradiance, light supply to PSII outpaces maximum downstream electron transport rates, creating the potential for dangerous reactive oxygen species (ROS) to accumulate (Müller et al., 2001). To mitigate excess excitation, photoautotrophs have evolved a number of photoprotective mechanisms, including non-photochemical quenching (NPQ), which dissipates excitation absorbed by PSII as heat, thereby reducing PSII photochemical and fluorescence yields. Previously, NPQ has been quantified from FRRF data as Stern–Volmer quenching, defined as the relative decrease in PSII fluorescence in response to light exposure:
However, this formulation does not account for longer-lived NPQ mechanisms that may still be active during dark measurements following recent high light exposure. To overcome this limitation, we used the normalized Stern–Volmer parameter (NPQNSV), calculated as (McKew et al., 2013). For each PI curve measured, NPQNSV was plotted against PAR and fit with a single component exponential curve. Out of 91 curve fits, 95 % had R2>0.90, and 87 % had R2>0.95. In situ NPQNSV was then estimated by mapping the resulting curve fit onto in situ PAR values.
Similarly, for each PI curve the fraction of closed RCII, , was plotted as a function of PAR and fit with a single component exponential curve, with 92 % of curves having an R2>0.90. Following the same procedure used to evaluate in situ NPQNSV, in situ was approximated by mapping the resulting curve fit onto in situ PAR values.
2.5 14C-uptake experiments
During daily station sampling, 200 mL were collected from 1 % and 46 % light level depths (approximately 50 and 10 m, respectively) into acid-washed 250 mL bottles for 14C incubations. Samples were immediately spiked with 150 µCi of H14CO3 (PerkinElmer), and inverted to homogenize the contents of the bottles. The homogenized media was then aliquoted into 20 mL borosilicate scintillation vials, which were incubated over 3 h in a custom-built photosynthetron at 7 light levels from 0 to 650 . At the end of the incubation, the entire content of the vials was filtered onto 25 mm GF/F filters with a nominal pore size of 0.7 µm. Filters were fumed with 10 % HCl for 24 h to remove any inorganic carbon prior to measuring activity on filters with an on-board scintillation counter (Beckman LS 6500). Immediately after spiking samples, three vials were filtered for triplicate time zero measurements. Three 100 µL aliquots were also taken from the initial 200 mL sample and treated with 100 µL of 3 M NaOH to measure total 14C counts. Disintegrations per minute were converted into hourly C fixation rates according to Knap et al., (1996).
2.6 Net community productivity (NCP)
We measured NCP based on mixed layer concentrations of O2 and N2 obtained from the pressure in situ gas instrument (PIGI), following Izett and Tortell (2021) and Izett et al. (2021). This method estimates NCP from the biological oxygen saturation anomaly, , using as an analog for Argon (Ar) to correct for physical effects on O2 saturation. In this method, net community productivity is equated to the sea–air flux of O2 as determined by the biological saturation anomaly () scaled by the [O2] in equilibrium with the atmosphere ([O2]sat), and the O2 piston velocity ():
The PIGI enables cost-effective measurements of using an oxygen optode and a gas tension device rather than a mass spectrometer, which is more commonly used to measure (Izett and Tortell, 2021). In this method, is derived as an approximation of Ar, using model calculations that quantify differences between Ar and N2 concentrations primarily due to solubility changes and bubble processes. A full description of the 1D model applied to estimate is available in Izett and Tortell (2021). The model uses ancillary data, including wind speed, mixed layer depth, temperature, salinity, and sea level pressure, to estimate changes in mixed layer Ar and N2 concentrations over one residence time period prior to sampling. We applied a residence time of 14 d for this region where mixed layer gas residence times are strongly influenced by the timescales of upwelling events (Austin and Barth, 2002). Ancillary datasets required for calculations were obtained from a combination of satellite observations and model products, as described by Izett and Tortell (2021). The 1D model calculations and code are available at https://github.com/rizett/O2N2_NCP_toolbox (last access: 2 February 2024) with example calculations.
Additional corrections to NCP estimates were made to account for vertical mixing fluxes, which transport low O2 water to the surface (Izett et al., 2018). Previous studies have omitted data collected in known upwelling areas, where the assumption of limited vertical mixing fluxes on variability is violated (e.g., Stanley et al., 2010). To address this limitation, Cassar et al. (2014) developed an approach to use surface measurements of N2O to quantify vertical transport of low O2 waters. In marine environments, there is a strong stoichiometric relationship between apparent oxygen utilization and N2O, which is produced as a by-product of subsurface oxygen-consuming N remineralization pathways (Elkins et al., 1978). These N2O production pathways are thought to be photoinhibited within the euphotic zone (Olson, 1981; Horrigan et al., 1981), so that excess N2O concentrations in the mixed layer serve as a tracer for vertical influxes of O2-depleted subsurface water. We thus used the approach of Cassar et al. (2014) and Izett et al. (2018) to correct for vertical mixing following Eq. (7):
This mixing correction uses surface measurements of the N2O biological concentration ([N2O]B), the “supply ratio” of oxygen saturation, given by the vertical gradient of biological O2 to N2O (), and the ratio of N2O and O2 gas transfer velocities (). Biological concentrations, indicated by the superscript “B”, are derived by isolating and removing physical solubility effects from measured gas concentrations. The surface water biological concentration of N2O, [N2O]B, was derived based on the difference between the N2O saturation anomaly ([N2O]sat) and changes in N2O solubility due to recent heat fluxes (). Heat flux effects on solubility, [N2O]thermal, were derived following Keeling and Shertz (1992), with corrections from Jin et al. (2017). Surface [N2O]meas was continuously measured from the surface seawater supply with an integrated cavity output spectroscopy (OA-ICOS) gas analyzer (Los Gatos Research, N2OCH4 Analyzer, Model Number: 913-0055) coupled to a gas extraction module (Schuler and Tortell, 2023). The region-specific supply ratio, , was calculated by taking the slope of subsurface [O2]B plotted against subsurface [N2O]B. The compiled data across the cruise track resulted in a supply ratio of , which is similar to previous measurements for the Northeast Pacific (; Izett et al., 2018) and global basins (; Cassar et al., 2014). Following Cassar et al. (2014), we assumed a constant ratio of 0.92.
We note that several recent studies have observed nitrification within the euphotic zone, challenging the assumption that N2O production is limited to subsurface waters (Grundle et al., 2013; Smith et al., 2014), and potentially leading to overestimates in our vertical mixing-corrected NCP estimates. Previous observations in the CCS reported a range of depth-integrated mixed layer nitrification rates between 0.3 and 2 , resulting in consumption of 0.6–4 (Stephens et al., 2020). Following the approach of Izett et al. (2018) we used a range of realistic N2O:O2 stoichiometries to estimate potential upper and lower bounds of mixed layer N2O production. We determined mixed layer N2O production was likely in the range 0.09–0.23 , which would yield offsets in our final NCP estimates between 1.2 and 3.3 . Total uncertainty due to sources of error in other derived parameters was determined by following Izett (2021).
2.7 Nutrient concentrations
Samples collected during daily productivity casts were analyzed for dissolved , , and silicic acid concentrations. Samples of 30 mL were collected from Niskin bottles and filtered through GF/F filters using acid-washed syringes into 20 mL HDPE scintillation vials. Samples were kept frozen before analysis on a OI Analytical Flow Solutions IV auto analyzer at Wetland Biogeochemistry Analytical Services at Louisiana State University. Detection limits were 0.09 µmol L−1 for nitrate + nitrate, 0.02 µmol L−1 for phosphate, and 0.02 µmol L−1 for silicic acid. Reference standards for dissolved nutrients in seawater were used to ensure quality control.
Samples for iron analysis were collected with a rosette of Teflon-coated OTE bottles during a separate cast directly after the daily sampling cast. After recovery, OTE bottles were taken directly to a trace metal-clean sampling van where they were pressurized with filtered compressed air. Surface samples (∼3 m depth) were also collected with a tow-fish system plumbed into the trace metal van, as in Bruland et al. (2005). All samples were passed through pre-cleaned 0.2 micrometer Supor membrane AcroPak capsule filters into trace metal cleaned bottles (Cutter et al., 2017). Samples were acidified to pH 1.8 with optima HCl and analyzed post-cruise with a flow injection analysis method (Lohan et al., 2006) with modifications as in Biller et al. (2013). Briefly, this method involved pre-concentrating the Fe at pH 2 with Toyopearl Chelate-650 resin and eluting into a reaction stream containing the colorimetric agent N,N-dimethyl-p-phenylenediamine dihydrochloride. The absorbance of the reaction stream was measured with a flow-through spectrophotometer. Calibration was performed with a standard addition curve, and blanks were assessed using acidified Milli-Q. Reference samples analyzed to assess accuracy compared well to consensus values: SAFe D1 , n=12 compared with consensus value , and GEOTRACES GSC (n=11) compared with consensus value .
2.8 Transcriptomic analysis
Water collected from near-surface Niskin bottle casts (46 % surface irradiance) during daily productivity measurements was subsampled for RNA extraction. Approximately 2.5–4 L of seawater were filtered onto 0.8 µm Pall Supor filters (142 mm) using a peristaltic pump, and then flash frozen in liquid nitrogen and stored at −80 °C. RNA was extracted using the RNAqueous-4PCR kit, following manufacturer instructions with the incorporation of a bead beating step during RNA lysis. All RNA samples were sent to GENEWIZ for library preparation and sequencing with PolyA tail selection. Sequencing was performed on an Illumina HiSeq 4000 with a 2×150 bp configuration. GENEWIZ provided raw paired-end read sequences for each sample.
Raw reads were trimmed using Trim Galore 0.6.10 (Martin, 2011) and quality control was determined with FastQC (Andrews, 2010). A de novo metatranscriptome assembly was conducted using rnaSPAdes 3.15.5 (Bushmanova et al., 2019) and CD-HIT-EST (Li and Godzik, 2006). Contigs were annotated using the Marine Functional Eukaryotic Reference Taxa (MarFERReT) database (Groussman et al., 2023), which provides NCBI taxonomic annotations (Federhen, 2012) and Pfam 34.0 functional annotations (Mistry et al., 2021). Samples were mapped against the MarFERReT DIAMOND sequencing aligner and its compatible BLASTX command (e-value < ) (Buchfink et al., 2015). Trimmed samples were aligned using Salmon (Patro et al., 2017). The package tximport (Soneson et al., 2016) was used to generate a comprehensive table of read count data for each sample and each contig. Only counts taxonomically mapping to Bacillariophyta (i.e., diatoms) were included. The normalized counts for all genes were then calculated using DESeq2's median of ratios method (Love et al., 2014). Normalized counts of the low iron-inducible periplasmic protein (Fea1) (Allen et al., 2007), which show high similarities to iron starvation-induced protein 2A (ISIP2A) (Behnke and LaRoche, 2020), were used as an indicator for iron stress (Marchetti et al., 2017).
2.9 Pigment concentrations and taxonomic compositions
During daily productivity casts, duplicate 1 L dark Nalgene bottles were filled with water from Niskin bottles collected at 1 % and 46 % PAR level depths. Under low ambient light, samples were filtered onto 47 mm GF/F filters (Whatman, nominal pore size 0.7 µm). Filters were immediately flash frozen and stored in an onboard −80 °C freezer. Samples were shipped on dry ice to the Pinckney Estuarine Ecology Photopigment Analysis Facility at the University of Southern California. There, photopigment concentrations were determined with high performance liquid chromatography following Pinckney et al. (2001). Pigment compositions are reported in Appendix B.
In addition to pigment sampling, Light microscopy was used to identify and enumerate dominant phytoplankton taxa. For microscopic cell counts, 25–50 mL subsamples preserved in Lugol's solution were concentrated by sedimentation using Utermöhl chambers for >24 h (Lund et al., 1958). Cell counts of recognizable dinoflagellate and diatom genera were carried out using an Olympus CKX-31 inverted microscope in at least 10 fields of view per sample at 200× and 400× magnification.
3.1 Oceanographic conditions
Across the cruise track, sea surface temperatures (SSTs) ranged from 8.5 to 14 °C (Fig. 2), with strong coastal to offshore gradients (Figs. 1 and 2). The lowest SST was observed within near-shore upwelling plumes, which were associated with high salinity (>33). Along the entire cruise transect, salinity was negatively correlated with the SST (, p≪0.01), as expected for upwelling regions. Sharp hydrographic fronts were apparent along coastal to offshore transects. Moving offshore, the SST rapidly increased, while salinity dropped, changing by as much as 2° and 0.5, respectively, within a span of 5 km. These results indicate the presence localized onshore upwelling plumes, as compared to more homogenous offshore waters. Within the upwelling plumes, concentrations were elevated, reaching maximum concentrations of 20.5 µM and displaying a positive relationship with salinity (ρ=0.89, p≪0.01) and a negative relationship with SST (, p≪0.01). Off-shore, decreased to concentrations below the SUNA detection limit (∼0.3 µM), highlighting the difference in nutrient availability between the oligotrophic offshore waters and productive coastal upwelling environments. Chlorophyll concentrations varied in the range 0.04–5.6 mg m−3 and exhibited a statistically significant (though weak) positive relationship with (ρ=0.30, p≪0.01).
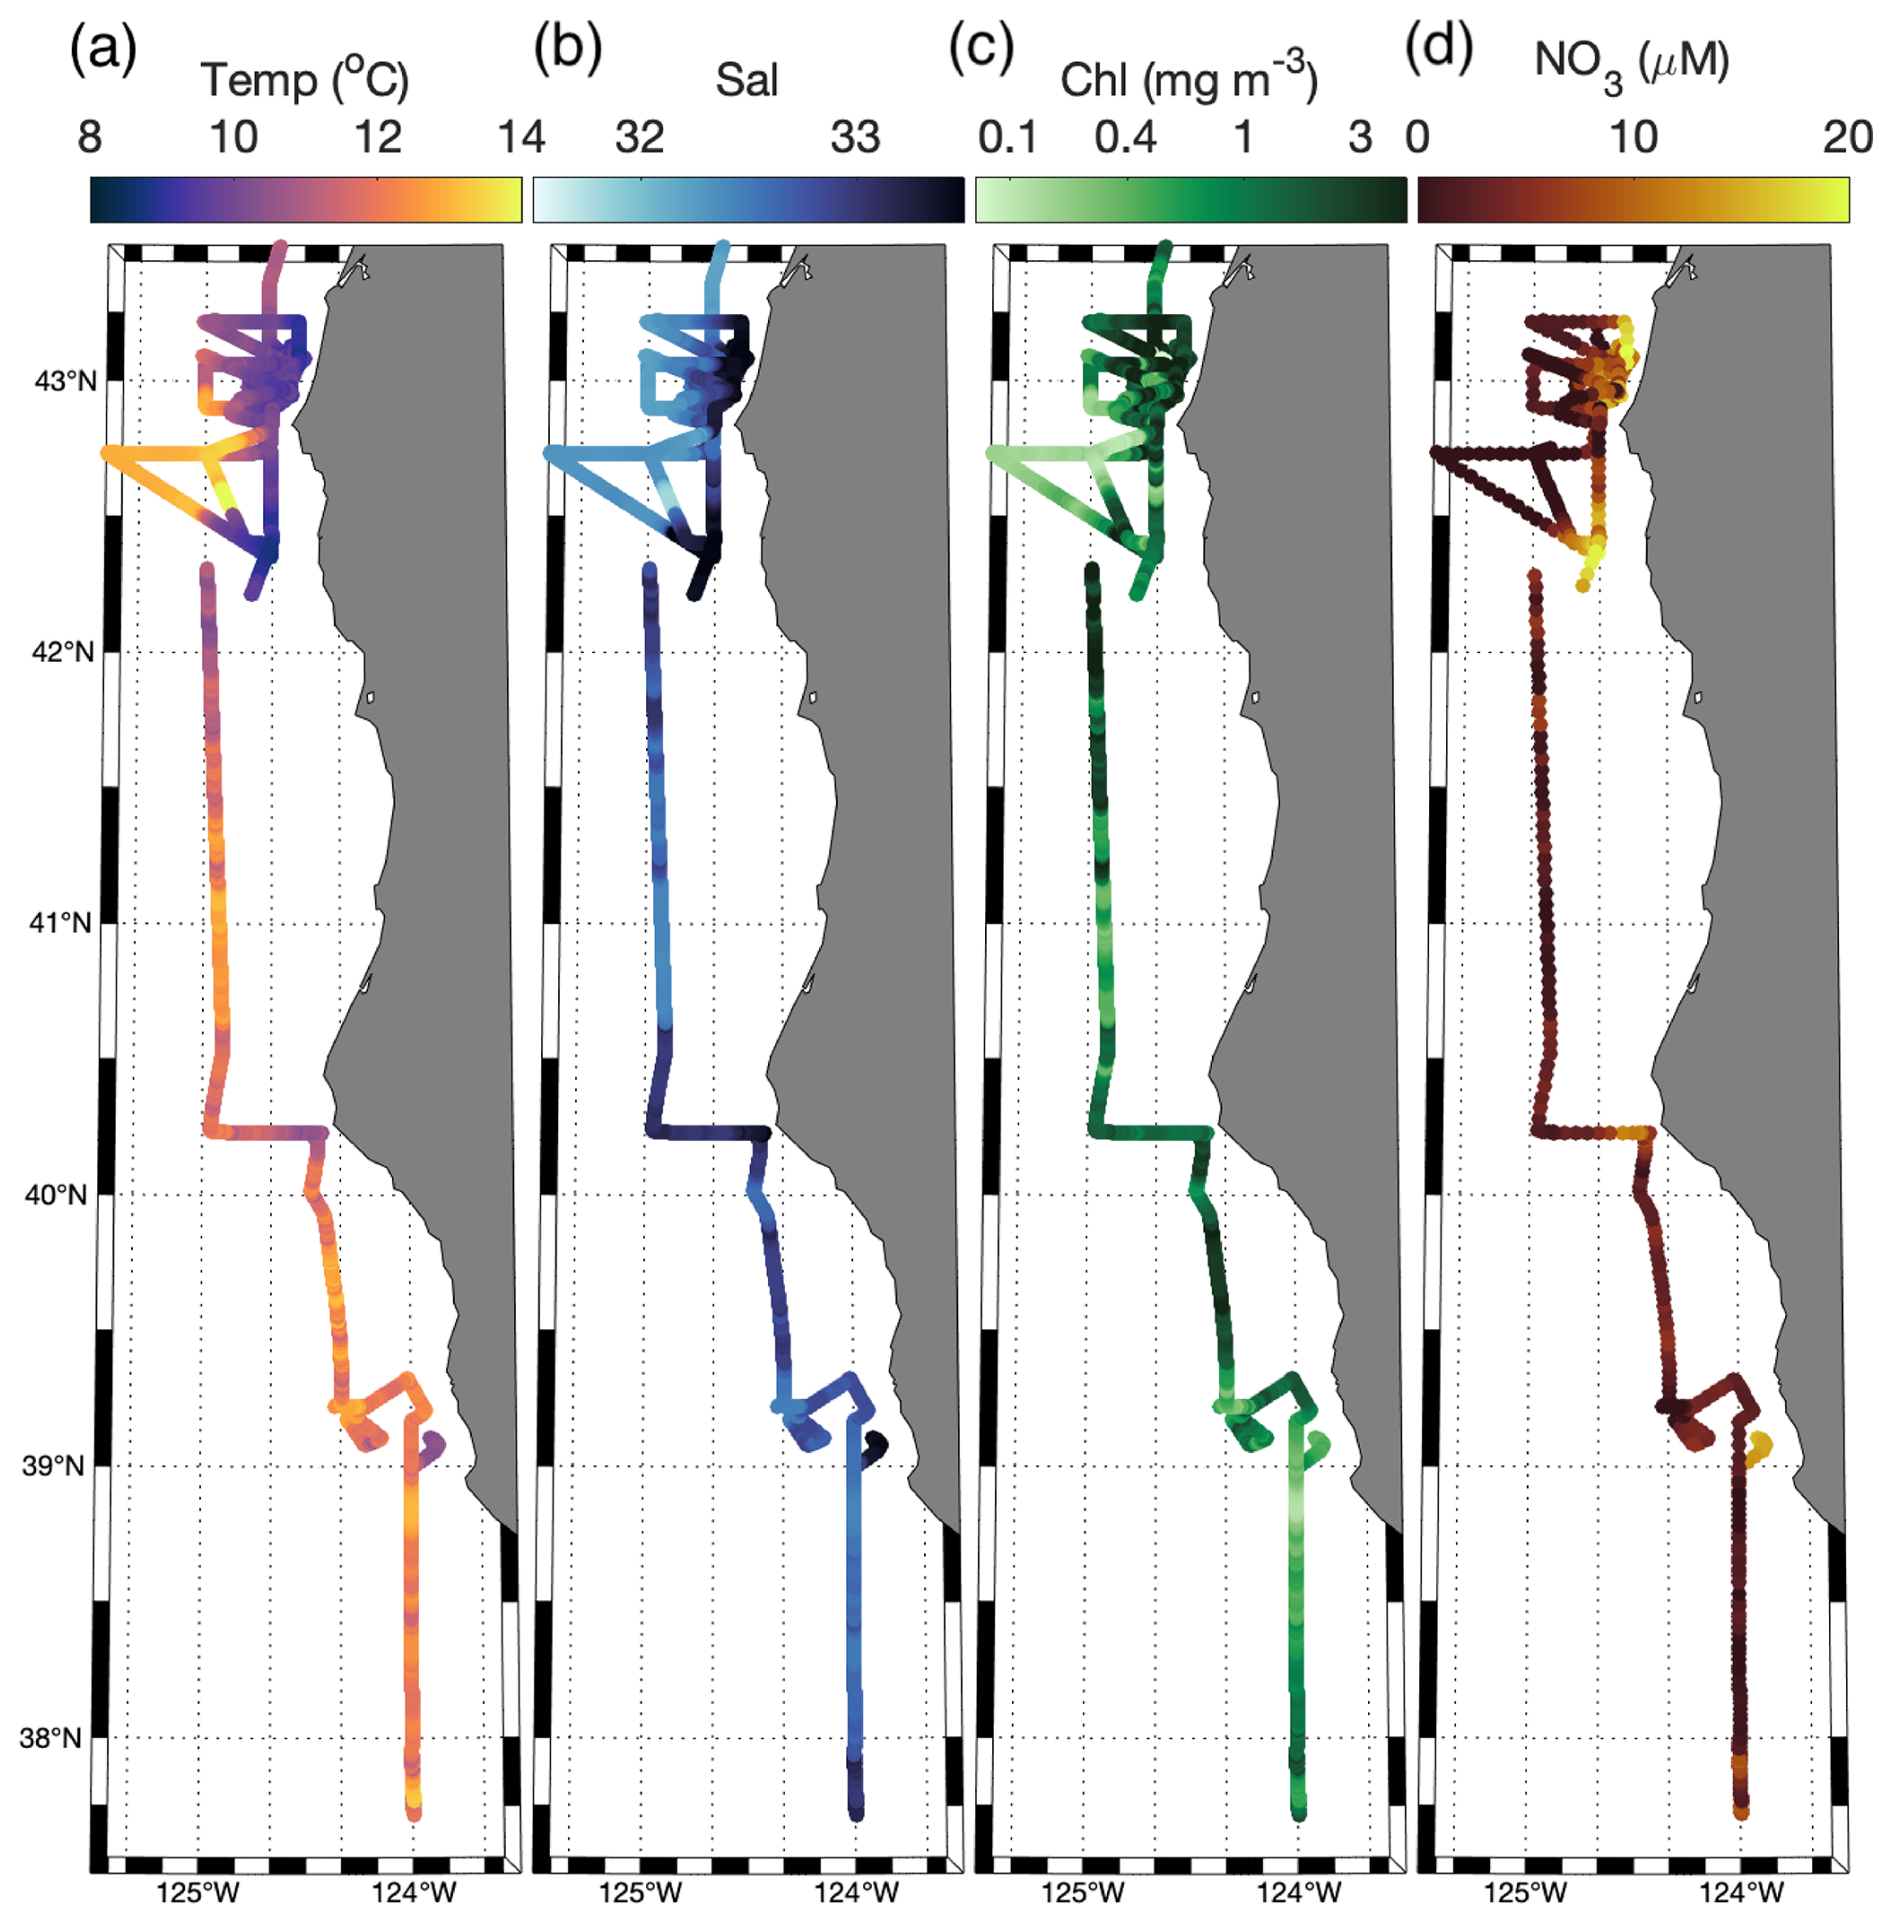
Figure 2Surface water (a) SST, (b) salinity, (c) Chl, and (d) along the cruise track.
In addition to the coastal-offshore gradient, surface water hydrography also differed between the two distinct upwelling plumes we sampled. These plumes were identified as low SST in the lees of Cape Blanco and Cape Mendocino (Fig. 1). Both plumes exhibited an upwelling signature, but the apparent intensity of upwelling (as reflected in SST, salinity, , and Chl) was significantly stronger within the northern Cape Blanco plume (Fig. 3). Most apparently, SST was several degrees cooler at Cape Blanco (median of 9.6±0.4 °C) than at Cape Mendocino (median of 11.5±0.01 °C). Nitrate concentrations were highly variable across both plumes, but the mean at Cape Blanco (9.4±0.8 µM) was nearly twice as high as that of Cape Mendocino (5.2±0.4 µM). Chlorophyll concentrations were elevated at both plumes relative to offshore waters, with a median of around Cape Blanco and at Cape Mendocino. Both these Chl concentrations are well below that which can be supported by the available concentrations (1 can typically yield 1 µg Chl L−1), indicating that the phytoplankton blooms were likely in the early phases of development following upwelling.
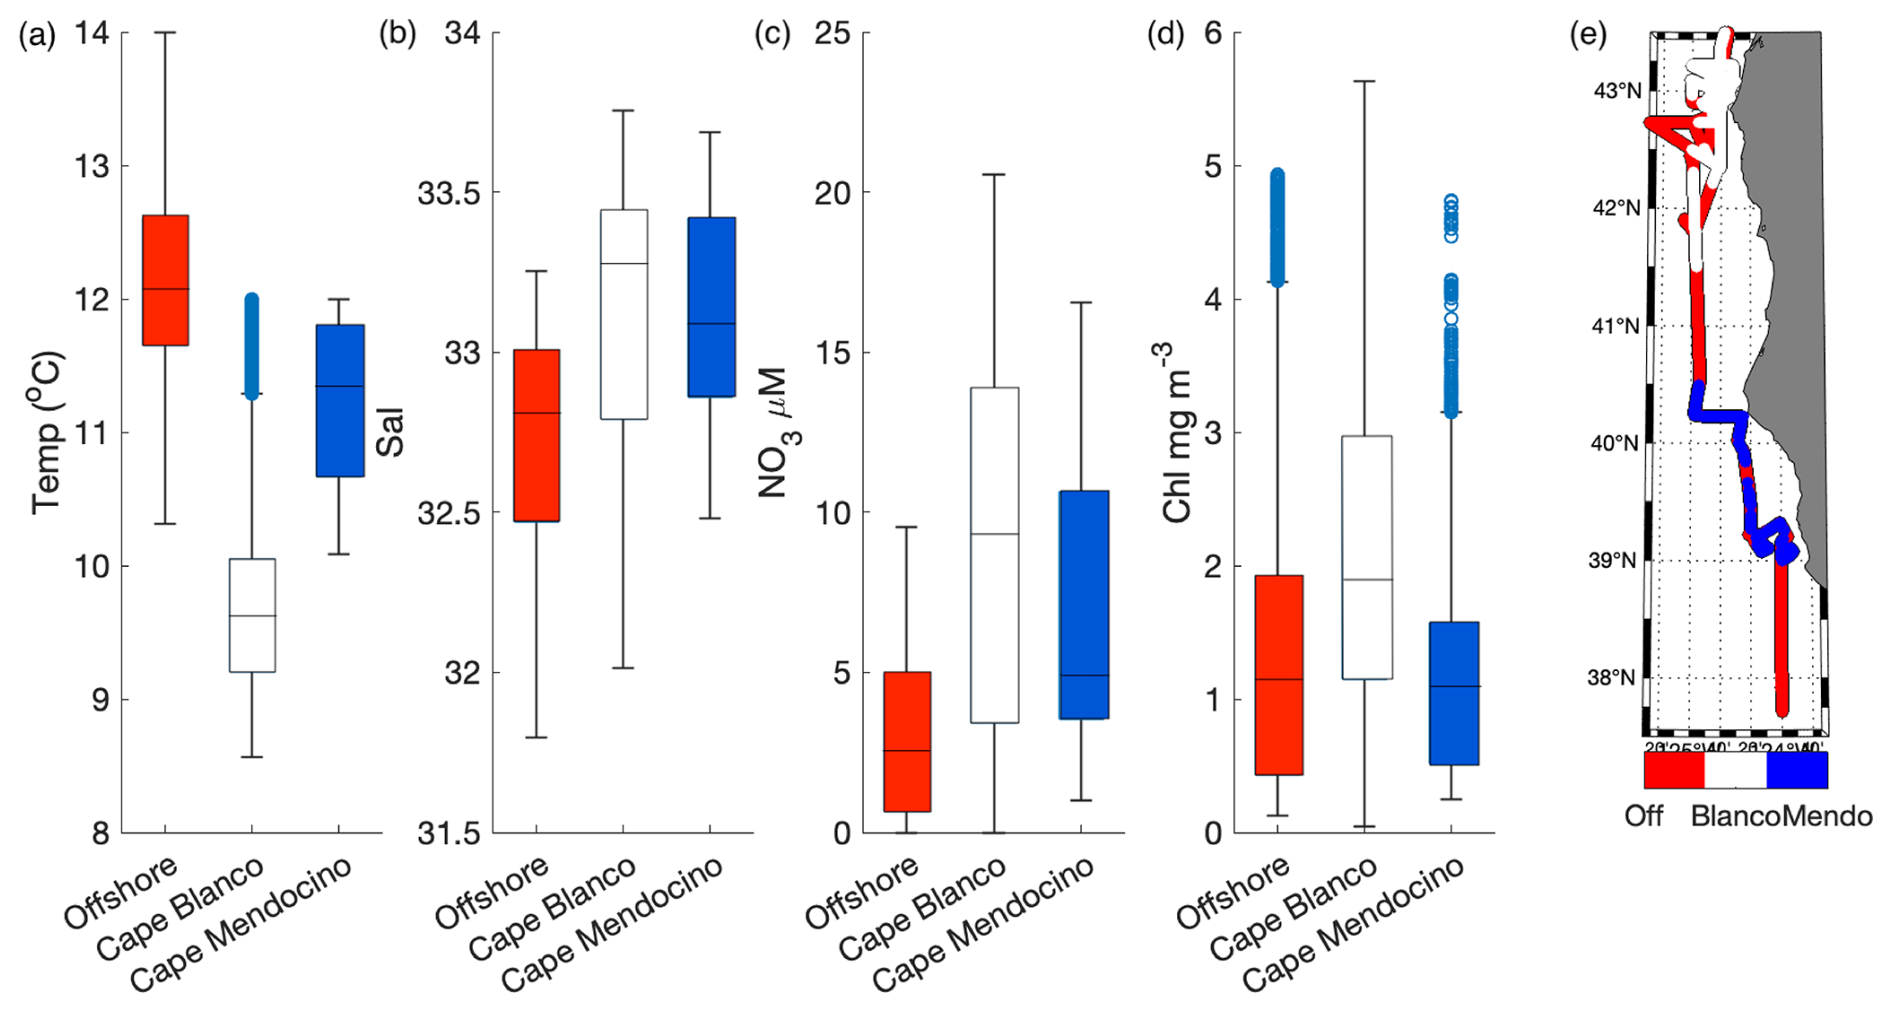
Figure 3Variability in SST (a), salinity (b), (c), and Chl (d) within the observed water masses offshore, at Cape Blanco and Cape Mendocino. The line inside each boxplot represents the median, while whiskers display the 75th percentile. Points outside the whiskers represent outliers. Panel (e) displays the spatial distribution of offshore (off) Cape Blanco and Cape Mendocino (Mendo) data. Samples with SST<12 °C and south of 41.5° N were considered part of the Cape Mendocino plume, while samples with <12 °C and north of 41.5° N were considered part of the Cape Blanco plume. Samples falling out of these criteria were designated as offshore samples. Criteria were chosen based on a visual inspection of water hydrographic distributions (Fig. 1).
Underway surface measurements were accompanied by on-station discrete sampling for , , Si, and Fe concentrations. As expected, was highly correlated with (ρ=0.99, p≪0.01) and SiO2 (ρ=0.92, p≪0.01). The ratio of was 7.4±2.0, and less than half the expected Redfield ratio of 16. This result is consistent with observations of low : () in the North Pacific attributed to high subsurface denitrification rates (Tyrrell and Law, 1997). In contrast with the strong covariance observed among macronutrients, surface Fe distributions were not correlated with surface concentrations (ρ=0.35, p=0.6). At Cape Blanco, Fe concentrations varied from 1.2 to 2.0 nM, whereas Cape Mendocino concentrations were significantly lower, in the range 0.21–0.65 nM. Offshore Fe concentrations were relatively high, with a surface concentration of 0.29–0.42 nM. These waters exhibited low macronutrient concentrations. In Sect. 4.1 we explore the potential causes for different nutrient signatures in the various water masses we sampled.
3.2 Photophysiology
Along the cruise track, phytoplankton photophysiological properties displayed spatial variability associated with hydrographic gradients, superimposed on significant diel cycles. In particular, we observed strong diel signatures in the expression of various photoprotective mechanisms. Generally, we observed decreases in the PSII functional absorption area, σPSII throughout the day, followed by recovery overnight (Fig. 4a). The maximum photochemical efficiency of PSII () similarly decreased during the day and peaked overnight. Measurements of NPQNSV displayed an inverse diel pattern to those of σPSII and , reflecting adjustments to the allocation of absorbed energy between competitive photochemistry and thermal dissipation pathways. However, the magnitude of diel variability in , σPSII, and NPQNSV signals displayed significant variability between subregions, as discussed below. These observations agree with previous diel cycle studies of the region (Schuback and Tortell, 2019).
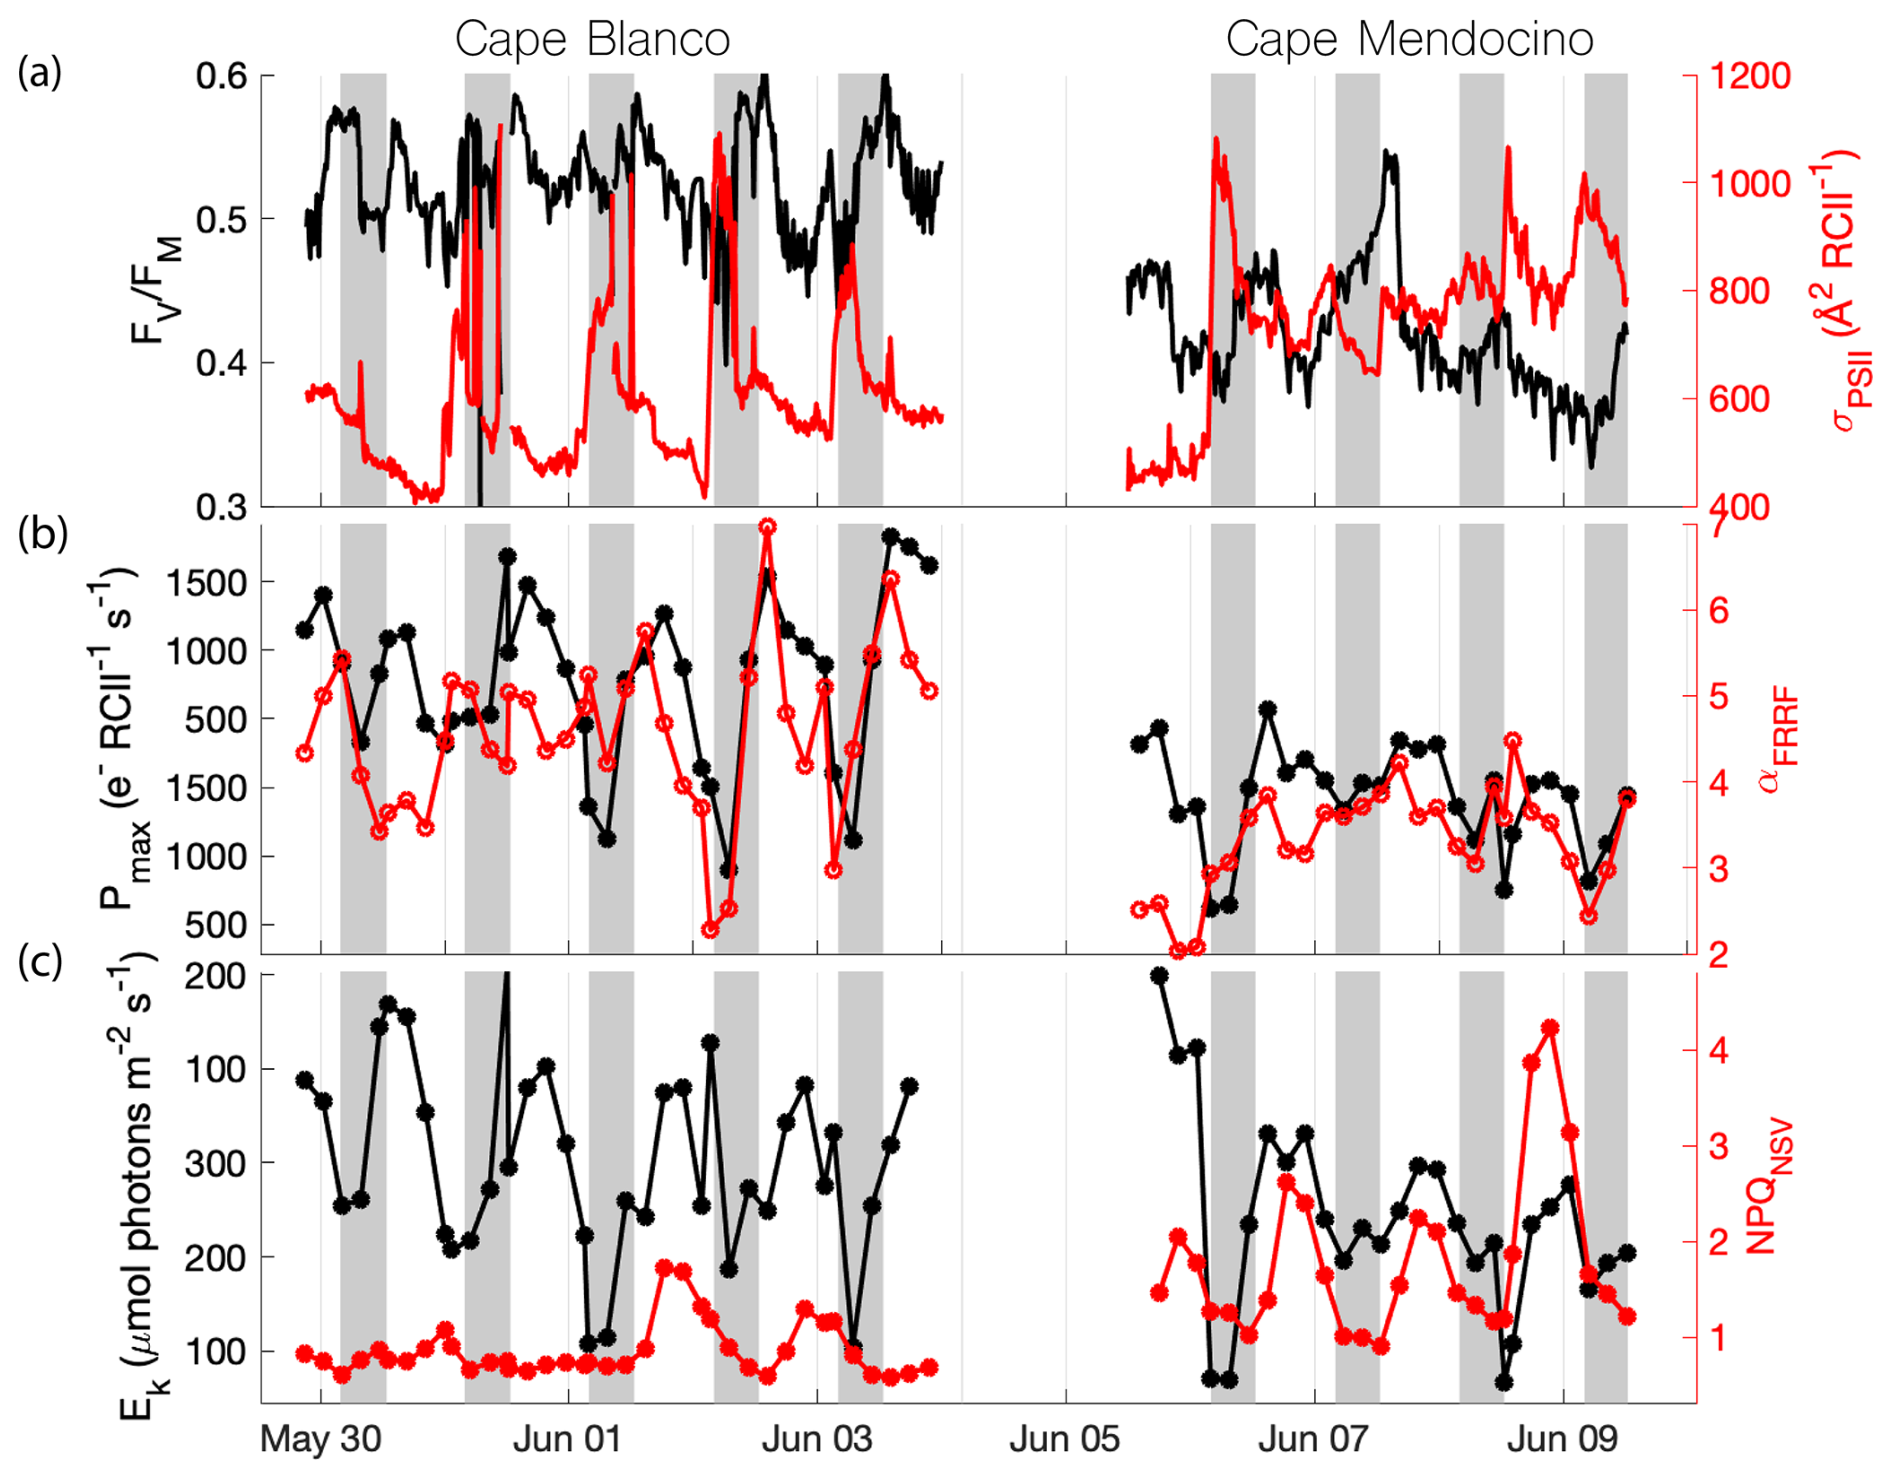
Figure 4Diel patterns in photophysiological properties along the cruise track. Gray shading indicates nighttime, when surface . (a) (black) and σPSII (red), (b) Pmax (black) and α (red), (c). Ek (black) and NPQNSV (red) are displayed with respect to sampling time. High sea states in the period 4–6 June impacted the seawater intake, resulting in the data gap.
Overall, photosynthetic parameters derived from semi-continuous PI curves also exhibited diel patterns that mirrored those of and σPSII. The maximum, light-saturated ETRPSII (Pmax) and the light utilization efficiency under light limiting conditions (α) both peaked during the midday when in situ irradiance was highest. The light saturation level, Ek, tracked surface light availability, while the photoinhibition parameter (β) peaked during midday and decreased overnight (data not shown). As with the continuous underway data, results from these discrete PI curves match the previous diel observations of Schuback and Tortell (2019). We note, however, that there is potential for some convolution of temporal and spatial variability, as the ship spent more time offshore in the night, and onshore during the daytime. It is thus possible that some of the diel cycling partially reflects variable photophysiological signals between coastal and offshore waters.
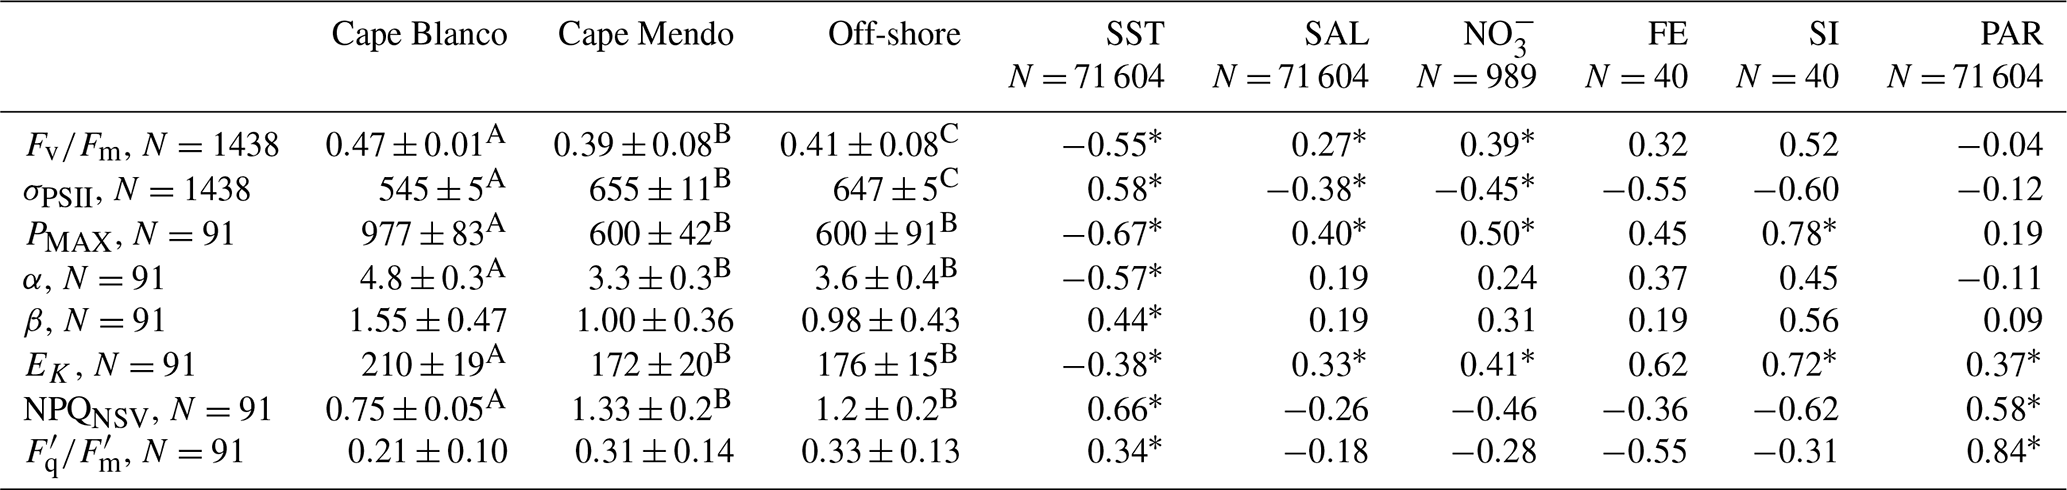
Beyond diel signals, we also observed significant gradients in photophysiological parameters in relation to oceanographic conditions. In general, , Pmax, Ek, and α displayed positive relationships with upwelling indicators, i.e., high salinity and macronutrients, and low sea surface temperature (Table 1), suggesting that vertical transport of nutrient-rich water to the surface supported high photochemical yields. In contrast, upwelling signals were associated with decreased σPSII and NPQNSV. However, despite general trends between photophysiological parameters and upwelling, there were significant differences in photophysiological properties between the Cape Blanco and Cape Mendocino upwelling plumes. At Cape Blanco, mean values of NPQNSV and σPSII were significantly lower than at Cape Mendocino, while , Pmax, α, and β were all higher (Table 1). Photophysiological properties at Cape Mendocino were much closer to those observed in offshore non-upwelling waters, with mean values that were lower than offshore, despite elevated macronutrient concentrations. This result, combined with low Fe concentrations at Cape Mendocino, suggests that phytoplankton at Cape Mendocino were Fe stressed despite the presence of upwelling conditions (see Discussion).
Table 1Summary of photophysiological properties at each sampling environment and their relationship to hydrographic parameters. Left side of the table displays the median ± median absolute deviation for each photophysiological parameter according to sampling environment. Superscripts denote groups with significantly different medians. Right side of the table displays Spearman rank correlation coefficients for each photophysiological parameter against environmental parameters. * indicates p<0.05. Due to differences in sampling frequencies, the number of observations (N) varied across different parameters. For correlation analyses, paired observations were matched in space and time to the lowest resolution measurement. Cape Mendocino is abbreviated as Cape Mendo. Salinity is abbreviated in the table as “SAL”.
3.3 Primary productivity
3.3.1 Electron transport rates (ETRPSII)
In situ ETRPSII followed a notable diel cycle due to its first-order dependency on irradiance (Eq. 1 and Fig. 5a). However, the relationship between PAR and ETRPSII was spatially variable across the cruise track, reflecting differences in αFRRF, Pmax, and Ek between Cape Blanco and Cape Mendocino (Table 1 and Fig. 4). The amplitude of diel ETRPSII was greatest near Cape Blanco, despite lower average mixed layer PAR (Fig. 5a). At Cape Blanco, maximum ETR averaged , as compared to maximum values of only at Cape Mendocino. The higher maximum ETR at Cape Blanco is in good agreement with the observations of higher photochemical yields in this region (Table 1).
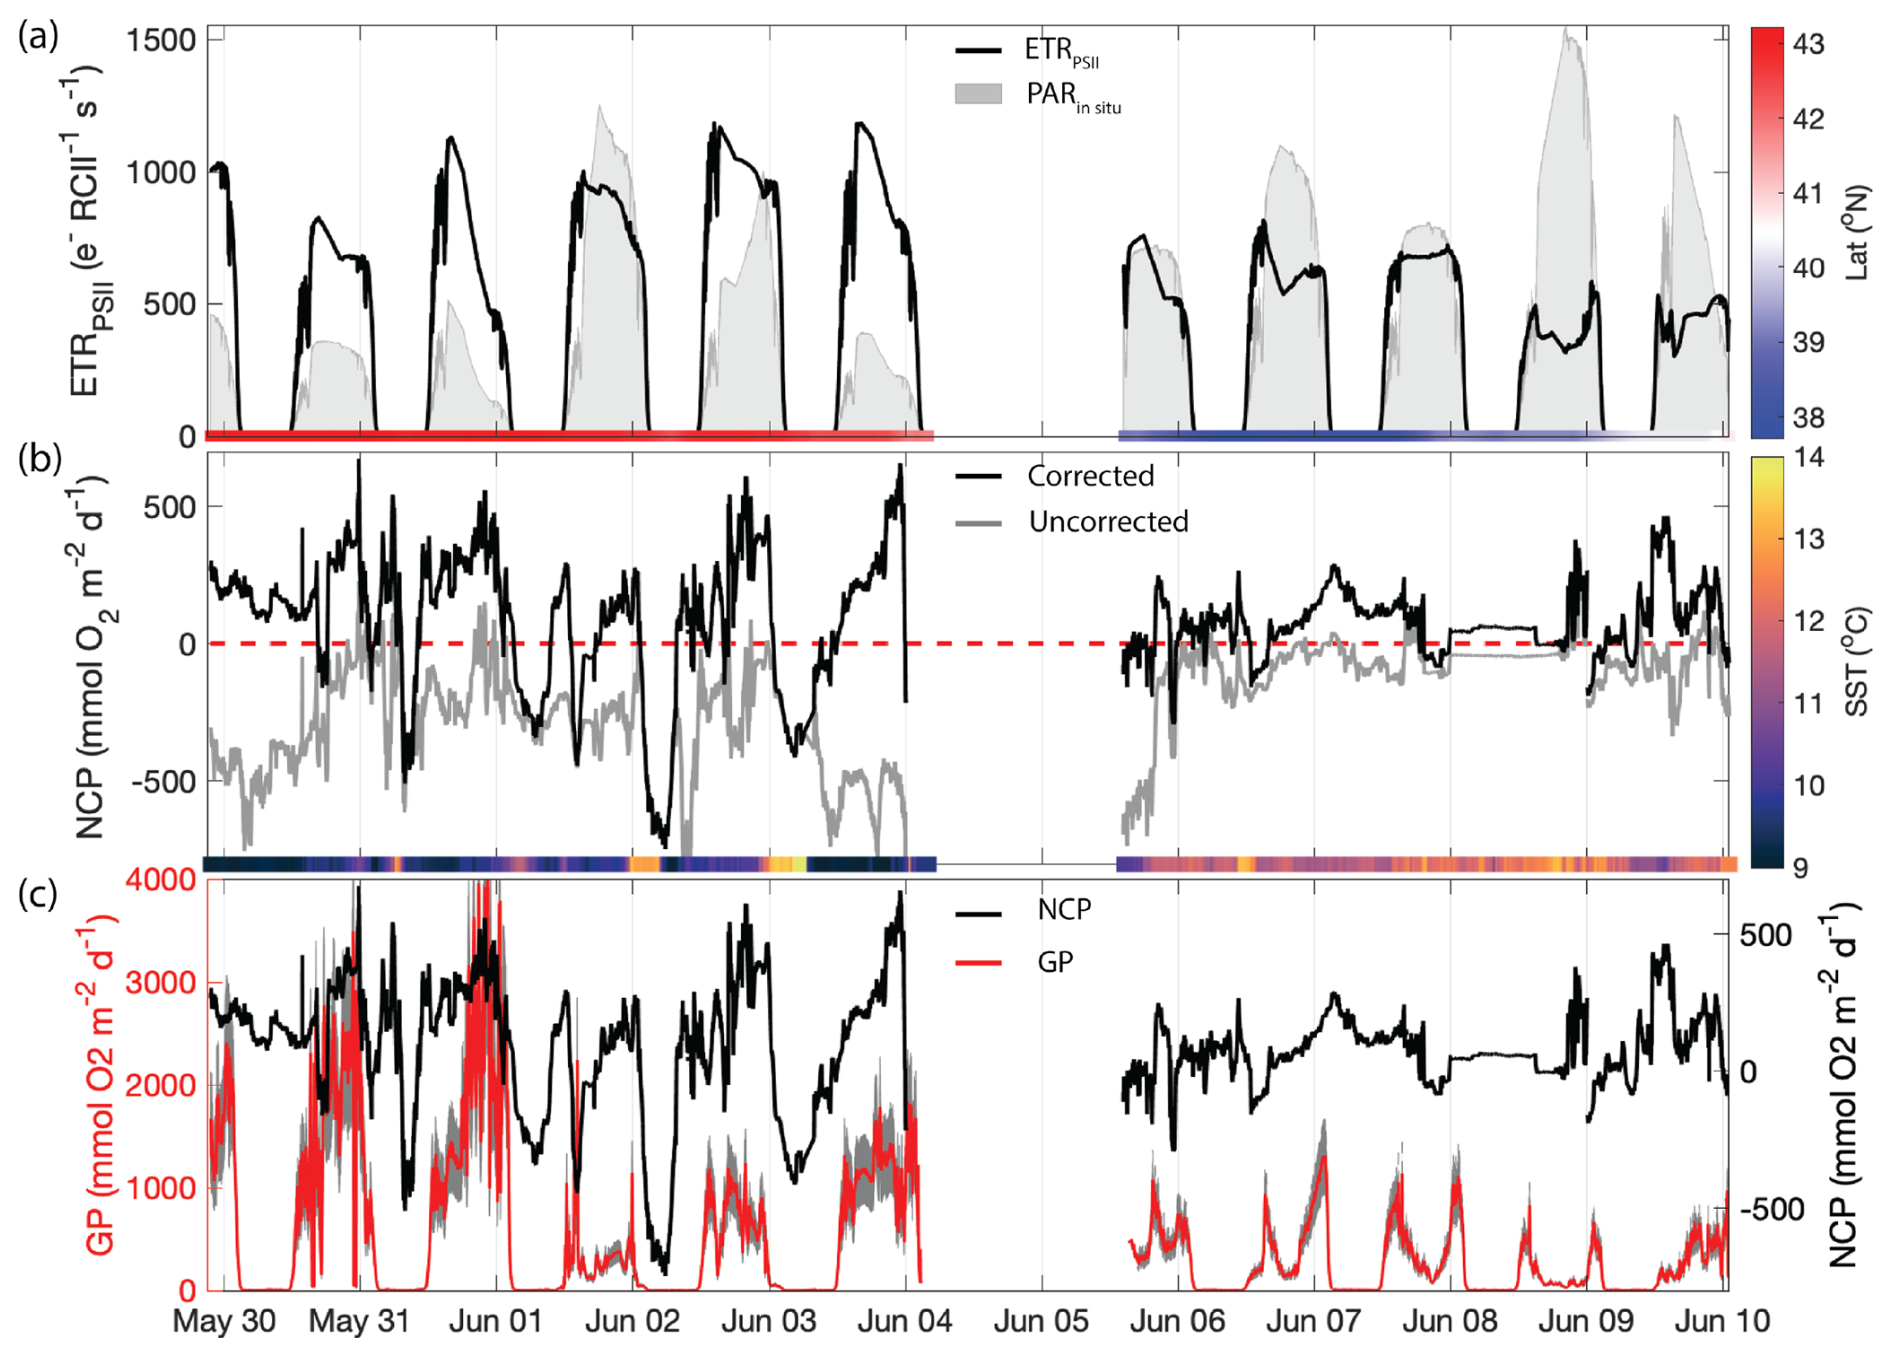
Figure 5Primary productivity time series along the cruise track. (a) ETRPSII derived from FRRF-measured PI curve parameter interpolated to match NCP sampling frequency (black line). The gray patches indicate the mean PAR available within the mixed layer (PARin situ). The bar on the bottom is colored by the sampling latitude. The Cape Blanco filament is designated as latitude>40.5 and is colored red, while Cape Mendocino is designated as latitude<40.5 colored blue. (b) Uncorrected NCP (gray) and mixing-corrected NCP (black). The dashed red line denotes the boundary between net autotrophy (NCP>0) and net heterotrophy (NCP<0). The color bar on the bottom illustrates the sample temperature. (c) Mixing-corrected NCP (black, right y axis) and gross photochemistry (GP), shown in red (left y axis). GP is calculated by converting ETRPSII from units to . The gray shading around the red line displays the range of GP based on an assumed range of 400–700 Chl : RCII.
3.3.2 Net community productivity (NCP)
In addition to GPP, we estimated NCP from underway measurements. Prior to correcting for vertical mixing, more than 80 % of derived NCP values were negative, suggesting net heterotrophic conditions over most of the cruise track. The most negative uncorrected NCP values were observed near Cape Blanco, despite the high gross photochemistry rates measured in this region (Fig. 5a and b).
The apparent decoupling between NCP and GPP can be largely explained by vertical mixing of low-O2 waters, which artificially depress O2-derived NCP estimates (see Sect. 2.4). After applying the N2O-based mixing correction, we found that the majority of the cruise track (73 % of measurements) exhibited net autotrophy, with the highest value recorded within the Cape Blanco filament. For the most part, net heterotrophy only existed at night in warmer off-shelf waters. The mean corrected NCP was , within range of previous observations of late-spring NCP within the California Current (Kranz et al., 2020). The large standard deviation reflects the large diel and spatial variability observed along the cruise track. The highest NCP estimates we obtained () are on the upper end of previous measurements. Values above 100 have only been observed in the most productive coastal waters (Wang et al., 2020; Niebergall et al., 2023), further emphasizing the high productivity of the CCS.
The N2O-derived mixing correction term was strongly correlated to N2O-independent indicators of upwelling, namely temperature (, p≪0.01). Uncertainty in vertical-mixing corrected NCP due to potential mixed layer nitrification (see Sect. 2.6) represented between 1.5 % and 4.2 % of our mean corrected NCP value. These results give confidence that high surface concentrations of N2O are a valid marker of upwelling and transport of O2-poor subsurface water into the mixed layer. The maximum correction factor, 1200 , was observed within the cold upwelling filament near Cape Blanco, where uncorrected NCP was below . This result highlights the impact of vertical fluxes on O2-based NCP estimates in upwelling regions.
3.3.3 Carbon fixation rates
At nine discrete sampling stations, 14C-based PI curves were measured in parallel with ETRPSII at the surface and at the base of the euphotic zone. Volumetric carbon fixation rates varied significantly between stations and depths. Maximum carbon fixation rates (carbon-based Pmax) ranged from 0.4 to 96 . Over 85 % of the variability in carbon fixation rates could be explained by differences in biomass, which varied in the range 0.11–9 mg Chl L−1. Chlorophyll concentrations in near-surface waters were, on average, four times higher than those at the base of the euphotic zone, implying the bulk of carbon fixation took place in the mixed layer. On average, the bottom depth of the euphotic zone was 14±12 m deeper than the bottom depth of the mixed layer.
To compare carbon-based GPP estimates against parallel ETRPSII measurements, carbon fixation rates were normalized to chlorophyll and converted to units of . Chlorophyll normalized carbon fixation rates were positively correlated with Fe (ρ=0.40, p<0.05), (ρ=0.56, p<0.05), and Si : ratios (ρ=0.60, p<0.05), and negatively correlated with σPSII (, p<0.05). These results suggest that stations with low chlorophyll-normalized carbon fixation rates may have been affected by Fe and Si co-limitation. By comparison, carbon fixation rates were not significantly correlated with or concentrations or salinity.
Notably, carbon fixation consistently saturated at lower light intensities than ETRPSII. The average Ek for ETRPSII was 5±2.8 times greater than Ek for carbon fixation. As a result, carbon fixation did not scale linearly with ETRPSII, but rather demonstrated a hyperbolic relationship at each station and depth sampled. At subsaturating light levels, carbon fixation increased linearly with ETRPSII, until approaching an asymptote as ETRPSII continued to increase while carbon-fixation remained stationary (Fig. 6). This result indicates that at light levels beyond the saturating index for carbon-fixation, ETRPSII provides reducing power in excess Calvin–Benson cycle requirements. Previous studies have noted a similar nonlinear relationship between carbon fixation and ETRPSII, consistent with an upregulation of alternative electron pathways under high light levels (Schuback and Tortell, 2019; Suorsa, 2015; Zhu et al., 2017). This nonlinear relationship between C fixation and ETR has been cited as a key limitation to the widespread use of FRRF for autonomous high resolution GPP estimates. Although our results demonstrate a clear hyperbolic relationship between these rates, the parameters describing this relationship were variable across stations. In Sect. 4.3, we further examine the relationship between carbon fixation and ETRPSII and contextualize the apparent differences in carbon-electron decoupling with available physiological and environmental data.
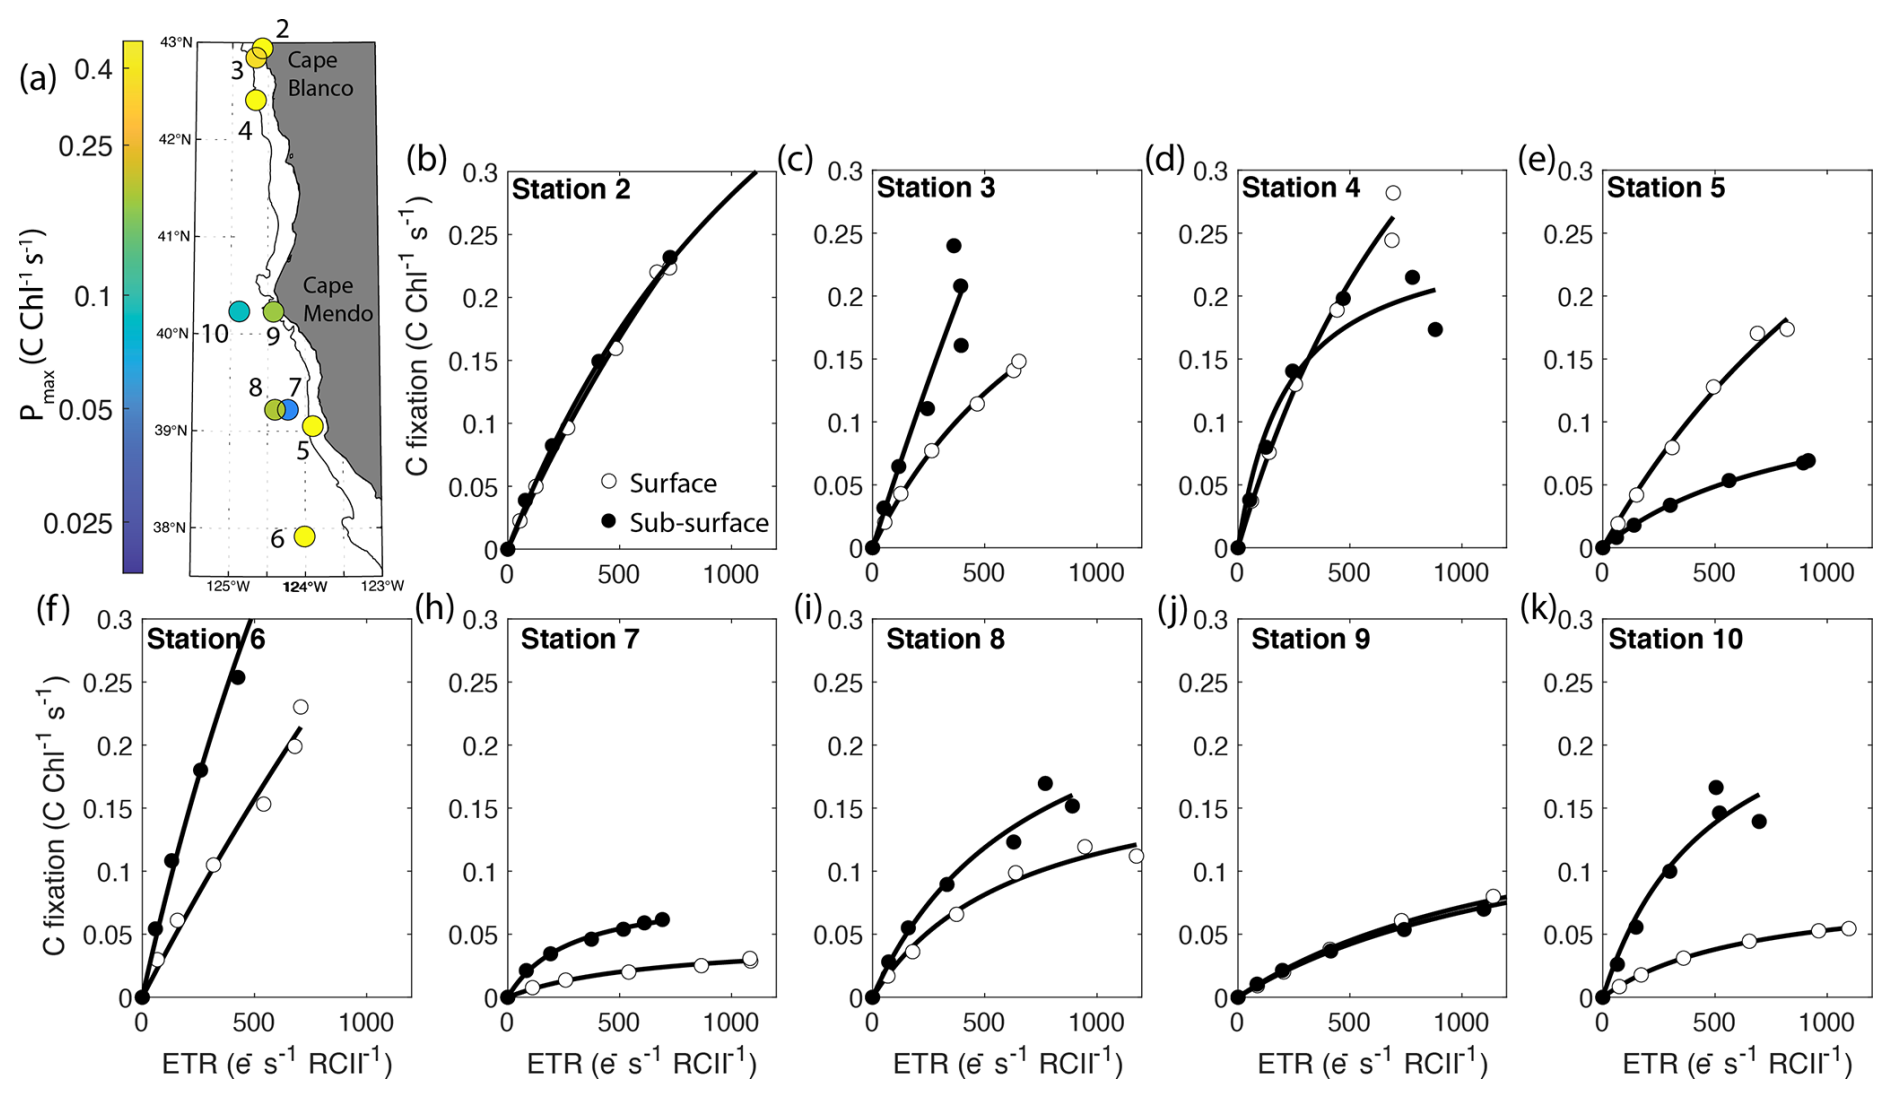
Figure 6Parallel measurements of fluorescence- and 14C-based photosynthesis-irradiance experiments conducted on-station. The top left panel displays the sample locations colored by maximum Chl-specific surface carbon fixation rates. The black contour line displays the 200 m isobath. The other panels show carbon fixation rates plotted against ETRPSII. Surface samples are represented by open circles while subsurface samples are depicted as closed circles. Each curve is fit with the function, , where Pmax-C is the maximum carbon fixation rate, and Ksat is the saturation constant beyond which changes in carbon fixation with respect to ETRPSII become increasingly nonlinear. Carbon fixation data were not collected at Station 1. All curve fits had an R2>0.9.
As expected, our continuous underway measurements revealed strong spatial and temporal variability in biogeochemical properties across the California Upwelling system. In particular, we observed large diel cycles, and coastal-offshore gradients in biogeochemical properties, with two distinct upwelling filaments in the vicinity of Cape Mendocino and Cape Blanco. Differences in nutrient availability between sample sites appeared to exert a strong influence on photophysiology, gross photochemistry, GPP, and net community productivity. In this section, we explore the potential underlying causes of biogeochemical differences across our survey region, with a focus on iron gradients across the two distinct upwelling filaments. We also discuss the direct and indirect influence of iron availability and other environmental variables on phytoplankton photophysiology, and energy transfer efficiencies between photosynthetic processes.
4.1 Factors driving the contrasting biogeochemistry of Cape Blanco and Cape Mendocino filaments
The significant differences in surface oceanographic conditions between upwelling filaments may have been driven by differences in (1) the strength and timing of upwelling at the two capes, or (2) differences in the nutrient content of the subsurface upwelling source waters. We investigated these two possibilities by examining the NOAA coastal upwelling transport index (CUTI) as a proxy for upwelling strength during and prior to the sampling period, and by evaluating nutrient depth profiles to examine the upwelling source waters at the two capes. Our analysis suggests that both factors likely contributed to the apparent differences between Cape Blanco and Cape Mendocino biogeochemistry, providing evidence that Fe and Si concentrations were particularly affected by bathymetric features that influence Fe supply.
4.1.1 Strength of upwelling and relative age of filaments
To examine differences in the timing and strength of upwelling between the two filaments, we tracked CUTI for a 10 d interval prior to sampling (Jacox et al., 2018). Throughout the sampling period, the strength of upwelling at Cape Blanco varied in the range 1.3–2.4 m d−1 (positive values indicate upwelling) and peaked 6 d prior to our arrival, at 3.8 m d−1. During our sampling period at Cape Mendocino, upwelling varied in the range . Upwelling conditions persisted in this region, with vertical transport rates between 1 and 4 June, up to 1 d prior to our arrival. However, after 4 June, the vertical mixing index at Cape Mendocino rapidly reversed to weak downwelling (−0.1 to ) during the last few days of sampling, emphasizing the dynamic nature of this sampling environment. These results support the hypothesis that colder and more nutrient-rich water near Cape Blanco was attributable to stronger and more consistent upwelling in this region in the interval prior to our sampling. In contrast, Cape Mendocino was transitioning from upwelling to downwelling conditions during our sampling period.
4.1.2 Nutrient content of upwelling source waters
Depth profiles offer additional insight into the nutrient concentrations of upwelling filament source waters. Unfortunately, nutrient samples were only collected down to the base of the euphotic zone, missing the deeper source waters. Nonetheless, measurements at the base of the euphotic zone (40–50 m) enable us to compare subsurface nutrient concentrations. Mean concentrations of [] between 40 and 50 m were significantly (p<0.05) higher at Cape Blanco (24.5±4.3 µM) than at Cape Mendocino (16.5±5.7 µM). Similarly, phosphate concentrations between 40–50 m were significantly greater around Cape Blanco (2.6±0.3 µM) compared to Cape Mendocino (2.1±0.4 µM; p=0.02). Relative to nitrate and phosphate, even larger differences were observed in Fe and Si concentrations between the two capes. The 40–50 m silicic acid concentration at Cape Blanco (30.0±8.6 µM) was nearly double that observed at Cape Mendocino (16.3±8.2 µM; p≪0.01), while, Fe concentrations in the range 40–50 m at Cape Blanco (6.8±4.1 nM) were more than three-fold higher than those at Cape Mendocino (1.8±2.3 nM; p=0.01). These results support the hypothesis that the two upwelling plumes were seeded by different water masses with distinct nutrient concentrations.
Differences in underlying bathymetric features between Cape Blanco and Cape Mendocino likely contributed to the observed differences in Fe and Si availability. Cape Blanco sits over a broad section of the continental shelf (>30 km wide) composed of highly erodible sedimentary rocks with mineral-rich sand-silt layers originating from the Klamath Mountains (Spigai, 1971). The broad shelf continues south until the triple junction of the North American, Pacific, and Gorda plates which forms the submarine Mendocino escarpment, a narrow ridge extending west from Cape Mendocino along the transform fault (Menard and Dietz, 1952). Importantly, the shelf rapidly narrows to less than 5 km at the latitude of Cape Mendocino (Appendix A). Differences in shelf width have important implications on subregional iron availability. Previous work by Biller et al. (2013) demonstrated that shelf width correlated with greater Fe bioavailability in the water layer directly overlying the seafloor. This trend was evident in our study as well, with a positive correlation (ρ=0.57) between shelf width and Fe concentrations at the bottom of the euphotic zone for on-shelf stations. Yet, with only nine stations on-shelf stations, this correlation was not statistically significant.
In contrast with and , which are resupplied to the surface by upwelling, remineralized Fe is rapidly removed from the water column, such that Fe supply to the surface can be significantly decoupled from macronutrients (King and Barbeau, 2011; Bruland et al., 2014). As a result, differences in upwelling strength at Cape Blanco and Cape Mendocino likely account for the differences in and between the two sites, while contrasting shelf features can explain the larger differences in Fe availability. These observations fit within the theory that the California Current contains a “mosaic” of Fe limitation, where patches of Fe-poor water may persist even in the presence of upwelling conditions (Till et al., 2019; Hutchins et al., 1998). In the following section, we present several lines of evidence that photophysiological properties of phytoplankton assemblages were influenced by iron gradients.
4.2 Environmental and taxonomic influences on physiology and productivity
Environmental gradients exert direct effects on phytoplankton physiology and productivity by determining the supply of essential nutrients that support cellular growth and the maintenance of photosynthetic proteins. As a cofactor in many biological redox reactions, Fe plays a particularly important role in the photosynthetic electron transport chain and nutrient uptake pathways. Several lines of evidence suggest that iron stress was a key factor shaping phytoplankton productivity and photophysiology across our study site. As noted above, there was a significant difference in Fe concentrations between Cape Blanco (high Fe) and Cape Mendocino (low Fe) associated with variability in the shelf width. The difference in Fe availability was strongly correlated with Si: (ρ=0.85, p≪0.0.1), likely reflecting excess Si uptake by iron-limited diatoms (Sarthou et al., 2005; Franck et al., 2000). Further evidence of Fe stress at Cape Mendocino was obtained from ancillary transcriptomic analysis, which demonstrated elevated expression of the Fe assimilation gene Fea1 (Appendix C), which has previously been cited as a marker of Fe stress (Allen et al., 2007). Together, these observations indicate the onset of Fe stress at sites with reduced Fe availability.
Beyond direct effects, Fe gradients indirectly influence phytoplankton physiology and productivity by driving taxonomic shifts towards species that are adapted to low Fe conditions. Although diatoms were the most dominant group across the study area, their relative contribution was significantly lower around Cape Mendocino compared to Cape Blanco (Appendix B). At Cape Mendocino, we observed a taxonomic shift towards smaller phytoplankton, including smaller diatoms and dinoflagellates. Smaller cells sizes afford larger surface area to volume ratios, facilitating nutrient uptake at lower concentrations (Sunda and Huntsman, 1997). Moreover, stations near Cape Mendocino had high abundances of Pseudo-nitzschia, whereas this genus was not observed near Cape Blanco. Pseudo-nitzschia is a well-studied diatom with a number of physiological adaptations to Fe limitation (Lampe et al., 2018). These shifts in phytoplankton assemblages towards smaller sizes and low Fe specialists suggest bottom-up environmental controls driving taxonomic composition.
Cell size and nutrient status influence the optical properties and photophysiology of phytoplankton. Large cells are prone to pigment packaging effects, which decrease Chl-specific absorption as intracellular Chl concentrations increase and surface area to volume ratios decrease. This effect causes reduced σPSII, as was observed near Cape Blanco (Table 1). Nutrient limitation, particularly for Fe, can also lead to accumulation of photoinactive or damaged RCII, which still absorb light but do not contribute to photochemistry (Roncel et al., 2016). This further drives high σPSII, which is proportional to the light harvesting complex absorption coefficient normalized by active RCII concentrations (Oxborough et al., 2012; Li et al., 2021) and low , due to inactive RCII contributing to the Fm but not Fv signal (Schuback et al., 2021). Both of these commonly cited indicators of Fe stress were observed around Cape Mendocino and in some offshore regions (Table 1).
The taxonomic and nutrient-dependent effects on photophysiology described above directly impact ETRPSII (Eq. 1). Previous studies have noted higher ETRPSII among Fe-limited phytoplankton, presumably due to increased σPSII (Schuback et al., 2015). However, we observed greater ETRPSII in the relatively Fe-rich waters near Cape Blanco (Table 1), likely due to high , which represents the proportion of open RCII at a given light level (Suggett et al., 2011). Low NPQ observed in the Cape Blanco region (Fig. 4d) likely enabled to remain high under high light levels. Indeed, measured during underway PI curves and interpolated to in situ irradiances demonstrated that was higher around Cape Blanco compared to Cape Mendocino (Table 1). It is well recognized that iron limitation exacerbates high light stress and NPQ (Schallenberg et al., 2020; Ryan-Keogh et al., 2020), and the high NPQ at Cape Mendocino compared to Cape Blanco provides further evidence that Cape Mendocino assemblages were affected by Fe stress. Iron limitation also impacts photosynthetic processes downstream of ETRPSII. In this study, maximum carbon fixation rates (Pmax determined during 14C PI experiments) displayed a strong correlation with Si (ρ=0.63, p≪0.01) and the ratio of Si : (ρ=0.60, p≪0.0.1) in the water column.
Overall, our results suggest that Fe availability gradients between Cape Blanco and Mendocino influenced local community composition and physiology with consequential effects on C and Si cycles. Differences in taxonomic composition, photophysiology, nutrient quotas, and productivity all serve as evidence that the community shifted toward Fe limitation in proximity to Cape Mendocino. Due to the differential sensitivity of ETRPSII, carbon fixation, and NCP to Fe availability, we hypothesized that Fe limitation would lead to a decoupling between these different PP currencies. We explore this hypothesis below with direct comparisons of ETRPSII, C-fixation, and NCP.
4.3 Energy transfer efficiencies between photosynthetic processes
Measurements of PP in different “currencies” (electrons, carbon, and oxygen) reflect the rates of distinct photosynthetic processes. Comparison of these alternative productivity metrics can yield information on energy transfer efficiencies across the photosynthetic pipeline (Fig. 7). A minimum of four charge separation events are required to produce one O2 and fix one CO2, stoichiometrically linking water splitting and carbon fixation. Yet a number of nonlinear electron transport pathways can divert reducing power from carbon fixation, decoupling ETRPSII from GPP, while oxygen consumption by respiration and nonlinear electron transport pathways can further decouple ETRPSII from NCP (Fig. 7). The ratio between ETRPSII and GPP thus provides information on the magnitude of nonlinear electron transport, while the ratio between ETRPSII and NCP reflects the sum of nonlinear electron transport and respiration. In practice, interpreting the decoupling between ETR, GPP, and NCP is complicated by differences in the temporal and spatial scales of the various measurement approaches, as well as the different assumptions implicit in each method. In the following sections, we directly compare parallel productivity measurements to examine energy transfer efficiencies across photosynthetic processes, taking care to note important methodological considerations.
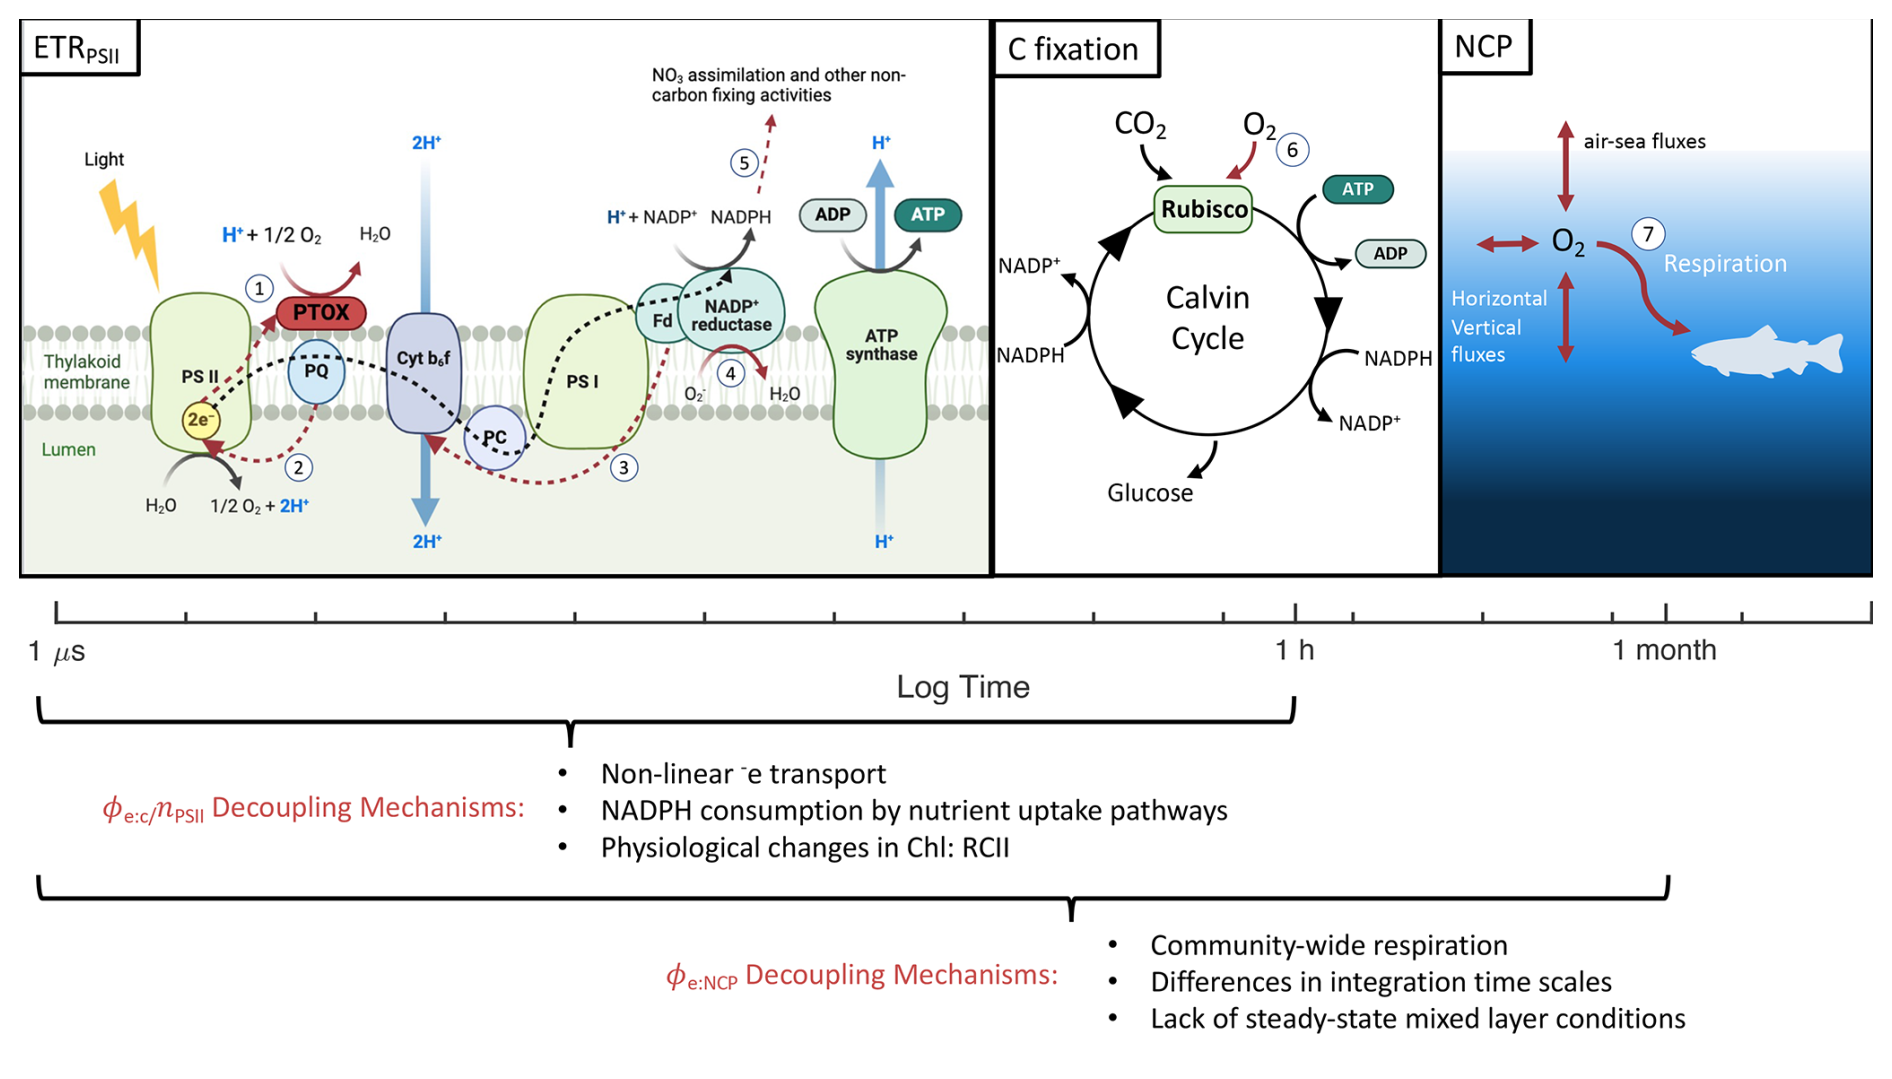
Figure 7Different primary productivity currencies and their decoupling mechanisms. The three productivity currencies of interest are indicated with respect to the times scales they represent. Numbered red pathways denote decoupling mechanisms including (1) chloro-respiration, (2) cyclic transport around PSII, (3) cyclic transport around PSI, (4) pseudocyclic/Mehler reactions, (5) reductant-consuming nutrient uptake pathways, (6) photorespiration, and (7) community-wide respiration. Figure produced in BioRender.
4.3.1 Carbon fixation as a function of ETRPSII
Nonlinear electron transport pathways (Fig. 7) can act to maintain redox homeostasis when ETRPSII exceeds downstream energy requirements for growth and metabolism. The energy balance between PSII and PSI becomes disrupted under high irradiance, when PSII absorbs energy in excess of PSI electron transport rates, and/or under nutrient limitation, when biosynthesis of electron transporters is limited (Hughes et al., 2018b; Schuback et al., 2015; Roncel et al., 2016). Iron limitation, in particular, exerts acute constraints on the synthesis of photosystem I (PSI) and Cytochrome b6f (Cyt b6f), which require 12 and 5 Fe atoms each (Raven et al., 1999). As a result, Fe-limited phytoplankton have high levels of PSII relative to PSI, exacerbating energy imbalances between PII and PSI, and necessitating upregulation of nonlinear electron transport pathways (Behrenfeld and Milligan, 2013). We therefore hypothesized that Fe stress would increase decoupling between C-fixation and ETRPSII.
One of our primary findings is that C-fixation varies as a hyperbolic function of ETRPSII, with curves defined by the maximum carbon fixation rate (Pmax-C) and the saturation constant (Ksat). These parameters were highly variable between samples (Fig. 6). Samples with high Pmax-C and Ksat (e.g., Station 6) showed more linear relationships between C-fixation and ETRPSII, and a nearly constant electron requirement for carbon fixation (). In contrast, in phytoplankton assemblages with low Pmax-C and Ksat, carbon-fixation quickly saturated with respect to ETRPSII, resulting in an increase in with increasing light levels (e.g., Station 7). Determining sources of Pmax-C and Ksat variability therefore provides significant utility in predicting electron requirements for gross carbon fixation, a key parameter required for fluorescence-based GPP measurements.
Previous studies have documented the importance of different environmental, taxonomic, and physiological parameters in driving variability in , but efforts to develop empirical algorithms predicting remain ongoing (Lawrenz et al., 2013). Recent progress has been made on this front by Schuback et al. (2015, 2016, 2017) who reported a consistent relationship between NPQNSV and in the surface waters of the Northeast Pacific and Canadian Arctic, suggesting that carbon fixation can be estimated using FRRF-based NPQ and ETRPSII measurements alone. Subsequent studies have applied the relationship observed by Schuback et al. (2015) to collect high-resolution fluorescence-based GPP estimates, e.g., Kranz et al. (2020). Others, however, have noted that the relationship does not hold for all taxa (Hughes et al., 2021), light conditions (Schuback et al., 2017), or environments where phytoplankton grow on more reduced N forms like (Fei et al., 2024).
In our study, NPQNSV was positively correlated with (ρ=0.55, p≪0.01). However, the linear relationship proposed by Schuback et al. (2017), Schuback and Tortell (2019) did not adequately predict for our samples (), nor did we find a single line of best fit that could describe all of our data (R2=0.30). Rather, we found that scaled directly with NPQNSV only for samples with low Pmax-C (). In contrast, for samples with high Pmax-C (), remained relatively constant across increasing light, NPQNSV, and ETRPSII (Fig. 8).
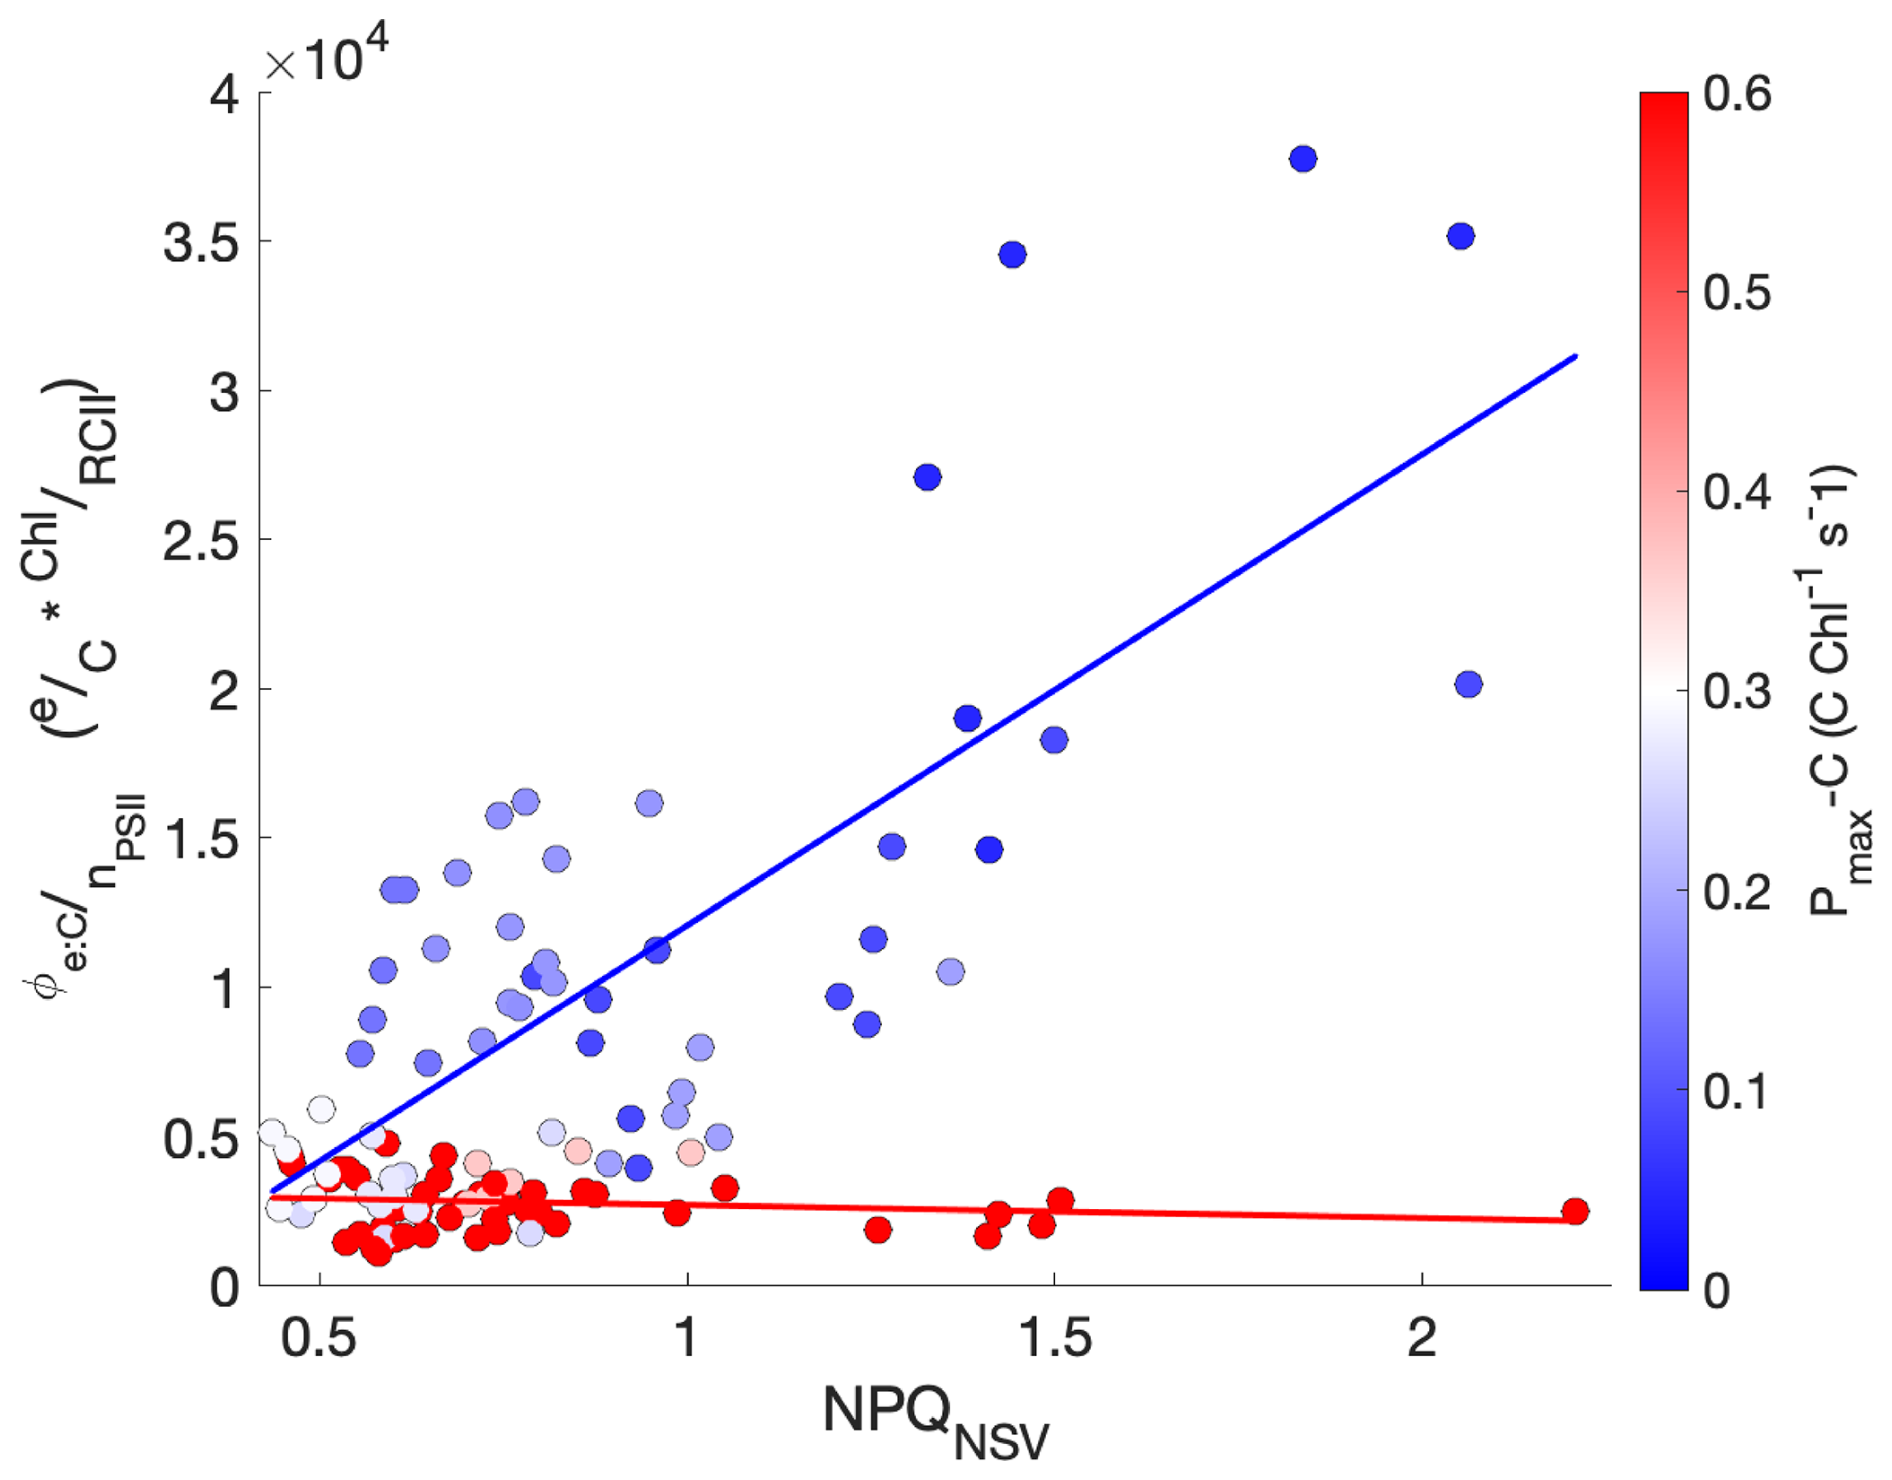
Figure 8The relationship between , NPQNSV, and Pmax-C. The electron requirement for carbon fixation, , measured as the ratio of ETRPSII to Chl-normalized carbon fixation, is plotted against NPQNSV. Each data point is colored by the sample's Pmax-C, shown by the red/blue color bar. Lines of best fit are drawn through points with and , with the color bar indicating Pmax−C.
By analogy with the Michaelis–Menten enzyme kinetics model, variability in Pmax-C can be explained as the product of the enzyme concentration and maximum reaction rate (Choi et al., 2017). In our case, Pmax-C reflects the entire suite of proteins that facilitate the conversion of chemical energy to organic matter. Reduced concentrations of PSI and Cyt b6f expected under Fe stress would therefore reduce Pmax-C. Indeed, Pmax-C was significantly correlated to physiological markers of Fe stress, σPSII (, p≪0.01), (ρ=0.56, p=0.02), and Si : (ρ=0.60, p=0.01). Additionally, meta transcriptomic analysis of diatom RNA revealed significant positive correlations (p<0.05) between Pmax-C and the expression level of different PSI subunits (psaE, psaL, psaM), with correlation coefficients of ρ=0.71, 0.70, and 0.93, respectively. In contrast, there were no detected correlations between Pmax-C and Cyt b6f; however, Cyt b559a, a subunit of PSII, also demonstrated a strong positive correlation with Pmax-C (ρ=0.76, p<0.05). While the precise functional roles of Cyt b559a are still not certain, previous studies have demonstrated its potential role in PSII assembly and photoprotective cyclic electron transport around PSII (Chiu and Chu, 2022). Finally, it is worth noting Ksat and Pmax-C displayed a positive correlation (ρ=0.70, p≪0.01).
In addition to nonlinear electron transport, is also directly affected by the number of Chl energetically coupled to RCII (). Directly measuring requires specialized O2 flash yield instrumentation (Suggett et al., 2009), which was unavailable for this study. Moreover, O2 flash yield measurements may be challenging in natural plankton assemblages containing phytoplankton and bacteria. As an alternative, variability in between samples can be assessed based on in situ Chl concentrations, normalized to FRRF-derived proxies for [RCII] () following the approach of Oxborough et al. (2012). With a known instrument calibration factor Ka, either provided by instrument manufacturers or determined independently by O2 flash yield measurements, this approximation could be used to estimate the absolute value of .
It is well established that Chl : RCII () ratios increase under low light to maximize light absorption (Greenbaum and Mauzerall, 1991). In our measurements, the proxy for varied significantly between sample depths, with higher at the bottom of the euphotic zone compared to surface depths, confirmed by a t-test comparison of population means (p≪0.01). Iron limitation is also expected to increase Chl : RCII. Although iron limitation lowers total cellular Chl content, Chl is more likely to be energetically coupled to RCII than PSI reaction centers (Greene et al., 1992). Accordingly, displayed a negative correlation with Fea1 expression in surface samples (ρ=0.72, p<0.05, n=9), which we used as a proxy for iron limitation. We thus conclude that Fe stress likely contributed to variability in in addition to influencing nonlinear electron transport. The hyperbolic relationship between carbon fixation and electron transport was unaffected by , which was assumed to be constant for individual samples throughout the course of PI experiments. However, this assumption may be violated under high light due to photoinactivation of RCII (Campbell and Serôdio, 2020). A robust understanding of variability requires direct [RCII] measurements collected in parallel with ETRPSII and carbon fixation measurements.
4.3.2 Comparison of ETRPSII and NCP
As opposite end members of the productivity spectrum (Fig. 7), ETRPSII quantifies gross photochemical energy production while NCP represents the net accumulation of photosynthetic carbon or oxygen remaining after accounting for all sources of mixed layer respiration. To directly compare ETRPSII and NCP, we converted ETRPSII from units of to (Eq. 5) by assuming each RCII was functionally coupled to 400–700 Chl pigments (Schuback et al., 2015; Kolber and Falkowski, 1993) and 4 charge separation events per gross O2 evolved. The resulting O2-based gross photochemistry values varied in the range 0–4000 (Fig. 5c), coincident with the range of previously reported values for the CCS (Kranz et al., 2020). On average, NCP accounted for 17 ± 8 % of gross photochemistry, indicating ∼80 % of oxygen produced at PSII by water-splitting reactions was consumed within the mixed layer through autotrophic and heterotrophic respiration. In contrast to , there was no significant differences in NCP:ETRPSII between Cape Blanco, Cape Mendocino, or offshore, suggesting minimal effects of nutrient limitation on decoupling between ETRPSII and NCP. Although NCP is constrained by gross photochemistry, NCP was greater than ETRPSII over 29 % of the cruise track. This apparent contradiction can be explained by differences in timescales between instantaneous ETRPSII measurements, and NCP, which is integrated over O2 residence times in the mixed layer (∼1–2 weeks). Sustained net autotrophy can lead to accumulation of O2 in the mixed layer, such that measured O2 fluxes indicate high levels of NCP despite short-term decreases in ETRPSII (e.g., overnight).
Regardless of the large differences in integration timescales and metabolic sources of decoupling, NCP showed strong coherence with ETRPSII (Fig. 9). Direct comparison between continuous underway measurements of ETRPSII and NCP yielded a moderate positive correlation (ρ=0.43, p≪0.01). To account for some of the decoupling introduced by the strong diel dependence of ETRPSII, we also compared ETRPSII and NCP measurements integrated over 24 h bins. This comparison indicated a much stronger relationship between ETRPSII and NCP (ρ=0.92, p≪0.01; Fig. 9). For daily integrated timescales, NCP linearly increased as a function of ETRPSII with a ∼15 % energy transfer efficiency and a predicted NCP of when ETRPSII is zero. This efficiency estimate is within range of previous studies that have compared gross oxygen production and NCP using triple oxygen isotope and methods (Howard et al., 2017; Haskell et al., 2017), despite the differences in integration timescales between ETRPSII and the triple oxygen isotope method. Further, a sensitivity analysis found no significant changes in the derived energy transfer efficiency between ETR and NCP integrated over 24, 48, 72, and 96 h bins. These results support the utility of FRRF to estimate gross oxygen productivity as an alternative to triple oxygen isotopes or other discrete methods, such as tracer experiments.
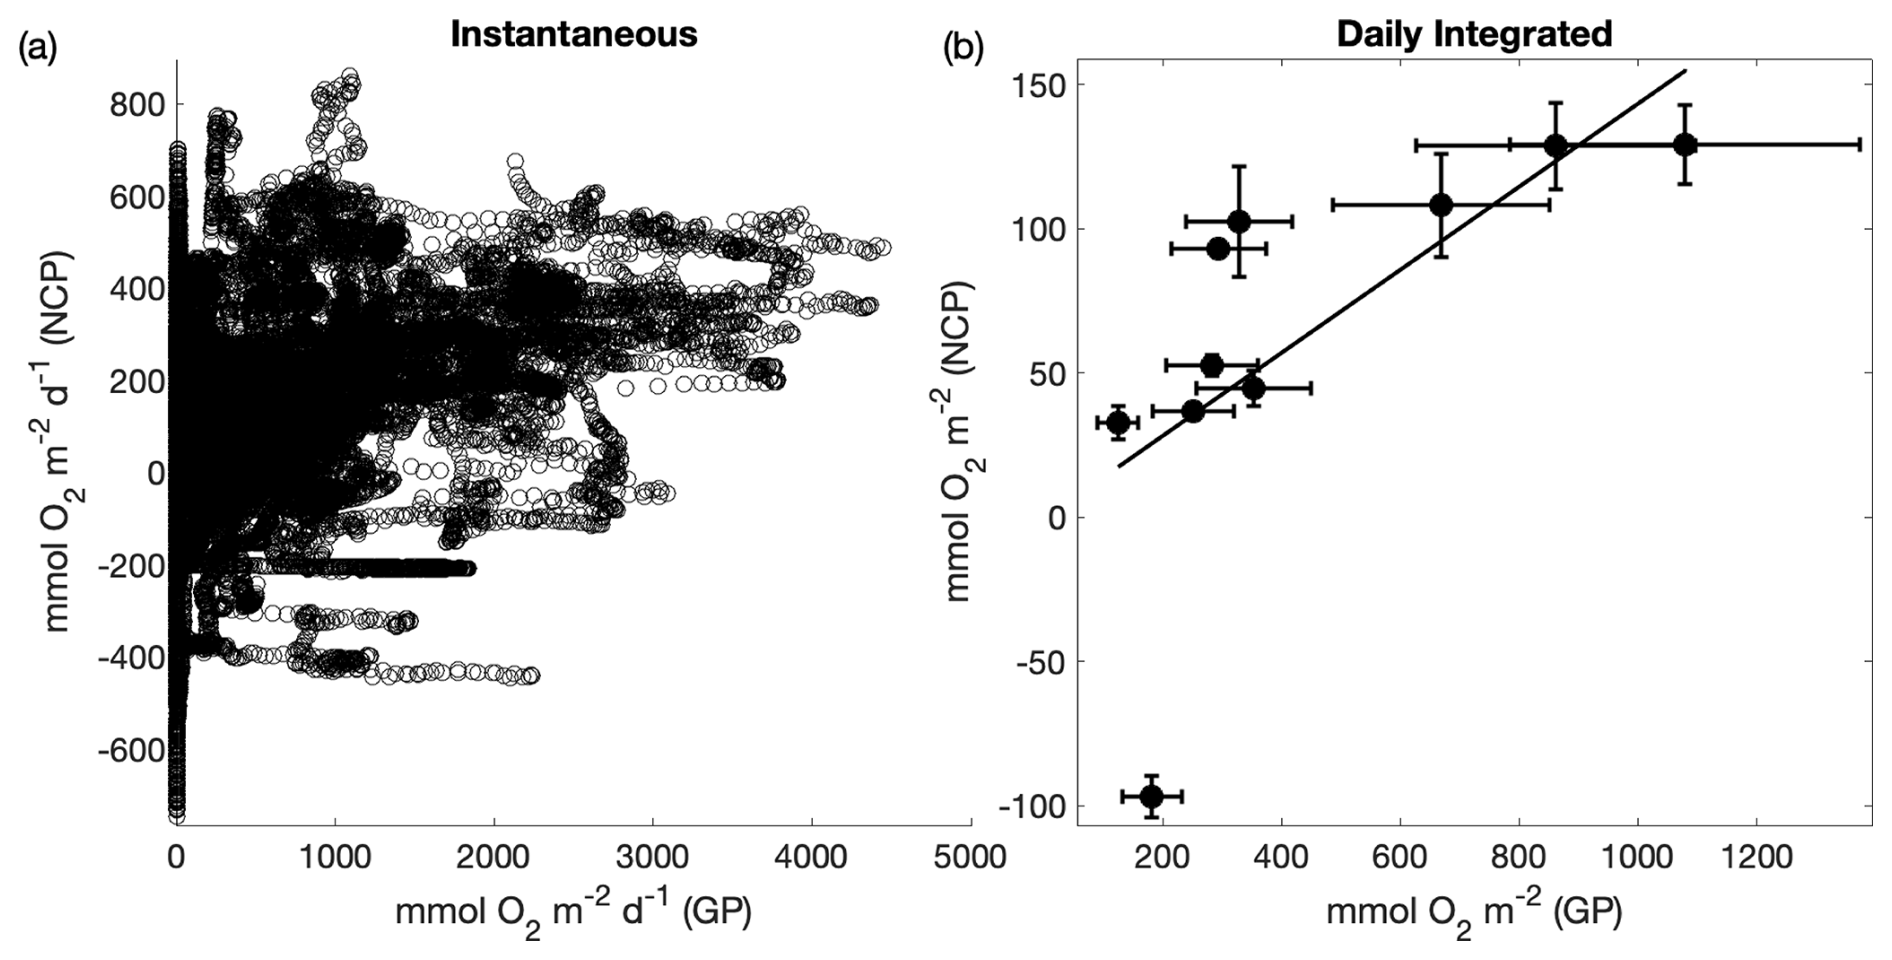
Figure 9Comparison between fluorescence-based gross photochemistry (GP) and net community productivity (NCP). Panel (a) compares continuous underway ETRPSII and NCP measurements (ρ=0.43, p≪0.01); (b) compares daily-integrated measurements of ETRPSII and NCP measurements (ρ=0.92, p≪0.01). A line of best fit () is drawn through the positive NCP data points. The error bars represent the total uncertainty of each measurement determined by propagating uncertainty in each input variable. For GP, total uncertainty is represented as the uncertainty in the Chl : RCII. For NCP, uncertainty was quantified from uncertainty in the deep water supply ratio of O2:N2O, and modeled differences between [N2] and [Ar]. Assumption biases (e.g., no horizontal advection of O2) also represent a potential large source of uncertainty but were not quantified.
Despite the inherent dependency of net oxygen production on gross oxygen production, the strength of the correlation between NCP and ETRPSII and the consistency of ETRPSII:NCP across subregions is surprising given the multitude of methodological and physiological factors that can uncouple these rates (Fig. 7). However, the derivations of NCP and GP both have similar dependencies on mixed layer Chl concentration. To obtain FRRF-derived GP estimates in comparable units of , we multiplied in situ ETRPSII by mixed layer Chl concentrations (Eq. 5). While mixed layer Chl concentrations are not explicitly included in NCP calculations (Sect. 2.6), biomass is expected to be a primary driver of bulk productivity. If Chl-normalized NCP is instead compared against GP expressed in units of , the correlation between 24 h binned and instantaneous NCP and ETRPSII estimates decrease to ρ=0.22 and 0.35, respectively. We therefore conclude that it remains challenging to derive gross and net carbon fluxes from FRRF measurements alone, but paired ETRPSII and Chl measurements can provide useful constraints for NCP estimates.
4.3.3 Final methodological considerations: spectral corrections
As discussed in Sect 4.3.1, decoupling between ETRPSII, C-fixation, and NCP is affected by methodological factors, including differences in the timescale of different photosynthetic processes and the different normalizations for various measured rates (e.g., per volume, Chl, or RCII). Additionally, differences in the spectral characteristics of the in situ light environment and instrument light sources may contribute further to decoupling between ETRPSII, C-fixation, and NCP.
Phytoplankton exhibit variable light use efficiencies across the photosynthetically available wavelength spectrum due to nonuniform pigment compositions and absorption spectra across assemblages. Consequently, photosynthetic measurements are wavelength-dependent (Kyewalyanga et al., 1997). As a result, differences in the spectral distribution of light between the FRRF and photosynthetron incubator (used for 14C uptake measurements) and the in situ light environment could influence the stoichiometry we observed between ETRPSII, C-fixation, and NCP.
In principal, spectral corrections can be used to account for variability between instrument light sources and in situ light environments to improve the inter-comparability of measurements (Schuback et al., 2021; Berman-Frank et al., 2023). These corrections require measurements of the spectral distribution of FRRF, photosynthetron incubator, and in situ light, and a reconstruction of photosynthesis absorption spectra based on photosynthetic pigment concentrations, determined from HPLC analysis. These corrections rely on the assumption that absorption spectra of photosynthetic pigments accurately represent the action spectra of photosynthesis, which not always the case (Kyewalyanga et al., 1997). In our study, we did not collect measurements of the spectral distribution of light in the euphotic zone, which would have likely varied significantly across depths and sampling sites (i.e., onshore versus offshore). For this reason, we are not able to spectrally correct in vitro measurements of ETRPSII and 14C-uptake to in situ spectral fields for more direct comparison with NCP. As a result, spectral differences between instrument light sources and the in situ light environment could contribute to some of the observed variability between ETRPSII, C-fixation, and NCP in this study. As for the comparison of FRRF and 14C data, spectral corrections would affect the absolute magnitude of , but these corrections would yield a station-specific scalar and would not affect the hyperbolic relationship observed between ETRPSII and C-fixation.
The best approach to minimize the influence of spectral variability is to match the spectral properties of instrument light sources to ambient light fields. However, this remains challenging for high-resolution underway applications across varying spectral environments.
Consistent with previous observations, our results indicate a patchwork of Fe stress within the coastal upwelling waters of the California Current, with evidence for physiological Fe stress within an upwelling filament near Cape Mendocino. Differences in iron availability between upwelling filaments appear to be linked to bathymetric features that influence sediment loading and variable micronutrient content of subsurface upwelling source waters. Paired fluorescence- and 14C-based PI measurements indicated strong connectivity between ETRPSII and carbon-fixation in Fe-replete phytoplankton, and greater decoupling in these rates for Fe-limited assemblages, with greater associated variability in . Recently, there has been significant focus on understanding variability to expand FRRF-based GPP surveys (Hughes et al., 2018b). Our results suggest that nutrient-replete phytoplankton are able maintain near constant under increasing excitation pressures due to their ability to efficiently transfer energy between PSI and PSII. Under these circumstances, NPQNSV is not a good predictor of . However, where nutrient limitation necessitates enhanced nonlinear electron transport pathways to maintain energy balance between PSII and PSI, does scale with NPQNSV and excess excitation pressure. With the accumulation of further data across a range of oceanographic conditions, it may be possible to derive more robust empirical relationships between NPQNSV and , which could be used to derive GPP in C-based units from FRRF measurements. In addition, our results show a general coherence between daily integrated GP, derived from ETRPSII, and NCP measurements, suggesting that ETRPSII may have significant utility as an indicator of bulk PP. We thus conclude that high-resolution, ship-board measurements hold significant potential to explore fine-scale variability in surface water PP in complex coastal waters.
The shelf width was determined at each latitude as the distance between the 200 and 0 m isobath calculated with the Haversine formula.
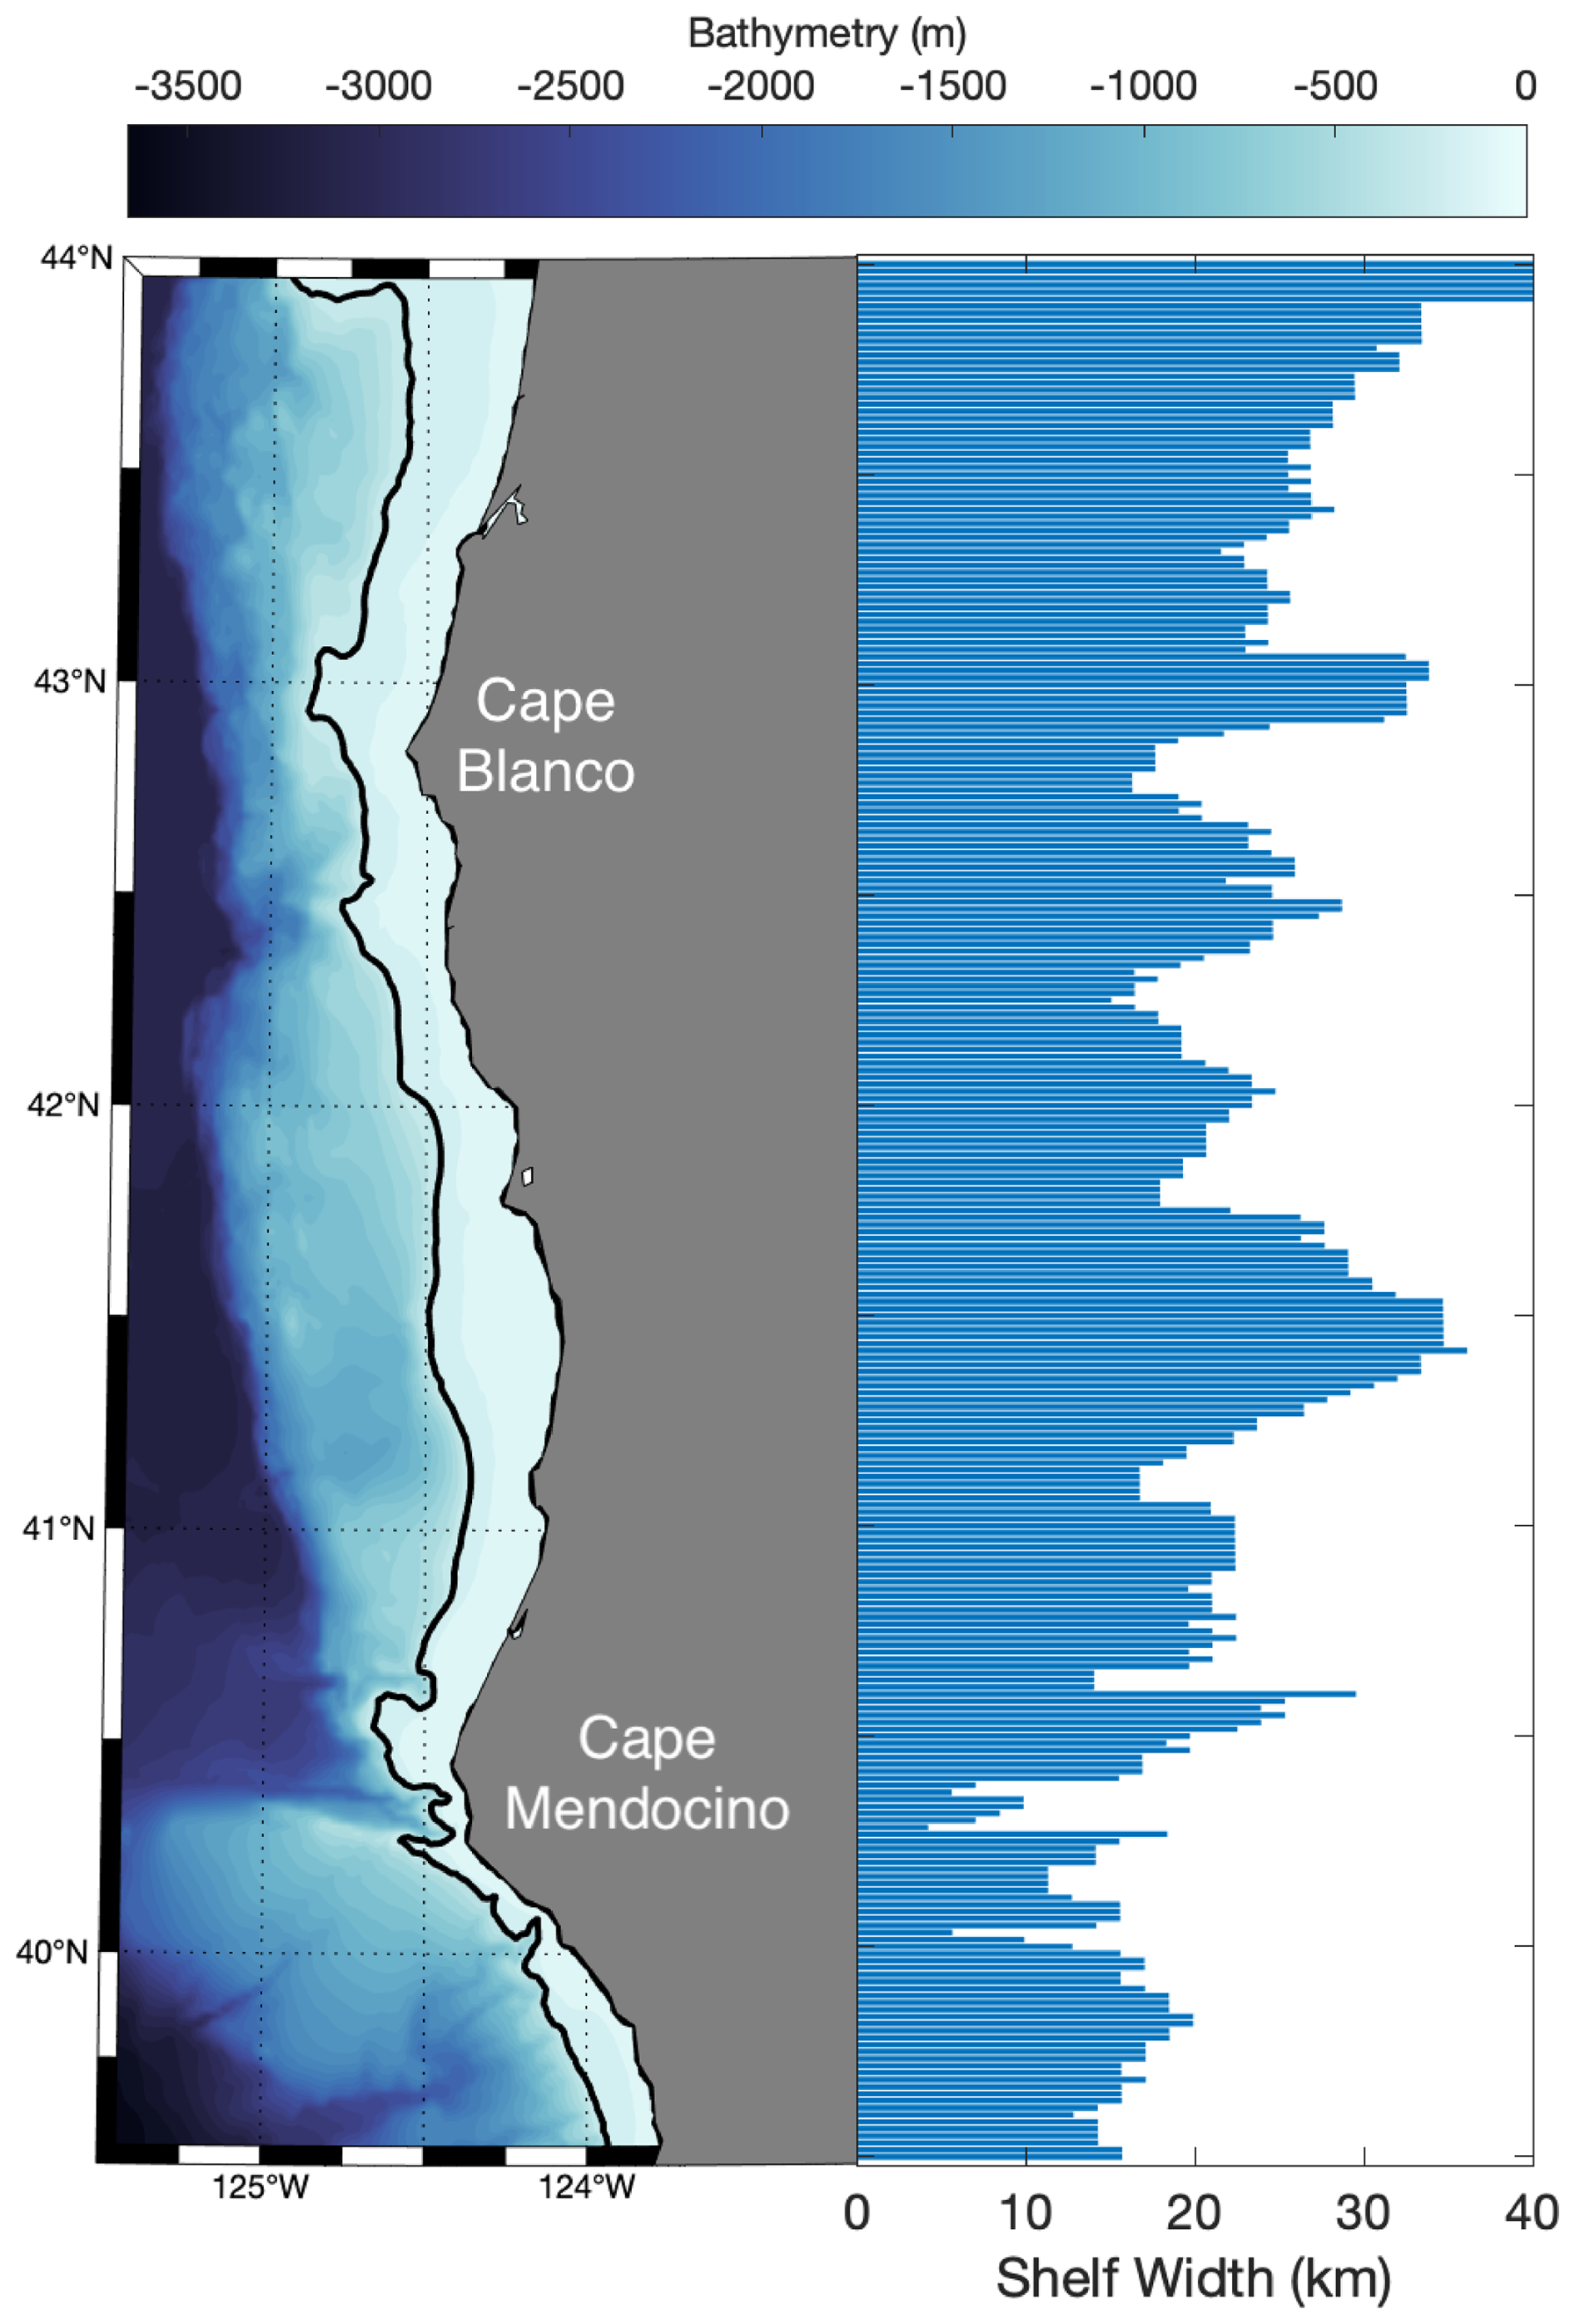
Figure A1Bathymetric map of the study region. The black contour line indicates the 200 m isobath. The horizontal bar graph demonstrates the shelf width at the aligned latitude.
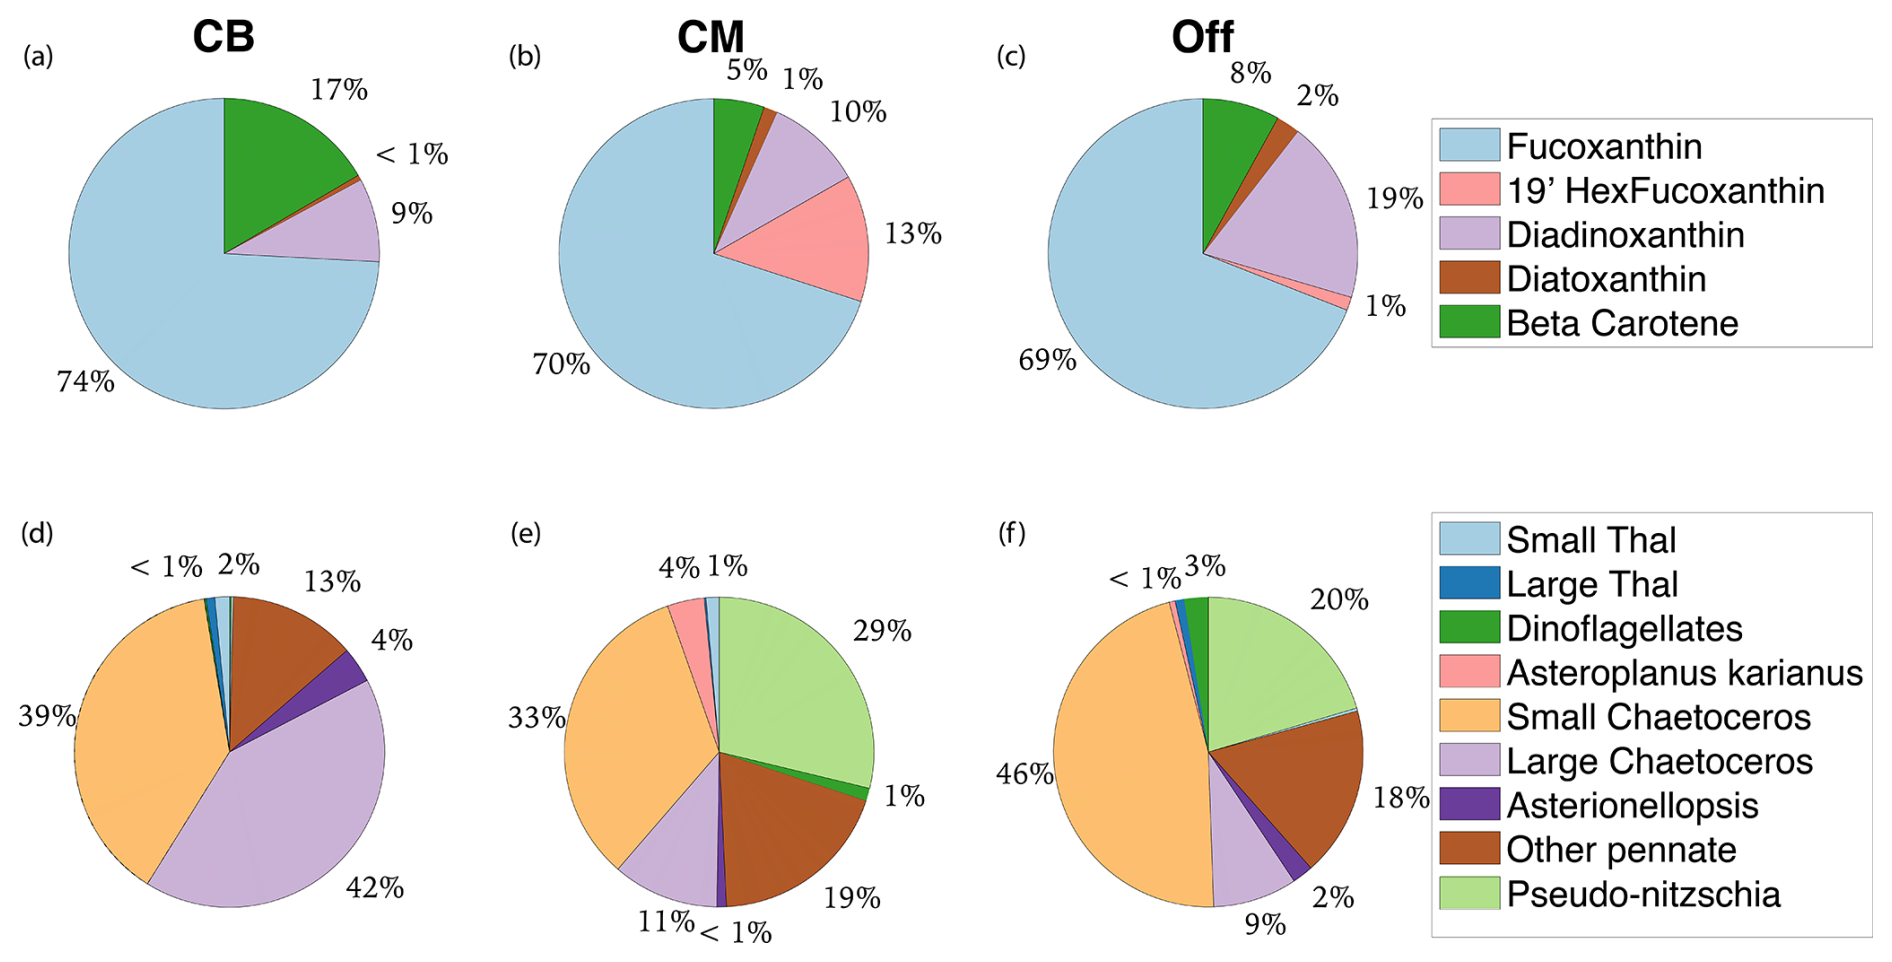
Figure B1Pigment and taxonomic composition of study area subregions. Panels (a)–(c) display non-Chl pigment distribution by mass for Cape Blanco (CB), Cape Mendocino (CM), and Offshore (Off). Panels (d)–(f) display the taxonomic distribution of diatom and dinoflagellate groups visible for microscope counts.
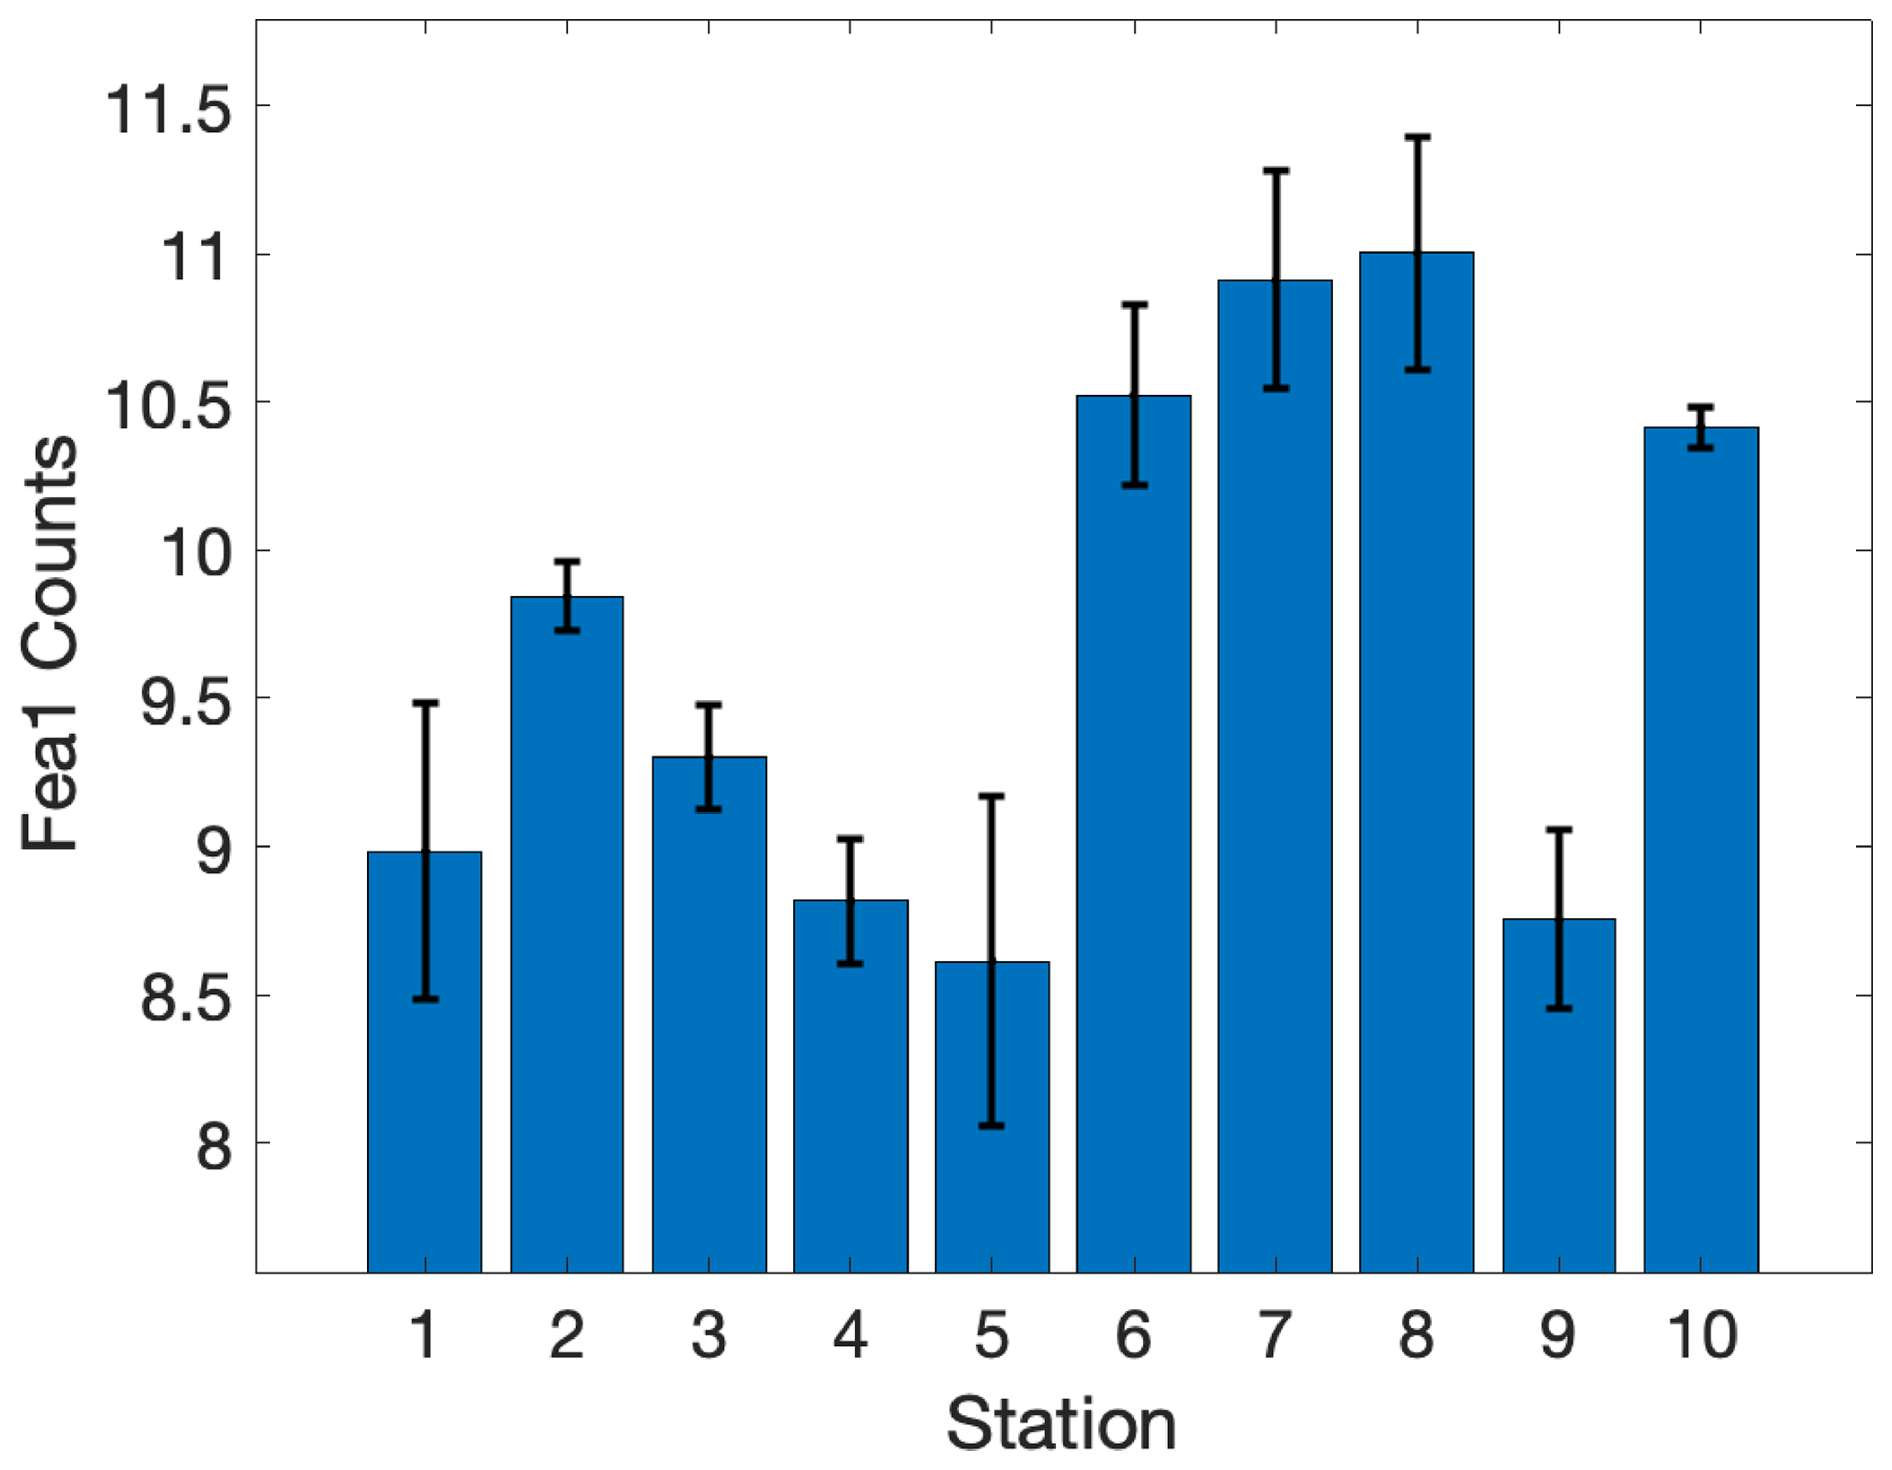
Figure C1Diatom-specific expression of Fe assimilation gene Fea1. Bar height displays the mean of normalized Fea1 counts mapping to Bacillariophyta by station. Normalized Fea1 counts were calculated using DESeq2's median of ratios method in R (Love et al., 2014). Error bars display the standard deviation. Stations 1–4 were in close proximity of Cape Blanco, 6 and 10 were offshore while the remaining stations were in proximity of the Cape Mendocino upwelling filament.
In situ hydrographic (https://doi.org/10.1594/PANGAEA.977780, Sezginer et al., 2025a), dissolved gas concentration (https://doi.org/10.1594/PANGAEA.977807, Sezginer et al., 2025b), and phytoplankton photophysiology data (https://doi.org/10.1594/PANGAEA.977630, Sezginer and Tortell, 2025) collected during the PUPCYCLE II expedition are all publicly available on PANGAEA, an Earth Science data repository. Dissolved Fe data have been submitted to https://www.bco-dmo.org/ (last access: 29 September 2025). Published data are available at https://www.bcodmo.org/project/768006 (last access: 29 September 2025). Satellite SST (11 µ daytime) and Chl data used to produce Fig. 1 were downloaded from NASA Aqua MODIS platform (https://oceancolor.gsfc.nasa.gov/l3/, last access: 9 February 2024). Ancillary data required to derive were sourced from several public databases. Wind speed and Ekman transport were taken from NOAA's Windspeed, Stress, Curl, Divergence, and Ekman Upwelling, Metop-C ASCAT, 0.25°, Global, Near Real Time, 2020–present, 1-Day Composite product. Sea level pressure was downloaded from the US Navy Global Environmental Model (NAVGEM) 0.5°, 2013–present Pressure MSL (https://coastwatch.pfeg.noaa.gov/erddap/griddap/erdNavgem05DPres.html, last access: 25 January 2024). Modeled sea surface temperature and salinity products were downloaded from https://psl.noaa.gov/data/gridded/data.noaa.oisst.v2.highres.html (last access: 27 October 2024) and https://podaac.jpl.nasa.gov/dataset/SMAP_JPL_L3_SSS_CAP_8DAY-RUNNINGMEAN_V5 (last access: 2 February 2024), respectively. Model code used to calculate and NCP calculations are available at https://github.com/rizett/O2N2_NCP_toolbox (Izett and Tortell, 2020).
YS conceived the research plan, conducted FRRF and 14C measurements, analyzed data, and wrote the manuscript with significant contribution from all co-authors. KS operated the PIGI, conducted all N2O measurements, and assisted with NCP computations and analysis. ES collected macronutrient and meta-transcriptomic data and assisted with meta-transcriptomic analysis. AM facilitated meta-transcriptomic data collection, assisted with meta-transcriptomic analysis, and co-organized the PUPCYCLE II expedition with CT. Trace metal clean Fe samples were collected by CT and processed by RT. Funding was secured by AM, CT, and PT. Primary advisory support and manuscript editing was done by PT.
The contact author has declared that none of the authors has any competing interests.
Publisher's note: Copernicus Publications remains neutral with regard to jurisdictional claims made in the text, published maps, institutional affiliations, or any other geographical representation in this paper. While Copernicus Publications makes every effort to include appropriate place names, the final responsibility lies with the authors.
We would like to thank the crew and fellow scientists aboard the R/V Sally Ride who made this work possible and created a delightful working environment. Special thanks go to Sacchinandan Pillai who provided HPLC data and mobilization assistance. We thank the Bundy lab at the University of Washington for the loan of their trace metal sampling van. We thank Diya Patel from the University of North Carolina for performing microscope counts.
Funding for the PUPCYCLE II cruise was provided to Adrian Marchetti from a National Science Foundation grant (OCE1751805). Iron analyses were funded through the Research Corporation for Science Advancement's Cottrell Scholar Award #26844 to Claire Till. Trace metal sampling was conducted with a shared-use rosette maintained at Skidaway and purchased with NSF Award OCE-2015430.
This paper was edited by Koji Suzuki and reviewed by Kazuhiro Yoshida and one anonymous referee.
Aardema, H. M., Slagter, H. A., de Angelis, I., Calleja, M. L., Dragoneas, A., Moretti, S., Schuback, N., Heins, L., Walter, D., Weis, U., Haug, G. H., and Schiebel, R.: On the Variability of Phytoplankton Photophysiology Along a Latitudinal Transect in the North Atlantic Surface Ocean, J. Geophys. Res.-Biogeo., 129, e2023JG007962, https://doi.org/10.1029/2023JG007962, 2024.
Allen, M., del Campo, J., Kropat, J., and Merchant, S.: FEA1, FEA2, and FRE1, encoding two homologous secreted proteins and a candidate ferrireductase, are expressed coordinately with FOX1 and FTR1 in iron-deficient Chlamydomonas reinhardtii., Eukaryot Cell., https://doi.org/10.1128/EC.00205-07, 2007.
Andrews, S.: FastQC: a quality control tool for high throughput sequence data, TS29 [code], https://www.bioinformatics.babraham.ac.uk/projects/fastqc/ (last access: 5 March 2024), 2010.
Austin, J. A. and Barth, J. A.: Variation in the position of the upwelling front on the Oregon shelf, J. Geophys. Res.-Oceans., 107, 1–15, https://doi.org/10.1029/2001JC000858, 2002.
Banse, K.: Should we continue to measure 14C-uptake by phytoplankton for another 50 years?, Limnol. Oceanogr. Bull., 11, 45–46, https://doi.org/10.1002/lob.200211345, 2002.
Behnke, J. and LaRoche, J.: Iron uptake proteins in algae and the role of Iron Starvation-Induced Proteins (ISIPs), Eur. J. Phycol., 55, 339–360, https://doi.org/10.1080/09670262.2020.1744039, 2020.
Behrenfeld, M. J. and Falkowski, P. G.: Photosynthetic rates derived from satellite-based chlorophyll concentration, Limnol. Oceanogr., 41, 1–20, 1997.
Behrenfeld, M. J. and Milligan, A. J.: Photophysiological expressions of iron stress in phytoplankton, Ann. Rev. Mar. Sci., 5, 217–246, https://doi.org/10.1146/annurev-marine-121211-172356, 2013.
Behrenfeld, M. J., Boss, E., Siegel, D. A., and Shea, D. M.: Carbon-based ocean productivity and phytoplankton physiology from space, Global Biogeochem. Cy., 19, 1–14, https://doi.org/10.1029/2004GB002299, 2005.
Berman-Frank, I., Campbell, D. A., Ciotti, A., Courtecuisse, E., Erickson, Z. K., Fujiki, T., Halsey, K., Hickman, A. E., Gorbunov, M. Y., Hughes, D. J., Kolber, Z. S., Moore, C. M., Oxborough, K., Prášil, O., Robinson, C. M., Ryan-Keogh, T. J., Schuback, N., Silsbe, G., Simis, S., Thomalla, S. and Varkey, D. R.: A user guide for the application of single turnover active chlorophyll fluorescence for phytoplankton productivity measurements, edited by: Tortell, P. and Suggett, D. J., https://doi.org/10.25607/OBP-1084, 2023.
Biller, D. V, Coale, T. H., Till, R. C., Smith, G. J., and Bruland, K. W.: Coastal iron and nitrate distributions during the spring and summer upwelling season in the central California Current upwelling regime, Cont. Shelf Res., 66, 58–72, https://doi.org/10.1016/j.csr.2013.07.003, 2013.
Bograd, S. J., Jacox, M. G., Hazen, E. L., Lovecchio, E., Montes, I., Pozo Buil, M., Shannon, L. J., Sydeman, W. J., and Rykaczewski, R. R.: Climate Change Impacts on Eastern Boundary Upwelling Systems, Ann. Rev. Mar. Sci., 15, 303–328, https://doi.org/10.1146/annurev-marine-032122-021945, 2023.
Bruland, K. W., Rue, E. L., Smith, G. J., and DiTullio, G. R.: Iron, macronutrients and diatom blooms in the Peru upwelling regime: brown and blue waters of Peru, Mar. Chem., 93, 81–103, https://doi.org/10.1016/j.marchem.2004.06.011, 2005.
Bruland, K. W., Middag, R., and Lohan, M. C.: 8.2 – Controls of Trace Metals in Seawater, in: Treatise on Geochemistry, edited by: Holland, H. D. and Turekian, K. K., 2nd edn., Elsevier, Oxford, 19–51, https://doi.org/10.1016/B978-0-08-095975-7.00602-1, 2014.
Buchfink, B., Xie, C., and Huson, D. H.: Fast and sensitive protein alignment using DIAMOND, Nat. Methods, 12, 59–60, https://doi.org/10.1038/nmeth.3176, 2015.
Bushmanova, E., Antipov, D., Lapidus, A., and Prjibelski, A. D.: RnaSPAdes: A de novo transcriptome assembler and its application to RNA-Seq data, Gigascience, 8, 1–13, https://doi.org/10.1093/gigascience/giz100, 2019.
Campbell, D. A. and Serôdio, J.: Photoinhibition of Photosystem II in Phytoplankton: Processes and Patterns, in: Photosynthesis in Algae: Biochemical and Physiological Mechanisms, edited by: Larkum, A. W. D., Grossman, A. R., and Raven, J. A., Springer International Publishing, Cham, 329–365, https://doi.org/10.1007/978-3-030-33397-3_13, 2020.
Carvalho, F., Gorbunov, M. Y., Oliver, M. J., Haskins, C., Aragon, D., Kohut, J. T., and Schofield, O.: FIRe glider: Mapping in situ chlorophyll variable fluorescence with autonomous underwater gliders, Limnol. Oceanogr. Methods, 18, 531–545, https://doi.org/10.1002/lom3.10380, 2020.
Cassar, N., Barnett, B. A., Bender, M. L., Kaiser, J., Hamme, R. C., and Tilbrook, B.: Continuous high-frequency dissolved Measurements by Equilibrator Inlet Mass Spectrometry, Anal. Chem., 81, 1855–1864, https://doi.org/10.1021/ac802300u, 2009.
Cassar, N., Nevison, C. D., and Manizza, M.: Correcting oceanic O2/Ar-net community production estimates for vertical mixing using N2O observations, Geophys. Res. Lett., 41, 8961–8970, https://doi.org/10.1002/2014GL062040, 2014.
Castelao, R. M. and Luo, H.: Upwelling jet separation in the California Current System, Sci. Rep., 8, 1–8, https://doi.org/10.1038/s41598-018-34401-y, 2018.
Chiu, Y.-F. and Chu, H.-A.: New Structural and Mechanistic Insights Into Functional Roles of Cytochrome b559 in Photosystem II, Front. Plant Sci., 13, https://doi.org/10.3389/fpls.2022.914922, 2022.
Choi, B., Rempala, G., and Kim, J.: Beyond the Michaelis–Menten equation: Accurate and efficient estimation of enzyme kinetic parameters, Sci Rep., https://doi.org/10.1038/s41598-017-17072-z, 2017.
Craig, H. and Hayward, T.: Oxygen Supersaturation in the Ocean: Biological Versus Physical Contributions, Science, 235, 199–202, https://doi.org/10.1126/science.235.4785.199, 1987.
Cutter, G., Casciotti, K., Croot, P., Geibert, W., Heimbürger, L.-E., Lohan, M., Planquette, H., and van de Flierdt, T.: Sampling and Sample-handling Protocols for GEOTRACES Cruises. Version 3, August 2017, GEOTRACES International Project Office, Toulouse, France, 139pp., https://doi.org/10.25607/OBP-2, 2017.
Deutsch, C., Frenzel, H., McWilliams, J. C., Renault, L., Kessouri, F., Howard, E., Liang, J.-H., Bianchi, D., and Yang, S.: Biogeochemical variability in the California Current System, Prog. Oceanogr., 196, 102565, https://doi.org/10.1016/j.pocean.2021.102565, 2021.
Domingues, R. B. and Barbosa, A. B.: Evaluating Underwater Light Availability for Phytoplankton: Mean Light Intensity in the Mixed Layer versus Attenuation Coefficient, Water, 15, https://doi.org/10.3390/w15162966, 2023.
Elkins, J. W., Wofsy, S. C., McElroy, M. B., Kolb, C. E., and Kaplan, W. A.: Aquatic sources and sinks for nitrous oxide, Nature, 275, 602–606, https://doi.org/10.1038/275602a0, 1978.
Federhen, S.: The NCBI Taxonomy database, Nucleic Acids Res., 40, D136–D143, https://doi.org/10.1093/nar/gkr1178, 2012.
Fei, S., Gao, Y., Li, J., and Cao, L.: The linkage between phytoplankton productivity and photosynthetic electron transport in the summer from the Changjiang River to the East China Sea, Front. Mar. Sci., 11, https://doi.org/10.3389/fmars.2024.1383988, 2024.
Greenbaum, N. L. and Mauzerall, D.: Effect of irradiance level on distribution of chlorophylls between PS II and PS I as determined from optical cross-sections, Biochim. Biophys. Acta – Bioenerg., 1057, 195–207, https://doi.org/10.1016/S0005-2728(05)80102-1, 1991.
Greene, R. M., Geider, R. J., Kolber, Z., and Falkowski, P. G.: Iron-Induced Changes in Light Harvesting and Photochemical Energy Conversion Processes in Eukaryotic Marine Algae 1, Plant Physiol., 100, 565–575, https://doi.org/10.1104/pp.100.2.565, 1992.
Groussman, R. D., Blaskowski, S., Coesel, S. N., and Armbrust, E. V: MarFERReT, an open-source, version-controlled reference library of marine microbial eukaryote functional genes, Sci. Data, 10, 926, https://doi.org/10.1038/s41597-023-02842-4, 2023.
Grundle, D. S., Juniper, S. K., and Giesbrecht, K. E.: Euphotic zone nitrification in the NE subarctic Pacific: Implications for measurements of new production, Mar. Chem., 155, 113–123, https://doi.org/10.1016/j.marchem.2013.06.004, 2013.
Halsey, K. H. and Jones, B. M.: Phytoplankton Strategies for Photosynthetic Energy Allocation, Ann. Rev. Mar. Sci., 7, 265–297, https://doi.org/10.1146/annurev-marine-010814-015813, 2015.
Haskell II, W. Z., Prokopenko, M. G., Hammond, D. E., Stanley, R. H. R., and Sandwith, Z. O.: Annual cyclicity in export efficiency in the inner Southern California Bight, Global Biogeochem. Cy., 31, 357–376, https://doi.org/10.1002/2016GB005561, 2017.
Horrigan, S. G., Carlucci, A. F., and Williams, P. M.: Light inhibition of nitrification in sea-surface films, J. Mar. Res., 39, https://elischolar.library.yale.edu/journal_of_marine_research/1559 (last access: 29 September 2025), 1981.
Howard, E. M., Durkin, C. A., Hennon, G. M. M., Ribalet, F., and Stanley, R. H. R.: Biological production, export efficiency, and phytoplankton communities across 8000 km of the South Atlantic, Global Biogeochem. Cy., 31, 1066–1088, https://doi.org/10.1002/2016GB005488, 2017.
Hughes, D. J., Varkey, D., Doblin, M. A., Ingleton, T., Mcinnes, A., Ralph, P. J., van Dongen-Vogels, V., and Suggett, D. J.: Impact of nitrogen availability upon the electron requirement for carbon fixation in Australian coastal phytoplankton communities, Limnol. Oceanogr., 63, 1891–1910, https://doi.org/10.1002/lno.10814, 2018a.
Hughes, D. J., Campbell, D. A., Doblin, M. A., Kromkamp, J. C., Lawrenz, E., Moore, C. M., Oxborough, K., Prášil, O., Ralph, P. J., Alvarez, M. F., and Suggett, D. J.: Roadmaps and Detours: Active Chlorophyll-a Assessments of Primary Productivity Across Marine and Freshwater Systems, Environ. Sci. Technol., 52, 12039–12054, https://doi.org/10.1021/acs.est.8b03488, 2018b.
Hughes, D. J., Giannini, F. C., Ciotti, A. M., Doblin, M. A., Ralph, P. J., Varkey, D., Verma, A., and Suggett, D. J.: Taxonomic Variability in the Electron Requirement for Carbon Fixation Across Marine Phytoplankton, J. Phycol., 57, 111–127, https://doi.org/10.1111/jpy.13068, 2021.
Hutchins, D. A., DiTullio, G. R., Zhang, Y., and Bruland, K. W.: An iron limitation mosaic in the California upwelling regime, Limnol. Oceanogr., 43, 1037–1054, https://doi.org/10.4319/lo.1998.43.6.1037, 1998.
IOCCG Protocol Series: Ocean Optics and Biogeochemistry Protocols for Satellite Ocean Colour Sensor Validation Volume 7.0. Aquatic Primary Productivity Field Protocols for Satellite Validation and Model Synthesis, edited by: Vandermeulen, R.A., and Chaves, J. E., International Ocean-Colour Coordinating Group (IOCCG), Dartmouth, NS, Canada, 201 pp., https://doi.org/10.25607/OBP-1835, 2022.
Izett, R. W.: Improved Estimates of Net Community Production in the Subarctic Pacific and Canadian Arctic Ocean Using Ship-Based Autonomous Measurements and Computational Approaches, Electronic Theses and Dissertations (ETDs) 2008+. T, University of British Columbia, https://doi.org/10.14288/1.0398454, 2021.
Izett, R. W., and Tortell, P. D.: O2N2_NCP_toolbox, GitHub [code], https://github.com/rizett/O2N2_NCP_toolbox (last access: 2 February 2024), 2020.
Izett, R. W. and Tortell, P. D.: as a tracer of mixed layer net community production: Theoretical considerations and proof-of-concept, Limnol. Oceanogr. Methods, 19, 497–509, https://doi.org/10.1002/lom3.10440, 2021.
Izett, R. W., Manning, C. C., Hamme, R. C., and Tortell, P. D.: Refined Estimates of Net Community Production in the Subarctic Northeast Pacific Derived From Measurements With N2O-Based Corrections for Vertical Mixing, Global Biogeochem. Cy., 32, 326–350, https://doi.org/10.1002/2017GB005792, 2018.
Izett, R. W., Hamme, R. C., McNeil, C., Manning, C. C. M., Bourbonnais, A., and Tortell, P. D.: as a New Tracer of Marine Net Community Production: Application and Evaluation in the Subarctic Northeast Pacific and Canadian Arctic Ocean, Front. Mar. Sci., 8, 1–19, https://doi.org/10.3389/fmars.2021.718625, 2021.
Jacox, M. G., Edwards, C. A., Hazen, E. L., and Bograd, S. J.: Coastal Upwelling Revisited: Ekman, Bakun, and Improved Upwelling Indices for the U. S. West Coast, J. Geophys. Res.-Oceans., 123, 7332–7350, https://doi.org/10.1029/2018JC014187, 2018.
Jin, X., Najjar, R. G., Louanchi, F., and Doney, S. C.: A modeling study of the seasonal oxygen budget of the global ocean, Journal of Geophysical Research: Oceans, 112, 1–19, https://doi.org/10.1029/2006JC003731, 2007.
Keeling, R. F., and Shertz, S. R.: Seasonal and interannual variations in atmospheric oxygen and implications for the global carbon cycle. Nature, 358, 723–727. https://doi.org/10.1038/358723a0, 1992.
King, A. L. and Barbeau, K. A.: Dissolved iron and macronutrient distributions in the southern California Current System, J. Geophys. Res.-Oceans., 116, https://doi.org/10.1029/2010JC006324, 2011.
Knap, A., Michaels, A., Close, A., Ducklow, H., and Dickson, A.: Protocols for the Joint Global Ocean Flux Study (JGFOS) Core Measurements, JGOFS Reoprt Nr. 19, vi + 170 pp., 198, https://doi.org/10013/epic.27912.d001, 1996.
Kolber, Z. and Falkowski, P. G.: Use of active fluorescence to estimate phytoplankton photosynthesis in situ, Limnol. Oceanogr., 38, 1646–1665, https://doi.org/10.4319/lo.1993.38.8.1646, 1993.
Kolber, Z. S., Prášil, O., and Falkowski, P. G.: Measurements of variable chlorophyll fluorescence using fast repetition rate techniques: Defining methodology and experimental protocols, Biochim. Biophys. Acta – Bioenerg., 1367, 88–106, https://doi.org/10.1016/S0005-2728(98)00135-2, 1998.
Kranz, S. A., Wang, S., Kelly, T. B., Stukel, M. R., Goericke, R., Landry, M. R., and Cassar, N.: Lagrangian Studies of Marine Production: A Multimethod Assessment of Productivity Relationships in the California Current Ecosystem Upwelling Region, J. Geophys. Res.-Oceans., 125, e2019JC015984, https://doi.org/10.1029/2019JC015984, 2020.
Kyewalyanga, M. N., Platt, T., and Sathyendranath, S.: Estimation of the photosynthetic action spectrum: Implication for primary production models, Mar. Ecol. Prog. Ser., 146, 207–223, https://doi.org/10.3354/meps146207, 1997.
Lampe, R. H., Mann, E. L., Cohen, N. R., Till, C. P., Thamatrakoln, K., Brzezinski, M. A., Bruland, K. W., Twining, B. S., and Marchetti, A.: Different iron storage strategies among bloom-forming diatoms., P. Natl. Acad. Sci. USA, 115, E12275–E12284, https://doi.org/10.1073/pnas.1805243115, 2018.
Lawrenz, E., Silsbe, G., Capuzzo, E., Ylöstalo, P., Forster, R. M., Simis, S. G. H., Prášil, O., Kromkamp, J. C., Hickman, A. E., Moore, C. M., Forget, M. H., Geider, R. J., and Suggett, D. J.: Predicting the Electron Requirement for Carbon Fixation in Seas and Oceans, PLoS One, 8, https://doi.org/10.1371/journal.pone.0058137, 2013.
Li, W. and Godzik, A.: Cd-hit: a fast program for clustering and comparing large sets of protein or nucleotide sequences, Bioinformatics, 22, 1658–1659, https://doi.org/10.1093/bioinformatics/btl158, 2006.
Li, Z., Li, W., Zhang, Y., Hu, Y., Sheward, R., Irwin, A. J., and Finkel, Z. V: Dynamic Photophysiological Stress Response of a Model Diatom to Ten Environmental Stresses, J. Phycol., 57, 484–495, https://doi.org/10.1111/jpy.13072, 2021.
Lohan, M. C., Aguilar-Islas, A. M., and Bruland, K. W.: Direct determination of iron in acidified (pH 1.7) seawater samples by flow injection analysis with catalytic spectrophotometric detection: Application and intercomparison, Limnol. Oceanogr. Methods, 4, 164–171, https://doi.org/10.4319/lom.2006.4.164, 2006.
Love, M. I., Huber, W., and Anders, S.: Moderated estimation of fold change and dispersion for RNA-seq data with DESeq2, Genome Biol., 15, 550, https://doi.org/10.1186/s13059-014-0550-8, 2014.
Lund, J. W. G., Kipling, C., and Le Cren, E. D.: The inverted microscope method of estimating algal numbers and the statistical basis of estimations by counting, Hydrobiologia, 11, 143–170, https://doi.org/10.1007/BF00007865, 1958.
Franck, V. M., Brzezinski, M. A., Coale, K. H., and Nelson, D. M.: Iron and silicic acid concentrations regulate Si uptake north and south of the Polar Frontal Zone in the Pacific Sector of the Southern Ocean, Deep-Sea Res. Part II Top. Stud. Oceanogr., 47, 3315–3338, https://doi.org/10.1016/S0967-0645(00)00070-9, 2000.
Marchetti, A., Moreno, C. M., Cohen, N. R., Oleinikov, I., deLong, K., Twining, B. S., Armbrust, E. V., and Lampe, R. H.: Development of a molecular-based index for assessing iron status in bloom-forming pennate diatoms, J. Phycol., 53, 820–832, https://doi.org/10.1111/jpy.12539, 2017.
Marshak, A. R. and Link, J. S.: Primary production ultimately limits fisheries economic performance, Sci. Rep., 11, 12154, https://doi.org/10.1038/s41598-021-91599-0, 2021.
Martin, M.: Cutadapt removes adapter sequences from high-throughput sequencing reads, EMBnet.journal [Online], 10–12, https://doi.org/10.14806/ej.17.1.200, 2011.
Mathis, M., Lacroix, F., Hagemann, S., Nielsen, D. M., Ilyina, T., and Schrum, C.: Enhanced CO2 uptake of the coastal ocean is dominated by biological carbon fixation, Nat. Clim. Chang., 14, 373–379, https://doi.org/10.1038/s41558-024-01956-w, 2024.
McKew, B. A., Davey, P., Finch, S. J., Hopkins, J., Lefebvre, S. C., Metodiev, M. V, Oxborough, K., Raines, C. A., Lawson, T., and Geider, R. J.: The trade-off between the light-harvesting and photoprotective functions of fucoxanthin-chlorophyll proteins dominates light acclimation in Emiliania huxleyi (clone CCMP 1516), New Phytol., 200, 74–85, https://doi.org/10.1111/nph.12373, 2013.
Menard, H. W. and Dietz, R. S.: Mendocino Submarine Escarpment, J. Geol., 60, 266–278, https://doi.org/10.1086/625962, 1952.
Mistry, J., Chuguransky, S., Williams, L., Qureshi, M., Salazar, G. A., Sonnhammer, E. L. L., Tosatto, S. C. E., Paladin, L., Raj, S., Richardson, L. J., Finn, R. D., and Bateman, A.: Pfam: The protein families database in 2021, Nucleic Acids Res., 49, D412–D419, https://doi.org/10.1093/nar/gkaa913, 2021.
Müller, P., Li, X. P., and Niyogi, K. K.: Non-photochemical quenching. A response to excess light energy, Plant Physiol., 125, 1558–1566, https://doi.org/10.1104/pp.125.4.1558, 2001.
Murphy, C. D., Ni, G., Li, G., Barnett, A., Xu, K., Grant-Burt, J., Liefer, J. D., Suggett, D. J., and Campbell, D. A.: Quantitating active photosystem II reaction center content from fluorescence induction transients, Limnol. Oceanogr. Methods, 15, 54–69, https://doi.org/10.1002/lom3.10142, 2017.
Niebergall, A. K., Traylor, S., Huang, Y., Feen, M., Meyer, M. G., McNair, H. M., Nicholson, D., Fassbender, A. J., Omand, M. M., Marchetti, A., Menden-Deuer, S., Tang, W., Gong, W., Tortell, P., Hamme, R., and Cassar, N.: Evaluation of new and net community production estimates by multiple ship-based and autonomous observations in the Northeast Pacific Ocean, Elem. Sci. Anthr., 11, 107, https://doi.org/10.1525/elementa.2021.00107, 2023.
Olson, R. J.: Differential photoinhibition of marine nitrifying bacteria: A possible mechanism for the formation of the primary nitrite maximum, J. Mar. Res., 39, https://elischolar.library.yale.edu/journal_of_marine_research/1541 (last access: 29 September 2025), 1981.
Oxborough, K., Moore, C. M., Suggett, D. J., Lawson, T., Chan, H. G., and Geider, R. J.: Direct estimation of functional PSII reaction center concentration and PSII electron flux on a volume basis: A new approach to the analysis of Fast Repetition Rate fluorometry (FRRf) data, Limnol. Oceanogr. Methods, 10, 142–154, https://doi.org/10.4319/lom.2012.10.142, 2012.
Patro, R., Duggal, G., Love, M. I., Irizarry, R. A., and Kingsford, C.: Salmon provides fast and bias-aware quantification of transcript expression, Nat. Methods, 14, 417–419, https://doi.org/10.1038/nmeth.4197, 2017.
Pauly, D. and Christensen, V.: Primary production required to sustain global fisheries, Nature, 374, 255–257, https://doi.org/10.1038/374255a0, 1995.
Pinckney, J. L., Richardson, T. L., Millie, D. F., and Paerl, H. W.: Application of photopigment biomarkers for quantifying microalgal community composition and in situ growth rates, Org. Geochem., 32, 585–595, https://doi.org/10.1016/S0146-6380(00)00196-0, 2001.
Platt, T., Gallegos, C. L., and Harrison, W. G.: Photoinhibition of photosynthesis in natural assemblages of marine phytoplankton, Journal of Marine Research, 38, https://elischolar.library.yale.edu/journal_of_marine_research/1525 (last access: 29 September 2025), 1980.
Raven, J. A., Evans, M. C. W., and Korb, R. E.: The role of trace metals in photosynthetic electron transport in O2-evolving organisms, Photosynthesis Research, Vol. 60, pp. 111–150, https://doi.org/10.1023/A:1006282714942, 1999.
Roncel, M., González-Rodríguez, A. A., Naranjo, B., Bernal-Bayard, P., Lindahl, M., Hervás, M., Navarro, J. A., and Ortega, J. M.: Iron deficiency induces a partial inhibition of the photosynthetic electron transport and a high sensitivity to light in the diatom Phaeodactylum tricornutum, Front. Plant Sci., 7, 1–14, https://doi.org/10.3389/fpls.2016.01050, 2016.
Ryan-Keogh, T. J., Thomalla, S. J., Robinson, C., and Smith, W.: Deriving a Proxy for Iron Limitation From Chlorophyll Fluorescence on Buoyancy Gliders, Front. Mar. Sci., 7, 1–13, https://doi.org/10.3389/fmars.2020.00275, 2020.
Saba, V. S., Friedrichs, M. A. M., Antoine, D., Armstrong, R. A., Asanuma, I., Behrenfeld, M. J., Ciotti, A. M., Dowell, M., Hoepffner, N., Hyde, K. J. W., Ishizaka, J., Kameda, T., Marra, J., Mélin, F., Morel, A., O'Reilly, J., Scardi, M., Smith Jr., W. O., Smyth, T. J., Tang, S., Uitz, J., Waters, K., and Westberry, T. K.: An evaluation of ocean color model estimates of marine primary productivity in coastal and pelagic regions across the globe, Biogeosciences, 8, 489–503, https://doi.org/10.5194/bg-8-489-2011, 2011.
Sarthou, G., Timmermans, K. R., Blain, S., and Tréguer, P.: Growth physiology and fate of diatoms in the ocean: a review, J. Sea Res., 53, 25–42, https://doi.org/10.1016/j.seares.2004.01.007, 2005.
Schallenberg, C., Strzepek, R. F., Schuback, N., Clementson, L. A., Boyd, P. W., and Trull, T. W.: Diel quenching of Southern Ocean phytoplankton fluorescence is related to iron limitation, 793–812, 2020.
Schuback, N. and Tortell, P. D.: Diurnal regulation of photosynthetic light absorption, electron transport and carbon fixation in two contrasting oceanic environments, Biogeosciences, 16, 1381–1399, https://doi.org/10.5194/bg-16-1381-2019, 2019.
Schuback, N., Schallenberg, C., Duckham, C., and Maldonado, M. T.: Interacting Effects of Light and Iron Availability on the Coupling of Photosynthetic Electron Transport and CO2-Assimilation in Marine Phytoplankton, PLoS One, 1–30, https://doi.org/10.1371/journal.pone.0133235, 2015.
Schuback, N., Flecken, M., Maldonado, M. T., and Tortell, P. D.: Diurnal variation in the coupling of photosynthetic electron transport and carbon fixation in iron-limited phytoplankton in the NE subarctic Pacific, Biogeosciences, 13, 1019–1035, https://doi.org/10.5194/bg-13-1019-2016, 2016.
Schuback, N., Hoppe, C. J. M., Tremblay, J. É., Maldonado, M. T., and Tortell, P. D.: Primary productivity and the coupling of photosynthetic electron transport and carbon fixation in the Arctic Ocean, Limnol. Oceanogr., 62, 898–921, https://doi.org/10.1002/lno.10475, 2017.
Schuback, N., Tortell, P. D., Berman-Frank, I., Campbell, D. A., Ciotti, A., Courtecuisse, E., Erickson, Z. K., Fujiki, T., Halsey, K., Hickman, A. E., Huot, Y., Gorbunov, M. Y., Hughes, D. J., Kolber, Z. S., Moore, C. M., Oxborough, K., Prášil, O., Robinson, C. M., Ryan-Keogh, T. J., Silsbe, G., Simis, S., Suggett, D. J., Thomalla, S., and Varkey, D. R.: Single-Turnover Variable Chlorophyll Fluorescence as a Tool for Assessing Phytoplankton Photosynthesis and Primary Productivity: Opportunities, Caveats and Recommendations, Front. Mar. Sci., 8, https://doi.org/10.3389/fmars.2021.690607, 2021.
Schuler, K. H. and Tortell, P. D.: Impacts of vertical mixing and ice-melt on N2O and CH4 concentrations in the Canadian Arctic Ocean, Cont. Shelf Res., 269, 105124, https://doi.org/10.1016/j.csr.2023.105124, 2023.
Sezginer, Y., Suggett, D. J., Izett, R. W., and Tortell, P. D.: Irradiance and nutrient-dependent effects on photosynthetic electron transport in Arctic phytoplankton: A comparison of two chlorophyll fluorescence-based approaches to derive primary photochemistry, PLoS One, 16, 1–23, https://doi.org/10.1371/journal.pone.0256410, 2021.
Sezginer, Y., Campbell, D., Pillai, S., and Tortell, P.: Fluorescence-based primary productivity estimates are influenced by non-photochemical quenching dynamics in Arctic phytoplankton, Front. Microbiol., 14, https://doi.org/10.3389/fmicb.2023.1294521, 2023.
Smith, J. M., Casciotti, K. L., Chavez, F. P., and Francis, C. A.: Differential contributions of archaeal ammonia oxidizer ecotypes to nitrification in coastal surface waters, ISME J., 8, 1704–1714, https://doi.org/10.1038/ismej.2014.11, 2014.
Soneson, C., Love, M. I., and Robinson, M. D.: Differential analyses for RNA-seq: transcript-level estimates improve gene-level inferences [version 2; peer review: 2 approved], F1000Research, 4, https://doi.org/10.12688/f1000research.7563.2, 2016.
Spigai, J. J.: Marine geology of the continental margin off southern Oregon, Oregon State University, https://ir.library.oregonstate.edu/concern/graduate_thesis_or_dissertations/2r36v139f (last access: 29 September 2025), 1971.
Stanley, R. H. R., Kirkpatrick, J. B., Cassar, N., Barnett, B. A., and Bender, M. L.: Net community production and gross primary production rates in the western equatorial Pacific, Global Biogeochem. Cy., 24, https://doi.org/10.1029/2009GB003651, 2010.
Stephens, B. M., Wankel, S. D., Beman, J. M., Rabines, A. J., Allen, A. E., and Aluwihare, L. I.: Euphotic zone nitrification in the California Current Ecosystem, Limnol. Oceanogr., 65, 790–806, https://doi.org/10.1002/lno.11348, 2020.
Suggett, D. J., MacIntyre, H. L., Kana, T. M., and Geider, R. J.: Comparing electron transport with gas exchange: parameterising exchange rates between alternative photosynthetic currencies for eukaryotic phytoplankton, Aquatic Microbial Ecology, 56, 147–162, https://doi.org/10.3354/ame01303, https://www.int-res.com/articles/ame_oa/a056p147.pdf (last access: 29 September 2025), 2009.
Suggett, D., and Moore, C. M., and Geider, R. J.: Estimating Aquatic Productivity from Active Fluorescence Measurements, in: Chlorophyll a Fluorescence in Aquatic Sciences: Methods and Applications. Developments in Applied Phycology, vol 4,, edited by: Suggett, D., Prášil, O., and Borowitzka, M., Springer, Dordrecht, https://doi.org/10.1007/978-90-481-9268-7_6, 2010.
Suggett, D. J., Moore, C. M., and Geider, R. J.: Chlorophyll a fluorescence in Aquatic Sciences: Methods and Applications, Dev. Appl. Phycol., https://doi.org/10.1007/978-90-481-9268-7, 2011.
Sunda, W. G. and Huntsman, S. A.: Interrelated influence of iron, light and cell size on marine phytoplankton growth, Nature, 390, 389–392, https://doi.org/10.1038/37093, 1997.
Suorsa, M.: Cyclic electron flow provides acclimatory plasticity for the photosynthetic machinery under various environmental conditions and developmental stages, Front. Plant Sci., 6, 1–8, https://doi.org/10.3389/fpls.2015.00800, 2015.
Sezginer, Y. and Tortell, P. D.: May–June 2023 California Current Fast Repetition Rate Fluorometer (FRRF) Data, PANGAEA [data set], https://doi.org/10.1594/PANGAEA.977630, 2025.
Sezginer, Y., Marchetti, A., and Till, C.: May–June 2023 California Current Thermosalinograph Data, PANGAEA [data set], https://doi.org/10.1594/PANGAEA.977780, 2025a.
Sezginer, Y., Schuler, K., and Tortell, P. D.: May–June 2023 California Current Pressure In Situ Gas Instrument (PIGI) Data, PANGAEA [data set], https://doi.org/10.1594/PANGAEA.977807, 2025b.
Till, C. P., Solomon, J. R., Cohen, N. R., Lampe, R. H., Marchetti, A., Coale, T. H., and Bruland, K. W.: The iron limitation mosaic in the California Current System: Factors governing Fe availability in the shelf/near-shelf region, Limnol. Oceanogr., 64, 109–123, https://doi.org/10.1002/lno.11022, 2019.
Tyrrell, T. and Law, C. S.: Low nitrate:phosphate ratios in the global ocean, Nature, 387, 793–796, https://doi.org/10.1038/42915, 1997.
Wang, S., Kranz, S. A., Kelly, T. B., Song, H., Stukel, M. R., and Cassar, N.: Lagrangian Studies of Net Community Production: The Effect of Diel and Multiday Nonsteady State Factors and Vertical Fluxes on O2/Ar in a Dynamic Upwelling Region, J. Geophys. Res.-Biogeo., 125, e2019JG005569, https://doi.org/10.1029/2019JG005569, 2020.
Zhu, Y., Ishizaka, J., Tripathy, S. C., Wang, S., Sukigara, C., Goes, J., Matsuno, T., and Suggett, D. J.: Relationship between light, community composition and the electron requirement for carbon fixation in natural phytoplankton, Mar. Ecol. Prog. Ser., 580, 83–100, https://doi.org/10.3354/meps12310, 2017.
- Abstract
- Introduction
- Methods and materials
- Results
- Discussion
- Conclusion
- Appendix A: Study region shelf width variability
- Appendix B: Photopigment and species distribution by subregion
- Appendix C: Normalized counts of diatom-specific Fea1 transcripts
- Code and data availability
- Author contributions
- Competing interests
- Disclaimer
- Acknowledgements
- Financial support
- Review statement
- References