the Creative Commons Attribution 4.0 License.
the Creative Commons Attribution 4.0 License.
 | 20 Oct 2025
Isotope discrimination of carbonyl sulfide (34S) and carbon dioxide (13C, 18O) during plant uptake in flow-through chamber experiments
Sophie L. Baartman
Steven M. Driever
Maarten L. J. Wassenaar
Linda M. J. Kooijmans
Nerea Ubierna
Leon Mossink
Maria E. Popa
Ara Cho
Lisa Wingate
Thomas Röckmann
Steven M. A. C. van Heuven
Maarten C. Krol
Carbonyl sulfide (COS) has been proposed as a proxy for gross primary production (GPP), as it is taken up by plants through a pathway comparable to that of CO2. COS diffuses into the leaf, where it undergoes an essentially one-way reaction in the mesophyll cells, irreversibly catalyzed by the enzyme carbonic anhydrase (CA), and is likely not respired by the leaf. In order to use COS as a proxy for GPP, the mechanisms of COS uptake and its coupling to photosynthesis need to be well understood. Characterizing the isotopic discrimination of COS during plant uptake could provide valuable information on the physiological COS uptake process and may help to constrain the COS budget.
This study presents joint measurements of isotope discrimination during plant uptake for COS (CO34S) and CO2 (13CO2 and C18O16O). A C3 plant, sunflower (Helianthus annuus), and a C4 plant, papyrus (Cyperus papyrus), were enclosed in a flow-through plant chamber and exposed to varying light levels. The incoming and outgoing gas compositions were measured online, and discrete air samples were taken for isotope analysis. Simultaneously measuring fluxes and isotope discrimination of both COS and CO2 yielded a unique dataset that includes information on the plant's behavior and allowed for the estimation of stomatal- and mesophyll conductances.
The average COS uptake fluxes were 73.3 ± 1.5 pmol m−2 s−1 for sunflower and 107.3 ± 1.5 pmol m−2 s−1 for papyrus (PAR > 0) and displayed virtually no trend with increasing PAR from 200 to 600 µmol m−2 s−1. The mean observed 34Δ for COS was 3.4 ± 1.0 ‰ for sunflower and 2.6 ± 1.0 ‰ for papyrus. 34Δ was stable across all light intensities, which could be explained by a sufficient stomatal opening and low variability in the ratio of mesophyll vs. ambient COS mole fraction, . For both C3 and C4 plants, for CO2, a negative relationship was observed between the uptake flux and the isotopic discriminations 13Δ and 18Δ. The CO2 uptake and 13CO2 and C16O18O discriminations of sunflower have expected values for a C3 plant, while the low CO2 flux and high 13Δ and 18Δ values observed for papyrus were not in the typical C4 range, which was perhaps due to the relatively low light conditions during our experiments.
- Article
(3915 KB) - Full-text XML
- BibTeX
- EndNote


Photosynthetic uptake of carbon dioxide (CO2) by the terrestrial biosphere, quantified by the gross primary production (GPP), is the largest sink of atmospheric CO2, and may be altered as the climate changes (Friedlingstein et al., 2023). For making accurate future climate projections, it is important to quantify changes in the functioning of the biosphere and its influence on the atmospheric composition. Several techniques can be used to quantify photosynthesis and respiration fluxes at the ecosystem- and larger scales, such as Eddy Covariance (EC) (Asaf et al., 2013; Billesbach et al., 2014; Commane et al., 2015; Wehr et al., 2017; Vesala et al., 2022), variations in the stable isotopic composition of CO2 (e.g. Farquhar and Lloyd, 1993; Farquhar et al., 1993; Wingate et al., 2007; Gentsch et al., 2014; Wehr and Saleska, 2015), solar-induced chlorophyll fluorescence (SIF), near infrared reflectance of vegetation (NIRv) and inverse atmospheric modeling studies (Kettle et al., 2002; Ma et al., 2021; Remaud et al., 2022). However, these techniques have limitations, because they either measure net CO2 fluxes (Wohlfahrt et al., 2012; Kooijmans et al., 2017) or they require additional measurements such as the oxygen isotopic composition of water pools (Wingate et al., 2010; Adnew et al., 2020) or, in the case of modeling studies, prior information on location and magnitude of the fluxes. Because of these limitations, other potential independent proxies for GPP have recently gained attention, especially the trace gas carbonyl sulfide (COS or OCS, COS henceforth) (Sandoval-Soto et al., 2005; Montzka et al., 2007; Campbell et al., 2008; Whelan et al., 2018; Lai et al., 2024).
COS is the most abundant sulfur-containing atmospheric trace gas, with a tropospheric mole fraction of around 500 pmol mol−1 that displays a strong seasonal cycle, mostly due to the uptake of COS by terrestrial vegetation during photosynthesis. Figure 1 shows a schematic of the uptake pathways and assimilation locations of COS and CO2 in the leaf. Similarly to CO2, COS diffuses across the leaf boundary layer, through the stomata and into the leaf mesophyll cells (Protoschill-Krebs and Kesselmeier, 1992; Protoschill-Krebs et al., 1996). There, COS is hydrolyzed in an essentially one-way reaction, catalyzed by the enzyme carbonic anhydrase (CA), in contrast to the reversible hydration reaction that CO2 undergoes (Protoschill-Krebs and Kesselmeier, 1992; Protoschill-Krebs et al., 1996). Assuming that there is no COS emission, the COS uptake by plants is proportional to photosynthetic uptake of CO2, and therefore, GPP can be derived from the leaf-scale relative uptake ratio (LRU) of COS and CO2 uptake fluxes, AS (pmol m−2 s−1) and AC (µmol m−2 s−1), normalized to their atmospheric mole fractions, (pmol mol−1) and (µmol mol−1) using Eq. (1):
If we assume negligible daytime leaf respiration, or if we account for it, AC can be replaced by GPP, which can then be estimated using Eq. (2) (re-arrangement of Eq. 1) (Campbell et al., 2008).
While the use of LRU as a link between COS and CO2 fluxes seems promising, some studies have shown that the LRU is not constant among species and changes with environmental conditions such as photosynthetically active radiation (PAR), temperature and vapor pressure deficit (VPD) (Kooijmans et al., 2019; Maignan et al., 2021; Sun et al., 2022; Spielmann et al., 2023; Sun et al., 2024). Additionally, the existence of a COS compensation point suggests that emissions can occur for some species under certain circumstances (Goldan et al., 1988; Kesselmeier and Merk, 1993; Kuhn and Kesselmeier, 2000; Maseyk et al., 2014; Belviso et al., 2022). Thus, a more thorough understanding of the physiological drivers and limitations of COS uptake by plants, and its relationship with CO2 uptake, is needed.
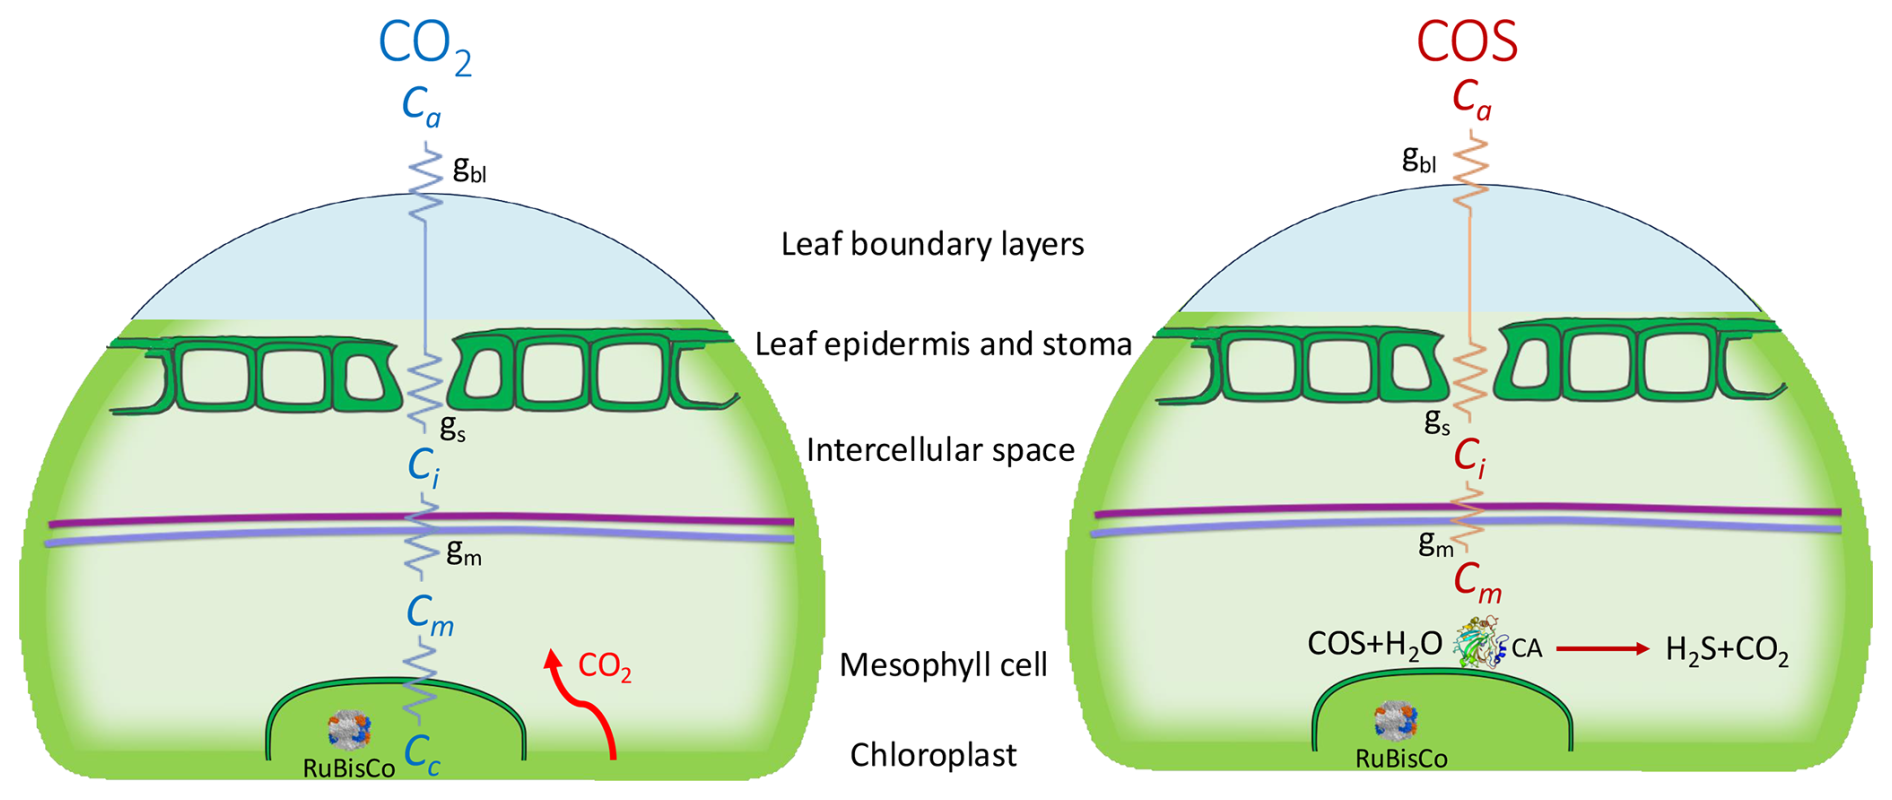
Figure 1Schematic (simplified) representation of the diffusion pathways (zigzag lines) of CO2 (left) and COS (right) into a C3 leaf, with the conductance parameters being boundary layer- (gbl), stomatal- (gs) and mesophyll conductance (gm). The CO2 and COS mole fractions are indicated as Ca (atmospheric), Ci (intercellular space), Cm (mesophyll cell) and, for CO2, Cc indicates the mole fraction in the chloroplast (the green, bordered area). The enzymes ribulose-1,5-bisphosphate carboxylase oxygenase (RuBisCo, inside the chloroplast) and carbonic anhydrase (CA, right figure only) catalyze CO2 and COS fixation. The purple line represents the mesophyll cell wall, and the blue line indicates the plasma membrane.
Using the distinct fingerprints of chemical and diffusion processes, the isotopic fractionation of COS during plant uptake could be used to help improve understanding of processes driving COS plant uptake. For example, isotope measurements may provide insights on the role of environmental factors, such as PAR and VPD with respect to LRU variations. Improved global estimates of isotope discrimination of C3 and C4 species may then be used to better constrain the COS budget (Davidson et al., 2022) and possibly aid in improving the COS-derived GPP estimate.
Isotope studies on COS uptake build on the extensive experience and literature on the isotope effects associated with the uptake of CO2. The discrimination against CO34S (‰) is defined in Eq. (3), where 32k and 34k are the reaction rate coefficients for uptake of CO32S and CO34S, respectively:
Isotope discrimination occurs both during diffusion of COS into the leaf and due to the preferential hydrolysis of lighter isotopologues by CA (Davidson et al., 2022). Similar to the model developed by Farquhar et al. (1982) for 13CO2 discrimination during photosynthesis, the net CO34S discrimination during plant uptake (34Δ) can be expressed as a function of the ratio of COS mole fraction at the site of assimilation (the end-point), in the mesophyll cell () versus the COS mole fraction in ambient air () (Davidson et al., 2022):
where is the fractionation occurring during diffusion of COS into the leaf up to the mesophyll cell, which incorporates leaf boundary layer (BL) diffusion, stomatal diffusion and gas-liquid interface dissolution and diffusion, and h is the S isotope fractionation during fixation by the enzyme carbonic anhydrase (CA).
has been suggested to be close to zero in C3 plants (Stimler et al., 2011, 2012). When , Eq. (4) reduces to , thus 34Δ is caused solely by diffusion differences between CO32S and CO34S () through the stomata and up to the mesophyll. Binary molecular diffusion of COS in air is theoretically expected to provide a 34Δ value of around 5 ‰, because of the differences in molecular masses between the different COS isotopologues (Angert et al., 2019). However, this may be a too crude simplification of the diffusion processes taking place, as COS diffusion not only involves gaseous diffusion but also gas-liquid interface diffusion from the intercellular space to the mesophyll cell (Fig. 1) (Stimler et al., 2010; Berry et al., 2013). When including stomatal diffusion, leaf BL diffusion, and gas–liquid phase diffusion in the mesophyll cell, Davidson et al. (2022) calculated an overall diffusion fractionation value of = 1.6 ± 0.1 ‰ for 34S.
Still, it is not known whether the COS mole fraction in the mesophyll always reaches values close to zero, especially for C4 species, in which CA activity is low (Stimler et al., 2011). In the case of non-zero , enzymatic fractionation during COS fixation by CA (h) will affect the observed 34Δ (Eq. 4). Davidson et al. (2022) determined an enzymatic fractionation for 34S, h, of 15 ± 2 ‰ from experiments in which the plants were exposed to high CO2 (2900 ± 90 pmol mol−1) and COS (3.4 ± 0.1 µmol mol−1) mole fractions.
In another set of experiments by Davidson et al. (2022), this time using ambient CO2 (500 ± 80 pmol mol−1) and COS (0.53 ± 0.02 nmol mol−1) mole fractions, their observed 34Δ values were 1.6 ± 0.1 ‰ for C3 and 5.4 ± 0.5 ‰ for C4 species. These authors attributed the higher discrimination value for C4 species to the lower CA activity, which could lead to a non-zero COS mole fraction at th esite of CA and discrimination by this enzyme.
As the methodology for isotope ratio measurements of COS has only recently been established (Hattori et al., 2015; Angert et al., 2019; Baartman et al., 2022), the only studies that have determine COS isotope discrimination during plant uptake are by Davidson et al. (2021, 2022). These studies used a closed-chamber approach and, as mole fractions of CO2, COS and H2O change during experiments with closed chambers, there is a potential risk that feedback processes on stomatal conductance and other metabolic processes may have contributed to the observed discrimination. Hence, these results may not reflect typical leaf conditions. With flow-through chambers, conditions can be monitored online and kept stable throughout the entire experiment, also allowing for easier repetition of the experiments.
In this work, we introduce a new methodoly for measuring COS isotope discrimination in plants, using a flow-through plant chamber, which was closely monitored to maintain stable conditions. We demonstrate the advantages of simultaneously measuring COS and CO2 fluxes, and isotope discrimination of COS uptake against CO34S and CO2 uptake against 13CO2 and C12O18O (34Δ, 13Δ, and 18Δ) in C3 and C4 species and at a range of PAR. Photosynthetic discrimination against 13CO2 (13Δ) can be used to explain variations in photosynthesis rates and to estimate stomatal conductance (Farquhar and Richards, 1984; Farquhar, 1989; Cernusak et al., 2013). During photosynthesis, CO2 can exchange oxygen atoms with the leaf water, catalyzed by CA, and partly diffuse back to the atmosphere with changed isotopic composition. The resulting apparent discrimination against 12C16O18O (18Δ) during photosynthesis can serve as a proxy for gross biosphere-atmosphere CO2 exchange (Francey and Tans, 1987; Yakir, 1998; Adnew et al., 2020). Both 13Δ and 18Δ display a typical and distinct range of values for C3 and C4 species and depend on environmental factors (Farquhar et al., 1982; Stimler et al., 2011; Adnew et al., 2020). Therefore, the joint COS and CO2 measurements allowed investigating the relationship between COS and CO2 isotope effects, where the CO2 data provide additional information for validating the experimental setup and the plant behavior.
2.1 Plant materials and growing conditions
Experiments were conducted with one C3 plant, sunflower (Helianthus annuus “Sunsation”), and an assemblage of stems and leaves from the C4 plant papyrus (Cyperus papyrus). A sunflower in the flowering stage was obtained at a local garden center. A large papyrus shrub was available and grown at the tropical greenhouse at Wageningen Univesity and Research (WUR). Three large stems with leaves were carefully cut from this larger shrub, using a sharp razor, and transported in water to the lab, where they were kept in water throughout the chamber measurements. The sunflower plant and papyrus cuttings were kept under a lamp with a solar-like spectrum (ca. 400 µmol m−2 s−1 PAR, LED growth light SMD2835, Ortho, China) before experiments started and watered sufficiently before and during the measurements. Leaf surface area of sunflower and papyrus were measured after the experiments using a LI-3100 (Li-Cor, Lincoln, NE, USA). This instrument was calibrated using a metal disk with a surface area of exactly 50.00 cm2.
2.2 Whole plant gas exchange system
Gas exchange experiments were conducted at Wageningen University and Research (WUR) using a custom-built whole plant chamber that was developed for estimating net photosynthetic CO2 assimilation and transpiration (Lazzarin et al., 2025). The main component is a flow-through plant chamber, which can be fed with different gas mixtures. Two analyzers were used to measure in- and outgoing mole fractions and we used an add-on module for discrete air samples (Fig. 2).
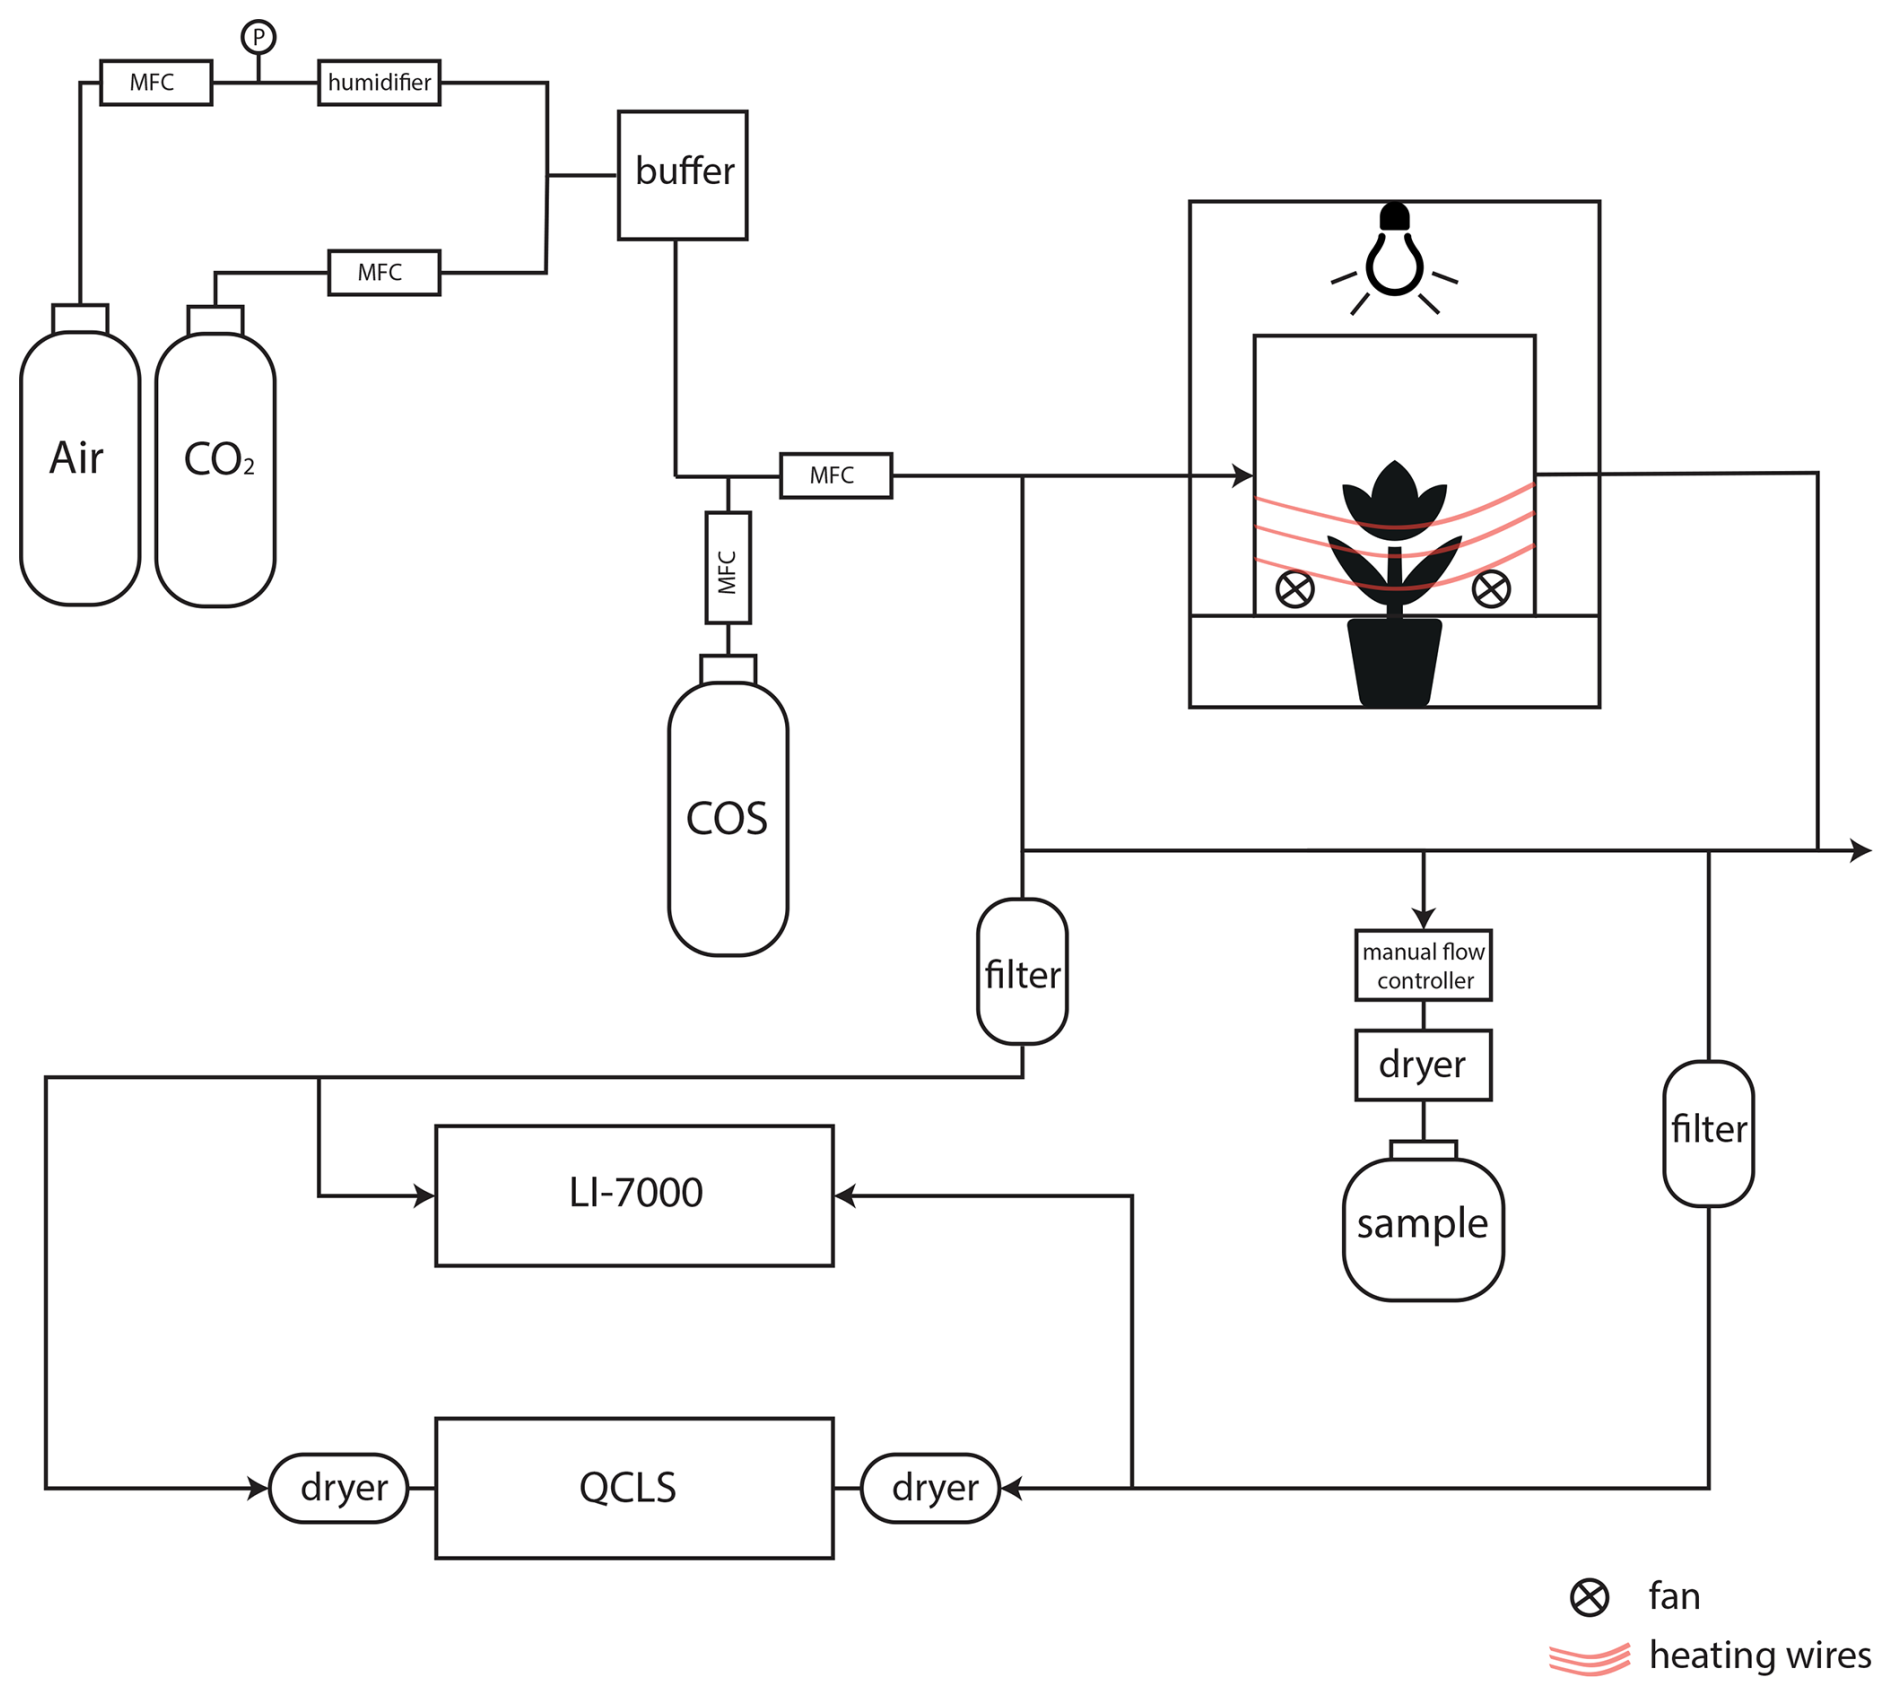
Figure 2Schematic overview of the setup to determine CO2 and COS photosynthetic isotope discrimination by coupling a custom-built plant chamber to a LI-7000, a QCLS and a system to fill up gas canisters for posterior isotope analysis with IRMS. MFC: mass flow controller; QCLS: Quantum Cascade Laser Spectrometer. CO2 and COS were mixed into humidified synthetic air and introduced into the plant chamber. The in- and outflowing airstreams of the chamber (airin and airout) were measured by both the LI-7000 and QCLS instruments. Air was dried using Mg(ClO4)2 before the QCLS and when taking a sample for isotope analysis.
The plant chamber was made of clear plexiglass lined with a FEP foil (Holscot Europe, Breda NL) to prevent water from sticking to the chamber walls. The chamber had a diameter of 29 cm, and the height was either 18 or 27 cm, depending on the plant size. To ensure proper air mixing and leaf boundary layer reduction, three SanAce40W ventilators (type 9WL0424P3J001, Sanyo120 Denki, Philippines) were placed in a circular pattern at the bottom of the chamber. Fan speed was controlled with a SanAce PWM controller. The entire chamber was placed inside a 63×63 cm2 enclosure with white reflective walls that ensured uniform horizontal light distribution. Air temperature inside the plant chamber was measured with a LM35 temperature sensor (Texas Instruments). Temperature of the plant chamber was controlled using heating cables positioned around the outside of the plant chamber (in combination with a PID controller) and two 12 V computer fans were used to provide airflow and cooling around the plant chamber. Light was provided by LED lighting mounted above the chamber with a spectrum resembling sunlight (artificial sunlight research modules generation 2, Specialty Lighting Holland B. V., Breda, the Netherlands). PAR was quantified during the experiments just above the chamber using a handheld PAR sensor (LI-190, Li-Cor, Lincoln, NE, USA). Plants were placed in the chamber, and the bottom two plexiglass panels were closed around the stem of the plant and sealed it with Terostat RB VII, ensuring that the plant was isolated from the soil or water (in the case of the papyrus), and making sure the chamber was leak-free. Two pictures of the plant chamber are shown in Appendix A, Fig. A2.
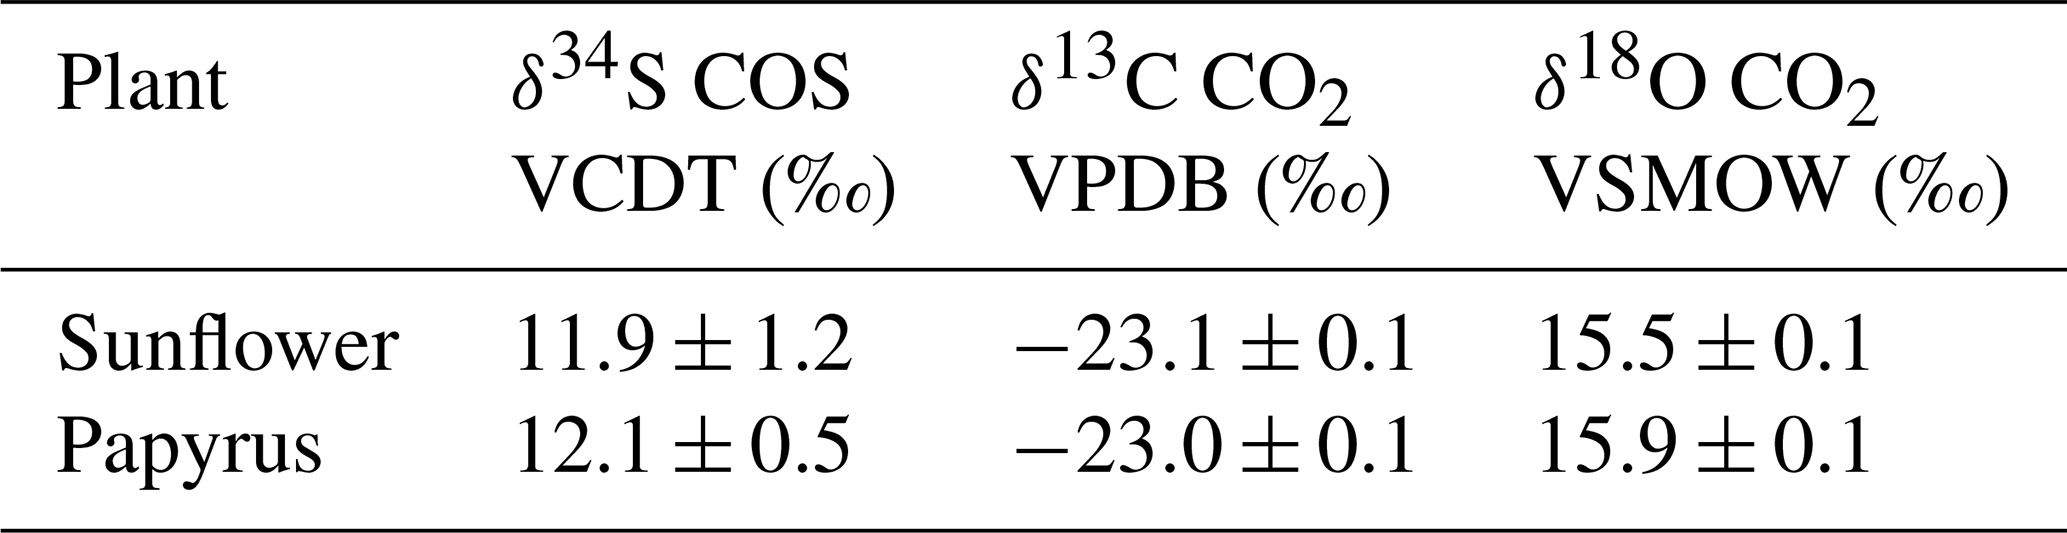
Synthetic air humidified with a temperature-controlled water bubbler (dew point temperature 17 °C) was mixed with pure CO2 using mass flow controllers (MFC), to reach the desired CO2 and H2O mole fractions. Subsequently, COS from a cylinder with 700 nmol mol−1 COS in synthetic “zero” air was supplied to the mix using a MFC to establish the target COS mole fractions of approximately 2 nmol mol−1. The flow rate of the total (combined) air mixture into the chamber was controlled by a MFC to around 8 L min−1, depending on the experiment conducted. The COS and CO2 isotopic composition of the ingoing air was determined using the methods described in 2.5 and the values are provided in Table 1.
Table 1Isotope composition of the inlet gas (airin) supplying the plant chamber determined from samples collected in canisters and analyzed with IRMS. Values are reported on the Vienna Canyon Diablo Troilite (VCDT) (δ34S), the Vienna Pee Dee Belemnite (VPDB) (δ13C) and Vienna Standard Mean Ocean Water (VSMOW) (δ18O) scales.
The CO2 and H2O mole fractions of both the in-going air (airin, reference line) and the outgoing air (airout, sample line) of the chamber were analyzed with a LI-7000 infrared gas analyzer (LI-COR Biosciences, Lincoln, Nebraska, USA). To measure the COS mole fractions of airin and airout, we used a quantum cascade laser spectrometer (QCLS, TILDAS, Aerodyne Inc, USA) from the Center for Isotope Research, Rijksuniversiteit Groningen (CIO-RUG). This instrument also measured CO2 mole fractions, which were validated with the readings of the LI-7000 and used for further analyses. QCLS used a 50 mL min−1 flow and was manually switched between airin, airout and calibration cylinders. The air entering the QCLS was dried with magnesium perchlorate (Mg(ClO4)2) dryers. Calibration of the QCLS was performed at least twice a day using the working standards from the CIO-RUG, which are calibrated against NOAA-certified cylinders. Possible instrumental baseline drift during the experiments was corrected by measuring pure nitrogen (N2) multiple times during the experiment. For a detailed description of the QCLS instrument and calibration procedures, see Kooijmans et al. (2017). Blank measurements with an empty chamber were performed before a plant was installed in the chamber to ensure that the COS, CO2 and H2O mole fractions of airin and airout were equal.
Samples for isotope analysis of COS and CO2 were taken in 6 L evacuated Silonite canisters (ENTECH, type: PN: 29-10622) that were then filled to ambient pressure. Sampling was done through a Mg(ClO4)2 dryer and a filter, and the flow into the canisters was regulated using a manual flow controller. The dryer was changed after every two samples. At the start of each experiment, two canister samples were collected from airin, and their average mole fraction and isotope values (Table 1) were used to characterize the incoming air. At each new light setting, and after photosynthetic gas exchange was stable (as monitored with the QCLS and with the LI-7000), two samples were taken from airout. For PAR > 0, these two samples were treated as duplicates and their average mole fraction and isotope values were used for subsequent analyses. In the dark, the plant was still gradually adjusting over time (e.g. closing its stomata) and therefore, these two airout samples were not treated as duplicates and their individual data points are reported.
2.3 Experimental conditions
For all experiments, the chamber was supplied with air mixtures with [COS] = 2300–2400 pmol mol−1, and [CO2] = 430–440 µmol mol−1 at a flow rate of 8.1 L min−1, giving an air residence time of around 1.5–2 min. Temperature in the chamber was 24.6–25.0 °C in sunflower experiments and 25.7–25.9 °C in papyrus experiments, chosen to obtain sufficient COS uptake flux (for isotope analysis) while avoiding condensation of water vapor in the system. Light intensity was sequentially set to PAR = 400, 600, 200, and 0 µmol m−2 s−1, allowing time after each light setting for plant adjustment, uptake flux stabilization and subsequent isotope sampling. Measurements at PAR 600 µmol m−2 s−1 were not performed with the papyrus due to time constrains. For the dark measurements, chamber light was switched off and the chamber was covered with a blanket.
2.4 Uptake flux calculations
Both CO2 and COS net uptake fluxes (As in pmol m−2 s−1 and AC in µmol m−2 s−1) were calculated using Eq. (5) (which shows the calculation for COS):
where ue is the molar flow of air entering the chamber (mol air s−1), S is the leaf area (m2), and we and wa (mol of H2O mol air−1) are the mole fractions of water vapor in airin and airout, and (pmol COS mol air−1) are the [COS] in airin and airout, respectively.
The uncertainties of the uptake fluxes were calculated by propagating the uncertainties of the in- and out-going air mole fraction measurements. In the case of the mole fraction measurements by the QCLS, the 1σ uncertainties were obtained measuring airin or airout during 15 min.
As a consistency check, we also calculated the uptake fluxes using the CO2 and COS mole fractions determined with the mass spectrometer in the canister samples. Comparison of fluxes determined by both methods lead to the exclusion of two samples because of suspected contamination (see Fig. A1 in Appendix A). QCLS COS and CO2 fluxes, excluding these two samples, were used in subsequent analyses.
From the CO2 fluxes, the water vapor fluxes obtained from the LI-7000 analyzer and the leaf temperature, we calculated using the gas exchange calculations by Farquhar et al. (1980) (details in Appendix B). The leaf internal COS mole fraction, , was calculated using Eqs. (6) and (7), including a ternary correction:
where is the total leaf conductance to COS from ambient air to the internal leaf space ( (Eq. 7).
Here, is the boundary layer conductance to water, which was assumed infinite, as the chamber fans created well-mixed air. The coefficients 1.94 and 1.56 (mol H2O mol COS−1) are the ratios of diffusivities of COS to water vapor in air and in the boundary layer, respectively (Fuller et al., 1966; Farquhar and Lloyd, 1993). is the stomatal conductance to water vapor, for which the calculations can be found in the Appendix, Eqs. (B3) through (B5). Equations (6) and (7) assume that the leaf internal spaces are saturated with water vapor. This assumption has been questioned, particularly under high avaporative demands (Cernusak et al., 2018, 2024), which were not the conditions during our experiments. Further details on gas exchange calculations are presented in Appendix B.
From the CO34S isotope discrimination values (34Δ, Eq. 4), we estimated the COS mole fraction in the mesophyll cell (, using Eq. (8).
where the diffusion fractionation components of were split into fractionation occurring during boundary layer diffusion (ab=3.5 ‰), stomatal diffusion (as=5.2 ‰) and mesophyll diffusion (am=0.5 ‰). is the COS mole fraction at the leaf surface, calculated using Eq. (B14), assuming infinite , and h (= 15 ‰) is the fractionation occurring during COS hydrolysis by CA (Eq. 4). The values for all these fractionation factors are from Davidson et al. (2022).
Using a big leaf approach, we applied Eqs. (6) to (8) to entire plants excluding roots (sunflower) or several leaves (papyrus). This approach assumes that the entire canopy behaves as a single unshaded leaf. In reality, gradients in light or temperature occur within the canopy, but those should have been minor in our experiment that used small plants in a well-mixed chamber. Additionally, given the precision at which the COS isotope exchange can currently be determined, we deemed it unnecessary to go beyond the big leaf approach.
2.5 Isotope ratio measurements
COS and CO2 isotope ratios in the canister samples were determined using isotope ratio mass spectrometry (IRMS) at Utrecht University. Before measurement, the sample canisters' pressure was increased by adding COS-free zero air, as the extraction system needs overpressure. The δ34S in COS was determined according to the methods described in Baartman et al. (2022) but using a new Delta V Plus mass spectrometer, which was specifically customized to measure COS isotope ratios with improved performance (Thermo Fisher Scientific, USA). The continuous-flow GC-IRMS system measures the S+ fragment ions generated in the IRMS ion source by the electron-impact fragmentation of COS. The isotope ratios were calculated relative to our laboratory standard, which is a 50 L cylinder, filled with outside air and spiked with COS to approximately 800 pmol mol−1 COS. This lab standard was calibrated against the Vienna Canyon Diablo Troilite (VCDT) international sulfur isotope standard (see Baartman et al., 2022 for a detailed description of the COS isotope measurement system). The typical reproducibility error for δ34S in COS was 0.4 ‰ and the typical uncertainty for a single sample measurement with ambient COS mole fraction was 0.9 ‰ (Baartman et al., 2022).
The δ13C and δ18O in CO2 were measured using a separate continuous flow IRMS system, initially developed for measuring CO isotopologues (Pathirana et al., 2015), and later modified to measure CO2 isotopologues. A laboratory reference air cylinder with known isotopic composition was used for calibration (Brenninkmeijer, 1993). Typical precision was better than 0.2 ‰ for both δ13C and δ18O. Values are reported on the Vienna Pee Dee Belemnite (VPDB) (δ13C) and Vienna Standard Mean Ocean Water (VSMOW) (δ18O) scales.
2.6 Isotope discrimination calculations
Observed isotope discrimination (‰) was calculated using Eqs. (9) and (10) (Evans et al., 1986):
where δe and δa are the isotope compositions of the gas entering and leaving the chamber, respectively, for the gas of interest (δ13C, δ18O in CO2, or δ34S in COS). ξ is calculated as:
where Ce and Ca are the mole fractions (CO2 or COS), entering and leaving the chamber, respectively. The errors on the measured mole fractions and isotope ratios were propagated to the isotope discrimination values (Δ); details are provided in the accompanying data set (Baartman et al., 2025).
3.1 COS and CO2 uptake fluxes
In experiments with both plant species there was a net uptake of COS under all light conditions, including dark (Fig. 3b). Mean COS uptake fluxes in the light were 73.3 ± 1.5 and 107.3 ± 1.5 pmol m−2 s−1 for sunflower and papyrus, respectively, and uptake fluxes did not vary strongly for different light conditions. Note that samples in the dark were taken sequentially, when plant performace was still adjusting.
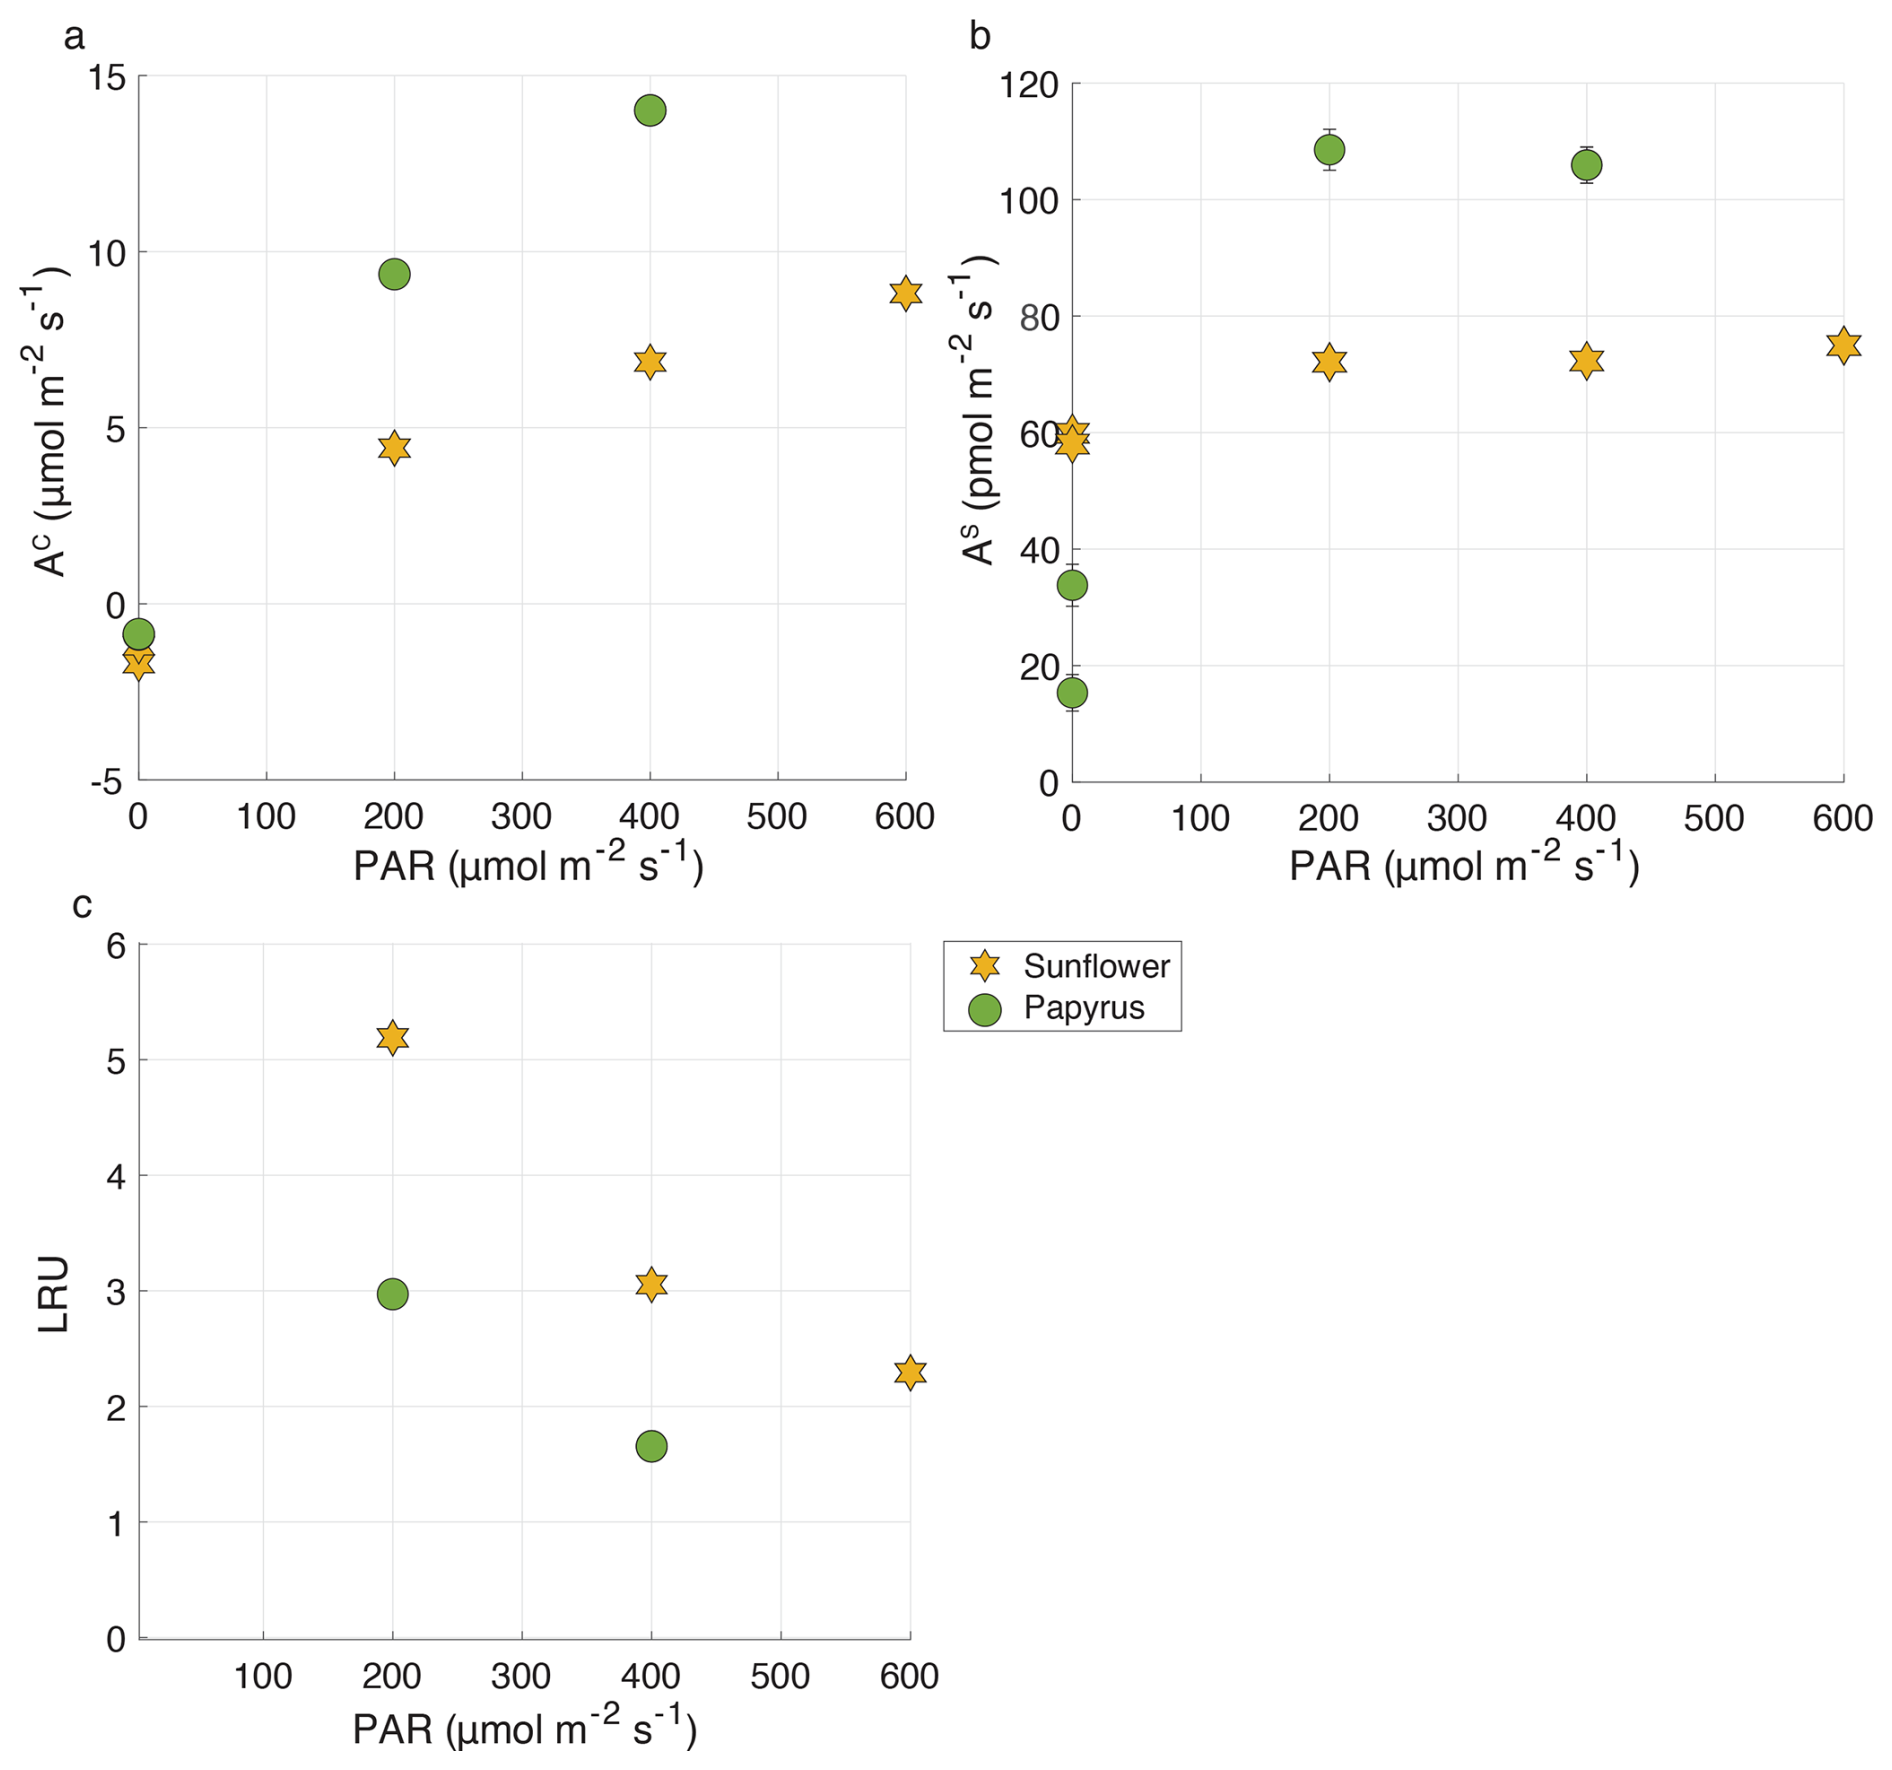
Figure 3(a) AC (CO2 uptake flux, in µmol m−2 s−1), (b) AS (COS uptake flux, in pmol m−2 s−1) and (c) LRU versus PAR (µmol m−2 s−1), for sunflower (orange stars) and papyrus (green circles). Flux values for PAR > 0 are means ± 1 standard error (SE) (n=2), where 1 SE was obtained using error propagation (details provided in the accompanying data set of Baartman et al., 2025), flux values for PAR = 0 reflect individual measurements. Only positive LRU values are shown. LRU was negative for PAR = 0 (see Table 2). Errors are only displayed when larger than the symbols.
Previously reported COS uptake fluxes at the ecosystem scale usually range between 30 and 60 pmol m−2 s−1 (Cho et al., 2023; Kooijmans et al., 2017; Commane et al., 2015; Billesbach et al., 2014), with some higher reported uptake fluxes around 80 to 100 pmol m−2 s−1 (Asaf et al., 2013; Spielmann et al., 2023). Berkelhammer et al. (2020) reported maximum mid-day ecosystem-scale COS uptake fluxes of up to 100 pmol m−2 s−1 for a maize field (C4) during July. Those values were higher than the mid-day fluxes obtained from a prairie (C3 and C4 species), being around 50 pmol m−2 s−1 (July–August). However, Stimler et al. (2011) measured COS fluxes ranging between around 15 to 30 pmol m−2 s−1 for the C4 species maize, sorghum and amaranthus, under a light intensity of 500 µmol m−2 s−1, in leaf cuvette experiments. Thus, our measured COS uptake fluxes are at the high end of the spectrum.
Table 2Photosynthetic discrimination (mean ± 1 SE, n=2), COS and CO2 uptake fluxes (AS and AC), LRU, stomatal conducance to water vapor (gsw), total conductance to COS (), leaf internal vs. ambient mole fraction ratios for COS ( and CO2 (, mesophyll vs. ambient COS mole fraction ( for sunflower and papyrus, for each PAR level. The uncertainties were calculated as the standard error of the mean (SEM) and the student's t-distribution, with 60 % confidence interval and 1 () degree of freedom. Uncertainties where n=1 are the propagated measurement uncertainties. Values without stated uncertainty are single sample measurements (in the case of isotope discrimination values) or have an uncertainty smaller than 0.01 (in the case of and ). AS at PAR = 0 for papyrus was too small for calculating 34Δ. The samples taken in the dark were not seen as duplicates as the plant was still adjusting to the dark conditions between sampling, and two values for PAR = 0 are given for each species.
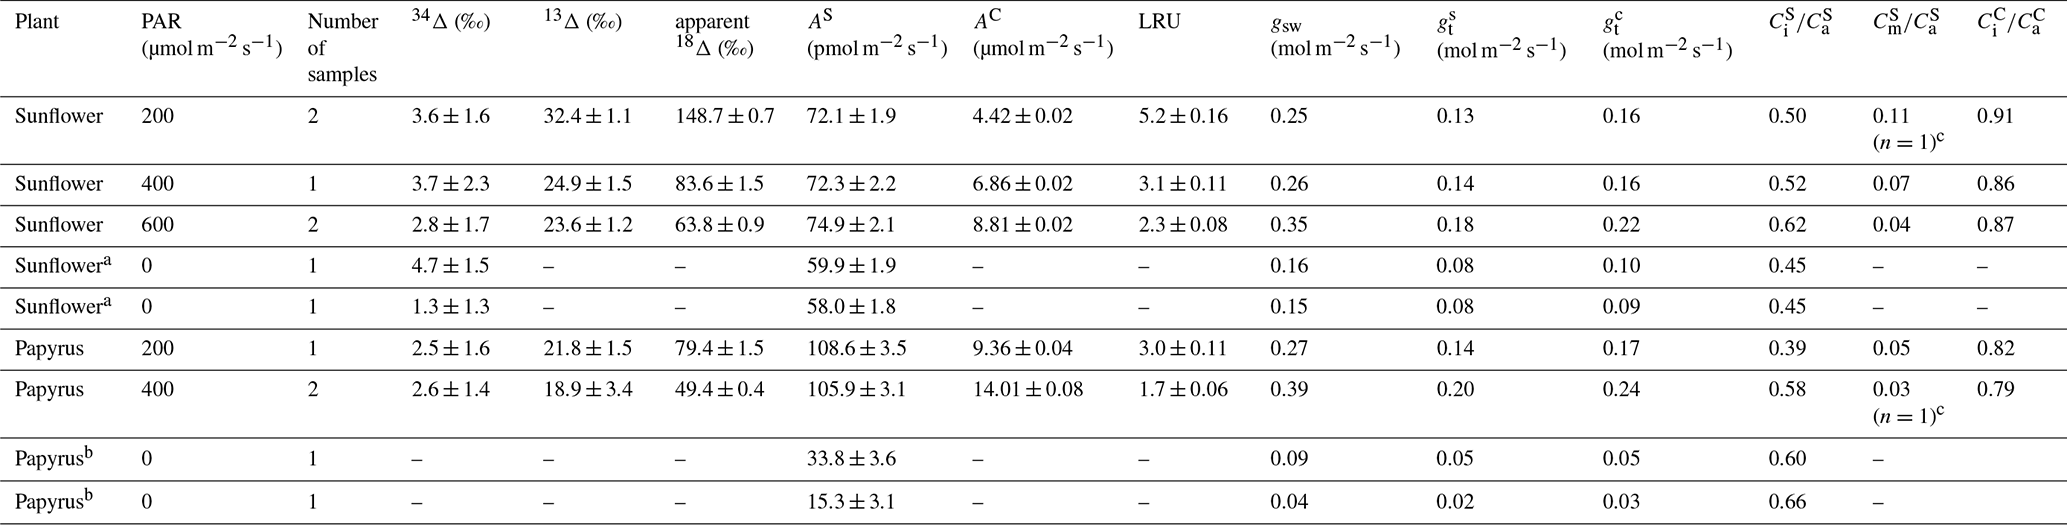
a There was no uptake of CO2 at PAR = 0. b There was no uptake of CO2 at PAR = 0 and not sufficient COS uptake to calculate 34Δ. c only obtained from one sample as the calulations for the other sample yielded negative (unrealistic) values for .
Stomatal conductance to water vapor in sunflower ranged from 0.25 to 0.35 mol m−2 s−1 under light conditions and decreased to 0.15 mol m−2 s−1 in the dark (Table 2). In papyrus, stomatal conductance was slightly higher in the light, ranging between 0.27 and 0.39 mol m−2 s−1. In the dark, stomatal conductance for papyrus dropped substantially to 0.09 mol m−2 s−1 during the first sampling and further to 0.04 mol m−2 s−1 during the second. This is reflected in the lower COS assimilation for papyrus in the dark compared to sunflower (see Fig. 3 and Table 2).
Overall, our observed stomatal conductance values are at the upper end of the previously reported ranges. For example, Stimler et al. (2011) reported gs values of up to approximately 0.17 mol m−2 s−1, while Berkelhammer et al. (2020) found maximum gs values of around 0.22 mol m−2 s−1 for maize (C4) and 0.12 for a prairie field (C3 and C4). Miner and Bauerle (2017) did find unusually high stomatal conductance values for sunflowers of up to 1.2, with a high inter-plant variability and Howard and Donovan (2007) reported nighttime gs values of 0.023–0.225 for well-watered sunflowers. These elevated gs values in our experiments likely explain the relatively high and stable COS fluxes for PAR > 0. Moreover, the non-zero gs values under PAR = 0 support the continued COS uptake in the dark, particularly for sunflower (Fig. 3b). As hydrolysis of COS, catalyzed by CA, is a light-independent reaction, COS assimilation can continue as long as the stomata are open (Protoschill-Krebs et al., 1996).
The small increase in values (Table 2) with increasing PAR also suggests that stomata were sufficiently open to sustain stable COS uptake fluxes, even in low-light conditions. In plant experiments conducted with elevated COS mole fractions (1.5 nmol mol−1), Stimler et al. (2010) reported similar values around 0.6, corresponding to COS uptake fluxes around 100 pmol m−2 s−1 and gs of 0.5 mol m−2 s−1. Thus, the higher than usual and potentially the higher stomatal conducance in our experiments may be attributable to the elevated COS mole fractions in our chamber. These elevated COS mole fractions were necessary for obtaining precise measurements of COS isotope discrimination.
Both sunflower and papyrus respired CO2 in the dark and photosynthesyzed in the light, at a net rate that increased with PAR (Fig. 3a). Mean CO2 uptake fluxes in light conditions were 6.7 ± 1.7 µmol m−2 s−1 for sunflower and 11.7 ± 2.2 µmol m−2 s−1 for papyrus (Fig. 3a). These photosynthesis rates match that of sunflowers of Tezara et al. (2008) under their low-light condition experiments (in the least drought-exposed conditions).
At all light intensities (PAR > 0), CO2 uptake rates were larger in papyrus than in sunflower, matching expectations for C4 vs. C3 photosynthesis (Farquhar and Lloyd, 1993). Our measurements can be classified as relatively low-light, because although the PAR measured at the top of the chamber was 400 µmol m−2 s−1 at the highest setting for the C4 experiments, there was likely light attenuation across the plant canopy. The photosynthesis rates for papyrus are comparable with previous measurements, conducted under low-light conditions. Ubierna et al. (2013) measured CO2 assimilation rates of around 10 µmol m−2 s−1 at PAR = 500 µmol m−2 s−1 in three C4 species, Zea mays, Miscanthus × giganteus and Flaveria bidentis, under varying light conditions between 0 and 2000 µmol m−2 s−1. Their results are similar to our measured CO2 uptake fluxes of between 9.4 µmol m−2 s−1 (200 PAR) and 14.0 µmol m−2 s−1 (400 PAR).
At PAR = 600 µmol m−2 s−1, LRU (Eq. 1) was 2.3 ± 0.08 for sunflower and at PAR = 400 µmol m−2 s−1, LRU values were 3.1 ± 0.11 and 1.7 ± 0.06 for sunflower and papyrus, respectively (see Table 2 and Fig. 3). As PAR decreased to 200 µmol m−2 s−1, LRU increased to 5.2 ± 0.16 for sunflower and 3.0 ± 0.11 for papyrus. The increase in LRU at low light was due to a decrease in CO2 uptake fluxes while the COS uptake remained roughly constant. In the dark, LRU values were negative, up to −16.0 for sunflower, as COS uptake by the plant continued while CO2 was being respired. Our LRU values are higher than those found by Stimler et al. (2011) and higher than the usually reported median LRU values of 1.7 (n=53) for C3 species and 1.2 (n=4) for C4 (Whelan et al., 2018), which may be due to our relatively low-light experiments. Still, previously reported LRU values display a wide range of values of between 0.7 and 6.2, and Stimler et al. (2011) also reported a higher LRU for C4 compared to C3. Furthermore, recent research has shown that LRU can differ across species and vary with environmental conditions, especially light availability and VPD (Kooijmans et al., 2019; Spielmann et al., 2023; Sun et al., 2022). The exact mechanism for this varying LRU is still not completely understood (Whelan et al., 2018; Wohlfahrt et al., 2022).
Our slightly higher LRU values could also be due to the higher than ambient COS mole fractions (of around 2 nmol mol−1) that the plants were exposed to during our experiments. Davidson et al. (2022) reported LRU values or 0.7 and 1.7 for C3 and C4, respectively for experiment with ambient COS mole fractions, and LRU values of 2.4 and 1.0 for C3 and C4 for plants exposed to 2900 µmol mol−1 CO2 and 3.4 nmol mol−1 COS (see Table C1 in Appendix C). Thus, exposure to higher COS mole fractions could have influenced LRU, however, in the experiments by Davidson et al. (2022), not only the COS but also the elevated CO2 mole fractions could have affected the LRU (Sun et al., 2022).
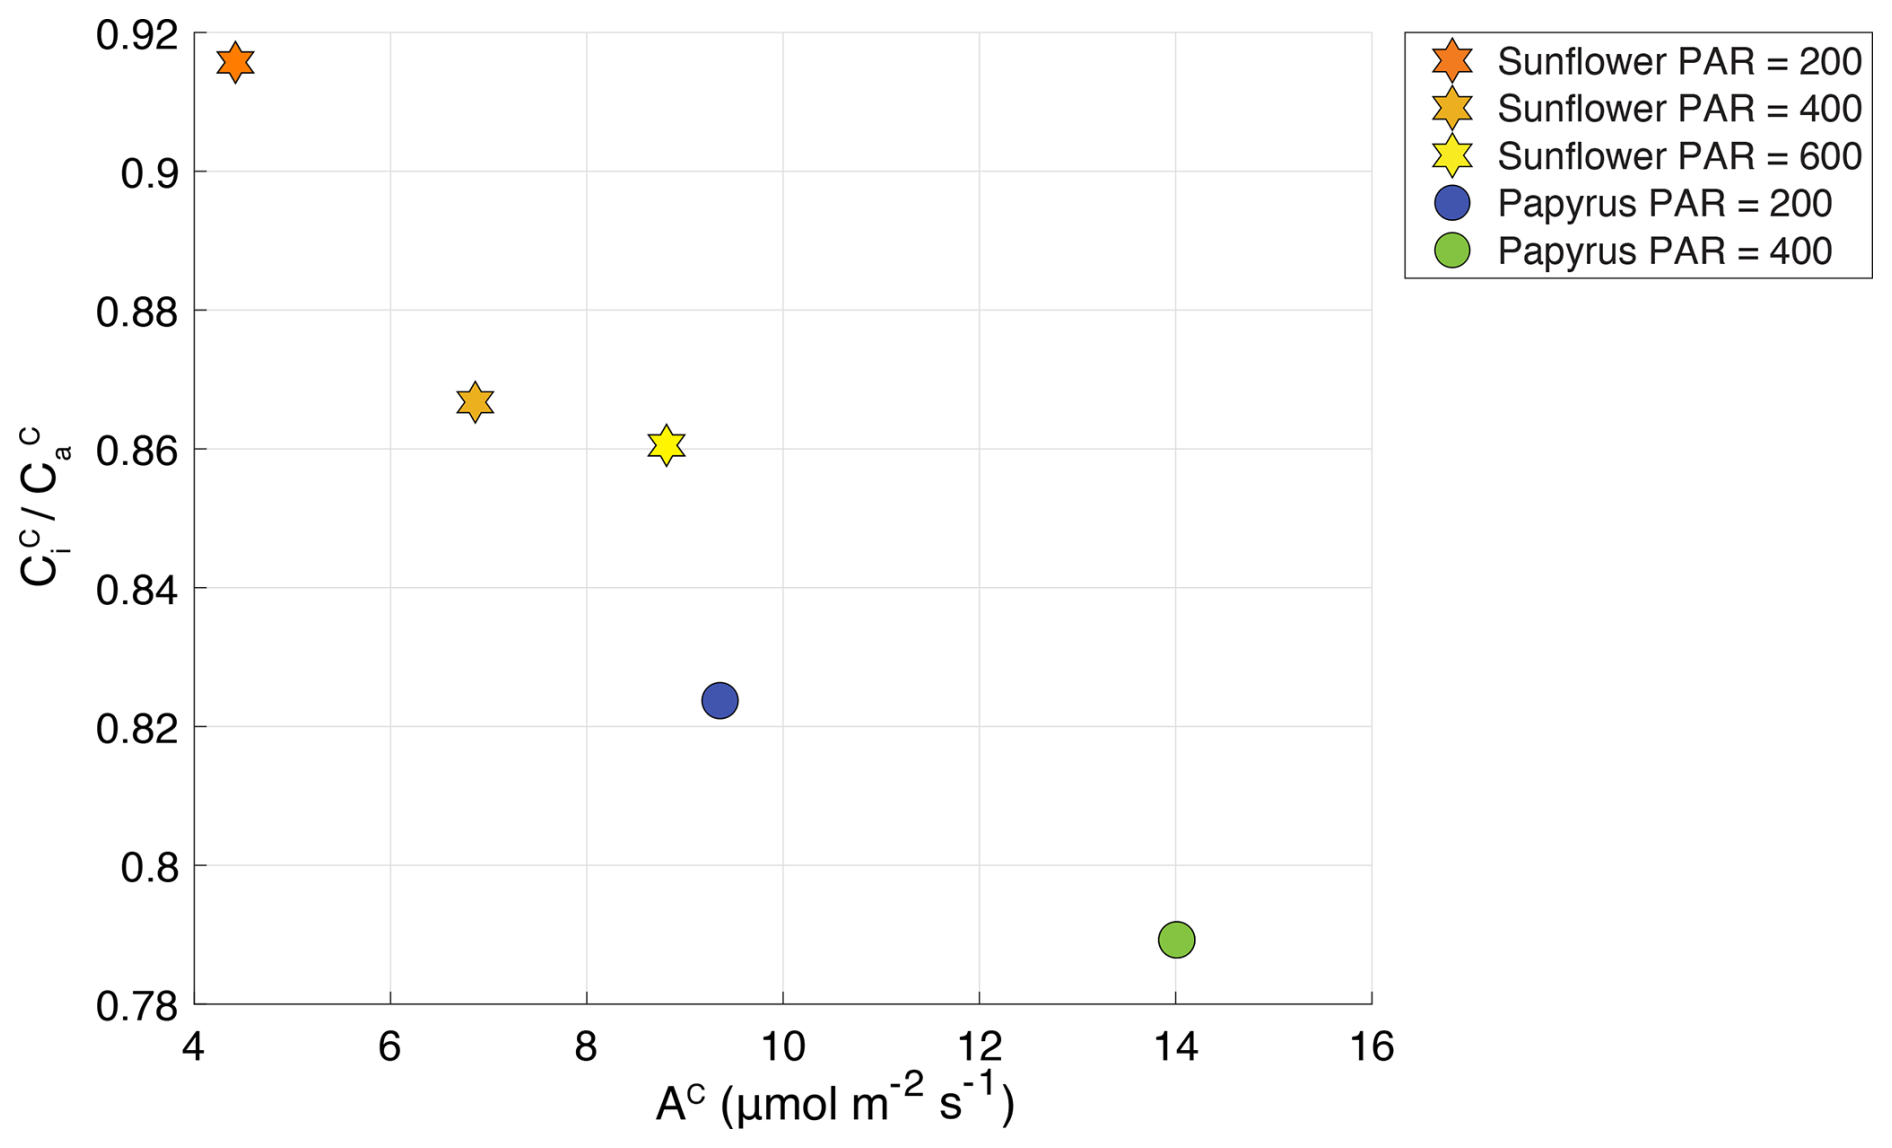
Figure 4 plotted against AC (CO2 uptake flux in µmol m−2 s−1), for sunflower (stars) and papyrus (circles). Colors indicate PAR levels (µmol m−2 s−1). Data for PAR = 0 are not included because the plants were respiring during dark conditions.
Figure 4 shows the CO2 uptake flux (µmol m−2 s−1) plotted against ratio of the CO2 mole fractions in the intercellular space versus the ambient (Table 2) (. The ratio increases with decreasing CO2 uptake flux for both species and the differences in CO2 uptake flux between C3 and C4 plants are consistent with the results presented by Stimler et al. (2011). Our measured for sunflower compares well with previous values for sunflower of 0.8 found by Tezara et al. (2008). The for papyrus is high for a C4 species, for which values usually range around 0.4, but could again be explained by the low-light conditions, as previously observed by Ubierna et al. (2013). The higher than usual could also be explained by the fact that we measured entire plants, of which some leaves were partly shaded.
3.2 CO34S discrimination
Table 2 shows the isotopic discrimination for COS (34Δ) and CO2 (13Δ, 18Δ), and accompanying data for the different light treatments. In contrast to the CO2 isotope discrimination (Sect. 3.3), 34Δ did not show a trend with COS uptake flux nor with PAR (Fig. 5), (Fig. 6), or a difference between the species. The average 34Δ values in light conditions (PAR > 0) were 3.4 ± 1.0 (SEM) ‰ for sunflower and 2.6 ± 1.0 (SEM) ‰ for papyrus (see Table 2). For sunflower in dark conditions, we found a 34Δ of 4.7 ± 1.5 ‰ for the first sample and 1.3 ± 1.6 ‰ for the second sample. The COS uptake flux for papyrus in dark conditions decreased drastically, to the point that 34Δ could no longer be estimated with confidence (see Fig. 3).
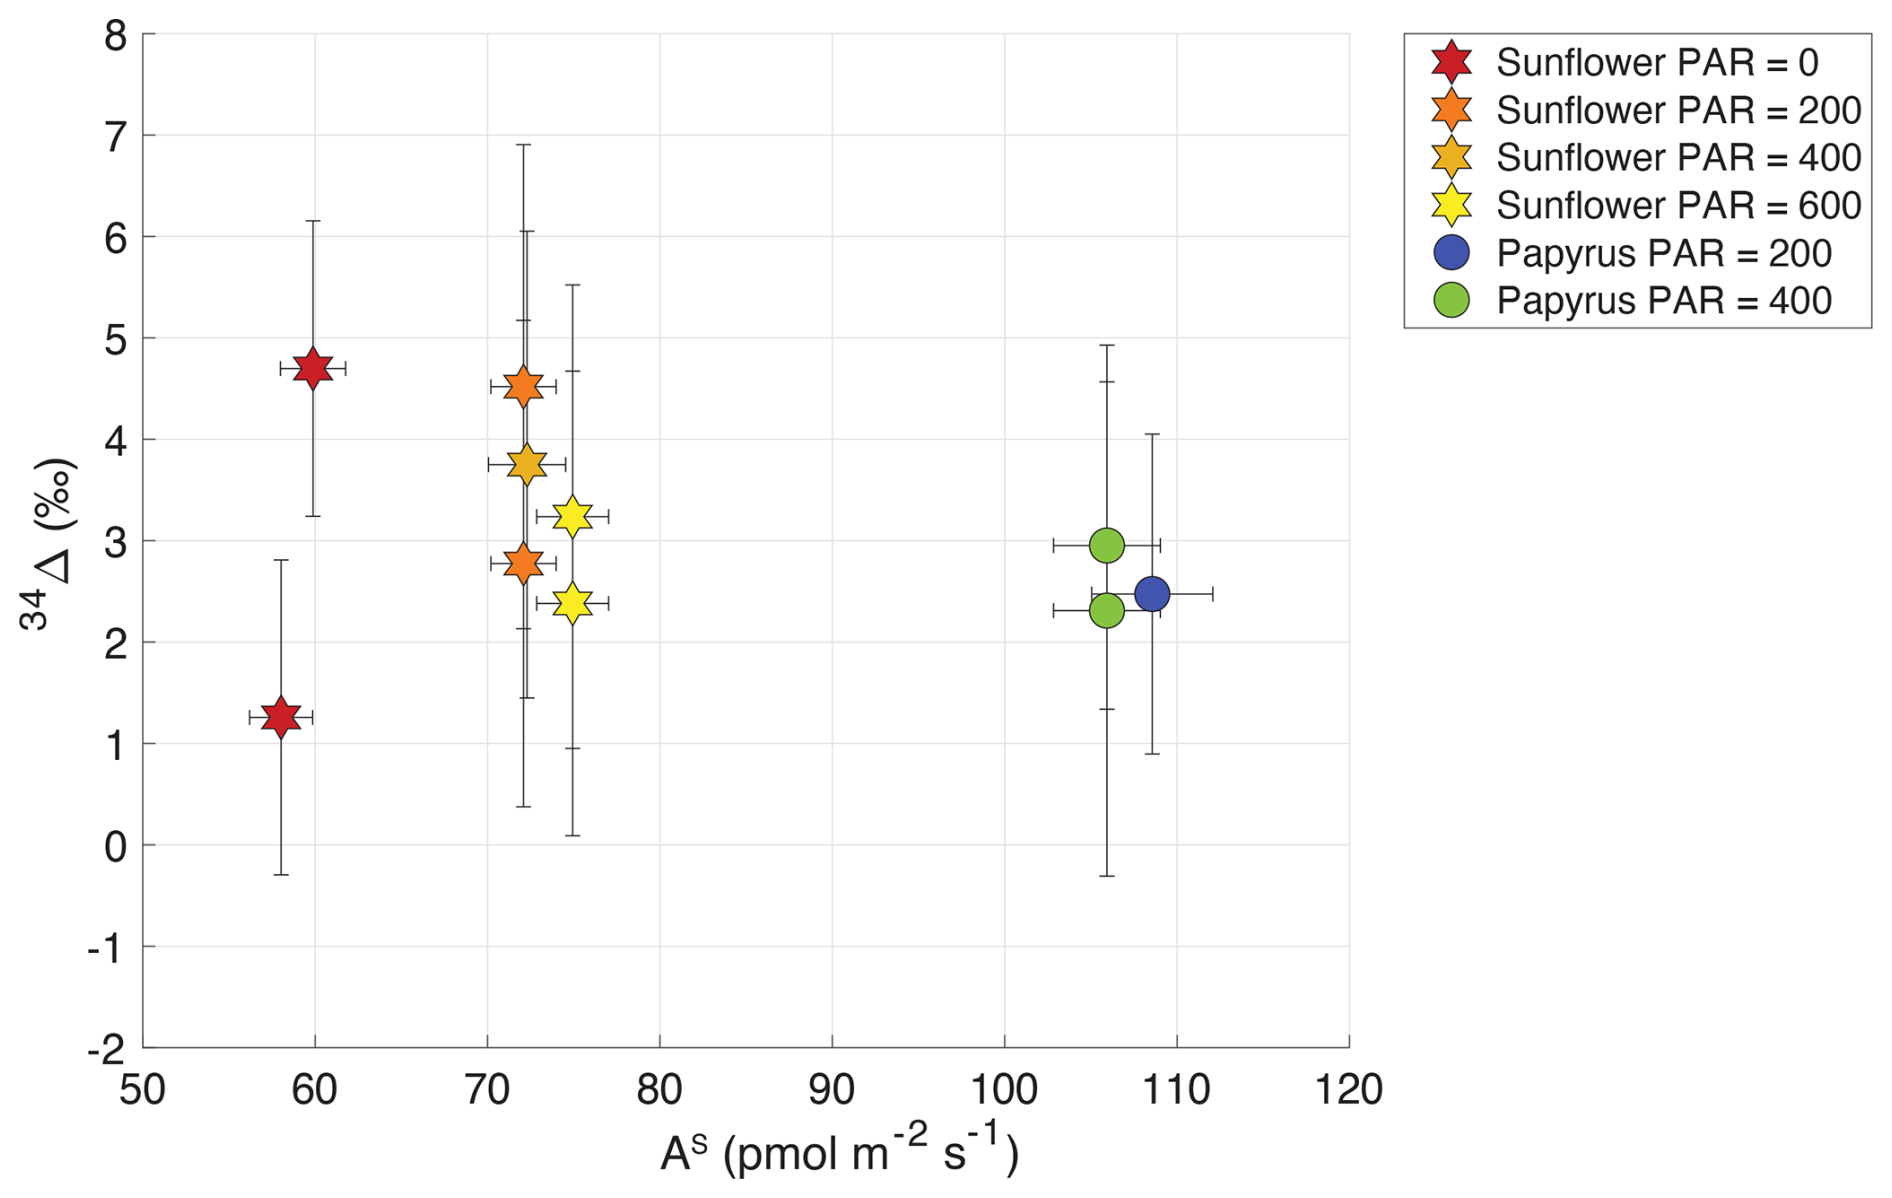
Figure 5Plant COS isotope discrimination (34Δ) plotted against AS (COS uptake flux in pmol m−2 s−1) for sunflower (stars) and papyrus (circles). Colors indicate PAR levels (µmol m−2 s−1). Samples for PAR = 0 are only shown for sunflower as As for papyrus (PAR = 0) was too low to calculate 34Δ with meaningful precision.
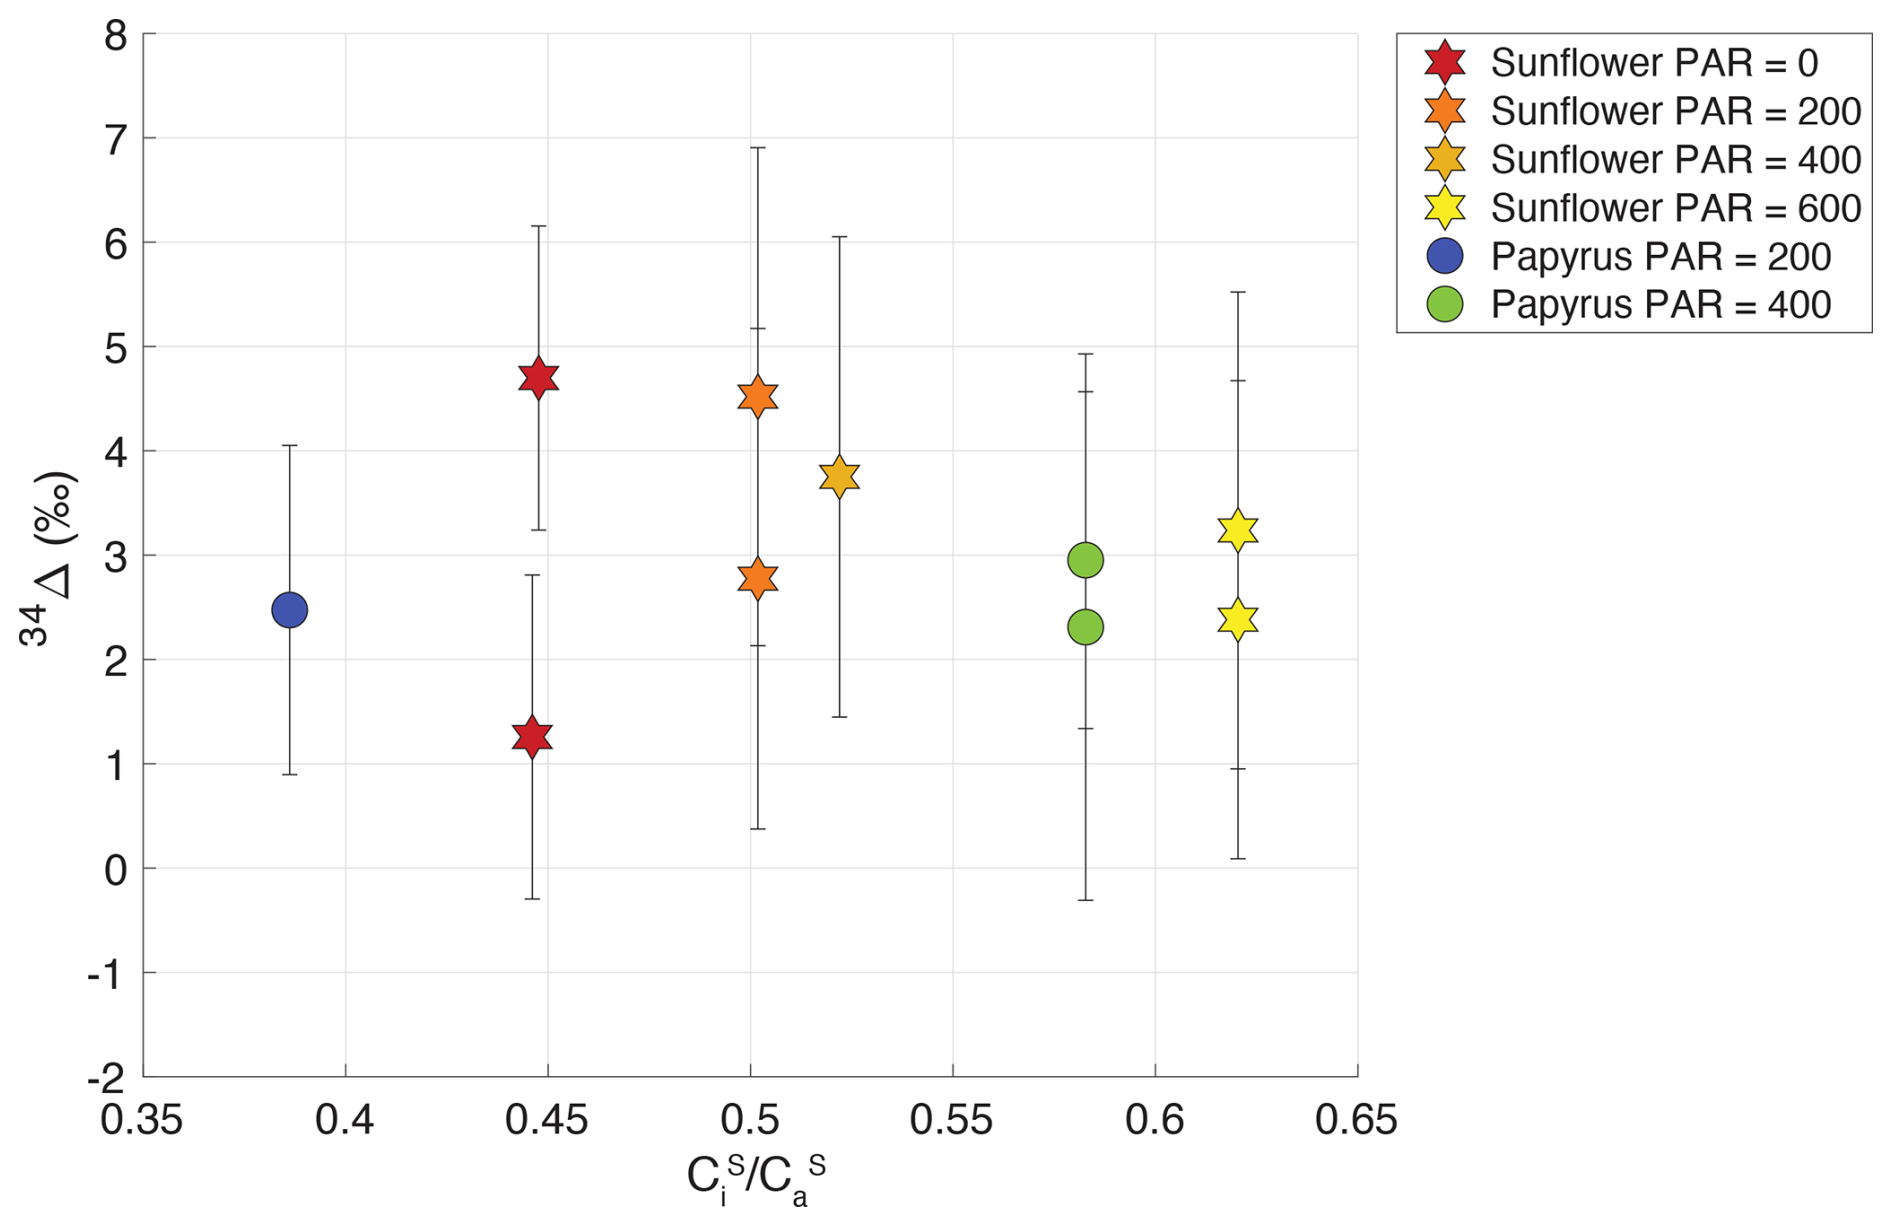
Figure 6Plant COS isotope discrimination (34Δ) against the ratio of internal versus , for sunflower (stars) and papyrus (circles). Colors indicate PAR levels (µmol m−2 s−1). Samples for PAR = 0 are only shown for sunflower as As for papyrus (PAR = 0) was too low to calculate 34Δ with meaningful precision.
To further investigate this lack of variability in 34Δ, we examined the variability in and as a function of PAR (Table 2). We observed a slight increase of with PAR that could be explained by an increase in gs with available light. Observed COS isotope discrimination also depends on , the ratio of COS mole fractions in the mesophyll cell and the ambient air (see Eq. 4). This ratio was relatively stable at low values around 0.03–0.07 (Table 2) over the various PAR levels and did not differ substantially between sunflower and papyrus, except for one sunflower sample (PAR = 200) yielding a . This lack in variability in might explain the absence in variability in 34Δ across the different light settings and between the two measured species. The calculation of does entail several assumptions (see Eqs. B16–B19 in Appendix B), and thus, the results should not be over interpreted.
Comparing our 34Δ to previous studies, Angert et al. (2019) estimated a value for 34Δ during COS plant uptake of around 5 ‰ (based on binary diffusion theory), and experiments presented by Davidson et al. (2021, 2022) yielded 34Δ values of 1.6 ± 0.1 ‰ for C3 and 5.4 ± 0.5 ‰ for C4 species. Our results differ from these measurements, as we did not find statistically different 34Δ values between our C3 and C4 species. However, the range for 34Δ that we measured in sunflower of 2.8 ± 1.7 ‰ to 3.7 ± 2.3 ‰ (average 3.3 ± 1.0 (SEM) ‰) is in the same range as the C found by Davidson et al. (2021, 2022) and the theoretical estimate of Angert et al. (2019). This is reassuring, given that different measurement techniques were used for both the plant experiments (flow-through chamber compared to closed-chamber) and the isotope ratio measurements.
The benefit of using a flow-through system is that stable environmental conditions inside the chamber can be maintained during the experiment. In contrast, in a closed chamber, CO2 and COS mole fractions will decrease due to plant uptake, which can be problematic when the experiment runs over long periods of time. Furthermore, transpiration by the plant will increase the water vapor mole fraction in the chamber, which might affect stomatal opening and therefore also the isotope fractionation.
3.3 CO2 isotope discrimination
3.3.1 13CO2 discrimination
In both sunflower and papyrus, 13Δ increased as the CO2 uptake flux decreased, with decreasing PAR (Fig. 7). Average 13Δ in sunflower was between 23.6 ± 1.2 ‰ and 32.4 ± 1.1 ‰ (Table 2), which is within the range of values expected for C3 photosynthesis (Farquhar et al., 1982; Kohn, 2010; Cernusak et al., 2013; Wingate et al., 2007). However, in papyrus, 13Δ was between 18.9 ± 3.4 ‰ and 21.8 ± 1.5 ‰ much larger than the expected 3 ‰ to 6 ‰ for C4 species operating at optimal conditions (Farquhar, 1983; Cerling et al., 1997; Kubásek et al., 2013; Ellsworth and Cousins, 2016; Eggels et al., 2021). As previously explained, our measurements were performed at low light intensities (PAR ≤ 400 µmol m−2 s−1), which resulted in moderately low photosynthetic rates (9.3–14.0 µmol m−2 s−1). In C4 species, 13Δ has been shown to increase at low light to values as large as 8 ‰–17 ‰, when PAR = 50–125 µmol m−2 s−1 (Ubierna et al., 2013; Pengelly et al., 2010; Kromdijk et al., 2010) and photosynthetic rates were small (<5 µmol m−2 s−1). Our 13Δ values for papyrus are still larger than these previous reports at low irradiance, suggesting that processes other than photosynthesis might have affected the measurements. Upward transport of water dissolved CO2 in the transpiration stream has been shown in tree stems (Aubrey and Teskey, 2009; Bloemen et al., 2013) and in papyrus culms (Li and Jones, 1995). We measured detached papyrus leaves submerged in water. This setting could have facilitated the transport of water dissolved CO2 into the leaf chamber, particularly because papyrus leaves have numerous vascular bundles surrounded by large air cavities (Plowman, 1906). Water dissolved CO2 would presumably have near-ambient air δ13C values – enriched compared to tank CO2 supplied to the chamber air –, and therefore if released in the plant chamber would artefactually increase 13Δ.
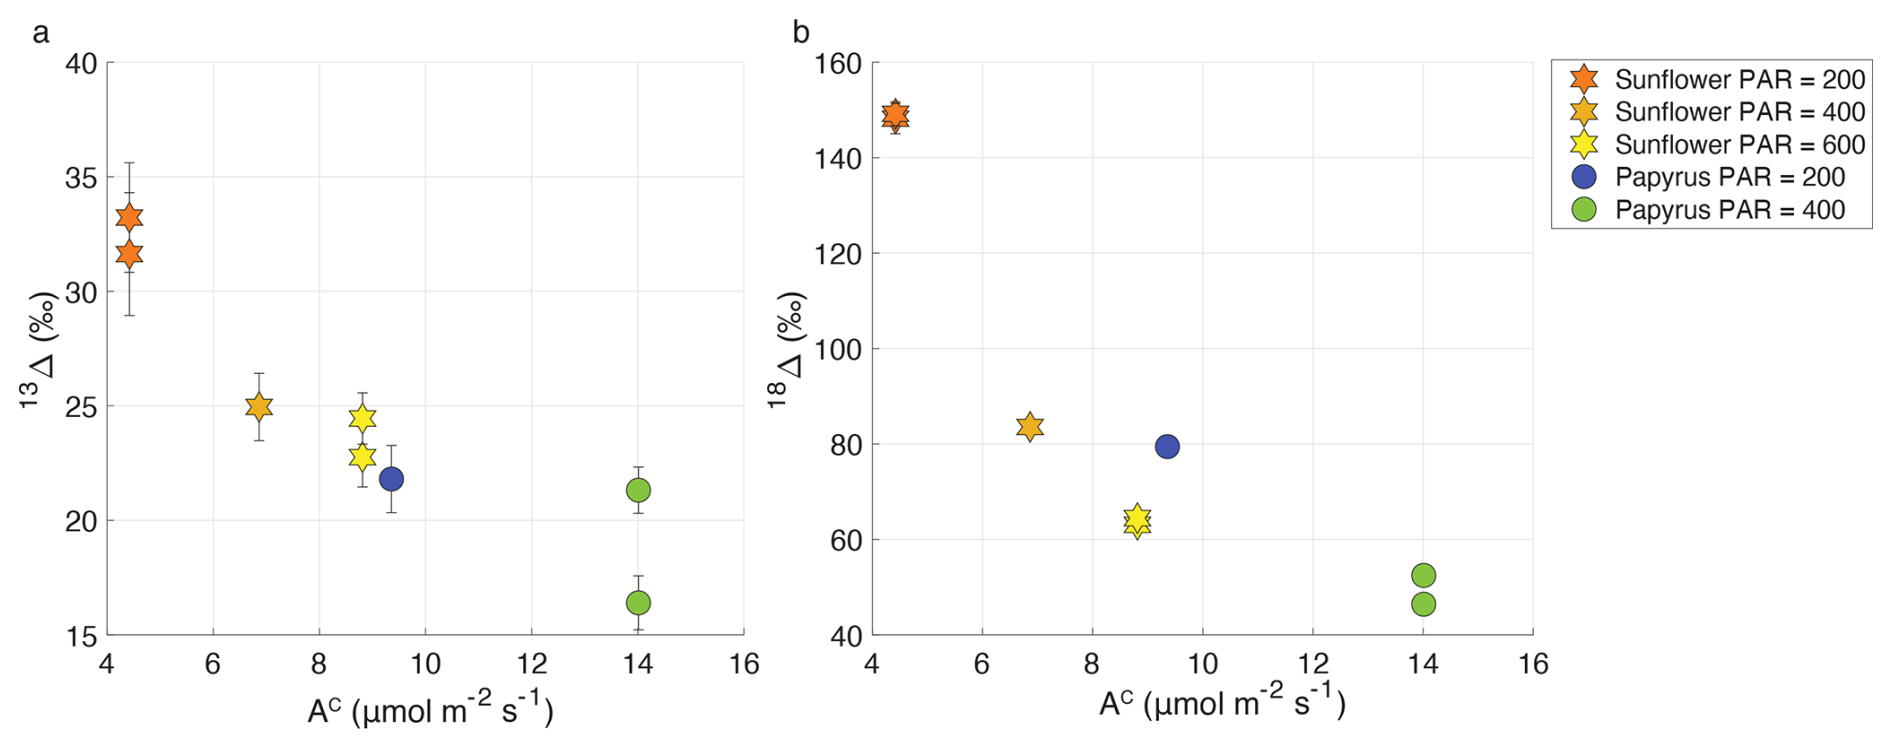
Figure 7Variation of photosynthetic discrimination against 13CO2 (13Δ, a) and CO18O (18Δ, b) as a function of AC (CO2 uptake flux in µmol m−2 s−1) for sunflower (stars) and papyrus (circles). Colors indicate PAR levels (µmol m−2 s−1). Data for PAR = 0 are not included because the plants were respiring in during dark conditions.
3.3.2 C16O18O discrimination
From Fig. 7, we observe a negative relationship between apparent 18Δ and CO2 uptake flux, similar to 13Δ. The average 18Δ values of sunflower range between 63.8 ± 0.9 ‰ and 148.7 ± 0.7 ‰ and the average 18Δ values of papyrus are between 49.4 ± 0.4 ‰ and 79.4 ± 1.5 ‰ (Table 2). 18Δ mostly reflects the exchange of 18O between CO2 and leaf water (Francey and Tans, 1987; Yakir, 1998; Adnew et al., 2020). The lower 18Δ in C4 species likely indicates the incomplete equilibrium between CO2 and leaf water, because of the reduced CA activity in C4 species compared to most C3 species (Gillon and Yakir, 2000).
A negative correlation of 18Δ with CO2 assimilation and light intensity, as well as lower 18Δ in C4 species was also found by Stimler et al. (2011). For their C3 plants, they found that 18Δ ranged between 40 ‰ and 240 ‰, with the highest values found at the lowest CO2 uptake fluxes. For C4 species, Stimler et al. (2011) found an 18Δ between 10 ‰ and 50 ‰. Seibt et al. (2006) also found large variations in 18Δ during CO2 uptake by Picea sitchensis, and a correlation with PAR. They too measured the largest 18Δ discrimination at dusk and dawn, when light intensity was lowest.
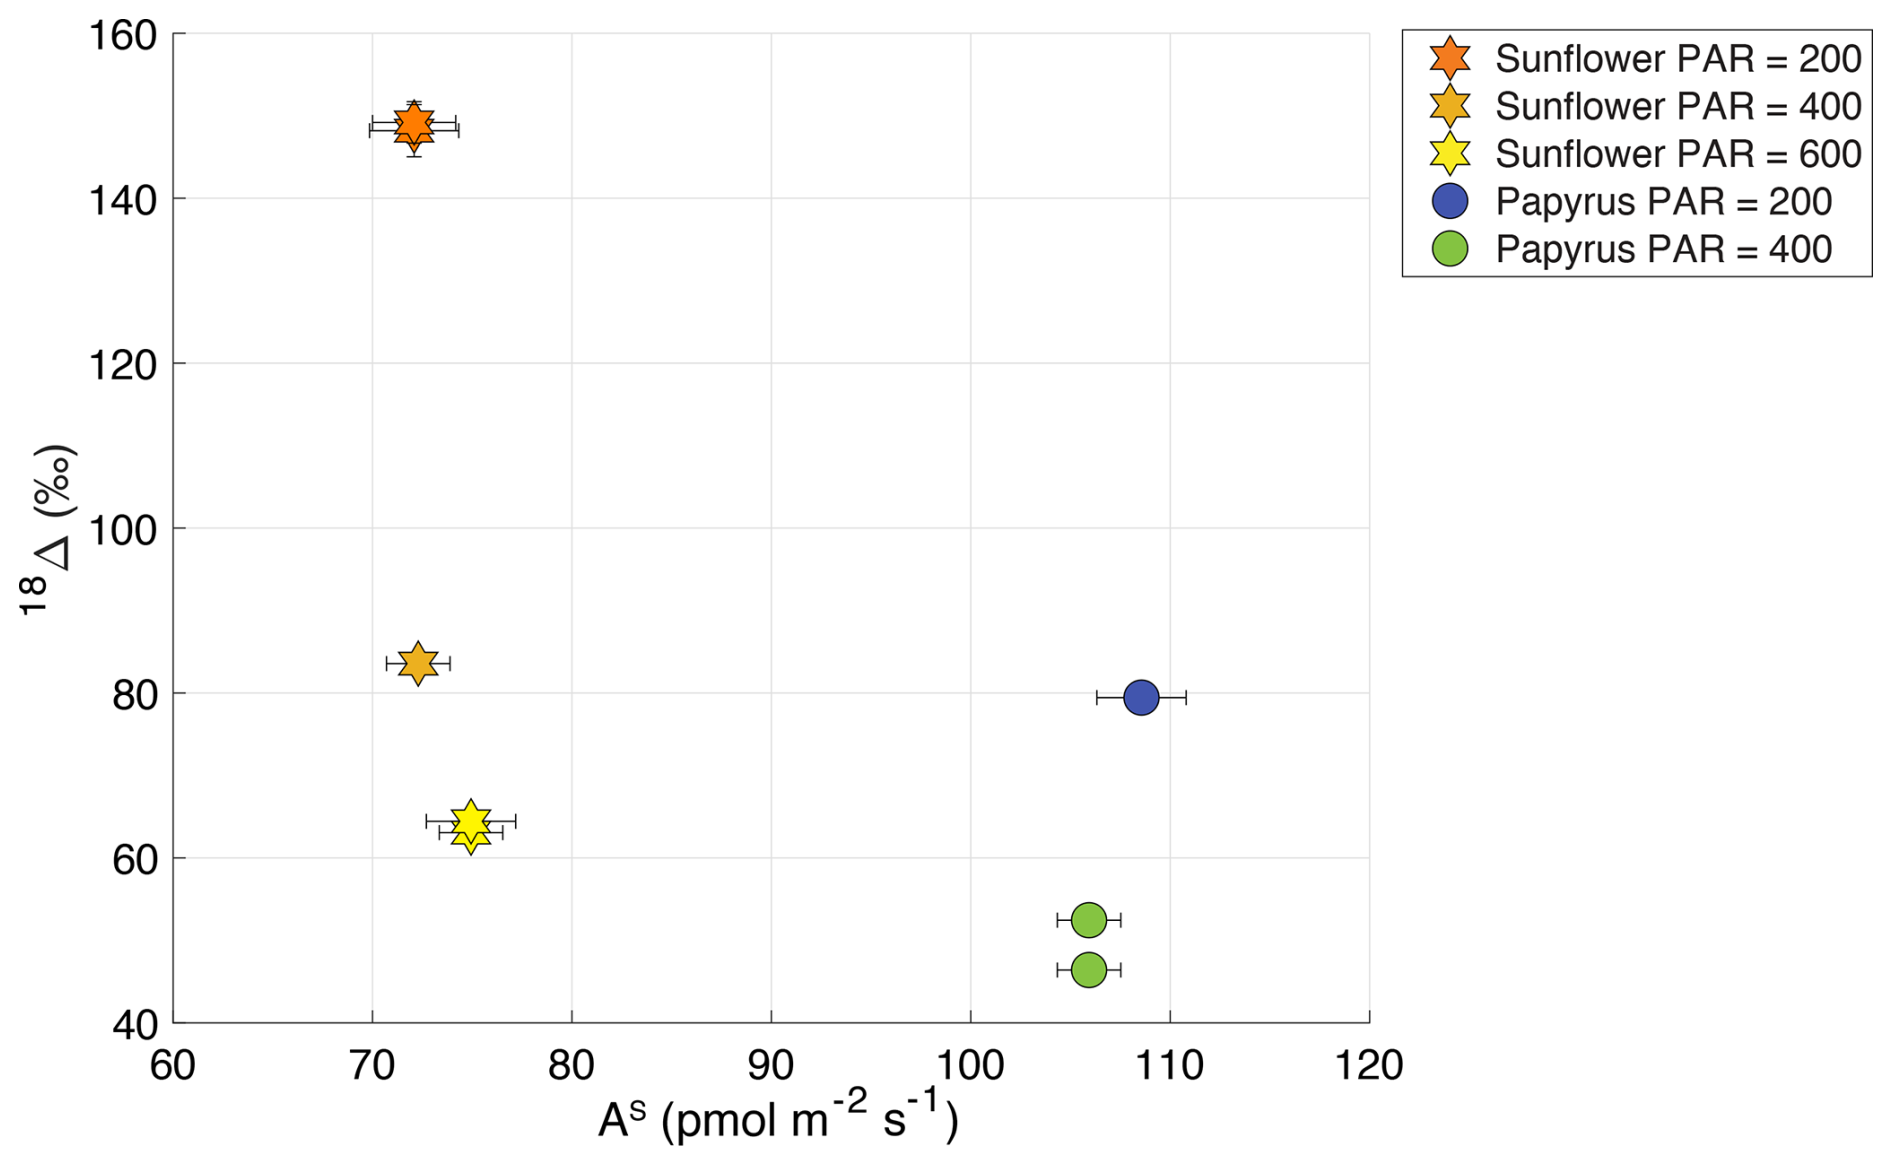
Figure 818Δ (‰) plotted against AS (COS uptake flux in pmol m−2 s−1) for sunflower (C3) and papyrus (C4), where the different symbols and colors indicate the plant types and PAR (µmol m−2 s−1). Data for PAR = 0 are not included because the plants were respiring during dark conditions.
The relation between the COS uptake flux and 18Δ can also be analyzed, since both depend on the same diffusion pathway and CA activity (Stimler et al., 2011). Stimler et al. (2011) observed a negative correlation between 18Δ and COS uptake flux, with a larger change in 18Δ for C3 species, compared to C4. Figure 8 shows 18Δ against the COS uptake flux for our data. We do not observe such a correlation between 18Δ and the uptake COS flux. However, our range in COS uptake flux for each species is small, as we found that the COS uptake flux did not change significantly with light intensity. In the same range of COS uptake flux data, Stimler et al. (2011) did not find a strong trend in 18Δ either.
This study presented measurements of COS and CO2 plant uptake fluxes and COS (34Δ) and CO2 (13Δ and 18Δ) isotope discrimination for sunflower (C3) and papyrus (C4). The experiments were conducted using a flow-through gas exchange system, which is a new and different method compared to previously reported measurements of COS isotope fractionation during plant uptake (Davidson et al., 2021, 2022). The gas exchange system including the QCLS and LI-7000 instruments ensured stable chamber conditions, which were easy to monitor throughout the experiments.
Our study is the first to combine measurements of both COS and CO2 plant isotope discrimination, where the CO2 values provided additional information on the plant's behavior and their responses to environmental variation. CO2 assimilation increased with increasing PAR level and CO2 uptake flux was higher for the C4 than for the C3 species, both findings being consistent with previous results under similar conditions. However, the moderate to low-light conditions were limiting CO2 assimilation rate. Corresponding CO2 isotope discrimination values,13Δ and 18Δ, were therefore higher than those normally exhibited by planst at full photosynthetic capacity. CO2 isotope discrimination as well as were lower in papyrus than in sunflower, consistent with differences between C3 and C4 photosynthesis and decreased with light intensity for both species. Therefore, we conclude that both species were behaving normal, albeit not in the most optimal conditions for maximum photosynthetic CO2 assimilation.
In contrast to photosynthesis, COS assimilation did not vary strongly with light intensity, which is to be expected when stomatal conductance is sufficiently large to maintain a steady COS supply to the mesophyll cell, as the hydrolysis reaction catalyzed by CA is light-independent. The observed COS uptake flux was lower during the dark experiments, but not zero, consistent with residual stomatal opening. Our measurements also showed a constant 34Δ across different light settings, which can be explained by the rather constant and values. Surprisingly, 34Δ also did not differ significantly between papyrus and sunflower, whereas previous measurements (Davidson et al., 2022) reported higher 34S isotope discrimination for C4 species. Nevertheless, our values for 34Δ are close to the previously reported values by Davidson et al. (2022), despite using a different experimental set-up and a different way to calculate the isotopic discrimination (Evans et al., 1986).
For future studies, we recommend to use representative C3 and C4 plant species to characterize isotope discrimination more broadly. In our study, papyrus was selected due to its availability and large leaf area, which enabled sufficient COS uptake fluxes for isotope analysis at the required precision. However, we acknowledge that papyrus, along with the environmental conditions during our measurements, may not be broadly representative of typical C4 species. Future work should aim to include a wider range of species and ideally those that are ecologically abundant and physiologically representative of the C3 and C4 photosynthetic pathways.
We furthermore recommend to perform experiments under environmental conditions closer to natural field conditions, in particular using higher PAR than in our experiments. However, measuring at high PAR in a plant chamber, while maintaining a sufficient COS mole fraction difference between in- and outgoing air to quantify COS isotope discrimination may introduce technical challenges, especially related to water condensation on chamber walls and sampling lines, which will need to be overcome.
Aditionally, the influence of soil water availability, VPD, and nutrient availabiliy on COS isotope discrimination remains unexplored. Investigating these environmental variables may yield insights into mesophyll conductance and its influence on the LRU.
Finally, we recommend future studies to directly measure the isotope discrimination occuring during the CA-catalyzed hydrolysis of COS. Precisely quantifying the CA discrimination factor, h, as defined in Eq. (4), would provide a critical constraint on possible values for total observed isotope discrimination across different plant species. This would be beneficial for upscaling the isotope signatures to the global scale. Furthermore, better constraining h would enable more accurate estimations of CA activity, thereby improving our understanding of the physiological processes underlying plant COS assimilation.
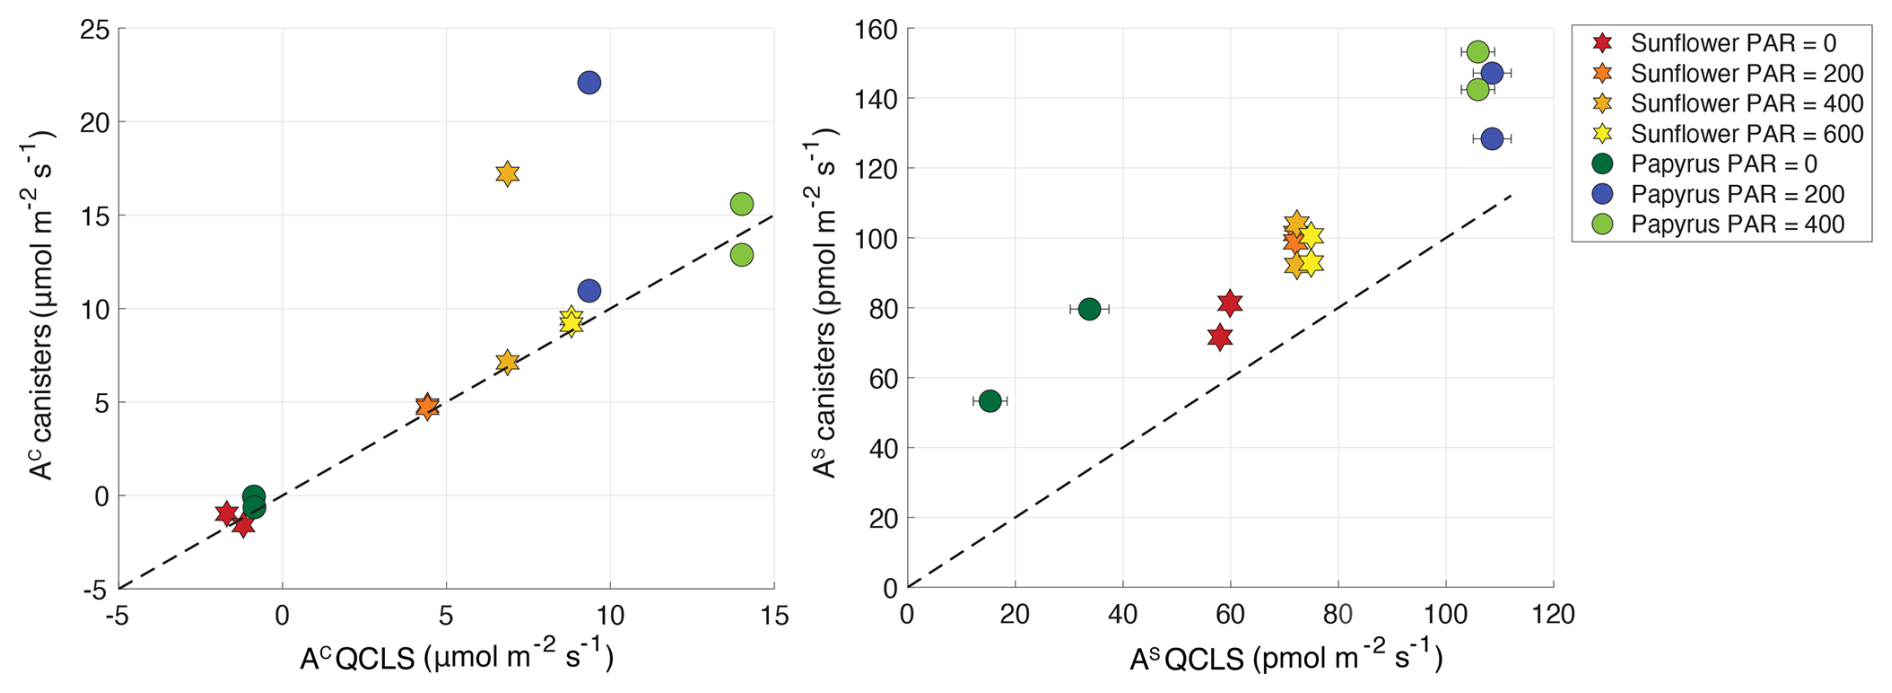
Figure A1CO2 and COS fluxes in µmol m−2 s−1 and pmol m−2 s−1, respectively, calculated from the discrete samples that were analyzed on the mass spectrometer, plotted against the fluxes that were calculated from the online QCLS measurements. Uncertainty bars are ±1σ, obtained using error propagation of the measurement errors on all the components used during the flux calculations (see the accompanying data set of Baartman et al., 2025). The errors are only depicted when they are larger than the symbols. The stars symbols are the sunflower data, and the circles are the papyrus data. The different color shadings indicate the varying PAR levels in µmol m−2 s−1. The black dashed line shows the one-to-one line, for reference. The two samples that clearly fall off the line in the CO2 plot were excluded from both the CO2 and COS dataset, as these sample canisters had possibly leaked or were contaminated with air other than the plant chamber air.
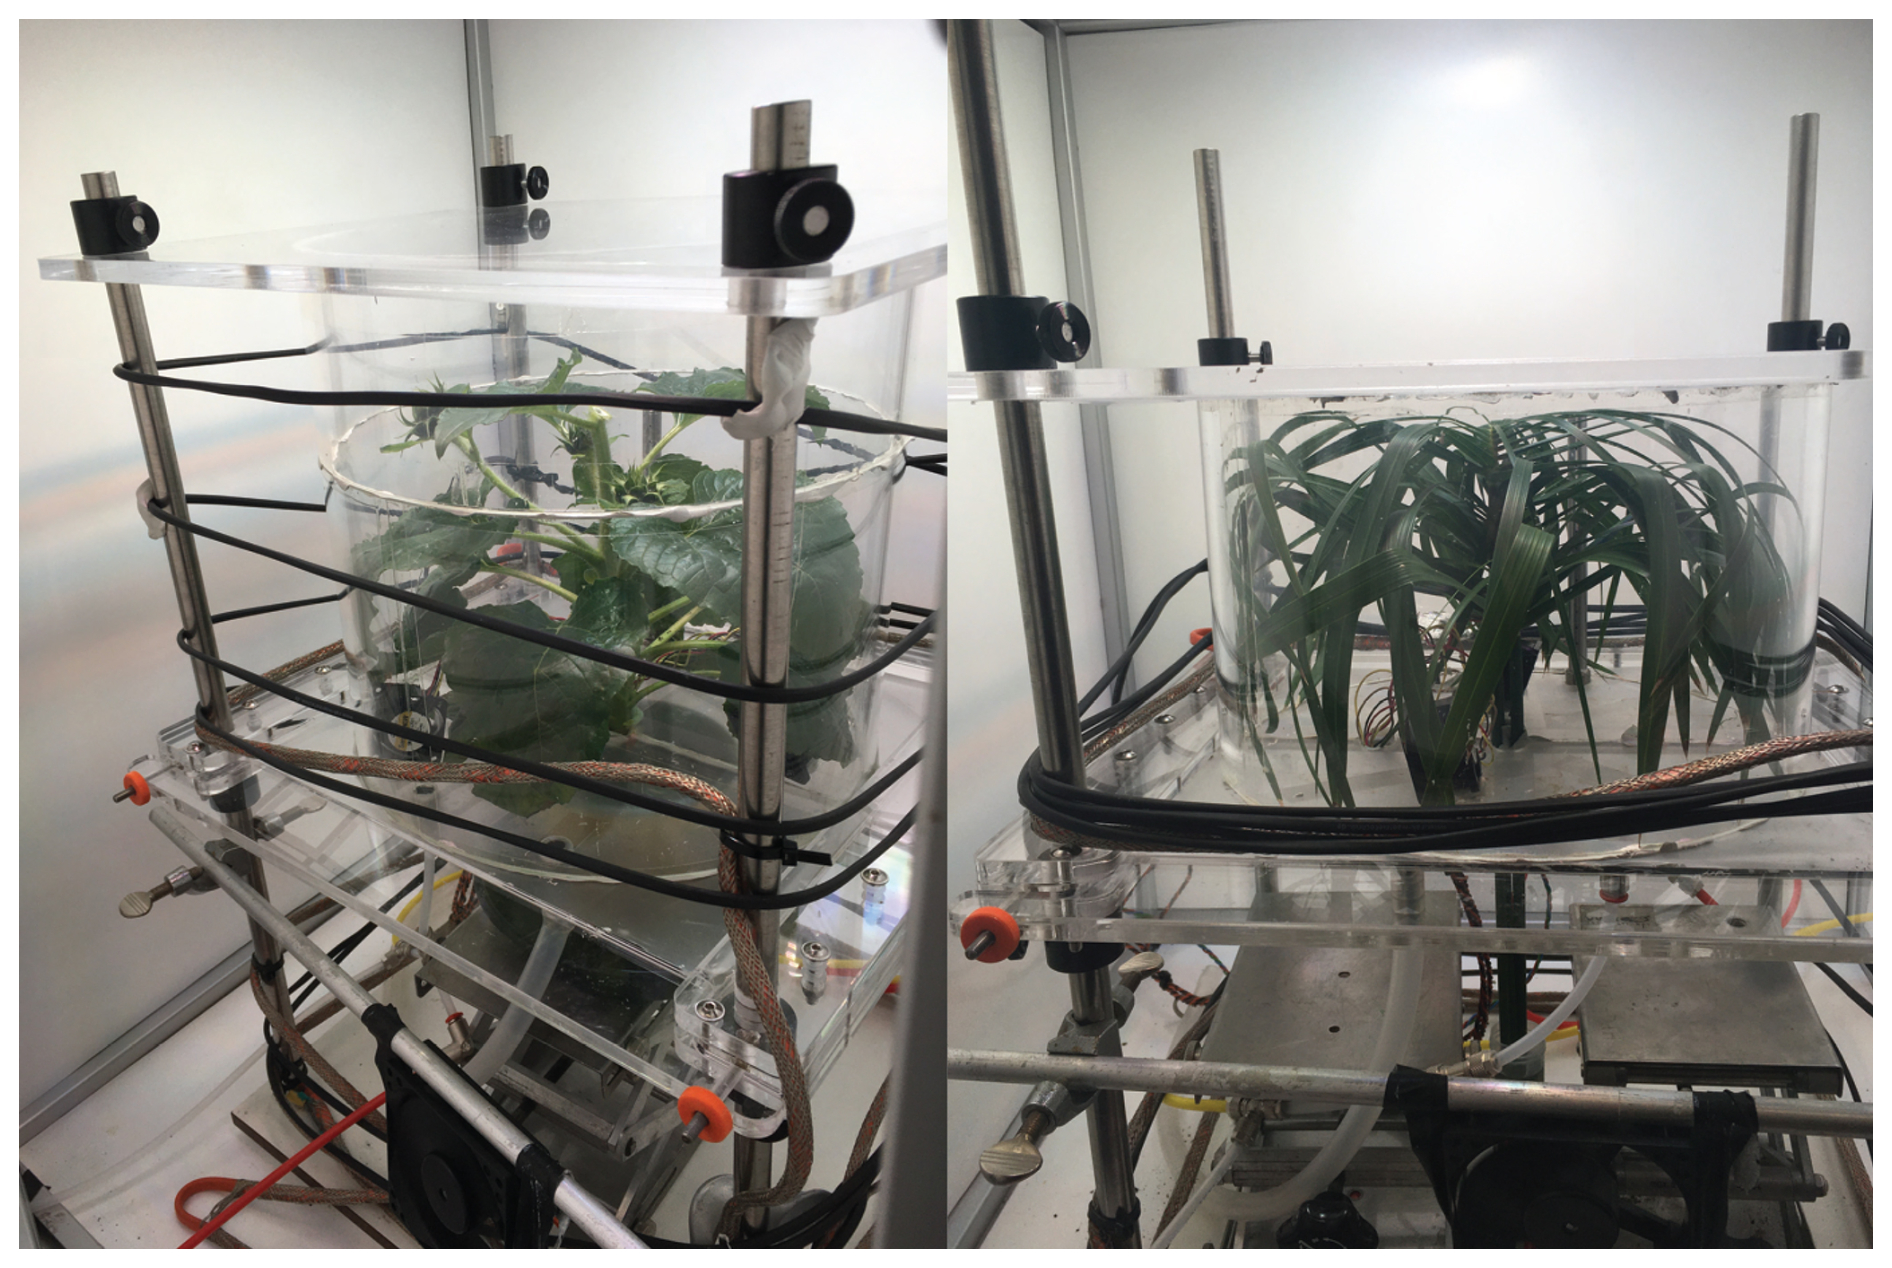
Figure A2Pictures of the plant chamber, with sunflower (left) and papyrus leaves (right) inside. The chamber consists of two cylinders, connected to each other and to the upper and lower panels with Terostat RB VII. The plant pot and soil are kept outside of the chamber and the chamber is sealed onto the stem with Terostat as well. The black wires are automated (computer controlled) heating wires, ensuring constant temperature around the chamber.
We detail gas exchange equations of von Caemmerer and Farquhar (1981) for CO2 and adapt this theory to derive gas exchange parameters for COS. For assimilation rates and mixing ratios we adopt a nomenclature where the superscript “c” refers to CO2 and “s” to COS. For conductances the subscript represents the molecule of interest (w – water, c – CO2, s – COS) and the superscript the type of conductance (t – total, b – boundary layer, s – stomata).
CO2 and COS assimilation rates (Ac, As, µmol CO2 m−2 s−1, As given by Eq. 5):
where ue is the molar flow of air entering the chamber (mol air s−1), S is the leaf area (m2), and (µmol CO2 mol air−1) are the [CO2] in the air entering and leaving the chamber, respectively, and and (pmol COS mol air−1) are the [COS] in the air entering and leaving the chamber, respectively.
Transpiration rate (mol H2O m−2 s−1)
where we, wa (mol H2O mol air−1) are the mole fractions of water vapor in the air entering the chamber and in the chamber air (which equals to the air out of the chamber).
Total conductance to water vapor (, mol H2O m2 s−1):
where (mol H2O mol air−1) is the mole fraction of water vapor inside the leaf, which assuming saturation with water vapour at the leaf temperature (Tl, °C) can be calculated:
where Pa (kPa) is atmosphere pressure in the chamber.
Stomata conductance to water (, mol H2O m−2 s−1) is:
where is the boundary layer conductance to water, a characteristic of each plant chamber, but often very large in well stirred chambers (a requisite for gas exchange).
Total conductance to CO2 (, mol CO2 m−2 s−1) and COS (, mol COS m−2 s−1):
where the coefficient 1.6 and 1.37 (mol H2O mol CO) are the ratio of diffusivities of CO2 to water vapor in air, and in the boundary layer, respectively. The coefficients 1.94 and 1.56 (mol H2O mol COS−1) are the ratio of diffusivities of COS to water vapor in air, and boundary layer, respectively (Fuller et al., 1966; Farquhar and Lloyd, 1993).
Concentration inside the leaf of CO2 (, µ mol CO2 mol wet air−1) and COS (, pmol COS mol wet air−1).
Ac and As are determined with gas exchange with Eqs. (B1) and (5), and can also be related to the [CO2] and [COS] inside the leaf with the equations:
where and are ternary corrections that accounts for the influence of transpiration on the diffusion of CO2 and COS into the leaf. Solving from Eq. (9) and from Eq. (B9) results in:
COS concentration in the mesophyll at the sites of CA (, pmol COS mol wet air−1):
By analogy with the model for photosynthetic discrimination against 13CO2 (Farquhar et al., 1982; Farquhar and Cernusak, 2012) discrimination against CO36S (‰) during plant uptake can be described:
where (‰) is the weighted discrimination for diffusion across the leaf boundary layer and inside the mesophyll, calculated as:
with , the [COS] (pmol COS mol wet air−1) at the leaf surface, is:
The t is a ternary correction factor calculated as (Farquhar and Cernusak, 2012):
where .
The ab (= 3.5 ‰), as (= 5.2 ‰), and am (= 0.5 ‰) are fractionations for COS diffusion across the boundary layer, across the stomata, and due to COS dissolution and diffusion in water through the mesophyll, respectively (Davidson et al., 2022). h (=15 ± 2 ‰) is the fractionation during COS hydrolysis by CA (Davidson et al., 2022).
The can be solved from Eq. (13) as:
Because t≅0, then Eq. (B16) can be simplified to:
Substituting in Eq. (B17) the for its expression given in Eq. (B14) and rearranging terms result in:
Substituting in Eq. (B18) the fractionation factors by their values results in:
where Δ34S (‰) can be experimentally determined during measurements of gas exchange as (Evans et al., 1986):
where and are the mole of COS in mole of dry air in the air entering and going out the chamber, and and (‰) are the δ34S isotope composition of the air entering and leaving the chamber, respectively. The term is often represented as ζ. The δ34S values in the numerator should be divided by 1000 (for example if ‰, then 0.0010 should be used).
We present values calculated including ternary (Eq. B16). Ignoring ternary overestimated % at PAR = 200 and ∼5 % at PAR = 600.
Table C1Overview of all the available data on COS isotope discrimination experiments during plant uptake. [COS] and [CO2] in columns three and four indicate the mole fractions of the respective gases inside the chamber, PAR is the photosynthetically available radiation at the top of the chamber, 34Δ is the discrimination against CO34S and LRU is the leaf relative uptake ratio.
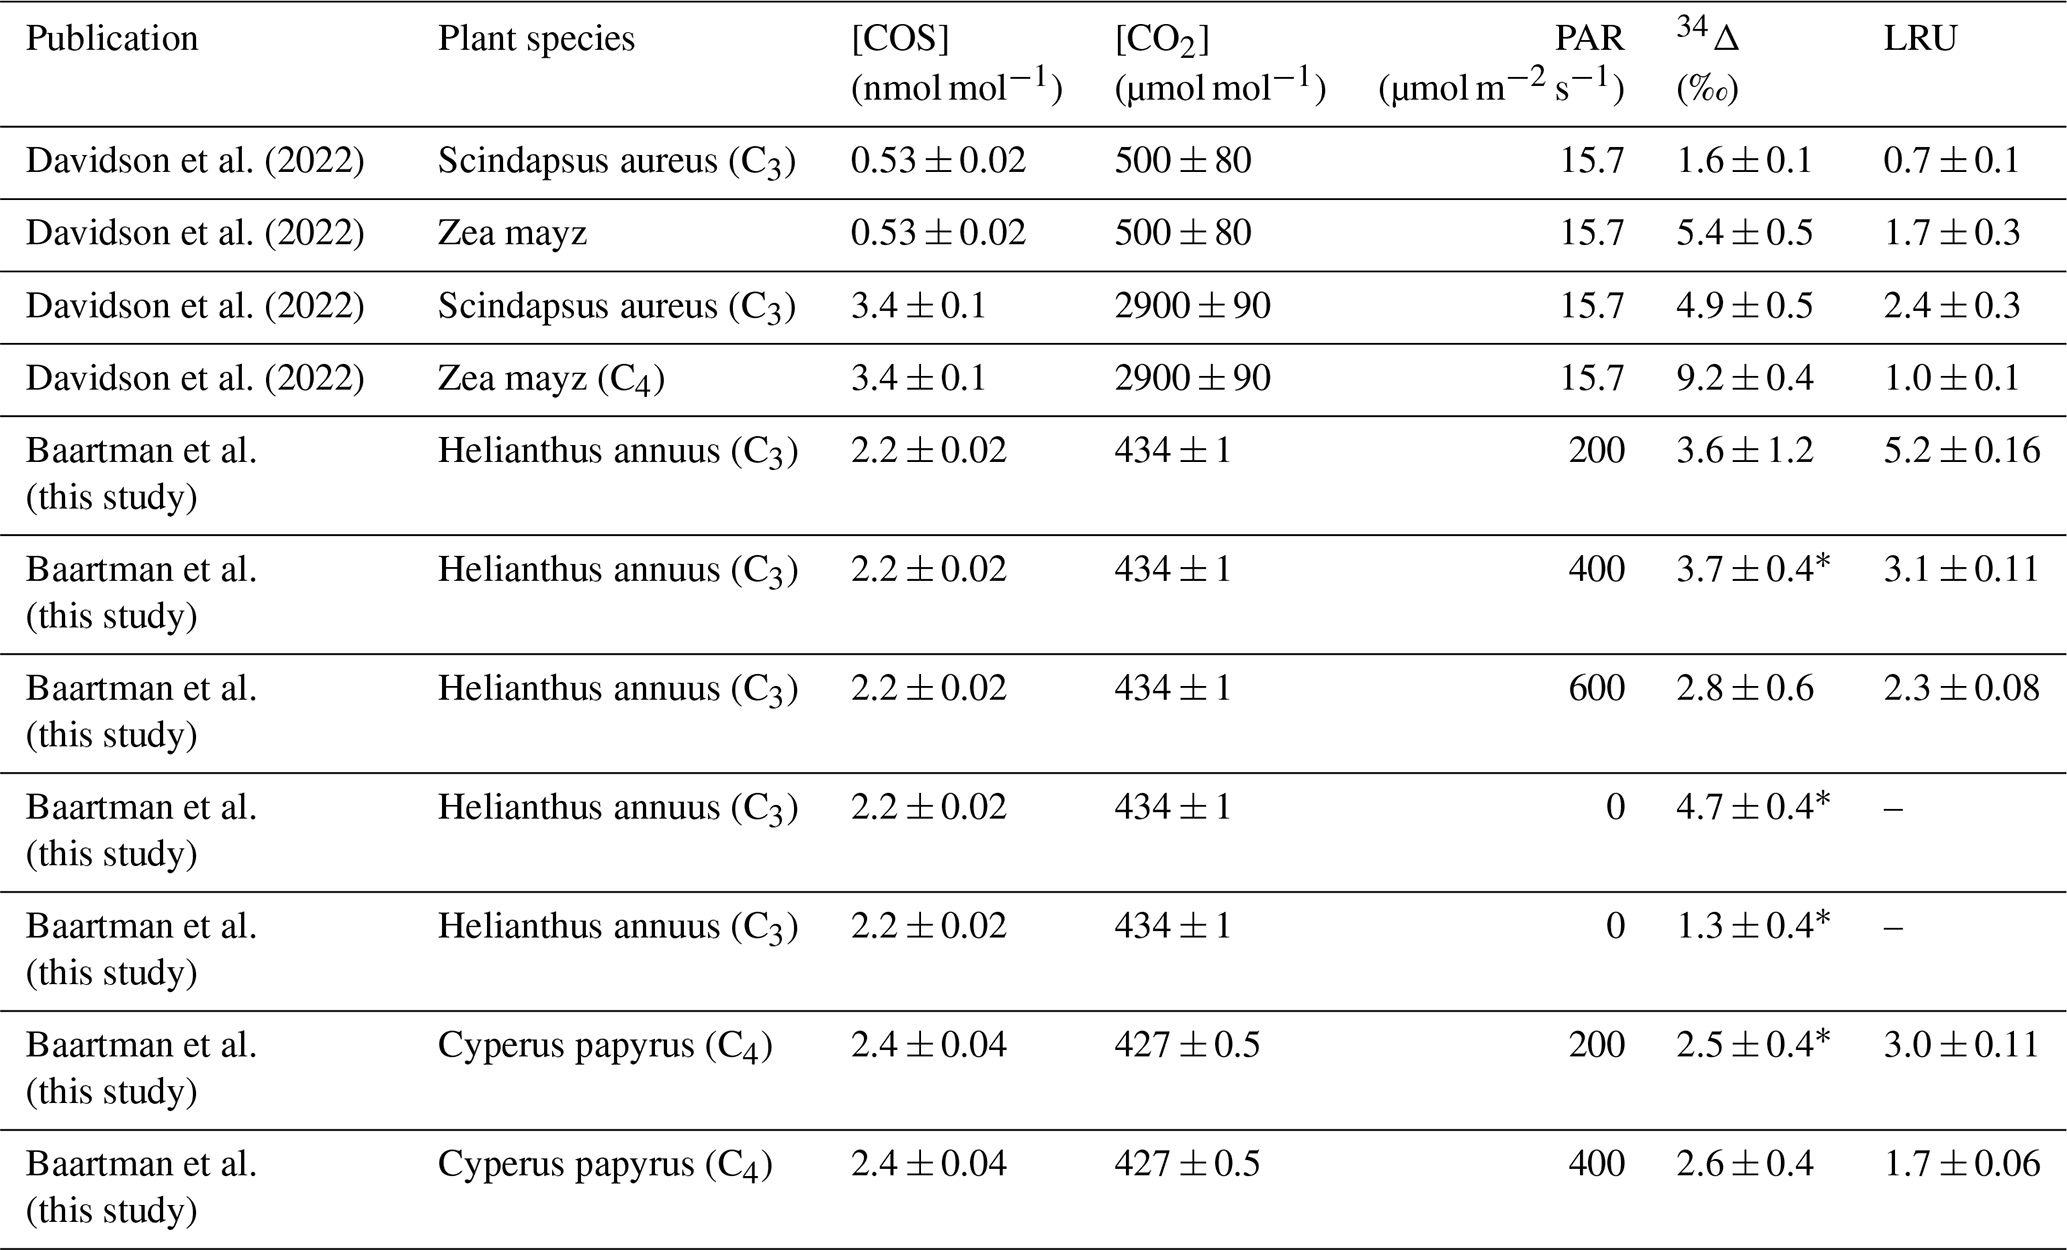
* n=1, error states is the single measurement precision instead of the repeatability precision.
The dataset is available at: https://doi.org/10.5281/zenodo.14677494 (Baartman et al., 2025).
Conceptualization: SLB, MCK, MEP, LW. Data curation: SLB. Formal analysis: SLB, NUL. Funding acquisition: MCK. Investigation: SLB, SMD, MW, LMJK, LM, AC, SH. Methodology: SLB, SMD, MW, LMJK, MEP. Resources: SMD, MW, LM, SH. Supervision: MEP, TR, MCK. Visualization: SLB, NUL. Writing – original draft preparation: SLB, NUL. Writing – review & editing: SMD, MW, LMJK, NUL, LM, MEP, AC, LW, TR, SH, MCK.
The contact author has declared that none of the authors has any competing interests.
Publisher's note: Copernicus Publications remains neutral with regard to jurisdictional claims made in the text, published maps, institutional affiliations, or any other geographical representation in this paper. While Copernicus Publications makes every effort to include appropriate place names, the final responsibility lies with the authors. Also, please note that this paper has not received English language copy-editing. Views expressed in the text are those of the authors and do not necessarily reflect the views of the publisher.
We are grateful for the technical support from Carina van der Veen, Marcel Portanger and Giorgio Cover. The authors gratefully acknowledge the insightful discussions with Jérôme Ogée.
This project has received funding from the European Research Council (ERC) under the European Union's Horizon 2020 research and innovation program under grant agreement No. 742798 (COS-OCS; to Maarten C. Krol).
This paper was edited by Nicolas Brüggemann and reviewed by Marine Remaud and one anonymous referee.
Adnew, G. A., Pons, T. L., Koren, G., Peters, W., and Röckmann, T.: Leaf-scale quantification of the effect of photosynthetic gas exchange on Δ17O of atmospheric CO2, Biogeosciences, 17, 3903–3922, https://doi.org/10.5194/bg-17-3903-2020, 2020.
Angert, A., Said-Ahmad, W., Davidson, C., and Amrani, A.: Sulfur isotopes ratio of atmospheric carbonyl sulfide constrains its sources, Sci. Rep., 9, https://doi.org/10.1038/s41598-018-37131-3, 2019.
Asaf, D., Rotenberg, E., Tatarinov, F., Dicken, U., Montzka, S. A., and Yakir, D.: Ecosystem photosynthesis inferred from measurements of carbonyl sulphide flux, Nat. Geosc., 6, 186–190, https://doi.org/10.1038/ngeo1730, 2013.
Aubrey, D. P. and Teskey, R. O.: Root-derived CO2 efflux via xylem stream rivals soil CO2 efflux, New. Phyt., 184, 35–40, https://doi.org/10.1111/j.1469-8137.2009.02971.x, 2009.
Baartman, S. L., Krol, M. C., Röckmann, T., Hattori, S., Kamezaki, K., Yoshida, N., and Popa, M. E.: A GC-IRMS method for measuring sulfur isotope ratios of carbonyl sulfide from small air samples, Open Res. Europe, 1, 105, https://doi.org/10.12688/openreseurope.13875.2, 2022.
Baartman, S. L., Driever, S., Wassenaar, M., Kooijmans, L., Ubierna, N., Mossink, L., Popa, M. E., Cho, A., Wingate, L., Röckmann, T., van Heuven, S., and Krol, M.: Data of: Isotope discrimination of carbonyl sulfide (34S) and carbon dioxide (13C, 18O) during plant uptake in flow-through chamber experiments, Zenodo [data set], https://doi.org/10.5281/zenodo.14677494, 2025.
Belviso, S., Abadie, C., Montagne, D., Hadjar, D., Tropée, D., Vialettes, L., Kazan, V., Delmotte, M., Maignan, F., and Remaud, M.: Carbonyl sulfide (COS) emissions in two agroecosystems in central France, PLoS ONE, 17, e0278584, https://doi.org/10.1371/journal.pone.0278584, 2022.
Berkelhammer, M., Alsip, B., Matamala, R., Cook, D., Whelan, M. E., Joo, E., and Meyers, T.: Seasonal evolution of canopy stomatal conductance for a prairie and maize field in the midwestern United States from continuous carbonyl sulfide fluxes, Geophys. Res. Lett., 47, https://doi.org/10.1029/2019GL085652, 2020.
Berry, J., Wolf, A., Campbell, J. E., Baker, I., Blake, N., Blake, D., Denning, A. S., Kawa, S. R., Montzka, S. A., Seibt, U., Stimler, K., Yakir, D. and Zhu, Z.: A coupled model of the global cycles of carbonyl sulfide and CO2: A possible new window on the carbon cycle, Journal of Geophysical Research: Biogeosciences, 118, 842–852, https://doi.org/10.1002/jgrg.20068, 2013.
Billesbach, D. P., Berry, J. A., Seibt, U., Maseyk, K., Torn, M. S., Fischer, M. L., Abu-Naser, M., and Campbell, J. E.: Growing season eddy covariance measurements of carbonyl sulfide and CO2 fluxes: COS and CO2 relationships in Southern Great Plains winter wheat, Agr. For. Meteorol., 184, 48–55, https://doi.org/10.1016/j.agrformet.2013.06.007, 2014.
Bloemen, J., McGuire, M. A., Aubrey, D. P., Teskey, R. O., and Steppe, K.: Transport of root-respired CO2 via the transpiration stream affects aboveground carbon assimilation and CO2 efflux in trees, New Phytol., 197, 555–565, https://doi.org/10.1111/j.1469-8137.2012.04366.x, 2013.
Brenninkmeijer, C. A. M.: Measurement of the abundance of 14CO in the atmosphere and the and ratio of atmospheric CO with applications in New Zealand and Antarctica, J. Geophys. Res., 98, 10595–10614, https://doi.org/10.1029/93jd00587, 1993.
Campbell, J. E., Carmichael, G. R., Chai, T., Mena-Carrasco, M., Tang, Y., Blake, D. R., Blake, N. J., Vay, S. A., Collatz, G. J., and Baker, I.: Photosynthetic Control of Atmospheric Carbonyl Sulfide During the Growing Season, Science, 322, 1085–1088, https://doi.org/10.1126/science.1164015, 2008.
Cerling, T. E., Harris, J. M., MacFadden, B. J., Leakey, M. G., Quade, J., Eisenmann, V., and Ehleringer, J. R.: Global vegetation change through the Miocene/Pliocene boundary, Nature, 389, 153–158, https://doi.org/10.1038/38229, 1997.
Cernusak, L. A., Ubierna, N., Winter, K., Holtum, J. A. M., Marshall, J. D., and Farquhar, G. D.: Environmental and physiological determinants of carbon isotope discrimination in terrestrial plants, New Phytol., 200, 950–965, https://doi.org/10.1111/nph.12423, 2013.
Cernusak, L. A., Ubierna, N., Jenkins, M. W., Garrity, S. R., Rahn, T., Powers, H. H., Hanson, D. T., Sevanto, S., Wong, S. C., and McDowell, N. G.: Unsaturation of vapour pressure inside leaves of two conifer species, Sci. Rep., 8, https://doi.org/10.1038/s41598-018-25838-2, 2018.
Cernusak, L. A., Wong, S. C., Stuart-Williams, H., Márquez, D. A., Pontarin, N., and Farquhar, G. D.: Unsaturation in the air spaces of leaves and its implications, Plant Cell & Environ., 47, 3685–3698, https://doi.org/10.1111/pce.15001, 2024.
Cho, A., Kooijmans, L. M. J., Kohonen, K.-M., Wehr, R., and Krol, M. C.: Optimizing the carbonic anhydrase temperature response and stomatal conductance of carbonyl sulfide leaf uptake in the Simple Biosphere model (SiB4), Biogeosciences, 20, 2573–2594, https://doi.org/10.5194/bg-20-2573-2023, 2023.
Commane, R., Meredith, L. K., Baker, I. T., Berry, J. A., Munger, J. W., Montzka, S. A., Templer, P. H., Juice, S. M., Zahniser, M. S., and Wofsy, S. C.: Seasonal fluxes of carbonyl sulfide in a midlatitude forest, Proc. Natl. Acad. Sci. U.S.A., 112, 14162–14167, https://doi.org/10.1073/pnas.1504131112, 2015.
Davidson, C., Amrani, A., and Angert, A.: Tropospheric carbonyl sulfide mass balance based on direct measurements of sulfur isotopes, Proc. Natl. Acad. Sci. U.S.A., 118, https://doi.org/10.1073/pnas.2020060118, 2021.
Davidson, C., Amrani, A., and Angert, A.: Carbonyl Sulfide Sulfur Isotope Fractionation During Uptake by C3 and C4 Plants, JGR Biogeosciences, 127, https://doi.org/10.1029/2022jg007035, 2022.
Eggels, S., Blankenagel, S., Schön, C.-C., and Avramova, V.: The carbon isotopic signature of C4 crops and its applicability in breeding for climate resilience, Theor. Appl. Genet., 134, 1663–1675, https://doi.org/10.1007/s00122-020-03761-3, 2021.
Ellsworth, P. Z. and Cousins, A. B.: Carbon isotopes and water use efficiency in C4 plants, Curr. Opin. Plant Biol., 31, 155–161, https://doi.org/10.1016/j.pbi.2016.04.006, 2016.
Evans, J., Sharkey, T., Berry, J., and Farquhar, G.: Carbon Isotope Discrimination measured Concurrently with Gas Exchange to Investigate CO2 Diffusion in Leaves of Higher Plants, Functional Plant Biol., 13, 281, https://doi.org/10.1071/pp9860281, 1986.
Farquhar, G.: On the Nature of Carbon Isotope Discrimination in C4 Species, Functional Plant Biol., 10, 205, https://doi.org/10.1071/pp9830205, 1983.
Farquhar, G.: Carbon Isotope Discrimination And Photosynthesis, Ann. Rev. Plant Physio., 40, 503–537, https://doi.org/10.1146/annurev.arplant.40.1.503, 1989.
Farquhar, G. and Richards, R.: Isotopic Composition of Plant Carbon Correlates With Water-Use Efficiency of Wheat Genotypes, Functional Plant Biol., 11, 539, https://doi.org/10.1071/pp9840539, 1984.
Farquhar, G., O'Leary, M., and Berry, J.: On the Relationship Between Carbon Isotope Discrimination and the Intercellular Carbon Dioxide Concentration in Leaves, Functional Plant Biol., 9, 121, https://doi.org/10.1071/pp9820121, 1982.
Farquhar, G. D. and Cernusak, L. A.: Ternary effects on the gas exchange of isotopologues of carbon dioxide, Plant Cell Environ., 35, 1221–1231, https://doi.org/10.1111/j.1365-3040.2012.02484.x, 2012.
Farquhar, G. D. and Lloyd, J.: Carbon and Oxygen Isotope Effects in the Exchange of Carbon Dioxide between Terrestrial Plants and the Atmosphere, Stable isotopes and plant carbon-water relationships, 47–70, https://doi.org/10.1016/b978-0-08-091801-3.50011-8, 1993.
Farquhar, G. D., von Caemmerer, S., and Berry, J. A.: A biochemical model of photosynthetic CO2 assimilation in leaves of C3 species, Planta, 149, 78–90, https://doi.org/10.1007/bf00386231, 1980.
Farquhar, G. D., Lloyd, J., Taylor, J. A., Flanagan, L. B., Syvertsen, J. P., Hubick, K. T., Wong, S. C., and Ehleringer, J. R.: Vegetation effects on the isotope composition of oxygen in atmospheric CO2, Nature, 363, 439–443, https://doi.org/10.1038/363439a0, 1993.
Francey, R. J. and Tans, P. P.: Latitudinal variation in oxygen-18 of atmospheric CO2, Nature, 327, 495–497, https://doi.org/10.1038/327495a0, 1987.
Friedlingstein, P., O'Sullivan, M., Jones, M. W., Andrew, R. M., Bakker, D. C. E., Hauck, J., Landschützer, P., Le Quéré, C., Luijkx, I. T., Peters, G. P., Peters, W., Pongratz, J., Schwingshackl, C., Sitch, S., Canadell, J. G., Ciais, P., Jackson, R. B., Alin, S. R., Anthoni, P., Barbero, L., Bates, N. R., Becker, M., Bellouin, N., Decharme, B., Bopp, L., Brasika, I. B. M., Cadule, P., Chamberlain, M. A., Chandra, N., Chau, T.-T.-T., Chevallier, F., Chini, L. P., Cronin, M., Dou, X., Enyo, K., Evans, W., Falk, S., Feely, R. A., Feng, L., Ford, D. J., Gasser, T., Ghattas, J., Gkritzalis, T., Grassi, G., Gregor, L., Gruber, N., Gürses, Ö., Harris, I., Hefner, M., Heinke, J., Houghton, R. A., Hurtt, G. C., Iida, Y., Ilyina, T., Jacobson, A. R., Jain, A., Jarníková, T., Jersild, A., Jiang, F., Jin, Z., Joos, F., Kato, E., Keeling, R. F., Kennedy, D., Klein Goldewijk, K., Knauer, J., Korsbakken, J. I., Körtzinger, A., Lan, X., Lefèvre, N., Li, H., Liu, J., Liu, Z., Ma, L., Marland, G., Mayot, N., McGuire, P. C., McKinley, G. A., Meyer, G., Morgan, E. J., Munro, D. R., Nakaoka, S.-I., Niwa, Y., O'Brien, K. M., Olsen, A., Omar, A. M., Ono, T., Paulsen, M., Pierrot, D., Pocock, K., Poulter, B., Powis, C. M., Rehder, G., Resplandy, L., Robertson, E., Rödenbeck, C., Rosan, T. M., Schwinger, J., Séférian, R., Smallman, T. L., Smith, S. M., Sospedra-Alfonso, R., Sun, Q., Sutton, A. J., Sweeney, C., Takao, S., Tans, P. P., Tian, H., Tilbrook, B., Tsujino, H., Tubiello, F., van der Werf, G. R., van Ooijen, E., Wanninkhof, R., Watanabe, M., Wimart-Rousseau, C., Yang, D., Yang, X., Yuan, W., Yue, X., Zaehle, S., Zeng, J., and Zheng, B.: Global Carbon Budget 2023, Earth Syst. Sci. Data, 15, 5301–5369, https://doi.org/10.5194/essd-15-5301-2023, 2023.
Fuller, E. N., Schettler, P. D., and Giddings, J. Calvin.: New method for prediction of binary gas-phase diffusion coefficients, Ind. Eng. Chem., 58, 18–27, https://doi.org/10.1021/ie50677a007, 1966.
Gentsch, L., Sturm, P., Hammerle, A., Siegwolf, R., Wingate, L., Ogée, J., Baur, T., Plüss, P., Barthel, M., and Buchmann, N.: Carbon isotope discrimination during branch photosynthesis of Fagus sylvatica: field measurements using laser spectrometry, J. Exp. Bot., 65, 1481–1496, https://doi.org/10.1093/jxb/eru024, 2014.
Gillon, J. S. and Yakir, D.: Naturally low carbonic anhydrase activity in C4 and C3 plants limits discrimination against C18OO during photosynthesis, Plant Cell Environ., 23, 903–915, https://doi.org/10.1046/j.1365-3040.2000.00597.x, 2000.
Goldan, P. D., Fall, R., Kuster, W. C., and Fehsenfeld, F. C.: Uptake of COS by growing vegetation: A major tropospheric sink, J. Geophys. Res., 93, 14186–14192, https://doi.org/10.1029/jd093id11p14186, 1988.
Hattori, S., Toyoda, A., Toyoda, S., Ishino, S., Ueno, Y., and Yoshida, N.: Determination of the sulfur isotope ratio in carbonyl sulfide using gas chromatography/isotope ratio mass spectrometry on fragment ions 32S+, 33S+, and 34S+, Analytical chemistry, 87, 477–484, https://doi.org/10.1021/ac502704d, 2015.
Howard, A. R. and Donovan, L. A.: Helianthus Nighttime Conductance and Transpiration Respond to Soil Water But Not Nutrient Availability, Plant Physiol., 143, 145–155, https://doi.org/10.1104/pp.106.089383, 2007.
Kesselmeier, J. and Merk, L.: Exchange of carbonyl sulfide (COS) between agricultural plants and the atmosphere: Studies on the deposition of COS to peas, corn and rapeseed, Biogeochemistry, 23, https://doi.org/10.1007/bf00002922, 1993.
Kettle, A. J., Kuhn, U., von Hobe, M., Kesselmeier, J., Liss, P. S., and Andreae, M. O.: Comparing forward and inverse models to estimate the seasonal variation of hemisphere-integrated fluxes of carbonyl sulfide, Atmos. Chem. Phys., 2, 343–361, https://doi.org/10.5194/acp-2-343-2002, 2002.
Kohn, M. J.: Carbon isotope compositions of terrestrial C3 plants as indicators of (paleo)ecology and (paleo)climate, Proc. Natl. Acad. Sci. U.S.A., 107, 19691–19695, https://doi.org/10.1073/pnas.1004933107, 2010.
Kooijmans, L. M. J., Maseyk, K., Seibt, U., Sun, W., Vesala, T., Mammarella, I., Kolari, P., Aalto, J., Franchin, A., Vecchi, R., Valli, G., and Chen, H.: Canopy uptake dominates nighttime carbonyl sulfide fluxes in a boreal forest, Atmos. Chem. Phys., 17, 11453–11465, https://doi.org/10.5194/acp-17-11453-2017, 2017.
Kooijmans, L. M. J., Sun, W., Aalto, J., Erkkilä, K.-M., Maseyk, K., Seibt, U., Vesala, T., Mammarella, I., and Chen, H.: Influences of light and humidity on carbonyl sulfide-based estimates of photosynthesis, Proc. Natl. Acad. Sci. U.S.A., 116, 2470–2475, https://doi.org/10.1073/pnas.1807600116, 2019.
Kromdijk, J., Griffiths, H., and Schepers, H. E.: Can the progressive increase of C4 bundle sheath leakiness at low PFD be explained by incomplete suppression of photorespiration?, Plant Cell Environ., 33, 1935–1948, https://doi.org/10.1111/j.1365-3040.2010.02196.x, 2010.
Kubásek, J., Urban, O., and Šantrůček, J.: C4 plants use fluctuating light less efficiently than do C3 plants: a study of growth, photosynthesis and carbon isotope discrimination, Physiol. Plantarum, 149, 528–539, https://doi.org/10.1111/ppl.12057, 2013.
Kuhn, U. and Kesselmeier, J.: Environmental variables controlling the uptake of carbonyl sulfide by lichens, J. Geophys. Res., 105, 26783–26792, https://doi.org/10.1029/2000jd900436, 2000.
Lai, J., Kooijmans, L. M. J., Sun, W., Lombardozzi, D., Campbell, J. E., Gu, L., Luo, Y., Kuai, L., and Sun, Y.: Terrestrial photosynthesis inferred from plant carbonyl sulfide uptake, Nature, 634, 855–861, https://doi.org/10.1038/s41586-024-08050-3, 2024.
Lazzarin, M., Dupont, K., van Ieperen, W., Marcelis, L. F. M., and Driever, S. M.: Far-red light effects on plant photosynthesis: from short-term enhancements to long-term effects of artificial solar light, Ann. Bot.-London, 135, 589–602, https://doi.org/10.1093/aob/mcae104, 2025.
Li, M. and Jones, M. B.: CO2 and O2 transport in the aerenchyma of Cyperus papyrus L., Aquat. Bot., 52, 93–106, https://doi.org/10.1016/0304-3770(95)00484-h, 1995.
Ma, J., Kooijmans, L. M. J., Cho, A., Montzka, S. A., Glatthor, N., Worden, J. R., Kuai, L., Atlas, E. L., and Krol, M. C.: Inverse modelling of carbonyl sulfide: implementation, evaluation and implications for the global budget, Atmos. Chem. Phys., 21, 3507–3529, https://doi.org/10.5194/acp-21-3507-2021, 2021.
Maignan, F., Abadie, C., Remaud, M., Kooijmans, L. M. J., Kohonen, K.-M., Commane, R., Wehr, R., Campbell, J. E., Belviso, S., Montzka, S. A., Raoult, N., Seibt, U., Shiga, Y. P., Vuichard, N., Whelan, M. E., and Peylin, P.: Carbonyl sulfide: comparing a mechanistic representation of the vegetation uptake in a land surface model and the leaf relative uptake approach, Biogeosciences, 18, 2917–2955, https://doi.org/10.5194/bg-18-2917-2021, 2021.
Maseyk, K., Berry, J. A., Billesbach, D., Campbell, J. E., Torn, M. S., Zahniser, M., and Seibt, U.: Sources and sinks of carbonyl sulfide in an agricultural field in the Southern Great Plains, Proc. Natl. Acad. Sci. U.S.A., 111, 9064–9069, https://doi.org/10.1073/pnas.1319132111, 2014.
Miner, G. L. and Bauerle, W. L.: Seasonal variability of the parameters of the Ball–Berry model of stomatal conductance in maize (Zea mays L.) and sunflower (Helianthus annuus L.) under well-watered and water-stressed conditions, Plant Cell Environ., 40, 1874–1886, https://doi.org/10.1111/pce.12990, 2017.
Montzka, S. A., Calvert, P., Hall, B. D., Elkins, J. W., Conway, T. J., Tans, P. P., and Sweeney, C.: On the global distribution, seasonality, and budget of atmospheric carbonyl sulfide (COS) and some similarities to CO2, J. Geophys. Res., 112, https://doi.org/10.1029/2006jd007665, 2007.
Pathirana, S. L., Van Der Veen, C., Popa, M. E., and Röckmann, T.: An analytical system for stable isotope analysis on carbon monoxide using continuous-flow isotope-ratio mass spectrometry. Atmospheric Measurement Techniques, 8, 5315–5324, https://doi.org/10.5194/amt-8-5315-2015, 2015.
Pengelly, J. J. L., Sirault, X. R. R., Tazoe, Y., Evans, J. R., Furbank, R. T., and von Caemmerer, S.: Growth of the C4 dicot Flaveria bidentis: photosynthetic acclimation to low light through shifts in leaf anatomy and biochemistry, J. Exp. Bot., 61, 4109–4122, https://doi.org/10.1093/jxb/erq226, 2010.
Plowman, A. B.: The Comparative Anatomy and Phylogeny of the Cyperaceae, Ann. Bot.-London, os-20, 1–33, https://doi.org/10.1093/oxfordjournals.aob.a089079, 1906.
Protoschill-Krebs, G. and Kesselmeier, J.: Enzymatic Pathways for the Consumption of Carbonyl Sulphide (COS) by Higher Plants*, Bot. Acta, 105, 206–212, https://doi.org/10.1111/j.1438-8677.1992.tb00288.x, 1992.
Protoschill-Krebs, G., Wilhelm, C., and Kesselmeier, J.: Consumption of carbonyl sulphide (COS) by higher plant carbonic anhydrase (CA), Atmos. Environ., 30, 3151–3156, https://doi.org/10.1016/1352-2310(96)00026-x, 1996.
Remaud, M., Chevallier, F., Maignan, F., Belviso, S., Berchet, A., Parouffe, A., Abadie, C., Bacour, C., Lennartz, S., and Peylin, P.: Plant gross primary production, plant respiration and carbonyl sulfide emissions over the globe inferred by atmospheric inverse modelling, Atmos. Chem. Phys., 22, 2525–2552, https://doi.org/10.5194/acp-22-2525-2022, 2022.
Sandoval-Soto, L., Stanimirov, M., von Hobe, M., Schmitt, V., Valdes, J., Wild, A., and Kesselmeier, J.: Global uptake of carbonyl sulfide (COS) by terrestrial vegetation: Estimates corrected by deposition velocities normalized to the uptake of carbon dioxide (CO2), Biogeosciences, 2, 125–132, https://doi.org/10.5194/bg-2-125-2005, 2005.
Seibt, U., Wingate, L., Berry, J. A., and Llloyd, J.: Non-steady state effects in diurnal 18O discrimination by Picea sitchensis branches in the field, Plant Cell Environ., 29, 928–939, https://doi.org/10.1111/j.1365-3040.2005.01474.x, 2006.
Spielmann, F. M., Hammerle, A., Kitz, F., Gerdel, K., Alberti, G., Peressotti, A., Delle Vedove, G., and Wohlfahrt, G.: On the Variability of the Leaf Relative Uptake Rate of Carbonyl Sulfide Compared to Carbon Dioxide: Insights from a Paired Field Study with Two Soybean Varieties, Agri. Forest Meteorol., https://doi.org/10.2139/ssrn.4357150, 2023.
Stimler, K., Montzka, S. A., Berry, J. A., Rudich, Y., and Yakir, D.: Relationships between carbonyl sulfide (COS) and CO2 during leaf gas exchange, New Phytologist, 186, 869–878, https://doi.org/10.1111/j.1469-8137.2010.03218.x, 2010.
Stimler, K., Berry, J. A., Montzka, S. A., and Yakir, D.: Association between Carbonyl Sulfide Uptake and 18Δ during Gas Exchange in C3 and C4 Leaves, Plant Physiol., 157, 509–517, https://doi.org/10.1104/pp.111.176578, 2011.
Stimler, K., Berry, J. A., and Yakir, D.: Effects of Carbonyl Sulfide and Carbonic Anhydrase on Stomatal Conductance, Plant Physiol., 158, 524–530, https://doi.org/10.1104/pp.111.185926, 2012.
Sun, W., Berry, J. A., Yakir, D., and Seibt, U.: Leaf relative uptake of carbonyl sulfide to CO2 seen through the lens of stomatal conductance–photosynthesis coupling, New Phytol., 235, 1729–1742, https://doi.org/10.1111/nph.18178, 2022.
Sun, W., Maseyk, K., Lett, C., and Seibt, U.: Restricted internal diffusion weakens transpiration–photosynthesis coupling during heatwaves: Evidence from leaf carbonyl sulphide exchange, Plant Cell Environ., 47, 1813–1833, https://doi.org/10.1111/pce.14840, 2024.
Tezara, W., Driscoll, S., and Lawlor, D. W.: Partitioning of photosynthetic electron flow between CO2 assimilation and O2 reduction in sunflower plants under water deficit, Photosynthetica, 46, https://doi.org/10.1007/s11099-008-0020-1, 2008.
Ubierna, N., Sun, W., Kramer, D. M., and Cousins, A. B.: The efficiency of C4 photosynthesis under low light conditions in Zea mays, Miscanthus x giganteus and Flaveria bidentis, Plant Cell Environ., 36, 365–381, https://doi.org/10.1111/j.1365-3040.2012.02579.x, 2013.
Vesala, T., Kohonen, K.-M., Kooijmans, L. M. J., Praplan, A. P., Foltýnová, L., Kolari, P., Kulmala, M., Bäck, J., Nelson, D., Yakir, D., Zahniser, M., and Mammarella, I.: Long-term fluxes of carbonyl sulfide and their seasonality and interannual variability in a boreal forest, Atmos. Chem. Phys., 22, 2569–2584, https://doi.org/10.5194/acp-22-2569-2022, 2022.
von Caemmerer, S. and Farquhar, G. D.: Some relationships between the biochemistry of photosynthesis and the gas exchange of leaves, Planta, 153, 376–387, https://doi.org/10.1007/bf00384257, 1981.
Wehr, R. and Saleska, S. R.: An improved isotopic method for partitioning net ecosystem–atmosphere CO2 exchange, Agr. Forest Meteorol., 214–215, 515–531, https://doi.org/10.1016/j.agrformet.2015.09.009, 2015.
Wehr, R., Commane, R., Munger, J. W., McManus, J. B., Nelson, D. D., Zahniser, M. S., Saleska, S. R., and Wofsy, S. C.: Dynamics of canopy stomatal conductance, transpiration, and evaporation in a temperate deciduous forest, validated by carbonyl sulfide uptake, Biogeosciences, 14, 389–401, https://doi.org/10.5194/bg-14-389-2017, 2017.
Whelan, M. E., Lennartz, S. T., Gimeno, T. E., Wehr, R., Wohlfahrt, G., Wang, Y., Kooijmans, L. M. J., Hilton, T. W., Belviso, S., Peylin, P., Commane, R., Sun, W., Chen, H., Kuai, L., Mammarella, I., Maseyk, K., Berkelhammer, M., Li, K.-F., Yakir, D., Zumkehr, A., Katayama, Y., Ogée, J., Spielmann, F. M., Kitz, F., Rastogi, B., Kesselmeier, J., Marshall, J., Erkkilä, K.-M., Wingate, L., Meredith, L. K., He, W., Bunk, R., Launois, T., Vesala, T., Schmidt, J. A., Fichot, C. G., Seibt, U., Saleska, S., Saltzman, E. S., Montzka, S. A., Berry, J. A., and Campbell, J. E.: Reviews and syntheses: Carbonyl sulfide as a multi-scale tracer for carbon and water cycles, Biogeosciences, 15, 3625–3657, https://doi.org/10.5194/bg-15-3625-2018, 2018.
Wingate, L., Seibt, U., Moncrieff, J. B., Jarvis, P. G., and Lloyd, J.: Variations in 13C discrimination during CO2 exchange by Picea sitchensis branches in the field, Plant Cell Environ., 30, 600–616, https://doi.org/10.1111/j.1365-3040.2007.01647.x, 2007.
Wingate, L., Ogée, J., Burlett, R., Bosc, A., Devaux, M., Grace, J., Loustau, D., and Gessler, A.: Photosynthetic carbon isotope discrimination and its relationship to the carbon isotope signals of stem, soil and ecosystem respiration, New Phytologist, 188, 576–589, https://doi.org/10.1111/j.1469-8137.2010.03384.x, 2010.
Wohlfahrt, G., Brilli, F., Hörtnagl, L., Xu, X., Bingemer, H., Hansel, A., and Loreto, F.: Carbonyl sulfide (COS) as a tracer for canopy photosynthesis, transpiration and stomatal conductance: potential and limitations, Plant Cell Environ., 35, 657–667, https://doi.org/10.1111/j.1365-3040.2011.02451.x, 2012.
Wohlfahrt, G., Hammerle, A., Spielmann, F. M., Kitz, F., and Yi, C.: Novel estimates of the leaf relative uptake rate of carbonyl sulfide from optimality theory, Biogeosciences Discussions, 1–13, https://doi.org/10.5194/bg-20-589-2023, 2022.
Yakir, D.: Oxygen-18 of leaf water: a crossroad for plant-associated isotopic signals, in: Stable isotopes: integration of biological, ecological and geochemical processes, edited by: Griffiths, H., BIOS Scientific Publishers, Oxford, 147–188, https://www.taylorfrancis.com/chapters/edit/10.1201/ 9781003076865-10/oxygen-18-leaf-water-crossroad-plant-associated-isotopic-signals-dan-yakir (last access: 20 December 2024), 1998.
- Abstract
- Introduction
- Methods
- Results and Discussion
- Conclusions and perspectives
- Appendix A: Additional figures
- Appendix B: Gas exchange calculations for CO2 and COS
- Appendix C: Overview of CO34S plant isotope discrimination data
- Data availability
- Author contributions
- Competing interests
- Disclaimer
- Acknowledgements
- Financial support
- Review statement
- References