the Creative Commons Attribution 4.0 License.
the Creative Commons Attribution 4.0 License.
 | 29 Oct 2025
Subsurface CO2 dynamics in a temperate karst system reveal complex seasonal and spatial variations
Marc Luetscher
Thomas Laemmel
Anna Harrison
Sönke Szidat
Franziska A. Lechleitner
Understanding the carbon cycle of the terrestrial critical zone, extending from the tree canopy to the aquifer, is crucial for accurate quantification of its total carbon storage and for modelling terrestrial carbon stock responses to climate change. Caves and their catchments offer a natural framework to sample and analyse carbon in unsaturated zone reservoirs across various spatial and temporal scales. In this study, we analyse the concentration, stable carbon isotopic ratio (δ13C), and radiocarbon (14C) compositions of CO2 from the atmosphere, boreholes (0.5 to 5 m depth), and cave sampled every 2 months over 2 years at Milandre cave in northern Switzerland. High concentrations of up to 35 000 ppmV CO2 are measured in the boreholes. The δ13C values of CO2 in the boreholes reflect the δ13C of C3 plants (∼ −26 ‰), which dominate the catchment ecosystem. Shallow meadow boreholes host older CO2 in winter and modern CO2 in summer, while forest ecosystems consistently export modern CO2 (F14C = ∼ 1) to the unsaturated zone. Cave CO2 concentrations exceed atmospheric levels and are diluted by temperature-driven seasonal ventilation. Keeling plot intercepts indicate that the cave CO2, which mixes with atmospheric CO2, is younger in summer (F14C = 0.94) and older in winter (F14C = 0.88), with a δ13C consistent with the C3-plant-dominated catchment. Mixing models utilizing drip water dissolved inorganic carbon 14C suggest that varying carbonate dissolution and degassing dynamics do not explain the F14C variation and concurrent δ13C stability of the mixing endmember. Rather, contributions from aged carbon reservoirs in the deeper unsaturated zone are likely. This study provides valuable insights into CO2 source dynamics and cycling within the karstic critical zone, highlighting the impact of seasonal variations and ecological factors on downward carbon export from terrestrial ecosystems.
- Article
(7054 KB) - Full-text XML
- BibTeX
- EndNote


Within the context of current and future climate change, investigations into the response of critical zone carbon pools to rising temperatures and changing hydroclimatic conditions are crucial (Brantley et al., 2007). Recent studies have specifically highlighted the unsaturated zone as a potentially important but poorly constrained reservoir of gaseous CO2 (Mattey et al., 2016; Noronha et al., 2015; Keller, 2019; Stewart et al., 2022). Estimates suggest that between 2 and 53 PgC could be present in the form of CO2 in the unsaturated zone globally (Baldini et al., 2018). This carbon is particularly vulnerable to changes in the water table level, whereby rises may easily result in the rapid release of CO2 into the atmosphere (Baldini et al., 2018). Despite its importance, comprehensive assessments integrating spatial and temporal variability of shallow subsurface CO2 remain scarce.
Understanding unsaturated zone CO2 dynamics is complicated by the different sources of carbon contributing to the subsurface reservoir. The CO2 present in the unsaturated zone is often referred to as ground air and was first defined as CO2 produced by microbial oxidation of organic material which was transported from the surface (Atkinson, 1977). However, ground air can also refer more generally to high CO2 concentrations in the subsurface, without linking its presence to a particular source. Early evidence for the presence of a ground air reservoir was the observation of high CO2 concentrations found in deep cave passages with poor connection to the catchment surface, suggesting an endogenous source of CO2 (McDonough et al., 2016). The age profile of this high-concentration CO2 reservoir, however, varies by site, suggesting significant variability in its source and processing. CO2 reservoirs of a lower F14C, corresponding to an older age, have been reported (Breecker et al., 2012; Noronha et al., 2015; Mattey et al., 2016; Bergel et al., 2017), as well as modern subsurface CO2 pools, likely derived from ecosystem respiration of recently fixed carbon (Campeau et al., 2019; Tune et al., 2020). Consequently, the primary sources of subsurface CO2 generally considered are (1) the outside atmosphere (Kukuljan et al., 2021), (2) catchment soil and vegetation respiration (Breecker et al., 2012; Li et al., 2024), (3) microbial respiration in the unsaturated zone (Mattey et al., 2016; Ravn et al., 2020), (4) carbon dissolved from the carbonate bedrock (Milanolo and Gabrovšek, 2015), and (5) volcanic and metamorphic hydrothermal input (Chiodini et al., 2008; Girault et al., 2018).
Carbon isotope analysis of CO2 can be used to differentiate the contributing sources to the subsurface gas mixture. Specifically, the δ13C of CO2 in the unsaturated zone can provide information about the influence of biological fractionation by overlying catchment vegetation and microbial respiration and the influence of carbonate dissolution and subsequent degassing (Breecker, 2017; McDonough et al., 2016). In addition, due to the contrast between the 14C content of biospheric carbon, which ranges from bomb-peak-enriched to > 10 000 years old, and carbonate rock, which is typically radiocarbon-dead, 14C measurements of subsurface CO2 can provide information for both source apportionment and carbon turnover rates in the terrestrial subsurface (Noronha et al., 2015).
Though there has been extensive work investigating unsaturated zone CO2 reservoirs, questions remain about the concentration, composition, and sources of ground air on temporal and spatial scales. This study seeks to address this gap by presenting a detailed assessment of CO2 concentrations and isotopic compositions over 2 years within the Milandre cave karst system in Switzerland. We aim to (1) determine the relationships between pCO2, δ13CO2, and 14CO2 in Milandre cave and its catchment; (2) assess the effect of seasonality on CO2 concentration and isotopic characteristics; and (3) gain insights into the provenance of CO2 and how these evolve over time.
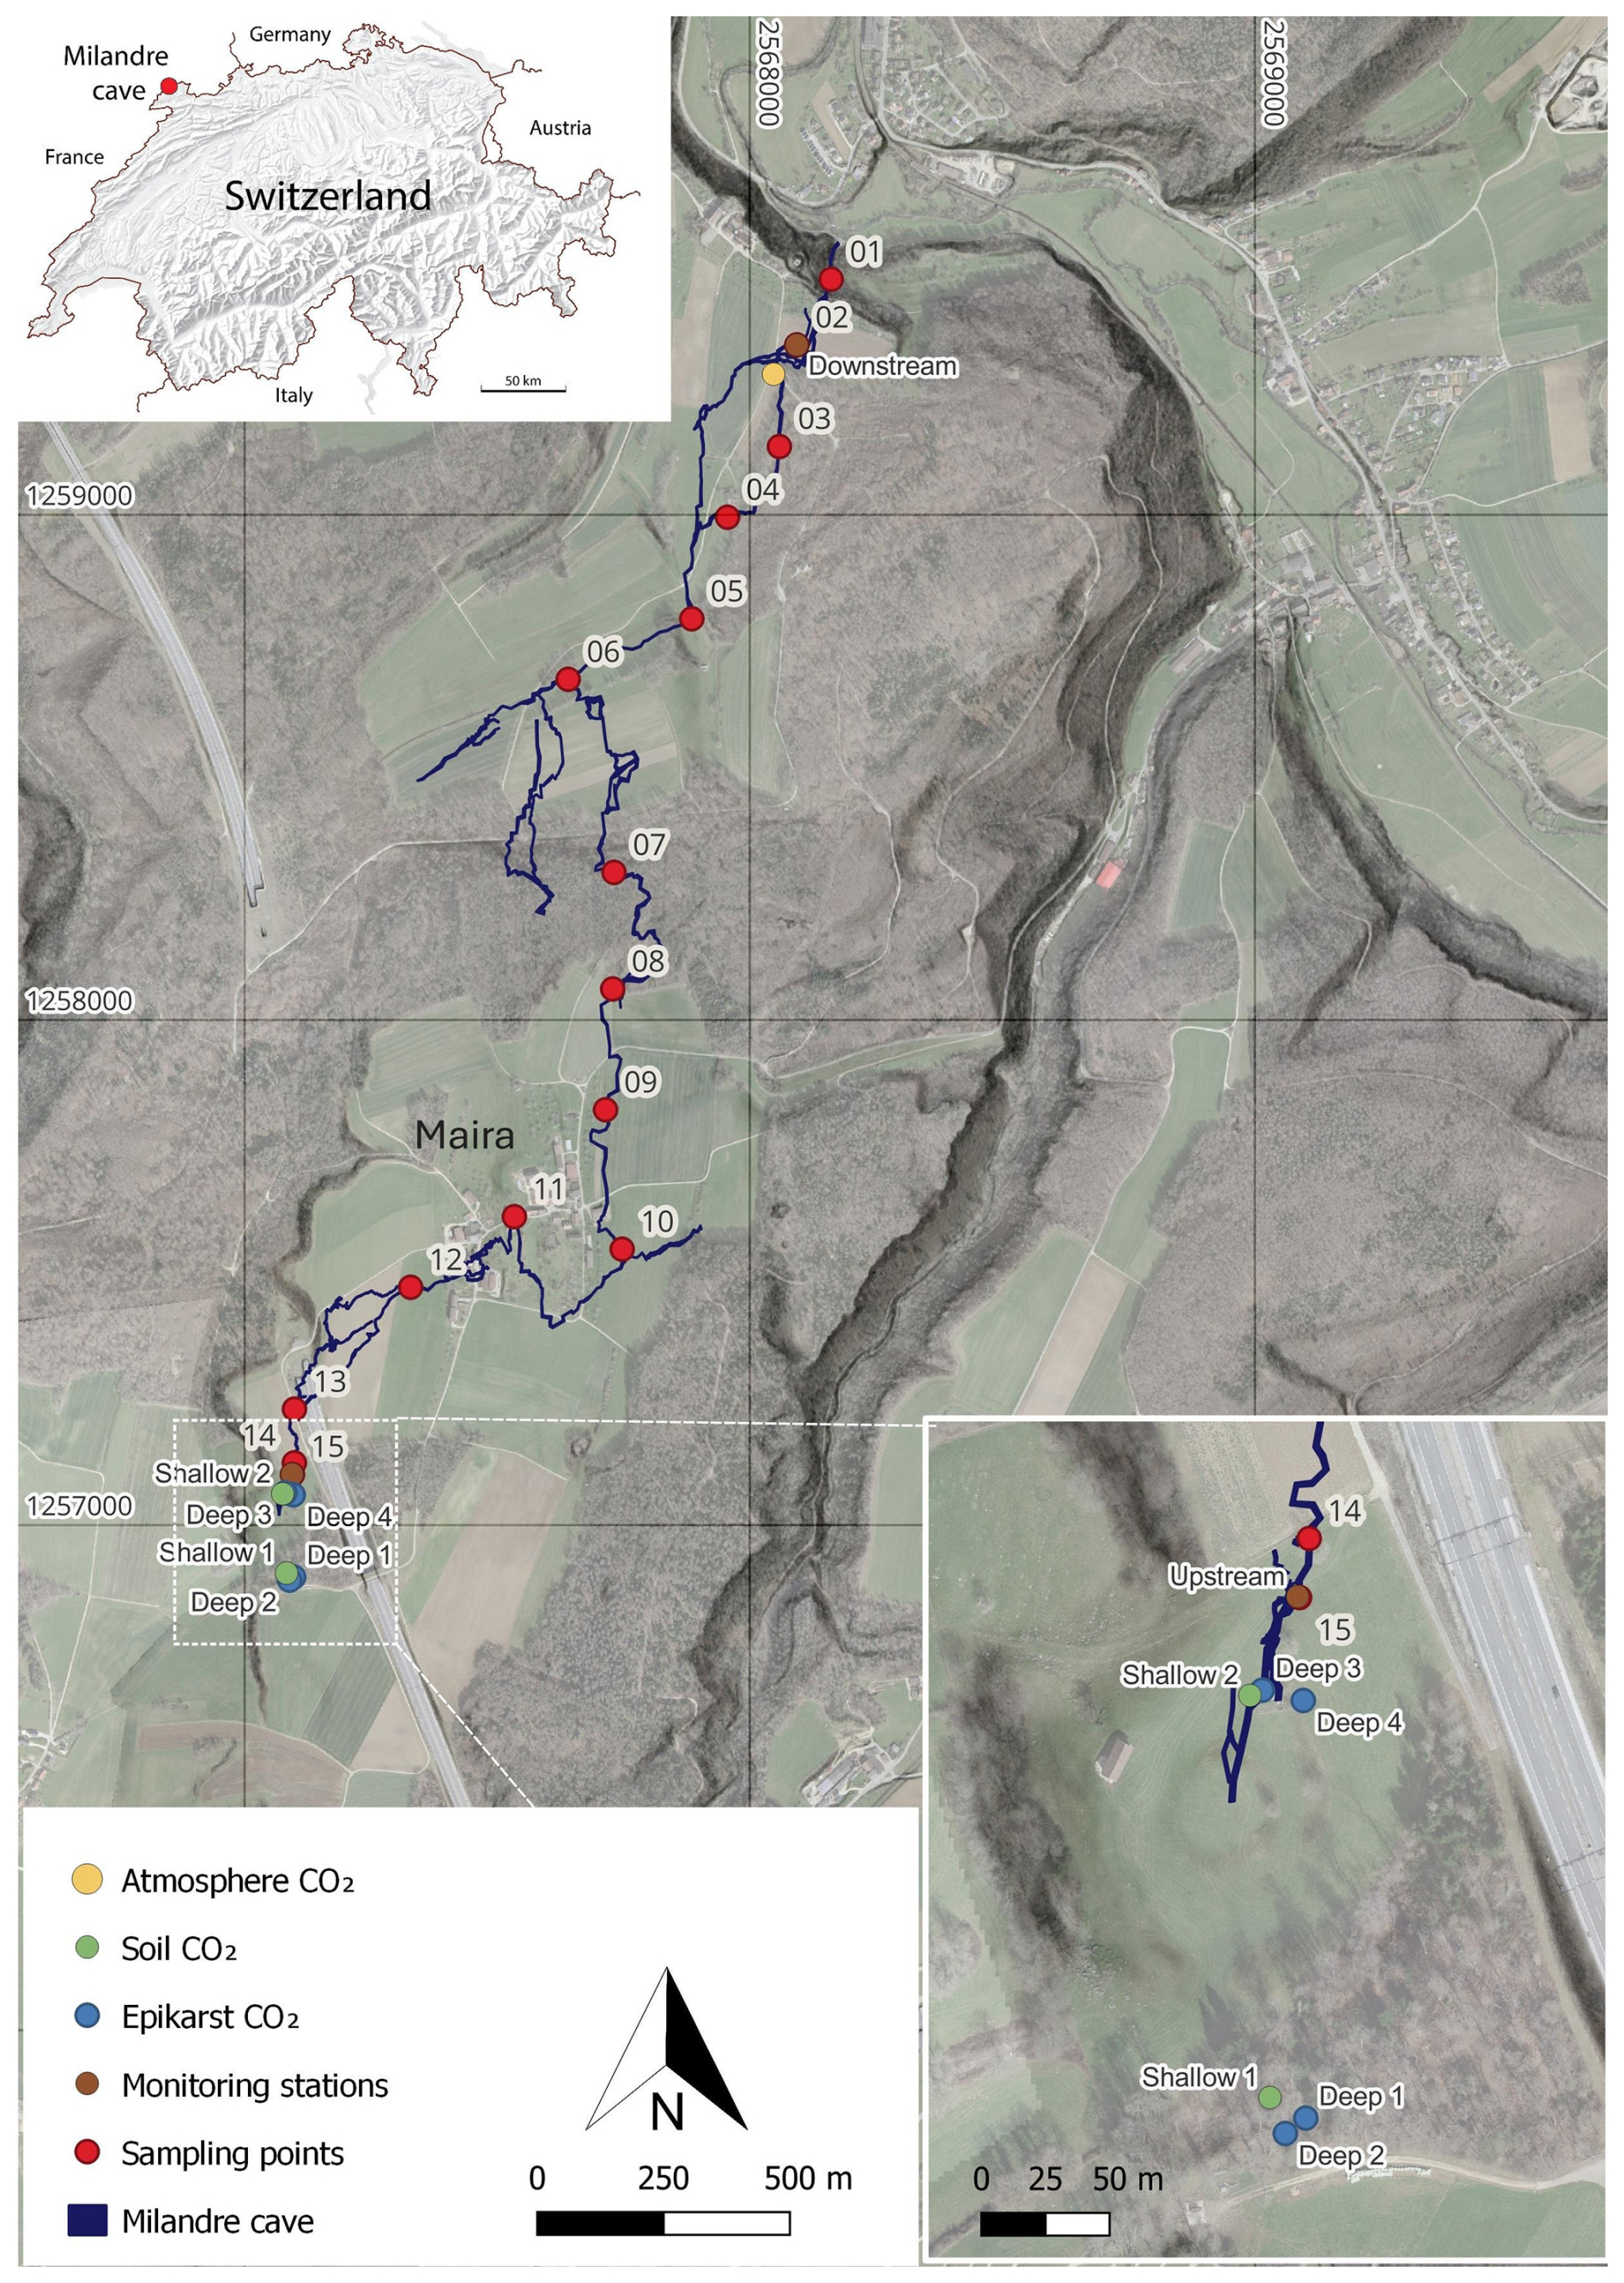
Figure 1Map of the main passages of the Milandre cave network. The locations of the atmospheric sampling (yellow), the soil (green) and unsaturated zone boreholes (blue), and the cross-trip sampling (red) are annotated. Cave survey modified from Gigon and Wenger (1986). Base map from ©swisstopo (Swisstopo, 2024).
Milandre cave (47.4852° N, 7.0161° E, 373 ) is located in the municipality of Boncourt in the Jura canton, NW Switzerland (Fig. 1). The Milandre karst structure formed within the Jura Mountains, a sub-alpine mountain range which lies laterally in a northwest–southeast direction. The cave is located within the external plateau unit of the Jura Mountains, which consists of thin subhorizontal Mesozoic limestone units that have experienced deformation which produced imbricates and strike-slip faults (Sommaruga, 2011). More specifically, the Milandre karst system formed within the Late Jurassic (Middle Oxfordian) St-Ursanne Formation, which overlies Early to Middle Oxfordian marls (Jeannin, 1998). The unsaturated zone ranges between 40 and 80 m depth. The active karst level developed in the epiphreatic zone, with the underlying phreatic zone extending for ∼ 20 m to reach the low-permeability Lower Oxfordian marls (Liesberg Mb) (Perrin et al., 2003). The cave is formed over 2.7 km, with 10.5 km of galleries forming along N–S-oriented fractures. The Milandre river flows for 4.5 km in a northerly direction in the lower part of the cave and exits via the perennial Saivu spring where it joins the Allaine River and the Bame temporary spring. Clays and silts, deposited during hydraulic backflooding, are particularly present in the downstream part of Milandre cave where they contribute to the sediment load during mild flood events. In contrast, during medium to intense flow, allochthonous sediment transport is often associated with higher microbial concentrations (Vuilleumier et al., 2021). Quantifying the contribution of microbial respiration to the cave carbon cycle was beyond the scope of this study and should be addressed by future research. The Milandre river drains a catchment area of approximately 13 km2 (Perrin et al., 2003). There is a series of dolines in the catchment area which form depressions ∼ 10 to 20 m deep in the landscape. Notably, one doline is located in the meadow partially covering the upstream section of Milandre cave (Fig. 1).
Over the past 40 years, land use in the catchment area has been dominated by farmland (37 %), forest (36 %), and meadows (12 %) as estimated by aerial photo analysis (Jeannin et al., 2016). The crops grown primarily include maize and tobacco, two C4 plants. Long-term land use analysis shows that farmland has decreased slightly in this area and special infrastructures have increased due to the construction of a motorway that overlies part of the cave. The soils of the area are influenced by the ecosystem that is overlying it. Forest soils are shallow Leptosols (< 10 cm deep) that are rich in fragments of the carbonate bedrock. The shallow forest soils transition into deeper (up to ∼ 80 cm) organic-rich Histosols in the meadows, particularly in the dolines. The roots from the forest vegetation likely extend into the epikarst and unsaturated zone; however, no roots are visible within the cave itself.
Table 1Summary of the boreholes sampled in Milandre cave catchment noting sample depth, number of sampling lines, classification in soil/unsaturated zone, and ecosystem cover type. The IDs are the names given to the boreholes for this study and are concurrent with the supplementary data provided. SISKA (Swiss Institute for Speleology and Karst Studies) IDs refer to the original names of the boreholes at the time of installation.
The Jura region experiences a marine west coast, warm summer climate (Cfb classification) (Kottek et al., 2006). Daily temperature measurements from the Fahy MeteoSwiss weather station located ∼ 9.5 km SW from Milandre cave show a mean temperature of 9.4 °C (1991 to 2020). Temperature seasonality is strong, with monthly mean temperatures fluctuating between a minimum of −1.2 °C in January and a maximum of 18.2 °C in July from 1991 to 2020 (MeteoSwiss, 2024). In contrast, temperatures within the cave remain almost constant year-round and vary between 10.3 and 11.0 °C (Affolter et al., 2020). The temperature difference between the outside and in-cave temperature drives dynamic ventilation on seasonal scales (Garagnon et al., 2022). Regional meteoric precipitation shows a mean of 1046 mm yr−1. Monthly precipitation data indicate that precipitation in this area is well dispersed throughout the year (MeteoSwiss, 2024). Monitoring of tritium (3H) in stalagmite drip water was used to estimate the residence time of seepage water at ∼ 5.5 to 6.6 years (Affolter et al., 2020).
3.1 Gas sampling setup
All gas samples were taken every 2 months from December 2021 to January 2024. The samples were collected in 5 L sampling bags (Cali-5-Bond, Calibrated Instruments, USA) using a handheld pump. The gas was dried through a glass tube filled with granular magnesium perchlorate (∼ 83 % purity, Supelco, Germany) to reduce the effects of humidity, which may affect the isotopic composition of the sample. The sampling setup and procedure were identical for all gas samples. The CO2 concentration was monitored during line flushing using a nondispersive infrared (NDIR) CO2 sensor (SCD30, Sensirion, Switzerland) to ensure accurate sampling. The magnesium perchlorate was exchanged before each sampling day. Prior to analysis, the samples were stored away from direct sunlight in cool indoor temperatures for a maximum of 6 weeks. The same bags were reused for each sampling location and were flushed with N2 gas for at least 48 h before sampling to reduce cross-contamination risks.
Atmospheric samples were collected at a defined sampling site above the cave (Fig. 1). Before sampling, the line was manually flushed for 1 min. To reduce the risk of breath contamination, the sampling setup was attached to 3 m long Teflon tubes, and samples were always taken against the airflow direction.
The unsaturated zone air was sampled from six boreholes of varying depths between 0.5 and 5 m (Table 1). Spatially, the boreholes cover a large portion of the cave's upstream hydrological catchment and are overlain by contrasting vegetation cover (mixed deciduous forest or a grass meadow) (Fig. 1, Table 1). The gas was sampled in two lines from depths of 0.5 to 0.85 m (Shallow 1), three lines from 0.6 to 1.5 m (Shallow 2), and single lines from a depth of 5 m (Deep 1, Deep 2, Deep 3, Deep 4). Due to the nature of the installation, it was not possible to assign a specific depth to the multi-line boreholes. All boreholes were drilled in 2013 and are equipped with aluminium tubes compacted by layers of gravel, bentonite, and sand. The sampling line was flushed for 1 min once attached to the borehole, and then samples were taken into the Cali-5-Bond bags. Due to the nature of the borehole installation, we assume that the samples were not taken in steady-state conditions, where the production rate of CO2 would equal the sampling rate.
Cave air was sampled in two locations within Milandre cave proximal to both entrances, Downstream (topographically lower) and Upstream (topographically higher), with the same procedure as for the atmospheric samples (Fig. 1). To gain insight into possible spatial variability within the cave, a trip through the cave across the main passage was carried out in September 2021, and 14 samples were collected (Fig. 1). The trip was taken against the direction of airflow to reduce the risk of breath contamination, from the Downstream to Upstream entrance.
3.2 Continuous O2 and CO2 concentration monitoring
Soil gas O2 and CO2 concentrations were measured continuously near Shallow 2 at 40 cm depth and recorded at 10 min intervals between April 2023 and June 2024 using a SCD-41 CO2 sensor (± 50 ppmV + 5 % of reading) (Sensirion, Switzerland) and SGX-40X O2 sensor (Amphenol SGX, Sensortech, Switzerland). Calibration was cross-checked with an independent, handheld multi-gas monitor (XAM 5600, Dräger, Germany) before installation.
3.3 CO2 concentration and δ13C analysis
The concentration of CO2 and the stable carbon isotopic composition (δ13C) in all gas samples was measured using a cavity ring-down spectrometer (CRDS) G2131-I isotopic CO2 instrument (Picarro, USA) at ETH Zurich (CO2 concentration = 0.2 ppm, δ13C = < 0.1 ‰ precision). Standard gases with known CO2 concentrations of 399.6 and 2000 ppmV CO2 in synthetic air were measured in addition to standard gases of known δ13CO2 values of −27.8 ‰ and −2.8 ‰ VPDB for offline calibration. As there was no equivalent standard gas available for high CO2 concentrations as in some samples, linearity of the concentration data produced by the CRDS is assumed. All standards and samples were measured by directly attaching the sample bags to the inlet of the CRDS that was previously fitted with a magnesium perchlorate dryer and measuring gas concentration and isotopic composition for 2 min after reaching steady state. We used the mean and standard deviation of this measurement interval for evaluation. δ13C refers to the ratio between the two stable carbon isotopes with respect to the Vienna Pee Dee Belemnite (VPDB) standard.
3.4 Radiocarbon analysis
The CO2 from each gas sample was converted into approximately 1 mg of graphite using automatic graphitization equipment (AGE, IonPlus, Switzerland) (Wacker et al., 2010a) coupled with a custom-made carbon inlet system. In this process, each sampling bag was successively attached to the inlet system, which dried the sample through a fine-grained magnesium perchlorate water trap via a vacuum line. The volume of air required to sample was calculated from the CO2 concentration of the sample, allowing the appropriate amount of CO2 to be trapped within a stainless-steel coil that was cooled by submersion in a liquid N2 bath. After trapping, the CO2 was sublimated by submerging the coil in a room-temperature water bath and then adsorbed onto a zeolite trap using helium as a carrier gas between the coil and the trap. The CO2 adsorbed onto the trap was then thermally desorbed and filled into the AGE reactor, where it was reduced to graphite with hydrogen over an iron catalyst (Wacker et al., 2010a). A modern standard of Oxalic Acid II gas (F14C = 1.3407, Oxa II, NIST SRM 4990C, HEKAL AMS Lab, Hungary) and a radiocarbon fossil reference CO2 gas (F14C = 0, CO2 ≥ 99.7 % Vol.abs, Carbagas, Switzerland) were also graphitized and used to calibrate the measurements. The resulting graphite was pressed into targets for radiocarbon analysis through AMS analysis with a MIni CArbon DAting System (MICADAS, Ionplus, Switzerland) (Synal et al., 2007; Szidat, 2020). The resultant radiocarbon data were corrected using the BATS (4.3) software (Wacker et al., 2010b). In this study the 14C content of samples will be discussed in F14C notation, which represents fraction modern (defined as the 1950 atmosphere) according to Reimer et al. (2004).
3.5 Dissolved inorganic carbon analysis
Drip water dissolved inorganic carbon (DIC) 14C was measured to constrain the DIC degassing endmember. Samples were measured over 1 year from December 2021 and December 2022 at nine drip sites focused on the actively dripping galleries near Upstream and Downstream (Fig. 1). Using a 5 mL syringe, 1 mL of drip water was collected directly from the soda straw stalactites on the cave roof to reduce fractionation effects associated with degassing. The water was injected directly into pre-cleaned Exetainer® (Round Bottom, Borosilicate, 938W, Labco Limited, UK) vials which had been flushed with helium gas and pre-spiked with 150 µL of 85 % H3PO4 (Suprapur®, 85 %, Merck KGaA, Germany). The 14C content of the DIC was measured by sampling the vial headspace using the Carbonate Handling System (CHS, Ionplus, Switzerland) and transferring the gaseous sample to the AMS using a gas handling system. Here, the CO2 was introduced to the gas ion source through the CHS at a flow of 50 mL min−1. The 14C content for each sample was measured for ∼ 60 cycles. Standard materials with a carbonate matrix of similar composition to the DIC samples were used as standards (IAEA C1 (F14C = 0) and C2 (F14C = 0.411), sodium bicarbonate (NaHCO3, Sigma Aldrich, USA) and potassium bicarbonate (KHCO3, Sigma Aldrich, USA) (both F14C = 0)).
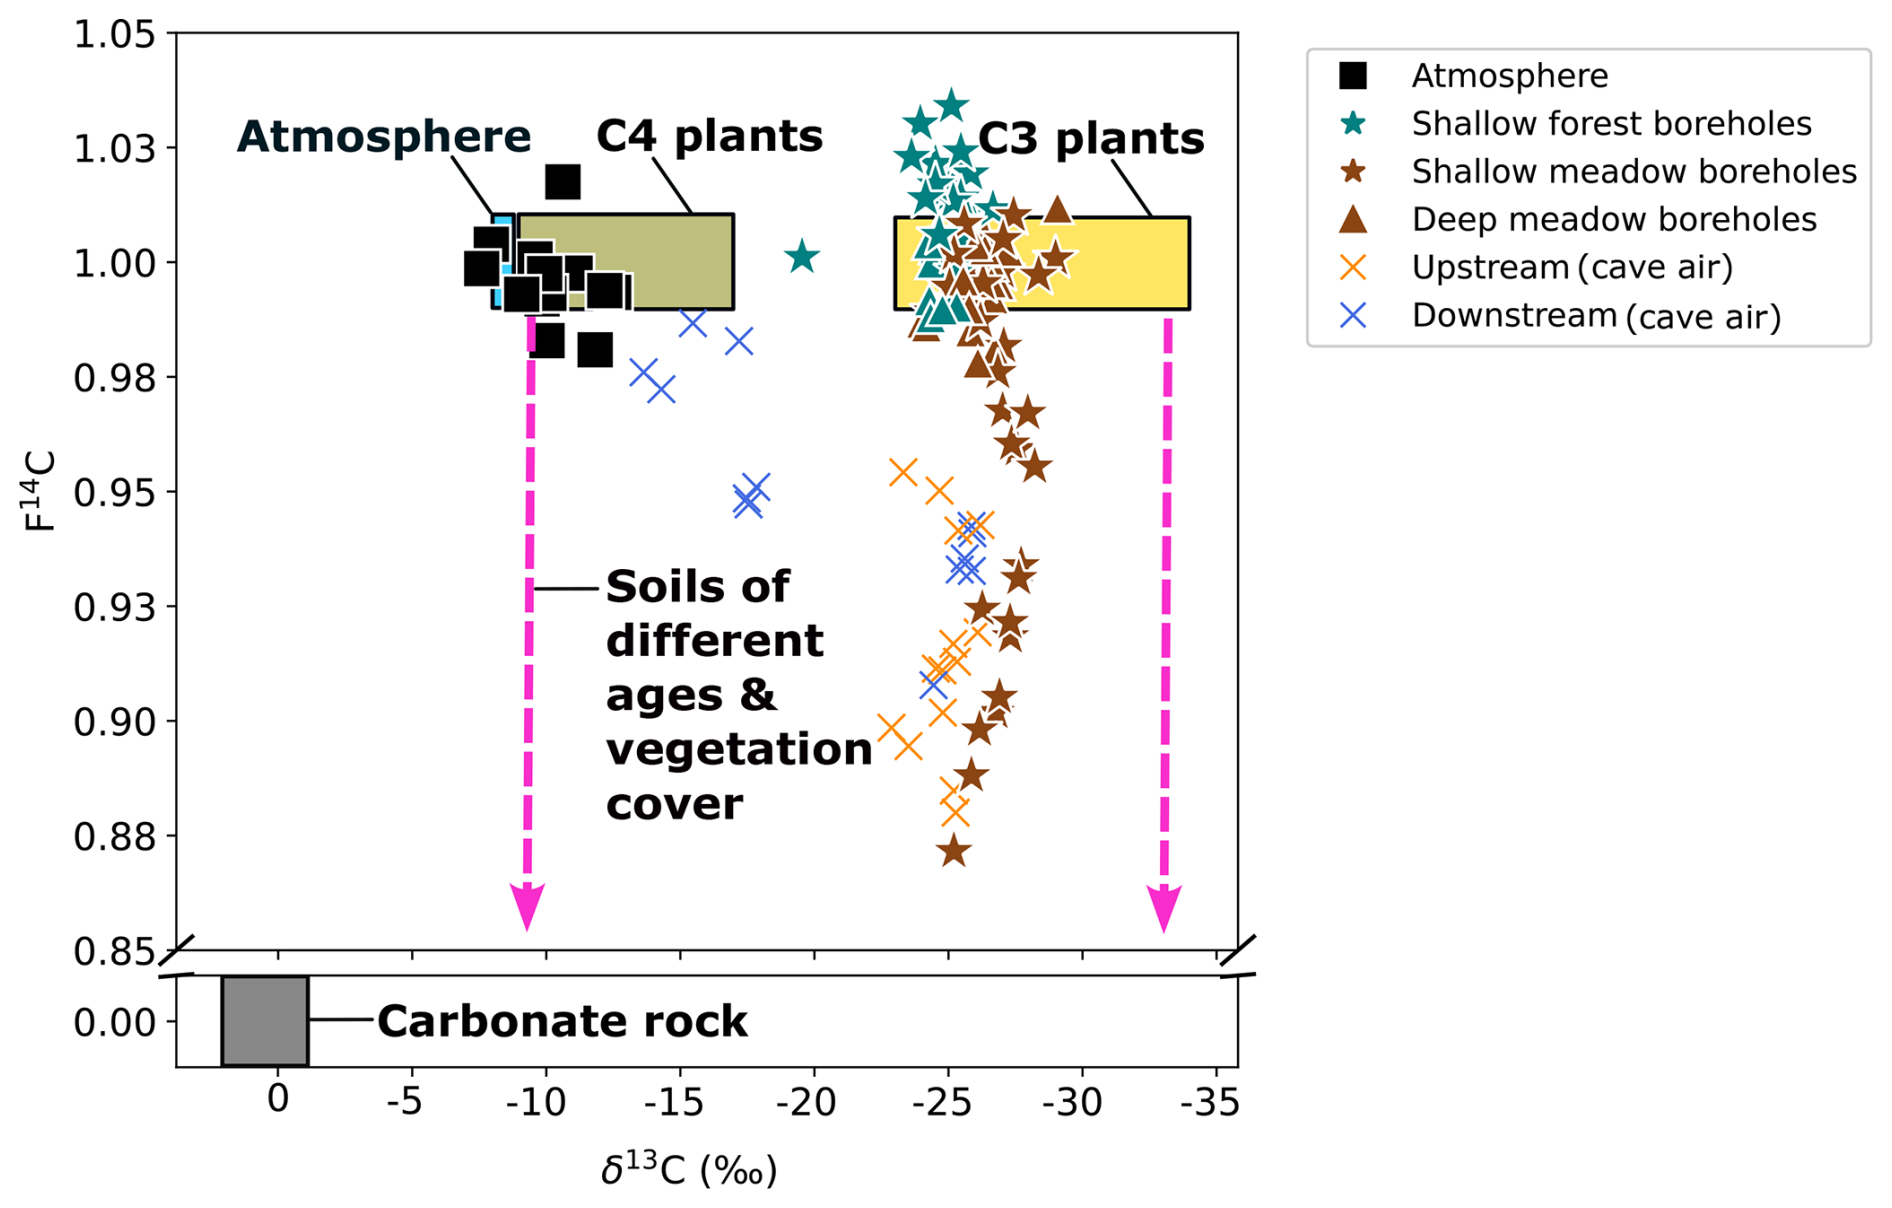
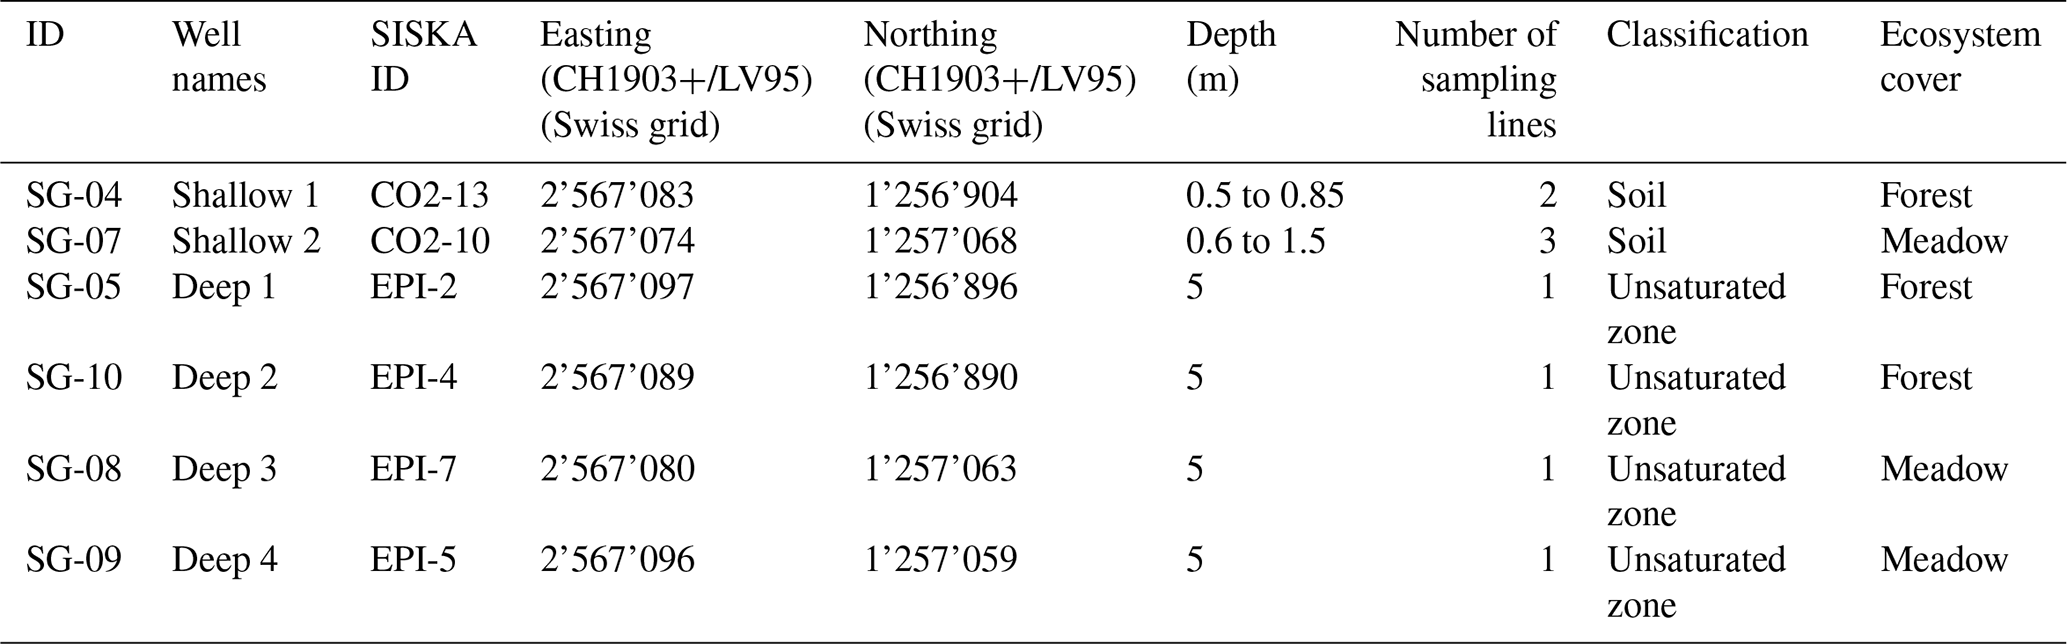
Figure 2δ13C and F14C of all gas samples over the monitoring period. The theoretical carbon reservoirs present in the system are shown with the atmosphere (blue), C3 plants (yellow), C4 plants (green), soils of various ages and compositions (pink arrows), and carbonate rock (grey).
3.6 Data analysis and statistics
All data and statistical analyses and all graphs were generated using the Python 3 programming language (Van Rossum and Drake, 2009).
Relationships between CO2 concentration, δ13C, F14C for each sample type, mean monthly temperature (MMT), and mean monthly precipitation (MMP) from Fahy weather stations were explored using Spearman's rank correlation coefficient analysis (Kokoska and Zwillinger, 2000). A significantly correlated relationship between two variables is defined by p < 0.05, with the correlation coefficient denoted by “rho” and the number of samples involved in the analysis as n.
4.1 Atmospheric CO2
The atmospheric samples had a CO2 concentration ranging from ∼ 380 ppmV (August 2023) to ∼ 485 ppmV (December 2022) with a mean of ∼ 440 ppmV. The δ13C ranged from −12.5 ‰ (February 2023) to −7.6 ‰ (August 2023) and had a mean of −10.1 ‰ (n = 17). The CO2 sampled was typically modern, though it had some fluctuation from F14C 0.98 (December 2022) to 1.02 (June 2022) and a mean of F14C 1.0 (Fig. 2).
Figure 3Maximum and minimum (a) CO2 concentration, (b) δ13C, and (c) F14C of the three soil borehole samples from Shallow 1 in the forest (green) and the two sampling lines in Shallow 2 in the meadow (brown). Summer (yellow) and winter (blue) seasons are highlighted by the coloured background. Concentrations are shown as ranges between maxima and minima as they aggregate over three sampling lines in the soil per location (Table 1).
4.2 Soil zone CO2
Soil boreholes have higher CO2 concentrations and lower δ13C compared to the atmosphere (Fig. 2). Concentrations in boreholes that sample the soil zone (Shallow 1 and Shallow 2) (Fig. 3a) vary significantly depending on sampling depth, cover type, and season. The Shallow 1 boreholes (forest) show seasonal high pCO2 in the summer months from June to October, which steadily declines during winter until it begins to rise again after April. In these boreholes CO2 concentrations vary from a maximum of ∼ 18 000 ppmV in August 2022 to a minimum in January 2024 of ∼ 1200 ppmV, with a mean of ∼ 10 700 ppmV (n = 21). The CO2 concentrations in Shallow 2 (meadow) boreholes range from ∼ 27 000 ppmV in June 2023 to ∼ 4800 ppmV in February 2023 with a mean of ∼ 9900 ppmV (n = 30).
The δ13C varies by 7.0 ‰ in shallow forest boreholes over the sampling period, ranging from a minimum of −26.7 ‰ in August 2023 to a maximum of −19.5 ‰ in January 2024 (Fig. 3b). There is ∼ 4.0 ‰ isotopic variation in the shallow meadow boreholes with a minimum of −29.0 ‰ in October 2022 and a maximum of −24.4 ‰ in August 2022. The pCO2 and δ13C are negatively correlated in both shallow forest and shallow meadow boreholes (forest: rho = −0.47, p = 0.02, n = 25. meadow: rho = −0.49, p = 0.01, n = 30), and δ13C is on average lower in shallow meadow than shallow forest boreholes.
F14C in Shallow 1 boreholes (forest) shows little annual variability and fluctuates slightly around a modern value (max = 1.03 in April 2022, min = 1.0 in June 2023) (Fig. 3c). Conversely, the Shallow 2 (meadow) boreholes show distinct annual variation in F14C, which steadily decreases from modern (1.0) in August 2022 and 2023 to a low in April 2023 and a minimum in January 2024 (0.87). The samples from the shallow forest boreholes have a positive correlation between F14C and δ13C (rho = 0.48, p = 0.02, n = 25). In the shallow meadow borehole samples, we observe a positive correlation between F14C and MMT (rho = 0.67, p = 0.001, n = 30). All other tested parameters show no significant correlations (see Appendix A).
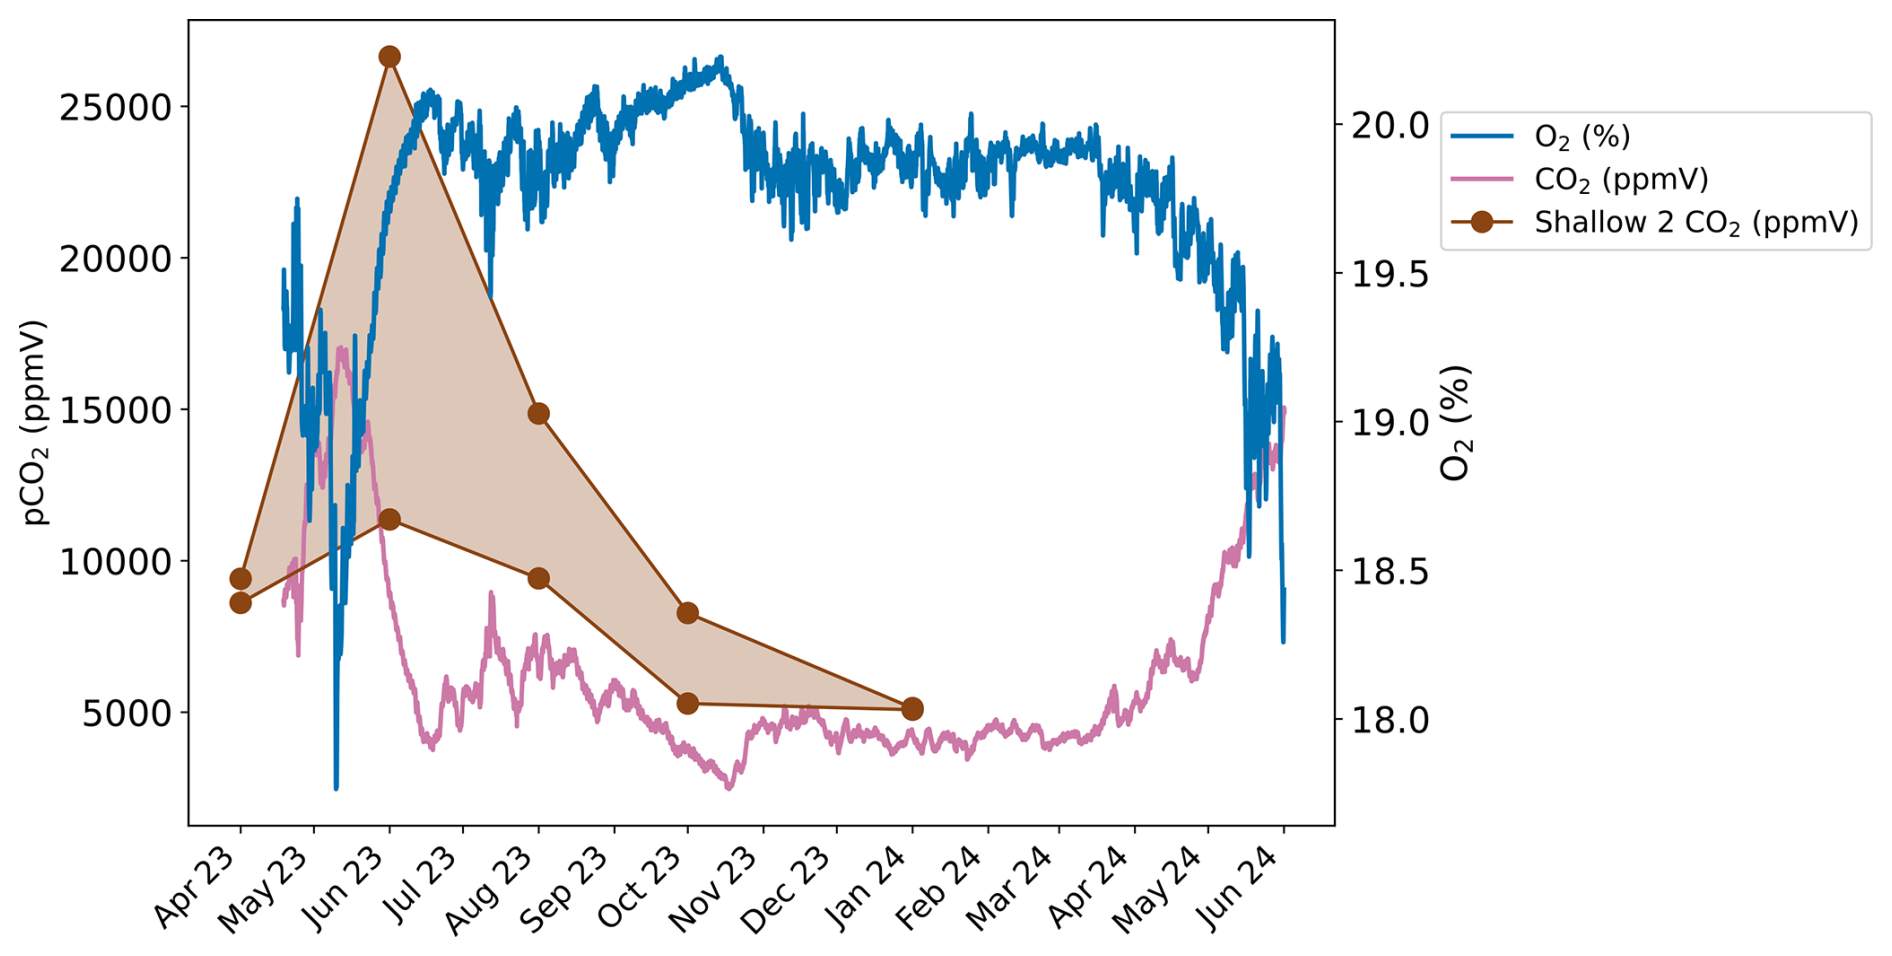
Figure 4Continuously measured CO2 (pink) and O2 (blue) concentrations from the soil zone near the Shallow 2 boreholes. CO2 concentrations from Shallow 2 are also plotted (brown).
The continuously measured O2 and CO2 concentrations near Shallow 2 in the meadow show an inverse relationship (Fig. 4). The concentrations are relatively stable throughout most of the year with higher O2 and lower CO2 concentrations. This pattern is disturbed by a sharp decrease in O2 and an increase in CO2 observed around May/June in both 2023 and 2024. These different conditions last around 1 month before returning to the typical concentrations. The O2 concentration ranges from a maximum of 20.2 % in August 2023 to a minimum of 17.8 % during a brief interval in May 2023. Conversely, the CO2 concentration peaks at ∼ 17 000 ppmV in May 2023 and is the lowest at ∼ 2500 ppmV in August 2023. The Shallow 2 boreholes also show peaks in CO2 concentration in May to June 2023 (Fig. 4).
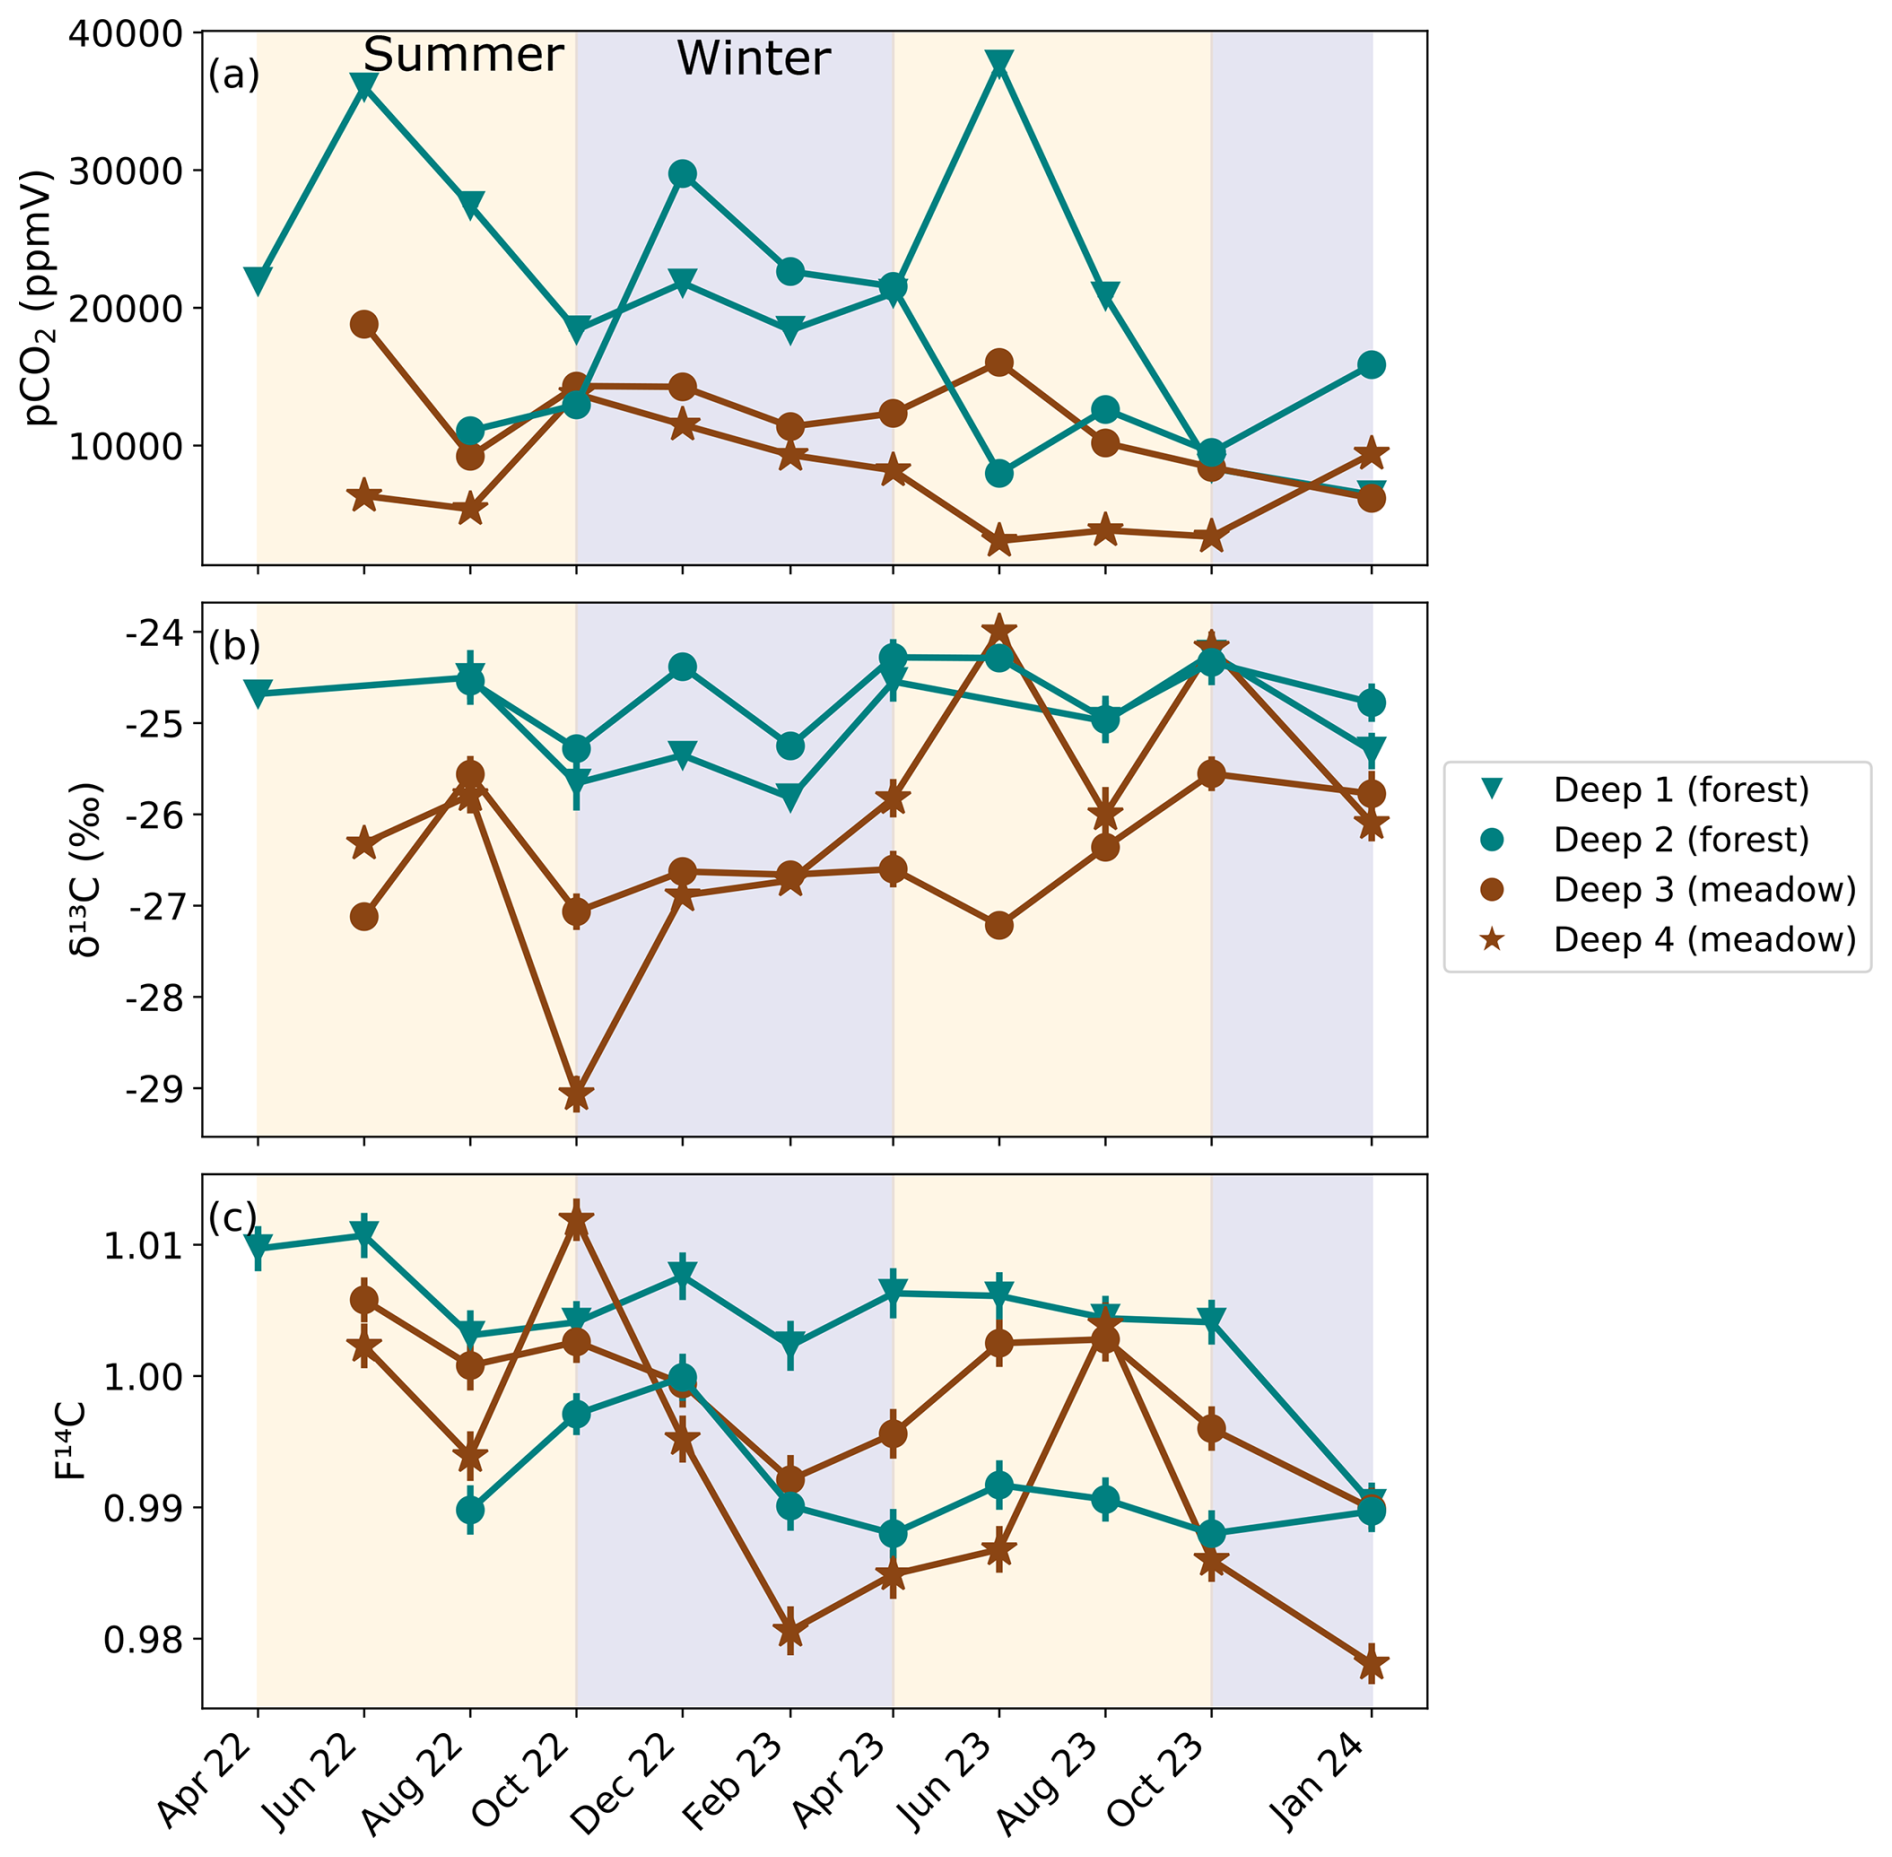
Figure 5(a) CO2 concentration, (b) δ13C and (c) F14C of unsaturated zone borehole samples from forest boreholes Deep 1 and Deep 2 (green), and meadow boreholes Deep 3 and Deep 4 (brown). Summer (yellow) and winter (blue) seasons are highlighted by the coloured background.
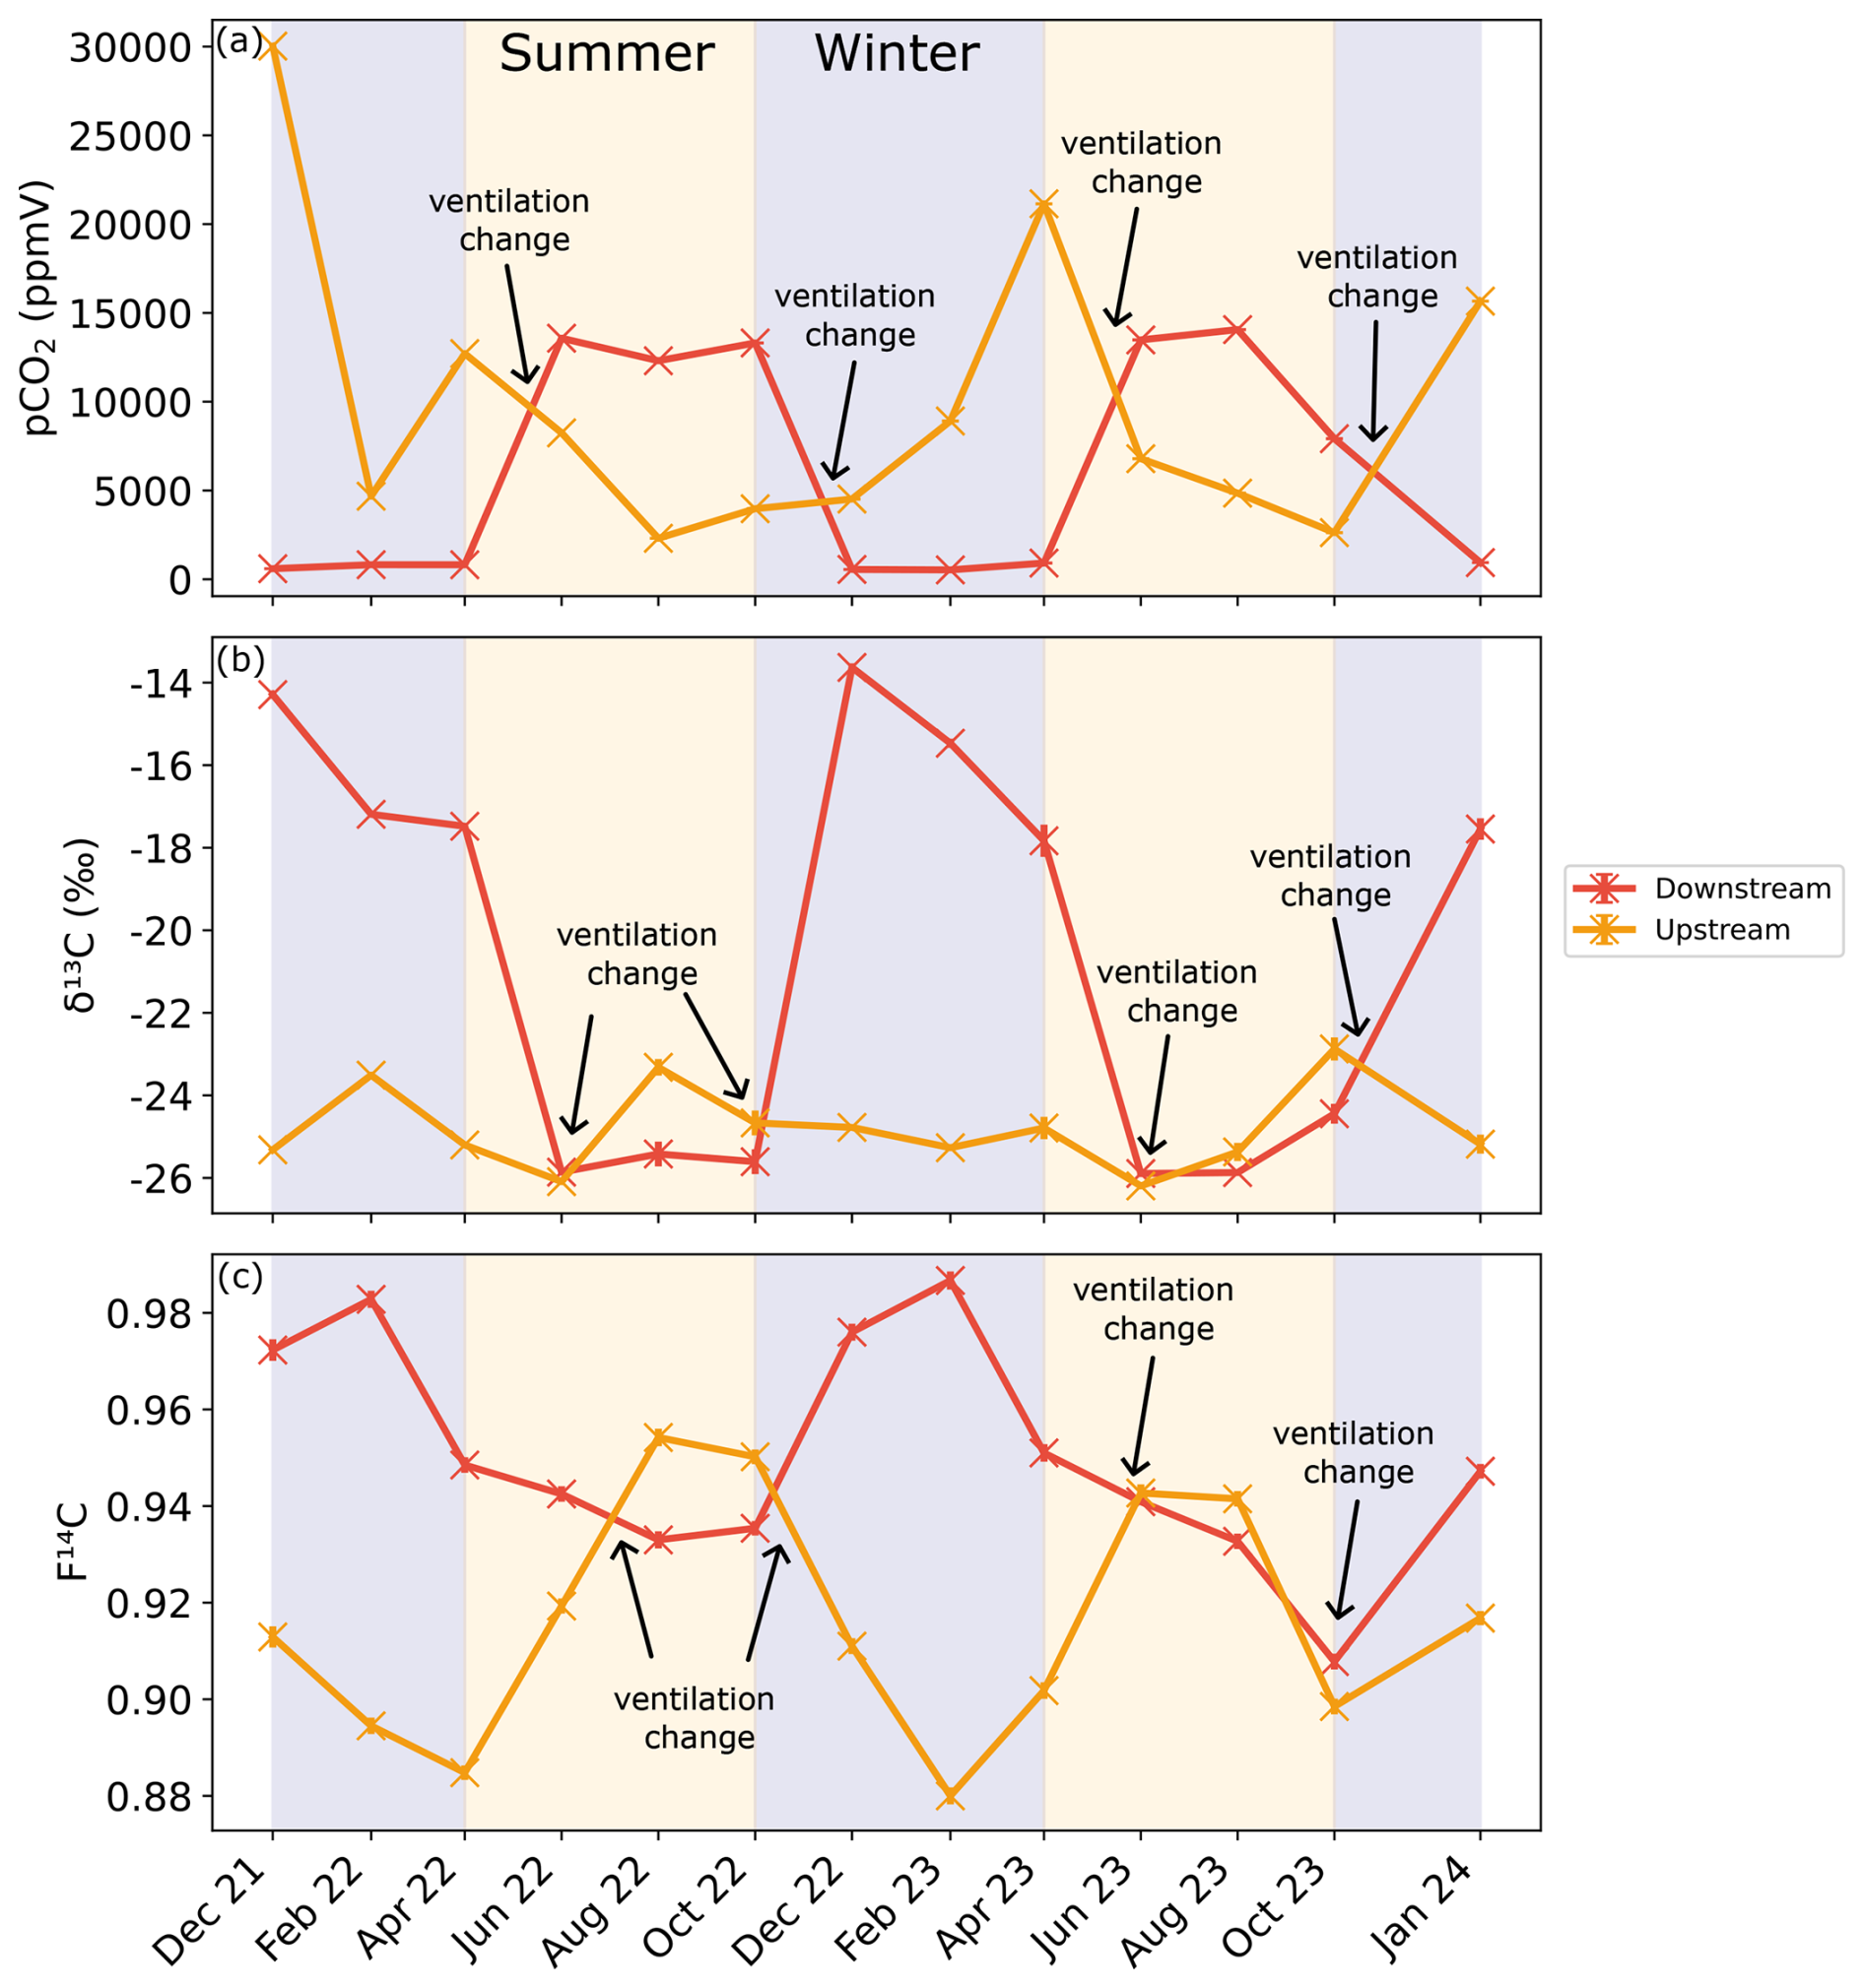
Figure 6(a) CO2 concentration as well as (b) δ13C and (c) F14C of cave air samples from the Downstream (red) and Upstream (orange) sites. Summer (yellow) and winter (blue) seasons are highlighted by the coloured background. The approximate timing of the temperature-driven ventilation direction changes is shown by the annotations.
4.3 Unsaturated zone CO2
Unsaturated zone CO2 concentrations varied widely during the sampling period but are generally very high (> 10 000 ppmV). On average, the forest boreholes Deep 1 and Deep 2 have higher concentrations than the meadow boreholes Deep 3 and Deep 4. Concentrations are generally highest in the Deep 1 borehole (forest) (Fig. 5a) with a maximum of ∼ 37 000 ppmV in June 2023 and a similarly high concentration peak in June 2022. The lowest values (∼ 21 000 ppmV) at this borehole are recorded in the winter months. Deep 2 (forest) shows an opposite trend with its highest CO2 concentrations in autumn, winter, and spring (max = ∼ 29 000 ppmV in December 2022). The lowest CO2 concentrations were measured during the summer months (min = ∼ 7900 ppmV in June 2023). There is comparatively less variability in the Deep 3 and Deep 4 boreholes (both in the meadow). In Deep 3, concentrations fluctuate from ∼ 6100 to ∼ 19 000 ppmV with no obvious seasonality. Deep 4 has higher concentrations over the winter period and lower during summer, peaking at ∼ 14 000 ppmV in October 2022 and dropping to an overall minimum of ∼ 3000 ppmV in June 2023.
The δ13C of the majority of unsaturated zone CO2 samples is very stable around ∼ −26 ‰ (Fig. 5b). Similar to the shallow boreholes, samples from deep meadow boreholes (Deep 3 and 4) have on average slightly lower δ13C values. In the meadow boreholes Deep 3 and Deep 4, the δ13C and pCO2 are negatively correlated (rho = −0.66, p = 0.001, n = 21) (see Appendix A).
The F14C of unsaturated zone CO2 samples is relatively stable throughout the sampling period, ranging from 1.01 (Deep 1, June 2022) to 0.98 (Deep 4, October 2022) (Fig. 5c). A possible seasonal pattern can be observed in the meadow boreholes (Deep 3 and Deep 4) with lower F14C values in the winter and spring months and higher F14C during summer, similar to the observation from the shallow meadow boreholes. No clear seasonal pattern is observed for Deep 1 and Deep 2. The F14C values of unsaturated zone CO2 samples are negatively correlated with their δ13C value (rho = −0.54, p = 0.01, n = 21) and positively correlated with MMT (rho = 0.53, p = 0.01, n = 21). All other tested parameters show no significant correlations.
4.4 Cave CO2
The CO2 concentrations at the Downstream and Upstream sampling points in the cave are inversely correlated (Fig. 6a). Downstream shows a higher pCO2 from June to October in 2022 and 2023, with a maximum of ∼ 14 000 ppmV in August 2023. The lowest concentrations are seen between December and April, reaching nearly atmospheric concentrations with a minimum of ∼ 420 ppmV in December 2021. Conversely, the highest CO2 concentrations at the Upstream site were measured during the winter months, with a maximum of ∼ 30 000 ppmV in December 2021. The lowest CO2 concentrations at Upstream were observed during the summer months with a minimum of ∼ 2300 ppmV in August 2022. Overall, concentrations at the Upstream site reach higher maxima and do not approach atmospheric values at their minimum, as at the Downstream site. The isotopic composition of CO2 is inversely related to its concentration, with higher CO2 concentrations coinciding with lower F14C and δ13C values. Seasonal trends differ between sites; at the Downstream site δ13C and F14C values are higher in winter and lower in summer, whereas at the Upstream site, δ13C and F14C values show the opposite pattern (Fig. 6b and c). The δ13C in Downstream ranged between −25.9 ‰ in June 2023 and −13.6 ‰ in December 2021, and the F14C ranged between 0.91 in October 2023 and 0.98 in February 2023. At Upstream, the opposite relation with CO2 concentration is well expressed for F14C but not as clear for δ13C, with minimal variability over the entire study period. The δ13C in Upstream fluctuates slightly around a mean of −24.8 ‰.
The F14C of CO2 in Upstream is overall lower than that of Downstream, increasing over late spring 2022 and into summer, peaking during August 2022 at 0.95. Decreasing F14C is observed during winter and into spring with lows of ∼ 0.88 in February 2023. At the Downstream site, the pCO2 and δ13C (rho = −0.9, p = 0.0001, n = 14), pCO2 and F14C (rho = −0.83, p = 0, n = 14), and δ13C and MMT (rho = −0.79, p = 0.0001, n = 14) are negatively correlated. Moreover, the pCO2 and MMT (rho = 0.53, p = 0.05, n = 14) and the δ13C and F14C (rho = 0.74, p = 0, n = 14) are positively correlated. At the Upstream site, pCO2 and MMP are positively correlated (rho = 0.55, p = 0.04, n = 14), and pCO2 and MMT are negatively correlated (rho = −0.54, p = 0.05, n = 14) (see Appendix A). All other tested parameters show no significant correlations.
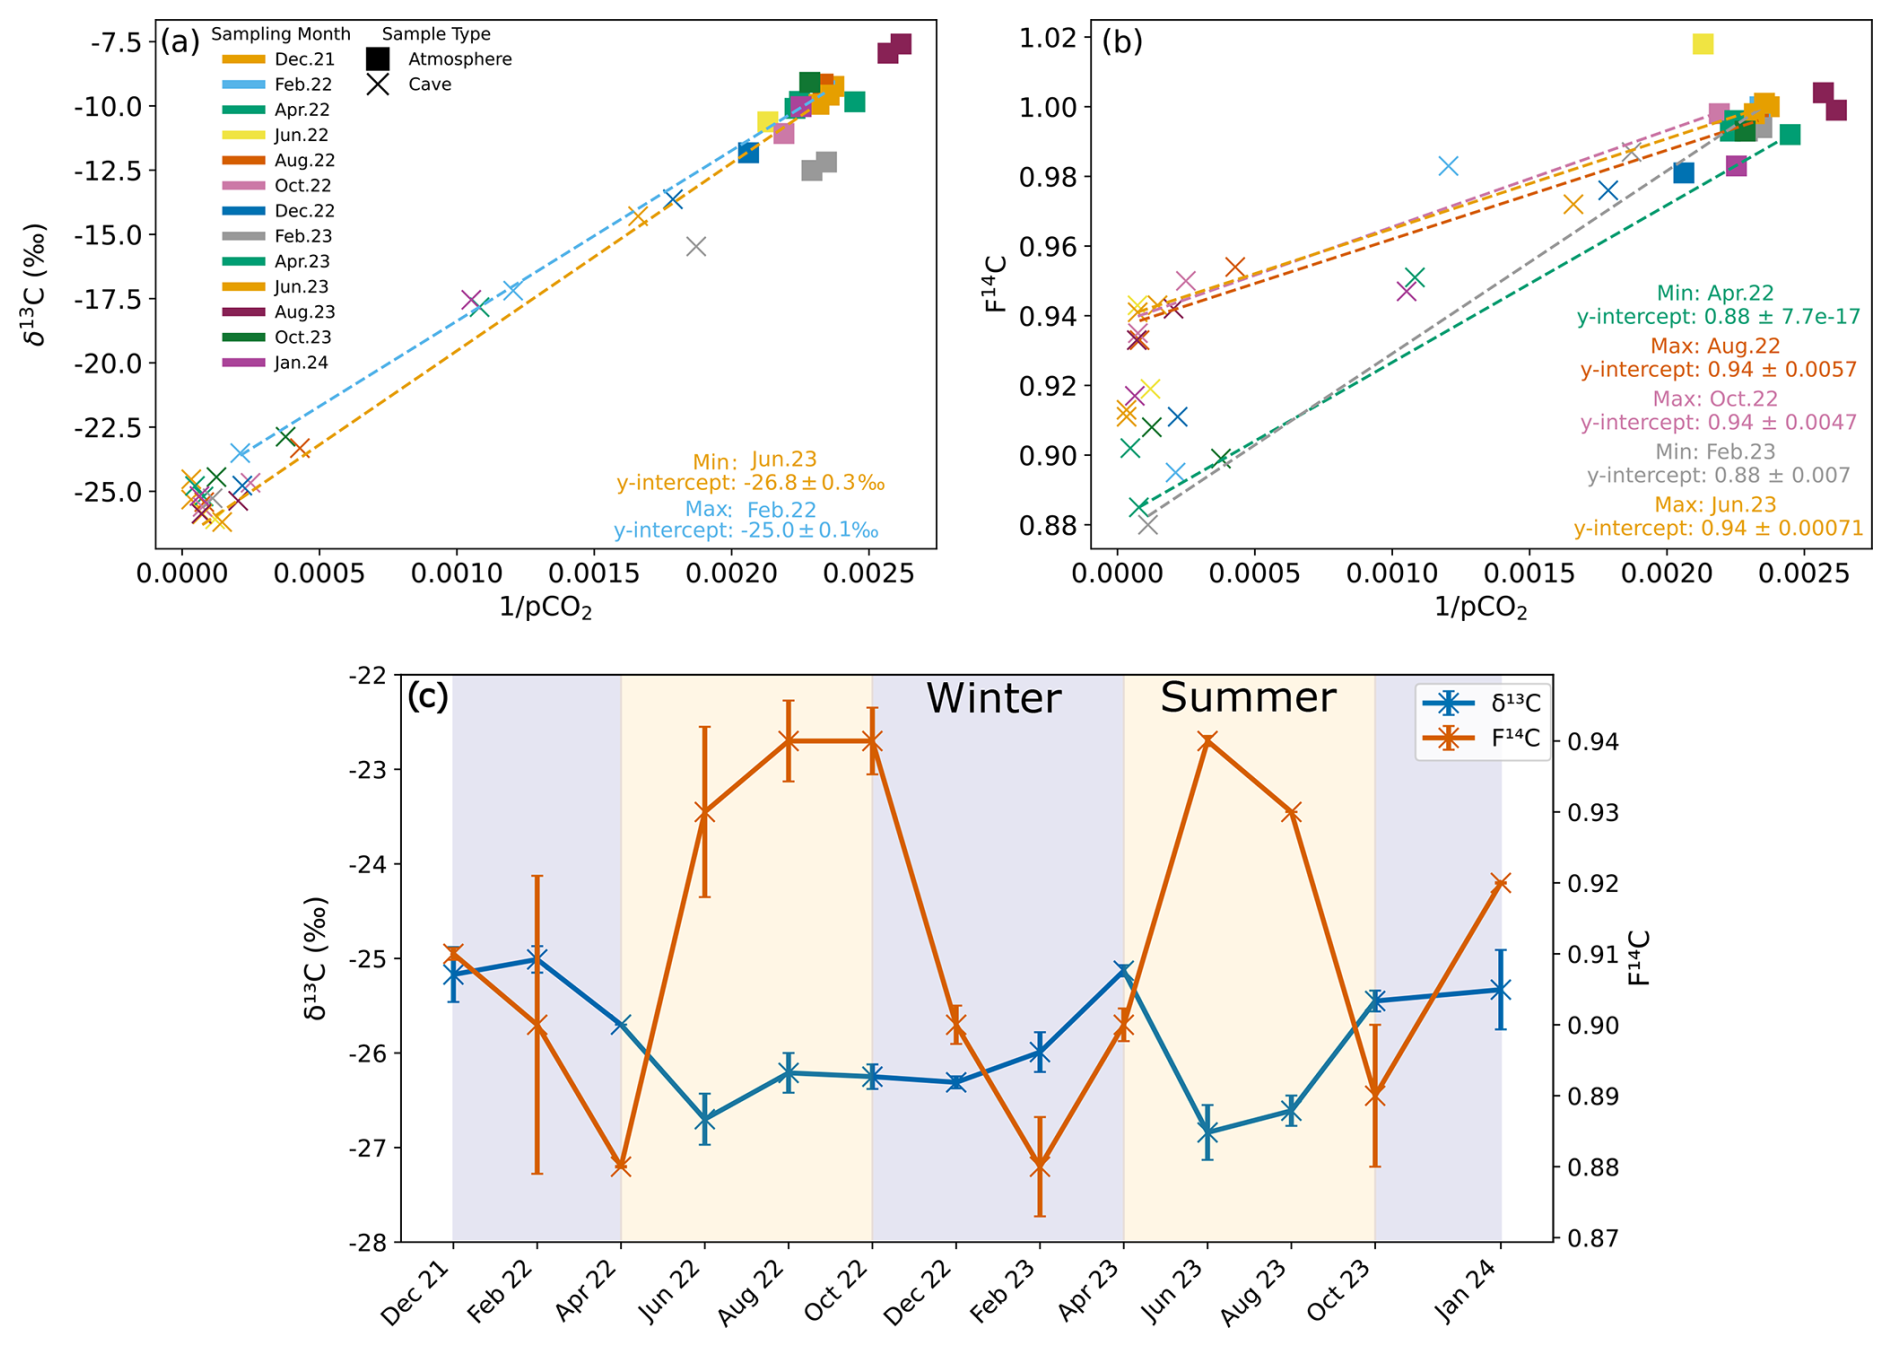
Figure 7Keeling plots for δ13C (a) and F14C (b) of cave (Upstream and Downstream sites) and atmospheric samples from all monitored months. The dashed regression lines denote the months with the maximum and minimum y intercepts for δ13C and F14C. (c) Keeling plot y intercepts for δ13C (blue) and F14C (orange) over time. Summer (yellow) and winter (blue) seasons are highlighted by the coloured background.
To constrain the isotopic composition of the endmembers contributing CO2 to the cave air mixture, we use the Keeling plot approach (Fig. 7a and b). This approach assumes that cave air is a mixture of two main sources, the atmosphere (with known concentration and isotopic values) and a second source of a priori unknown composition. The y intercepts of the Keeling plots represent the isotopic composition of the contributing endmember which mixes with atmospheric air inside the cave (Keeling, 1961; Pataki et al., 2003) (Fig. 7a and b). We find that over time, the isotopic composition of the endmember varies for both δ13C and F14C (Fig. 7c). The endmember δ13C value varies by ∼ 2.0 ‰ from −26.8 ‰ in June 2023 to −25.0 ‰ in February 2022. The variation in the F14C is larger, ranging from 0.88 in February 2023 to 0.94 in June 2022, August 2022, October 2022, and June 2023 (ca. ∼ 0.06 F14C). Maxima in the F14C value derived for the endmember through the Keeling plot generally correspond to decreases in δ13C, with two F14C maxima occurring in June to October 2022 and in June to August 2023.
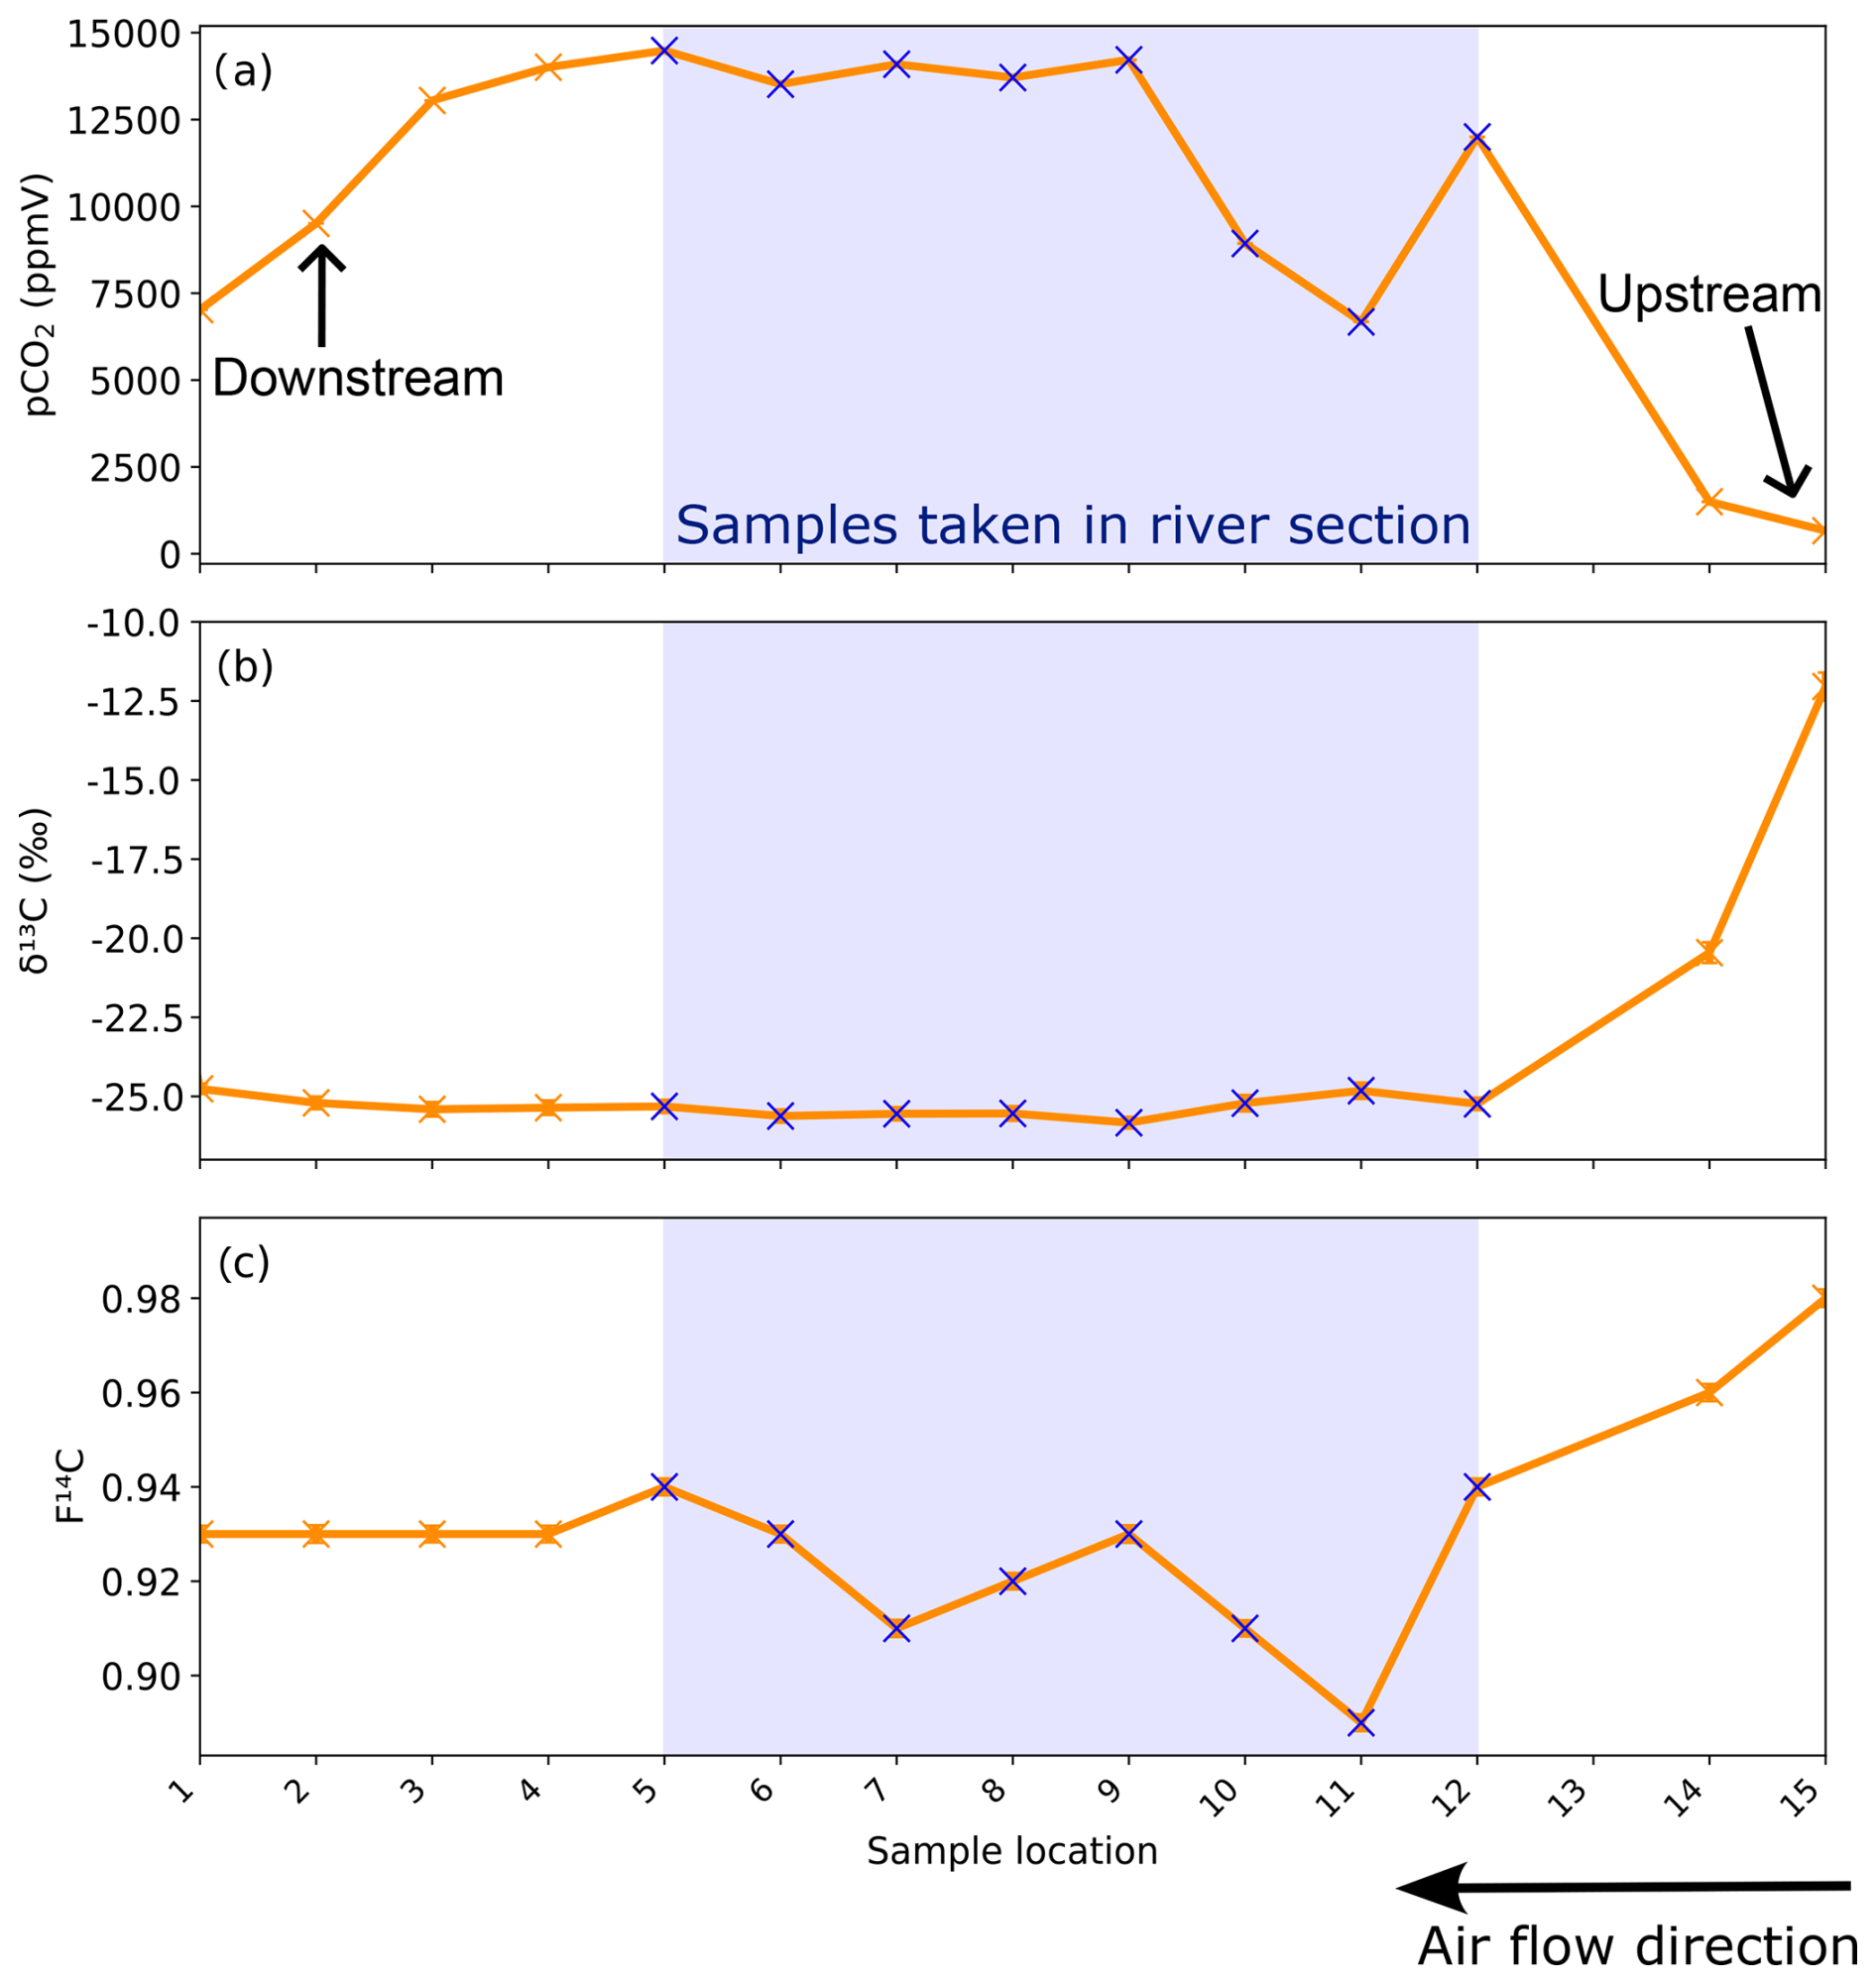
Figure 8(a) CO2 concentration, (b) δ13C, and (c) F14C of cave air samples from the different sites sampled during the trip through the cave. Sampling locations are shown in Fig. 1. The blue crosses and blue bar notate where samples were taken standing in the river. The direction of cave air ventilation is shown by the lower arrow. The approximate locations of the Upstream and Downstream sampling sites are annotated.
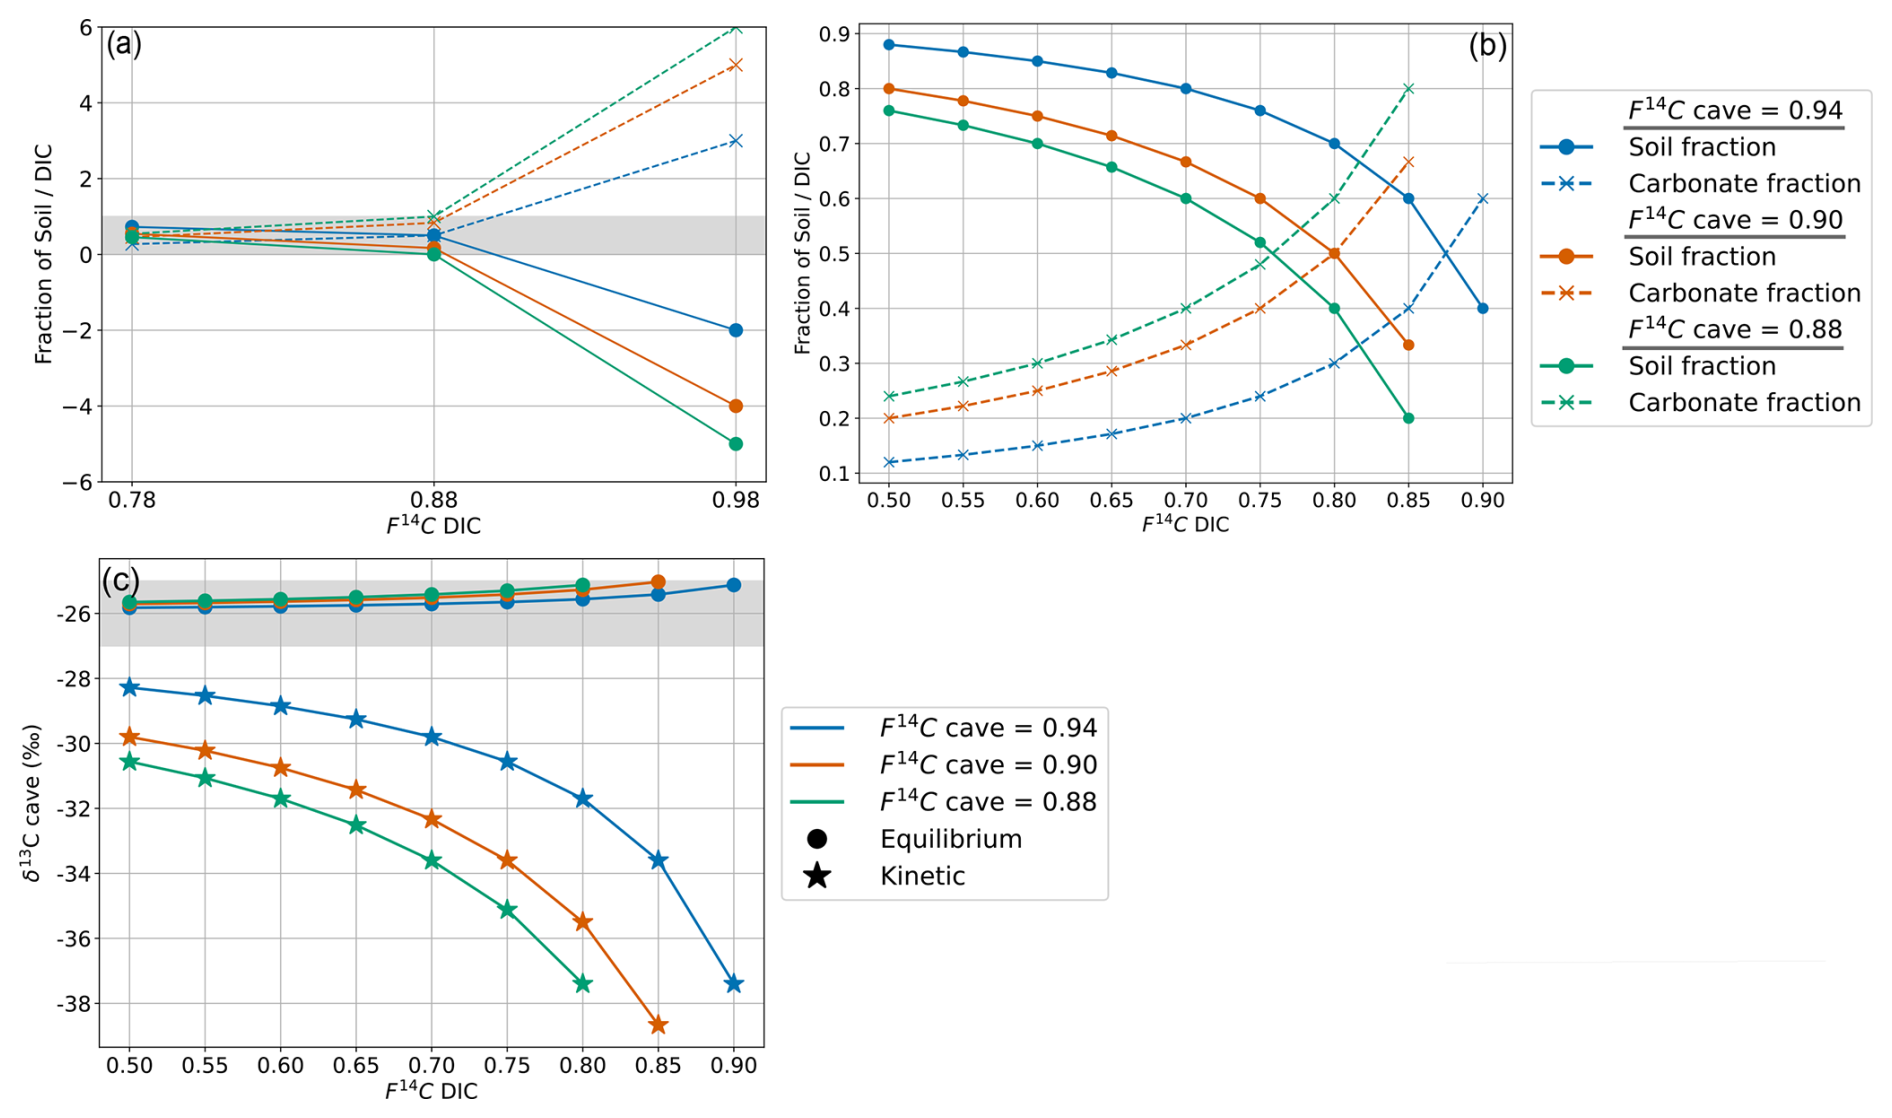
Figure 9(a) Mixing model between fsoil and fDIC for the measured range of F14C DIC values and F14C cave values of 0.94 (blue), 0.9 (orange), and 0.88 (green). The grey bar shows physically possible mixing ratios between 0 and 1. (b) Mixing model between fsoil and fDIC using the extended DIC F14C range and cave air F14C values. (c) Cave air δ13C for varying DIC F14C and cave air F14C values with equilibrium fractionation at −9.54 ‰ (circles) and kinetic fractionation at −30 ‰ (stars). The grey bar shows the cave air δ13C range which fits the measured values between −25 ‰ and −27 ‰.
Samples taken along the main passage of the cave during the trip through the cave show increasing pCO2 from the lower entrance (location 1, corresponding to the Downstream monitoring site, ∼ 6900 ppmV) to a plateau of ∼ 14 000 ppmV from sample point 4 to 9 towards the centre of the cave (Fig. 8a). The pCO2 decreases sharply after sample point 9 until point 11 (∼ 6600 ppmV). The pCO2 increases briefly at sample point 12 and then decreases again upon approach to the cave exit (Upstream). The δ13C values remain essentially constant at −25.5 ‰ through the initial segments of the cave, beginning to increase slightly past sample point 9 (Fig. 8b). The δ13C value is −25.8 ‰ at sample point 9 and progressively increases as pCO2 levels drop between sampling points 9 and 11, followed by a strong increase toward the Upstream exit (−11 ‰). The F14C values are constant at ∼ 0.93 between sample points 1 and 5, followed by more variability and generally lower F14C values in the middle of the transect, coinciding with the river passage of the cave (minimum 0.89 at sampling point 11; Fig. 9c). Towards the Upstream exit, F14C begins to increase strongly (maximum 0.98 at sampling point 15; Fig. 8c). Sample 13 is excluded due to a ruptured bag during sampling.
5.1 Sources and variability of shallow-depth CO2
The observed fluctuations in CO2 concentrations in the Shallow borehole gas samples vary with depth, vegetation cover, and season (Fig. 3), suggesting complex carbon cycling dynamics taking place in the soil zone and shallow fractured epikarst. Overall, samples from both forest and meadow locations have similar mean CO2 concentrations. In the Shallow 1 forest boreholes, higher CO2 concentrations occur during summer months (Fig. 3a), aligning with increased autotrophic (occurring in plant roots, leaves, and stems) and heterotrophic (microbial) respiration rates during warmer seasons. This results in higher CO2 production compared to losses from soil efflux to the atmosphere and downward transport in gaseous or dissolved form. Due to our discrete sampling approach, we cannot discern whether higher production or decreased losses are responsible for higher CO2 concentrations. The decline in CO2 concentrations during winter suggests that reduced autotrophic and soil microbial respiration in response to lower temperatures is likely an important driver of the seasonal cyclicity. The lower CO2 concentrations during winter in the forest boreholes (Shallow 1) compared to the meadow boreholes (Shallow 2) could be an indication of frost effects. Soil frost induced by colder temperatures can reduce heterotrophic respiration in soils. Experiments inducing deep frost in forested soils by removing snow cover caused a greater decrease in heterotrophic respiration during winter months compared to snow-covered control soils (Muhr et al., 2009). Furthermore, frost heave can physically damage the extraradical hyphae on plant roots (Lekberg and Koide, 2008). Due to the shielding of the tree canopy, the forested areas in the Milandre catchment likely experience less snow cover compared to the open meadow where snow can accumulate freely. The meadow soils may experience reduced frost effects, meaning that heterotrophic respiration is not impacted to the same extent as the forest soils and can accumulate CO2 year-round, as seen in borehole Shallow 2. However, during the monitored period, the Milandre catchment experienced little snow cover, suggesting that frost effects were likely minimal overall.
Though CO2 production is reduced in winter, concentrations of several thousand ppmV are measured at our sites, perhaps due to (i) slow, but persisting metabolic microbial activity at low temperatures (possible even below freezing temperatures as low as −5 to −7.5 °C; Kähkönen et al., 2001), (ii) reduced, but persisting autotrophic respiration of shallow roots, or (iii) reduced transportation of CO2 due to higher soil water content (Hashimoto and Komatsu, 2006). Similar seasonal trends in CO2 concentrations have been reported in other studies (Billings et al.; 1998; Pumpanen et al., 2003; Zhang et al., 2023).
The δ13C values of CO2 in shallow boreholes located in both the meadow and forest correspond to the typical isotopic signature of C3 plants which dominate the catchment area, supporting our interpretation of a dominant biogenic source of carbon in the soil gas (Figs. 2 and 3b). Plants using the C3 metabolic pathway (e.g. most temperate vegetation) produce carbon with a δ13C of ∼ −23 to −34 ‰ (Staddon, 2004). Furthermore, due to the nature of the sampling, the soil was not sampled in steady-state conditions, potentially disturbing any existing CO2 trends with depth. Another consideration is the symbiotic relationship between arbuscular mycorrhizal fungi (AMF) and plant roots, which is ubiquitous globally, occurring in 80 % of terrestrial plants (Fitter et al., 2000). AMF grows on plant roots and forms arbuscules within root cells and hyphae which extend into the soil (Zhu and Miller, 2003). Plants benefit from this relationship because of the increased uptake of nutrients such as phosphorus and nitrogen and improved resistance to environmental stress through more stable soil structure and enhanced water absorption (Kiers et al., 2011; Boyno et al., 2024). The fungi benefit through access to plant-derived carbohydrates for energy and a stable environment for growth and reproduction (Kiers et al., 2011). The respiration of AMF can contribute to the subsurface sequestration of carbon (Treseder and Allen, 2008) and may indeed contribute to the subsurface CO2 which we measured at Milandre cave. There appears to be a temperature dependance of roots with AMF colonization, where respiration rates increase at higher temperatures (Atkin et al., 2008). We observe an increase in CO2 concentration during the higher-temperature summer months (Figs. 3a and 5a), which may be caused in part by a contribution of CO2 from enhanced respiration of AMF. The isotopic composition of the CO2 produced by AMF respiration is not currently well constrained. Studies analysing the δ13C of individual AMF spores showed that the δ13C broadly corresponded to the C3 or C4 plant that it was associated with (Nakano et al., 1999). Therefore, it can be assumed that CO2 produced by AMF respiration is similar to that of the C3 host-plant-dominated catchment of Milandre cave. As carbon is fixed from modern atmospheric CO2 during host plant photosynthesis, the F14C signature should be modern (∼ 1). Hence, the respiration of AMF may contribute to the modern CO2 measured in the boreholes in both meadow and forest sites (Figs. 3 and 5).
Though both meadow and forest boreholes have C3 plant δ13C signatures, the δ13C values of CO2 in meadow soils are on average lower than those in the forest soils. Previous analysis of soil CO2 from various karstic sites in Slovenia showed a similar trend, whereby the δ13C values in meadow sites were ∼ 1 ‰ lower compared to forested sites (Stickler et al., 1997). The meadow and forested areas at our site have developed contrasting soil compositions, with the meadow soils deeper, more compacted, and with a higher organic content than the forest soils, which are shallow, unconsolidated, and with more roots. Comparisons of root-free and root-containing soils have suggested that root respiration contributes lower δ13CO2 to the soil gas (Diao et al., 2022). This is the opposite trend to what our findings would suggest. Efforts to disentangle the δ13C of autotrophic and heterotrophic contributions to soil CO2 have shown a range of results, where autotrophic respiration can produce the same (Wu et al., 2017), higher (Moyes et al., 2010), or lower (Risk et al., 2012) δ13C than heterotrophic respiration. However, different soil compositions can affect soil moisture, which can cause increases (Unger et al., 2010), decreases (Powers et al., 2010), and no change (Diao et al., 2022) in soil δ13C. It is therefore difficult in the context of this study to determine the exact reason for the difference in δ13C between surface covers. Interestingly, we also do not find evidence for contributions to subsurface gas from C4 plants, possibly due to the absence of sampling locations in the fields in the catchment where C4 crops are grown, suggesting limited lateral gas transport.
The CO2 F14C of meadow boreholes in Shallow 2 shows statistically significant seasonal behaviour (rho = 0.67, p = 0.001, n = 30), with more aged CO2 dominating the winter and spring months (F14C ∼ 0.88) and modern CO2 in summer (F14C ∼ 1.00) (Fig. 3c). These seasonal shifts suggest a potential influence of temperature-sensitive processes on soil carbon dynamics, with higher autotrophic respiration rates and heterotrophic respiration of very recently fixed photosynthates dominating in the warm months (Campeau et al., 2019). Though typically the productive growing season for meadow grasses occurs in spring (Wingler and Hennessy, 2016), there is a lag in the F14C response, which peaks between June and October. This may be due to the time it takes for enough modern CO2 to accumulate in the soil and dominate the average gas age. Similar impacts of seasonality on the contributions of young carbon pools to the soil CO2 budget have been observed in soils of various environments whereby autotrophic respiration and heterotrophic decomposition of younger carbon dominate in warmer months (Trumbore, 2000; Chiti et al., 2011; Vaughn and Torn, 2018). A contribution of fossil carbon from the dissolution of carbonate bedrock fragments in the soil zone could also be considered to explain the low soil CO2 F14C values in winter. However, such a bedrock contribution would result in a concomitant increase in δ13C, as marine carbonates, which typically constitute the karstified host rock, are characterized by δ13C of values of ∼ 0 ‰ (Planavsky et al., 2015) and up to +2 ‰ in the region of Milandre cave (Weissert and Mohr, 1996) (Fig. 2). This would contribute a gaseous δ13C ∼ 9.54 ‰ lighter when at equilibrium with DIC from carbonate dissolution at 10.5 °C (Mook et al., 1974). Since we do not observe increases in δ13C of soil gas during the periods of lower F14C, this is an unlikely scenario. A further explanation for the seasonal variability could be due to the seasonal ventilation dynamics in the karst system, which promote upward movement of cave air during the winter and downwards movement of soil air in summer (see Sect. 5.4).
The modern F14C CO2 signature in the Shallow 1 forest borehole (Fig. 3c) suggests a year-round dominant source of CO2 from autotrophic root respiration and the decomposition of very recently fixed soil organic matter. As the root systems are deeper and more developed in the forest soils, there is a higher input of modern carbon compared to the meadows. The soils in the forested area are shallow (in some areas < 10 cm deep) and are dominated by large pebbles and fragments of the carbonate bedrock and shallow roots. Thus, shallow-depth carbon sequestration may be suppressed in the forest soil, resulting in a CO2 profile dominated by deeper root respiration (Hasenmueller et al., 2017; Tune et al., 2020).
5.2 Sources and variability of CO2 at 5 m depth
CO2 concentrations at 5 m depth vary considerably over the sampling period and between individual sites (Fig. 5a). CO2 concentrations are generally higher in the forest boreholes (Deep 1, Deep 2) than in the meadow boreholes (Deep 3, Deep 4), likely due to the high volumes of CO2 produced by autotrophic respiration of the mature woodland root system, which penetrates deep into the unsaturated zone. The CO2 δ13C values across all boreholes reflect the C3-dominated ecosystem of the catchment and do not indicate any input from C4 plants in the nearby fields. Notably, the ecosystem composition of the overlying vegetation (meadow vs. forest) influences the isotopic composition of CO2 at 5 m in the same way as the shallow boreholes, with slightly lower δ13C values in the meadow than the forest. The F14C values of unsaturated zone CO2 vary across all deep boreholes by ± 0.02 around a mean value of 1.00 (Fig. 5c), suggesting that across the catchment, autotrophic tree root respiration may be the dominant source of CO2 at these depths (Breecker et al., 2012; Tune et al., 2020). Furthermore, the year-round modern CO2 F14C values in the deeper meadow boreholes Deep 3 and Deep 4 compared to the seasonally pronounced signal in the shallower boreholes of Shallow 2 highlight the potential influence of the meadow doline morphology. Boreholes Deep 3 and Deep 4 were drilled on the edge of the doline beneath shallow Leptosols like those found in the forest, while Shallow 2 was drilled fully within the doline, where the soil is thicker and much richer in organic matter. Unfortunately, there is no unsaturated zone depth borehole installed within the lower basin of the meadow to verify whether the seasonal signal measured at Shallow 2 translates to the deeper subsurface.
Whilst many studies point to the degradation of exported aged organic matter being the main source of karstic ground air (Breecker et al., 2012; Mattey et al., 2016; Bergel et al., 2017), unsaturated zone borehole CO2 in the Milandre cave catchment has predominantly modern F14C values and does not show seasonal isotopic variability. This suggests that the majority of the CO2 at 5 m depth is likely supplied by contemporaneous C3 tree root respiration. Similarly modern (106.4 pMC (percent modern carbon, corresponding to 1.064 in F14C)) biologically sourced CO2 was also detected in boreholes from Nerja cave, Spain (Vadillo et al., 2016). Modern but not substantially above modern F14C also excludes the contribution of substantial amounts of decadal-aged soil material containing bomb spike carbon due the enrichment in 14C by thermonuclear weapons testing during 1950s and 1960s (Trumbore, 2000; Shi et al., 2020). This result supports the body of literature stating that, in addition to the export and respiration of older carbon, large volumes of modern carbon are also transported into the unsaturated zone, likely in large part through deep root respiration (Breecker et al., 2012; Campeau et al., 2019; Tune et al., 2020). This suggests that deep roots, as found in mature forest ecosystems, might be more important than previously thought in contributing to the ground air budget.
5.3 Ventilation-driven isotopic variation in cave air
The CO2 dynamics in the cave show distinct variations in concentration and isotopic composition between the two sampling points Upstream and Downstream (Fig. 6a–c). Cave ventilation dynamics modulate the mixing ratio between the atmosphere and the other contributing pools and are usually the dominant source of variability (Kukuljan et al., 2021; Buzjak et al., 2024). Recent modelling of airflow dynamics in Milandre cave found that outside temperature controls 95 % of flow variability (Garagnon et al., 2022). During colder months when the outside temperature is ≤ 8 °C, the air in the cave flows topographically upwards from the northern downstream entrance close to the Downstream site to the higher entrance closer to Upstream. When the temperature increases above 8 °C, the ventilation regime reverses. This seasonality is reflected in the alternating concentrations and isotopic composition of the CO2 at the cave sampling sites as they experience varying amounts of dilution with atmospheric air during the year. CO2 degassing from the cave river at Upstream reduces the dilution effect in the upper passage. The effects of ventilation can also be observed in the higher-spatial-resolution sampling during the trip through the cave (Fig. 8a–c) whereby the summer regime ventilation resulted in lower concentrations, more positive δ13C, and increased F14C due to atmospheric mixing closer to the upper entrance (Upstream site). Spatially, a marked decrease in CO2 concentration and F14C occurs at sampling locations 10 and 11 (∼ 750 to 1000 m from the cave entrance, respectively) though little change is observed in the δ13C. This air input could be associated with an older organic matter pool which, however, contributes only little to the entire CO2 mass flux.
5.4 Sources and variability of CO2 in cave air
The Keeling plot y intercepts show that the composition of the gas pool (karst endmember) that mixes with atmospheric air in the cave varies seasonally (Fig. 7c). It is important to note that, while the isotopic composition of cave CO2 is influenced by ventilation-driven dynamics, the Keeling plot y intercept represents the composition of the subsurface gas that mixes with the atmospheric air during ventilation and is not affected by it. The δ13C of the karst endmember is mostly stable, varying ± 2 ‰ around a mean value of −26 ‰, a value typically associated with the CO2 produced by the C3 plants which dominate the catchment ecosystem. This value is also very similar to the δ13C CO2 values of soil and unsaturated zone gas and reinforces the notion of the karst endmember being dominated by ecosystem respiration. Previous work at Milandre cave investigating aquifer dynamics using 222Rn suggested that the majority of the cave CO2 comes from the overlying soils (Savoy et al., 2011). The F14C of the Keeling plot y intercept, on the other hand, shows seasonal variability with distinctly more “modern” (closer to F14C = 1) during the summer and “aged” (F14C < 1) CO2 during the winter. The transition from an F14C of 0.94 to 0.88 represents a change in the mean apparent age of CO2 from ∼ 100 to 1000 years, well beyond the assumed residence time of water in the unsaturated zone of ∼ 5.5 to 6.6 years (Affolter et al., 2020).
Several mechanisms may be responsible for the seasonal F14C fluctuations of the karst endmember. A contribution of carbon from the oxidation of methane, either from methanotrophs or through the evolution of pore fluid waters, must be considered. Methane can be produced by both thermogenic (originating from ancient organic-rich sediments) and biogenic (particularly through methanotrophic bacteria) processes (Suess and Whiticar, 1989). The δ13C CO2 range of published values for the CO2 resulting from methane oxidation from both sources is broad, with biogenic spanning from ∼ −20 ‰ to −90 ‰ and thermogenic from ∼ −30 ‰ to −65 ‰ (Suess and Whiticar, 1989). The δ13C CO2 produced by thermogenic sources can also evolve to less negative values of ∼ −25 ‰ to −34 ‰ in settings where there is nearly total conversion of CH4 to CO2 (Schoell, 1980; Frieling et al., 2016). Methane that undergoes biogenic oxidation is typically sourced from the atmosphere, meaning the resulting CO2 will have a modern F14C signature (F14C ∼ 1). In contrast, CO2 produced by thermogenic methane oxidation will have a fossil F14C signature because the methane originates from ancient organic-rich sediments that contain no measurable radiocarbon (F14C ∼ 0). While measuring methane concentrations quantitatively was not possible with our analytical setup, qualitative data show that methane concentrations in Milandre cave air and catchment borehole samples were exceedingly low (∼ 90 to 970 ppb), suggesting methane oxidation may occur in the Milandre subsurface environment. Methanotrophic bacteria have been identified in 98 % of soils sampled from 21 North American caves at a mean bacterial abundance of 0.88 % (Webster et al., 2022). Methanotrophic bacteria in caves significantly contribute to methane consumption, with a study in Pindal Cave (NW Spain) showing how methanotrophic bacteria associated with moonmilk deposits remove 65 % to 90 % of atmospheric methane entering the cave (Martin-Pozas et al., 2022). As our cave and borehole CO2 samples have a δ13C of ∼ −26 ‰ and a variable F14C in the cave air and shallow meadow samples, we cannot rule out a contribution of methane oxidation from biogenic processes actively occurring in Milandre. However, this would not explain the depleted radiocarbon signature that we measured episodically in the cave air. Methane evolved abiogenically from pore fluids in Oxfordian marls may have an isotopic ratio similar to that measured in our samples if thermogenically derived with a dominant conversion of CH4 to CO2. However, it is unlikely that this process occurred in the Milandre cave sediments given the lack of organic-rich sedimentary rocks in the stratigraphy. Thus, while we cannot quantify the importance of methane oxidation for the subsurface carbon budget at our site, it is unlikely that methane oxidation processes are responsible for the variation in radiocarbon ages in cave air CO2.
Despite the apparent limiting factors for microbial growth in caves, it is known that different organisms are able to thrive within this niche including bacteria, archaea, algae, and fungi. In terms of bacteria, Proteobacteria is typically reported as the dominant group in caves (Zhou et al., 2007; Tomczyk-Żak and Zielenkiewicz, 2016). However, in some cases Actinobacteria is the largest group of microbes (Wiseschart et al., 2018). In two Chinese caves with high CO2 concentrations (> 3000 ppm), Proteobacteria, Actinobacteria, Bacteroidetes, and Thaumarchaeota were the dominant phyla (Chen et al., 2023). Hundreds of fungi taxa have been described in caves globally, with Ascomycota being the most commonly reported (Gherman et al., 2014). Though not yet thoroughly investigated, diverse communities of protists have also been identified within caves (Gogoleva et al., 2024), as well as archaea (Biagioli et al., 2023) and algae (Kosznik-Kwaśnicka et al., 2022). As biological processes generally favour the incorporation of lighter 12C compared to 13C, the respiration of these organisms would contribute an organic signature (lower δ13C and a F14C corresponding to the age of the carbon source being consumed, which can range from modern to more aged F14C) to the CO2 composition of cave air at Milandre cave. With the isotopic analysis used in this study, and because we did not analyse the microbial community diversity present in Milandre cave and its catchment, the CO2 contributions from different types of microbial processes cannot be distinguished from one another. We are only able to distinguish between “organic” processes (in-cave microbial, soil, root, and fungi respiration), which produce a CO2 with a lower δ13C signature and a range of F14C depending on the age of the organic material consumed, and “inorganic” processes (carbonate degassing and atmospheric ventilation), which contribute CO2 with a higher δ13C and a range of F14C.
Varying contributions of host-rock-derived carbon to cave air through shifts in the host rock dissolution regime can affect the isotopic composition of cave air. Dissolution of the host rock carbonate can occur under a wide range of conditions between two extreme cases: completely closed and completely open systems. In a completely closed system, the aqueous solution becomes isolated from the soil CO2 reservoir after passing into the unsaturated zone, resulting in a theoretical 50:50 contribution ratio of carbon ions in solution from the carbonate host rock and from soil air and overall decreasing F14C to as low as 0.5 (Fohlmeister et al., 2011; Milanolo and Gabrovšek, 2015). On the other hand, in a completely open system the aqueous solution can continuously exchange with an unlimited soil CO2 reservoir, resulting in most carbon atoms being sourced from the soil CO2 reservoir and the rock contribution being minimal (Fohlmeister et al., 2011). Most natural systems exist in an intermediate state between completely open and completely closed settings.
If the seasonal variability in CO2 F14C in Milandre cave reflected seasonal shifts in the “openness” of the system, summers (with higher F14C) would be characterized by a more open system with higher rates of exchange between the aqueous solution and the soil CO2 reservoir. The observed shift to lower F14C in winter would reflect a more closed system with a higher contribution of the F14C free carbonate bedrock. Shifts in the open–closed continuum would likely result in changes in the δ13C of the endmember (Fairchild and Baker, 2012), which is not seen in the cave air, with an expected lower δ13C in a more open system and an increase in a more closed system because of the higher carbonate host rock carbon contribution (δ13C ≈ 0 ‰). However, varying amounts of isotopic fractionation can occur when CO2 is degassed from the drip water DIC pool into the cave atmosphere, potentially influencing the isotopic composition of the measured cave air CO2 (Mickler et al., 2019).
We constructed a mixing model which allows us to evaluate how much variability in the Keeling plot y intercept (i.e. the second source of carbon to cave air besides the atmosphere) can be explained by variation in DIC contribution from dissolution regime changes and degassing fractionation. This model assumes that the Keeling plot y intercept is itself a mixture of two endmembers that contribute CO2 to cave air, the modern soil (F14Csoil = 1) and the DIC (F14CDIC), where the F14CDIC represents a mixture of dissolved soil CO2 and DIC from carbonate mineral dissolution, which we can constrain with our measured DIC values. The F14Csoil represents direct input of CO2 soil gas into the cave.
The mixing ratio between F14Csoil and F14CDIC results in the F14C of CO2 of the karst endmember (F14Ccave). Thus, the cave air CO2 F14C can be expressed as follows (where f is fraction, defined as between 0 and 1).
Since , the equation can be written as follows.
For F14C, fractionation is generally negligible during carbonate dissolution and degassing compared to δ13C due to unit conversion, i.e. % vs. ‰ (Fohlmeister et al., 2011). We use the mixing calculation (Eq. 4) to estimate the contributions of fsoil and fDIC using the highest (0.94), an intermediate (0.90), and the lowest (0.88) measured cave CO2 F14C values (F14Ccave) and F14C DIC (F14CDIC) based on the highest (0.98), intermediate (0.88), and lowest (0.78) measured values of drip water DIC. We find that when F14CDIC = 0.98, the mixing model results in impossible scenarios with fsoil > 1 and fDIC < 0 because this value is higher than the highest F14Ccave. When F14CDIC = 0.88 it results in a highly unlikely scenario based on our observations and the literature where fsoil=0 and fDIC=1, as this corresponds to the lowest F14Ccave value (Fig. 9a). Only the scenario with the lowest F14CDIC = 0.78 produced realistic mixing fractions. Overall, this implies that there is a discrepancy between the measured F14CDIC and what is derived by a simplified mixing model based on the F14C of cave CO2, with F14CDIC values too high to result in the F14Ccave composition that we observe. Thus, carbonate dissolution and subsequent degassing of CO2 from drip water DIC to cave air are unlikely to be the dominant processes explaining the shifts in cave air F14C over time.
As our mixing ratios derived from measured DIC values were mostly not realistic according to the two-endmember mixing scenario, we considered how a wider theoretical range of F14CDIC values (from closed to mainly open system dissolution conditions, 0.50 to 0.90 F14C) would affect the contributing fractions of fsoil and fDIC. Variations in F14CDIC from 0.50 to 0.85 result in viable mixing fractions across the range of F14Ccave, with the fsoil (20 % to 76 %) and fDIC (24 % to 80 %) differing widely (Fig. 9b).
As the mean value of cave CO2 δ13C is −26 ‰ (we take a range from −25 ‰ to −27 ‰), we created a similar two-endmember mixing calculation for δ13C values to test whether the mixing ratios derived from F14C translate to observed δ13C values. For this we used the mean δ13C of soil CO2 (δ13Csoil) = −26 ‰ and the δ13C of the DIC (δ13CDIC) = −15 ‰ (estimated from a mean of the δ13C produced during the F14C DIC AMS measurement; see Appendix B).
Fractionation effects during degassing must be considered when modelling δ13C. If equilibrium fractionation between DIC and CO2(g) occurs, the fractionation factor () at 10.5 °C between HCO3− and CO2 is 9.54 ‰, with the gas being 9.54 ‰ depleted in 13C relative to the fluid (Mook et al., 1974). Kinetic fractionation can occur during rapid degassing of CO2 as well as during rapid precipitation of carbonate minerals (Mickler et al., 2019). If kinetic fractionation occurs during degassing, this results in a greater depletion of the dissolved CO2 in 13C compared to equilibrium fractionation (i.e. a more positive δ13CDIC). The possible ranges reported for the composition of CO2 generated from kinetic fractionation during degassing in caves vary widely, with some reporting close to that resulting from equilibrium fractionation (Dulinski and Rozanski, 1990) and others a range of 10 ‰ to 65 ‰ (Mickler et al., 2019). The extent of kinetic fractionation is expected to depend on the amount of degassing that occurs, which is a function of the disequilibrium between the fluid and the surrounding air (Frisia et al., 2011). In our system with limited geochemical data regarding fluid compositions, it is difficult to determine what extent of kinetic fractionation may have occurred. Hence, we first assume that the fractionation is < −9.54 ‰ (i.e. greater compared to equilibrium conditions) and take a moderate but arbitrary value ballpark of = 30 ‰.
A mixing calculation is then applied to assess if the measured range of the karst endmember δ13CO2 given by the Keeling plot can be consistent with the extended range of F14CDIC (0.50 to 0.85 F14C) and measured F14Ccave under conditions with equilibrium degassing and kinetic degassing.
Equilibrium degassing:
Kinetic degassing:
For the maximum (0.94), intermediate (0.90), and minimum (0.88) values of the endmember F14C, only equilibrium fractionation during degassing can explain the observed δ13Ccave value of approximately −26 ‰ (Fig. 9c). Kinetic fractionation scenarios result in very negative δ13Ccave values which do not fit those measured, except when using very small kinetic fractionation factors similar to that of the equilibrium fractionation ( of −10 ‰, see Appendix C). It is possible that kinetic fractionation occurs between Milandre cave waters and the cave air due to atmospheric ventilation which occurs year-round. The atmospheric air which enters from the upper entrance in the summer and the lower entrance in the winter creates a concentration gradient between the CO2 present within cave waters and the concentration in the cave atmosphere. However, the rapidly increasing pCO2 with distance from the cave entrance (Fig. 8a) implies that the concentration gradients required for kinetic fractionation do not occur throughout most of the cave passage and that kinetic influences are probably minimal.
Overall, the F14CDIC measured beyond F14C = 0.90 is too high to reproduce our measured cave air CO2 F14C and δ13C. The F14CDIC is based on the analysis of nine drip water sites of varying drip rates and ecosystem coverage over the course of 1 year. It is possible that the sampling setup did not capture the true range of F14CDIC in the drip water, though this hypothesis is highly unlikely due to the diversity in drip rate and hydrological response of drips measured, and we believe our DIC data to be representative of the system.
The F14CDIC of the cave river was not measured; however, previous studies investigating the Milandre cave river have suggested that in non-flooding conditions the river is fed by slow diffuse flow as the unsaturated zone acts as a buffer, storing water and dampening the signal of normal rainfall. During flooding events, the unsaturated zone aquifer is bypassed and the stream is mainly fed through fracture flow (Perrin et al., 2003; Savoy et al., 2011). A diffuse-flow-fed river is likely to have isotopic characteristics similar to that of the drip waters, which have higher F14C, suggesting more open-system dissolution conditions. In contrast, times of flooding and soil saturation result in less exchange with the soil gas reservoir, leading to dissolution under more closed conditions (Perrin et al., 2003; Savoy et al., 2011). However, the drip water F14CDIC is relatively stable over 1 year of monitoring in a variety of hydrological conditions, implying that variations in host rock dissolution and degassing dynamics are not the explanation for the variation in F14C and δ13C of the endmember.
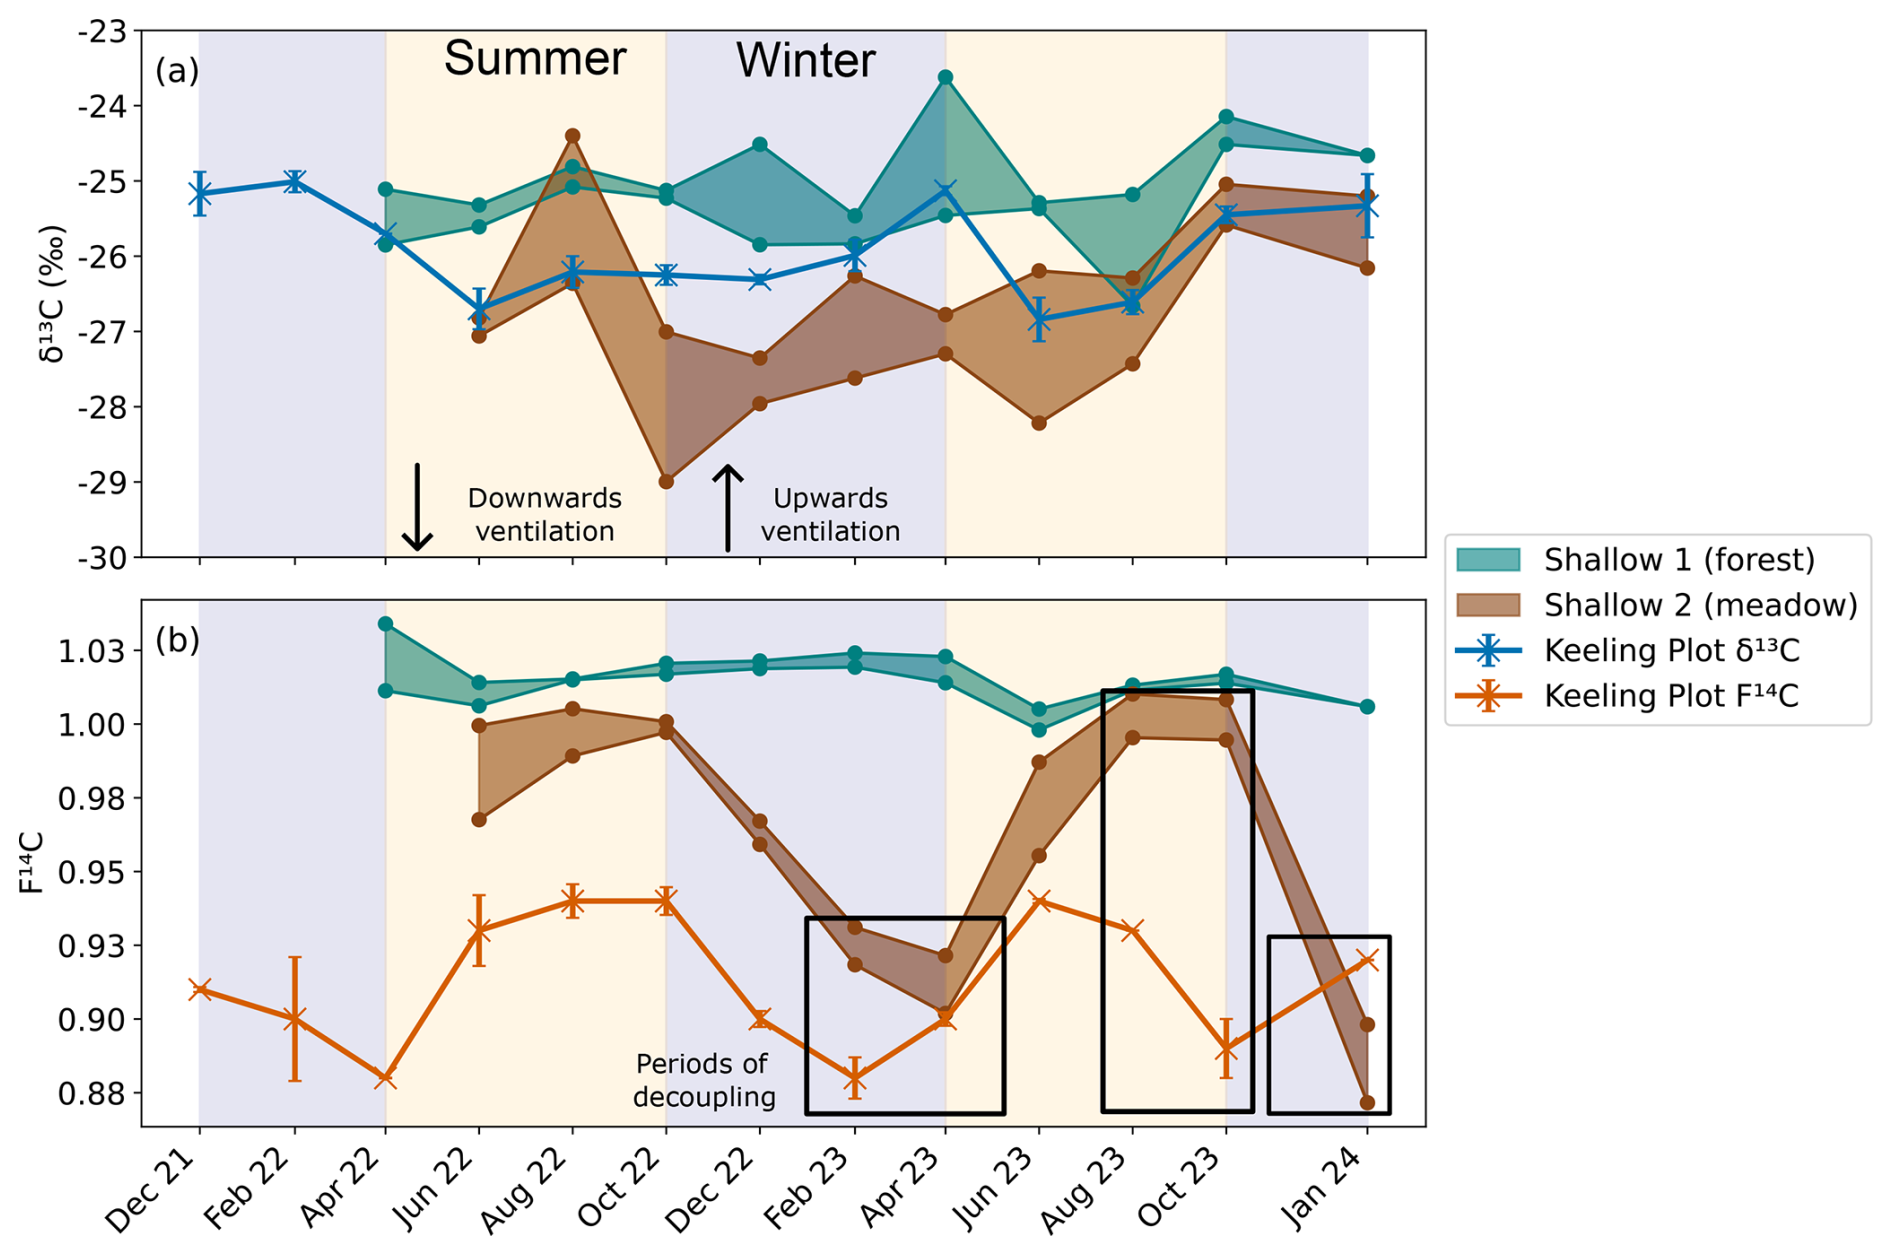
Figure 10Comparison between the (a) δ13C and (b) F14C of the shallow depth boreholes in the forest (Shallow 1, green) and meadow (Shallow 2, brown), as well as the Keeling plot endmembers δ13C (blue) and F14C (orange) also show in Fig. 7. Summer (yellow) and winter (blue) seasons are highlighted by the coloured background. The direction of cave ventilation is shown by the arrows with downwards ventilation (from Upstream to Downstream) in summer and upwards ventilation (Downstream to Upstream). Periods of decoupling between the F14C of the meadow borehole and the cave endmember are shown in black boxes.
The meadow soil boreholes in the doline (Shallow 2) have similar patterns in CO2 composition to the karst endmember, with a δ13C of −26 ‰ and variable F14C (Fig. 10a and b). In 2022, the F14C in the meadow soil and karst endmember align closely over the seasonal cycle, but then decouple slightly in 2023 during the transitional periods between winter and spring where the karst endmember F14C changes before the meadow. This suggests that, instead of the soils influencing the cave air due to seasonal changes in soil respiration, the cave ventilation regime may be influencing the soil CO2 F14C. The cave ventilates upwards in winter from Downstream to Upstream in a chimney effect (and vice versa in summer). Here, the lower-F14C karst endmember CO2 may flow upwards through the highly fractured unsaturated zone of the doline and ventilate the meadow soils, resulting in a mixture of low-F14C CO2 from the karst endmember and modern CO2 from the soils. This possibly reflects a contribution of older CO2 from within the karst itself, likely from a “ground air” reservoir of older respiring organic material in the unsaturated zone as found by several other studies (Breecker et al., 2012; Noronha et al., 2015; Mattey et al., 2016; Bergel et al., 2017). It is possible that several reservoirs of older organic material exist throughout the downstream catchment of Milandre, which may contribute the low-F14C CO2 to the ventilating cave air in winter. In summer the ventilation reverses, and the higher-F14C CO2 from the soil is transported downwards into the cave, increasing the F14C of the cave endmember CO2. The F14C of the karst endmember is always lower than the meadow soil F14C, implying that there is always mixing between the soils and the karst endmember (which additionally also reflects the DIC contribution). Similar upwards transport of CO2 in karst boreholes has been observed in Nerja Cave, Spain (Benavente et al., 2010; Benavente et al., 2015), and in the Gibraltar karst (Mattey et al., 2016). We do not observe significant effects of the winter upwards ventilation in the F14C CO2 in any of the deeper boreholes in the meadow or any of the boreholes in the forest. This could be related to the location of Shallow 2 in the doline, whilst the rest of the boreholes are situated higher on the banks (Deep 3 and Deep 4) or further away from the doline in the forest (Deep 1 and Deep 2). The topography difference between the higher forest and lower meadow likely reflects influences of the secondary porosity in the bedrock, which is likely more highly fractured in the meadow doline formation compared to the forest. As the doline structure likely has a higher secondary porosity and is more highly fractured than the higher bedrock, ventilation effects may be more important here than at the other locations.
The accumulation of the older organic carbon in the unsaturated zone likely occurs over time. Soil layers in karst regions often accumulate on bedrock with deep vertical fractures (Cheng et al., 2023). This decreases the ability of long-term storage of older soil carbon pools due to preferential fracture flow, also known as subsurface leakage, which destabilizes the oldest soil layer and leads to export of older carbon into the unsaturated zone (Sánchez-Cañete et al., 2018; Wan et al., 2018). Several studies have acknowledged this potential source of CO2 produced autochthonously inside the unsaturated zone by the microbial degradation of this old soil, plant, or root material which was previously washed into the unsaturated zone, contributing older CO2 to the ground air mix (Noronha et al., 2015; Bergel et al., 2017; Ding et al., 2023).
We conducted a comprehensive investigation over 2 years into the dynamics of CO2 concentrations and δ13C and F14C values across different land covers and soil types within the critical zone at Milandre cave in northern Switzerland. Our analysis found distinct seasonal fluctuations in CO2 levels in soil boreholes in both forest and meadow areas, with higher concentrations during summer compared to winter. Low δ13C values of ∼ −26 ‰ indicate respiration of C3 plants, which dominate the catchment area. The stable modern F14C of ∼ 1.00 in shallow forest boreholes indicated a year-round modern CO2 contribution from tree and plant roots to the subsurface, consistent with a well-ventilated soil. On the other hand, samples from meadow boreholes situated in a doline with a thick, well-developed soil cover displayed seasonality in F14C from ∼ 0.88 in the winter and spring to ∼ 1.00 in summer.
In the unsaturated zone we observed substantial variability in CO2 concentrations across the catchment (∼ 3000 to ∼ 37 000 ppmV), with higher concentrations in boreholes with forest cover than those with meadow cover. Despite differences in surface vegetation, the isotopic compositions of δ13C and F14C remained stable in both forest and meadow environments, reflecting the dominant modern C3 vegetation signature contributing to the ground air. The year-round modern unsaturated zone CO2 in meadow boreholes Deep 3 and Deep 4 contrasts with the seasonally attenuated signal in the thicker meadow soils.
Large variations in cave air CO2 concentrations (atmospheric to ∼ 30 000 ppmV), δ13C (∼ −9 to −25 ‰), and F14C (0.88 to 0.98) are controlled by seasonal temperature-driven cave ventilation. The seasonal changes in the isotopic composition of the Keeling-plot-derived karst endmember cannot be explained with the observed DIC F14C range, suggesting that bedrock dissolution and degassing dynamics are likely not the cause of the isotopic variation in the cave air. The isotopic characteristics of the cave air are comparable to those of the meadow doline soil. The seasonal variability in karst endmember CO2 F14C precedes that in the soil and is always older. This suggests that cave ventilation contributes older CO2 to the doline soils, likely sourced from a reservoir of aged organic material in the unsaturated zone, during the upward winter ventilation regime. In summer, the reversed downwards ventilation contributes younger soil CO2 to the cave, mixing with the older unsaturated zone reservoir.
Our study provides important insights into how carbon is transported to the subsurface in karstic critical zones. Understanding these processes is crucial for accurate estimation of the size of subsurface CO2 pools (ground air) and to refine terrestrial CO2 budgets. Moving forward, it would be beneficial to undertake more detailed investigation of CO2 transport into the subsurface by implementing 14C analysis to further constrain the sources of ground air. Furthermore, higher-resolution monitoring over periods of interest could assist us in understanding short-term variations.
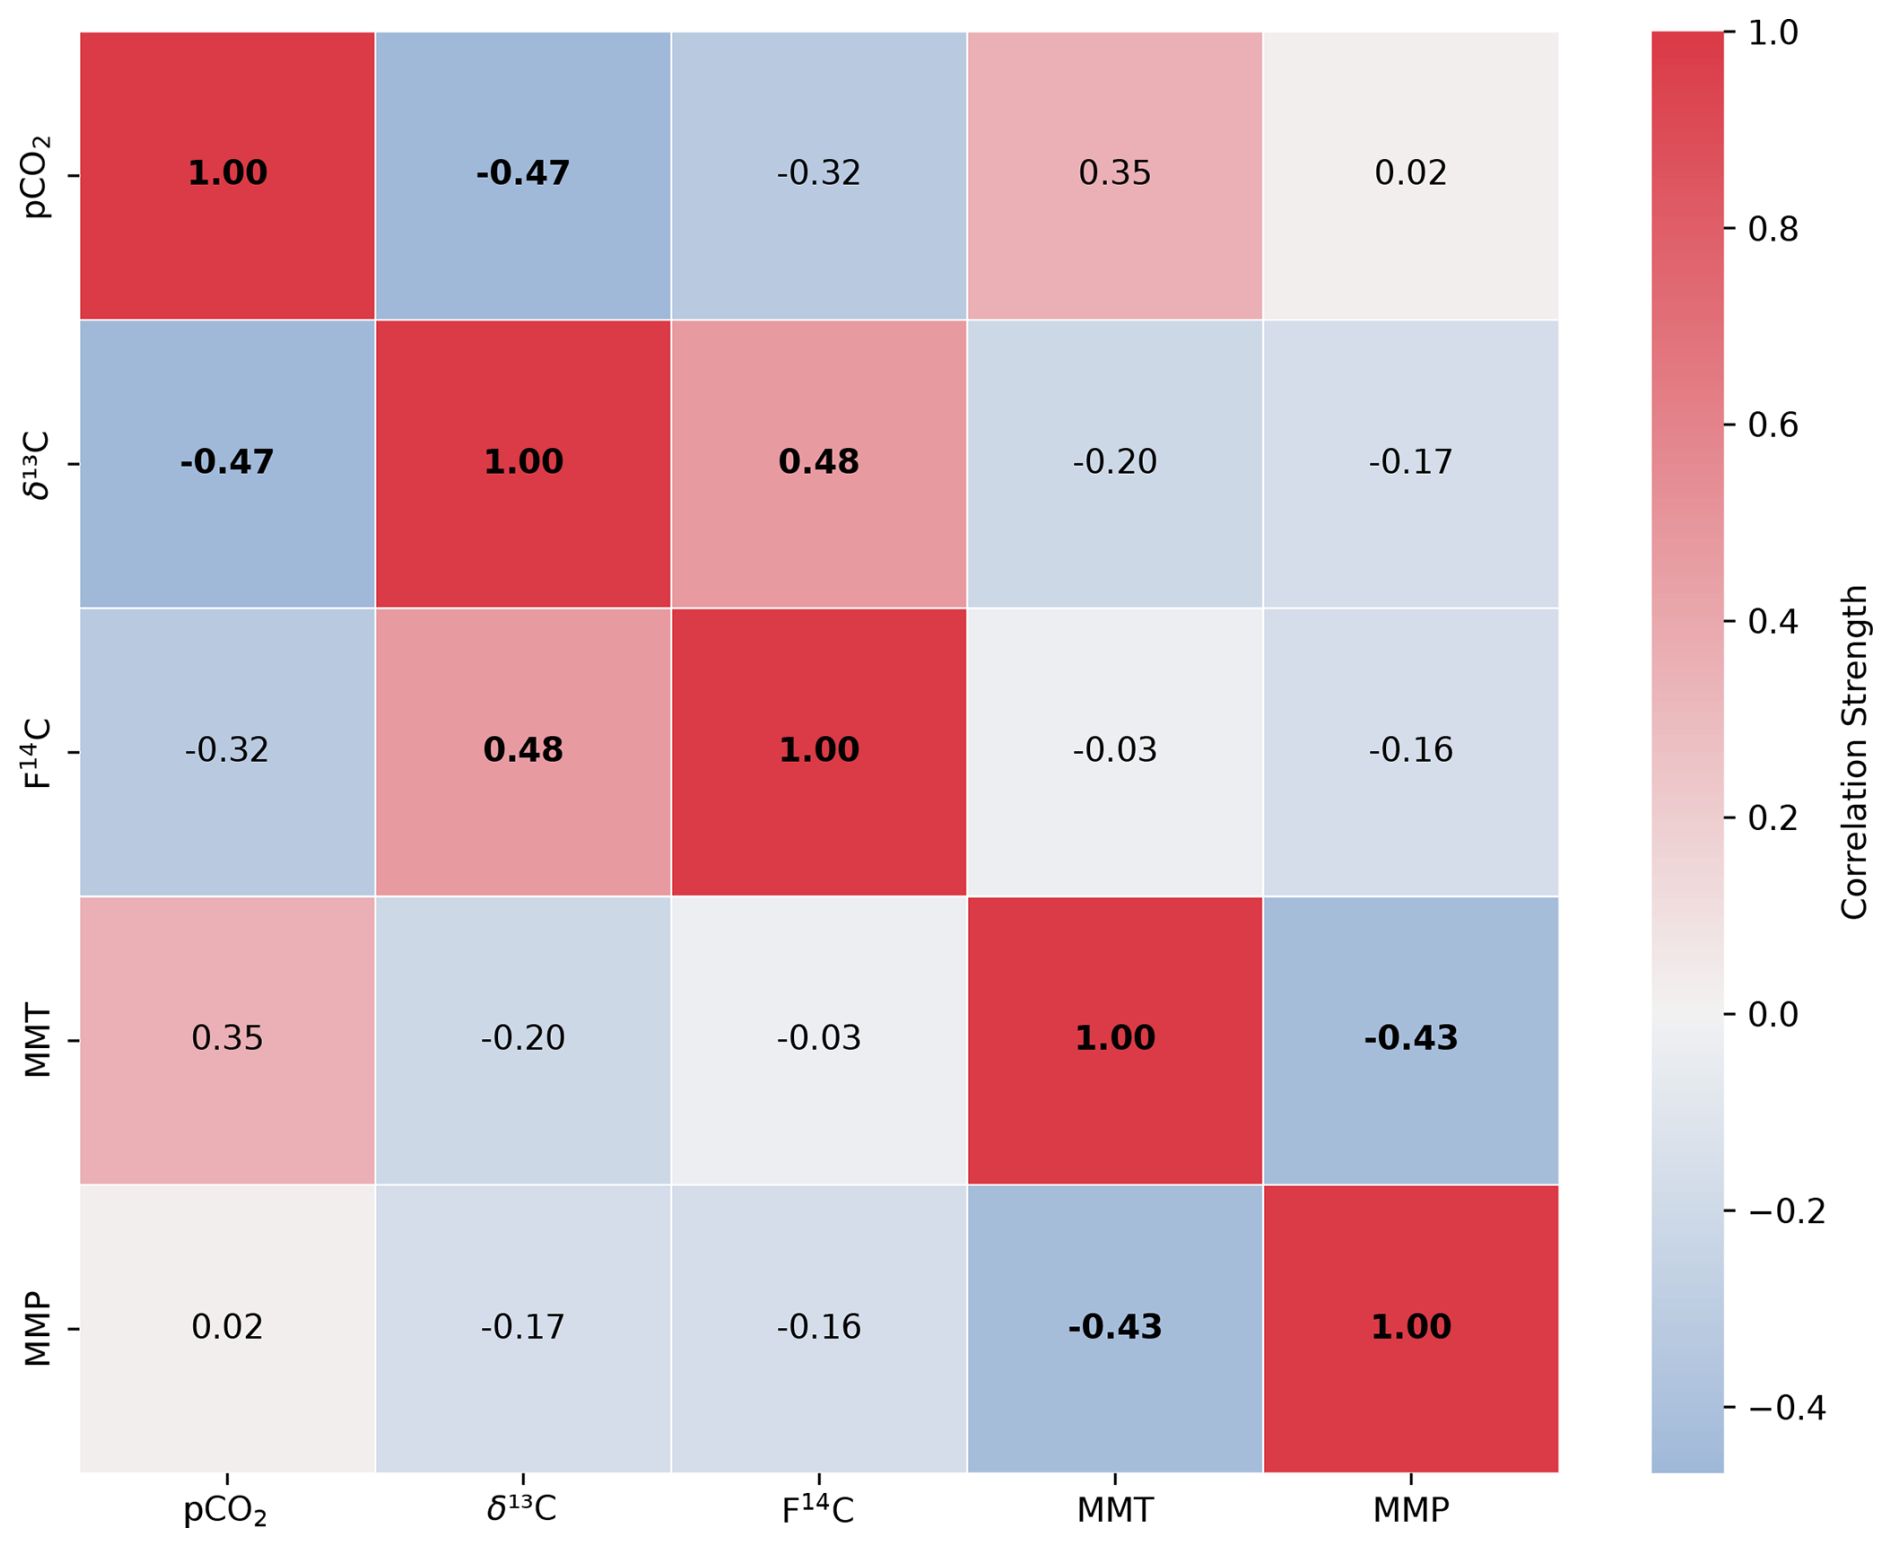
Figure A1Spearman's rank correlation matrix displaying the Spearman's rho of CO2 concentration, δ13C and F14C, mean monthly temperature (MMT), and mean monthly precipitation (MMP) from Fahy weather station from samples from soil depth borehole Shallow 1. Parameters with a significant correlation (positive or negative) are bolded, and the strength of the correlation is indicated by the blue to red colour bar.
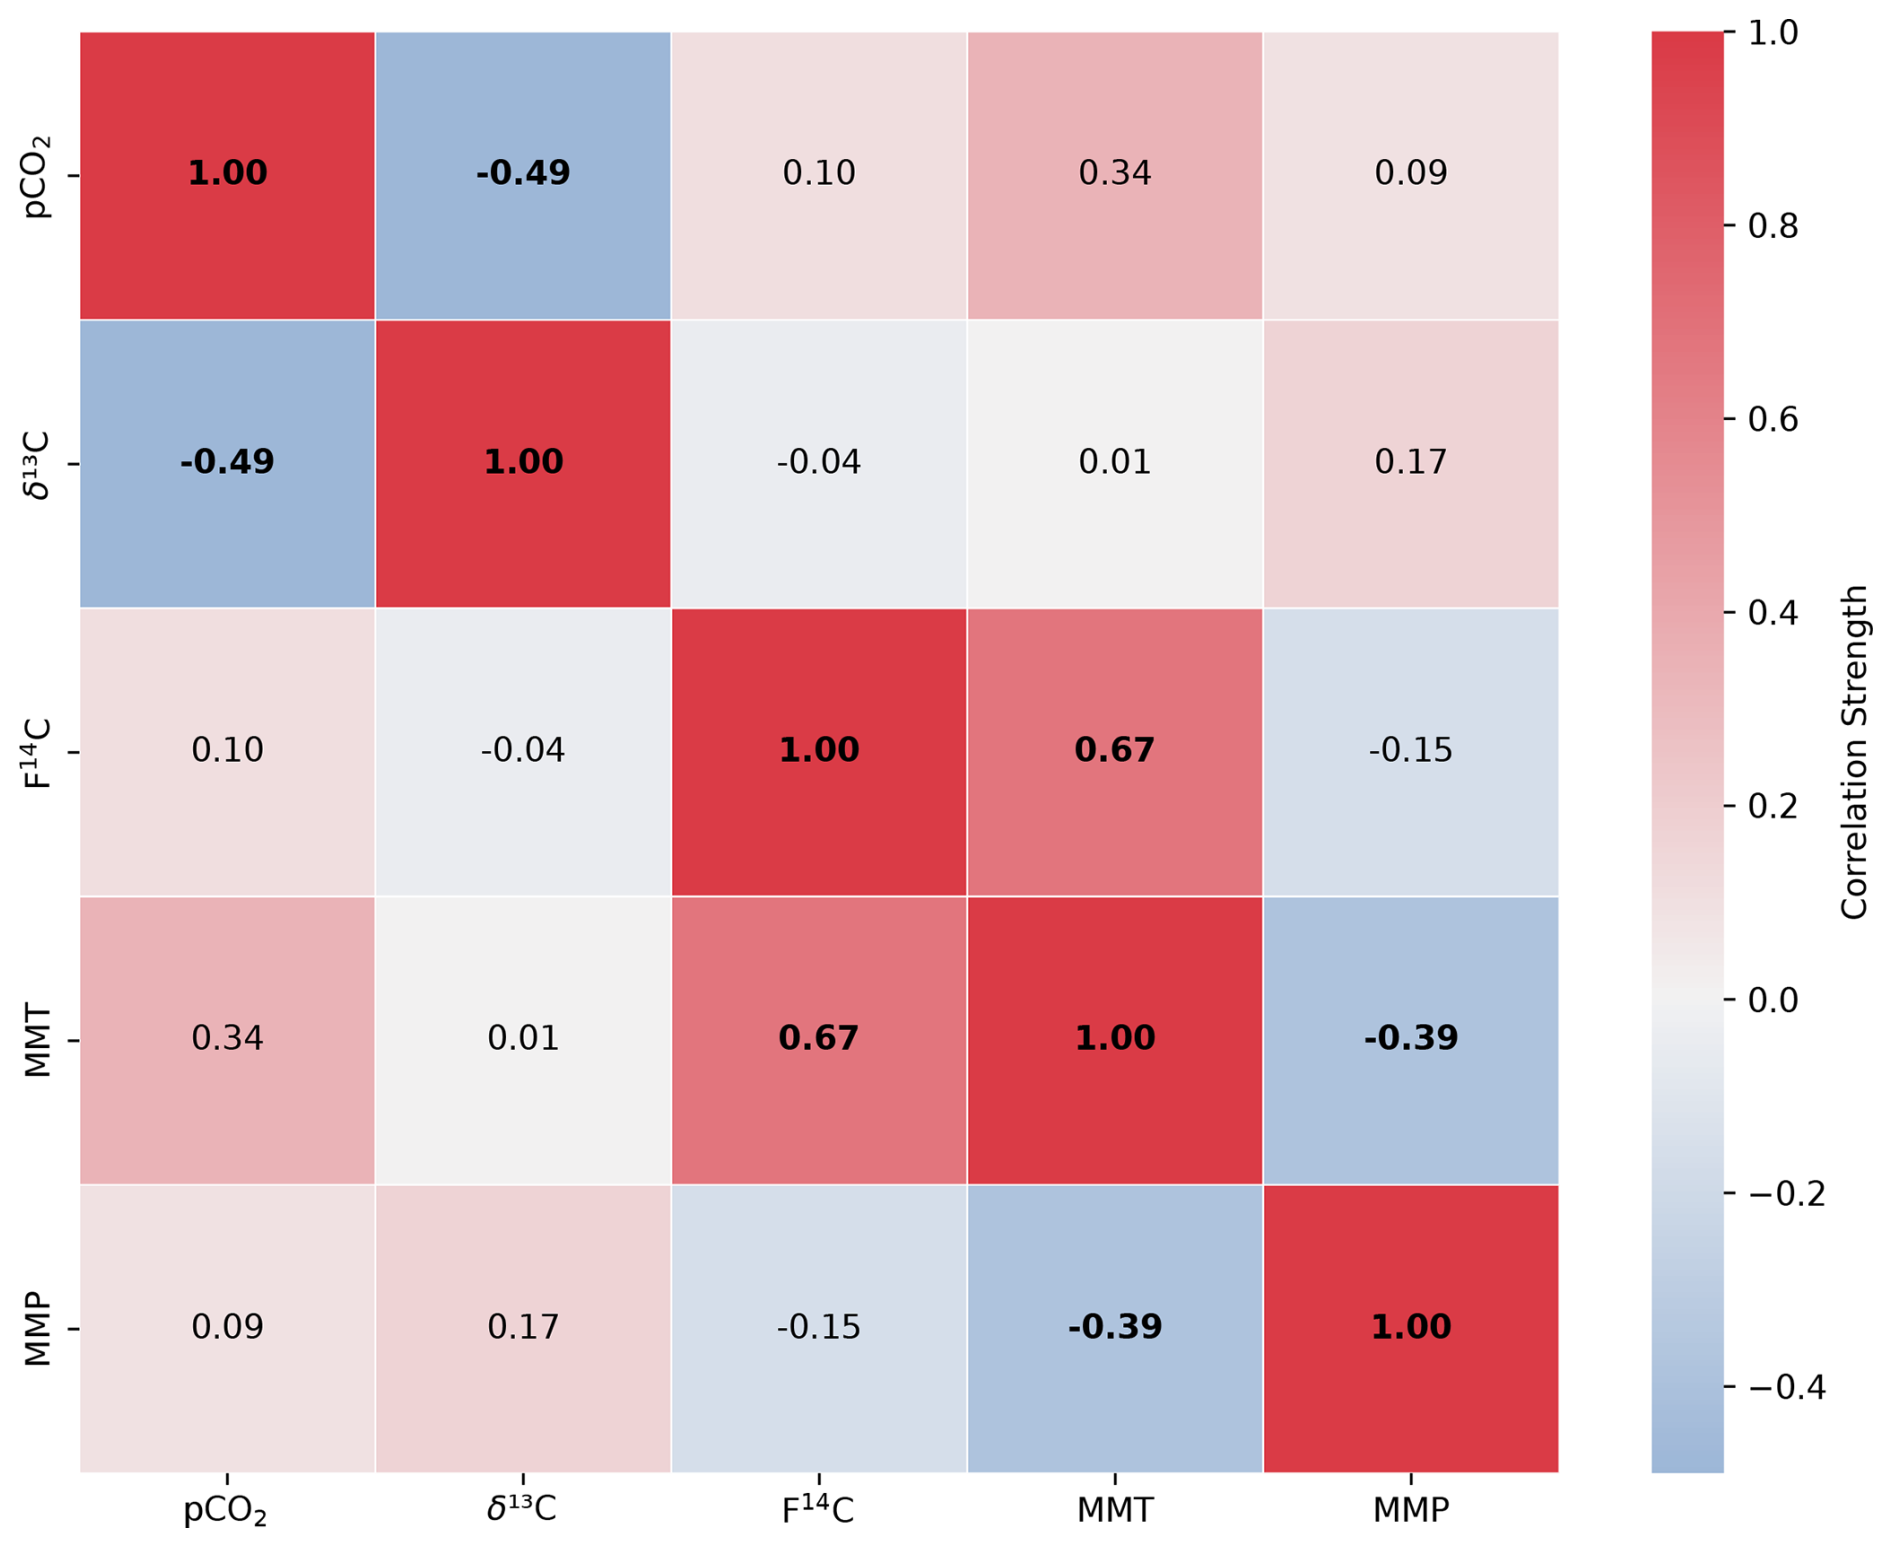
Figure A2Spearman's rank correlation matrix displaying the Spearman's rho of CO2 concentration, δ13C and F14C, mean monthly temperature (MMT), and mean monthly precipitation (MMP) from Fahy weather station from samples from soil depth borehole Shallow 2. Parameters with a significant correlation (positive or negative) are bolded, and the strength of the correlation is indicated by the blue to red colour bar.
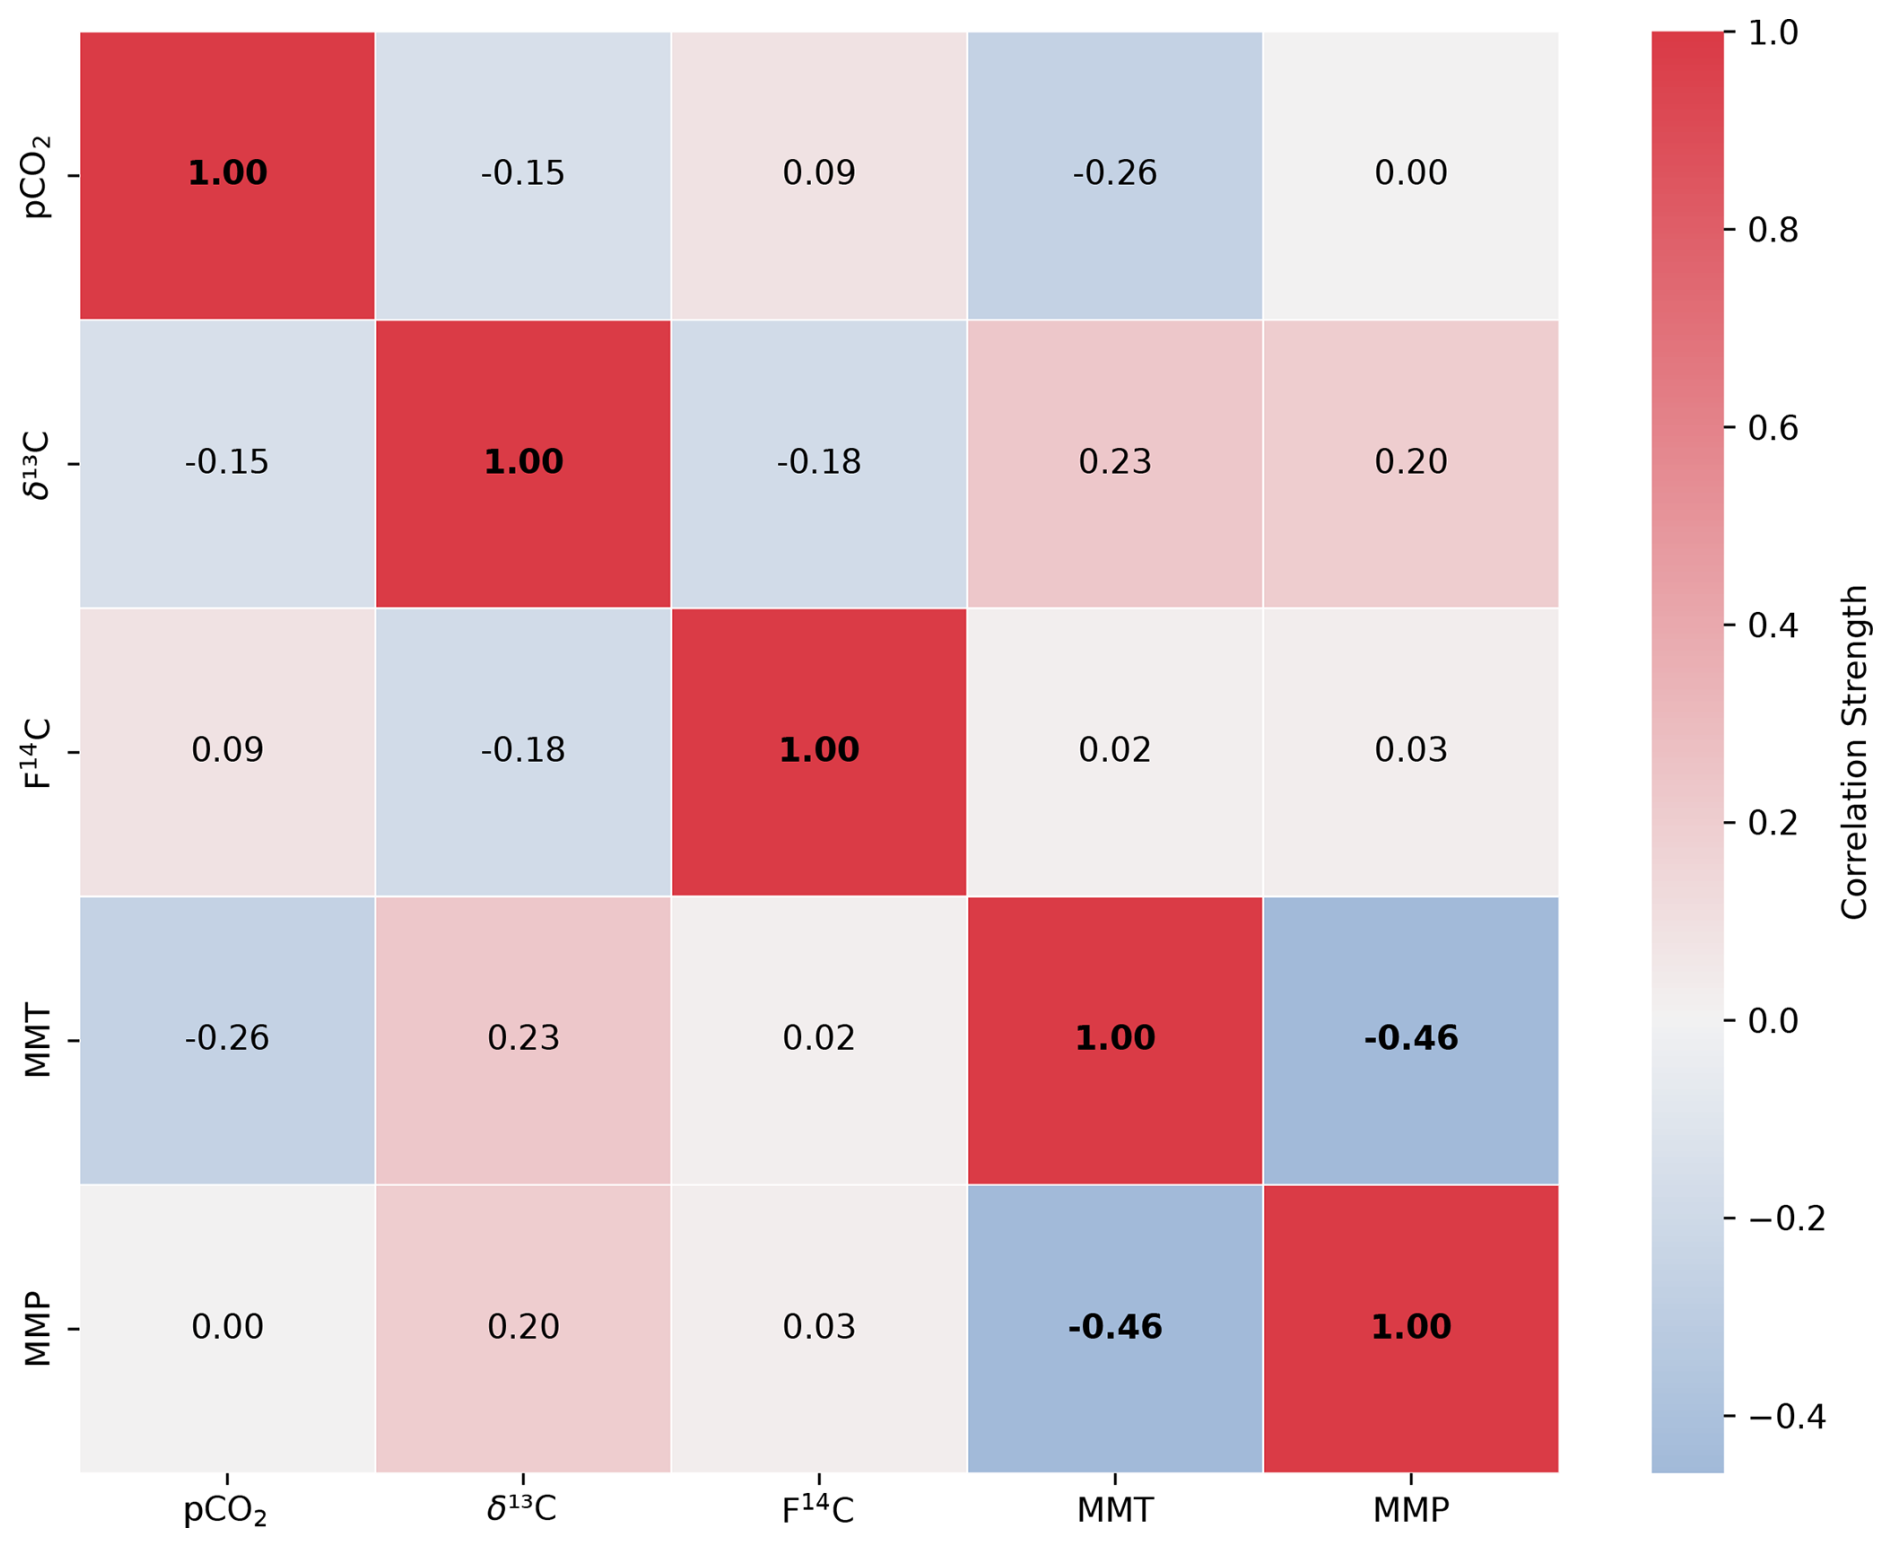
Figure A3Spearman's rank correlation matrix displaying the Spearman's rho of CO2 concentration, δ13C and F14C, mean monthly temperature (MMT), and mean monthly precipitation (MMP) from Fahy weather station from samples from unsaturated zone depth boreholes Deep 1 and Deep 2. Parameters with a significant correlation (positive or negative) are bolded, and the strength of the correlation is indicated by the blue to red colour bar.
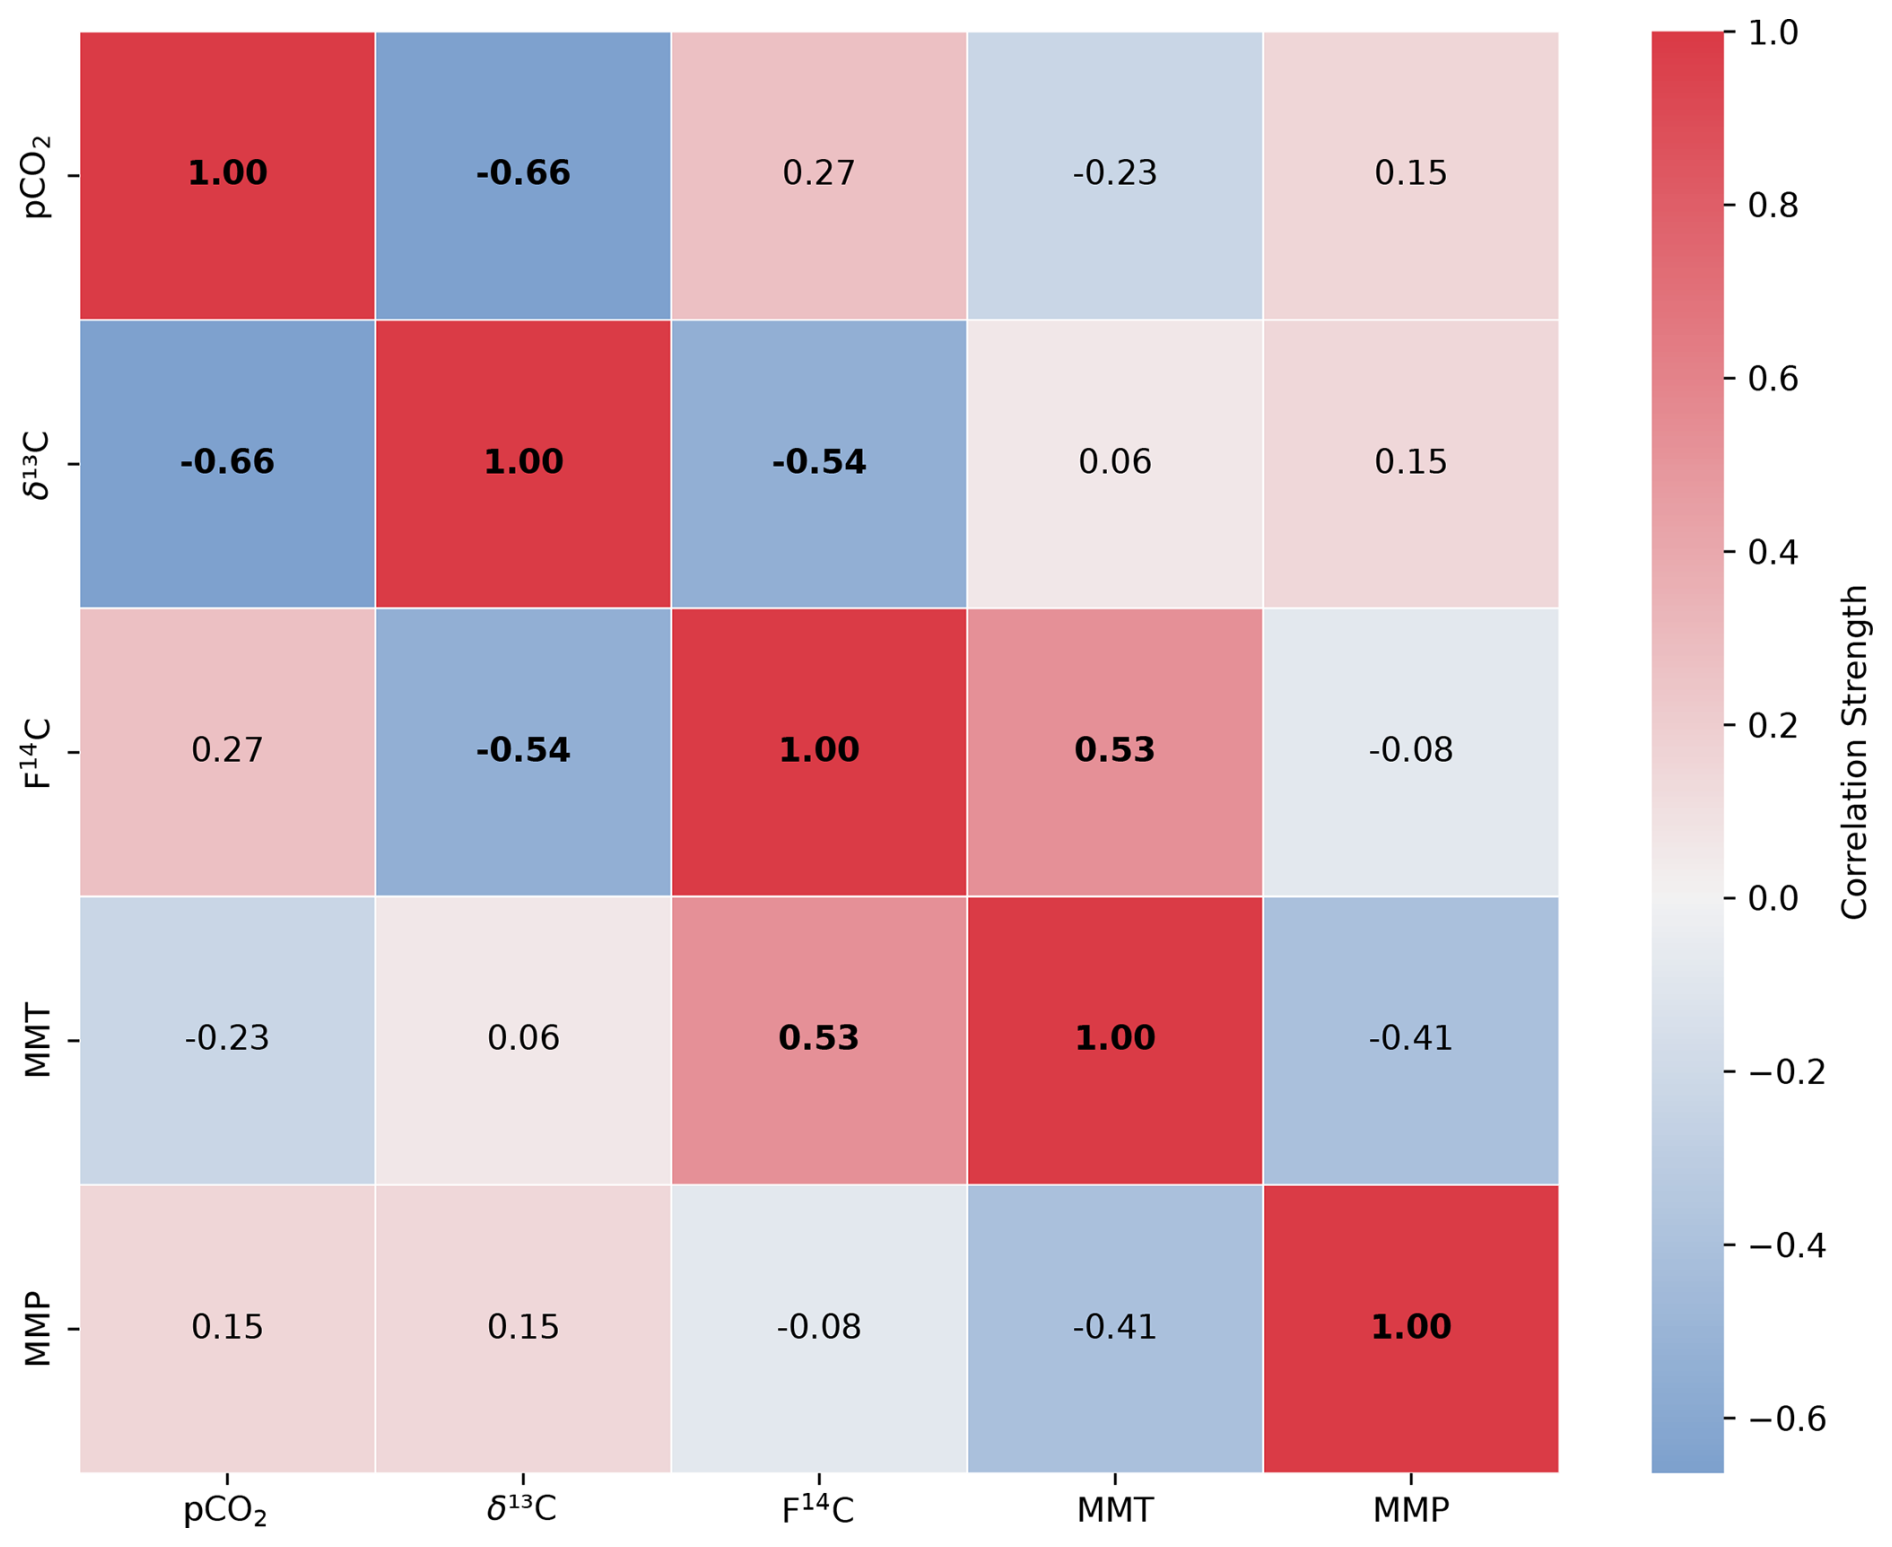
Figure A4Spearman's rank correlation matrix displaying the Spearman's rho of CO2 concentration, δ13C and F14C, mean monthly temperature (MMT), and mean monthly precipitation (MMP) from Fahy weather station from samples from unsaturated zone depth boreholes Deep 3 and Deep 4. Parameters with a significant correlation (positive or negative) are bolded, and the strength of the correlation is indicated by the blue to red colour bar.
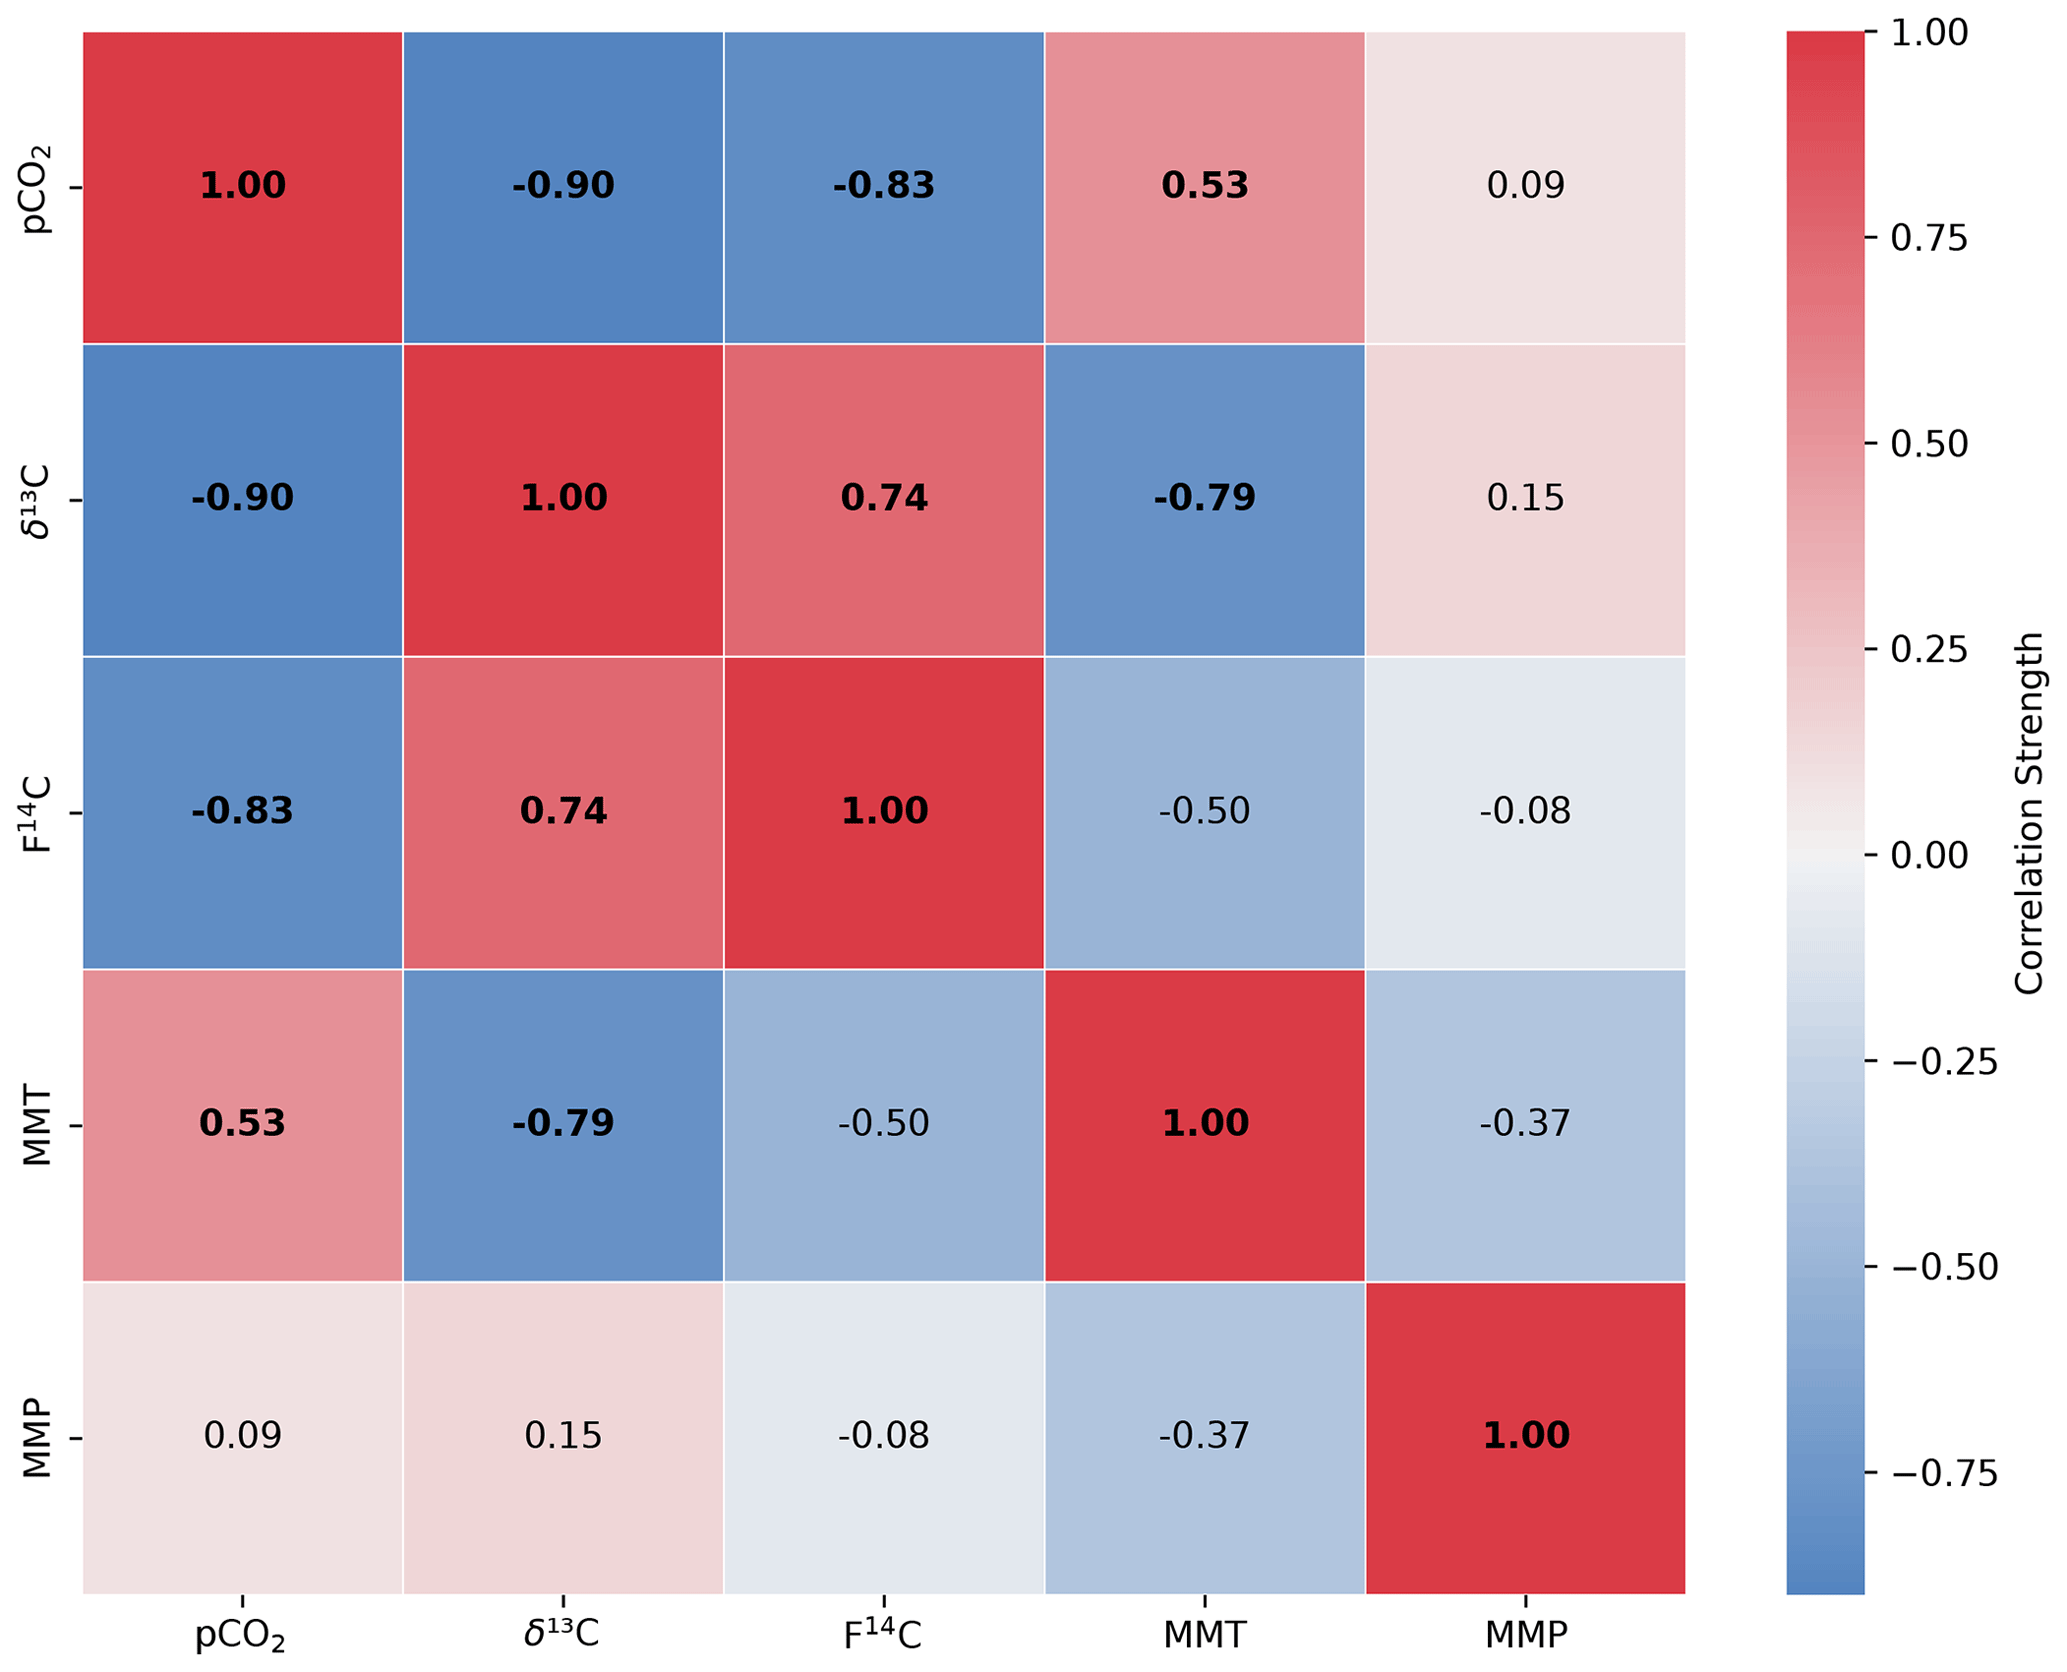
Figure A5Spearman's rank correlation matrix displaying the Spearman's rho of CO2 concentration, δ13C and F14C, mean monthly temperature (MMT), and mean monthly precipitation (MMP) from Fahy weather station from samples from the Downstream cave site. Parameters with a significant correlation (positive or negative) are bolded, and the strength of the correlation is indicated by the blue to red colour bar.
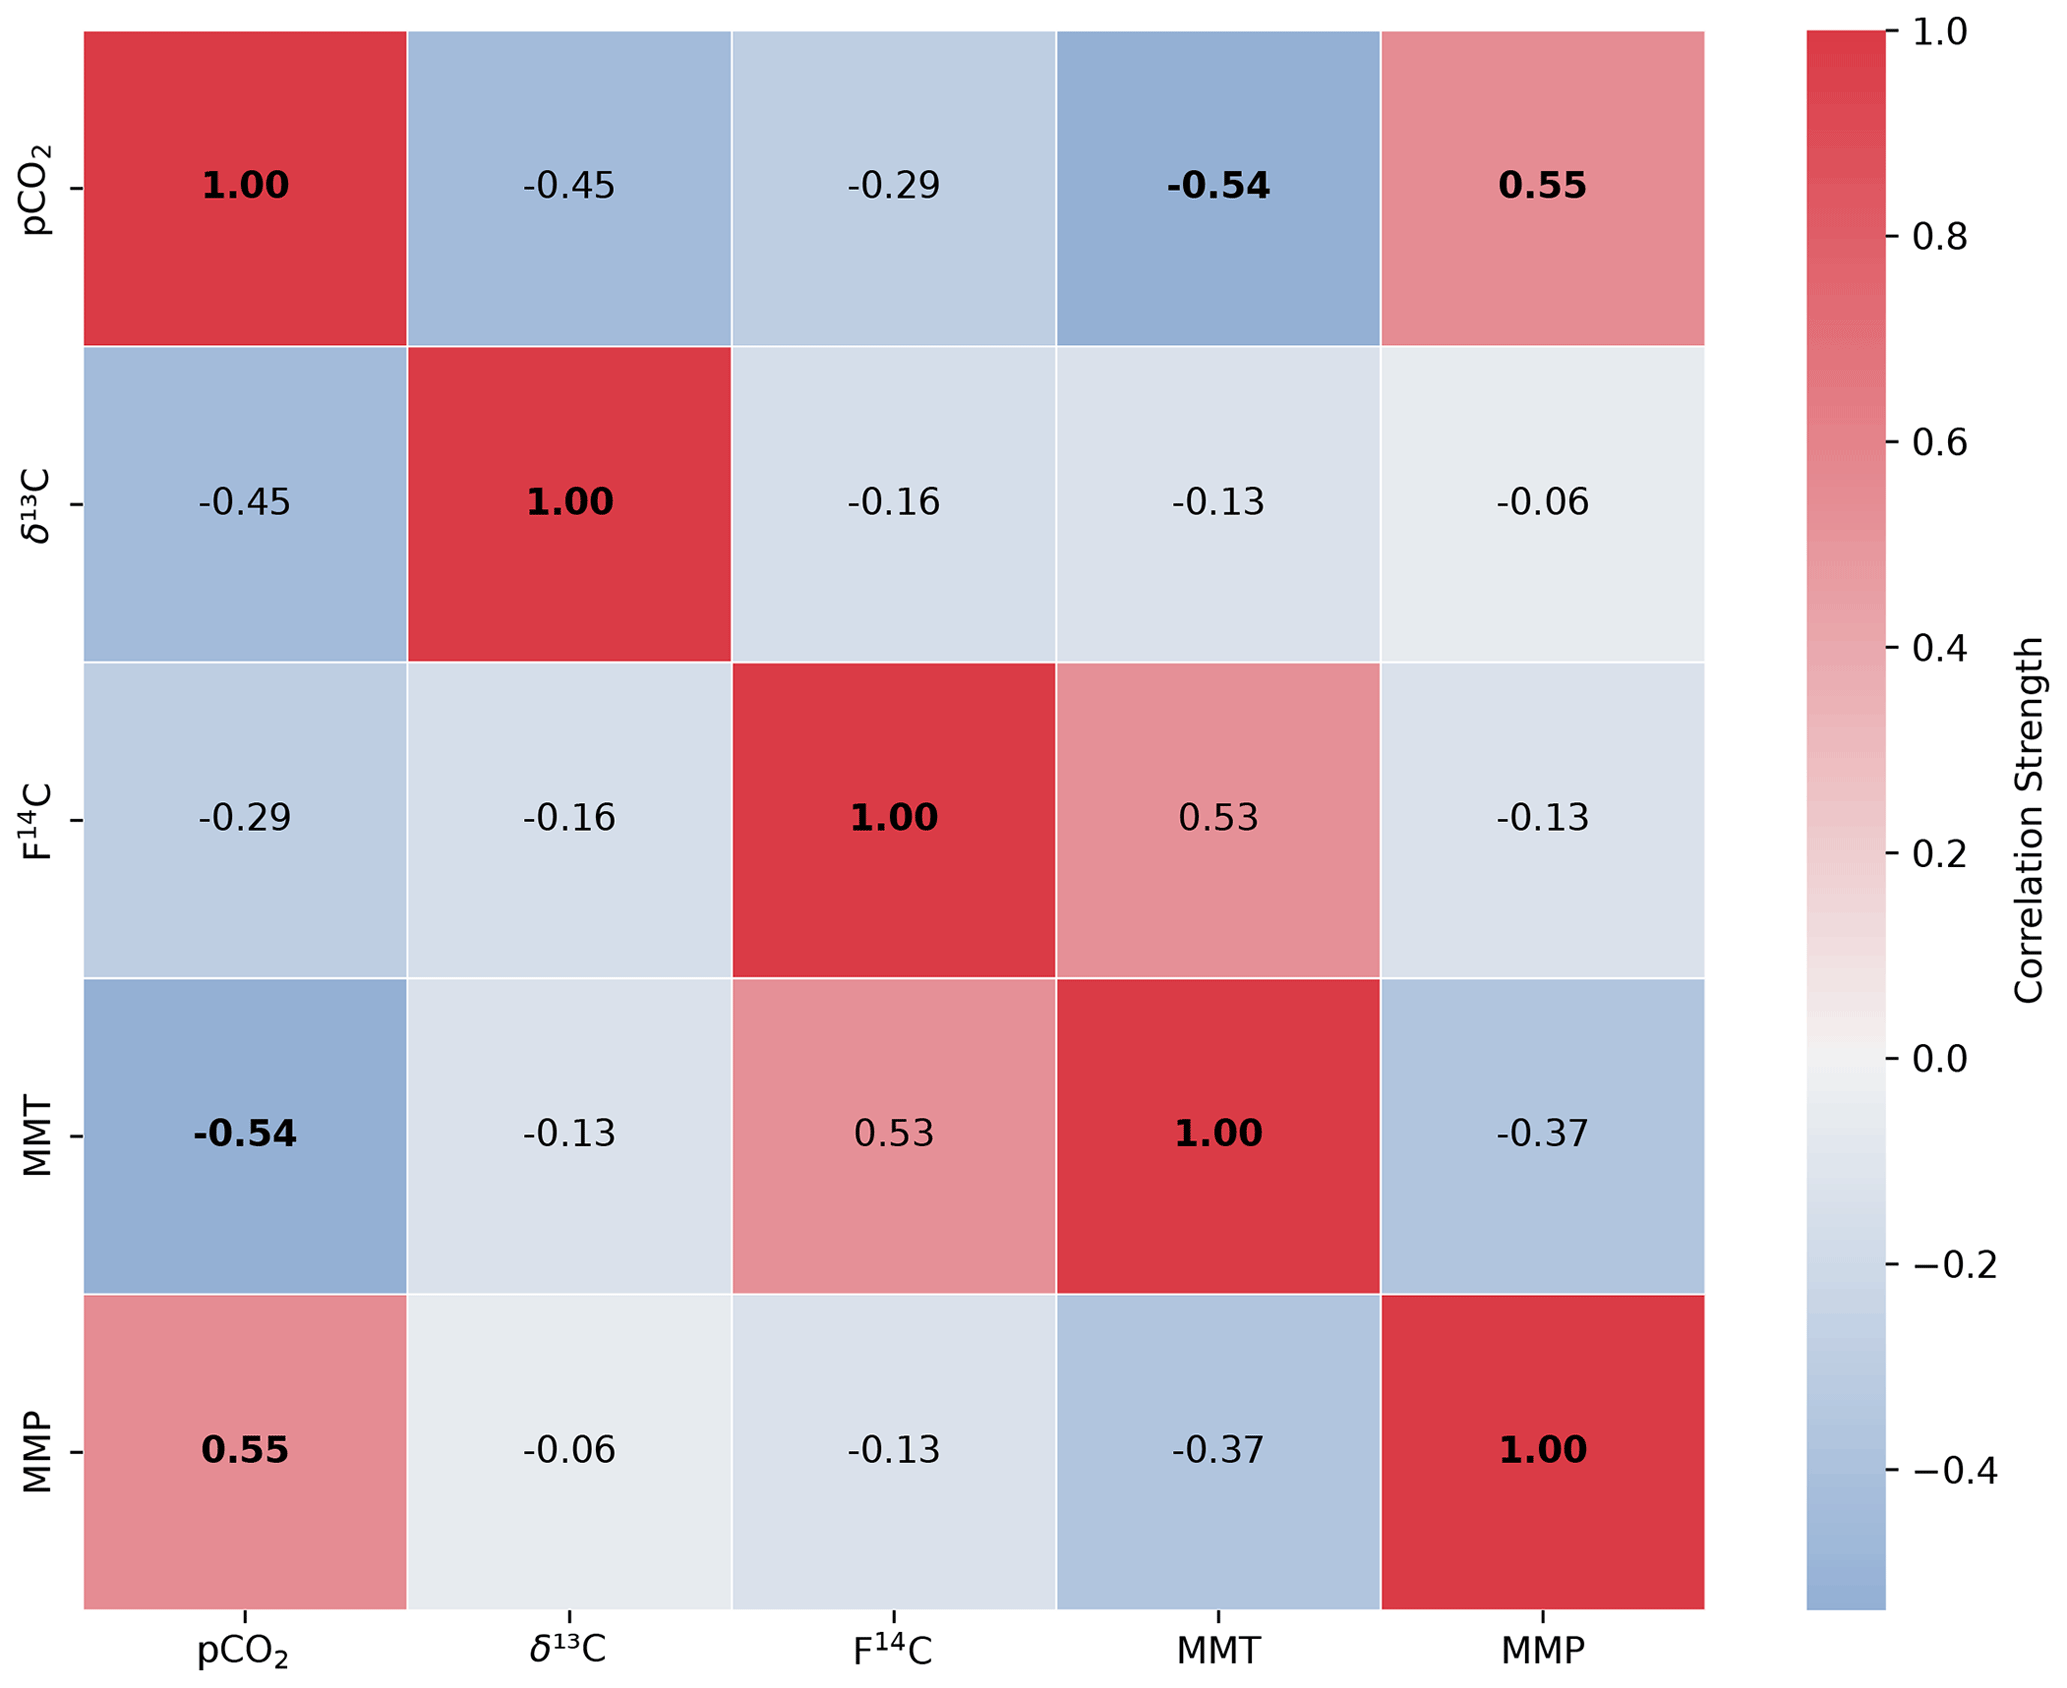
Figure A6Spearman's rank correlation matrix displaying the Spearman's rho of CO2 concentration, δ13C and F14C, mean monthly temperature (MMT), and mean monthly precipitation (MMP) from Fahy weather station from samples from the Upstream cave site. Parameters with a significant correlation (positive or negative) are bolded, and the strength of the correlation is indicated by the blue to red colour bar.
Table B1Drip water dissolved inorganic carbon F14C and AMS-derived δ13C from the actively dripping galleries near Upstream and Downstream.
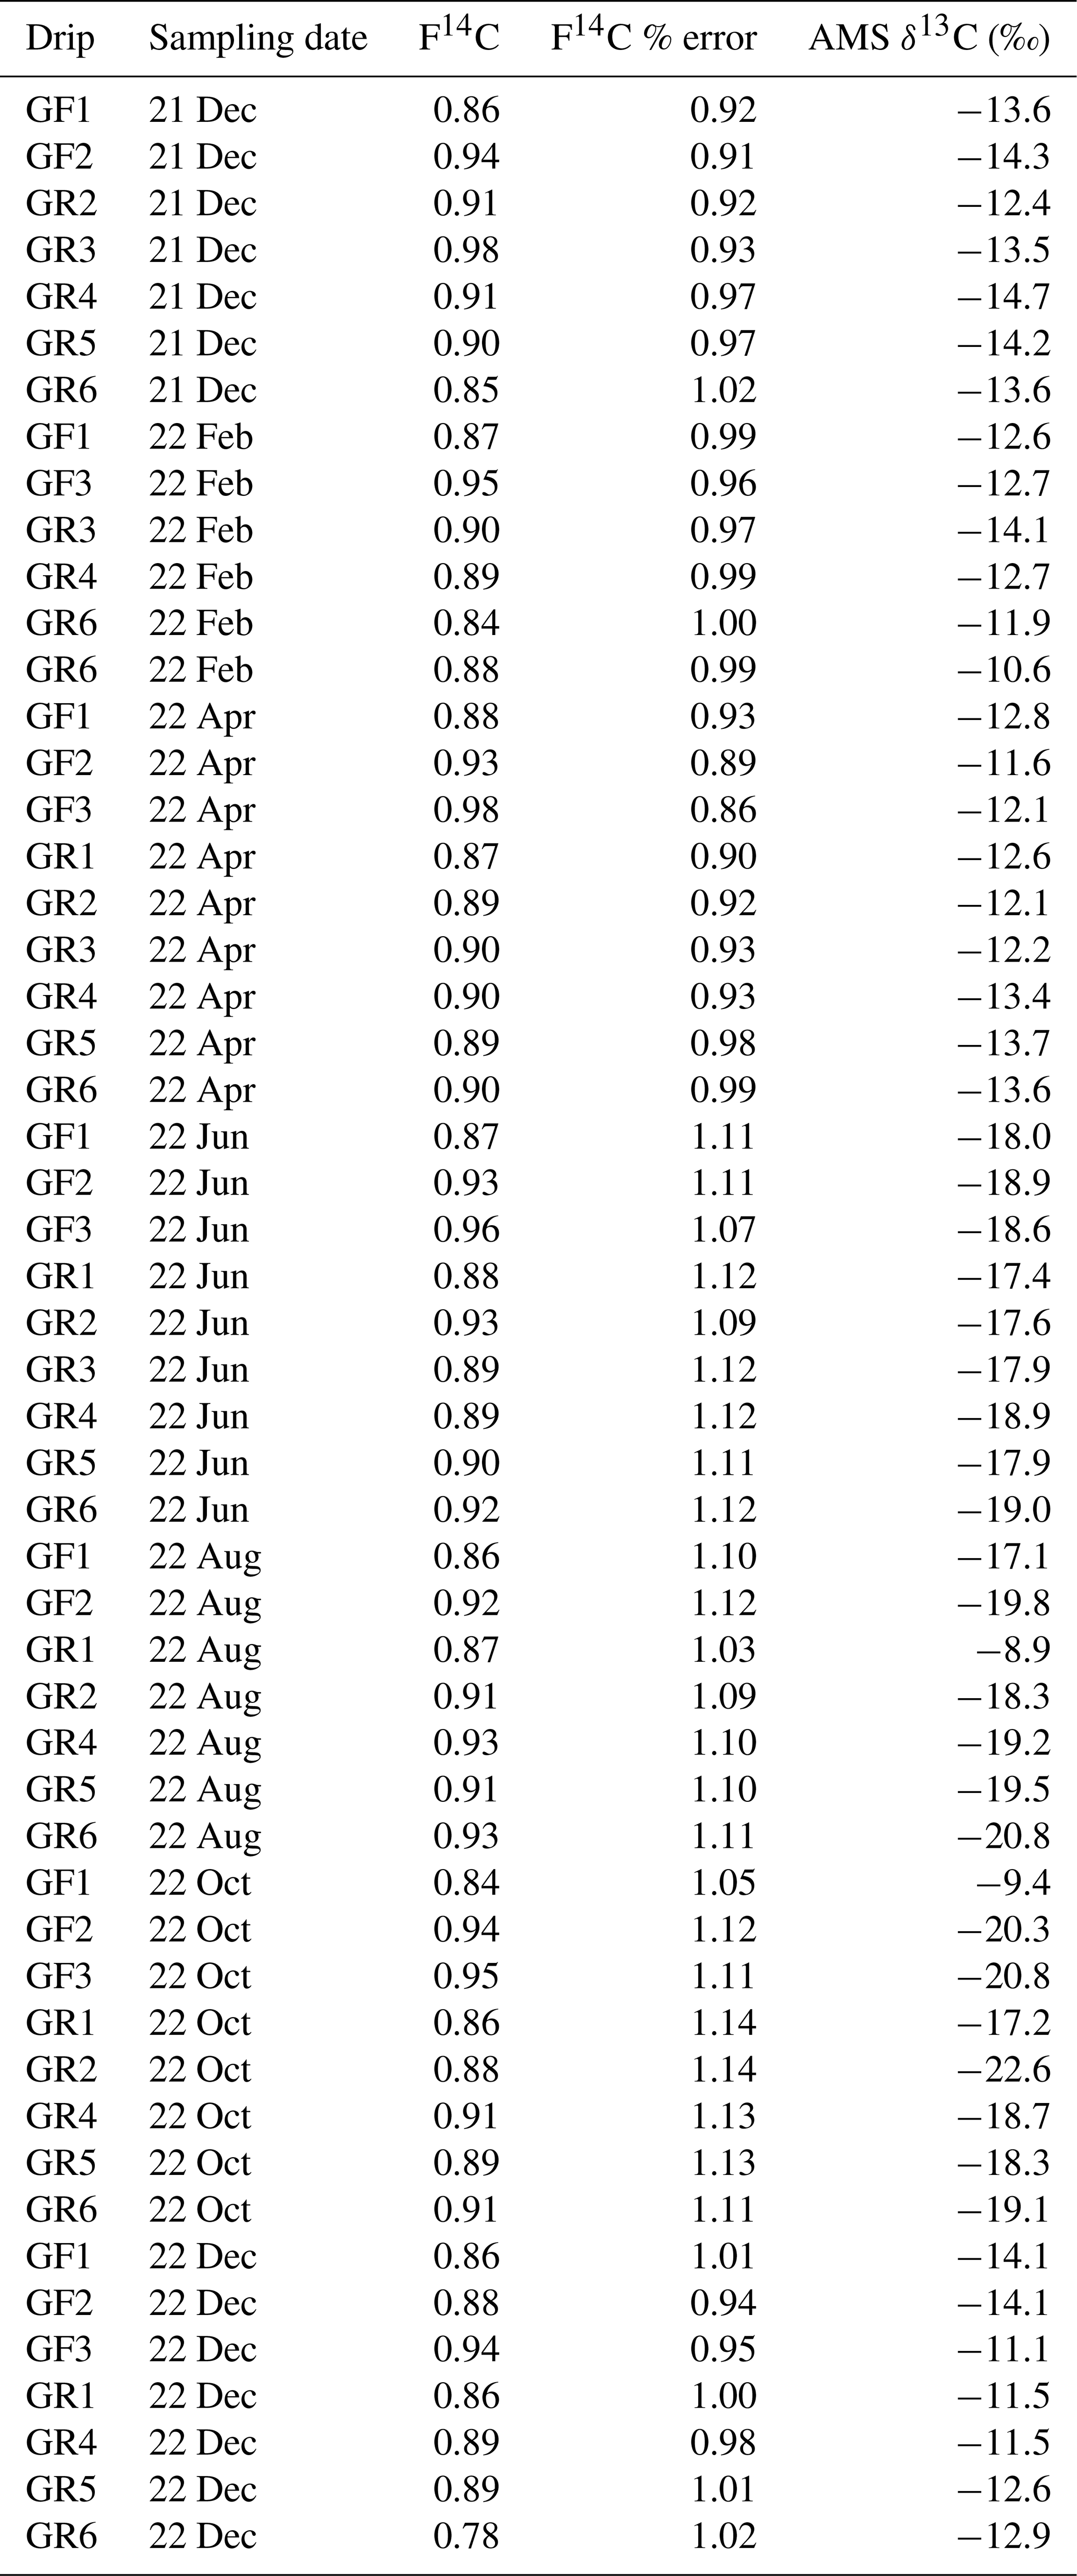
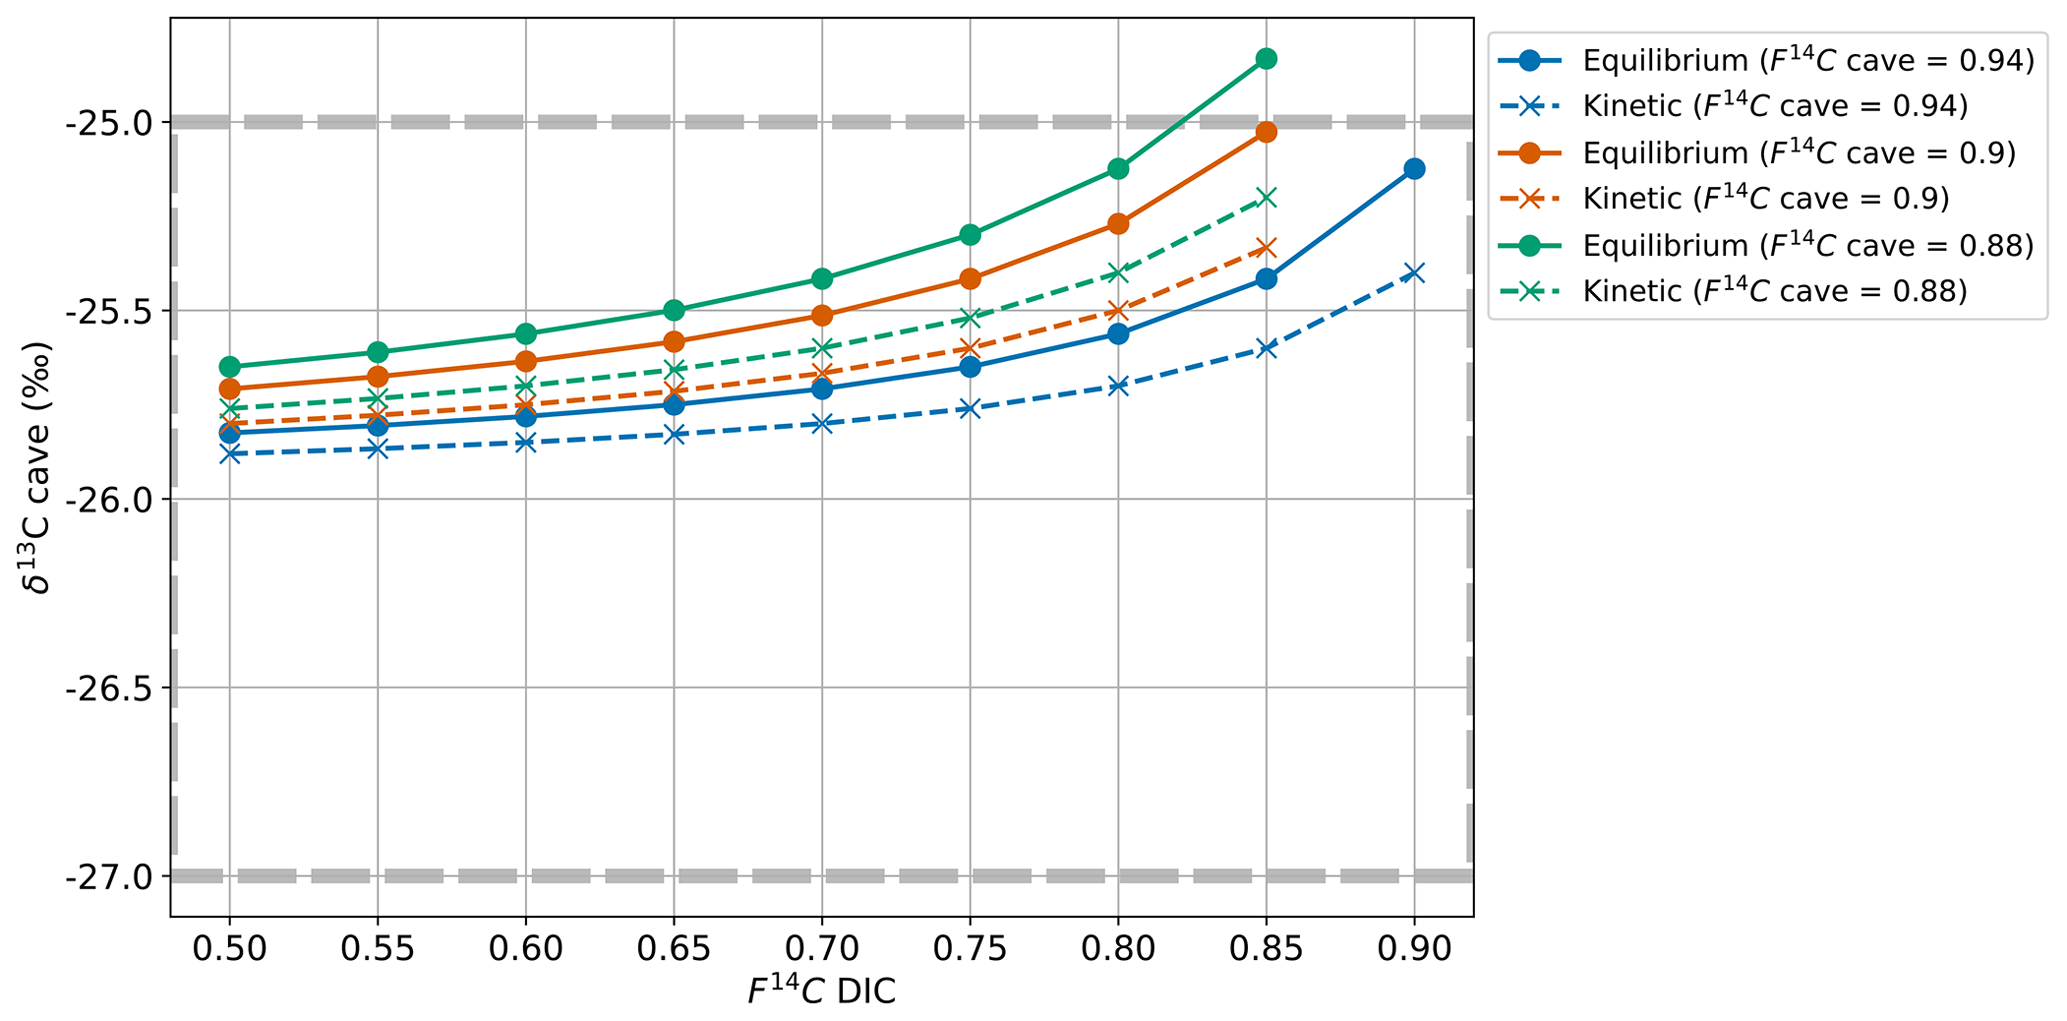
Figure C1Cave air δ13C for varying DIC F14C and cave air F14C values with equilibrium fractionation at −9.54 ‰ (solid lines) and kinetic fractionation at −10 ‰ (dashed lines).
The data, code for Spearman's rank statistics, and code to reproduce the model results are publicly available on Zenodo at https://doi.org/10.5281/zenodo.14253707 (djsarita, 2024).
SR: conceptualization, formal analysis, investigation, methodology, visualization, software, writing – original draft preparation. ML: conceptualization, resources, visualization, writing – review and editing. TL: methodology, validation, writing – review and editing. AH: methodology, writing – review and editing. SS: writing – review and editing. FAL: conceptualization, funding acquisition, project administration, resources, supervision, writing – review and editing.
The contact author has declared that none of the authors has any competing interests.
Publisher's note: Copernicus Publications remains neutral with regard to jurisdictional claims made in the text, published maps, institutional affiliations, or any other geographical representation in this paper. While Copernicus Publications makes every effort to include appropriate place names, the final responsibility lies with the authors.
We gratefully thank the staff of the Swiss Institute of Speleology and Karst Studies for their previous and continued work in Milandre cave and for their contribution of field assistance and expertise in karst science. Special thanks to Claudio Pastore for his assistance during the trip through the cave. We express our gratitude to the Spéléo Club Jura for the initial exploration of Milandre cave and for their persistent work and maintenance of the area. We also appreciate Daniel Pape for continued access to the cave entrance and boreholes. Thank you also to Madalina Jaggi, Oliver Kost, and Heather Stoll for providing access and support using the Picarro system. Graphitizations and AMS measurements were also assisted by Michael Staub and Gary Salazar. The constructive feedback from the two reviewers of this paper was greatly appreciated. Generative AI (ChatGPT versions 3.5, 4, and 4o) was used for code troubleshooting.
This research has been supported by the Schweizerischer Nationalfonds zur Förderung der Wissenschaftlichen Forschung (grant no. PZ00P2_186135).
This paper was edited by Steven Bouillon and reviewed by Silvia Frisia and one anonymous referee.
Affolter, S., Steinmann, P., Aemisegger, F., Purtschert, R., and Leuenberger, M.: Origin and percolation times of Milandre Cave drip water determined by tritium time series and beryllium-7 data from Switzerland, Journal of Environmental Radioactivity, 222, 106346, https://doi.org/10.1016/j.jenvrad.2020.106346, 2020.
Atkin, O. K., Sherlock, D., Fitter, A. H., Jarvis, S., Hughes, J. K., Campbell, C., Hurry, V., and Hodge, A.: Temperature dependence of respiration in roots colonized by arbuscular mycorrhizal fungi, New Phytologist, 182, 188–199, https://doi.org/10.1111/j.1469-8137.2008.02727.x, 2008.
Atkinson, T. C.: Carbon dioxide in the atmosphere of the unsaturated zone: An important control of groundwater hardness in limestones, J. Hydrol., 35, 111–123, https://doi.org/10.1016/0022-1694(77)90080-4, 1977.
Baldini, J. U. L., Bertram, R. A., and Ridley, H. E.: Ground air: A first approximation of the Earth's second largest reservoir of carbon dioxide gas, Sci. Total Environ., 616–617, 1007–1013, https://doi.org/10.1016/j.scitotenv.2017.10.218, 2018.
Benavente, J., Vadillo, I., Carrasco, F., Soler, A., Liñán, C., and Moral, F.: Air Carbon Dioxide Contents in the Vadose Zone of a Mediterranean Karst, Vadose Zone Journal, 9, 126–136, https://doi.org/10.2136/vzj2009.0027, 2010.
Benavente, J., Vadillo, I., Liñán, C., del Rosal, Y., and Carrasco, F.: Influence of the ventilation of a karst show cave on the surrounding vadose CO2 reservoir (Nerja, South Spain), Environmental Earth Sciences, 74, 7731–7740, https://doi.org/10.1007/s12665-015-4709-8, 2015.
Bergel, S. J., Carlson, P. E., Larson, T. E., Wood, C. T., Johnson, K. R., Banner, J. L., and Breecker, D. O.: Constraining the subsoil carbon source to cave-air CO2 and speleothem calcite in central Texas, Geochim. Cosmochim. Ac., 217, 112–127, https://doi.org/10.1016/j.gca.2017.08.017, 2017.
Biagioli, F., Coleine, C., Piano, E., Nicolosi, G., Poli, A., Prigione, V., Zanellati, A., Varese, C., Isaia, M., and Selbmann, L.: Microbial diversity and proxy species for human impact in Italian karst caves, Sci. Rep., 13, 689, https://doi.org/10.1038/s41598-022-26511-5, 2023.
Billings, S., Richter, D., and Yarie, J.: Soil carbon dioxide fluxes and profile concentrations in two boreal forests, Canadian Journal of Forest Research, 28, https://doi.org/10.1139/cjfr-28-12-1773, 1998.
Boyno, G., Yerli, C., Çakmakci, T., Sahin, U., and Demir, S.: The effect of arbuscular mycorrhizal fungi on carbon dioxide (CO2) emission from turfgrass soil under different irrigation intervals, Journal of Water and Climate Change, 15, 541–553, https://doi.org/10.2166/wcc.2024.482, 2024.
Brantley, S. L., Goldhaber, M. B., and Vala, R. K.: Crossing disciplines and scales to understand the critical zone, Elements, 3, 8, https://doi.org/10.2113/gselements.3.5.307, 2007.
Breecker, D. O.: Atmospheric pCO2 control on speleothem stable carbon isotope compositions, Earth Planet. Sc. Lett., 458, 58–68, https://doi.org/10.1016/j.epsl.2016.10.042, 2017.
Breecker, D. O., Payne, A. E., Quade, J., Banner, J. L., Ball, C. E., Meyer, K. W., and Cowan, B. D.: The sources and sinks of CO2 in caves under mixed woodland and grassland vegetation, Geochim. Cosmochim. Ac., 96, 230–246, https://doi.org/10.1016/j.gca.2012.08.023, 2012.
Buzjak, N., Gabrovšek, F., Perşoiu, A., Pennos, C., Paar, D., and Bočić, N.: CO2 Emission from Caves by Temperature-Driven Air Circulation—Insights from Samograd Cave, Croatia, Climate, 12, https://doi.org/10.3390/cli12120199, 2024.
Campeau, A., Bishop, K., Amvrosiadi, N., Billett, M. F., Garnett, M. H., Laudon, H., Öquist, M. G., and Wallin, M. B.: Current forest carbon fixation fuels stream CO2 emissions, Nature Communications, 10, https://doi.org/10.1038/s41467-019-09922-3, 2019.
Chen, J., Li, Q., He, Q., Schröder, H. C., Lu, Z., and Yuan, D.: Influence of CO2/ on Microbial Communities in Two Karst Caves with High CO2, Journal of Earth Science, 34, 145 155, https://doi.org/10.1007/s12583-020-1368-9, 2023.
Cheng, K., Liu, Z., Xiong, K., He, Q., Li, Y., Cai, L., and Chen, Y.: Migration of Dissolved Organic Matter in the Epikarst Fissured Soil of South China Karst, Land, 12, https://doi.org/10.3390/land12040887, 2023.
Chiodini, G., Caliro, S., Cardellini, C., Avino, R., Granieri, D., and Schmidt, A.: Carbon isotopic composition of soil CO2 efflux, a powerful method to discriminate different sources feeding soil CO2 degassing in volcanic-hydrothermal areas, Earth Planet. Sc. Lett., 274, 372–379, https://doi.org/10.1016/j.epsl.2008.07.051, 2008.
Chiti, T., Neubert, R., Janssens, I., Curiel Yuste, J., Sirignano, C., and Certini, G.: Radiocarbon based assessment of soil organic matter contribution to soil respiration in a pine stand of the Campine region, Belgium, Plant and Soil, 344, 273–282, https://doi.org/10.1007/s11104-011-0745-7, 2011.
Diao, H., Wang, A., Yuan, F., Guan, D., and Wu, J.: Autotrophic respiration modulates the carbon isotope composition of soil respiration in a mixed forest, Sci. Total Environ., 807, 150834, https://doi.org/10.1016/j.scitotenv.2021.150834, 2022.
Ding, Y., Wang, D., Zhao, G., Chen, S., Sun, T., Sun, H., Wu, C., Li, Y., Yu, Z., Li, Y., and Chen, Z.: The contribution of wetland plant litter to soil carbon pool: Decomposition rates and priming effects, Environmental Research, 224, 115575, https://doi.org/10.1016/j.envres.2023.115575, 2023.
djsarita: djsarita/Milandre-gas-data: Gas data (data), Zenodo [data set], https://doi.org/10.5281/zenodo.14253707, 2024.
Dulinski, M. and Rozanski, K.: Formation of 13C/12C Isotope Ratios in Speleothems: A Semi-Dynamic Model, Radiocarbon, 32, 7–16, https://doi.org/10.1017/S0033822200039904, 1990.
Fairchild, I. J. and Baker, A.: Speleothem Science: From Process to Past Environments, John Wiley & Sons, https://doi.org/10.1002/9781444361094.ch5, 2012.
Fitter, A. H., Heinemeyer, A., and Staddon, P. L.: The impact of elevated CO2 and global climate change on arbuscular mycorrhizas: A mycocentric approach, New Phytologist, 147, 179–187, https://doi.org/10.1046/j.1469-8137.2000.00680.x, 2000.
Fohlmeister, J., Scholz, D., Kromer, B., and Mangini, A.: Modelling carbon isotopes of carbonates in cave drip water, Geochim. Cosmochim. Ac., 75, 5219–5228, https://doi.org/10.1016/j.gca.2011.06.023, 2011.
Frieling, J., Svensen, H. H., Planke, S., Cramwinckel, M. J., Selnes, H., and Sluijs, A.: Thermogenic methane release as a cause for the long duration of the PETM, P. Natl. Acad. Sci. USA, 113, 12059–12064, https://doi.org/10.1073/pnas.1603348113, 2016.
Frisia, S., Fairchild, I. J., Fohlmeister, J., Miorandi, R., Spötl, C., and Borsato, A.: Carbon mass-balance modelling and carbon isotope exchange processes in dynamic caves, Geochim. Cosmochim. Ac., 75, 380–400, https://doi.org/10.1016/j.gca.2010.10.021, 2011.
Garagnon, J., Luetscher, M., and Weber, E.: Ventilation regime in a karstic system (Milandre Cave, Switzerland), Conference: 18th International Congress of Speleology, Savoie Mont Blanc, arXiv [preprint], https://doi.org/10.48550/arXiv.2304.12819, 2022.
Gherman, V. D., Boboescu, I. Z., Pap, B., Kondorosi, É., Gherman, G., and Maróti, G.: An Acidophilic Bacterial-Archaeal-Fungal Ecosystem Linked to Formation of Ferruginous Crusts and Stalactites, Geomicrobiology Journal, 31, 407–418, https://doi.org/10.1080/01490451.2013.836580, 2014.
Gigon, R. and Wenger, R.: Inventaire spéléologique de la Suisse, canton du Jura, Commission Spéléologie de la Société helvétique des sciences naturelles, La Chaux-de-Fonds, 1986.
Girault, F., Adhikari, L. B., France-Lanord, C., Agrinier, P., Koirala, B. P., Bhattarai, M., Mahat, S. S., Groppo, C., Rolfo, F., Bollinger, L., and Perrier, F.: Persistent CO2 emissions and hydrothermal unrest following the 2015 earthquake in Nepal, Nature Communications, 9, 2956, https://doi.org/10.1038/s41467-018-05138-z, 2018.
Gogoleva, N. E., Nasyrova, M. A., Balkin, A. S., Chervyatsova, O. Y., Kuzmina, L. Y., Shagimardanova, E. I., Gogolev, Y. V., and Plotnikov, A. O.: Flourishing in Darkness: Protist Communities of Water Sites in Shulgan-Tash Cave (Southern Urals, Russia), Diversity, 16, https://doi.org/10.3390/d16090526, 2024.
Hasenmueller, E. A., Gu, X., Weitzman, J. N., Adams, T. S., Stinchcomb, G. E., Eissenstat, D. M., Drohan, P. J., Brantley, S. L., and Kaye, J. P.: Weathering of rock to regolith: The activity of deep roots in bedrock fractures, Geoderma, 300, 11–31, https://doi.org/10.1016/j.geoderma.2017.03.020, 2017.
Hashimoto, S. and Komatsu, H.: Relationships between soil CO2 concentration and CO2 production, temperature, water content, and gas diffusivity: Implications for field studies through sensitivity analyses, Journal of Forest Research, 11, 41–50, https://doi.org/10.1007/s10310-005-0185-4, 2006.
Jeannin, P.-Y.: Structure et comportement hydraulique des aquifères karstiques, [Unpublished doctoral dissertation], University of Neuchâtel, 1998.
Jeannin, P.-Y., Hessenauer, M., Malard, A., and Chapuis, V.: Impact of global change on karst groundwater mineralization in the Jura Mountains, Sci. Total Environ., 541, 1208–1221, https://doi.org/10.1016/j.scitotenv.2015.10.008, 2016.
Kähkönen, M., Wittmann, C., Kurola, J., Ilvesniemi, H., and Salkinoja-Salonen, M.: Microbial activity of boreal forest soil in a cold climate, Boreal Environment Research, 6, 19–28, 2001.
Keeling, C. D.: The concentration and isotopic abundances of carbon dioxide in rural and marine air, Geochim. Cosmochim. Ac., 24, 277–298, https://doi.org/10.1016/0016-7037(61)90023-0, 1961.
Keller, C. K.: Carbon Exports from Terrestrial Ecosystems: A Critical-Zone Framework, Ecosystems, 22, 1691–1705, https://doi.org/10.1007/s10021-019-00375-9, 2019.
Kiers, E. T., Duhamel, M., Beesetty, Y., Mensah, J. A., Franken, O., Verbruggen, E., Fellbaum, C. R., Kowalchuk, G. A., Hart, M. M., Bago, A., Palmer, T. M., West, S. A., Vandenkoornhuyse, P., Jansa, J., and Bücking, H.: Reciprocal Rewards Stabilize Cooperation in the Mycorrhizal Symbiosism, Science, 333, 880–882, https://doi.org/10.1126/science.1208473, 2011.
Kokoska, S. and Zwillinger, D.: CRC Standard Probability and Statistics Tables and Formulae, Student Edition, CRC Press, ISBN-13: 978-1-4822-7384-7, 2000.
Kosznik-Kwaśnicka, K., Golec, P., Jaroszewicz, W., Lubomska, D., and Piechowicz, L.: Into the Unknown: Microbial Communities in Caves, Their Role, and Potential Use, Microorganisms, 10, https://doi.org/10.3390/microorganisms10020222, 2022.
Kottek, M., Grieser, J., Beck, C., Rudolf, B., and Rubel, F.: World Map of the Köppen-Geiger Climate Classification Updated, Meteorologische Zeitschrift, 15, 259–263, https://doi.org/10.1127/0941-2948/2006/0130, 2006.
Kukuljan, L., Gabrovšek, F., Covington, M. D., and Johnston, V. E.: CO2 dynamics and heterogeneity in a cave atmosphere: Role of ventilation patterns and airflow pathways, Theoretical and Applied Climatology, 146, 91–109, https://doi.org/10.1007/s00704-021-03722-w, 2021.
Lekberg, Y. and Koide, R. T.: Effect of soil moisture and temperature during fallow on survival of contrasting isolates of arbuscular mycorrhizal fungi, Botany, 86, 1117–1124, https://doi.org/10.1139/B08-077, 2008.
Li, Y., Yang, Y., Wang, X., Luo, W., Zhao, J., Sun, Z., Ye, Z., Chen, X., Shi, X., Xu, Y., and Baker, J. L.: Sources and transport of CO2 in the karst system of Jiguan Cave, Funiu Mountains, China, Sci. Total Environ., 918, 170507, https://doi.org/10.1016/j.scitotenv.2024.170507, 2024.
Martin-Pozas, T., Cuezva, S., Fernandez-Cortes, A., Cañaveras, J. C., Benavente, D., Jurado, V., Saiz-Jimenez, C., Janssens, I., Seijas, N., and Sanchez-Moral, S.: Role of subterranean microbiota in the carbon cycle and greenhouse gas dynamics, Sci. Total Environ., 831, 154921, https://doi.org/10.1016/j.scitotenv.2022.154921, 2022.
Mattey, D. P., Atkinson, T. C., Barker, J. A., Fisher, R., Latin, J.-P., Durrell, R., and Ainsworth, M.: Carbon dioxide, ground air and carbon cycling in Gibraltar karst, Geochim. Cosmochim. Ac., 184, 88–113, https://doi.org/10.1016/j.gca.2016.01.041, 2016.
McDonough, L. K., Iverach, C. P., Beckmann, S., Manefield, M., Rau, G. C., Baker, A., and Kelly, B. F. J.: Spatial variability of cave-air carbon dioxide and methane concentrations and isotopic compositions in a semi-arid karst environment, Environmental Earth Sciences, 75, 700, https://doi.org/10.1007/s12665-016-5497-5, 2016.
MeteoSwiss: Overview Weather Maps, https://www.meteoswiss.admin.ch/ (last access: 26 August 2024).
Mickler, P. J., Carlson, P., Banner, J. L., Breecker, D. O., Stern, L., and Guilfoyle, A.: Quantifying carbon isotope disequilibrium during in-cave evolution of drip water along discreet flow paths, Geochim. Cosmochim. Ac., 244, 182–196, https://doi.org/10.1016/j.gca.2018.09.027, 2019.
Milanolo, S. and Gabrovšek, F.: Estimation of carbon dioxide flux degassing from percolating waters in a karst cave: Case study from Bijambare cave, Bosnia and Herzegovina, Geochemistry, 75, 465–474, https://doi.org/10.1016/j.chemer.2015.10.004, 2015.
Mook, W. G., Bommerson, J. C., and Staverman, W. H.: Carbon isotope fractionation between dissolved bicarbonate and gaseous carbon dioxide, Earth Planet. Sc. Lett., 22, 169–176, https://doi.org/10.1016/0012-821X(74)90078-8, 1974.
Moyes, A. B., Gaines, S. J., Siegwolf, R. T. W., and Bowling, D. R.: Diffusive fractionation complicates isotopic partitioning of autotrophic and heterotrophic sources of soil respiration, Plant Cell Environ., 33, 1804–1819, https://doi.org/10.1111/j.1365-3040.2010.02185.x, 2010.
Muhr, J., Borken, W., and Matzner, E.: Effects of soil frost on soil respiration and its radiocarbon signature in a Norway spruce forest soil, Global Change Biology, 15, 782–793, https://doi.org/10.1111/j.1365-2486.2008.01695.x, 2009.
Nakano, A., Takahashi, K., and Kimura, M.: The carbon origin of arbuscular mycorrhizal fungi estimated from δ13C values of individual spores, Mycorrhiza, 9, 41–47, https://doi.org/10.1007/s005720050261, 1999.
Noronha, A. L., Johnson, K. R., Southon, J. R., Hu, C., Ruan, J., and McCabe-Glynn, S.: Radiocarbon evidence for decomposition of aged organic matter in the vadose zone as the main source of speleothem carbon, Quaternary Science Reviews, 127, 37–47, https://doi.org/10.1016/j.quascirev.2015.05.021, 2015.
Pataki, D. E., Ehleringer, J. R., Flanagan, L. B., Yakir, D., Bowling, D. R., Still, C. J., Buchmann, N., Kaplan, J. O., and Berry, J. A.: The application and interpretation of Keeling plots in terrestrial carbon cycle research, Global Biogeochemical Cycles, 17, https://doi.org/10.1029/2001GB001850, 2003.
Perrin, J., Jeannin, P.-Y., and Zwahlen, F.: Epikarst storage in a karst aquifer: A conceptual model based on isotopic data, Milandre test site, Switzerland, J. Hydrol., 279, 106–124, https://doi.org/10.1016/S0022-1694(03)00171-9, 2003.
Planavsky, N., Partin, C., and Bekker, A.: Carbon Isotopes as a Geochemical Tracer, in: Encyclopedia of Astrobiology, https://doi.org/10.1007/978-3-662-44185-5_228, pp. 366–371, 2015.
Powers, H. H., Hunt, J. E., Hanson, D. T., and McDowell, N. G.: A dynamic soil chamber system coupled with a tunable diode laser for online measurements of δ13C, δ18O, and efflux rate of soil-respired CO2, Rapid Communications in Mass Spectrometry, 24, 243–253, https://doi.org/10.1002/rcm.4380, 2010.
Pumpanen, J., Ilvesniemi, H., Perämäki, M., and Hari, P.: Seasonal patterns of soil CO2 efflux and soil air CO2 concentration in a Scots pine forest: Comparison of two chamber techniques, Global Change Biology, 9, 371–382, https://doi.org/10.1046/j.1365-2486.2003.00588.x, 2003.
Ravn, N. R., Michelsen, A., and Reboleira, A. S. P. S.: Decomposition of Organic Matter in Caves, Frontiers in Ecology and Evolution, 8, https://doi.org/10.3389/fevo.2020.554651, 2020.
Reimer, P., Brown, T., and Reimer, R.: Discussion: Reporting and Calibration of Post-Bomb 14C Data, Radiocarbon, 46, 1299–1304, https://doi.org/10.1017/S0033822200033154, 2004.
Risk, D., Nickerson, N., Phillips, C. L., Kellman, L., and Moroni, M.: Drought alters respired δ13CO2 from autotrophic, but not heterotrophic soil respiration, Soil Biology and Biochemistry, 50, 26–32, https://doi.org/10.1016/j.soilbio.2012.01.025, 2012.
Sánchez-Cañete, E. P., Barron-Gafford, G. A., and Chorover, J.: A considerable fraction of soil-respired CO2 is not emitted directly to the atmosphere, Sci. Rep., 8, 13518, https://doi.org/10.1038/s41598-018-29803-x, 2018.
Savoy, L., Surbeck, H., and Hunkeler, D.: Radon and CO2 as natural tracers to investigate the recharge dynamics of karst aquifers, J. Hydrol., 406, 148–157, https://doi.org/10.1016/j.jhydrol.2011.05.031, 2011.
Schoell, M.: The hydrogen and carbon isotopic composition of methane from natural gases of various origins, Geochim. Cosmochim. Ac., 44, 649–661, https://doi.org/10.1016/0016-7037(80)90155-6, 1980.
Shi, Z., Allison, S. D., He, Y., Levine, P. A., Hoyt, A. M., Beem-Miller, J., Zhu, Q., Wieder, W. R., Trumbore, S., and Randerson, J. T.: The age distribution of global soil carbon inferred from radiocarbon measurements, Nature Geoscience, 13, 555–559, https://doi.org/10.1038/s41561-020-0596-z, 2020.
Sommaruga, A.: From the central Jura mountains to the molasse basin (France and Switzerland), Swiss Bulletin fuer Angewandte Geologie, 16, 63–75, 2011.
Staddon, P.: Carbon isotopes in functional soil ecology, Trends in Ecology & Evolution, 19, 148–154, https://doi.org/10.1016/j.tree.2003.12.003, 2004.
Stewart, B., Zhi, W., Sadayappan, K., Sterle, G., Harpold, A., and Li, L.: Soil CO2 Controls Short-Term Variation but Climate Regulates Long-Term Mean of Riverine Inorganic Carbon, Global Biogeochemical Cycles, 36, e2022GB007351, https://doi.org/10.1029/2022GB007351, 2022.
Stickler, W., Trimborn, P., Maloszewski, P., Rank, D., Papesch, W., and Reichert, B.: Environmental Isotope Investigations, Acata Carsologica, 26/1, 236–259, 1997.
Suess, E. and Whiticar, M. J.: Methane-derived CO2 in pore fluids expelled from the Oregon subduction zone, Palaeogeography Palaeoclimatology Palaeoecology, 71, 119–136, https://doi.org/10.1016/0031-0182(89)90033-3, 1989.
Swisstopo: Map viewer map.geo.admin.ch, https://www.swisstopo.admin.ch/en, last access: 1 December 2024.
Synal, H.-A., Stocker, M., and Suter, M.: MICADAS: A new compact radiocarbon AMS system, Nuclear Instruments and Methods in Physics Research Section B: Beam Interactions with Materials and Atoms, 259, 7–13, https://doi.org/10.1016/j.nimb.2007.01.138, 2007.
Szidat, S.: 14C Research at the Laboratory for the Analysis of Radiocarbon with AMS (LARA), University of Bern, CHIMIA, 74, https://doi.org/10.2533/chimia.2020.1010, 2020.
Tomczyk-Żak, K. and Zielenkiewicz, U.: Microbial Diversity in Caves, Geomicrobiology Journal, 33, 20–38, https://doi.org/10.1080/01490451.2014.1003341, 2016.
Treseder, K. K. and Allen, M. F.: Mycorrhizal fungi have a potential role in soil carbon storage under elevated CO2 and nitrogen deposition, New Phytologist, 147, 189–200, https://doi.org/10.1046/j.1469-8137.2000.00690.x, 2008.
Trumbore, S.: Age of Soil Organic Matter and Soil Respiration: Radiocarbon Constraints on Belowground C Dynamics, Ecological Applications, 10, 399–411, https://doi.org/10.1890/1051-0761(2000)010[0399:AOSOMA]2.0.CO;2, 2000.
Tune, A., Druhan, J., Wang, J., Bennett, P., and Rempe, D.: Carbon Dioxide Production in Bedrock Beneath Soils Substantially Contributes to Forest Carbon Cycling, J. Geophys. Res.-Biogeo., 125, https://doi.org/10.1029/2020JG005795, 2020.
Unger, S., Máguas, C., Pereira, J. S., Aires, L. M., David, T. S., and Werner, C.: Disentangling drought-induced variation in ecosystem and soil respiration using stable carbon isotopes, Oecologia, 163, 1043–1057, https://doi.org/10.1007/s00442-010-1576-6, 2010.
Vadillo, I., Ojeda, L., Benavente, J., Liñán, C., Carrasco, F., and del Padial, R.: Datación del CO2 mediante 14C del aire de la zona no saturada en la parcela experimental de la Cueva de Nerja (Andalucía, Málaga), in: El karst y el hombre: las cuevas como Patrimonio Mundial, edited by: Andreo, B. and Durán, J. J., Asociación Cuevas Turísticas Españolas, 327–334, 2016.
Van Rossum, G. and Drake, F. L.: Python 3 Reference Manual, CreateSpace, Scotts Valley, CA, 2009.
Vaughn, L. J. S. and Torn, M. S.: Radiocarbon measurements of ecosystem respiration and soil pore-space CO2 in Utqiaġvik (Barrow), Alaska, Earth Syst. Sci. Data, 10, 1943–1957, https://doi.org/10.5194/essd-10-1943-2018, 2018.
Vuilleumier, C., Jeannin, P.-Y., Hessenauer, M., and Perrochet, P.: Hydraulics and turbidity generation in the Milandre Cave (Switzerland), Water Resour. Res., 57, e2020WR029550, https://doi.org/10.1029/2020WR029550, 2021.
Wacker, L., Němec, M., and Bourquin, J.: A revolutionary graphitisation system: Fully automated, compact and simple, Nuclear Instruments and Methods in Physics Research Section B: Beam Interactions with Materials and Atoms, 268, 931–934, https://doi.org/10.1016/j.nimb.2009.10.067, 2010a.
Wacker, L., Christl, M., and Synal, H.-A.: Bats: A new tool for AMS data reduction, Nuclear Instruments and Methods in Physics Research Section B: Beam Interactions with Materials and Atoms, 268, 976–979, https://doi.org/10.1016/j.nimb.2009.10.078, 2010b.
Wan, J., Tokunaga, T. K., Dong, W., Williams, K. H., Kim, Y., Conrad, M. E., Bill, M., Riley, W. J., and Hubbard, S. S.: Deep Unsaturated Zone Contributions to Carbon Cycling in Semiarid Environments, J. Geophys. Res.-Biogeo., 123, 3045–3054, https://doi.org/10.1029/2018JG004669, 2018.
Webster, K. D., Schimmelmann, A., Drobniak, A., Mastalerz, M., Rosales Lagarde, L., Boston, P. J., and Lennon, J. T.: Diversity and Composition of Methanotroph Communities in Caves, Microbiology Spectrum, 10, e01566-21, https://doi.org/10.1128/spectrum.01566-21, 2022.
Wiseschart, A., Mhuanthong, W., Thongkam, P., Tangphatsornruang, S., Chantasingh, D., and Pootanakit, K.: Bacterial Diversity and Phylogenetic Analysis of Type II Polyketide Synthase Gene from Manao-Pee Cave, Thailand, Geomicrobiology Journal, 35, 518–527, https://doi.org/10.1080/01490451.2017.1411993, 2018.
Weissert, H. and Mohr, H.: Late Jurassic climate and its impact on carbon cycling, Palaeogeogr. Palaeocl., 122, 27–43, https://doi.org/10.1016/0031-0182(95)00088-7, 1996.
Wingler, A. and Hennessy, D.: Limitation of Grassland Productivity by Low Temperature and Seasonality of Growth, Front. Plant Sci., 7, https://doi.org/10.3389/fpls.2016.01130, 2016.
Wu, J., Zhang, Q., Yang, F., lei, Y., Zhang, Q., and Cheng, X.: Does short-term litter input manipulation affect soil respiration and its carbon-isotopic signature in a coniferous forest ecosystem of central China?, Applied Soil Ecology, 113, 45–53, https://doi.org/10.1016/j.apsoil.2017.01.013, 2017.
Zhang, H., Zhou, Z., Dong, H., Yan, L., Ding, S., Huang, J., Gong, X., and Su, D.: Seasonal variations of cave dripwater hydrogeochemical parameters and δ13CDIC in the subtropical monsoon region and links to regional hydroclimate, Sci. Total Environ., 881, 163509, https://doi.org/10.1016/j.scitotenv.2023.163509, 2023.
Zhou, J., Gu, Y., Zou, C., and Mo, M.: Phylogenetic diversity of bacteria in an earth-cave in Guizhou province, southwest of China, Journal of Microbiology, 45, 2007.
Zhu, Y.-G., and Miller, R. M.: Carbon cycling by arbuscular mycorrhizal fungi in soil–plant systems, Trends in Plant Science, 8, 407–409, https://doi.org/10.1016/S1360-1385(03)001845, 2003.