the Creative Commons Attribution 4.0 License.
the Creative Commons Attribution 4.0 License.
 | 05 Nov 2025
Plant community composition explains spatial variation in year-round methane fluxes in a boreal rich fen
Eeva Järvi-Laturi
Teemu Tahvanainen
Eero Koskinen
Efrén López-Blanco
Juho Lämsä
Hannu Marttila
Mikhail Mastepanov
Riku Paavola
Maria Väisänen
Torben R. Christensen
Climate change is expected to impact the methane (CH4) budget of boreal peatlands, highlighting the need to understand the factors that influence methane cycling, including plant community structure. In northern peatlands, the majority of methane is transported through plants, and the magnitude of this process is strongly linked to plant community composition. Therefore, detailed information about the role of plants in regulating year-round methane fluxes is highly valuable. This paper explores the causes of spatial variability in plot-scale methane fluxes in a northern boreal rich fen. Methane fluxes were measured using the manual chamber technique in the context of fine-scale biomass variations in plant community composition from 36 study plots over 232 d throughout a full year. The mean methane flux rates for snow-free and snow seasons were 2.55 and 0.21 mg CH4 m−2 h−1, respectively. We found a significant correlation between methane fluxes and a plant community type associated with the presence of sedge Carex rostrata during three studied periods: year-round, snow-free, and snow season. C. rostrata was present at 13 out of 36 plots, and these 13 plots contributed 44 %–49 % of the total measured methane fluxes. The biomass of vascular plants, sedges, and C. rostrata, as well as the ratio of vascular plant to bryophyte biomass, was also significantly correlated with methane fluxes in year-round and snow-free seasons. By identifying vegetation-driven emission hotspots, these results can enhance efforts to upscale emission predictions and improve ecosystem-scale methane modeling. Thus, our findings provide valuable insights for predicting realistic future changes in peatland methane emissions throughout the year.
- Article
(12496 KB) - Full-text XML
- BibTeX
- EndNote


Northern peatlands are an intrinsic part of the global carbon cycle and currently, these peatlands store more than a third of all terrestrial carbon, act as strong sinks of carbon dioxide (CO2), and are among the main natural terrestrial sources of methane (CH4) (Ramage et al., 2024; Schuur et al., 2022). Indeed, wetlands produce about 25 % of the total methane emissions, which are still considered an important source of uncertainty in the global methane budget (Saunois et al., 2025). The uncertainty arises from several factors: the relative contributions of methane emissions from tropical and northern wetlands, how these regions respond to rising temperatures, and the spatiotemporal patterns of the emissions (Christensen, 2024; Yuan et al., 2024).
Climate change is predicted to affect the hydrology of peatlands by increasing the water table depth (WTD) (Evans et al., 2021; Helbig et al., 2020; Swindles et al., 2019), which is one of the most well-known regulators of methane fluxes along with temperature and vegetation (Turetsky et al., 2014). According to several studies, an increased WTD would decrease methane fluxes (e.g., Pearson et al., 2015; Riutta et al., 2020) and increase the rate of decomposition and soil CO2 emissions (Ma et al., 2022). These ecosystem-level processes are complex, though, as the increasing level of atmospheric CO2 is predicted to enhance plant productivity (Forkel et al., 2016) and thereby the rate of root exudation (Nielsen et al., 2017) that, via priming, leads to greater methane emissions (Turner et al., 2020; Waldo et al., 2019). The expected rise in methane production could be balanced by increased methane oxidation in the topsoil, which is a probable response to enhanced microbial activity and oxygen availability caused by rising temperatures (Zhang et al., 2021). A warming climate may, however, also increase the areal cover of wet fens in the Arctic region due to permafrost thaw, which could potentially create new sources of methane release (e.g., Christensen et al., 2023; Grimes et al., 2024).
Vegetation type and responses to environmental changes are highly relevant for methane flux dynamics, as up to 90 % of ecosystem-level methane is transported through plants in northern peatlands (Ge et al., 2023; Korrensalo et al., 2022). The aerenchymatous tissues of certain vascular plant species allow methane to move from anoxic soil through the plant, thus avoiding oxidation in oxic soil layers (Ge et al., 2023; Joabsson et al., 1999), and, indeed, plant species and their specific traits have been found to reliably predict methane flux rates (Korrensalo et al., 2022). Sphagnum mosses of wet environments can also host methanotrophic microbes and thus have the potential to oxidize methane and affect the magnitude of the total emissions (Larmola et al., 2010). Climate change is predicted to accelerate the natural vegetational succession in boreal rich fens toward Sphagnum-dominated plant communities even in stable hydrological conditions (see Kolari et al., 2021, and references therein), which could have major impacts on methane production and release. To improve our understanding and predictions of future methane emissions, it is important to have a stronger focus on the vegetation composition and the specific plant species controlling the magnitude of the fluxes (Riutta et al., 2020).
The relationship between plant community composition and methane fluxes remains an important topic of study (e.g., Lai et al., 2014; Riutta et al., 2007; Ström et al., 2015), and research on individual plant species has shown significant variation in the magnitude of flux rates and transport efficiencies (e.g., Bhullar et al., 2013; Koelbener et al., 2010; Korrensalo et al., 2022). However, year-round methane flux data from northern boreal rich fens at the plot scale are limited. This study aims to better understand the causes behind local spatial variability in methane fluxes year-round and to provide a new perspective on assessing plant-mediated methane emissions. To this end, we focus on fine-scale variations in plant community composition based on species' biomass, using non-destructive in situ methods. We intend to answer the following questions: (1) Do methane flux variations correlate with plant community type at a study plot scale? (2) Does plant community composition correlate with methane flux variability alone or in combination with other environmental factors? We hypothesize that (1) the plant community composition affects the methane flux and that (2) the flux is highest on study plots with the largest biomass of vascular plants in absolute terms or in proportion to the biomass of bryophytes.
2.1 Study site
This study was implemented in Puukkosuo, an open and slightly sloping calcareous fen located in the northern boreal zone at Oulanka National Park in Kuusamo, Northeast Finland (66.377299° N, 29.308062° E) (Fig. 1). The long-term (1992–2022) mean annual, January, and July temperatures were 0.6, −13.0, and 15.3 °C, respectively, and the mean annual precipitation was 557.4 mm. The study period (19 October 2021–31 October 2022) was slightly warmer and drier than the long-term mean, with temperatures 0.9, −11.4, and 16.5 °C and with total annual precipitation of 528.8 mm. During the snow-free season of 2022, the mean pH (n=179) measured from peat porewater at approximately 10 cm depth was 7.0, ranging from 6.74 to 7.38. These values are relatively high and place our site at the upper end of the pH range typically observed in northern boreal rich fens, which often exhibit pH values below 7 (e.g., Hájek et al., 2021; Olefeldt et al., 2017; Laitinen et al., 2021). The deepest measured water table was 9 cm below the peat surface, while the highest was 7 cm above the surface (Fig. A1). The plot-scale variation in WTD during the snow-free season of 2022 was 4–9 cm with an average of 6 cm. The vegetation at the site is dominated by vascular plants typical of rich fens (Carex spp., Trichophorum spp., Molinia caerulea, Potentilla erecta, and Menyanthes trifoliata), as well as brown mosses (Scorpidium cossonii, Campylium stellatum, and Cinclidium stygium) and peat mosses (Sphagnum spp., mostly S. warnstorfii).
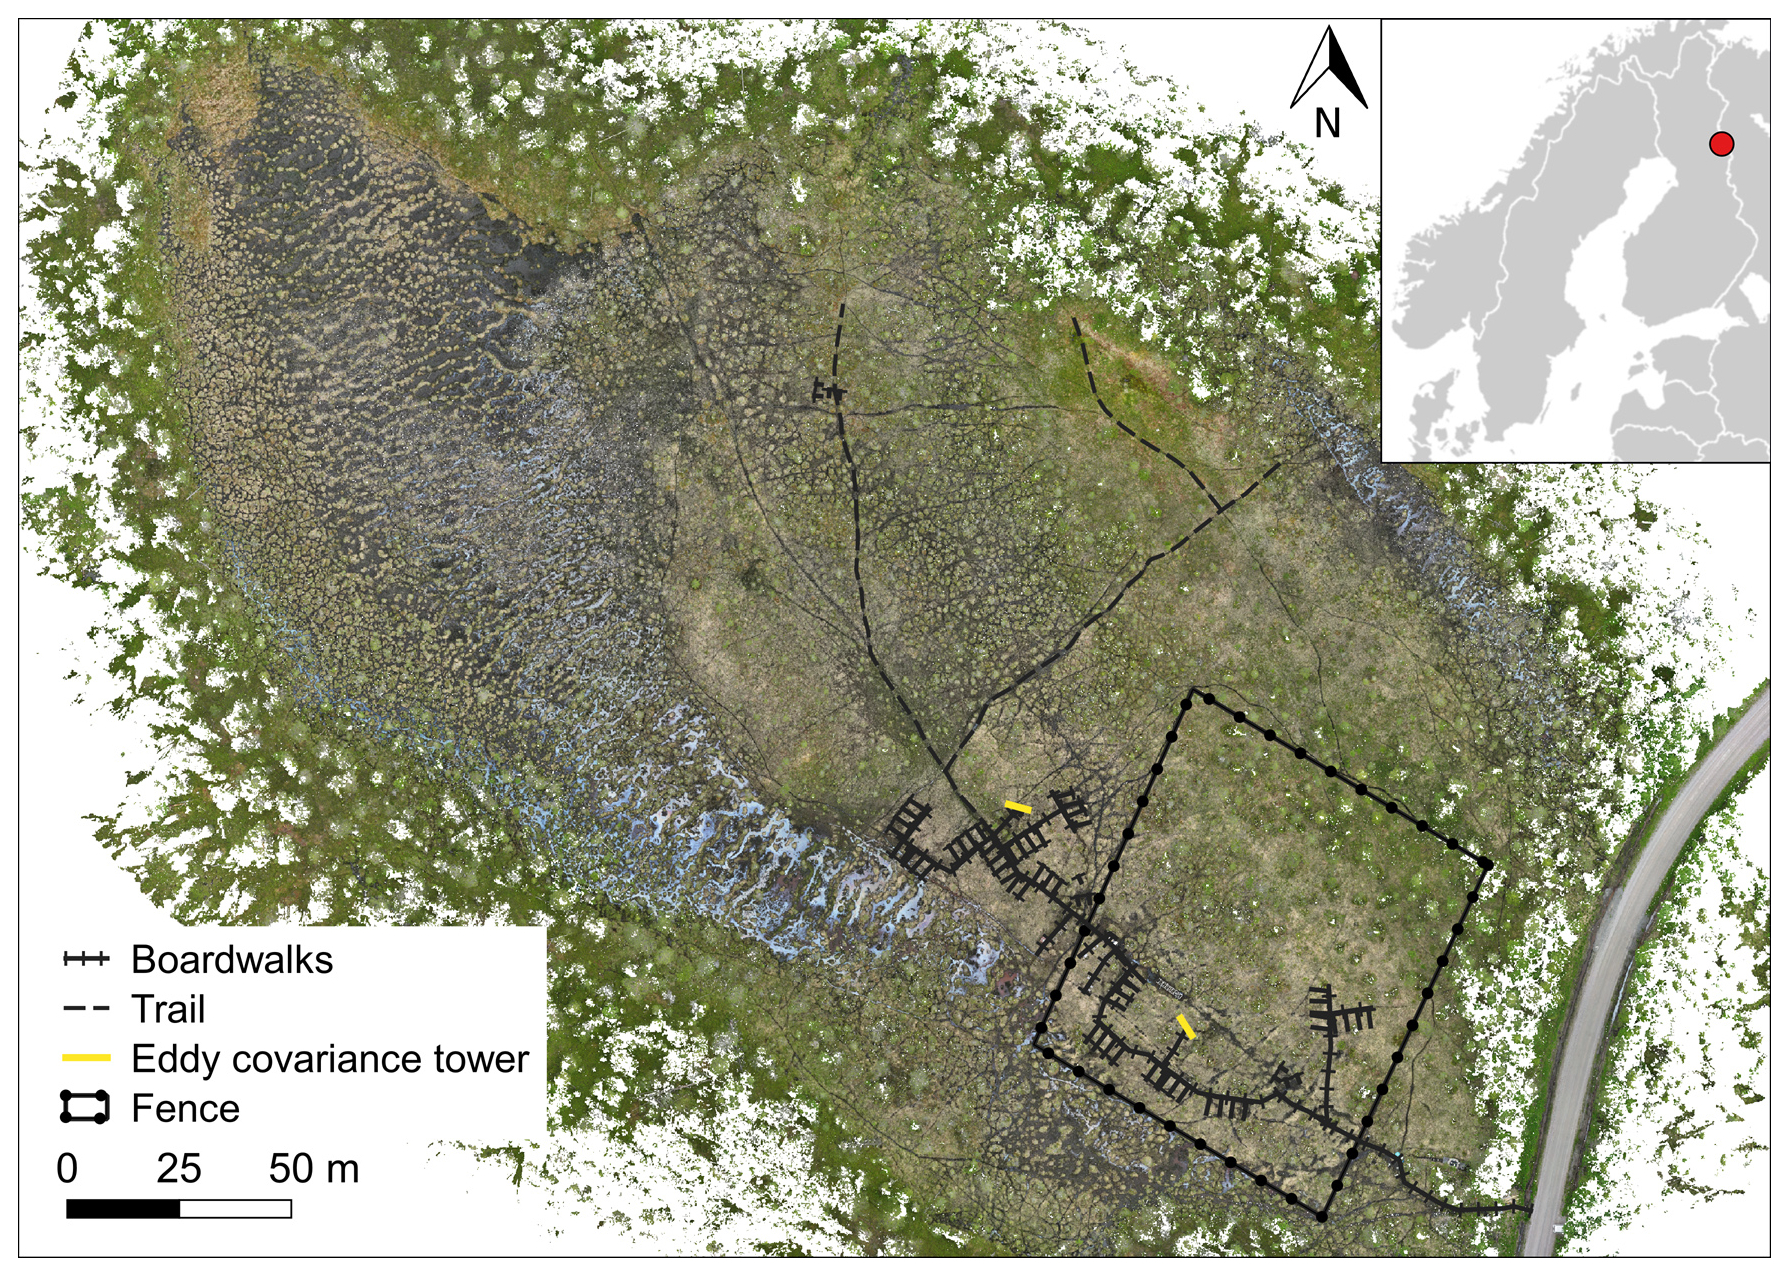
Figure 1A map of Puukkosuo rich fen showing the location of boardwalks, the experimental area, and the fence excluding reindeer. The small inset shows the location of the study area, Oulanka, in NE Finland. Orthomosaic © Petra Korhonen 2024.
2.2 Experimental design
The study area was approximately one hectare in size and included 12 spatial blocks. Each block had three study plots, resulting in 36 study plots. The plots were established in summer 2018, and the size of a plot was 2 m × 3.5 m, which included a 0.5 m wide buffer zone. Wooden boardwalks, built to minimize stepping on the surface of the peat, led to the plots. Half of the study plots (n=18) were located inside a fence, built in spring 2019, to exclude grazing by reindeer (Fig. 1). At the time of this study, the exclusion had lasted for 2–3 years. The location of the plots and the fence followed the hydrological gradient of the fen (Fig. 1) and the differences in vegetation and methane fluxes between inside and outside the fence were likely related to the hydrological conditions, rather than the effects of exclusion (Väisänen et al., unpublished data). The study plots were also assigned to snow level manipulations that began in January 2019. Within each block, one plot was an untreated control with ambient snow level, one was a snow removal plot where the snow depth was maintained at 0.25 m throughout the snow season, and one plot was a snow addition plot, where the snow from the removal plot was placed. The snow treatments had no statistically significant effects on the methane fluxes (Fig. B5).
2.3 Methane flux measurements
For methane flux measurements, a round PVC collar (inner diameter 29.5 cm) was inserted approximately 5 cm into the ground in the rear end of each plot in September 2020. During 19 October 2021–31 October 2022, we measured methane fluxes (mg CH4 m−2 h−1) over 232 individual days between 08:00 and 18:00 LT, conducting one measurement per plot per day. On most days, only half of the plots were measured, using randomized plot selection. We used a manual, closed chamber technique (e.g., Christensen et al., 2000) with a portable LI-COR CH4/CO2/H2O Trace Gas Analyzer (LI-7810) and a transparent polycarbonate chamber (height 38 cm, diameter 29 cm) equipped with a small fan to circulate the air inside the chamber (Fig. 2a). For each measurement during the snow-free season, the chamber was placed on the PVC collar for an airtight seal (Fig. 2b). Each measurement lasted for 5 min. During winter, when snow covered the collars and it was not possible to place the chamber directly on them, we measured the fluxes on top of the snowpack, also known as the floating chamber technique, to avoid disturbance to the snow and methane diffusion (Björkman et al., 2010) and consequently to the experimental plots. In comparison to the snow-free season, these measurements were taken at a slightly different spot closer to the boardwalks. Due to these limitations, snow season flux measurements should be examined with caution. Altogether, 4121 individual measurements were used in this study.
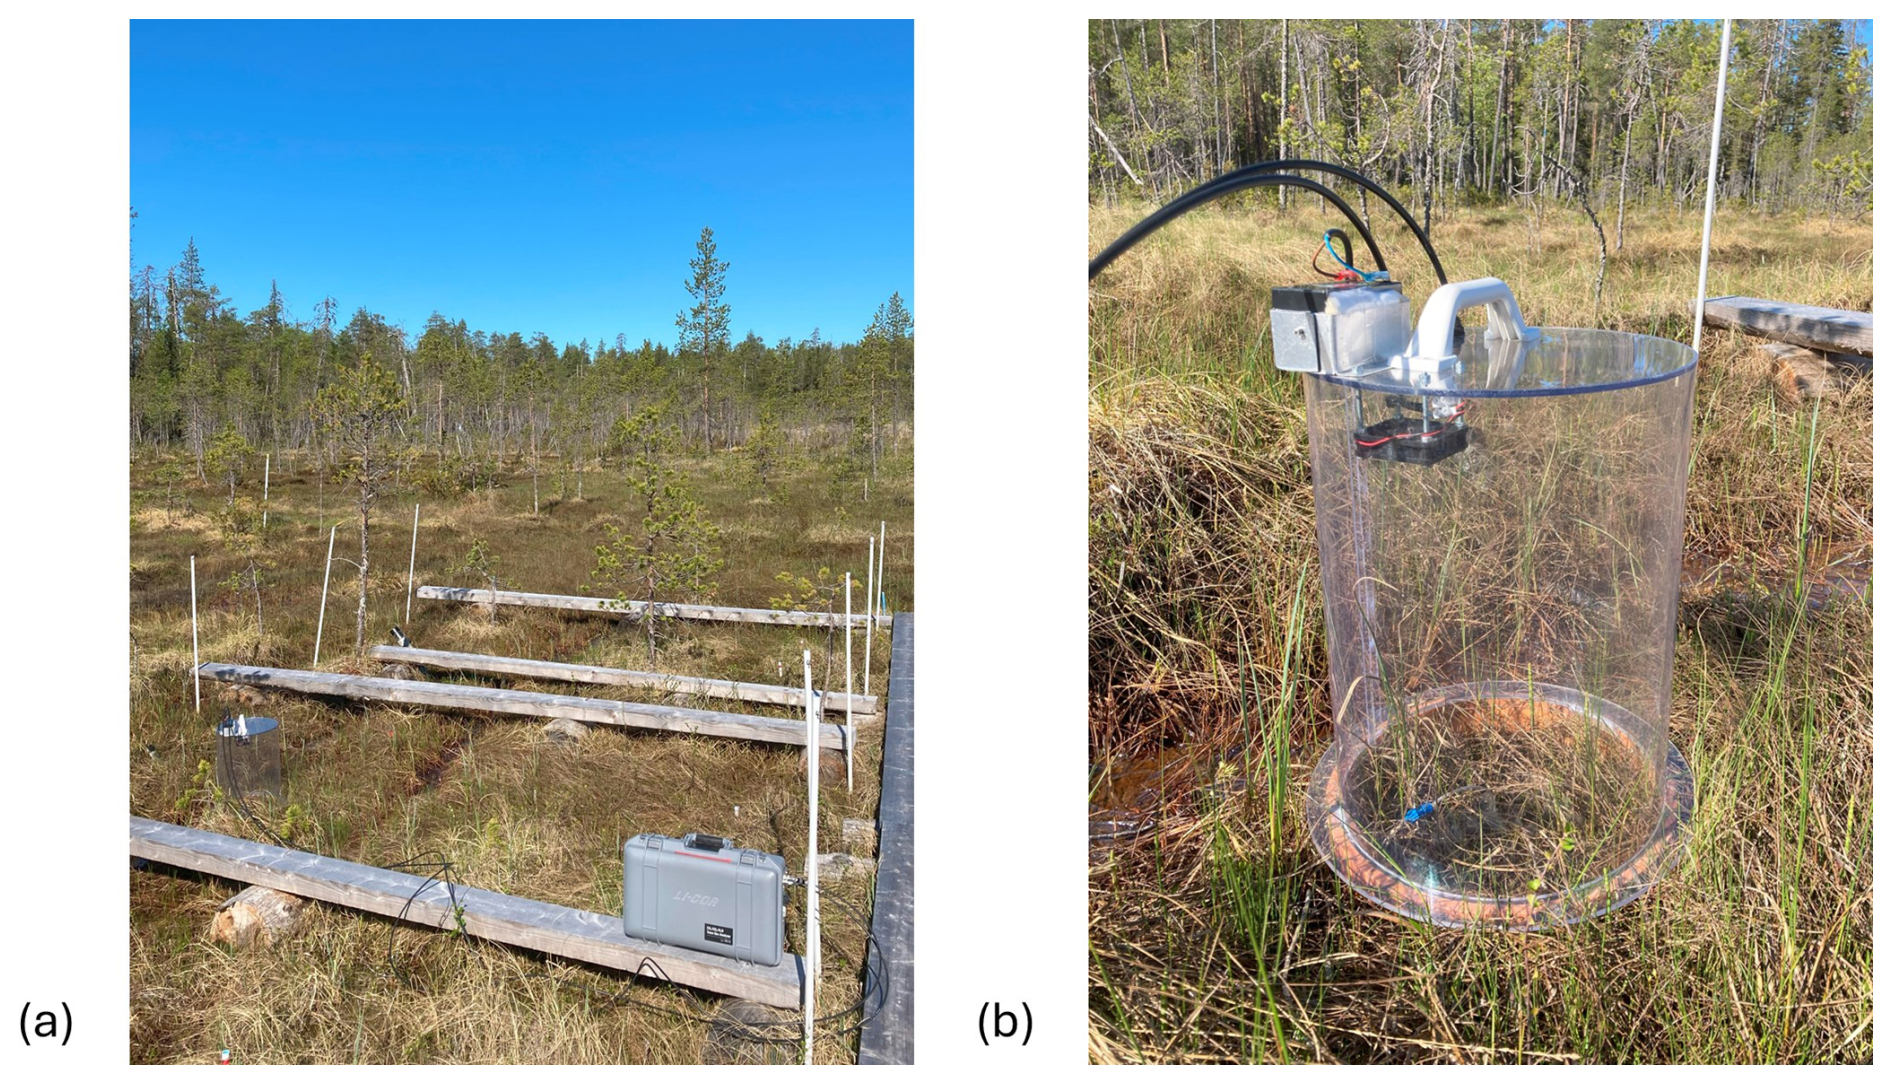
Figure 2A flux measurement carried out with (a) a portable LI-COR Trace Gas Analyzer and (b) a clear polycarbonate chamber placed on a round collar installed at each plot in 2020. Photos by Eeva Järvi-Laturi.
To calculate methane flux rates for each plot, we used a Python script that calculated the slope of methane concentration change during the three centermost minutes of a five-minute measurement period and computed the flux in mg CH4 m−2 h−1 using ambient air pressure and air temperature at the time of each measurement (linear regression model, e.g., Pirk et al., 2016a). We accepted the measurements with an R2 value ≥ 0.95 (n=3589) and inspected all the rest (n=691) individually, leaving out measurements showing very strong non-linearity or any other sign of failed measurement (n = 159). We examined the fluxes in three periods: (1) year-round (19 October 2021–31 October 2022), (2) snow-free (13 May–26 October 2022), and (3) snow season (19 October 2021–12 May 2022 and 27–31 October 2022). The snow-free season presented a period when we were able to measure fluxes on the collar (part of the experimental plot or the experimental site could be covered with snow). The snow covered season presented a season when we measured the fluxes on top of the snow, not on the collar. Annual accumulated flux (1 November 2021–31 October 2022) was estimated by calculating a 24 h accumulated flux for each available data point by multiplying the hourly mean flux by 24. These daily flux values were then summed to obtain the annual total. The days that were missing a measurement were given the value from a previous measurement, assuming the fluxes did not vary remarkably over the diel cycle or between the days. These assumptions were based on data from two automatic chambers located at the same site near our study plots, which showed limited diel variation in fluxes (Mastepanov et al., unpublished data).
2.4 Plant community data
We studied the plant communities by identifying species and their abundance within each collar, collecting separate biomass samples from approximately 50–150 m distance from the main research area, and using the mean biomass (BM) value of each species' samples to determine the community composition within each collar. Plant surveys and sample collection were conducted from 25 July to 12 August 2022. To survey the vascular plant (VP) species within the collars, we counted each aboveground shoot individually and separated them into flowering and non-flowering categories, as the flowering shoots may hold higher biomass than the non-flowering ones. There were altogether 31 vascular plant species identified at the study site. Then we collected separate samples of each identified species. The biomass sampling was randomized so that we first selected an area where vegetation heights resembled the heights of the vegetation within the collars. Then, we randomly threw a marker and selected the first 10 non-flowering individuals of the target vascular plant species close to the marker. We additionally collected 10 flowering individuals for those species that were found flowering within the collars. Shoots were cut at the peat surface. With uncommon species, randomization could not be put into practice (Angelica sylvestris, Carex dioica, Carex panicea, Dactylorhiza sp., Drosera sp., Eriophorum angustifolium, Festuca ovina, Pinguicula sp., Saussurea alpina, and Viola epipsila). For these, samples were collected from where they could be found. For bryophytes, we visually estimated the percentage cover of each species within each collar. There were altogether 10 bryophyte species identified at the study site. We took either three samples representing 5 % (diam. 6.6 cm) or one sample representing 1 % (diam. 2.95 cm) of the collar area with small plastic jars. The bigger sample size was collected for species that could easily be found in pure patches (Aulacomnium palustre, Campylium stellatum, Scorpidium cossonii, Sphagnum spp., and Tomentypnum nitens) and the smaller sample size for the remaining, more scattered and sparse species (Aneura pinguis, Cinclidium stygium, Fissidens adianthoides, Mesoptychia rutheana, and Paludella squarrosa). The sampling locations were selected so that the target bryophyte species could be found as “pure monoculture” as possible. We then cleaned the samples of other species and litter, removed the non-living parts, and included only the colorful or leafy parts to represent the aboveground biomass.
For BM estimation, we dried the samples (n=454) in a hot air circulation oven at 40 °C for a minimum of two days and weighed them with a four decimal precision (Denver Instrument SI-234, Table A1). The dry weights were normalized either by shoot (vascular plant, g per shoot) or by cover percent (bryophyte, g per 1 %). For each vascular plant species, we used the total number of shoots, separated by flowering and non-flowering status, within a collar, multiplied by the mean dry mass per shoot to obtain the total species BM for each collar. For each bryophyte species, we used the total percentage coverage within a collar multiplied by the mean dry mass per 1 % area to obtain the total species BM for each collar. We also calculated a VP to bryophyte BM ratio for each collar using these BM values (Table A2) to study whether this parameter could potentially be used as a predictive parameter for methane emissions. We acknowledge that studying the plant communities using non-destructive methods and a mean BM of the separate samples, instead of the actual BM of the plant communities within the collars, introduces a margin of error in the calculations.
2.5 Environmental variables
We used weekly measures of WTD from June to October from regular measuring points located approximately 1 m from the methane flux measurement points. As the microtopographic variation and WTD fluctuation at the site are minimal (see Sect. 2.1), WTD measured 1 m from the plot likely provides a reasonable estimate of WTD at the plot. At every plot, soil temperature was recorded at 10 min intervals at 5 cm depth (model p107 CS CR1000, Campbell Scientific Inc., Logan, UT, USA). In October 2023, we measured peat layer thickness at the rear edge of each study plot with a thin, metallic 300 cm long auger. To determine peat chemistry, we collected pore water during frost-free periods. At the beginning of the snow-free season in 2022, Rhizon samplers (Rhizosphere Research Products, the Netherlands) were installed (at 10 cm depth) for pore water sampling in the middle of the collar in each experimental plot. Pore water was sampled five times during the frost-free periods (31 May, 29 June, 22 July, 28 August, and 29 September). Samples were collected into evacuated opaque syringes over a period of 24–48 h, filtered (0.45 µm, sterile nylon, Sarstedt, Germany), and frozen (−18 °C). Thawed samples from all sampling campaigns were analyzed for pH (913 pH/DO Meter, Metrohm), dissolved organic carbon (DOC) and inorganic carbon (DIC; Shimadzu DOC-VCX, Trios), dissolved organic nitrogen (DON), ammonium (NH), nitrite + nitrate (NO + NO; AA500 Seal Analytical), and for DOC and DON reported as mg L−1 and for NH and NO + NO as µg L−1. In analyses, we used the mean value of each measured variable. Additionally, we estimated the percentage cover of litter inside the collar while identifying the vegetation.
2.6 Data analyses
To analyze the vegetation, we divided the plant communities into three species combinations: (1) all species, (2) VPs, and (3) bryophytes. We analyzed these combinations separately using plant BM estimates (see Sect. 2.4) with hierarchical cluster analysis using Sorensen (Bray–Curtis) distance measure and Flexible Beta group linkage method (McCune et al., 2002) with a beta value of −0.25. Clusters with fewer than six samples (study plots) were discarded. To evaluate which species were statistically most connected to the different clusters, we carried out an indicator species analysis separately for all three species combinations. We tested the differences between the clusters with Tukey's Honestly Significant Difference (HSD) test following an analysis of variance (aov function, R Core Team, 2024) to assess the significance of clusters in relation to methane fluxes in different time periods (snow-free, year-round, and snow season). With clustered data, we performed detrended correspondence analysis (DCA) to identify patterns in species composition and canonical correspondence analysis (CCA) to relate the species composition to environmental variables (McCune et al., 2002). We conducted the analyses separately for VPs and bryophytes to determine the main environmental factors characterizing the composition of these plant communities. Pairwise correlations between multiple BM and environmental variables were examined with a separate CCA, using snow-free season averages. The resulting Pearson correlation matrix (Table B2) provides insights into these relationships. Finally, we conducted local regression models (LOESS, locally estimated scatterplot smoothing) to explore nonlinear trends between various variables and methane fluxes in relation to VP clusters.
Cluster, indicator species, and correspondence analyses were implemented with PC-ORD version 7.09 (McCune and Mefford, 2018). Regression models and Tukey's HSD tests were performed using RStudio version 2024.4.2.764 (Posit team, 2024). Both programs were used for data visualization: PC-ORD for cluster dendrograms, boxplots, and ordination graphs and RStudio for line graphs and scatterplots. Significance was defined as p<0.05. We used the following R packages: readxl v1.4.3 (Wickham and Bryan, 2023), dplyr v1.1.4 (Wickham et al., 2023a), tidyr v1.3.1 (Wickham et al., 2024), ggplot2 v3.5.1 (Wickham, 2024), forcats v1.0.0 (Wickham, 2023), scales v1.3.0 (Wickham et al., 2023b), paletteer v1.3.0 (Hvitfeldt, 2021), ggnewscale v0.5.0 (Campitelli, 2024), and viridis v0.6.5 (Garnier et al., 2024). R scripts were created with the assistance of Microsoft 365 Copilot, an AI-powered productivity tool.
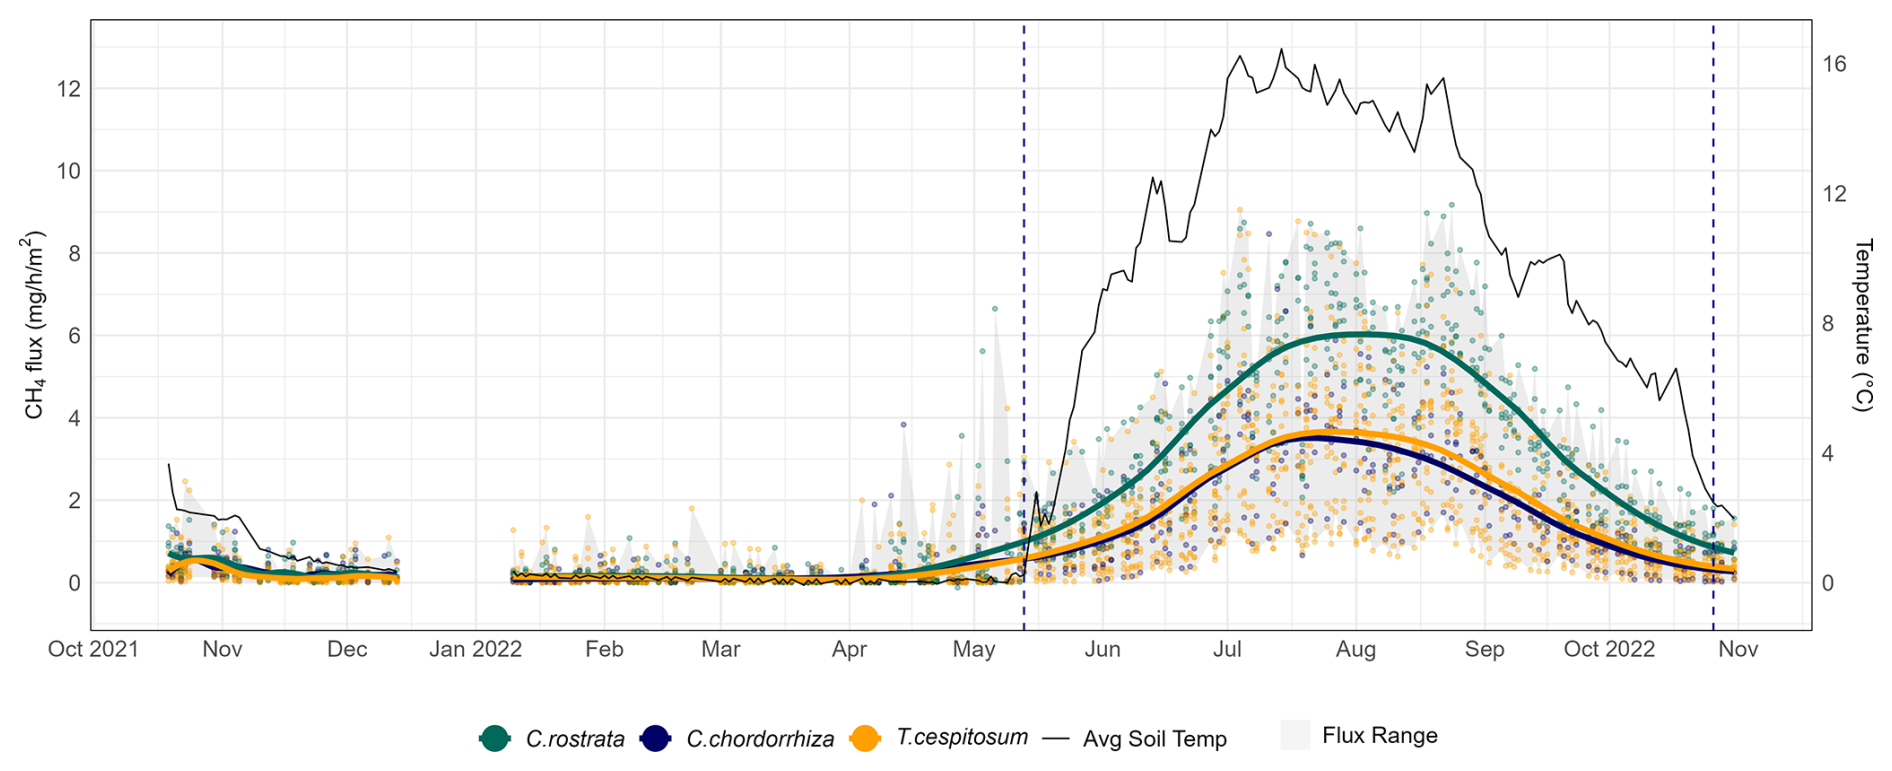
Figure 3Year-round methane fluxes (mg CH4 m−2 h−1) of Puukkosuo with average soil temperature at 5 cm depth. The gray flux range shows the overall variation of the fluxes. Smoothed conditional means (LOESS method) and data points, which represent individual plot-scale flux measurements, are segregated by vascular plant clusters defined in the text in Sect. 3.2. The vertical dashed lines mark the start and end of the snow-free season (13 May–26 October 2022).
3.1 Methane fluxes
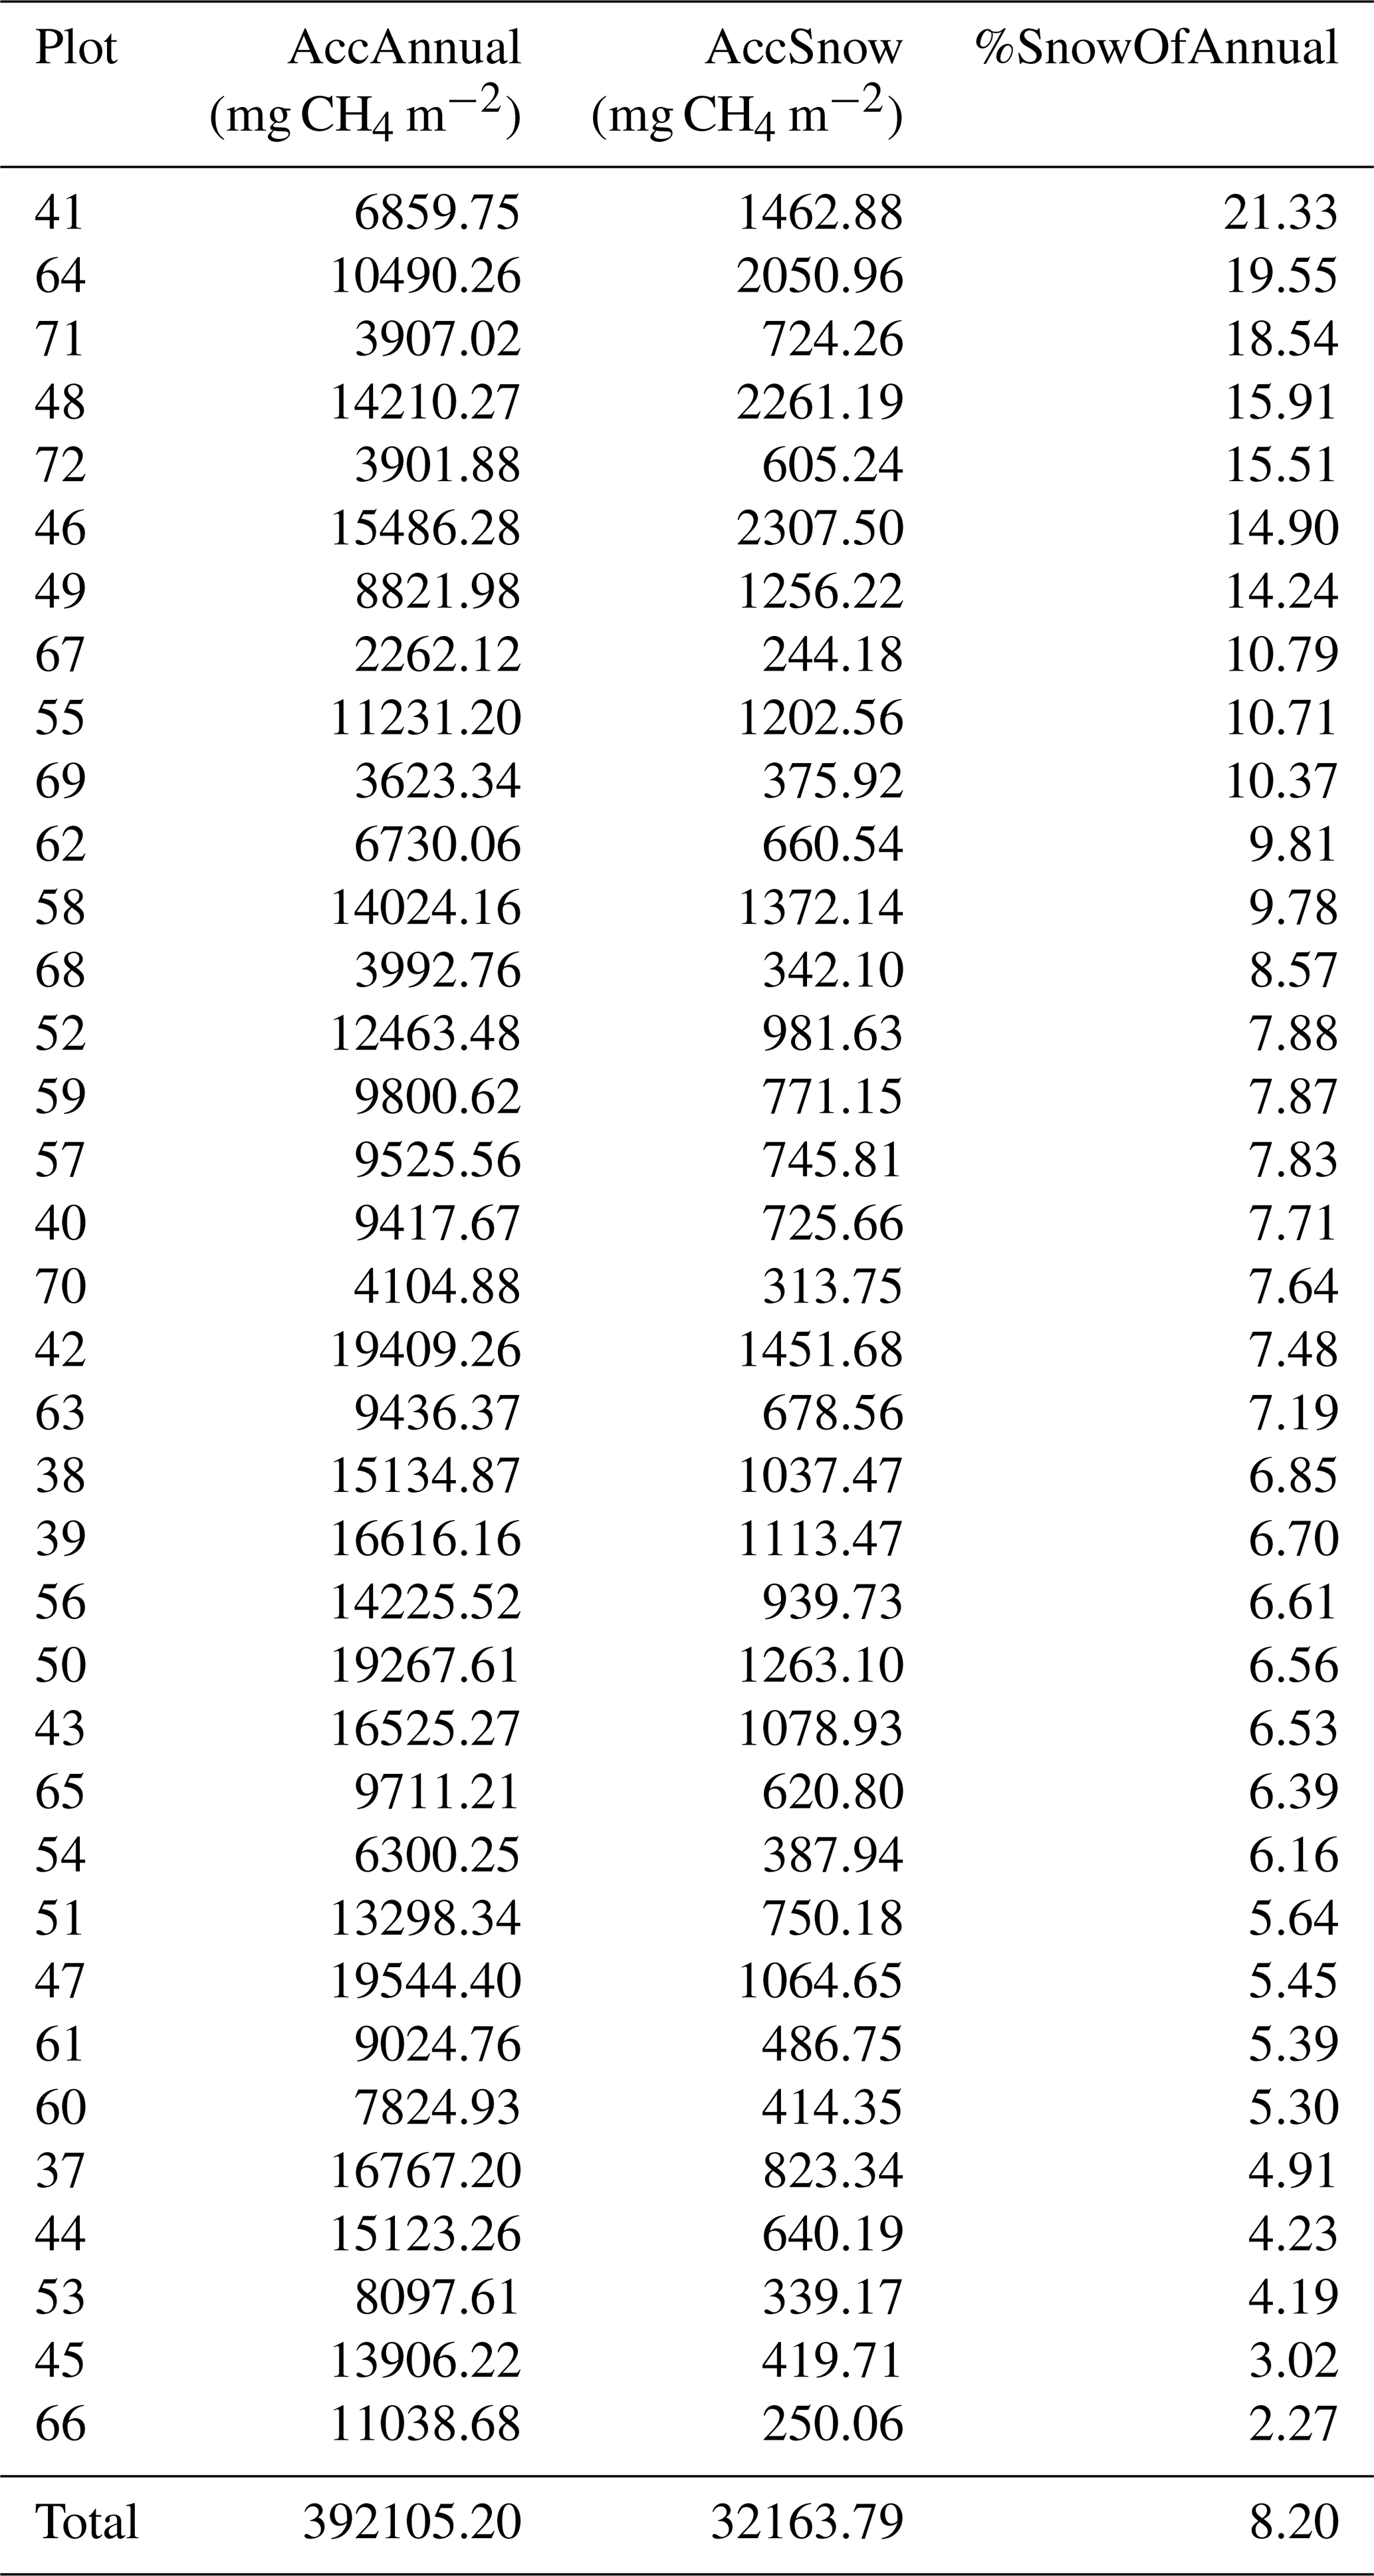
During the snow-free season, methane fluxes were the highest, ranging from 0.02 to 9.17 mg CH4 m−2 h−1 (i.e., 0.48–220 mg CH4 m−2 d−1), with an overall mean of 2.55 mg CH4 m−2 h−1 (i.e., 61 mg CH4 m−2 d−1). During this season, the mean of plot-scale methane fluxes ranged from 0.51 to 4.67 mg CH4 m−2 h−1 (Fig. B7), and the daily coefficient of variation spanned from 38.9 % to 85.4 %. The highest individual fluxes per plot varied between 1.51 and 9.17 mg CH4 m−2 h−1. The lowest flux values of the snow-free period (0.02–1.18 mg CH4 m−2 h−1) were measured in May after a spring burst (1 April–12 May 2022) and at the end of the season in late October (Fig. 3). The magnitude of the spring burst differed among the plots, with maximum individual fluxes ranging from 0.15 to 6.65 mg CH4 m−2 h−1. During the snow season, flux measurements fluctuated between 0 and 6.65 mg CH4 m−2 h−1 (i.e., 0–160 mg CH4 m−2 d−1), with an overall mean of 0.21 mg CH4 m−2 h−1 (i.e., 5 mg CH4 m−2 d−1). The mean of plot-scale fluxes ranged from 0.07 to 0.56 mg CH4 m−2 h−1 (Fig. B8), and the daily coefficient of variation spanned from 39.3 % to 300.4 %. Further, the snow season fluxes accounted, on average, for 8.2 % of the estimated annual accumulated flux, with values ranging from 2.3 % up to 21.3 % across the study plots (Table B3). On a year-round scale, the overall mean flux was 1.37 mg CH4 m−2 h−1, with mean fluxes varying between 0.29 and 2.52 mg CH4 m−2 h−1, and the daily coefficient of variation ranged from 38.9 % to 300.4 %.
3.2 Plant community structures
The plots differed in their plant community structures, with wide variation in plant BM. VP BM per plot ranged from 62.1 to 486 g m−2, while the bryophyte BM ranged from 65.1 to 269 g m−2. The lowest total BM for an individual plot was 167 g m−2, while the highest total BM was 674 g m−2. The percentage of VPs in the total BM varied between 21 % and 72 % (Table A2). The species producing the most BM, based on combined dry mass estimates from all plots, were sedges Carex lasiocarpa (122 g) and C. rostrata (84 g) and bryophytes Scorpidium cossonii (193 g), Campylium stellatum (113 g), and Sphagnum spp. (92 g) (Table A3).
The cluster and indicator species analyses for all species, VPs, and bryophytes yielded three clusters (groups of plots), each with significant (p<0.05) indicator species statistically connected to the clusters (Figs. B1–B3). The cluster analyses indicated that bryophytes (Sphagnum spp., S. cossonii, and C. stellatum) showed the strongest connection to the clusters when analyses were conducted with all plant species or bryophytes (Figs. B1 and B3). On the other hand, when analyzing VPs alone, the clusters connected mostly with different sedges (C. rostrata with the first, C. chordorrhiza with the second, and Trichophorum cespitosum, C. lasiocarpa, and Potentilla erecta (a forb) with the third cluster). From here on, the clusters are referred to as the C. rostrata cluster, the C. chordorrhiza cluster, and the T. cespitosum cluster, respectively. The characteristics of each VP cluster, including their community structure and indicator species, were studied by comparing the indicator values of the species (Table B1). The results demonstrated that the plant communities differed between the clusters, as most species were abundant in only one or two clusters, and only three species (Campylium stellatum, Vaccinium oxycoccos, and Scorpidium cossonii) were common in all clusters (Table B1). The spatial division of the vascular plant communities was clear – the C. rostrata community plots were all located in the upper part of the sloping fen, while the other two clusters were more widely distributed (Fig. B6).
When all plant species were considered, bryophytes defined the vegetation clusters (Fig. B1). Bryophyte communities and the biomass of Sphagnum mosses correlated with WTD and pH, but these did not, however, explain the distribution of the vascular plant communities (Table B2). Additionally, there was an association between Sphagnum mosses and C. rostrata in the plant communities: the C. rostrata cluster had the highest abundance of Sphagnum mosses among the three vascular plant clusters (Table B1).
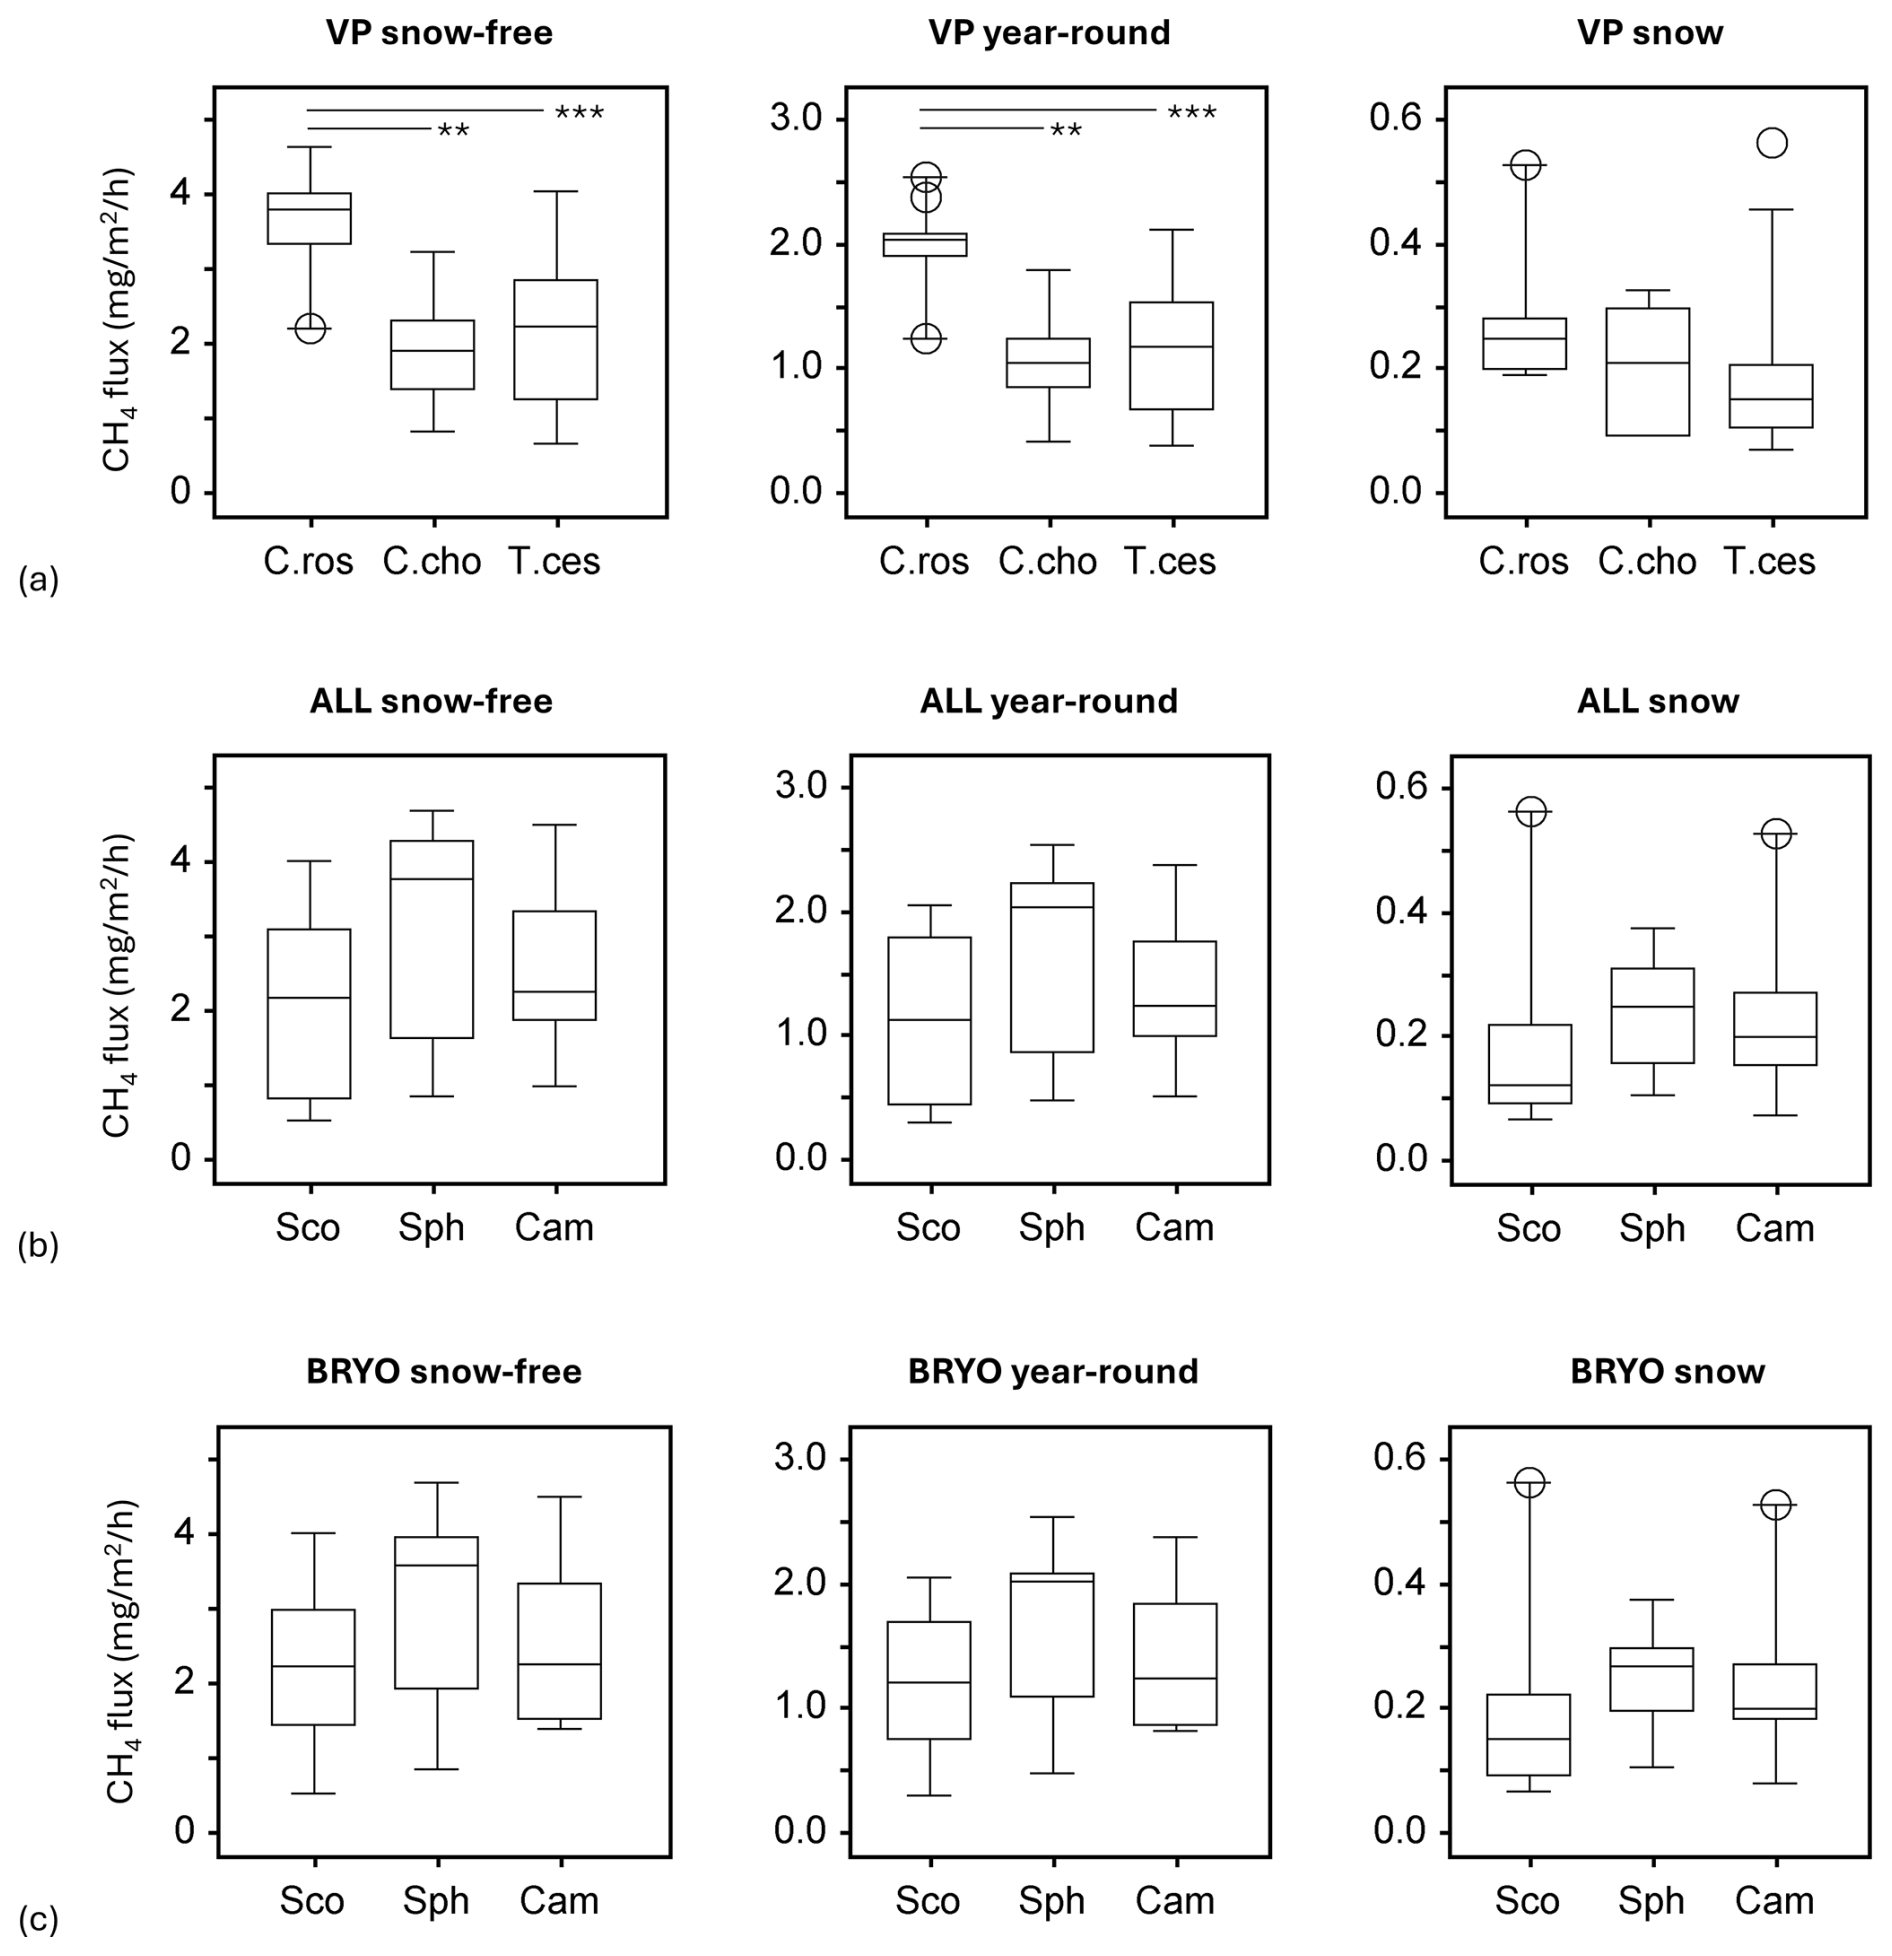
Figure 4Methane fluxes in the snow-free season (left panel), the whole year (middle panel), and the snow season (right panel), as divided by cluster analyses of (a) vascular plants (VPs), (b) all species (ALL), and (c) bryophytes (BRYO). Abbreviations for the clusters and the species with the highest fidelity according to indicator species analysis: C.Ros = C. rostrata, C.Cho = C. chordorrhiza, T.Ces = C. lasiocarpa, P. erecta, and T. cespitosum, Sco = S. cossonii, Sph = Sphagnum spp., and Cam = C. stellatum. Asterisks above the bars denote significant differences between the clusters at the level and .
3.3 Clusters' relation to methane fluxes
An analysis of variance (ANOVA) revealed that VP clusters significantly explained variation in methane fluxes during the snow-free (F=10.71, p<0.001) and year-round seasons (F=10.92, p<0.001) but not during the snow season (F=2.14, p>0.05). Tukey's HSD test indicated that the C. rostrata cluster, which had the highest fluxes, especially during the snow-free season (Fig. 3), differed significantly from the C. chordorrhiza and T. cespitosum clusters in the snow-free (p<0.01 and p<0.001, respectively) and year-round periods (p<0.01 and p<0.001, respectively) but not in the snow season (Fig. 4a). There were no significant differences between the C. chordorrhiza and T. cespitosum clusters in any of the periods (Fig. 4a–c). The cluster with all species considered did not significantly explain variation in methane fluxes in any period (F=1.51, p>0.2 for snow-free, F=1.45, p>0.2 for year-round, and F=0.57, p>0.5 for snow season, Fig. 4b). Similarly, bryophyte clusters did not show significant effects on methane fluxes (F=1.23, p>0.3 for snow-free, F=1.26, p>0.2 for year-round, and F=0.90, p>0.4 for snow season, Fig. 4c).
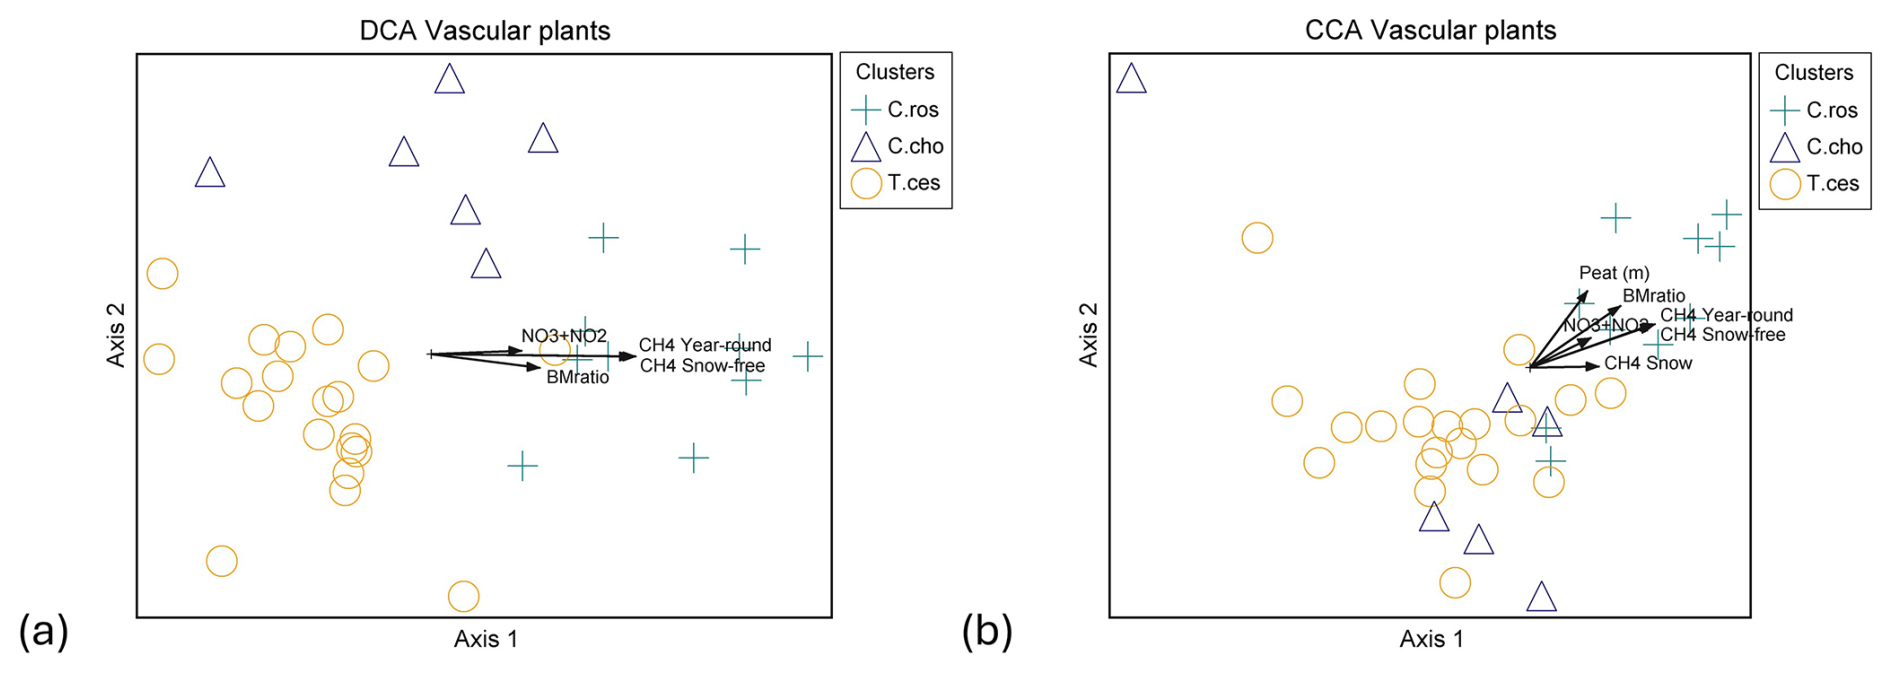
Figure 5Ordination graphs of vascular plant data. (a) DCA with rare species downweighted (eigenvalue axis 1 = 0.463, axis 2 = 0.154) and (b) CCA (eigenvalue axis 1 = 0.423, axis 2 = 0.163). Plant community clusters: C.ros = Carex rostrata, C.cho = Carex chordorrhiza and T.ces = Carex lasiocarpa, Potentilla erecta, and Trichophorum cespitosum. Time spans for methane fluxes: CH4 year-round (19 October 2021–31 October 2022), CH4 snow-free (13 May–26 October 2022), and CH4 snow (19 October 2021–12 May 2022, 27–31 October 2022). NO3+NO2 is the combined concentration of nitrate (NO) and nitrite (NO), BMratio is the ratio of vascular plant and bryophyte biomasses, and Peat (m) is the peat layer thickness.
3.4 Ordination analyses
Within VP communities, the C. rostrata cluster diverged from the C. chordorrhiza and T. cespitosum clusters in both detrended correspondence analysis (DCA) and canonical correspondence analysis (CCA), while the C. chordorrhiza and T. cespitosum clusters diverged in DCA but not in CCA (Fig. 5a and b). In bryophyte communities, the Sphagnum cluster diverged from the S. cossonii and C. stellatum clusters in both DCA and CCA, while the S. cossonii and C. stellatum clusters diverged in DCA but not in CCA (Fig. B4a and b). The main compositional gradients of VP and bryophyte communities displayed different correlation patterns with environmental variables. The first ordination axis of the VP communities correlated with snow-free and year-round methane fluxes (r=0.775 and 0.782 in DCA, and −0.866 in CCA, respectively, Fig. 5a and b). Additionally, the first ordination axis correlated with snow season fluxes (r=0.445 in DCA, −0.402 in CCA). The correlation was also significant for the ratio of VP to bryophyte BM (r=0.562 in DCA, −0.730 in CCA), peat layer depth (r=0.342 in DCA and −0.580 in CCA), and the combined nitrate (NO) and nitrite (NO) concentration (r=0.529 in DCA, −0.453 in CCA). In contrast, the strongest compositional gradient of the bryophyte data correlated with WTD and pH in both DCA ( and 0.473, respectively) and CCA ( and 0.408, respectively) (Fig. B4a and b). The correlation between the bryophyte communities and methane was not significant in any of the periods (r=0.267, 0.262, and 0.132 in DCA, r=0.316, 0.326, and 0.130 in CCA in snow-free, year-round, and snow season, respectively).
3.5 BM, environmental variables, and methane
In the correlation matrix (Table B2), the total BM of VPs correlated with the total BM of sedges (r=0.98) and the total BM of C. rostrata (r=0.93), indicating that sedges were the main functional group of VPs, and C. rostrata was the main VP species producing BM at our study site. The BM variables that had a significant pairwise correlation with methane fluxes in year-round and snow-free seasons were the total BM of VPs (p<0.001), the total BM of sedges (p<0.001), the total BM of C. rostrata (p<0.001), and the ratio of VP to bryophyte BM (p<0.01) (Fig. 6a–d). Significant correlations during the snow season were not found. Environmental variables that had a significant pairwise correlation with methane fluxes in snow-free and year-round periods were pH (p<0.05 and p≤0.01, respectively, Fig. 6e) and combined concentration of NO and NO in peat pore water (p<0.05 for both periods, Fig. 6f). There was no significant correlation between methane fluxes and WTD or soil temperature in any period. All correlation coefficients are listed in a correlation matrix in Table B2.
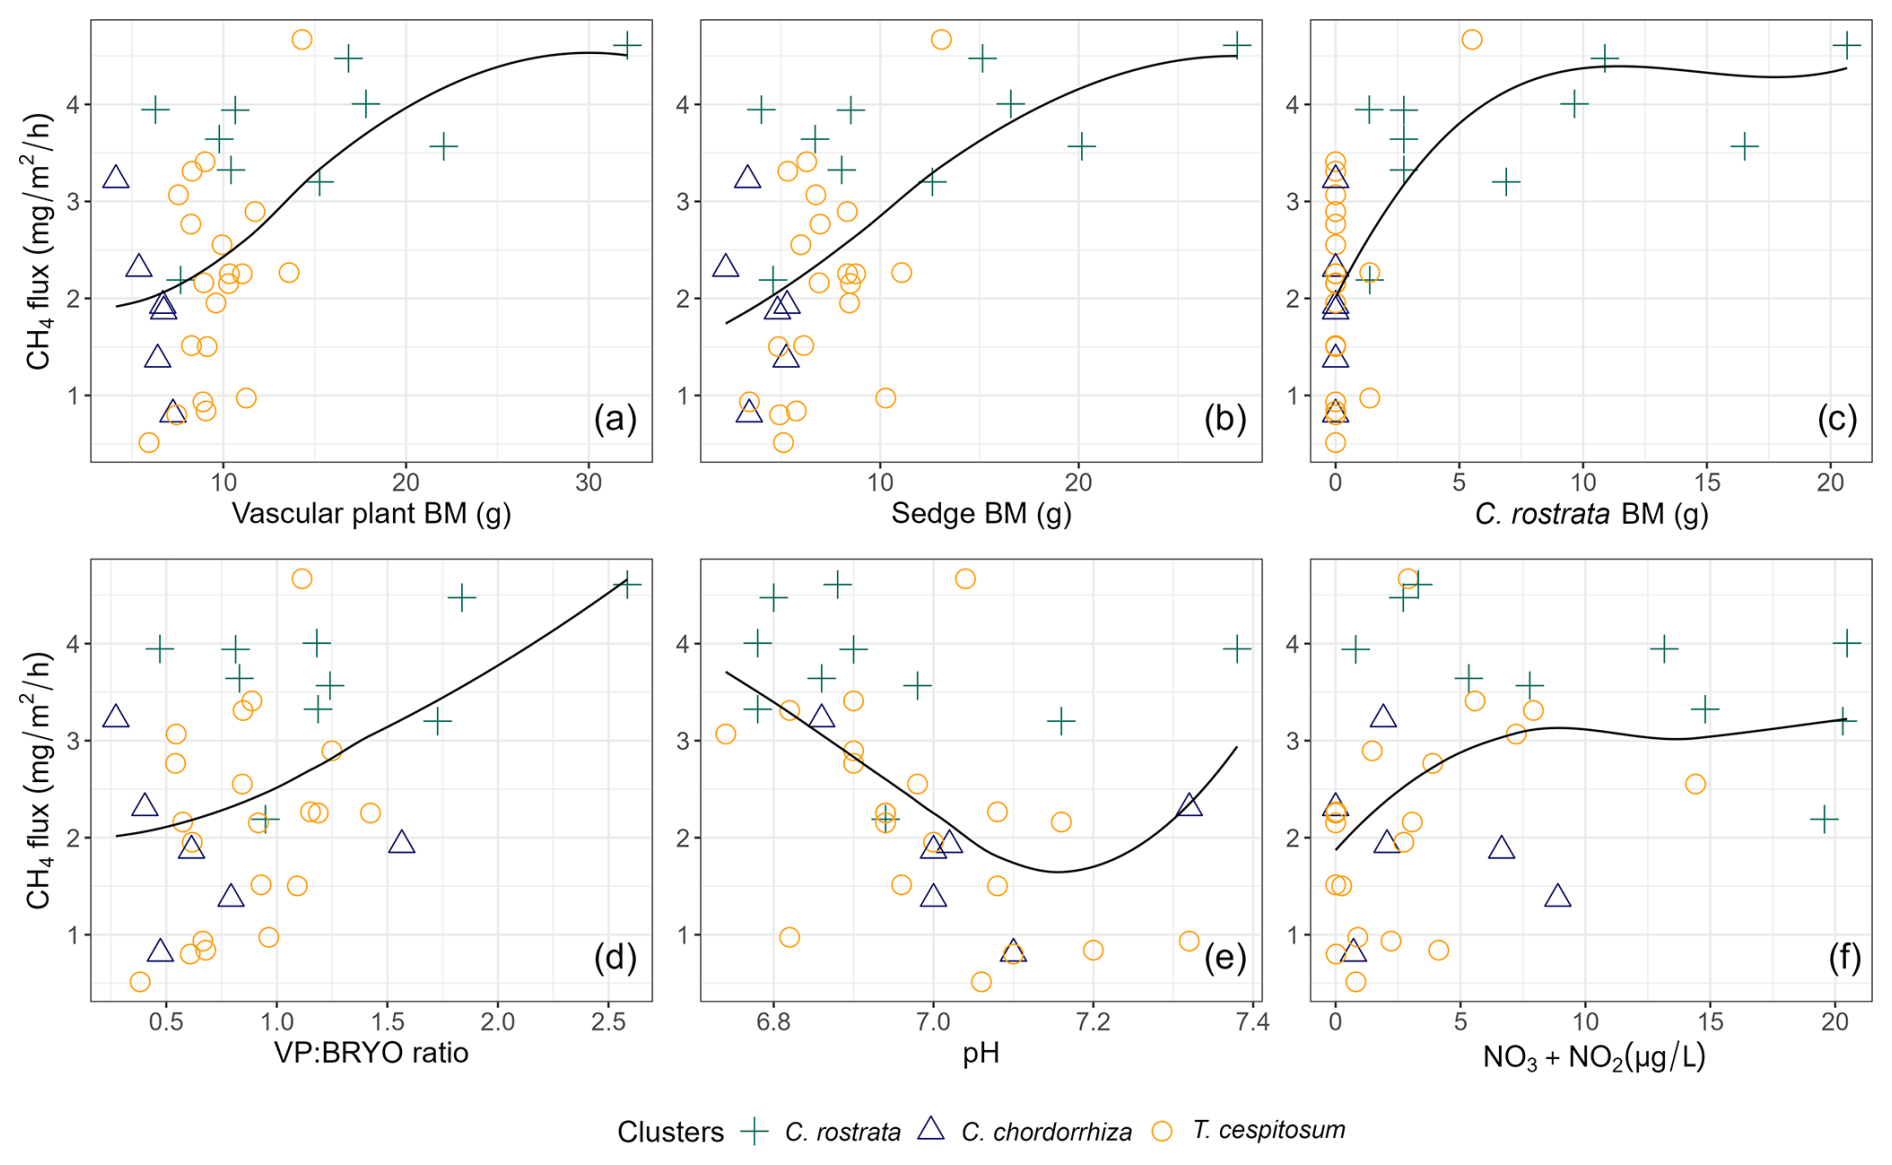
Figure 6Scatterplots showing the relationships between methane (CH4) flux (mg m−2 h−1) and environmental variables: (a) total biomass (BM) of vascular plants (p<0.001, r=0.54), (b) total BM of sedges (p<0.001, r=0.57), (c) BM of C. rostrata (p<0.001, r=0.60), (d) BM ratio of vascular plants and bryophytes (p<0.01, r=0.45), (e) pH (p<0.05, ), and (f) NO3 + NO2 concentration (p<0.05, r=0.34) across different vascular plant clusters. Vascular plant clusters are defined in the text in Sect. 3.2. The smoothing lines were fitted using local polynomial regression (LOESS) with a span value of 1 for moderate smoothing. Biomasses are in grams of dry weight.
We found that when C. rostrata BM was 0 g, there was a large variation in the magnitude of methane flux (Fig. 6c). Therefore, we additionally examined the clusters' relation to fluxes in plots without any C. rostrata shoots (23 plots out of 36), as well as the relationship between methane fluxes and environmental variables using linear regression models (lm function, R Core Team, 2024). This revealed that, in the absence of C. rostrata, pH and litter coverage were the primary environmental drivers of snow-free season methane fluxes, showing significant relationships (p<0.001 and p=0.01, respectively) and Pearson correlation values of −0.66 and −0.29, respectively.
4.1 Methane flux variation over time and space
During the snow-free season, methane fluxes ranged from 0.48 to 220 mg CH4 m−2 d−1, with an overall mean of 61 mg CH4 m−2 d−1. Similar fluxes have been measured from a northern boreal rich fen (Jammet et al., 2017). We also observed that the snow season fluxes accounted for 2.3 %–21.3 % of the estimated annual accumulated flux (Table B3). Even though we measured fluxes on top of an undisturbed snowpack, our results are in line with a study from fens in central Finland, where 6 %–17 % of the annual methane release was observed during wintertime, when measuring the fluxes on the peat surface after clearing the spots from snow (Alm et al., 1999). We acknowledge that direct measurements from the ground surface would have improved our ability to connect winter fluxes with the studied plant communities. However, we do not expect significant differences in flux values obtained using a closed chamber on top of the snowpack, as methane diffusion through the snowpack may be relatively unrestricted (Alm et al., 1999; Pirk et al., 2016b). Since winter may account for up to 20 % of the annual methane flux in boreal fens (this study, Alm et al., 1999), any changes in wintertime processes may impact future methane emissions from these regions. Our results highlight the importance of including winter in methane flux studies, as this information may help reduce the current large uncertainties in the net carbon balance. Further, the reduced variability of fluxes and the lack of significant variation among vegetation clusters during mid-winter suggest that winter fluxes could be effectively captured even with lower but more optimized sampling efforts, aiding in the estimation of annual emissions (Vargas and Le, 2023).
Flux rates during the snow-free season reached up to 9.17 mg CH4 m−2 h−1 at certain study plots, while they never exceeded 2 mg CH4 m−2 h−1 in some others (Fig. 3). The high BM of vascular plants, and especially the presence of C. rostrata, contributed to the spatial variability in fluxes: all plots with more than five flux measurements exceeding 6 mg CH4 m−2 h−1 (n=9) contained C. rostrata shoots, but only three out of 19 plots that never recorded fluxes above this threshold had C. rostrata present. However, C. rostrata biomass cannot be the sole factor in high methane fluxes, as one plot without any C. rostrata shoots still measured fluxes as high as 9.05 mg CH4 m−2 h−1. The possible explanations, other than the effect of aboveground BM of vascular plants or C. rostrata, are discussed further in Sect. 4.2 and 4.3. Unlike the snow-free season, the high flux values during the spring burst at the end of the snow season could not be explained by plant biomass or any other studied environmental variable. Other reasons for the spatial variation in flux rates may include species-specific plant traits such as rooting characteristics (Ge et al., 2023), ecohydrological aspects such as peat water holding capacity (Zhang et al., 2020), or microbial metabolic interactions such as nutrient cycling (Kujala et al., 2024; Yavitt et al., 2012), which contribute to soil conditions, substrate availability, and microbial activity. Interestingly, the methane fluxes from C. rostrata community plots were the highest from late July to late August (Fig. 3), when vegetation at our site remained predominantly green, even though fluxes from C. rostrata shoots have been reported to be the highest when leaves are senescing (Ge et al., 2024). The period from late July to late August may coincide with the peak development of permeable root surface area (Reid et al., 2015), whose extent, in turn, is a key factor influencing methane transport in plants (Henneberg et al., 2012). Therefore, the seasonal changes in methane flux rates associated with C. rostrata may be controlled by the belowground parts of the plant (Ge et al., 2024).
4.2 Plant communities, biomass, and methane
During the growing season, vegetation is known to correlate substantially with methane fluxes (e.g., Lai et al., 2014; Riutta et al., 2007; Ström et al., 2015), but we found significant correlations year-round, supporting our first hypothesis. Thus, our results indicate that the influence of plant communities on methane flux dynamics is not limited to the active growing season or plant senescence, and that some species are likely to be more efficient at supporting methane production and transport, even under the snowpack. Indeed, continuous production and spatial variation in methane flux rates have been observed throughout the cold season, and the variation has been associated with differences in plant community composition and the adjoining differences in substrate quantity and quality (Pirk et al., 2016b). However, the significant correlation between vegetation and methane fluxes during the snow season, identified by CCA but not by linear regression models, suggests that the relationship between vegetation and snow season methane fluxes is complex and nonlinear.
Both the total vascular plant biomass and the biomass ratio of vascular plants and bryophytes correlated significantly with methane fluxes during snow-free and year-round periods, supporting our second hypothesis (Fig. 6a and d; Table B2). There was a strong correlation between the biomasses of vascular plants, sedges, and C. rostrata (Table B2), and the biomasses of vascular plants, sedges, and C. rostrata also correlated with methane fluxes (Fig. 6a–c; Table B2). These findings suggest, similar to earlier studies (e.g., Ge et al., 2023; Korrensalo et al., 2022), that plant functional type and species largely determine the magnitude of the fluxes. High amounts of vascular plant, sedge, and C. rostrata biomass likely enhance methane production and release by supplying labile organic carbon substrates for methanogenesis through deep root systems throughout the year (Alm et al., 1999; Joabsson et al., 1999; Saarinen, 1996). High flux rates from C. rostrata dominated plots (Fig. 6c) may be due to the species' high methane transport rate (Ge et al., 2023), the high porosity of its roots (Ge et al., 2023), and a low capacity to oxidize methane into CO2 in the rhizosphere (Ström et al., 2005). Additionally, the perennial nature and deep rooting traits of C. rostrata (Saarinen, 1996, 1998) could support methane production and transport during the cold season by providing substrates for microbial processes in deeper peat layers and a potential pathway from belowground to the atmosphere. Approximately 40 % of C. rostrata shoots at our study site overwinter green (Cunow et al., unpublished data), indicating the potential to transport gases during winter as well. Moreover, the significant correlation between the ratio of vascular plant to bryophyte biomasses and methane fluxes brings a new perspective to the discussion, as previous studies have mainly focused on finding differences between single plant species (e.g., Bhullar et al., 2013; Ge et al., 2023; Koelbener et al., 2010; Korrensalo et al., 2022) or their role in a plant community (e.g., Lai et al., 2014; Riutta et al., 2007; Ström et al., 2015). This ratio could be obtained remotely (e.g., multispectral imaging, Wolff et al., 2023) and potentially used as a predictive parameter for modeling peatland methane fluxes.
A majority (75 %) of the highest methane fluxes observed in this study originated from C. rostrata dominated plots. However, the magnitude of the fluxes was not solely dictated by C. rostrata biomass; the fluxes increased rapidly in a non-linear manner and only slightly with higher biomass, remaining relatively high and stable in most C. rostrata cluster plots (Fig. 6c). As a species with high gas transport efficiency, even a single C. rostrata shoot can transport a substantial volume of gases, potentially the same amount as a community with multiple shoots, where gas transport is distributed among many individuals (Koelbener et al., 2010; Korrensalo et al., 2022). This division of gas transport among multiple shoots could explain the observed saturation in methane flux rates: as the biomass of C. rostrata increases, the total flux remains consistent regardless of the number of shoots. In our analysis, an increase in biomass corresponds to a higher number of shoots, and therefore we cannot argue that the size of individual C. rostrata shoots did not impact the plant's methane transport efficiency. This study focused only on the aboveground parts of the plant communities, and therefore the multiple effects that the belowground parts may have on methane production, consumption, transport, and emission (e.g., Määttä and Malhotra, 2024) were not considered in the analyses. However, we acknowledge that belowground plant characteristics likely play a significant role in explaining the variation in our methane flux data that could not be explained by the other studied variables.
4.3 Environmental factors and methane
We also asked if the spatial variability of methane fluxes could be explained by the combination of plant communities and environmental variables and found that vegetation composition was the primary driver of this variation. However, in some cases, the role of an environmental variable seemed to depend on the presence of plants. Firstly, we analyzed snow-free season methane fluxes from plots without any C. rostrata shoots and found that pH and litter cover emerged as the main drivers of methane fluxes. However, as the significance of pH decreased when including the plots with C. rostrata, it is likely that the significant relationship between methane fluxes and pH in snow-free and year-round periods is explained through vegetation. Secondly, when C. rostrata was present, NO and NO levels correlated positively with methane fluxes during snow-free and year-round periods. In plots without C. rostrata shoots, this significant relationship disappeared, suggesting that the positive correlation is related to the presence of the species. The positive correlation was unexpected, as these compounds usually inhibit methanogenesis (e.g., Knorr and Blodau, 2009). More precisely, higher levels of NO may promote methane oxidation, leading to lower fluxes (Song et al., 2022), but the impact of these electron acceptors remains debated (Zhang et al., 2021). Thus, our findings underscore the need to further investigate the interaction between C. rostrata and NO and NO in driving methane fluxes. Water table depth is commonly thought to regulate methane fluxes in peatlands (Lai, 2009; Turetsky et al., 2014) but did not correlate with methane fluxes at our site in any period. Indeed, in fens with a stable water table, such as our study site (standard deviation of WTD 1–3 cm), the depth of the water table may not control the variability of the fluxes (e.g., Ge et al., 2023). The thickness of the peat layer did not show a significant pairwise correlation with methane fluxes, which supports the findings that most of the methane is produced from fresh root litter and root exudates instead of old, recalcitrant peat (Ström et al., 2012). However, peat layer thickness correlated significantly with the first ordination axis in CCA and had a significant pairwise correlation with the biomass of vascular plants, sedges, and C. rostrata, as well as with the biomass ratio of vascular plants and bryophytes (Table B2), all of which were proxies for higher methane fluxes. This suggests that peat layer composition and depth can also impact methane production through an indirect relationship. Lastly, methane fluxes did not correlate with peat temperature at 5 cm depth. Indeed, methane fluxes in boreal rich fens are associated with deeper soil temperatures, which are connected to water table position, rather than with surface temperatures influenced by air temperature (Olefeldt et al., 2017). All these findings highlight that vegetation, rather than environmental factors, was the main driver of methane fluxes at our site.
Our year-round methane flux data showed significant spatial and temporal variations in flux magnitude in a northern boreal rich fen. Plant community composition, particularly the biomass of C. rostrata, explained the plot-scale spatial variation in methane fluxes well during snow-free and year-round periods. Multivariate analysis also revealed that a vascular plant cluster depicted by C. rostrata correlated with snow season methane fluxes. In addition, the total biomass of vascular plants and the ratio of vascular plant to bryophyte biomasses also showed a significant positive relationship with methane fluxes in both year-round and snow-free seasons. On the other hand, the role of other environmental factors, such as pH and nitrogen, in driving methane fluxes was subtle and seemed to depend on vegetation. Our findings suggest that the biomass ratio of vascular plants and bryophytes could be used as a parameter for predicting methane emissions at study sites with similar vegetation to ours. Importantly, these findings help to predict future changes in peatland methane emissions more accurately and realistically, which are essential for estimating the potential impacts of ongoing climate change.
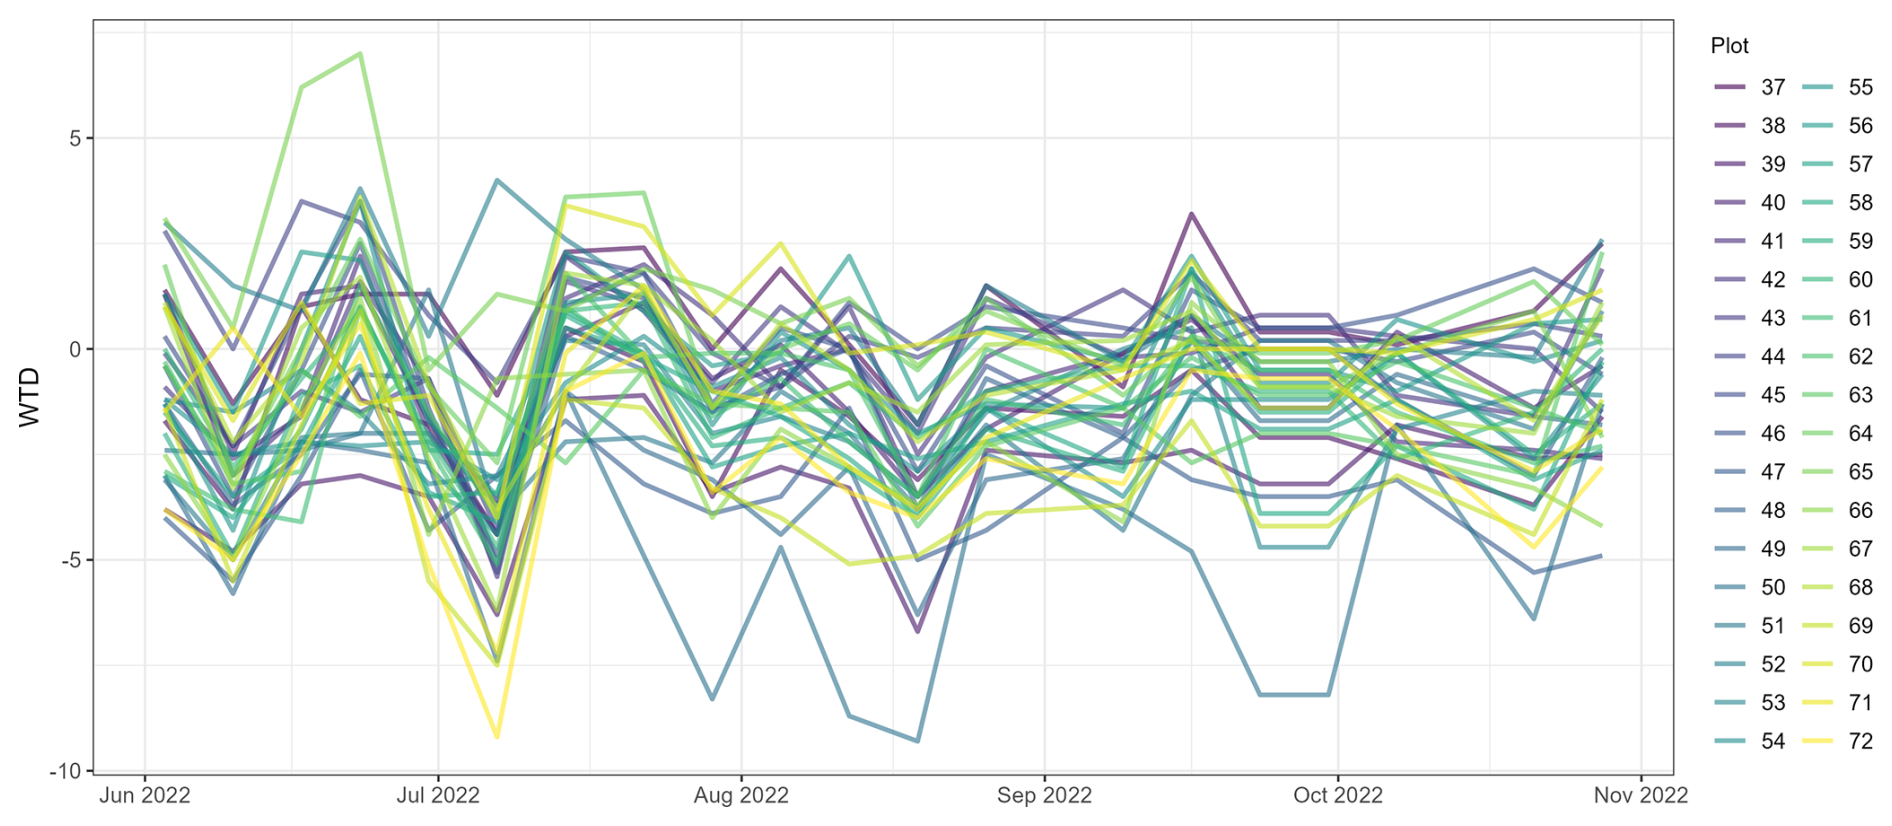
Figure A1The depth of the water table (WTD) at 36 study plots in Puukkosuo fen during June–October 2022. The average minimum value for WTD was −4.8 cm, and the average maximum was +1.8 cm from the peat surface.
Table A1Distribution (Dist), mean (M), median (Mdn), and standard deviation (SD) of the heights (h) and dry biomass (BM) of vascular plant (VP) and bryophyte (Bryo) species identified from the 36 study plots (P) in July 2022. The number of VPs within the studied area was counted by the number of shoots (Shoots_P). BMs are reported only for samples (S) collected for BM estimations. Separate samples were collected for plants in different growth stages: flowering (FL) and non-flowering (NF) VP species, except for four species for which these categories were combined (Comb). The sample size (Sample) of bryophytes depended on the commonness of the species and was either 1 % or 5 % of the studied area. For all Bryo species, a BM for 1 % coverage of the studied area was calculated (BM 1 %). Abbreviations for the plant species: Andromeda polifolia (AndPol), Angelica sylvestris (AngSyl), Betula nana (BetNan), Carex chordorrhiza (CarCho), Carex dioica (CarDio), Carex flava (CarFla), Carex lasiocarpa (CarLas), Carex limosa (CarLim), Carex panicea (CarPan), Carex rostrata (CarRos), Dactylorhiza species (DactSp.), Drosera anglica (DroAng), Drosera rotundifolia (DroRot), Equisetum fluviatile (EquFlu), Equisetum variegatum (EquVar), Eriophorum angustifolium (EriAng), Eriophorum gracile (EriGra), Eriophorum latifolium (EriLat), Festuca ovina (FesOvi), Menyanthes trifoliata (MenTri), Molinia caerulea (MolCae), Pedicularis palustris (PedPal), Pinguicula species (PingSp.), Potentilla erecta (PotEre), Saussurea alpina (SauAlp), Selaginella selaginoides (SelSel), Tofieldia pusilla (TofPus), Trichophorum alpinum (TriAlp), Trichophorum cespitosum (TriCes), Vaccinium oxycoccos (VacOxy), Viola epipsila (VioEpi), Aneura pinguis (AnePin), Aulacomnium palustre (AulPal), Campylium stellatum (CamSte), Cinclidium stygium (CinSty), Fissidens adianthoides (FisAdi), Mesoptychia rutheana (MesRut), Paludella squarrosa (PalSqu), Scorpidium cossonii (ScoCos), Sphagnum warnstorfii (SphWar), and Tomentypnum nitens (TomNit). Plot-scale vegetation data can be obtained from the corresponding author.
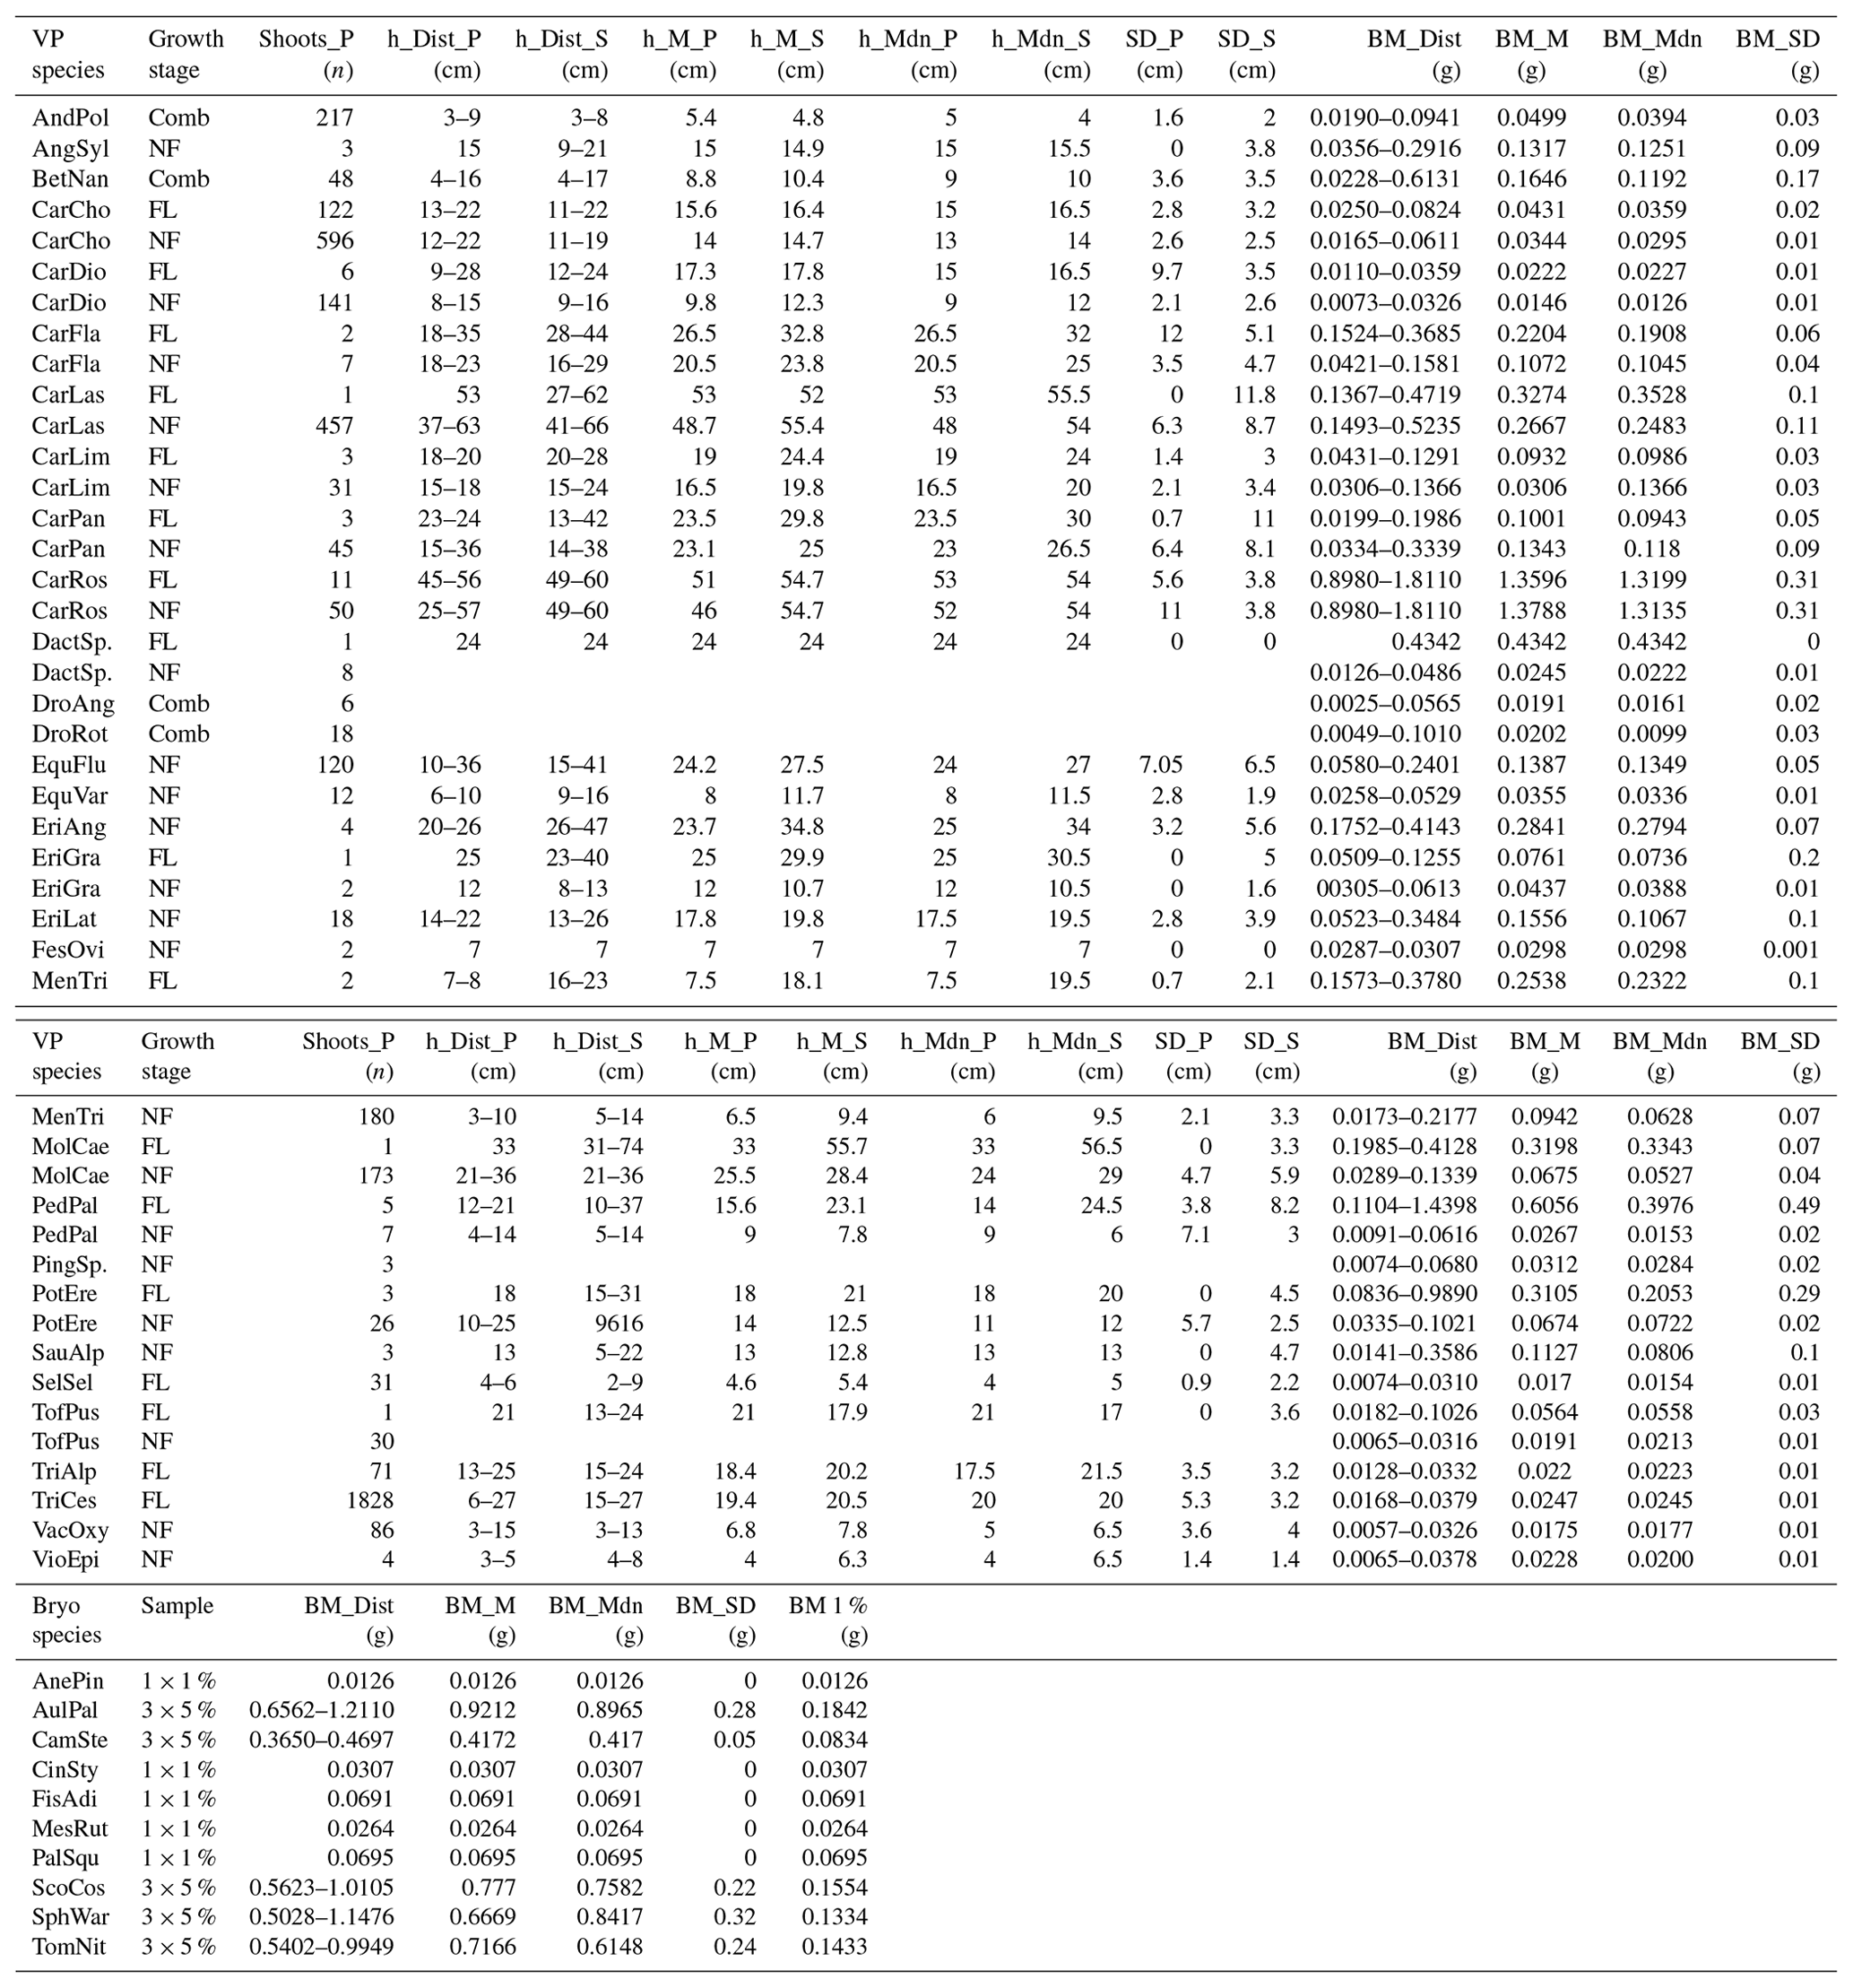
Table A2Total plot-scale dry mass weight biomass (BM) of vascular plants (VP) and bryophytes (Bryo) in grams inside the collar (A=660.5 cm2) at each experimental plot (37–72), a VP to Bryo BM ratio (VP : Bryo ratio), and the portion of VP BM in the total BM (VP of total BM).
Table A3Combined dry mass weight estimation (g) of all the study plots for each species. Vascular plants are listed at the top and bryophytes at the bottom of the list in alphabetical order. For abbreviations of the species, see Table A1.
Figure B1Cluster dendrogram of all species data. Indicator species by clusters: Sco = Scorpidium cossonii, Sph = Sphagnum spp. and Paludella squarrosa, and Cam = Campylium stellatum.
Figure B2Cluster dendrogram of vascular plant data. Indicator species by clusters: C.ros = Carex rostrata, C.cho = Carex chordorrhiza, and T.ces = Carex lasiocarpa, Potentilla erecta, and Trichophorum cespitosum.
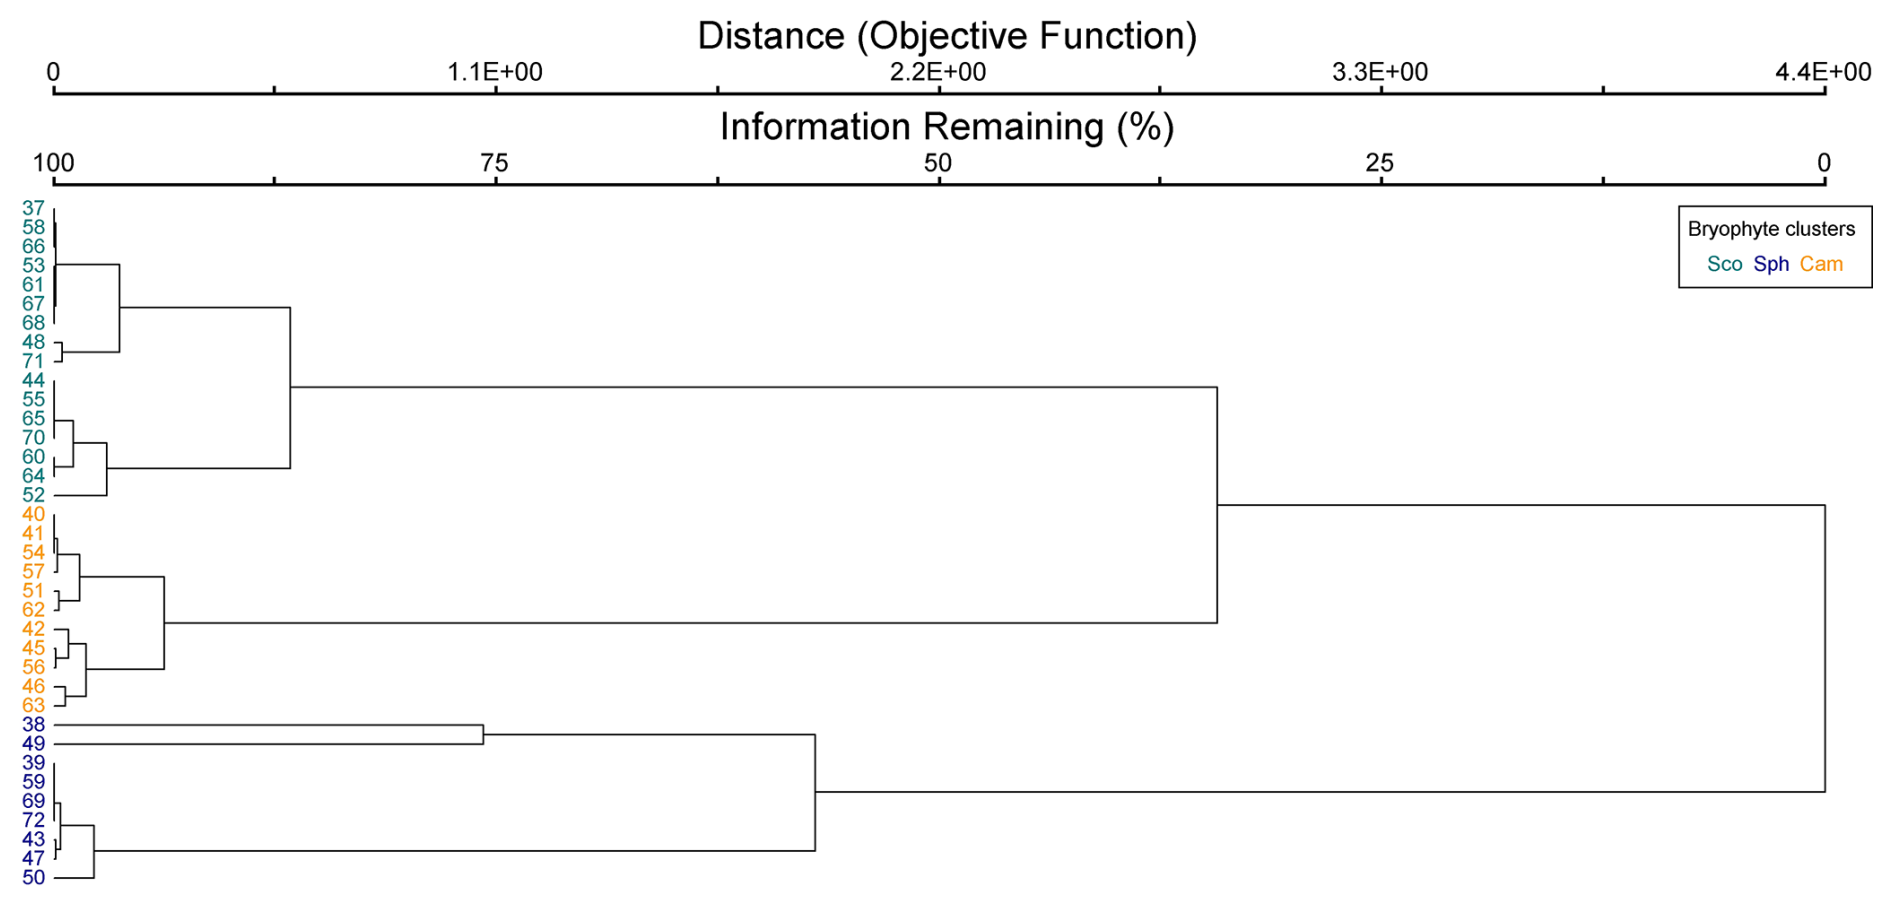
Figure B3Cluster dendrogram of bryophyte data. Indicator species by clusters: Sco = Scorpidium cossonii, Sph = Sphagnum spp. and Paludella squarrosa, and Cam = Campylium stellatum.
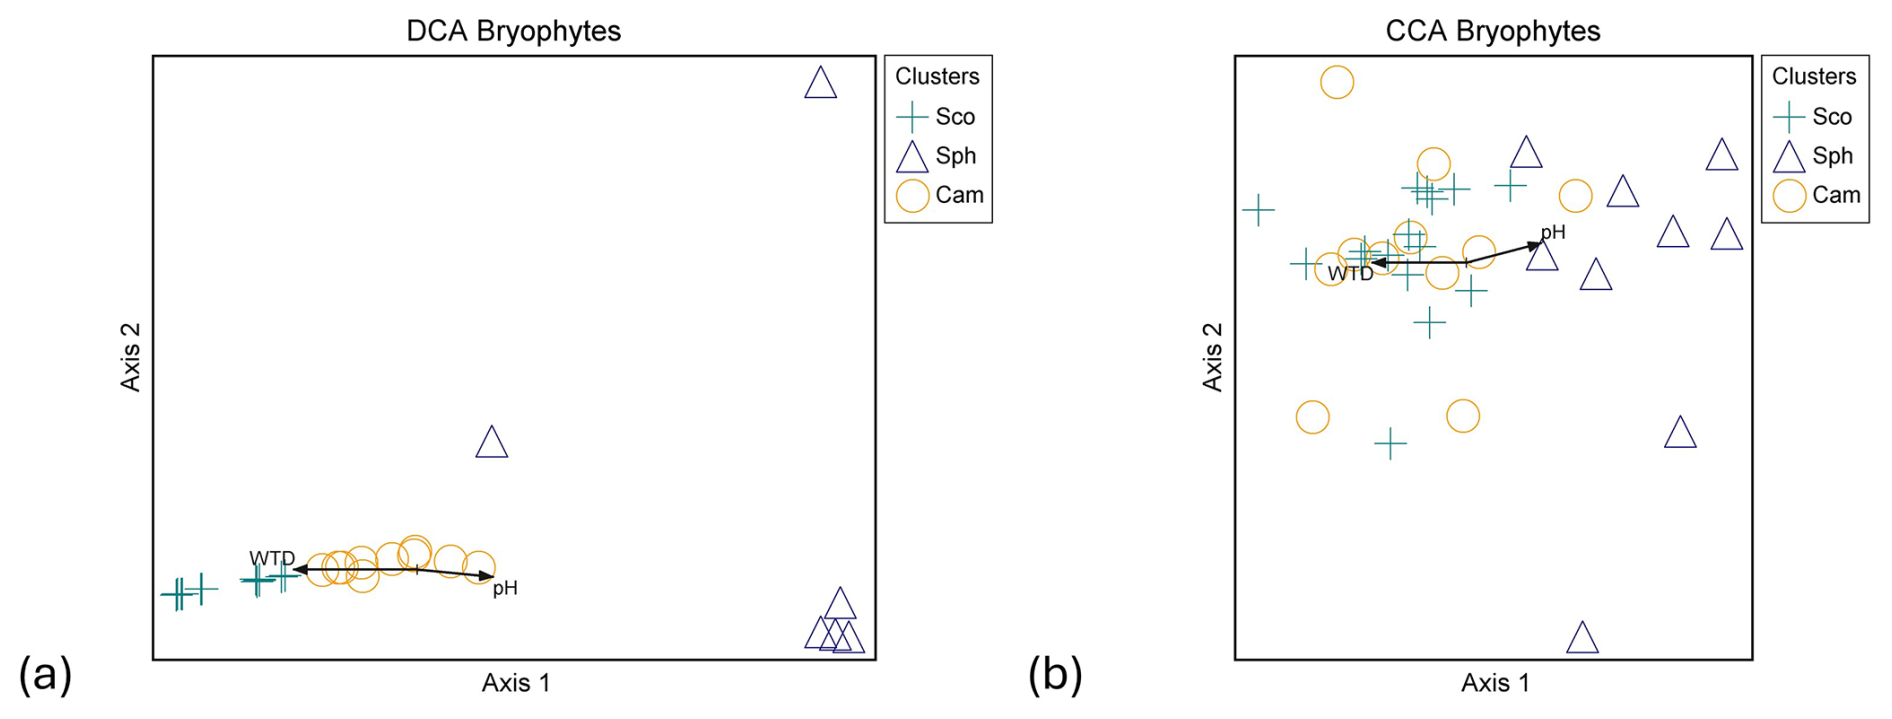
Figure B4Ordination graphs of bryophyte data. (a) DCA with rare species downweighted (eigenvalue axis 1 = 0.950, axis 2 = 0.364) and (b) CCA (eigenvalue axis 1 = 0.711, axis 2 = 0.510). Abbreviations for plant community clusters: Sco = Scorpidium cossonii, Sph = Sphagnum spp. and Paludella squarrosa, and Cam = Campylium stellatum. WTD stands for water table depth and CarRos for the biomass of C. rostrata.
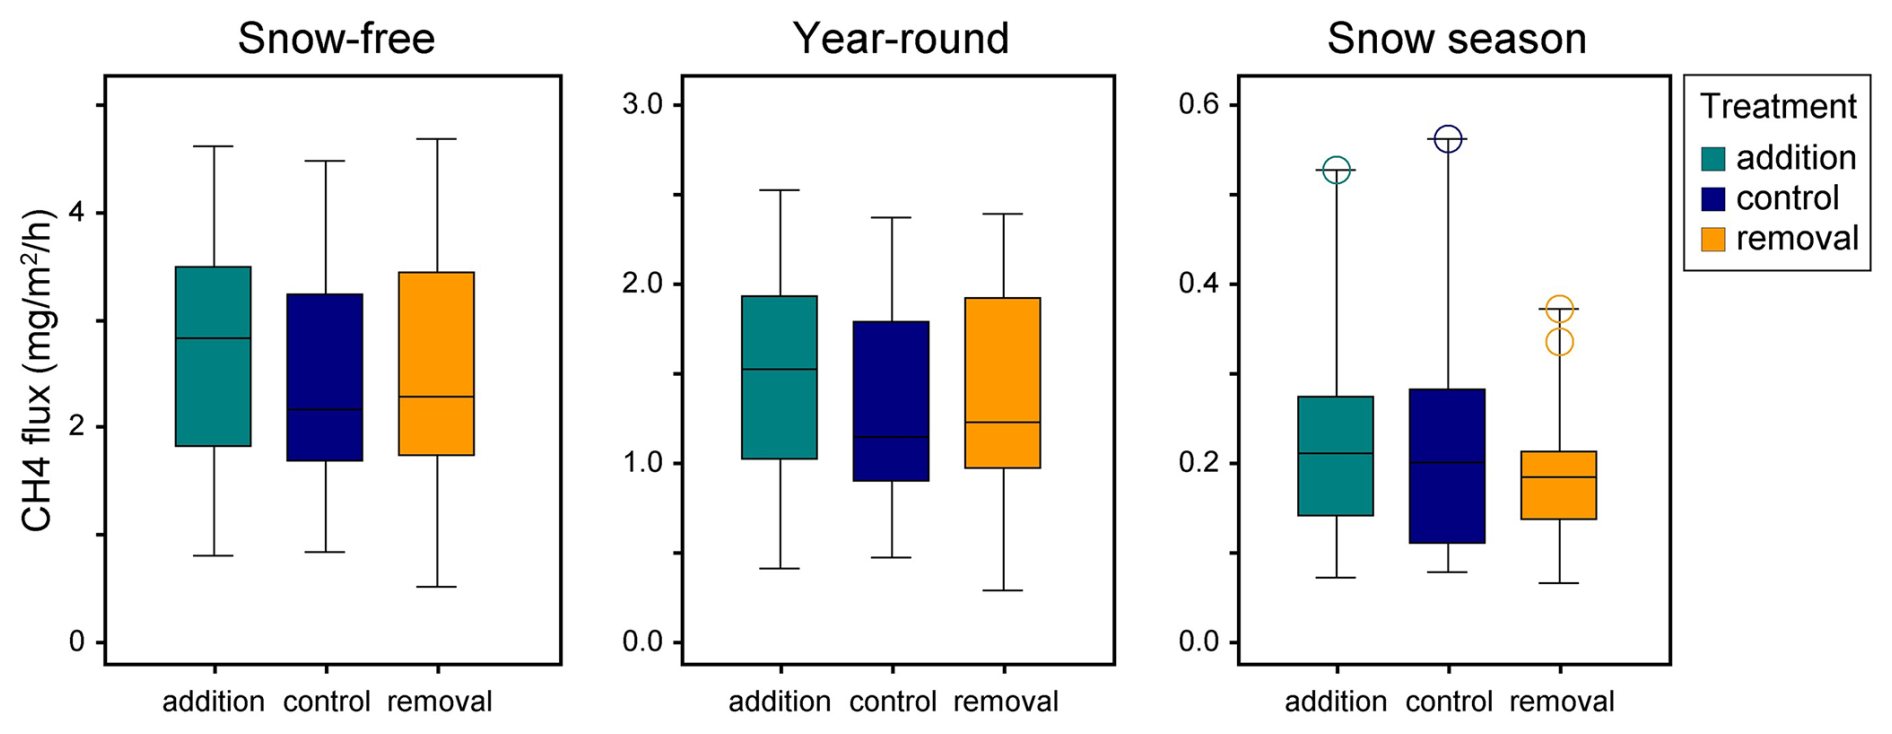
Figure B5The relation of the snow level manipulation experiment's treatments and methane flux in different time periods. There were no significant (p<0.05) differences between the treatments in relation to the fluxes. Control plots represent the natural snow level, while in removal plots, the snow depth was maintained at 0.25 m by shoveling the snow and distributing it evenly onto the addition plots.
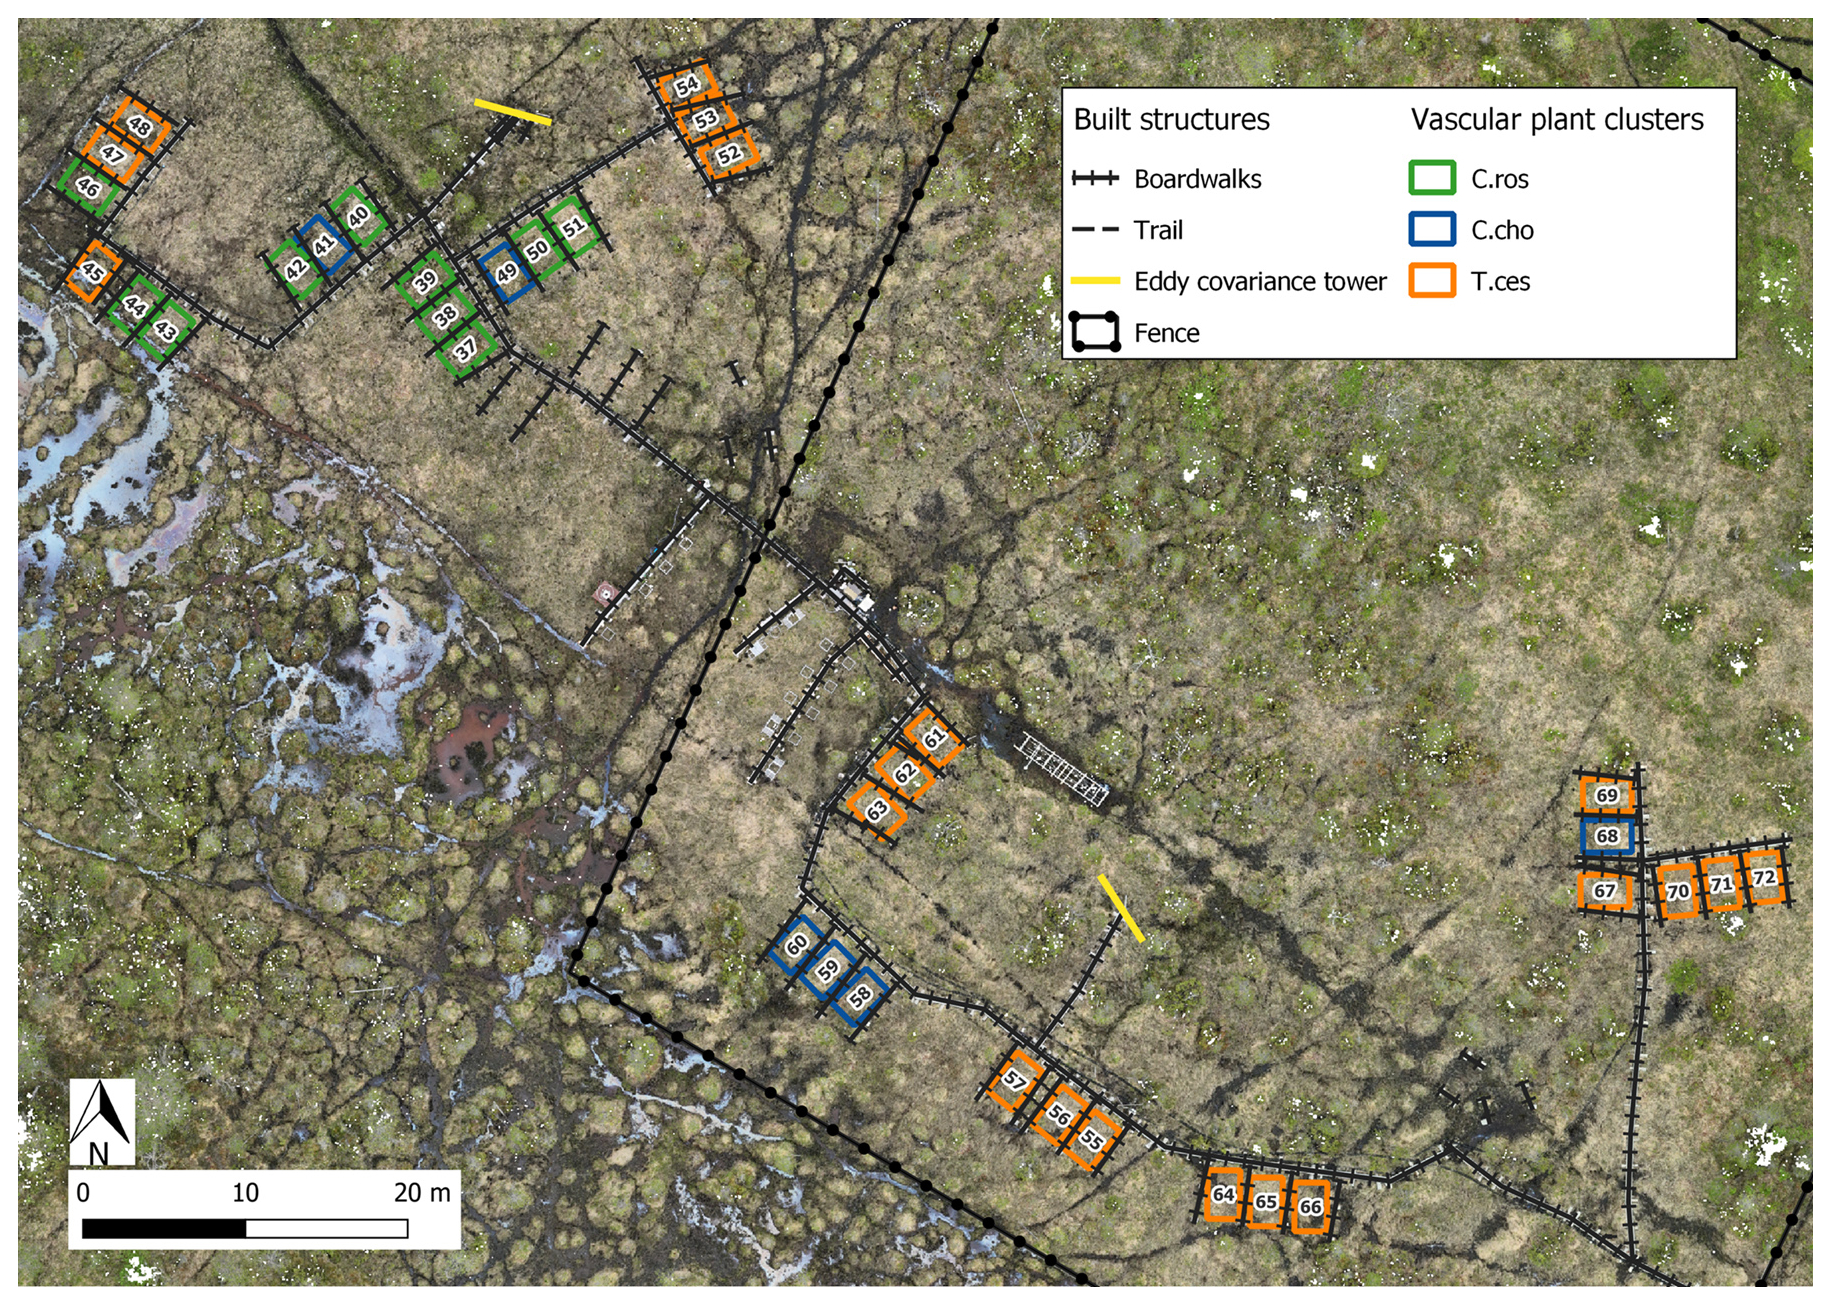
Figure B6Location of the study plots at Puukkosuo fen segregated by vascular plant clusters. Indicator species most strongly connected to the vascular plant clusters: C.ros = C. rostrata, C.cho = C. chordorrhiza, and T.ces = C. lasiocarpa, P. erecta, and T. cespitosum. Orthomosaic © Petra Korhonen 2024.
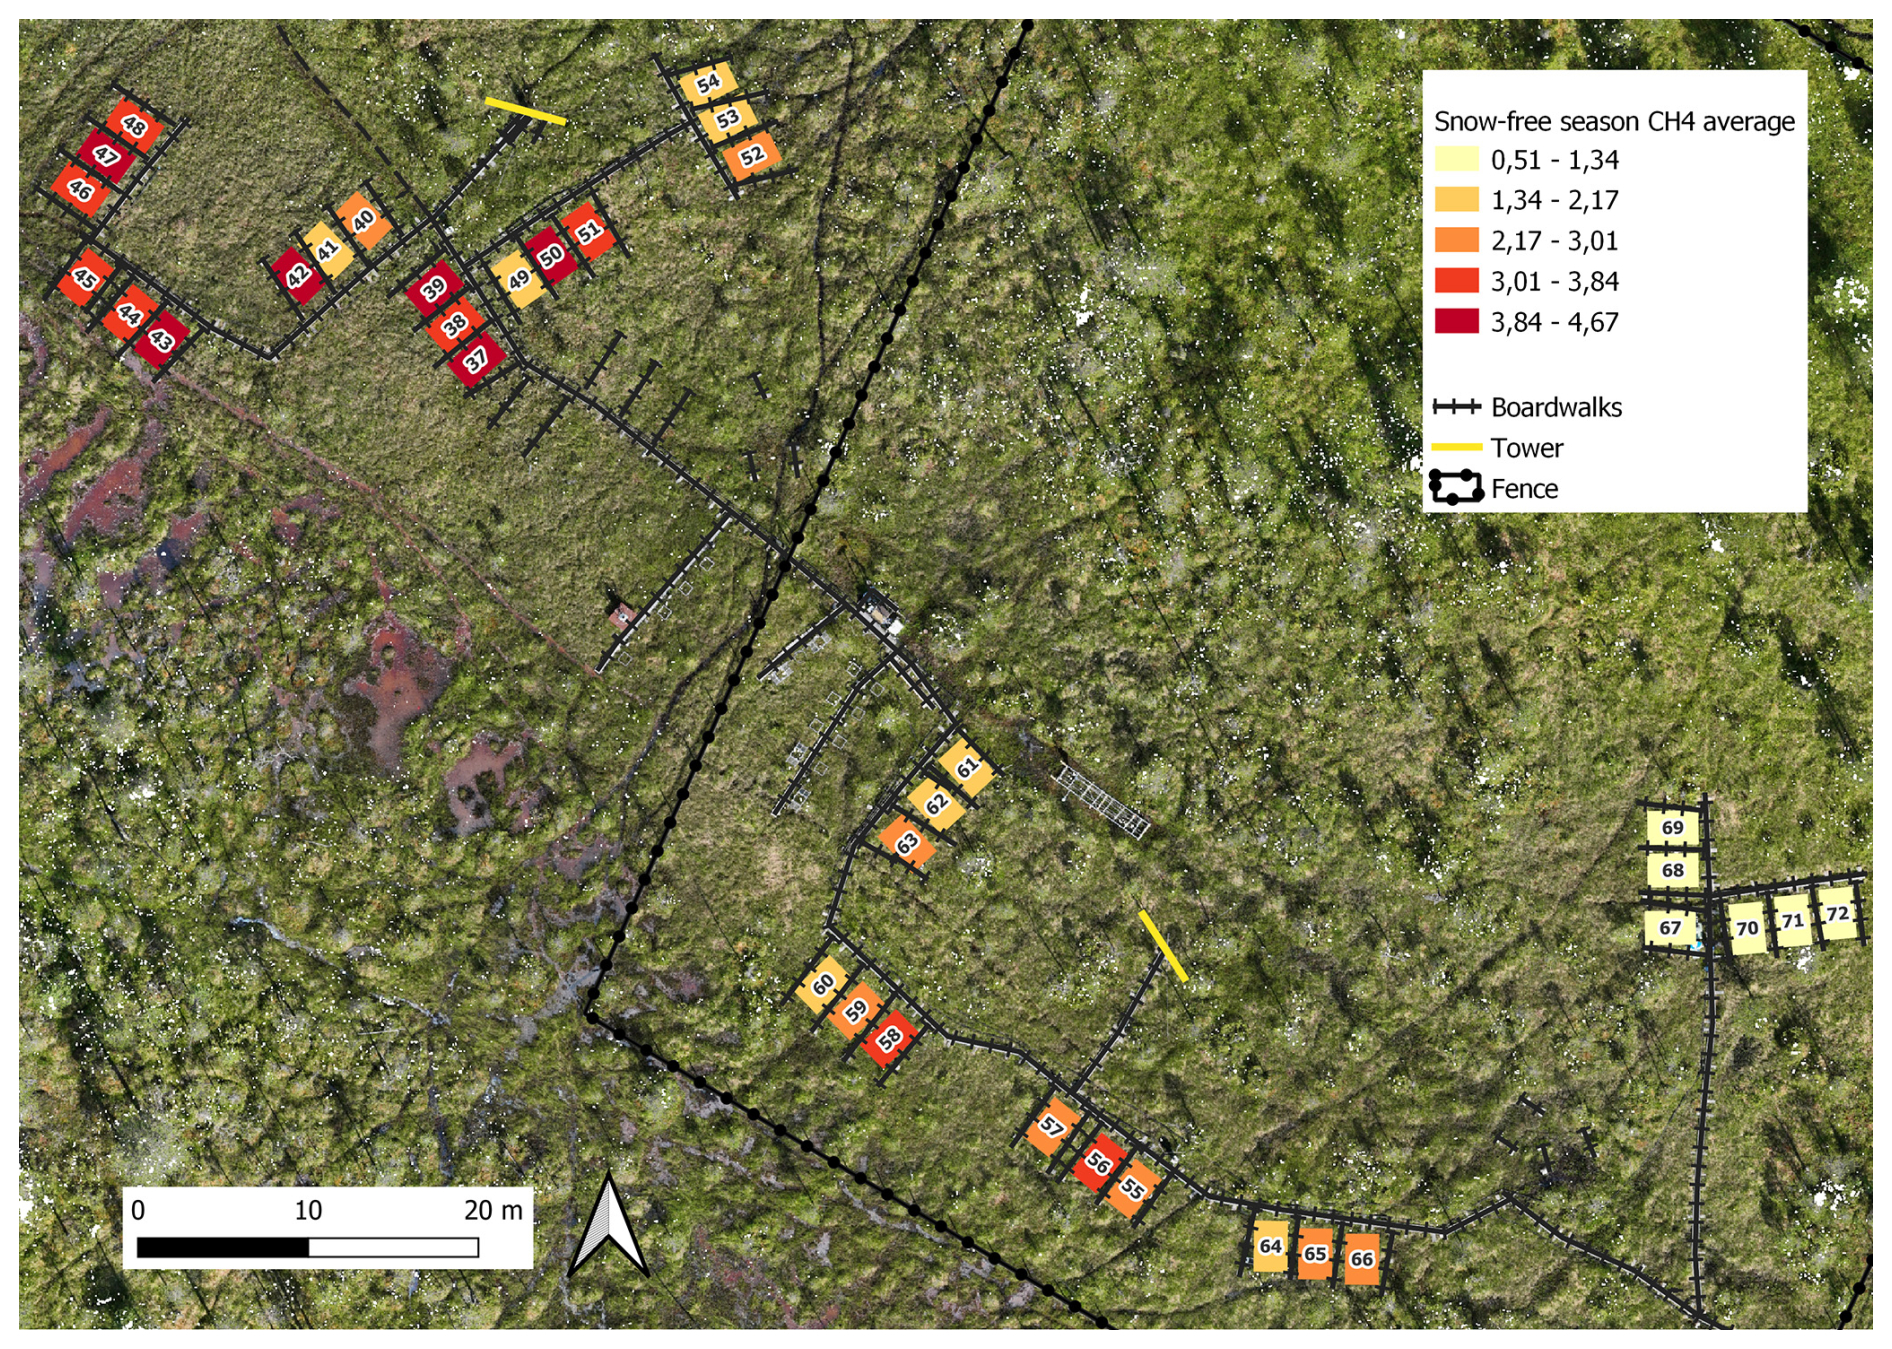
Figure B7Spatial variation of snow-free season (13 May–26 October 2022) methane fluxes (mg CH4 m−2 h−1). Orthomosaic © Petra Korhonen 2024.
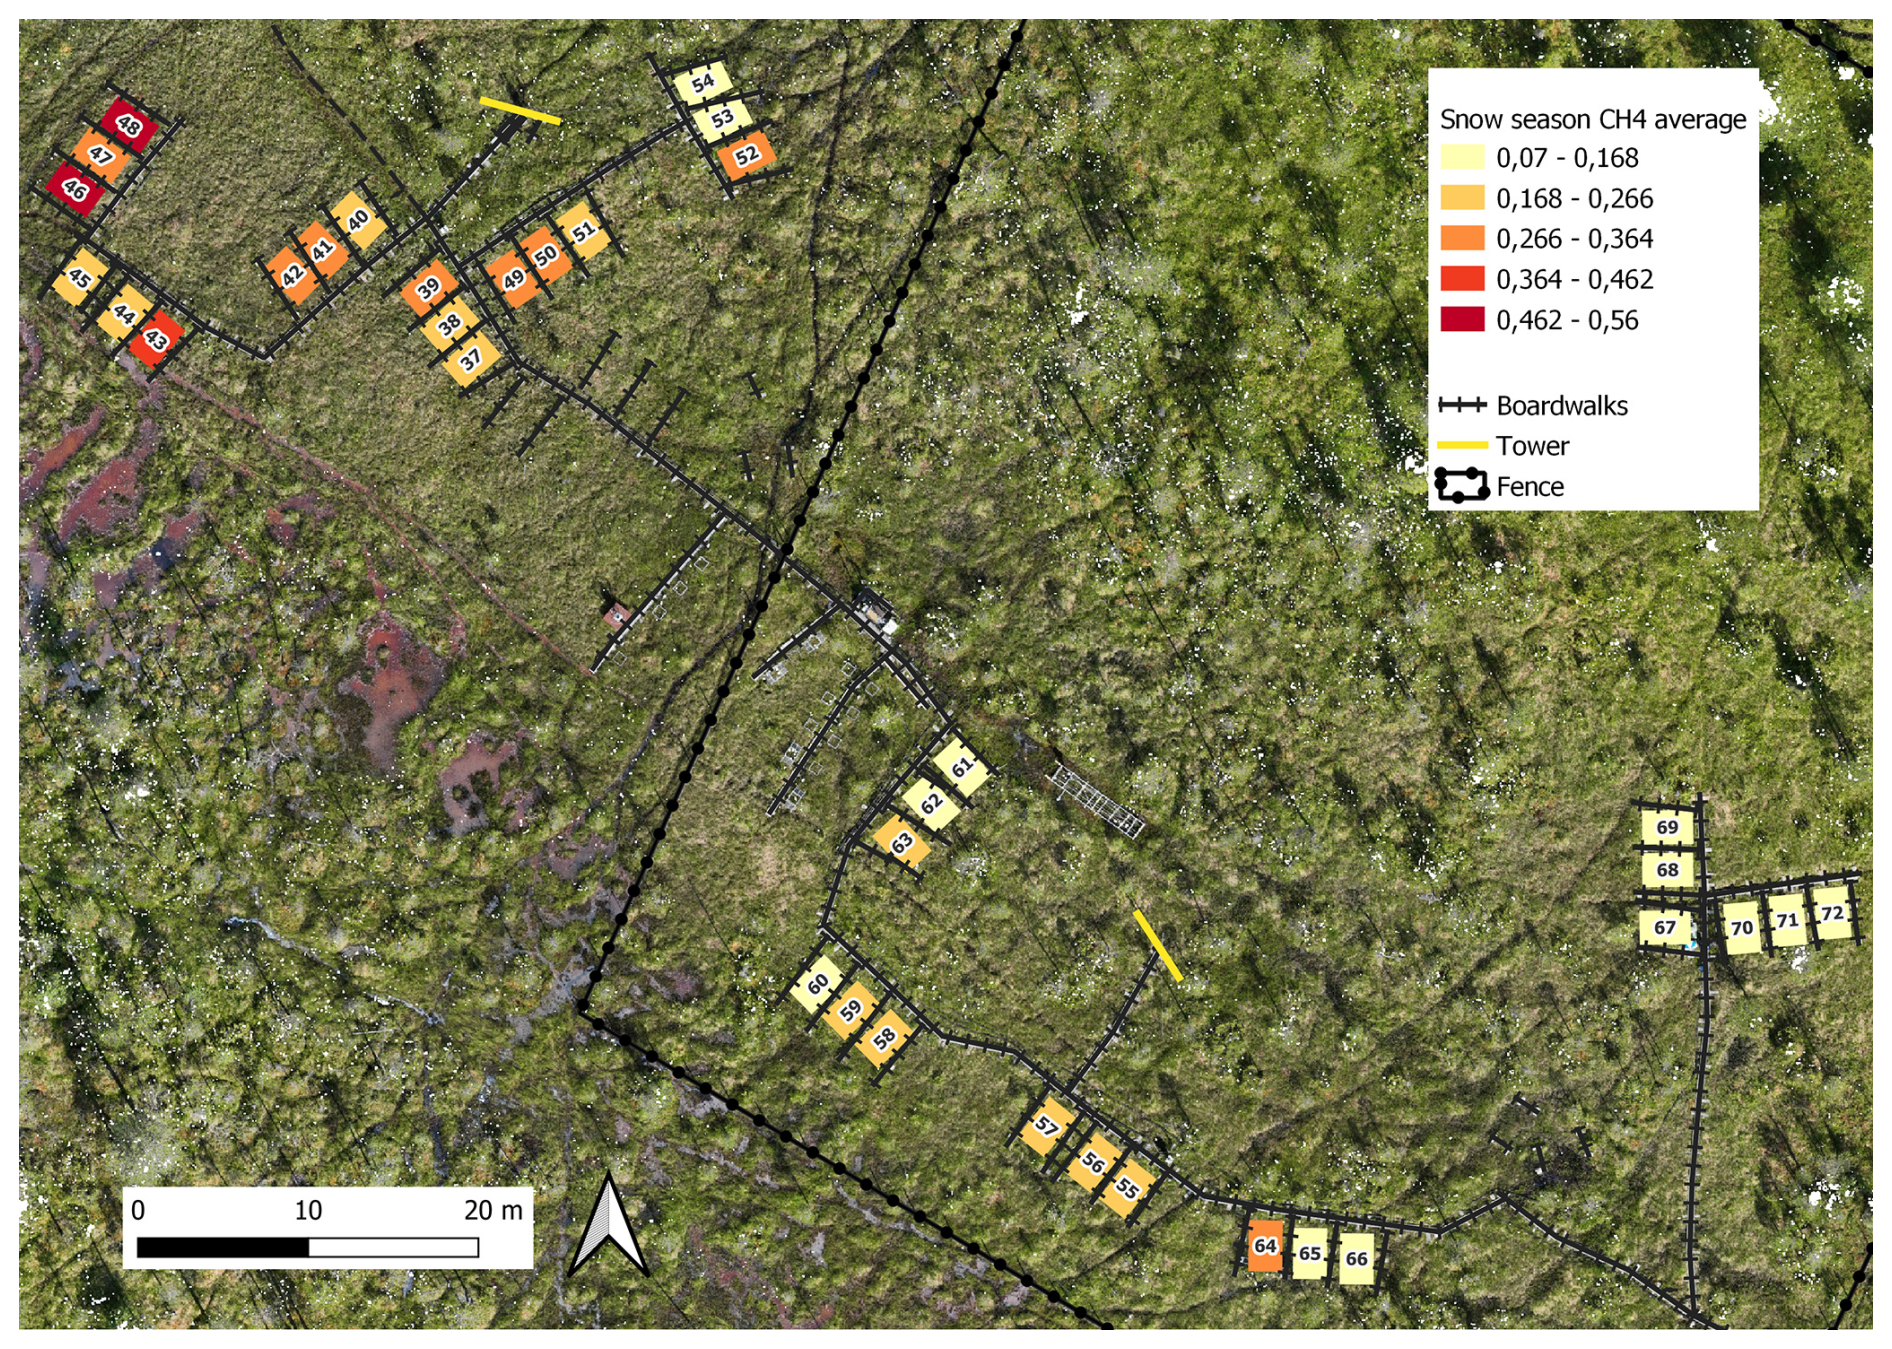
Figure B8Spatial variation of snow season (19 October 2021–12 May 2022 and 27–31 October 2022) methane fluxes (mg CH4 m−2 h−1). Orthomosaic © Petra Korhonen 2024.
Table B1Indicator values (% of perfect indication, based on combining the values of relative abundance and relative frequency) of all identified species (n=40) of Puukkosuo segregated by the vascular plant clusters. The values for the clusters' significant indicator species are bolded. Species with an indicator value lower than 20 % were excluded from the table. Abbreviations for the species most strongly connected to the clusters: C.ros = C. rostrata, C.cho = C. chordorrhiza, and T.ces = C. lasiocarpa, P. erecta, and T. cespitosum. Abbreviations for the species: CarRos = Carex rostrata, MenTri = Menyanthes trifoliata, TriAlp = Trichophorum alpinum, CarLim = Carex limosa, CinSty = Cinclidium stygium, CarCho = Carex chordorrhiza, VacOxy = Vaccinium oxycoccos, BetNan = Betula nana, AndPol = Andromeda polifolia, EriLat = Eriophorum latifolium, TriCes = Trichophorum cespitosum, PotEre = Potentilla erecta, CarLas = Carex lasiocarpa, EquFlu = Equisetum fluviatile, MolCae = Molinia caerulea, TofPus = Tofieldia pusilla, PingSp. = Pinguicula sp., CarDio = Carex dioica, CamSte = Campylium stellatum, ScoCos = Scorpidium cossonii, and SphWar = Sphagnum warnstorfii.
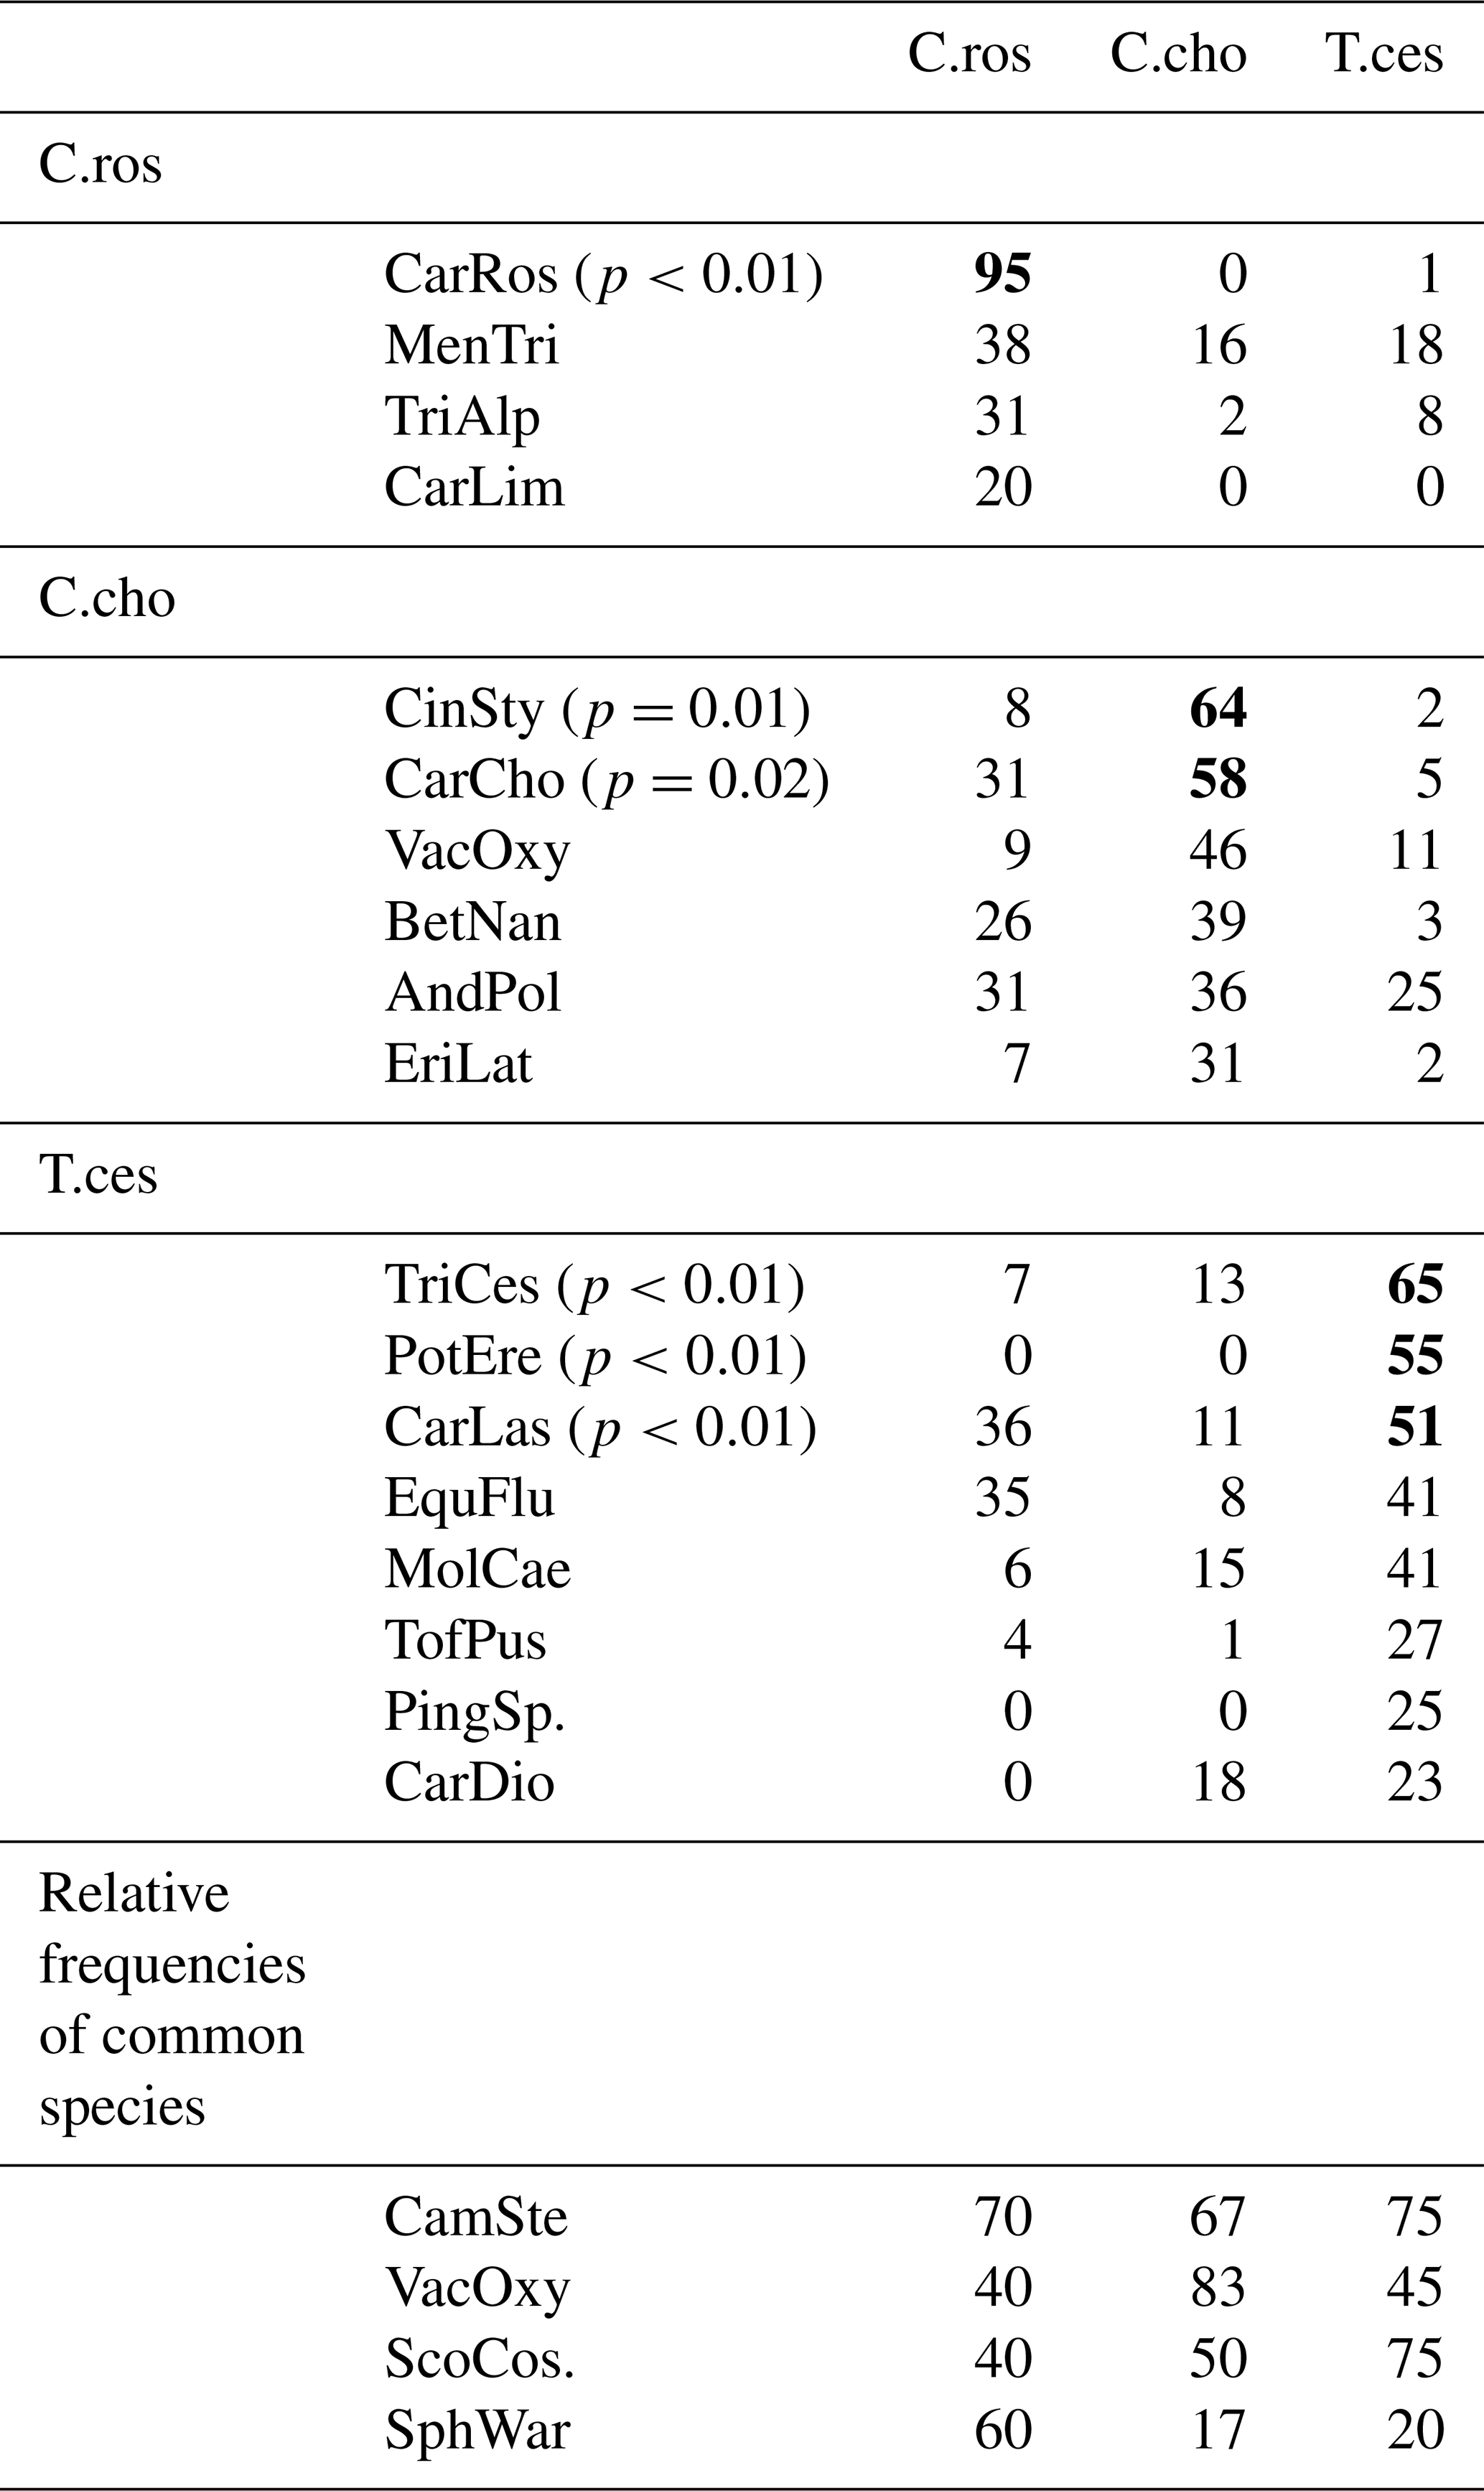
Table B2Pearson's correlation matrix among the environmental and biomass variables. Significant correlations are bolded, p-value ≤ 0.05 (r≥0.33) marked with one asterisk (*), p-value ≤ 0.01 (r≥0.42) with two asterisks () and p-value ≤ 0.001 (r≥0.53) with three asterisks (). CH4_y = year-round methane flux, CH4_sf = snow-free season methane flux, CH4_s = snow season methane flux, WTD = water table depth, NO3 + NO2 = nitrate and nitrite, NH4 = ammonium, TOTN = total nitrogen, TOC = total organic carbon, IC = inorganic carbon, BMratio = vascular plant to bryophyte biomass ratio, BMvp = vascular plant biomass, BMbryo = bryophyte biomass, BMsed = biomass of all sedges, BMsph = biomass of Sphagnum mosses, Peat = peat layer thickness, Litter = litter percentage, CarRos = biomass of Carex rostrata, SoilT_y = average year-round soil temperature at −5 cm, SoilT_sf = average snow-free season soil temperature at −5 cm, and SoilT_s = average snow season soil temperature at −5 cm. WTD and porewater chemistry concentrations are values of the snow-free season.
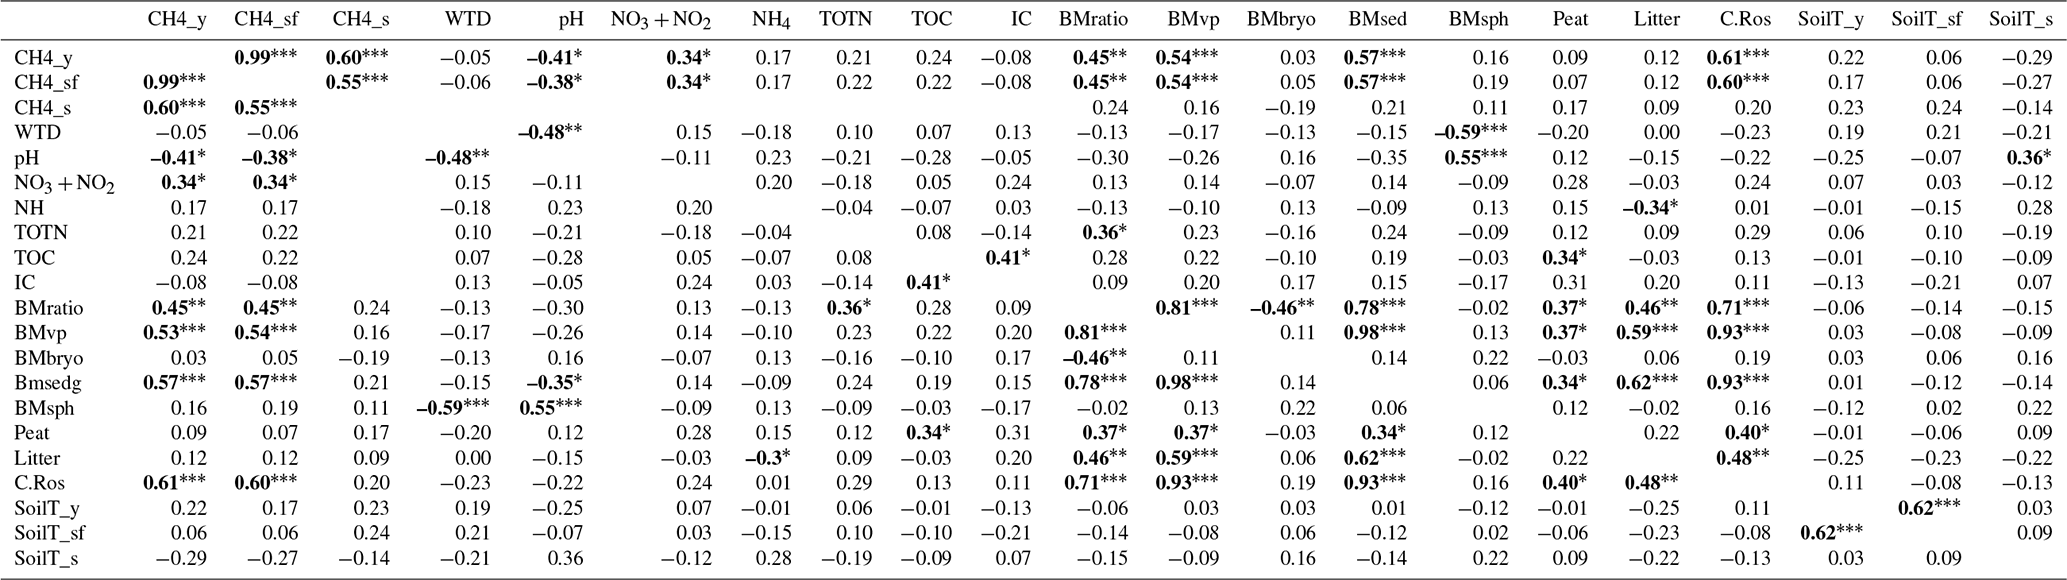
Table B3Accumulated annual (1 November 2021–31 October 2022, AccAnnual) and snow season (1 November 2021–12 May 2022 and 27–31 October 2022, AccSnow) methane flux rates in mg CH4 m−2 and the portion of snow season fluxes in the annual flux (%SnowOfAnnual) calculated for each plot from the manual static chamber measurements. Ordered by the highest portion of the annual flux.
The full datasets used are available upon request.
MV, RP, MM, and TRC designed the experimental setup of the study site. EJL, TT, TRC, and JL designed the study. EJL sampled the vegetation and performed the statistical analyses with assistance from JL, EK, and TT. EJL, JL, and EK were responsible for data curation. EK and MM wrote the code for the flux calculations. MV designed and provided resources for sampling the water chemistry. Resource management of the data collection was overseen by RP. Manual methane flux measurements, pore water sampling, and water level measurements were conducted by numerous individuals, including EJL and EK. EJL prepared the manuscript with contributions from all co-authors.
The contact author has declared that none of the authors has any competing interests.
Publisher's note: Copernicus Publications remains neutral with regard to jurisdictional claims made in the text, published maps, institutional affiliations, or any other geographical representation in this paper. While Copernicus Publications makes every effort to include appropriate place names, the final responsibility lies with the authors.
Maik Bischoff, Pyry Runko, Noémie Perrier-Malette, Valentin Kriegel, Polina Saarinen, and Johannes Väisänen, among others, are gratefully acknowledged for their help with the fieldwork. A special thanks goes to the Oulanka Research Station staff for their continuous efforts. We also acknowledge the help of AI in creating the R codes. Eeva Järvi-Laturi was supported by the Green-Digi-Basin project funded by the Research Council of Finland (RCF, 347704) and the DIWA-Digital Waters flagship PhD pilot program funded by the Ministry of Education (RCF, 359228). Efrén López-Blanco, Mikhail Mastepanov, and Torben R. Christensen consider this study a contribution to GreenFeedBack (Greenhouse gas fluxes and earth system feedbacks) funded by the European Union's HORIZON research and innovation program under grant agreement no. 101056921. Other funds during the project came from Maa- ja vesitekniikan tuki ry (to Maria Väisänen). The work is part of the EcoClimate experimental platform at Oulanka Research Station.
Eeva Järvi-Laturi was supported by the Green-Digi-Basin project funded by the Research Council of Finland (RCF, 347704) and the DIWA-Digital Waters flagship PhD pilot program funded by the Ministry of Education (RCF, 359228). Efrén López-Blanco, Mikhail Mastepanov, and Torben R. Christensen consider this study a contribution to GreenFeedBack (Greenhouse gas fluxes and earth system feedbacks) funded by the European Union's HORIZON research and innovation program (grant agreement no. 101056921). Other funds during the project came from Maaja vesitekniikan tukiry (to Maria Väisänen). The work is part of the EcoClimate experimental platform at Oulanka Research Station.
This paper was edited by Erika Buscardo and reviewed by Philip Wookey and three anonymous referees.
Alm, J., Saarnio, S., Nykänen, H., Silvola, J., and Martikainen, P. J.: Winter CO2, CH4 and N2O fluxes on some natural and drained boreal peatlands, Biogeochemistry, 44, 163–186, https://doi.org/10.1007/bf00992977, 1999.
Bhullar, G. S., Iravani, M., Edwards, P. J., and Olde Venterink, H.: Methane transport and emissions from soil as affected by water table and vascular plants, BMC Ecol., 13, 32, https://doi.org/10.1186/1472-6785-13-32, 2013.
Björkman, M. P., Morgner, E., Cooper, E. J., Elberling, B., Klemedtsson, L., and Björk, R. G.: Winter carbon dioxide effluxes from Arctic ecosystems: An overview and comparison of methodologies, Global Biogeochem. Cy., 24, GB3010, https://doi.org/10.1029/2009GB003667, 2010.
Campitelli, E.: ggnewscale: Multiple Fill and Colour Scales in `ggplot2', R package version 0.5.0 [data set], https://CRAN.R-project.org/package=ggnewscale/ (last access: 17 January 2025) 2024.
Christensen, T. R.: Wetland emissions on the rise, Nat. Clim. Change, 14, 210–211, https://doi.org/10.1038/s41558-024-01938-y, 2024.
Christensen, T. R., Friborg, T., Sommerkorn, M., Kaplan, J., Illeris, L., Soegaard, H., Nordstroem, C., and Jonasson, S.: Trace gas exchange in a high-Arctic valley: 1. Variations in CO2 and CH4 Flux between tundra vegetation types, Global Biogeochem. Cy., 14, 701–713, https://doi.org/10.1029/1999GB001134, 2000.
Christensen, T. R., Scheller, J., Scheel, M., Rudd, D. A., Jackowicz-Korczynski, M., Mastepanov, M., and López-Blanco, E.: Rapid shift in greenhouse forcing of emerging arctic peatlands, Sci. Rep., 13, 2828, https://doi.org/10.1038/s41598-023-29859-4, 2023.
Evans, C. D., Peacock, M., Baird, A. J., Artz, R. R. E., Burden, A., Callaghan, N., Chapman, P. J., Cooper, H. M., Coyle, M., Craig, E., Cumming, A., Dixon, S., Gauci, V., Grayson, R. P., Helfter, C., Heppell, C. M., Holden, J., Jones, D. L., Kaduk, J., Levy, P., Matthews, R., McNamara, N. P., Misselbrook, T., Oakley, S., Page, S. E., Rayment, M., Ridley, L. M., Stanley, K. M., Williamson, J. L., Worrall, F., and Morrison, R.: Overriding water table control on managed peatland greenhouse gas emissions, Nature, 593, 548–552, https://doi.org/10.1038/s41586-021-03523-1, 2021.
Forkel, M., Carvalhais, N., Rödenbeck, C., Keeling, R., Heimann, M., Thonicke, K., Zaehle, S., and Reichstein, M.: Enhanced seasonal CO 2 exchange caused by amplified plant productivity in northern ecosystems, Science, 351, 696–699, https://doi.org/10.1126/science.aac4971, 2016.
Garnier, S., Ross, N., Rudis, R., Camargo, A. P., Sciaini, M. and Scherer, C. viridis(Lite): Colorblind-Friendly Color Maps for R, viridis package version 0.6.5, https://cran.r-project.org/web/packages/viridis/ (last access: 17 January 2025), 2024.
Ge, M., Korrensalo, A., Laiho, R., Lohila, A., Makiranta, P., Pihlatie, M., Tuittila, E.-S., Kohl, L., Putkinen, A., and Koskinen, M.: Plant phenology and species-specific traits control plant CH emissions in a northern boreal fen, New Phytol., 238, 1019–1032, https://doi.org/10.1111/nph.18798, 2023.
Ge, M., Korrensalo, A., Putkinen, A., Laiho, R., Kohl, L., Pihlatie, M., Lohila, A., Makiranta, P., Siljanen, H., Tuittila, E.-S., Wang, J., and Koskinen, M.: CH4 transport in wetland plants under controlled environmental conditions – separating the impacts of phenology from environmental variables, Plant Soil, https://doi.org/10.1007/s11104-024-06756-x, 2024.
Grimes, M., Carrivick, J. L., Smith, M. W., and Comber, A. J.: Land cover changes across Greenland dominated by a doubling of vegetation in three decades, Sci Rep, 14, 3120, https://doi.org/10.1038/s41598-024-52124-1, 2024.
Hájek, M., Jiménez-Alfaro, B., Hájek, O., Brancaleoni, L., Cantonati, M., Carbognani, M., Dedić, A., Dítě, D., Gerdol, R., Hájková, P., Horsáková, V., Jansen, F., Kamberović, J., Kapfer, J., Kolari, T. H. M., Lamentowicz, M., Lazarević, P., Mašić, E., Moeslund, J. E., Pérez-Haase, A., Peterka, T., Petraglia, A., Pladevall-Izard, E., Plesková, Z., Segadelli, S., Semeniuk, Y., Singh, P., Šímová, A., Šmerdová, E., Tahvanainen, T., Tomaselli, M., Vystavna, Y., Biţă-Nicolae, C., and Horsák, M.: A European map of groundwater pH and calcium, Earth Syst. Sci. Data, 13, 1089–1105, https://doi.org/10.5194/essd-13-1089-2021, 2021.
Helbig, M., Waddington, J. M., Alekseychik, P., Amiro, B. D., Aurela, M., Barr, A. G., Black, T. A., Blanken, P. D., Carey, S. K., Chen, J., Chi, J., Desai, A. R., Dunn, A., Euskirchen, E. S., Flanagan, L. B., Forbrich, I., Friborg, T., Grelle, A., Harder, S., Heliasz, M., Humphreys, E. R., Ikawa, H., Isabelle, P.-E., Iwata, H., Jassal, R., Korkiakoski, M., Kurbatova, J., Kutzbach, L., Lindroth, A., Löfvenius, M. O., Lohila, A., Mammarella, I., Marsh, P., Maximov, T., Melton, J. R., Moore, P. A., Nadeau, D. F., Nicholls, E. M., Nilsson, M. B., Ohta, T., Peichl, M., Petrone, R. M., Petrov, R., Prokushkin, A., Quinton, W. L., Reed, D. E., Roulet, N. T., Runkle, B. R. K., Sonnentag, O., Strachan, I. B., Taillardat, P., Tuittila, E.-S., Tuovinen, J.-P., Turner, J., Ueyama, M., Varlagin, A., Wilmking, M., Wofsy, S. C., and Zyrianov, V.: Increasing contribution of peatlands to boreal evapotranspiration in a warming climate, Nat. Clim. Change, 10, 555–560, https://doi.org/10.1038/s41558-020-0763-7, 2020.
Henneberg, A., Sorrell, B. K., and Brix, H.: Internal methane transport through uncus effusus: experimental manipulation of morphological barriers to test above- and below-ground diffusion limitation, New Phytol., 196, 799–806, https://doi.org/10.1111/j.1469-8137.2012.04303.x, 2012.
Hvitfeldt, E.: paletteer: Comprehensive Collection of Color Palettes, R package version 1.3.0, Github [data set], https://github.com/EmilHvitfeldt/paletteer/ (last access: 17 January 2025), 2021.
Jammet, M., Dengel, S., Kettner, E., Parmentier, F.-J. W., Wik, M., Crill, P., and Friborg, T.: Year-round CH4 and CO2 flux dynamics in two contrasting freshwater ecosystems of the subarctic, Biogeosciences, 14, 5189–5216, https://doi.org/10.5194/bg-14-5189-2017, 2017.
Joabsson, A., Christensen, T. R., and Wallén, B.: Vascular plant controls on methane emissions from northern peatforming wetlands, Trends Ecol. Evol., 14, 385–388, https://doi.org/10.1016/S0169-5347(99)01649-3, 1999.
Knorr, K.-H. and Blodau, C.: Impact of experimental drought and rewetting on redox transformations and methanogenesis in mesocosms of a northern fen soil, Soil Biol. Biochem., 41, 1187–1198, https://doi.org/10.1016/j.soilbio.2009.02.030, 2009.
Koelbener, A., Ström, L., Edwards, P. J., and Olde Venterink, H.: Plant species from mesotrophic wetlands cause relatively high methane emissions from peat soil, Plant Soil, 326, 147–158, https://doi.org/10.1007/s11104-009-9989-x, 2010.
Kolari, T. H. M., Korpelainen, P., Kumpula, T., and Tahvanainen, T.: Accelerated vegetation succession but no hydrological change in a boreal fen during 20 years of recent climate change, Ecol. Evol., 11, 7602–7621, https://doi.org/10.1002/ece3.7592, 2021.
Korrensalo, A., Mammarella, I., Alekseychik, P., Vesala, T., and Tuittila, E.-S.: Plant mediated methane efflux from a boreal peatland complex, Plant Soil, 471, 375–392, https://doi.org/10.1007/s11104-021-05180-9, 2022.
Kujala, K., Schmidt, O., and Horn, M. A.: Synergy and competition during the anaerobic degradation of N-acetylglucosamine in a methane-emitting, subarctic, pH-neutral fen, Front. Microbiol., 15, https://doi.org/10.3389/fmicb.2024.1428517, 2024.
Lai, D. Y. F.: Methane Dynamics in Northern Peatlands: A Review, Pedosphere, 19, 409–421, https://doi.org/10.1016/S1002-0160(09)00003-4, 2009.
Lai, D. Y. F., Moore, T. R., and Roulet, N. T.: Spatial and temporal variations of methane flux measured by autochambers in a temperate ombrotrophic peatland, J. Geophys. Res.-Biogeo., 119, 864–880, https://doi.org/10.1002/2013JG002410, 2014.
Laitinen, J., Oksanen, J., Kaakinen, E., Peterka, T., Moen, A., and Tahvanainen, T.: Gradients, Species Richness and Communities in Eastern Finnish Sloping Fens, Annales Botanici Fennici, 58, 289–312, https://doi.org/10.5735/085.058.0415, 2021.
Larmola, T., Tuittila, E.-S., Tiirola, M., Nykänen, H., Martikainen, P. J., Yrjälä, K., Tuomivirta, T., and Fritze, H.: The role of Sphagnum mosses in the methane cycling of a boreal mire, Ecology, 91, 2356–2365, 2010.
Ma, L., Zhu, G., Chen, B., Zhang, K., Niu, S., Wang, J., Ciais, P., and Zuo, H.: A globally robust relationship between water table decline, subsidence rate, and carbon release from peatlands, Commun. Earth Environ., 3, 1–14, https://doi.org/10.1038/s43247-022-00590-8, 2022.
Määttä, T. and Malhotra, A.: The hidden roots of wetland methane emissions, Global Change Biol., 30, e17127, https://doi.org/10.1111/gcb.17127, 2024.
McCune, B. and Mefford, M. J.: PC-ORD. Multivariate Analysis of Ecological Data, Version 7.09, https://www.wildblueberrymedia.net/pcord (last access: 17 January 2025), 2018.
McCune, B., Grace, J. B., and Urban, D. L.: Analysis of Ecological Communities, MjM Software Design, Gleneden Beach, OR, 300 pp., ISBN 0-9721290-0-6, 2002.
Nielsen, C. S., Michelsen, A., Strobel, B. W., Wulff, K., Banyasz, I., and Elberling, B.: Correlations between substrate availability, dissolved CH4, and CH4 emissions in an arctic wetland subject to warming and plant removal, J. Geophys. Res.-Biogeo., 122, 645–660, https://doi.org/10.1002/2016JG003511, 2017.
Olefeldt, D., Euskirchen, E. S., Harden, J., Kane, E., McGuire, A. D., Waldrop, M. P., and Turetsky, M. R.: A decade of boreal rich fen greenhouse gas fluxes in response to natural and experimental water table variability, Global Change Biol., 23, 2428–2440, https://doi.org/10.1111/gcb.13612, 2017.
Pearson, M., Penttilä, T., Harjunpää, L., Laiho, R., Laine, J., Sarjala, T., Silvan, K., and Silvan, N.: Effects of temperature rise and water-table-level drawdown on greenhouse gas fluxes of boreal sedge fens, 489–505, https://www.proquest.com/docview/2676156234 (last access: 4 October 2025), 2015.
Pirk, N., Mastepanov, M., Parmentier, F.-J. W., Lund, M., Crill, P., and Christensen, T. R.: Calculations of automatic chamber flux measurements of methane and carbon dioxide using short time series of concentrations, Biogeosciences, 13, 903–912, https://doi.org/10.5194/bg-13-903-2016, 2016a.
Pirk, N., Tamstorf, M. P., Lund, M., Mastepanov, M., Pedersen, S. H., Mylius, M. R., Parmentier, F.-J. W., Christiansen, H. H., and Christensen, T. R.: Snowpack fluxes of methane and carbon dioxide from high Arctic tundra, J. Geophys. Res.-Biogeo., 121, 2886–2900, https://doi.org/10.1002/2016JG003486, 2016b.
Posit team: RStudio: Integrated Development Environment for R, Posit Software, PBC, Boston, MA, http://www.posit.co/ (last access: 17 January 2025), 2024.
Ramage, J., Kuhn, M., Virkkala, A.-M., Voigt, C., Marushchak, M. E., Bastos, A., Biasi, C., Canadell, J. G., Ciais, P., López-Blanco, E., Natali, S. M., Olefeldt, D., Potter, S., Poulter, B., Rogers, B. M., Schuur, E. A. G., Treat, C., Turetsky, M. R., Watts, J., and Hugelius, G.: The Net GHG Balance and Budget of the Permafrost Region (2000–2020) From Ecosystem Flux Upscaling, Global Biogeochem. Cy., 38, e2023GB007953, https://doi.org/10.1029/2023GB007953, 2024.
R Core Team: R: A language and environment for statistical computing, R Foundation for Statistical Computing, Vienna, Austria, https://www.R-project.org (last access: 17 January 2025). 2024.
Reid, M. C., Pal, D. S., and Jaffé, P. R.: Dissolved gas dynamics in wetland soils: Root-mediated gas transfer kinetics determined via push-pull tracer tests, Water Resour. Res., 51, 7343–7357, https://doi.org/10.1002/2014WR016803, 2015.
Riutta, T., Laine, J., Aurela, M., Rinne, J., Vesala, T., Laurila, T., Haapanala, S., Pihlatie, M., and Tuittila, E.-S.: Spatial variation in plant community functions regulates carbon gas dynamics in a boreal fen ecosystem, Tellus B, 59, 838–852, https://doi.org/10.1111/j.1600-0889.2007.00302.x, 2007.
Riutta, T., Korrensalo, A., Laine, A. M., Laine, J., and Tuittila, E.-S.: Interacting effects of vegetation components and water level on methane dynamics in a boreal fen, Biogeosciences, 17, 727–740, https://doi.org/10.5194/bg-17-727-2020, 2020.
Saarinen, T.: Biomass and production of two vascular plants in a boreal mesotrophic fen, Can. J. Bot., 74, 934–938, https://doi.org/10.1139/b96-116, 1996.
Saarinen, T.: Demography of Carex rostrata in a boreal mesotrophic fen: Shoot dynamics and biomass development, Ann. Bot. Fennici., 36, 203–209, 1998.
Saunois, M., Martinez, A., Poulter, B., Zhang, Z., Raymond, P. A., Regnier, P., Canadell, J. G., Jackson, R. B., Patra, P. K., Bousquet, P., Ciais, P., Dlugokencky, E. J., Lan, X., Allen, G. H., Bastviken, D., Beerling, D. J., Belikov, D. A., Blake, D. R., Castaldi, S., Crippa, M., Deemer, B. R., Dennison, F., Etiope, G., Gedney, N., Höglund-Isaksson, L., Holgerson, M. A., Hopcroft, P. O., Hugelius, G., Ito, A., Jain, A. K., Janardanan, R., Johnson, M. S., Kleinen, T., Krummel, P. B., Lauerwald, R., Li, T., Liu, X., McDonald, K. C., Melton, J. R., Mühle, J., Müller, J., Murguia-Flores, F., Niwa, Y., Noce, S., Pan, S., Parker, R. J., Peng, C., Ramonet, M., Riley, W. J., Rocher-Ros, G., Rosentreter, J. A., Sasakawa, M., Segers, A., Smith, S. J., Stanley, E. H., Thanwerdas, J., Tian, H., Tsuruta, A., Tubiello, F. N., Weber, T. S., van der Werf, G. R., Worthy, D. E. J., Xi, Y., Yoshida, Y., Zhang, W., Zheng, B., Zhu, Q., Zhu, Q., and Zhuang, Q.: Global Methane Budget 2000–2020, Earth Syst. Sci. Data, 17, 1873–1958, https://doi.org/10.5194/essd-17-1873-2025, 2025.
Schuur, E. A. G., Abbott, B. W., Commane, R., Ernakovich, J., Euskirchen, E., Hugelius, G., Grosse, G., Jones, M., Koven, C., Leshyk, V., Lawrence, D., Loranty, M. M., Mauritz, M., Olefeldt, D., Natali, S., Rodenhizer, H., Salmon, V., Schädel, C., Strauss, J., Treat, C., and Turetsky, M.: Permafrost and Climate Change: Carbon Cycle Feedbacks From the Warming Arctic, Annu. Rev. Environ. Resour., 47, 343–371, https://doi.org/10.1146/annurev-environ-012220-011847, 2022.
Song, S., Wang, X., Wang, Y., Li, T., and Huang, J.: NO is an important driver of nitrite-dependent anaerobic methane oxidation bacteria and CH4 fluxes in the reservoir riparian zone, Environ. Sci. Pollut. Res., 29, 16138–16151, https://doi.org/10.1007/s11356-021-16914-8, 2022.
Ström, L., Mastepanov, M., and Christensen, T. R.: Species-specific Effects of Vascular Plants on Carbon Turnover and Methane Emissions from Wetlands, Biogeochemistry, 75, 65–82, https://doi.org/10.1007/s10533-004-6124-1, 2005.
Ström, L., Tagesson, T., Mastepanov, M., and Christensen, T. R.: Presence of Eriophorum scheuchzeri enhances substrate availability and methane emission in an Arctic wetland, Soil Biol. Biochem., 45, 61–70, https://doi.org/10.1016/j.soilbio.2011.09.005, 2012.
Ström, L., Falk, J. M., Skov, K., Jackowicz-Korczynski, M., Mastepanov, M., Christensen, T. R., Lund, M., and Schmidt, N. M.: Controls of spatial and temporal variability in CH4 flux in a high arctic fen over three years, Biogeochemistry, 125, 21–35, https://doi.org/10.1007/s10533-015-0109-0, 2015.
Swindles, G. T., Morris, P. J., Mullan, D. J., Payne, R. J., Roland, T. P., Amesbury, M. J., Lamentowicz, M., Turner, T. E., Gallego-Sala, A., Sim, T., Barr, I. D., Blaauw, M., Blundell, A., Chambers, F. M., Charman, D. J., Feurdean, A., Galloway, J. M., Gałka, M., Green, S. M., Kajukało, K., Karofeld, E., Korhola, A., Lamentowicz, Ł., Langdon, P., Marcisz, K., Mauquoy, D., Mazei, Y. A., McKeown, M. M., Mitchell, E. A. D., Novenko, E., Plunkett, G., Roe, H. M., Schoning, K., Sillasoo, Ü., Tsyganov, A. N., Van Der Linden, M., Väliranta, M., and Warner, B.: Widespread drying of European peatlands in recent centuries, Nat. Geosci., 12, 922–928, https://doi.org/10.1038/s41561-019-0462-z, 2019.
Turetsky, M. R., Kotowska, A., Bubier, J., Dise, N. B., Crill, P., Hornibrook, E. R. C., Minkkinen, K., Moore, T. R., Myers-Smith, I. H., Nykänen, H., Olefeldt, D., Rinne, J., Saarnio, S., Shurpali, N., Tuittila, E.-S., Waddington, J. M., White, J. R., Wickland, K. P., and Wilmking, M.: A synthesis of methane emissions from 71 northern, temperate, and subtropical wetlands, Global Change Biol., 20, 2183–2197, https://doi.org/10.1111/gcb.12580, 2014.
Turner, J. C., Moorberg, C. J., Wong, A., Shea, K., Waldrop, M. P., Turetsky, M. R., and Neumann, R. B.: Getting to the Root of Plant-Mediated Methane Emissions and Oxidation in a Thermokarst Bog, J. Geophys. Res.-Biogeo., 125, e2020JG005825, https://doi.org/10.1029/2020JG005825, 2020.
Vargas, R. and Le, V. H.: The paradox of assessing greenhouse gases from soils for nature-based solutions, Biogeosciences, 20, 15–26, https://doi.org/10.5194/bg-20-15-2023, 2023.
Waldo, N. B., Hunt, B. K., Fadely, E. C., Moran, J. J., and Neumann, R. B.: Plant root exudates increase methane emissions through direct and indirect pathways, Biogeochemistry, 145, 213–234, https://doi.org/10.1007/s10533-019-00600-6, 2019.
Wickham, H.: forcats: Tools for Working with Categorical Variables (Factors), R package version 1.0.0 [data set], https://CRAN.R-project.org/package=forcats/ (last access: 17 January 2025), 2023.
Wickham, H.: ggplot2: Elegant Graphics for Data Analysis, R package version 3.5.1 [data set], https://cran.r-project.org/web/packages/ggplot2/ (last access: 17 January 2025), 2024.
Wickham, H. and Bryan, J.: readxl: Read Excel Files, R package version 1.4.3 [data set], https://CRAN.R-project.org/package=readxl/ (last access: 17 January 2025), 2023.
Wickham, H., François, R., Henry, L., Müller, K. and Vaughan, D.: dplyr: A Grammar of Data Manipulation, R package version 1.1.4 [data set], https://CRAN.R-project.org/package=dplyr/ (last access: 17 January 2025), 2023a.
Wickham, H., Pedersen, T., and Seidel, D.: _scales: Scale Functions for Visualization, R package version 1.3.0 [data set], https://CRAN.R-project.org/package=scales/ (last access: 17 January 2025), 2023b.
Wickham, H., Vaughan, D., and Girlich, M.: tidyr: Tidy Messy Data, R package version 1.3.1 [data set], https://CRAN.R-project.org/package=tidyr/ (last access: 17 January 2025), 2024.
Wolff, F., Kolari, T. H. M., Villoslada, M., Tahvanainen, T., Korpelainen, P., Zamboni, P. A. P., and Kumpula, T.: RGB vs. Multispectral imagery: Mapping aapa mire plant communities with UAVs, Ecol. Indic., 148, 110140, https://doi.org/10.1016/j.ecolind.2023.110140, 2023.
Yavitt, J. B., Yashiro, E., Cadillo-Quiroz, H., and Zinder, S. H.: Methanogen diversity and community composition in peatlands of the central to northern Appalachian Mountain region, North America, Biogeochemistry, 109, 117–131, https://doi.org/10.1007/s10533-011-9644-5, 2012.
Yuan, K., Li, F., McNicol, G., Chen, M., Hoyt, A., Knox, S., Riley, W. J., Jackson, R., and Zhu, Q.: Boreal–Arctic wetland methane emissions modulated by warming and vegetation activity, Nat. Clim. Change, 14, 282–288, https://doi.org/10.1038/s41558-024-01933-3, 2024.
Zhang, H., Tuittila, E.-S., Korrensalo, A., Räsänen, A., Virtanen, T., Aurela, M., Penttilä, T., Laurila, T., Gerin, S., Lindholm, V., and Lohila, A.: Water flow controls the spatial variability of methane emissions in a northern valley fen ecosystem, Biogeosciences, 17, 6247–6270, https://doi.org/10.5194/bg-17-6247-2020, 2020.
Zhang, H., Tuittila, E.-S., Korrensalo, A., Laine, A. M., Uljas, S., Welti, N., Kerttula, J., Maljanen, M., Elliott, D., Vesala, T., and Lohila, A.: Methane production and oxidation potentials along a fen-bog gradient from southern boreal to subarctic peatlands in Finland, Global Change Biol., 27, 4449–4464, https://doi.org/10.1111/gcb.15740, 2021.