the Creative Commons Attribution 4.0 License.
the Creative Commons Attribution 4.0 License.
 | 06 Nov 2025
Tracing the contribution of dust origins on deposition and phytoplankton carbon uptake in global oceans
Yaxin Liu
Yunting Xiao
Lehui Cui
Qinghao Guo
Yiyang Sun
Pingqing Fu
Cong-Qiang Liu
Dust provides iron, essential for marine phytoplankton growth, altering their carbon uptake capacity and affecting the global carbon cycle. However, due to the limited availability of observational parameters applied in evaluation models, there remains uncertainty in the contribution of marine dust deposition to carbon uptake. Here, we quantified the separate contributions of eleven major dust sources to dust deposition and marine ecological response to dust-borne iron in eight ocean regions based on a series of simulations constrained by multiple global observation datasets of iron solubility and total iron concentration in the oceans as well as iron content in the dust. Our simulations indicate that dust deposition could supply 11.1 Tg yr−1 of total iron and 0.4 Tg yr−1 of dissolved iron to the oceans. However, the study is limited by sparse observations and simplified assumptions, and further observations in undersampled regions would help to better constrain phytoplankton responses to dust-derived iron.
- Article
(7363 KB) - Full-text XML
-
Supplement
(3181 KB) - BibTeX
- EndNote


Dust aerosol, the main component of atmospheric aerosols from arid and semi-arid areas, is the dominant exogenous input of Iron (Fe) to the surface of the ocean (Raiswell and Canfield, 2012; Tagliabue et al., 2017). Dust carries various micronutrients that can be transported thousands of kilometers and deposited in remote ocean regions, ultimately resulting in the redistribution of nutrient elements (Jickells et al., 2005; Hamilton et al., 2022). Fe is an essential micronutrient for phytoplankton growth and can limit primary productivity in regions termed high nutrient, low chlorophyll (HNLC) regions, which comprise ∼ 30 % of the global ocean (Moore et al., 2013). Several sources of Fe in the ocean have been identified, primarily including atmospheric dust, coastal inputs, and hydrothermal fluids (Tagliabue et al., 2017, 2016; Boyd and Ellwood, 2010). When Fe enters the upper ocean, dFe is absorbed by marine organisms, such as phytoplankton and bacteria. After the organisms die, Fe is returned to the sediment, or, through physical processes, may be resuspended and re-enter the water column, completing the cycle (Boyd and Ellwood, 2010). However, large amounts of fluvial and glacial particulate Fe are trapped in coastal areas (Poulton and Raiswell, 2002), and hydrothermal inputs are promptly precipitated at depth in the ocean (Lough et al., 2023). Therefore, dust is a major external source and dust deposition carrying Fe can promote photosynthesis and plankton growth, thereby impacting the carbon cycle and atmospheric carbon dioxide (CO2) (Mahowald, 2011; Johnson and Meskhidze, 2013; Kanakidou et al., 2018; Pavia et al., 2020; Westberry et al., 2023). Nevertheless, quantitative assessments of the linkage between dust sources and their effects on marine biogeochemical cycles in various oceanic regions are still lacking (Shoenfelt et al., 2019; Hamilton et al., 2023).
One key reason current studies struggle to estimate marine phytoplankton carbon uptake to dust-borne Fe is the uncertainties in assessing the dissolved Fe (dFe) (Hamilton et al., 2023). Changes in the supply of dFe within its range of uncertainty can lead to substantial differences in phytoplankton carbon uptake (Dietze et al., 2017; Watson et al., 2000; Spolaor et al., 2013), since only dFe can be utilized by phytoplankton instead of all Fe in deposited dust (Mahowald et al., 2005; Shaked et al., 2005). Thus, accurately evaluating the dFe supply from dust deposition over the ocean is vital to assessing the marine phytoplankton carbon uptake caused by dust. The Fe content in dust and solubility of dust-borne Fe vary among different dust source regions (Struve et al., 2022). Therefore, determining the contributions of dust source regions to various oceans separately is essential for accurately assessing the dust-borne dFe. Previous studies have predominantly focused on investigating the spatiotemporal variations of global or regional dust emissions (Choobari et al., 2014; Wang and Zhang, 2014; Ginoux et al., 2001; Mahowald and Luo, 2003; Tegen et al., 2004), as well as the dust deposition fluxes to oceans (Zheng et al., 2016; Kok et al., 2021). Some studies evaluated global Fe cycle and Fe deposition using models (Myriokefalitakis et al., 2015; Zhang et al., 2015). However, the specific dust and Fe contributions of the various dust sources to the distinct oceans remain insufficiently understood, hindering a systematic understanding of the Fe supply relationships between sources and oceans, as well as their seasonal variations and underlying mechanisms. Moreover, dust usually undergoes complex atmospheric chemical processes during long distance transport, resulting in enhanced solubility of Fe within the dust particles (Longo et al., 2016; Li et al., 2017; Félix-Bermúdez et al., 2020; Kurisu et al., 2024). Consequently, the dFe content in dust transported to remote oceanic regions is typically higher than that in dust from the sources (Shi et al., 2012). The content of total Fe in aerosols can vary by a factor of 2 (Mahowald et al., 2005; Mahowald, 2011). Due to the complexity and uncertainty of atmospheric chemical processes including acidic reactions and photoreduction, accurately simulating the dFe content in dust deposited in remote oceanic regions is challenging. In previous studies, the Fe content of deposited dust is usually assumed to be 3.5 %, while its solubility is assumed to be 2 % (Jickells et al., 2005; Hamilton et al., 2022; Mahowald et al., 2005, 2017), overlooking their variability in different sources and chemical processes during transport. This assumption may lead to uncertainties in evaluating the Fe deposition from dust sources and the input of Fe to the oceans.
The struggle to accurately quantify the relationship between Fe availability and marine phytoplankton carbon uptake is a key problem limiting the evaluation of the marine phytoplankton carbon uptake to dust-borne input of Fe. Previous studies have verified that dust-borne inputs of Fe can enhance the carbon uptake, thereby impacting the carbon cycle (Bishop et al., 2002; Patra et al., 2007; Ziegler et al., 2013; Kobayashi et al., 2021). The large decline in atmospheric CO2 during past glacial periods coincided with an increase in observed Southern Ocean marine productivity and substantial dust deposition as recorded in marine sediments and ice cores (Ziegler et al., 2013; Lambert et al., 2008; Wolff et al., 2010). Model simulations also indicate that the Fe fertilization from glaciogenic dust played an important role in enhancing carbon storage and declining atmospheric CO2 concentration (Kobayashi et al., 2021). However, quantifying the marine phytoplankton carbon uptake caused by dust-borne inputs of Fe remains highly uncertain due to the complex processes during dust transport and the difficulty in quantifying phytoplankton growth induced by Fe supply from dust deposition. Several studies have tried to quantify the responses of marine biogeochemistry to dust deposition on large scales based on model simulations and observations (Mahowald et al., 2009, 2010; Ito et al., 2020), but the results vary largely due to the different global parameterization models. Given the complex and dynamic environmental conditions experienced by phytoplankton growth in the ocean, the ratios of carbon to nutrients in exported organic matter have long been used to simplify biogeochemical cycles (Twining et al., 2015; Wiseman et al., 2023). Ratios, such as Fe to carbon (Fe : C) in phytoplankton cells, help determine the efficiency of the biological export of carbon (Wiseman et al., 2023). In HNLC regions, Fe is the main limiting factor inducing phytoplankton blooms, and consequently influencing phytoplankton carbon uptake (Matrin, 1990; Boyd et al., 2007). In low nutrient, low chlorophyll (LNLC) regions, Fe can also alleviate nutrient-limiting pressure, and dust addition can stimulate nitrogen fixation, thereby promote phytoplankton growth and impact the carbon cycle (Zhang et al., 2019; Okin et al., 2011; Mills et al., 2004). Therefore, Fe is a significant limiting nutrient over global oceans, and Fe : C ratios in phytoplankton cells could be considered as a bridge to estimate the global carbon uptake by phytoplankton to dust deposition. In this study, marine phytoplankton carbon uptake specifically refers to the amount of carbon uptake by phytoplankton as a result of dust-derived dFe input, estimated using the Fe : C ratio in phytoplankton cells under the assumption of Fe-limited marine conditions. Wiseman et al. (2023) proposed a clearly dynamic relationship between phytoplankton Fe : C ratios and ambient dFe concentrations, making it possible to quantify the variations of marine phytoplankton carbon uptake caused by dust-borne inputs of dFe which could provides integrated insights into past climatic events and aids future marine-based CO2 removal initiatives for climate mitigation.
In this study, we conducted a series of sensitivity experiments using the Community Earth System Model (CESM) to apportion the contributions of various dust sources to dust deposition and Fe supply in different marine areas globally. By incorporating the Fe content of dust from diverse source as well as observations of oceanic Fe solubility and content from numerous sites, we calculated the carbon uptake by phytoplankton resulting from dust deposition in various marine areas. This research employs an observation-driven approach, providing a new perspective for assessing the impact of dust on the global carbon cycle and attempting to establish a more accurate and detailed link between different dust sources and carbon uptake by phytoplankton in various marine areas.
2.1 Community Earth System Model
CESM version 1.2.2 (Hurrell et al., 2013) is employed in this study, which is a community tool to figure out the behavior of Earth's climate. In the model, atmospheric dust is emitted from the land by wind in the Community Land Model (CLM) (Mahowald et al., 2006) and then transported and processed in the atmosphere by the Community Atmosphere Model (CAM) (Neale et al., 2012). The wind friction speed, vegetation cover, and soil moisture are key factors which could determine the soil erodibility and dust emission. The dust emission scheme employed into CLM based on the Dust Entrainment and Deposition (DEAD) model of Zender et al. (2003). More details could be found in Technical Description of CLM v4.0 (Oleson et al., 2010) and CAM5 Scientific Guide (Neale et al., 2012).
In dust model, the total vertical dust mass flux (Fj, kg m−2 s−1), from the ground into transport bin j is calculated by the following function:
Where T is a tuning factor that compensates for the DEAD model's sensitivity to horizontal and temporal resolution and equals , S is the source erodibility factor set to 1 and serves as a place holder, fm is a dimensionless fraction representing the exposed bare soil, α is the sandblasting mass efficiency (m−1), QS is the total horizontally saltating mass flux (kg m−1 s−1), and Mi,j is the dimensionless mass fraction of each source mode i carried in different bin j.
2.2 Regions classification and sensitivity experiments
To identify the contributions of dust source regions to the oceans, eleven main dust source regions and eight ocean regions were classified. Most dust is emitted from the so-called “dust belt”, which includes northern Africa, the Middle East, central Asia, and the northwest of China and the Mongolian deserts. Small amounts of dust are emitted from Australia, southern Africa, and North and South America. In addition to considering the primary dust sources, the varying iron content of the dust is also a factor in defining the dust source regions. Ultimately, we divided dust sources over the world into eleven source regions that together account for the overwhelming total of desert dust emissions identified in models. Eleven dust source regions are Northwest Africa (NWAf), Northeast Africa (NEAf), Middle Africa (MAf), South Africa (SAf), North America (NAm), South America (SAm), West Asia (WAs), Middle-North Asia (MNAs), East Asia (EAs), South Asia (SAs), and Australia (AU), respectively. The apportionment of the source regions partially follows the definition provided by Kok et al. (2021), with the main difference being that we divided Asia into more regions due to variations in iron content.
30° S and 30° N are the boundaries for dividing the difference ocean regions. The north of 30° N is North Pacific Ocean (NP), North Atlantic Ocean (NA), Mediterranean Sea (MS), respectively. The south of 30° S is Southern Ocean (SO). In addition, between the 30° N and 30° S is Equatorial Pacific Ocean (EP), Equatorial Atlantic Ocean (EA), Equatorial Indian Ocean (EI), respectively. In total, eleven dust source regions corresponding with eight deposit ocean regions are classified in this study as shown in Fig. 1 and Table 1.
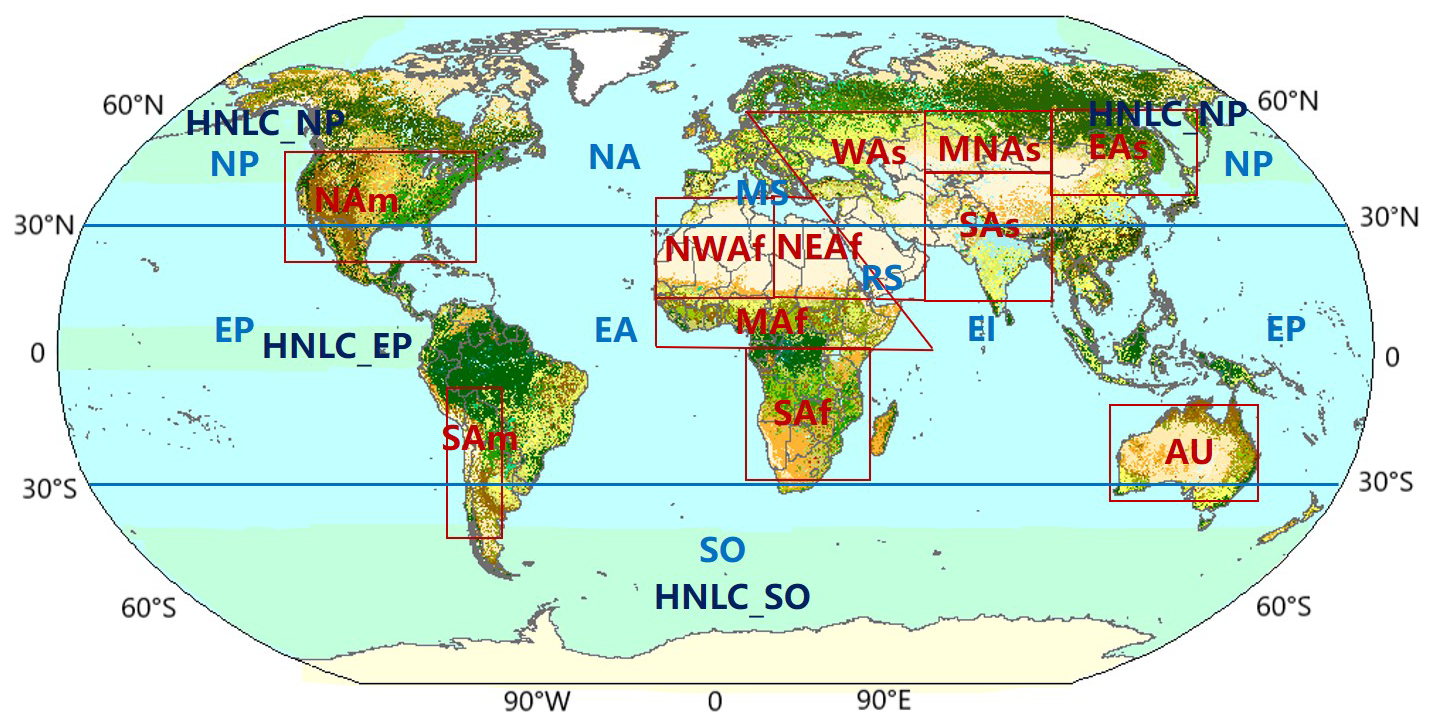
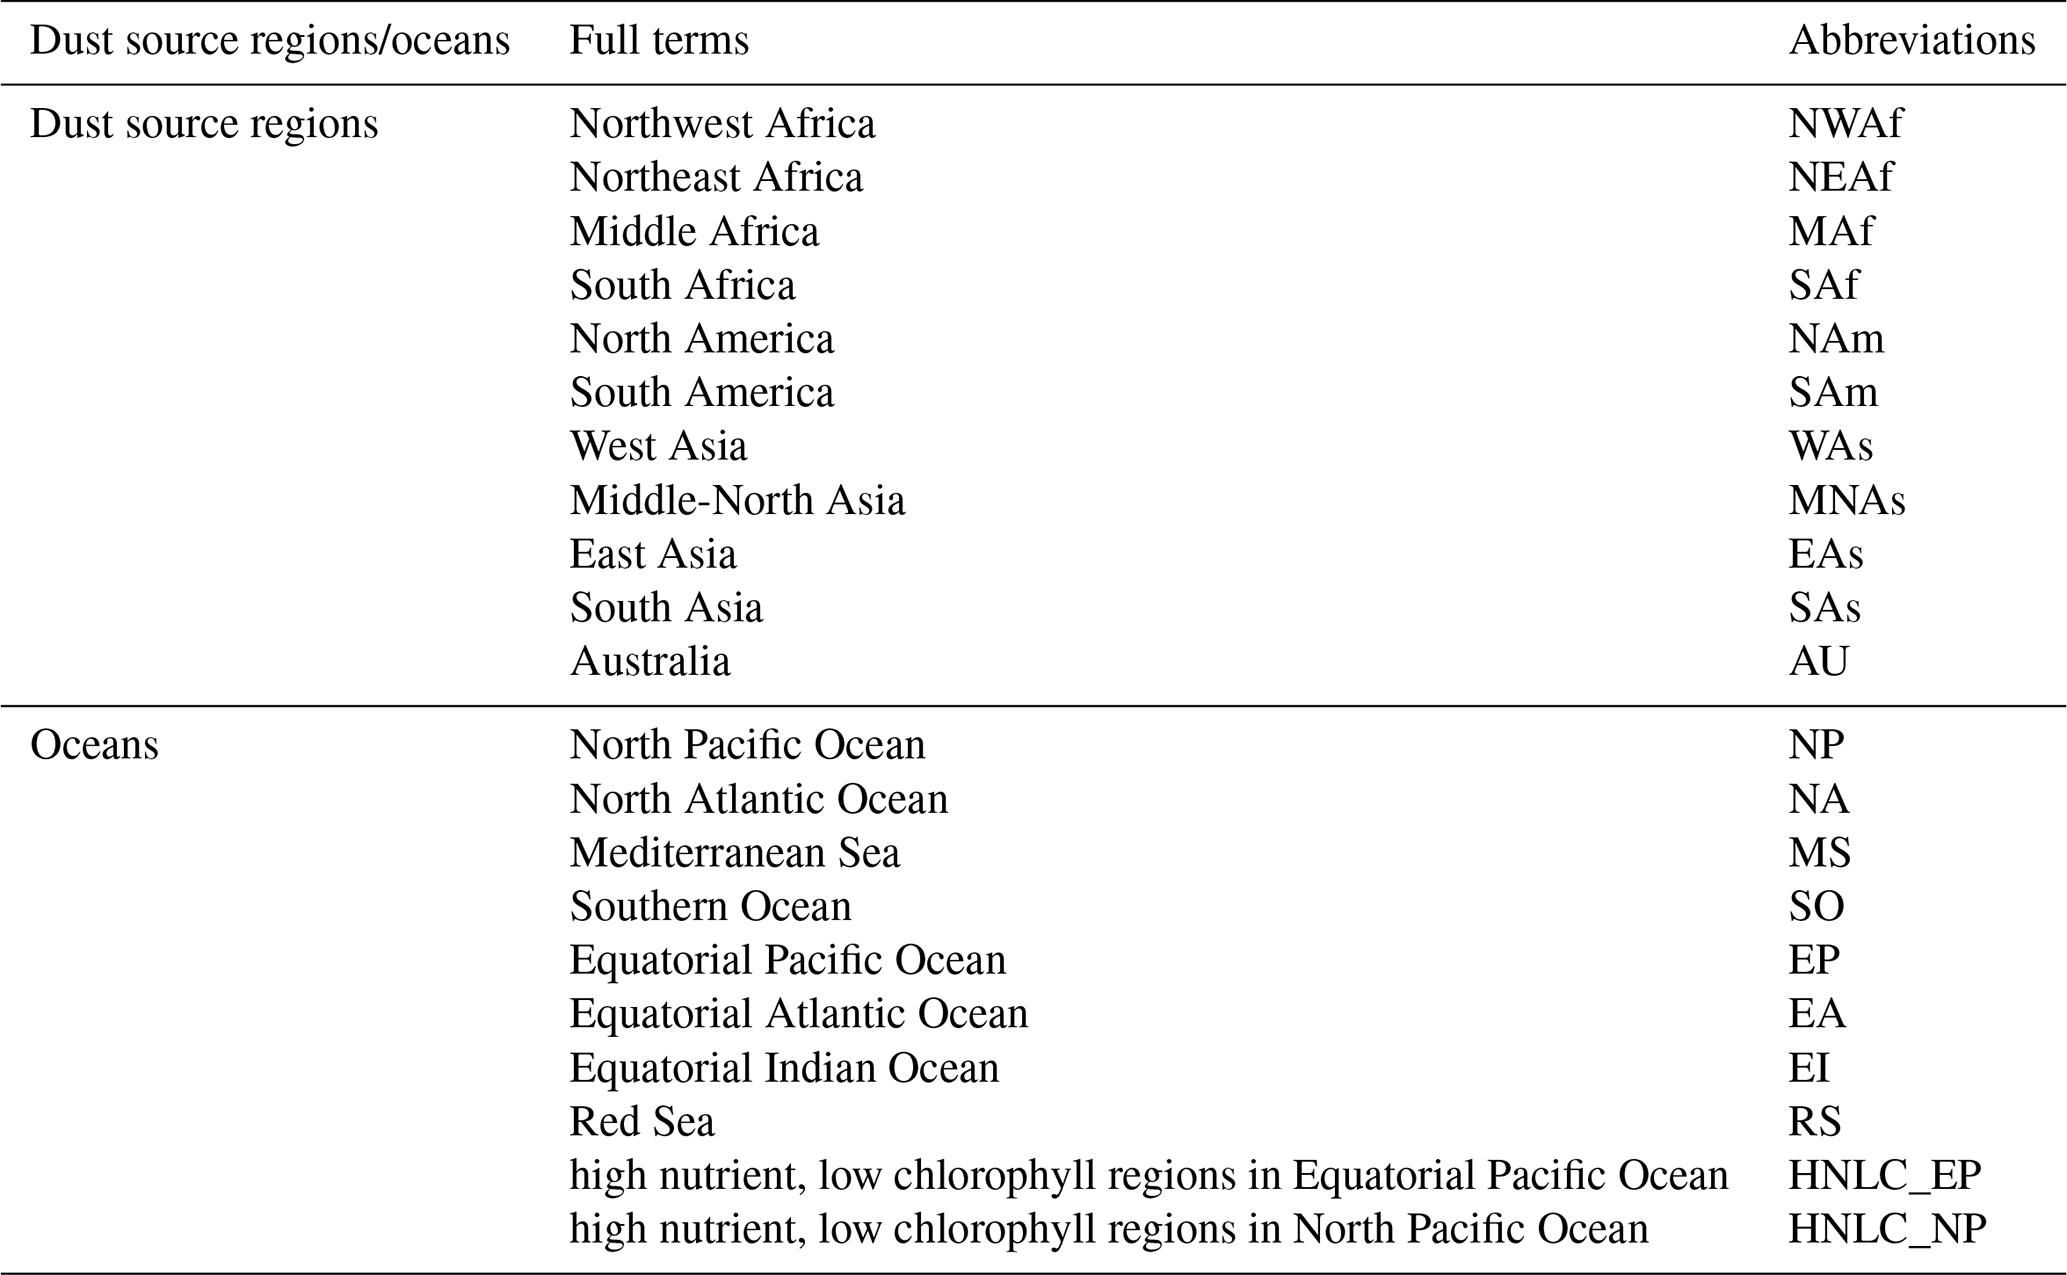
Figure 1The classification of global main dust source regions and oceans. (Dust source regions: NWAf – Northwest Africa; NEAf – Northeast Africa; MAf – Middle Africa; SAf – South Africa; NAm – North America; SAm – South America; WAs – West Asia; MNAs – Middle-North Asia; EAs – East Asia; SAs – South Asia; AU – Australia.) (Oceans: NP – North Pacific Ocean; NA – North Atlantic Ocean; MS – Mediterranean Sea; RS – Red Sea; SO – Southern Ocean; EP – Equatorial Pacific Ocean; EA – Equatorial Atlantic Ocean; EI – Equatorial Indian Ocean; HNLC_EP – high nutrient, low chlorophyll regions in Equatorial Pacific Ocean; HNLC_NP – high nutrient, low chlorophyll regions in North Pacific Ocean.)
Table 1List of abbreviations and full terms for dust source regions and oceans.
Three main HNLC regions as selected and defined by Aumont and Bopp (2006) include the Southern Ocean (SO) south of 40° S, the equatorial Pacific (EP) between 5° S–5° N and 180–80° W, and the subarctic North Pacific (NP) north of 40° N and spanning 140° E–120° W (Fig. 1 and Table 1).
We conducted five-year simulations with a spatial resolution of 1.9° × 2.5°, a 30 min time step, and monthly output frequency to investigate the characteristics of global dust emission and deposition. Each simulation was preceded by a one-year spin-up and used a 30 min model time step. A baseline simulation including global dust emissions was performed. In each experimental case, emissions from a specific dust source region were turned off, and the difference between this scenario and the baseline case was considered as the dust emission and deposition from that particular dust source region. The model configuration included 30 vertical layers. We employed prescribed aerosol emissions that repeat annually, based on emission inventories representative of the year 2000. The configuration imposes a climatological forcing by applying an identical annual emission cycle throughout the simulation period. Prescribed climatological sea ice and sea surface temperature from Hadley Centre were used to drive the climate (https://climatedataportal.metoffice.gov.uk/, last access: 2 November 2025). Environmental boundary conditions were derived from the default CESM surface dataset for the year 2000, which includes land cover, soil properties, vegetation distribution, and dust source regions. Atmospheric initial conditions were specified using the standard initialization file provided for CAM.
2.3 Fe Solubility and dissolved Fe concentration data
To accurately estimating the Fe supply to the ocean from dust deposition, we used varying Fe content data for different dust source regions based on ten-year-averaged percentages of elements over desert regions provided in Zhang et al. (2015). The Fe contents in NWAf, MAf, NEAf, SAf, NAm, SAm, WAs, MNAs, EAs, SAs and AU are 2.00 %, 2.65 %, 1.91 %, 2.47 %, 2.38 %, 2.28 %, 2.20 %, 1.76 %, 2.08 %, 2.17 % and 2.70 %, respectively.
Fe solubility is also a key factor to estimate the carbon uptake of phytoplankton to dust deposition. Since the complex particle-aging processes during dust transport would influence the solubility of dust-born Fe (Longo et al., 2016), the observed Fe solubility in different oceans were used to constrain the Fe solubility in specific marine areas. The observation data, introduced in Ito et al. (2019), included 774 sites of Fe solubility across various oceans. To mitigate the risk of overestimating the contribution of dust-borne Fe, Fe solubility data were filtered to retain only values below 6.0 %, based on the studies by Shi et al. (2011a, b, 2009), Journet et al. (2008), Trapp et al. (2010) and Scanza et al. (2018). Shi et al. (2011a) found that Fe solubility ranged from approximately 0.1 % to 0.8 % in various size fractions of Saharan soil samples. After cloud processing, Fe solubility of Saharan soil sample could increase to 3.5 % (Shi et al., 2009). Shi et al. (2011b) measured potential Fe solubility of Saharan soil dust samples approaching 6 %. However, Fe solubility of dust could increase during transport, which is attributed to the complex atmospheric chemical processes, including acidic reactions and photoreduction (Longo et al., 2016; Li et al., 2017). Journet et al. (2008) and Trapp et al. (2010) found maximum solubility values of 5.25 % and 5.8 %, respectively, by measuring African dust collected over the Atlantic Ocean, Mediterranean Sea, and Barbados, which had experienced atmospheric transport. Consequently, we filtered the Fe solubility data to retain only values below 6.0 %. Since the Fe solubility data used in this study are derived from multiple sources, not solely from dust, there is a possibility that the filtered-out Fe solubility data may be overestimated if regarded as representative of dust, as these data could originate from other sources, such as combustion. Scanza et al. (2018) showed that the global Fe solubility from both dust and combustion sources, as simulated, ranged from 0 % to 20 %. Ultimately, 514 data points were retained and interpolated to a resolution of 1.9° × 2.5° for this study. The mean Fe solubility interpolated from observations is 2.8 %, which is comparable to the assumed value of dust Fe solubility (2 %) by previous studies (Jickells et al., 2005), but incorporates spatial distribution (Fig. S1 in the Supplement).
The dFe concentration data is a necessary factor for calculating the Fe : C ratio in phytoplankton cells. The dFe concentration data used in this study is from the GEOTRACES Intermediate Data Product 2021 Version 2 (https://www.bodc.ac.uk/geotraces/data/idp2021/, last access: 2 November 2025). GEOTRACES is an international study of the marine biogeochemical cycles of trace elements and isotopes, and provides a broad coverage of observational data on aerosol nutrients (Schlitzer et al., 2018). A total of 15 970 data of dFe concentration across 3304 sites over ocean were obtained. Data overlapping on the same sites were averaged, and the resulting observed dFe concentration over ocean were interpolated into a resolution of 1.9° × 2.5° for this study (Fig. S2).
2.4 Inverse distance weighting interpolation
We employed the inverse distance weighting (IDW) method, a widely used spatial interpolation technique, to interpolate observation data on Fe solubility and dFe concentration to a resolution of 1.9° × 2.5°. The globe was divided into a grid matrix of 144 × 96 cells based on simulation results from CESM. Observations were matched to the grid matrix using spatial coordinates and subsequently interpolated using the IDW method. Spatial distances between each interpolation grid and observation locations were calculated iteratively. Weight functions were then applied to these distances to compute a weighted average, yielding the interpolated results.
The function to calculate the weight is as follows:
Here, wi represents the weight of the ith observation, di is the distance between the observation location and the interpolation point, and P is a tuning factor set to 3 for this interpolation.
The weights are applied to calculate a weighted average, yielding the interpolated results. The formula for calculating the weighted average is expressed as follows:
Here, z(x,y) is the interpolated result, N is the number of the observations, (x,y) denotes the coordinates of the ith observation, wi is its weight, and zi is the observed data.
To prevent data from a single site from affecting oceanic regions on both sides of a landmass, we delineated land-sea boundaries during interpolation. However, the uneven global distribution and limited number of observations and complex land-sea boundaries could lead to interpolation uncertainty. Refining interpolation methods may reduce the uncertainty and improve estimates the impact of Fe on phytoplankton carbon uptake.
2.5 Calculation of marine phytoplankton carbon uptake
The contribution of each dust source region to the dissolved Fe deposition in various marine areas can be calculated based on dust deposition rates and Fe solubility. Then, Fe : C ratios in phytoplankton cells are employed to calculate marine phytoplankton carbon uptake caused by dust deposition with the function as follows:
where C is the amount of marine phytoplankton carbon uptake driven by dust deposition, D (Tg) is the amount of dust from source regions and deposit to oceans, Fecon (%) is the Fe content for different dust source region, and Fesol (%) is the solubility of Fe over various oceans.
Fe : C ratio in phytoplankton cells (gQfe) is defined to be a linear function of the dFe concentration in seawater (Sunda and Huntsman, 1995), which is a vital link for estimating the marine phytoplankton carbon uptake to variations of dust-borne inputs of Fe. The following is the function to calculate Fe : C ratio in phytoplankton cells used in this study (Wiseman et al., 2023):
where gQfe is the Fe : C ratio in phytoplankton cells, gQfe_max is the prescribed maximum Fe : C, gQfe_min is the prescribed minimum Fe : C, dFe is the local concentration of dissolved Fe (nmol L−1), and FeOpt refers to the Fe concentration at which Fe : C ratio in phytoplankton cells reaches its maximum value. In this study, we used a broad Fe : C ratio range in phytoplankton cells (3–90 µmol Fe mol−1 C) and an FeOpt of 1.75 nM for all phytoplankton groups, as proposed by Wiseman et al. (2023), to estimate phytoplankton carbon uptake driven by Fe from dust. Given that Fe is the primary limiting nutrient in HNLC regions, we also calculated phytoplankton carbon uptake attributable to dust deposition in these regions. However, using the Fe : C ratio in phytoplankton cells to estimate the response of phytoplankton carbon uptake to dust deposition may introduce some uncertainty, because this method does not fully account for potential co-limiting factors such as light availability and the interactive effects of multiple micronutrients. The results, especially in non-HNLC regions, is only a hypothetical research results, and the uncertainty needs to be further reduced after being enriched with experimental and observational data.
3.1 Spatial and temporal characteristics of global dust emission and deposition over the oceans
Our simulations indicate a global annual average dust emission of 2071.5 Tg (Fig. 2). The highest dust emission concentrated in North Africa (i.e. NEAf and NWAf), surrounding the Sahara Desert. Dust emission from NEAf and NWAf accounts for 58.0 % of global dust emission, with NEAf exhibiting a stronger intensity of dust emission compared to NWAf. Dust emitted from WAs (317.7 Tg yr−1) is also a key contributor to global dust emission, accounting for 15.3 % of global dust emission. The northeastern region of the Arabian Desert, located on the Arabian Peninsula, is the primary area of dust emission within WAs, while the east of the Caspian Sea is also notable for its strong dust emissions, attributed to the presence of the Kyzylkum Desert and Karakum Desert (Fig. 2). Furthermore, the SAs and EAs regions are also high emission sources, including the Taklamakan Desert, Gobi Desert, and several small deserts such as the Badain Jaran Desert, Tengger Desert, Ulan Buh Desert, and Kubuchi Desert. Dust emissions from SAf, America (NAm, SAm), and MNAs are minor contributors to global dust emissions, each accounting for ∼ 1 % of the total dust emission. The contributions of the main dust sources to global dust emissions in this study are comparable with the results presented by Jickells et al. (2005) and Wang and Zhang (2024).
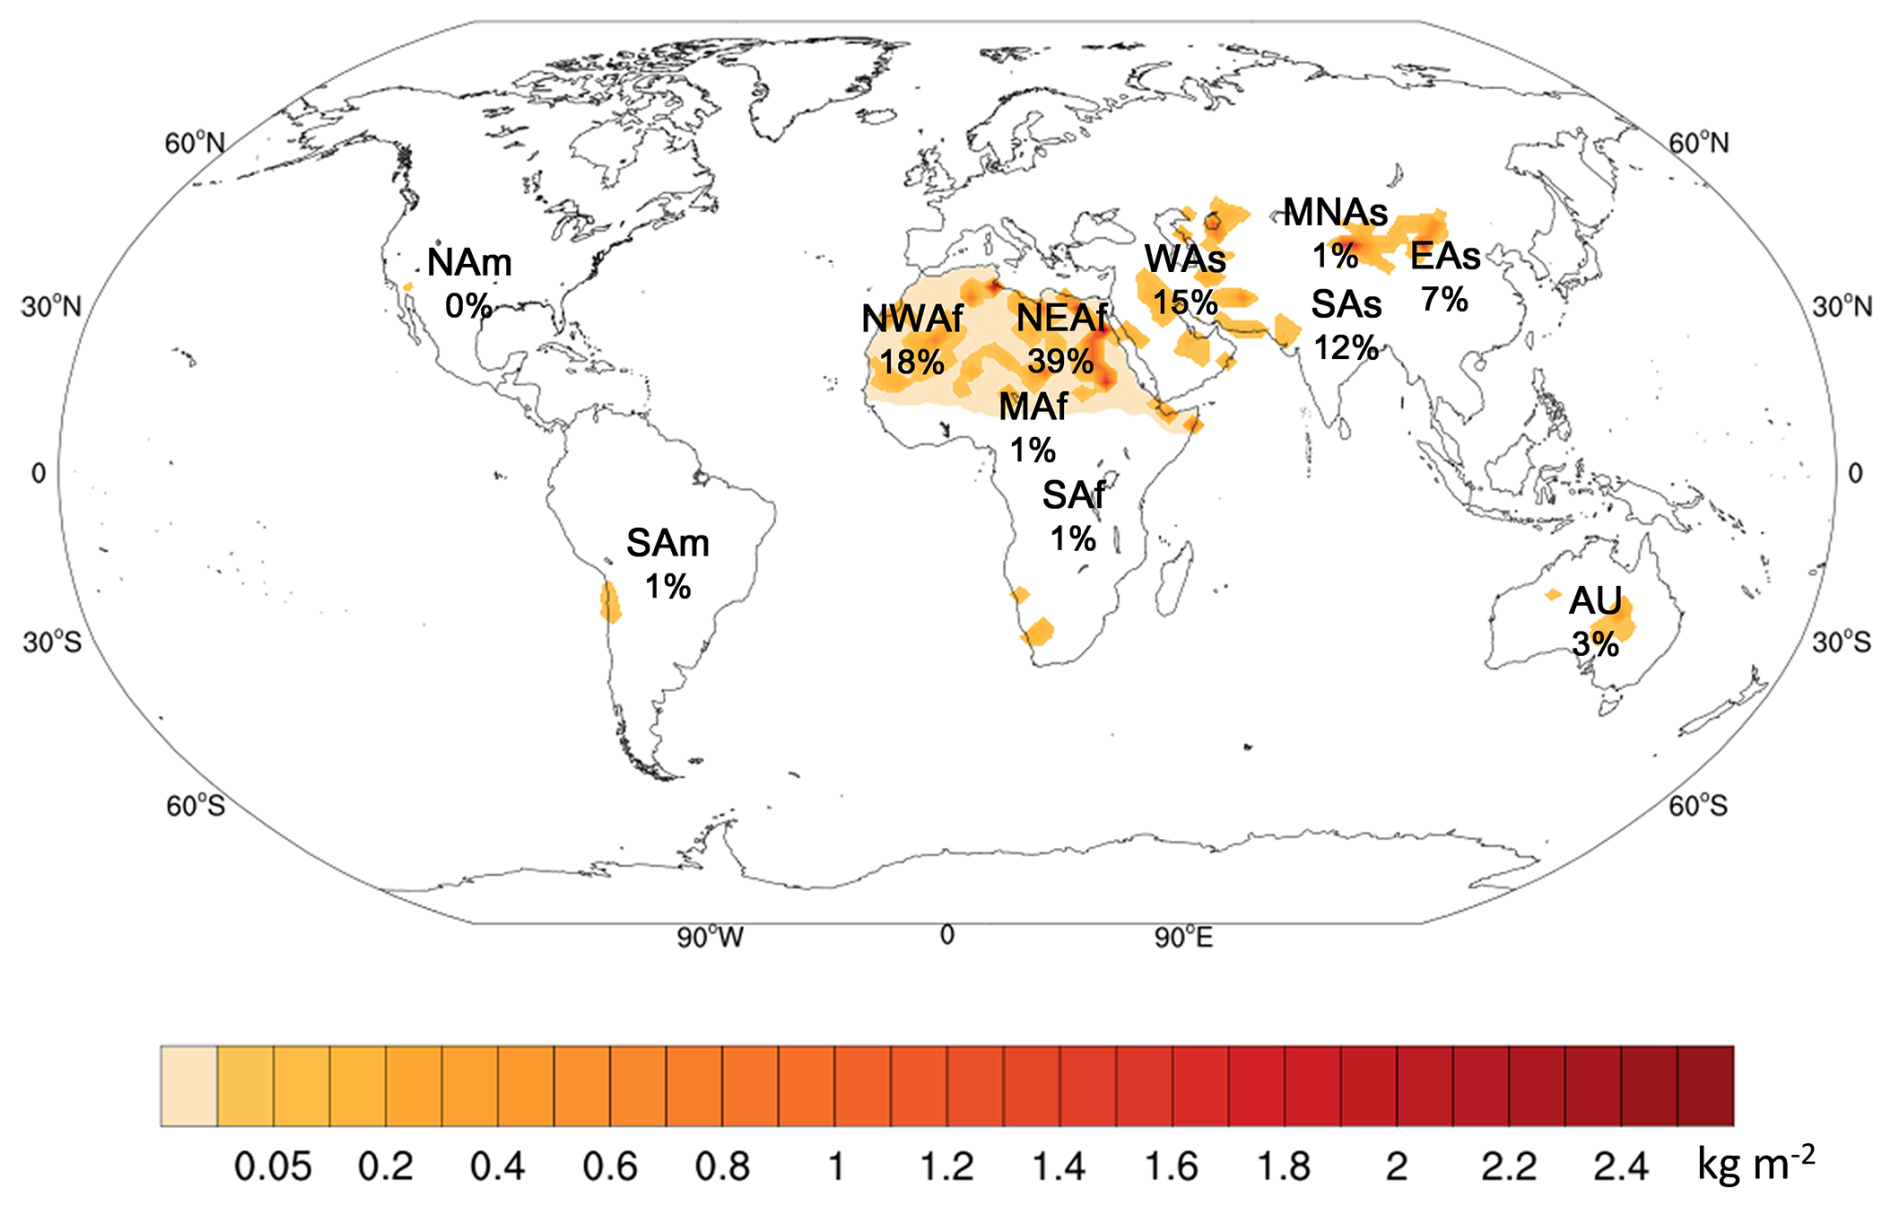
Figure 2The spatial distribution and proportion of the global five-year average dust emission, and percentages show the proportions of annual dust emission of each dust source to global (Dust source regions: NWAf – Northwest Africa; NEAf – Northeast Africa; MAf – Middle Africa; SAf – South Africa; NAm – North America; SAm – South America; WAs – West Asia; MNAs – Middle-North Asia; EAs – East Asia; SAs – South Asia; AU – Australia.)
Global dust emissions exhibit large seasonal variations, with emissions during spring and summer (663.0 and 667.1 Tg season−1) being approximately 70 %–90 % higher than those in autumn and winter (349.3 and 392.2 Tg season−1) (Fig. S3). This is largely attributed to the pronounced seasonal variations in dust emissions from the Asian region (Figs. S3 and 3). Dust emissions in EAs and SAs during spring (67.2 and 94.7 Tg) are 813.6 % and 436.2 % higher than those in winter (7.4 and 17.7 Tg) in EAs and SAs, respectively. During winter, surface temperatures in SAs and EAs can drop to below −30 °C, leading to soil freezing and reduced dust emissions (Fig. S4). The seasonal variations of dust emission in the Southern Hemisphere, such as SAf, SAm and AU, are similar. In these areas, dust emissions peak in autumn with SAf, SAm, and AU emitting 10.0, 3.6 and 26.6 Tg, respectively. In comparison, spring is the season with low dust emission season in these regions (3.21, 1.38 and 11.2 Tg) (Fig. 3).
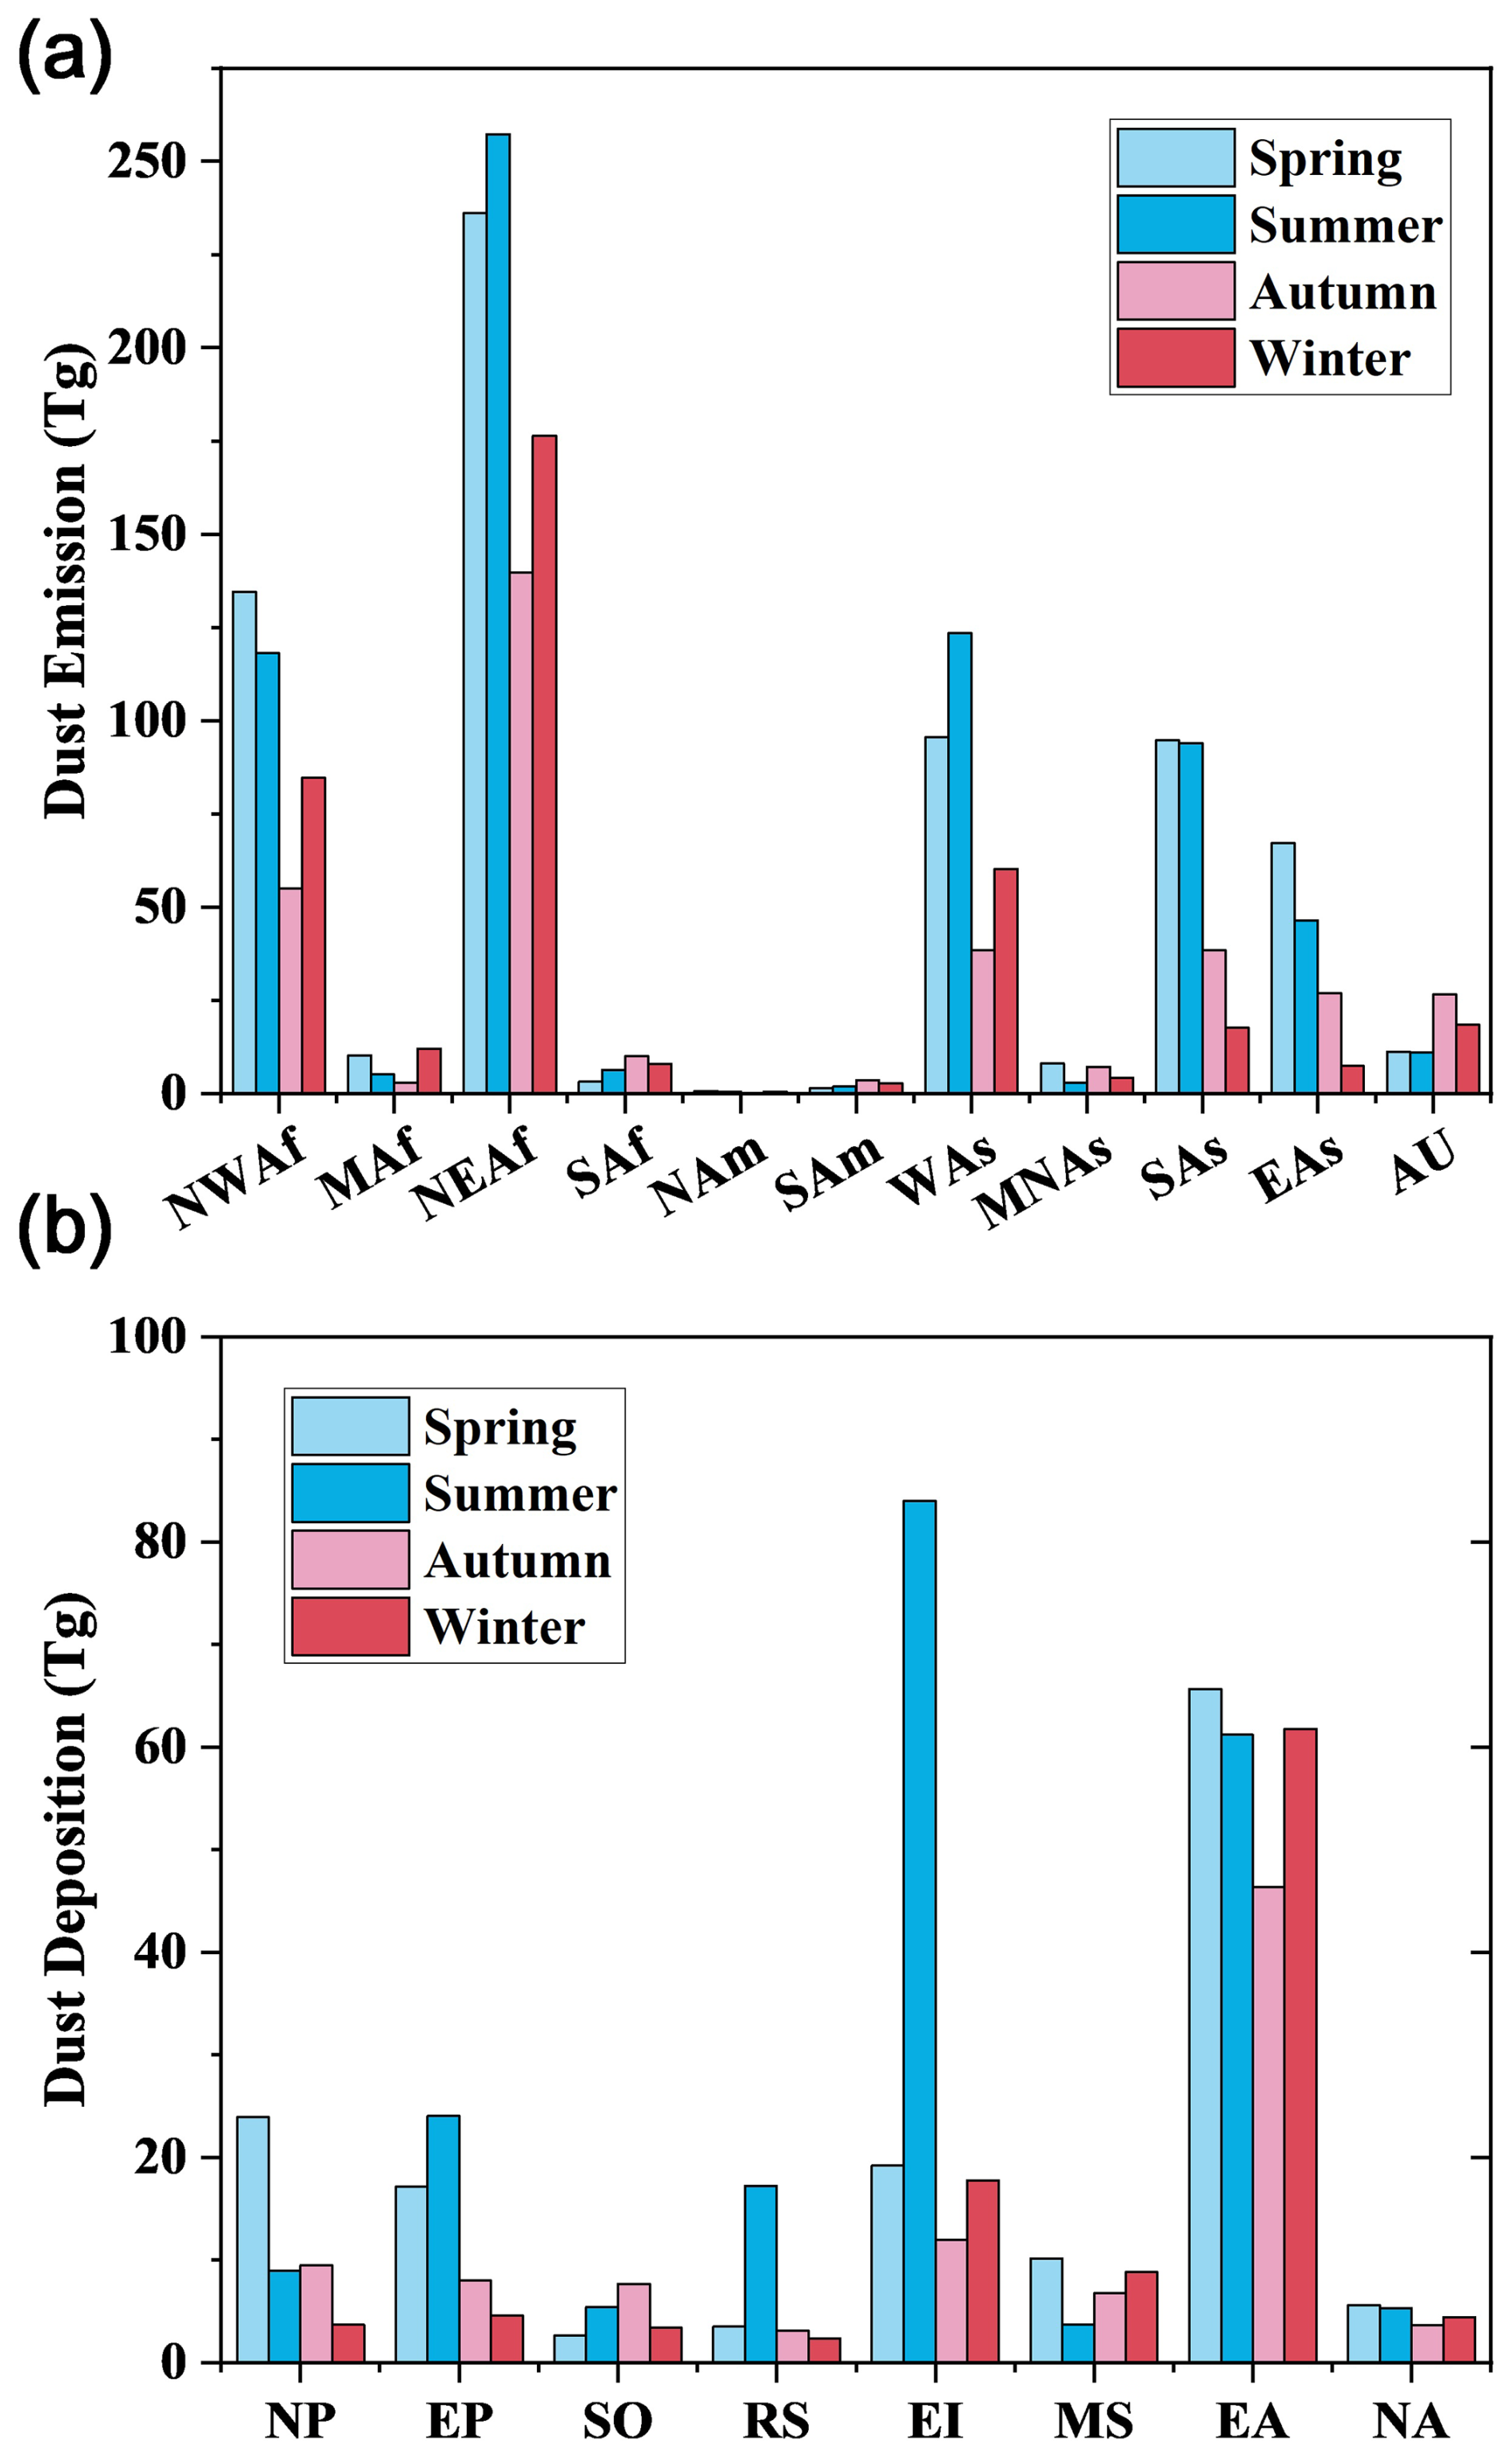
Figure 3The seasonal variations of (a) dust emission and (b) deposition in various dust sources
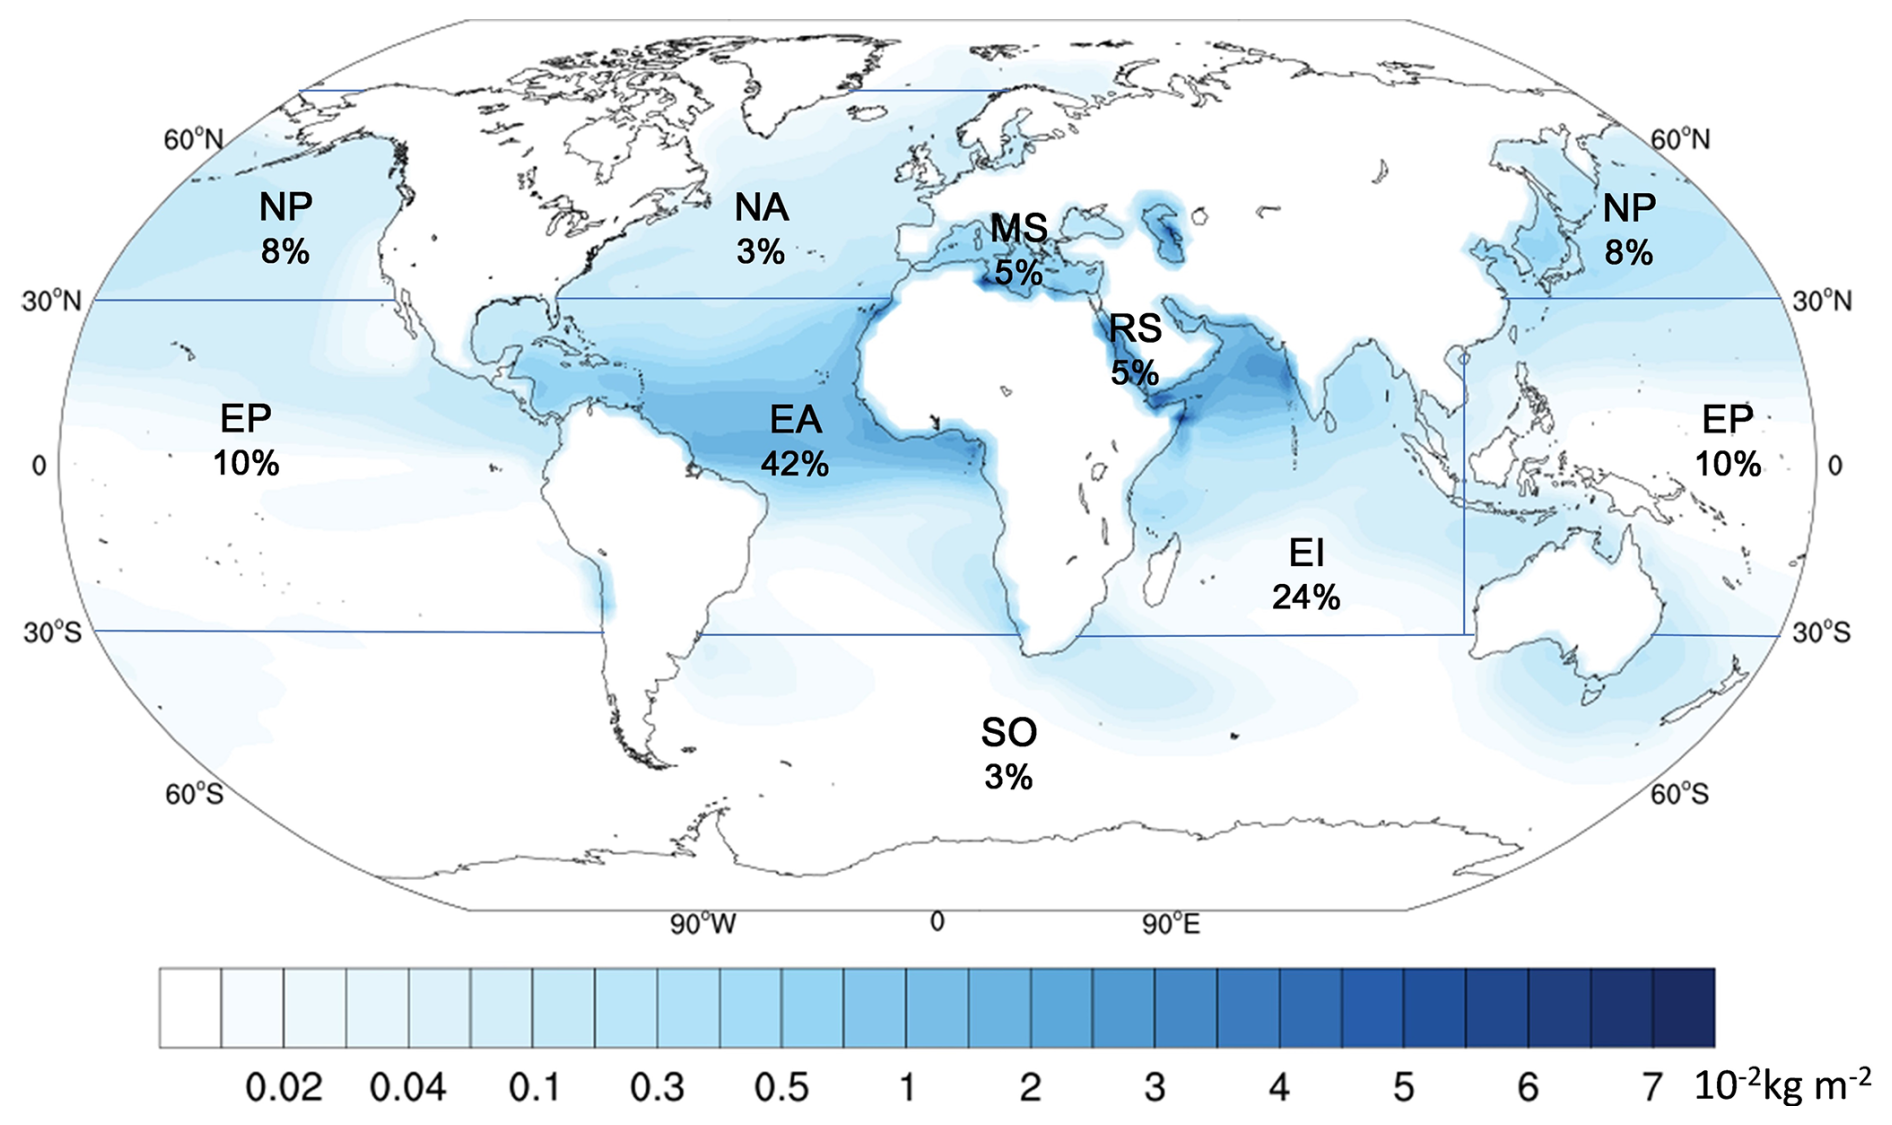
Figure 4The spatial distribution and proportion of the global five-year average dust deposition. Blue lines together with land-sea boundaries indicate different ocean regions. The percentages express the proportions of annual dust deposition in each ocean to global ocean. (Oceans: NP – North Pacific Ocean; NA – North Atlantic Ocean; MS – Mediterranean Sea; RS – Red Sea; SO – Southern Ocean; EP – Equatorial Pacific Ocean; EA – Equatorial Atlantic Ocean; EI – Equatorial Indian Ocean.)
There are 560.2 Tg dust deposited into ocean every year (Fig. 4), representing 27.0 % of the annual global dust emission. Wet deposition dominates the dust deposition, accounting for 77.4 % of the total dust deposition to the ocean. As shown in Fig. 4, the dust deposition over EA (235.0 Tg yr−1) and EI (132.9 Tg yr−1) is highest among oceans around the world. Dust depositions in the EP, NP, MS, RS and SO regions show a decreasing trend, with annual dust deposition of 53.8, 46.0, 28.2, 26.2 and 19.1 and 18.9 Tg, respectively. NA has the lowest dust deposition of 18.9 Tg yr−1, indicating that northwestward transport is not the primary direction for dust from Africa. In addition, the contributions of dry deposition to dust deposition in all oceans are generally less than 30 %, much lower than that of wet deposition, except in the RS and MS. The proportions of dry deposition in RS and MS are 52.0 % and 46.4 %, respectively, due to their relatively small areas with low precipitation and proximity to dust sources.
Global marine dust deposition in summer (209.4 Tg season−1) is higher than other seasons (Fig. S5) (147.5 Tg season−1 in spring, 96.8 Tg season−1 in autumn and 106.5 Tg season−1 in winter). In summer, dust deposition in EI increases sharply, rising by 337.6 % compared to spring, primarily due to the increase of wet deposition (Figs. S6 and S7). The large reduction in dust deposition in EA during autumn, which is ∼ 60 Tg lower than in other seasons, is the primary reason for the lowest global dust deposition during this period. As EA is a key source of marine dust deposition, this sharp decline in autumn emissions is a major contributor to the global decrease in dust deposition (Fig. 3). Generally, high dust deposition occurs in spring and summer, while low dust deposition occurs in autumn and winter in all oceans except for SO and MS (Fig. 3). Dust deposition in SO peaks in autumn, while it is lowest in the spring (Fig. 3). The MS experiences its lowest dust deposition in summer, with 3.3 Tg, a pattern that contrasts with the higher summer deposition seen in other oceanic regions. Moreover, seasonal variations of dust deposition are drastic in RS, EI and NP with changes of 626.1 %, 600.4 % and 550.0 %, respectively.
3.2 Annual and seasonal contributions of dust sources to deposition over ocean
The source apportionment of dust deposition over eight oceans were conducted through a series of sensitivity experiments. Dust from NWAf and NEAf are the major contributors to dust deposition over EA, NA, MS and EP, accounting for more than 50 % of dust deposition in each of these oceans (Fig. 5). Dust from NEAf is also the dominant contributor to dust deposition over RS, while dust from NWAf makes only a minor contribution due to a small portion of dust from NWAf being transported eastward (Fig. 5). EA is the ocean with the highest dust deposition over the world, which is primarily attributed to the dust transported westward from NWAf and NEAf. Dust from NWAf (46.0 %) contributes slightly more to deposition over EA than dust from NEAf (44.2 %), as a greater amount of dust from NWAf can be westward transported to EA than from NEAf (Fig. 5).
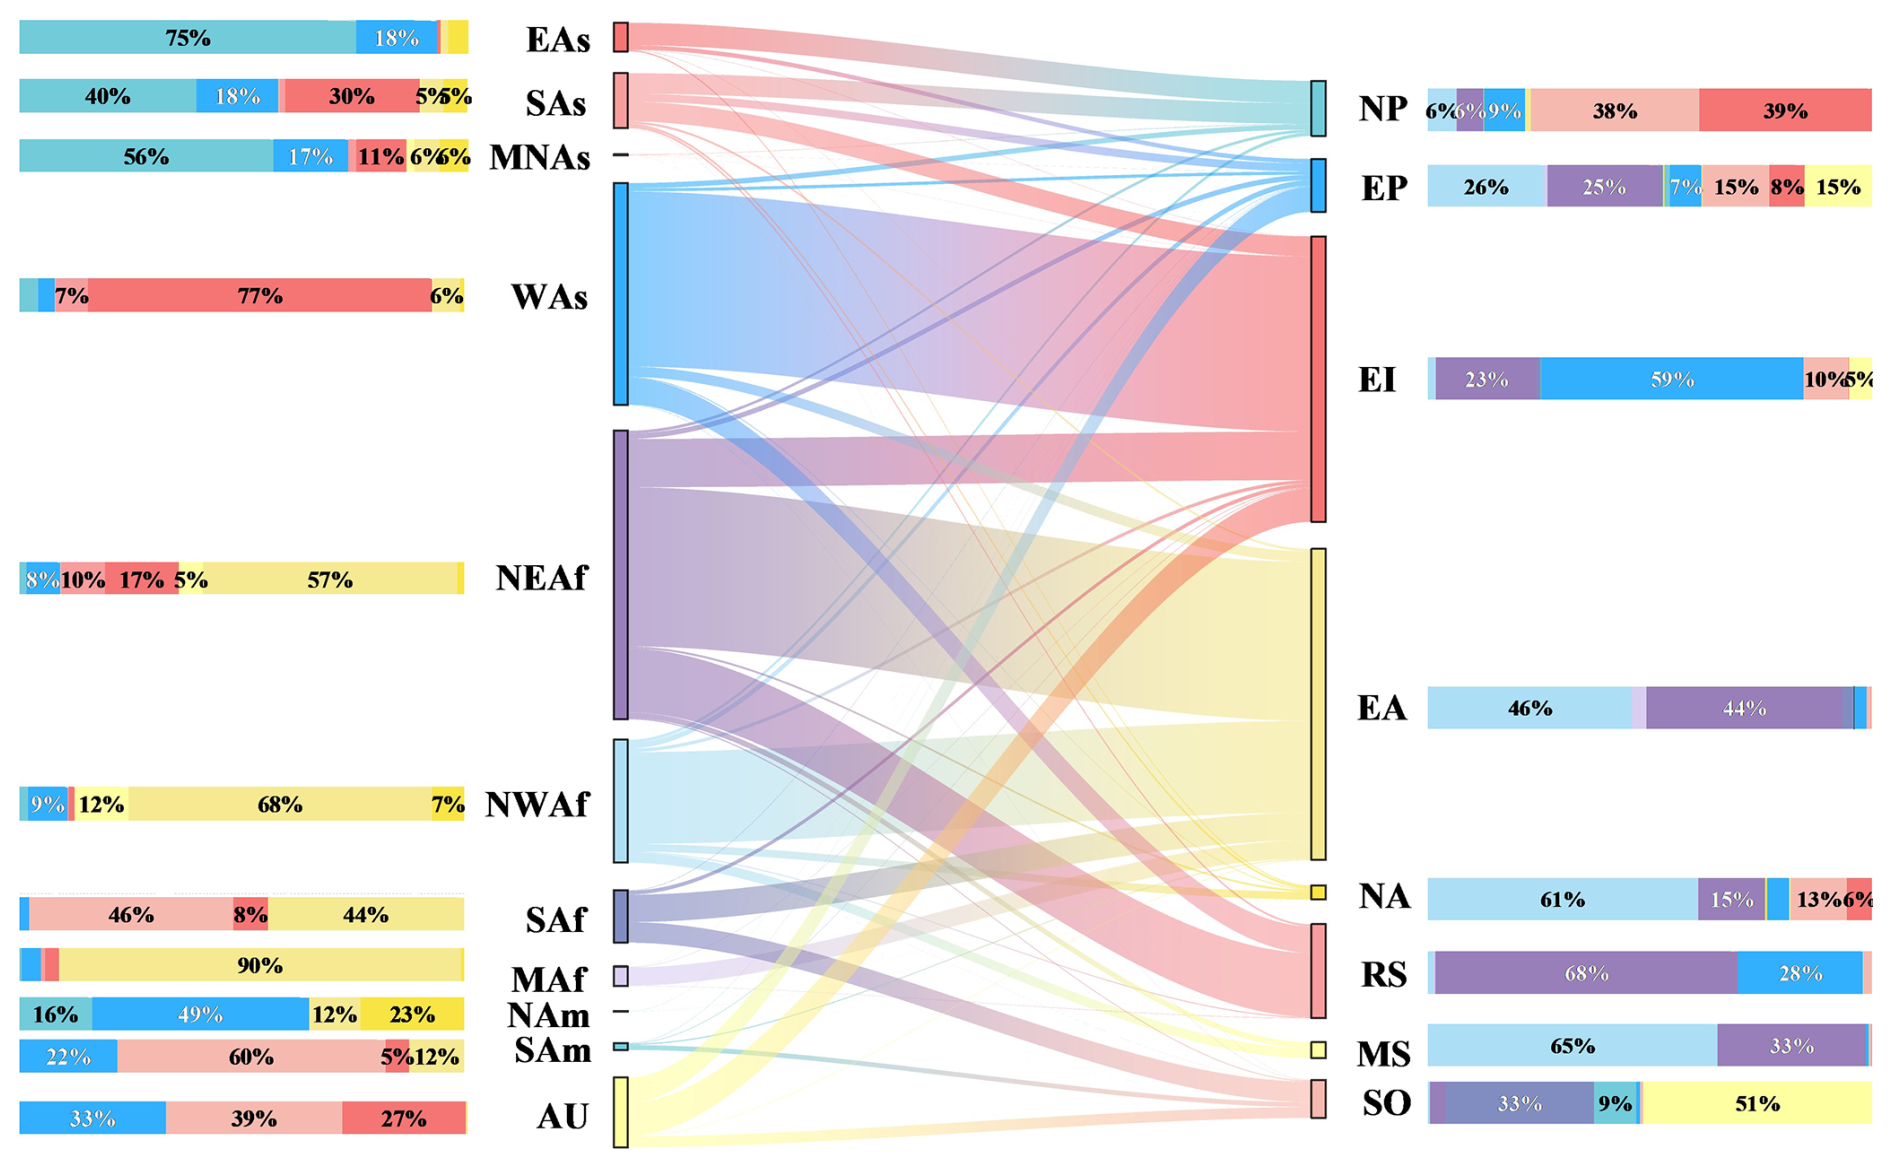
Figure 5The annual contributions of various dust source regions to oceanic dust deposition. Each column on the left represents the fraction of dust emitted from a given source region that is ultimately deposited in individual oceans, with different colors indicating the respective oceans. Each column on the right shows the contributions of various dust source regions to dust deposition over each ocean, with different colors corresponding to different dust source regions. The longitudinal columns depict the proportions of dust emission or deposition relative to global marine dust deposition. The lines in the middle illustrate the transport direction and intensity.
EI is the ocean with the second highest dust deposition, primarily due to the overwhelming southward transport of dust from WAs, accounting for 59.1 % (Fig. 5). The second largest contributor to dust deposition over EI is dust from NEAf, accounting for 22.7 %, mainly owing to the primary eastward transport from NEAf. The following contributor to EI's dust deposition is dust from SAs, accounting for 10.0 % (Fig. 5). Dust deposition in other oceans is comparatively lower than that in the EA and EI regions, but each with distinct source characteristics. EP and NP have similar dust deposition, accounting for 9.6 % and 8.2 % of total dust deposition over global oceans, respectively, but their major contributors are quite different. The major contributors to dust deposition over EP are NWAf and NEAf, while they are EAs and SAs for NP (Fig. 5). Moreover, dust deposition over NP is mainly from Asia except for MNAs, while dust from MNAs is primarily deposited over EP (Fig. 5). Dust deposition over MS and RS is similar (29.5 and 26.2 Tg yr−1), accounting for 5.3 % and 4.7 % of total dust deposition over the ocean, respectively. Dust from NEAf and NWAf dominate the dust deposition over MS, accounting for 98.6 %. However, NEAf is the primary contributor to dust deposition over RS, while dust from NWAf contributes little (Fig. 5). Additionally, dust deposition over SO is mainly from dust sources in the Southern Hemisphere (i.e. AU, SAf, and SAm).
As mentioned above, the largest global marine dust deposition occurs in summer dominated by the large dust deposition over EI in summer (Fig. S5). The seasonal variations in contributions from dust sources to oceans further explain this increase in summer. The primary contributor to dust deposition over EI is dust from WAs, which primarily transports southward and deposits over EI through the year (Fig. S8). In summer, dust emission from WAs peaks with the highest ratio of deposition to emission in WAs, which is 20 % higher (up to 47.4 %) than in other seasons (Figs. 3 and S3). The proportion of dust from WAs deposited over EI in summer (85.3 %) is 10 %–30 % higher than in other seasons (Fig. S8). In addition, dust from NEAf is predominantly transported eastward in summer, leading to an increase of ∼ 30 % compared to other seasons in the amount of dust from NEAf deposited over EI (Fig. S8). Dust emission from NEAf is also highest in summer, with the ratio of deposition to emission slightly higher by ∼ 7 % than in other seasons. Therefore, dust deposition over EI in summer is six times higher than in other seasons.
The dust deposition over EA in autumn is 29.4 % lower than that in other seasons (Fig. 3). Dust from NWAf and NEAf are consistent major sources of dust deposition over EA, contributing ∼ 90 % of the dust deposition to EA through the year (Fig. S8). Dust emissions from NWAf and NEAf are 59.1 % and 45.7 % lower in autumn compared to their peak seasons (spring for NWAf and summer for NEAf) (Fig. 3). Therefore, the decrease in dust deposition over EA in autumn is primarily due to reduced dust emissions from these two key contributors.
The lowest amount of dust deposition over oceans typically occurs in autumn and winter, except for MS, where it occurs in summer (Fig. 3). Dust from NWAf and NEAf are consistently accounts for more than 98 % of total dust deposition over MS as major contributors (Fig. S8). However, in summer, less dust from NWAf and NEAf is transported and deposited over MS, decreasing by ∼ 10 % and ∼ 6 %, respectively, compared to other seasons.
Dust deposition over RS, EI, NP and EP exhibits the largest seasonal variations among ocean areas, with variations of 626.3 %, 600.4 %, 550.0 % and 424.9 %, respectively. NEAf and WAs have consistently been the primary sources of dust deposition in the RS region, contributing over 90 % of the total, though their respective contributions show noticeable seasonal variations (Fig. S8). During the summer, the eastward transport of dust from NEAf increases, leading to a 15 %–21 % rise in its contribution to dust deposition in the RS region compared to other seasons (Fig. S8). The contribution of dust from NEAf shows a significant increase only in summer, further widening the gap with seasons of lower dust deposition. This is a key factor in the 626.3 % increase in dust deposition over the RS in summer compared to winter (Fig. 3). The seasonal variation in dust deposition over the NP region is driven by the large seasonal variations in Asian dust emissions as its primary source (Fig. S8). Dust from EAs and SAs consistently contributing over 80 % of the dust deposition over the NP area with emission peak in spring (Fig. S8). As a result, dust deposition over NP is much higher in spring than in other seasons, with an increase of 550.0 % compared to winter. The primary sources of dust deposition over EP are also dust sources in Asian, except during summer (Fig. S8). The primary contributors to dust deposition over EP in summer are NWAf and NEAf, accounting for 73.0 % (41.6 % for NWAf and 31.4 % for NEAf). Dust from NWAf and NEAf leads to 2 to 26 times more dust deposition over the EP during the summer compared to other seasons, resulting in a large seasonal disparity in dust deposition. Therefore, dust deposition over EP in summer is 424.9 % higher than that in winter.
3.3 Spatiotemporal patterns in phytoplankton carbon uptake driven by dust-borne iron supply
According to the function (4), the Fe : C ratio in phytoplankton cells is a crucial factor in calculating phytoplankton carbon uptake induced by dust deposition into the ocean. We utilize a dataset of Fe : C ratios in phytoplankton cells derived from observations (Ito et al., 2019; GEOTRACES Intermediate Data Product Group, 2023) to the same grid as our simulations. An Fe : C ratio in phytoplankton cells lower than the optimal value indicates large marine phytoplankton carbon uptake driven by the same amount of Fe supply. Increased Fe supply usually can enhance carbon uptake by phytoplankton, but only soluble Fe is bioavailable and Fe : C ratio is lower than optimal value, making the solubility of Fe key to the phytoplankton's carbon uptake to dust deposition. The interpolated result of Fe solubility showed that high Fe solubility primarily occurred in EA and NA, particularly in north-central EA. Relatively high Fe solubility was also found in the regions spanning 105–130° W and 45–75° E in the SO (Fig. S1). We estimated global phytoplankton carbon uptake induced by dust deposition using the Fe : C ratio in phytoplankton cells. Because Fe is the primary limiting nutrient in HNLC regions, we additionally provided a separate estimate for these regions.
Our simulations indicate that annual dust deposition supplies 11.1 Tg of Fe to the global ocean, of which 0.4 Tg is dFe, driving a carbon uptake of 5.6 Pg C yr−1 by phytoplankton. High dust-borne dFe primarily occurs in EI (1.1 × 10⁻¹ Tg yr−1), EA (1.7 × 10⁻¹ Tg yr−1), and MS (1.7 × 10⁻² Tg yr−1) (Fig. S9). The high Fe : C ratio in phytoplankton cells is primarily occurred in EA, particularly in the north-central of EA (Fig. S10). The mean Fe : C ratio in phytoplankton cells in EA is the highest, which is 62.5 µmol Fe mol−1 C. The NP and EP near America, as well as NA, exhibit relatively high Fe : C ratios in phytoplankton cells (Fig. S10). The average Fe : C ratios in phytoplankton cells in NP, EP, and NA are 19.6, 27.6, and 28.0 µmol Fe mol−1 C, respectively. Large marine phytoplankton carbon uptake driven by dust deposition occurs primarily in EA, EI and RS (Fig. 6), which exhibit positive ecological responses to dust deposition, with uptake values of 2.2, 1.8 and 0.5 Pg C yr−1, respectively. The following areas are NP (0.3 Pg C yr−1), EP (0.3 Pg C yr−1), NA (0.2 Pg C yr−1) and MS (0.2 Pg C yr−1). The marine phytoplankton carbon uptake driven by dust deposition is minimal in the SO (0.1 Pg C yr−1), accounting for only ∼ 3 % of the total marine phytoplankton carbon uptake driven by global dust deposition. The spatial distribution of marine phytoplankton carbon uptake driven by dust deposition closely mirrors that of dust deposition. In EA, marine phytoplankton carbon uptake driven by dust deposition decreases from east to west, while in EI, the northwestward region exhibits high values (Fig. 6). Despite the large Fe : C ratio in phytoplankton cells in EA, which means the carbon uptake by phytoplankton is not sensitive to dust-born Fe supply, it remains the region with the largest marine phytoplankton carbon uptake to dust deposition, accounting for 41.3 % of the marine phytoplankton carbon uptake induced by dust deposition (Figs. 6 and S10). This strong response is supported by the highest Fe supply from dust deposition (4.7 Tg yr−1) and Fe solubility (6.7 % in average) in EA. The intensity of marine phytoplankton carbon uptake driven by dust deposition in RS is much higher than that in other oceans, mainly because of the lowest Fe : C ratio in phytoplankton cells in RS (7.0 µmol Fe mol−1 C) (Figs. 6 and S10). In addition, compared to the role in global dust deposition over the oceans, the contributions of marine phytoplankton carbon uptake driven by dust deposition in EP is smaller due to low Fe solubility (1.9 %) and high Fe : C (27.6 µmol Fe mol−1 C).
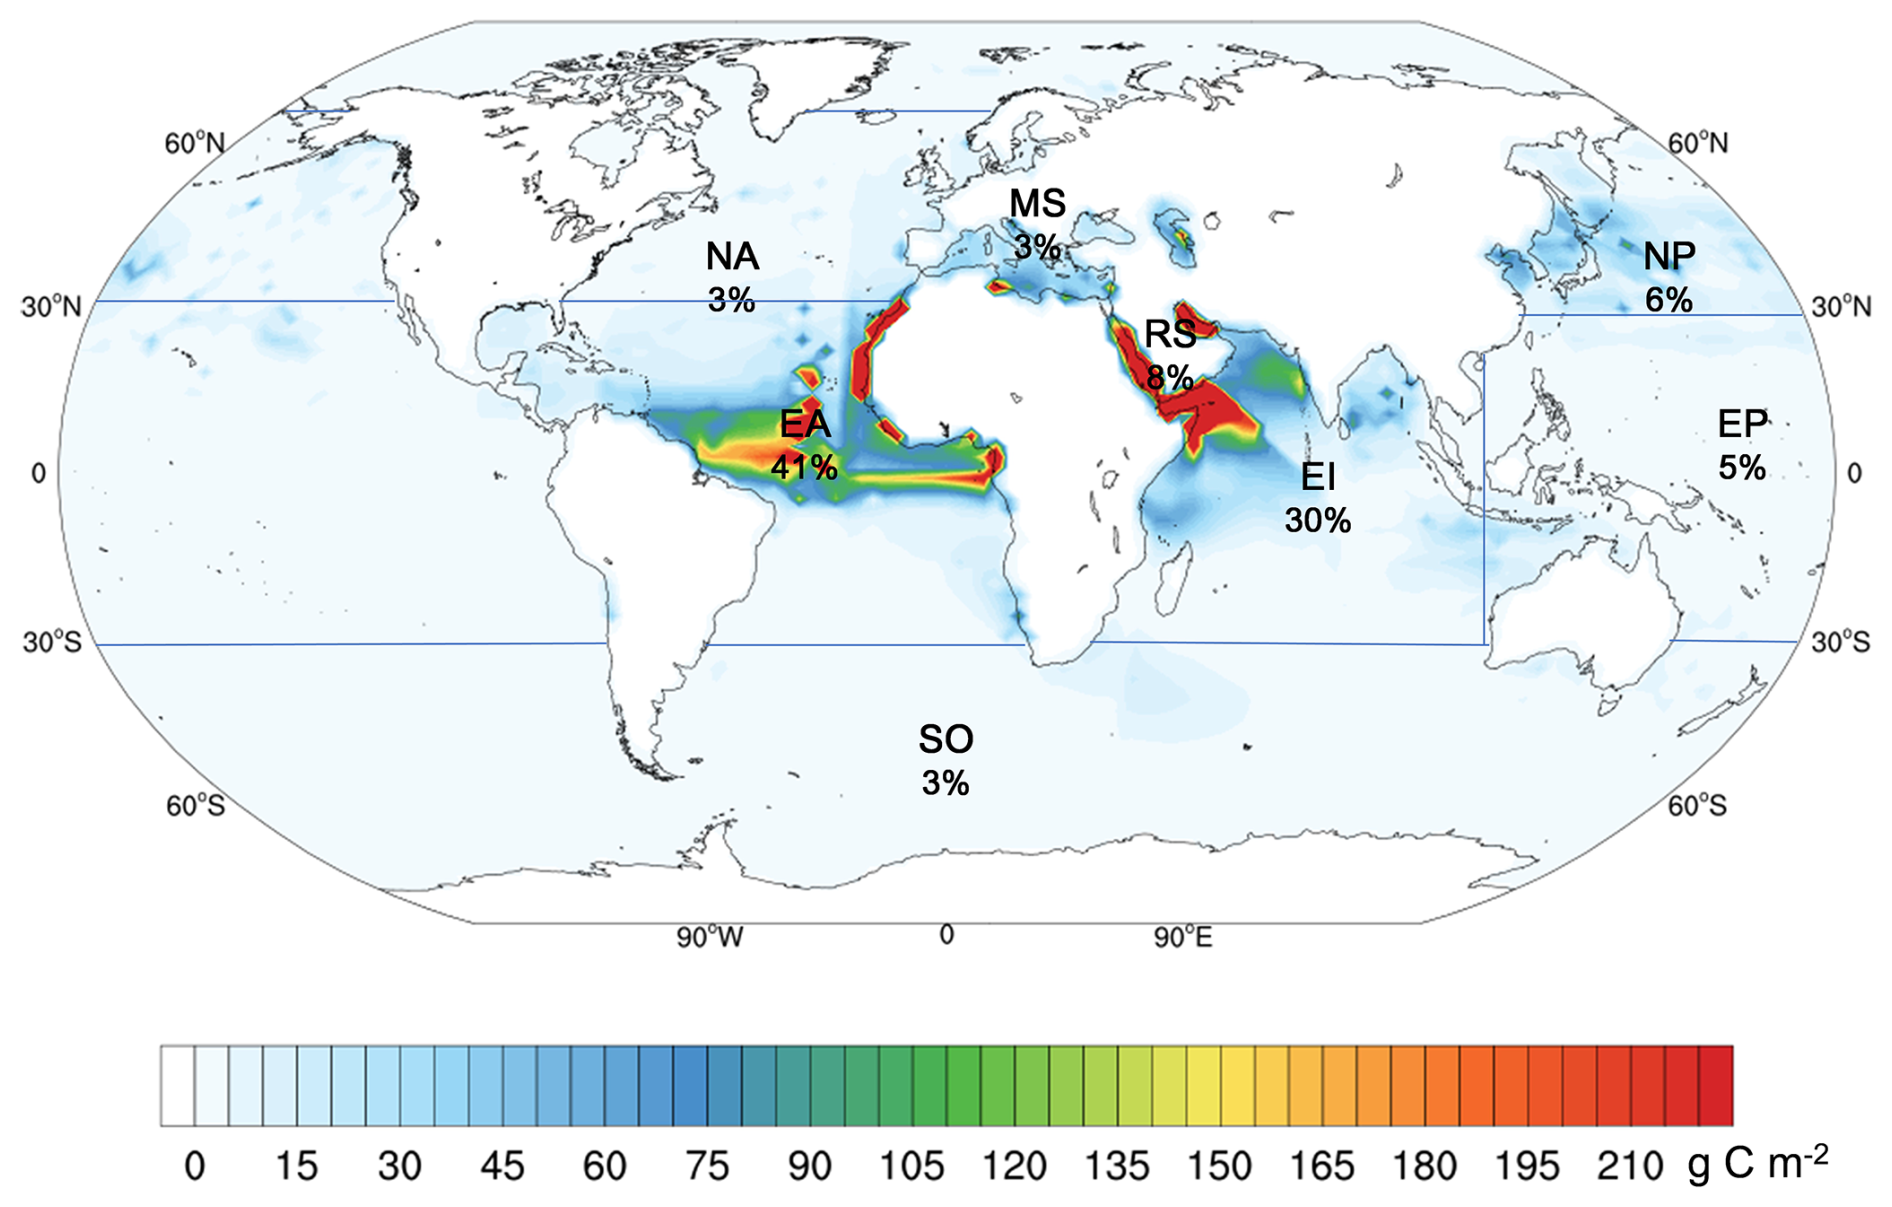
Figure 6The annual phytoplankton carbon uptake induced by dust deposition. Blue lines together with land-sea boundaries indicate different ocean regions. The percentages represent the proportion of annual dust-driven phytoplankton carbon uptake in each ocean to global ocean.
The global phytoplankton marine carbon uptake driven by dust deposition in summer is 2.1 Pg C season−1 while that is ∼ 1.0 Pg C in other seasons (1.4 Pg C season−1 in spring, 0.9 Pg C season−1 in autumn and 1.2 Pg C season−1 in winter) (Fig. S11). During summer, phytoplankton in EI, EA and RS contribute most to the global marine carbon uptake induced by dust deposition, with EI at 0.9 Pg C, EA at 0.5 Pg C and RS at 0.3 Pg C, in addition, the marine phytoplankton carbon uptake over EI and RS are much higher in summer than in other seasons (Fig. 7). Except for summer, EA has the largest marine phytoplankton carbon uptake driven by dust deposition among all ocean areas (Fig. 7). Generally, high marine phytoplankton carbon uptake usually occurred in spring and summer, and low marine phytoplankton carbon uptake occurred in autumn and winter, in addition to SO, MS and EA (Fig. 7). The seasonal variations of marine phytoplankton carbon uptake in SO and MS are dominated by the seasonal variation in dust deposition. Nevertheless, the seasonal changes in marine phytoplankton carbon uptake in EA differ from the seasonal pattern of its dust deposition. High marine phytoplankton carbon uptake in EA occurs in winter (0.7 Pg C) and spring (0.7 Pg C), while low marine phytoplankton carbon uptake occurs in autumn (0.4 Pg C) and summer (0.5 Pg C) (Fig. 7). In comparison, high dust deposition in EA occurs in spring (65.67 Tg), winter (61.8 Tg) and summer (61.2 Tg), the lowest dust deposition occurs in autumn (46.4 Tg) (Fig. 3). These differences are mainly due to the difference in the seasonal pattern between Fe : C ratio in phytoplankton cells and dust deposition in EA. The seasonal variations and spatial distribution of carbon uptake for new growth in the EA region are largely influenced by the Fe : C ratio in phytoplankton cells, in addition to the impact of dust deposition. High marine phytoplankton carbon uptake in EA during winter and spring is mainly distributed in the middle region, where Fe : C ratios in phytoplankton cells are relatively low (Fig. S10). In contrast, during autumn and summer, high marine phytoplankton carbon uptake is centered in the northern EA, where Fe : C ratios in phytoplankton cells are high (Fig. S10).
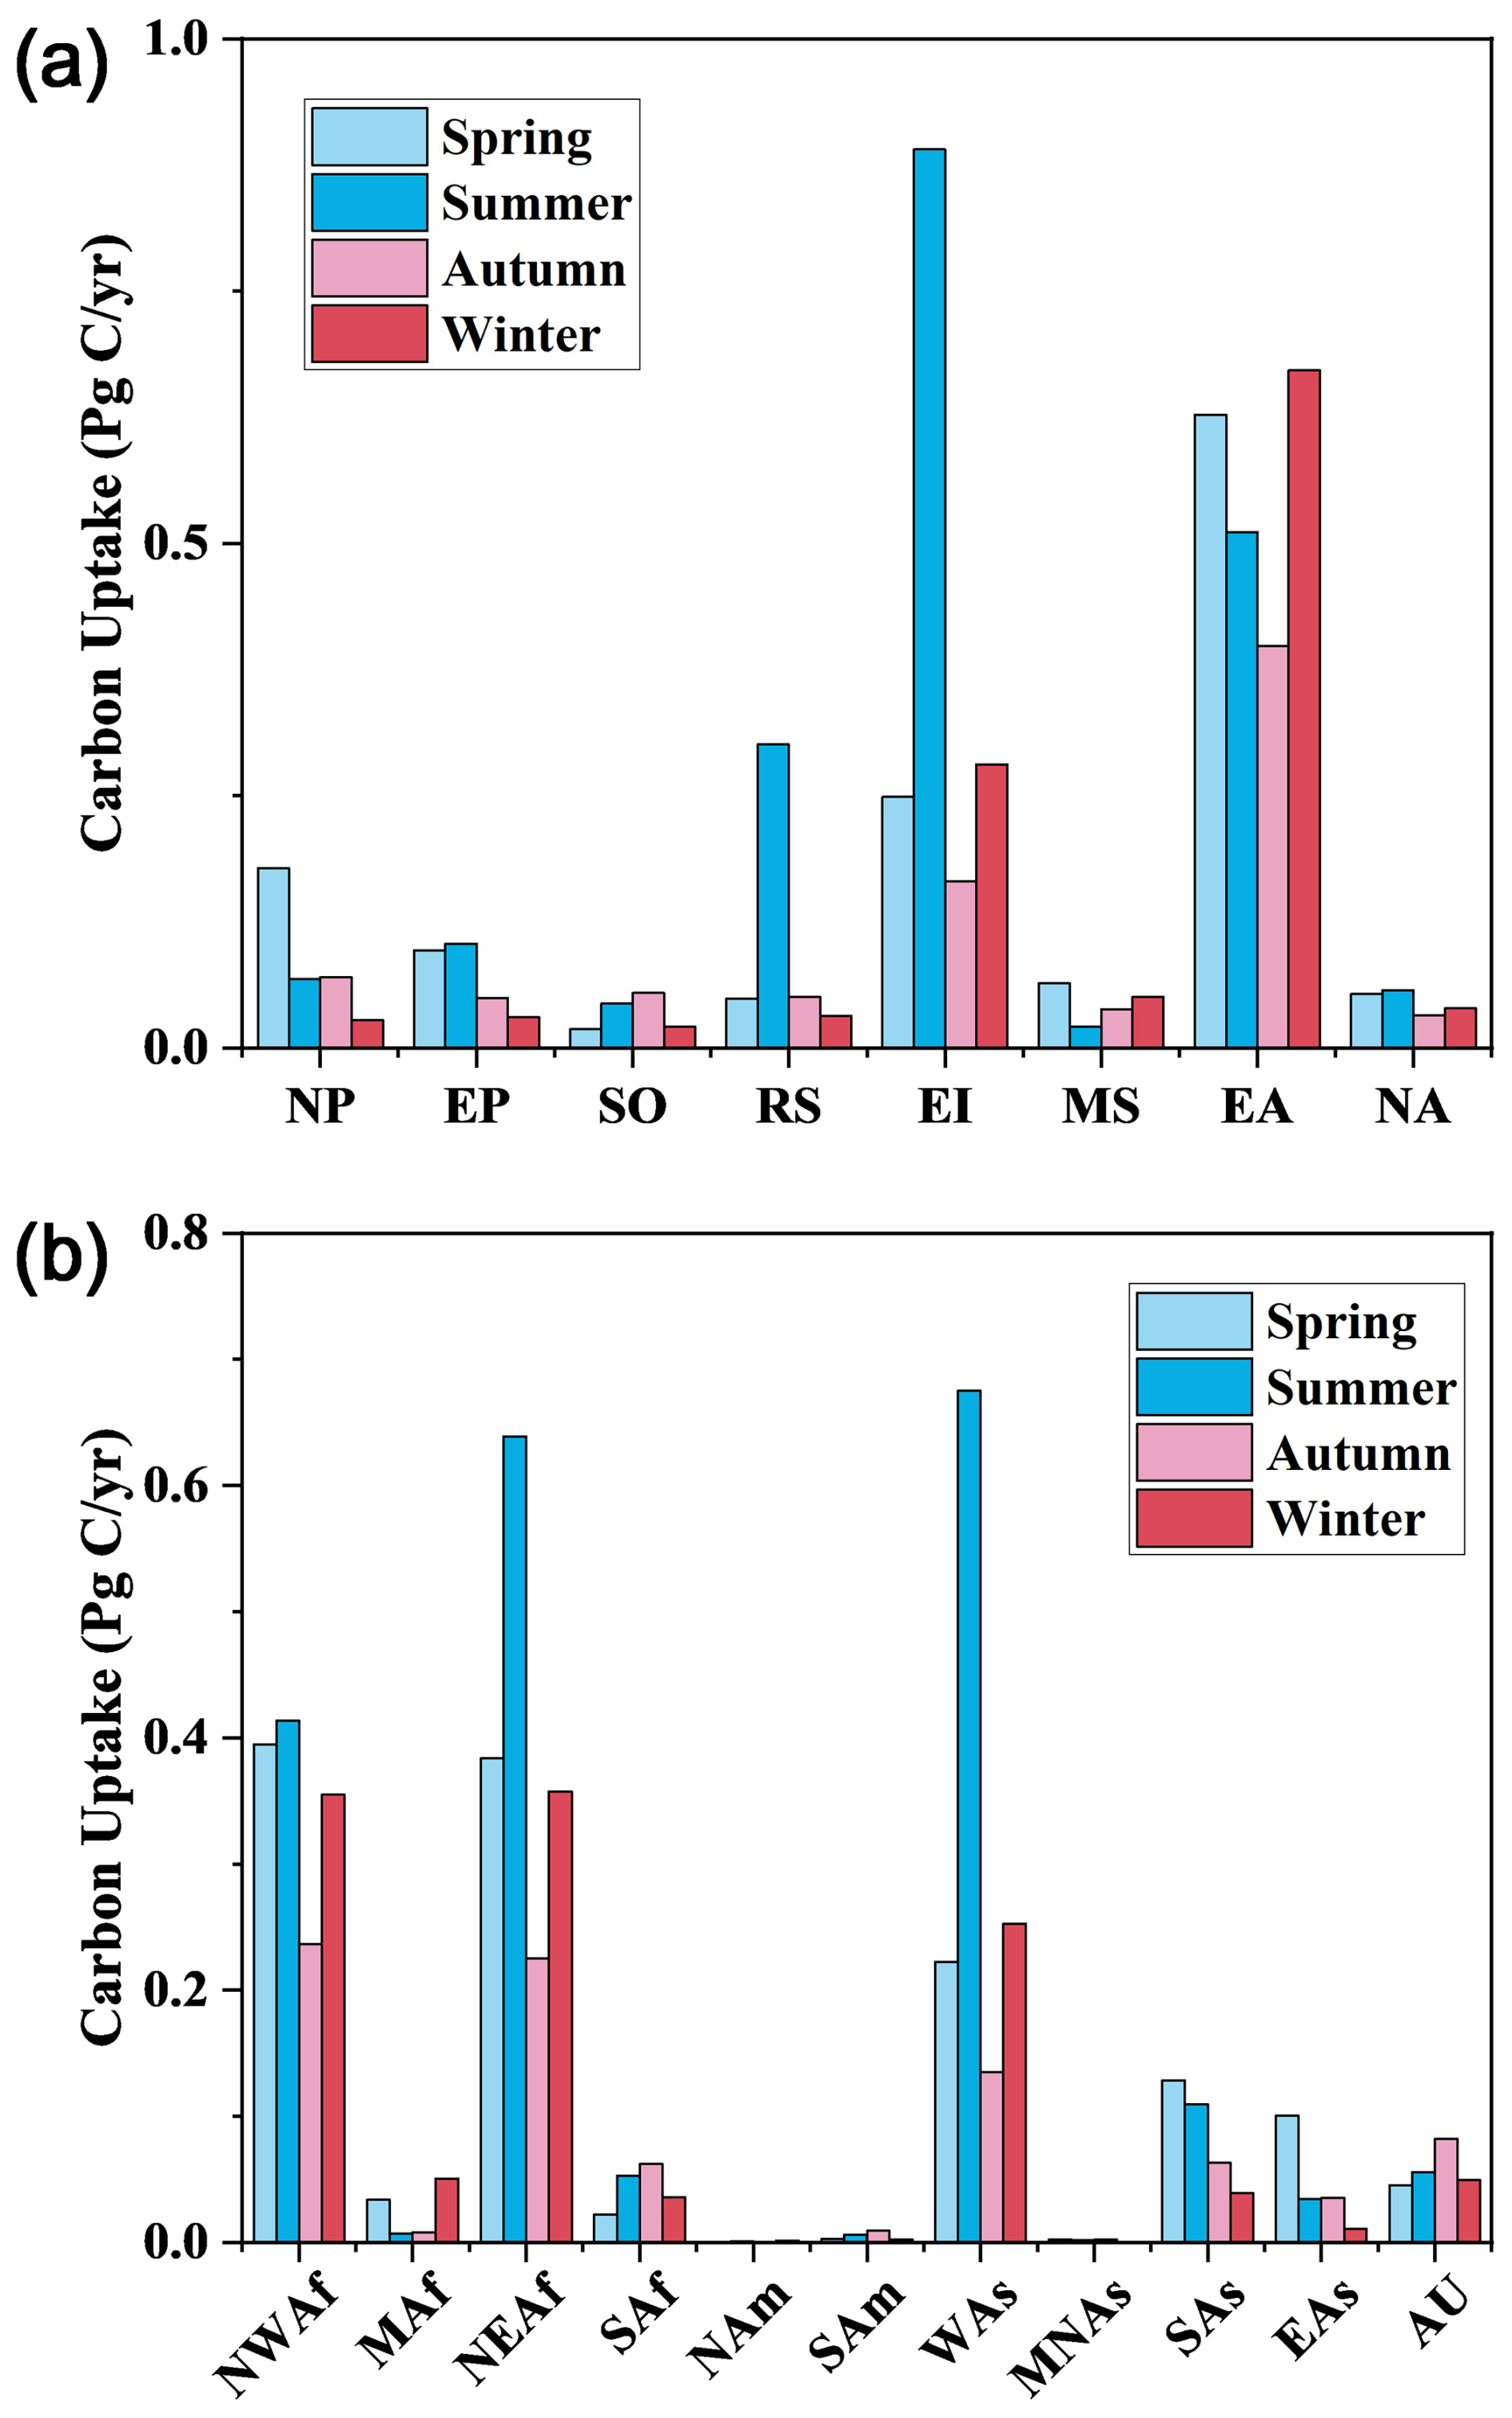
Figure 7(a) Seasonal variations of marine phytoplankton carbon uptake caused by dust deposition over each ocean area; (b) seasonal contribution of dust source regions to marine phytoplankton carbon uptake driven by dust deposition.
Recognizing Fe as the primary limiting nutrient in HNLC regions, we provided a separate estimate for these regions. The results show that annual dust deposition provides 0.8 Tg Fe to HNLC regions, of which 2.2 × 10⁻² Tg is dFe, causing a marine phytoplankton carbon uptake of 0.2 Pg C yr−1. The marine phytoplankton carbon uptake driven by dust deposition occurred in the HNLC region over NP, SO and EP is 1.6 × 10⁻¹, 7.2 × 10⁻² and 9.3 × 10⁻³ Pg C yr−1, respectively. The estimation of global marine phytoplankton carbon uptake attributed to dust deposition is 5.6 Pg C yr−1, which may be overestimated due to the assumption that every grid where dust deposition occurs over the ocean responds to its Fe supply. Therefore, the actual annual marine phytoplankton carbon uptake due to dust deposition worldwide is likely between 0.2 and 5.6 Pg C yr−1. In addition, phytoplankton carbon uptake driven by dust deposition in HNLC regions is the highest in spring (9.6 × 10⁻² Pg C season−1), compared with summer (6.5 × 10⁻² Pg C season−1), autumn (6.3 × 10⁻² Pg C season−1), and winter (2.1 × 10⁻² Pg C season−1). Dust-driven phytoplankton carbon uptake is the highest in HNLC regions of the NP across all seasons, except in winter, accounting for 86.1 % in spring. In winter, phytoplankton in the SO contribute the most to dust-driven marine carbon uptake in HNLC regions, with 1.1 × 10⁻² Pg C (∼ 50.2 %), while the NP accounts for ∼ 45.6 %.
3.4 Source apportionments of marine phytoplankton carbon uptake induced by dust deposition
Dust from NEAf (1.7 Pg C yr−1), NWAf (1.5 Pg C yr−1), and WAs (1.3 Pg C yr−1) are the primary drivers of marine phytoplankton carbon uptake induced by dust deposition (Fig. 7). NEAf, NWAf and WAs make their largest contributions to marine phytoplankton carbon uptake during the summer, contributing 0.7, 0.4 and 0.7 Pg C yr−1, respectively (Fig. 7). They (NEAf, NWAf and WAs) all contribute least in autumn with contributions of 0.2, 0.2, and 0.1 Pg C yr−1, respectively (Fig. 7). Examining the seasonal variation in contributions from dust sources to global dust-driven carbon uptake of marine phytoplankton, contribution from EAs exhibits the largest seasonal variation. In spring, marine phytoplankton carbon uptake induced by dust from EAs is about ten times higher than in winter (Fig. 7). Dust from MAf and MNAs also shows a 5–6 fold difference in their contributions to global marine phytoplankton carbon uptake across different seasons, but their overall contributions remain only ∼ 2 % (Figs. 7 and 8).
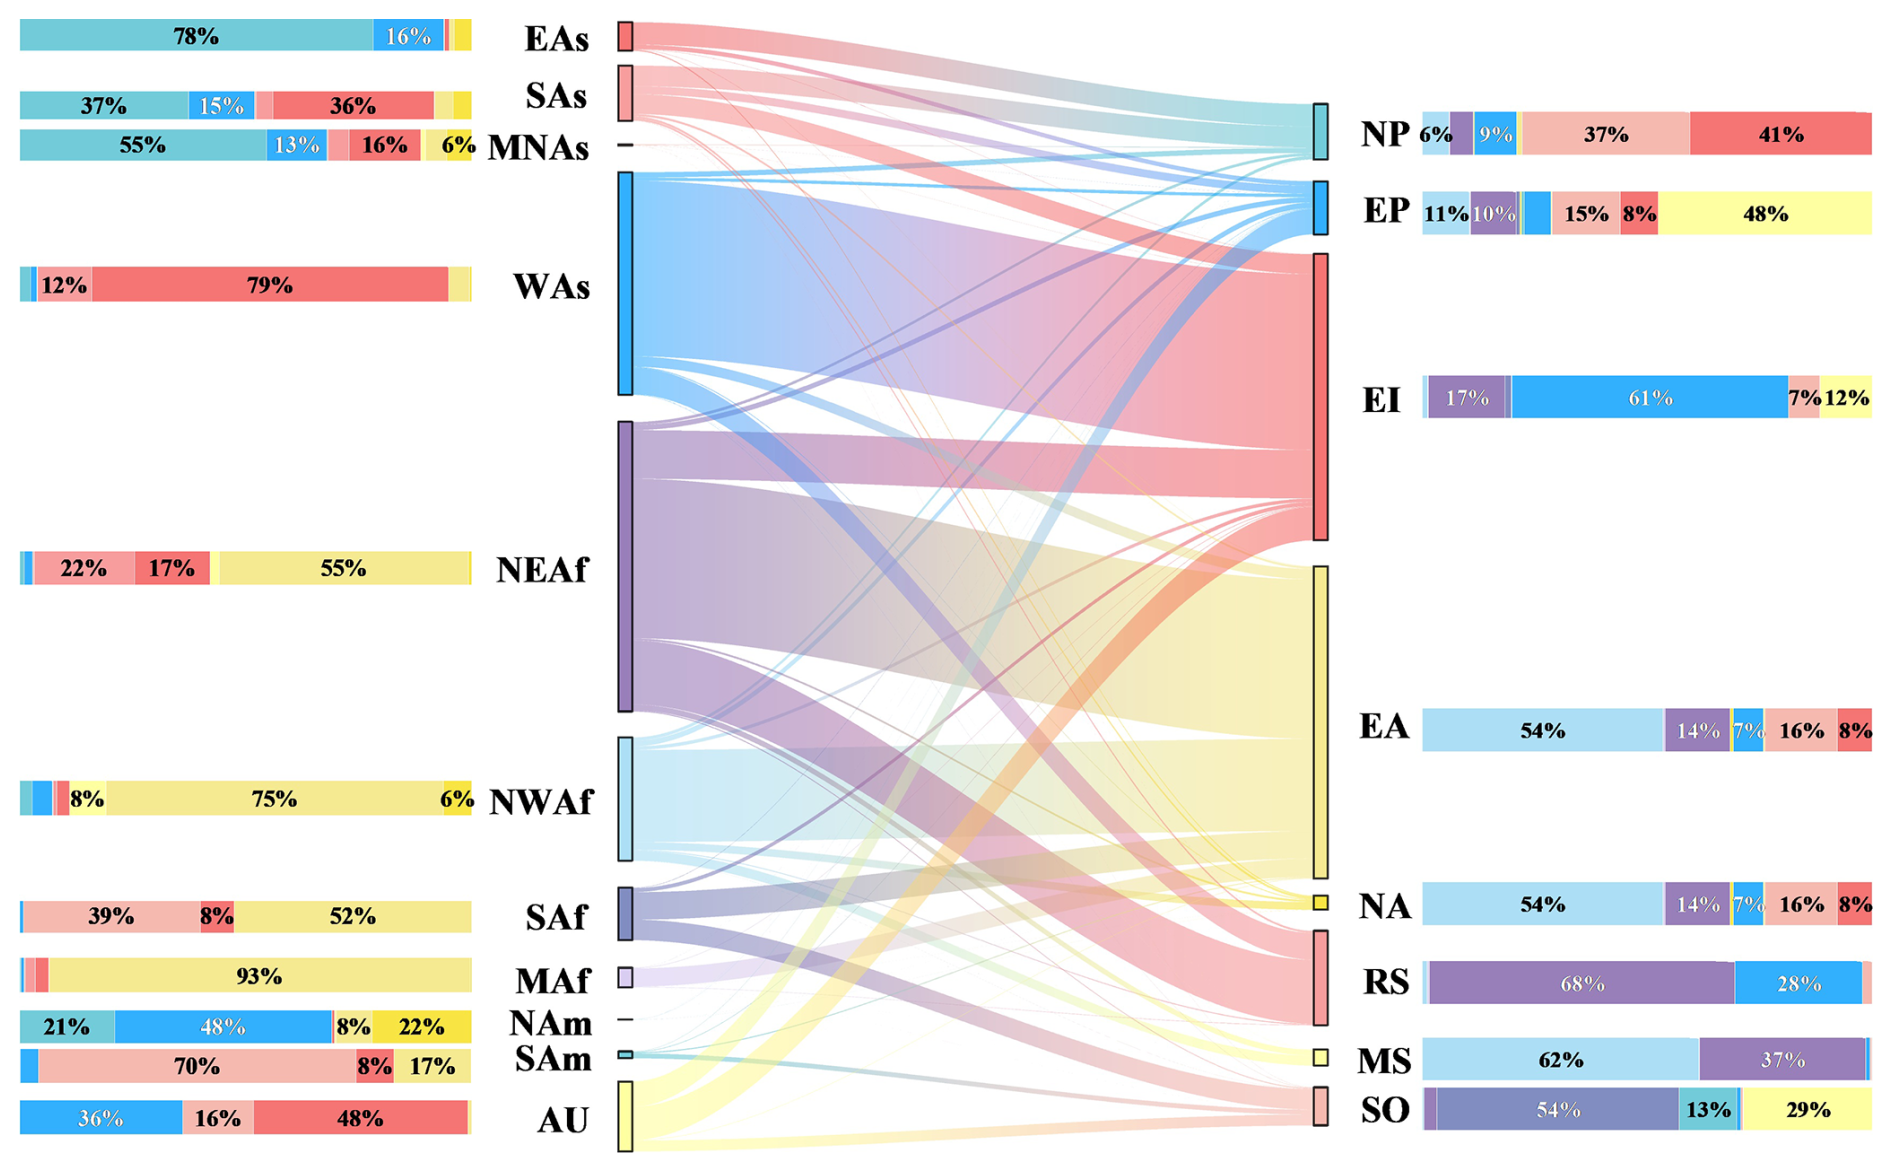
Figure 8The annual contribution of various dust source regions to the marine carbon uptake. Each column on the left represents the fraction of dust emitted from a given source region that ultimately induces phytoplankton carbon uptake in individual oceans, with different colors indicating the corresponding oceans. Each column on the right shows the contributions of various dust source regions to phytoplankton carbon uptake driven by dust deposition over each ocean, with different colors representing the respective dust sources. The longitudinal columns display the contribution ratios of dust sources or oceans to the total marine phytoplankton carbon uptake driven by dust deposition. The lines in the middle illustrate the transport direction and intensity.
The heterogeneity in Fe solubility and Fe : C ratios in phytoplankton cells across global oceans leads to difference in the contributions of dust sources to marine dust deposition and phytoplankton carbon uptake. The greatest contributors to marine phytoplankton carbon uptake in EP differ from those that contribute most to dust deposition in the region (Figs. 5 and 8). The dust from AU is the dominant contributor to marine phytoplankton carbon uptake driven by dust deposition over EP, accounting for 30.4 %, while the dust from NWAf and NEAf, the major contributors to dust deposition over EP, only accounts for 17.2 % and 15.6 %, respectively (Figs. 5 and 8). Dust from AU is the third largest supplier of Fe to dust deposition over EP, following NWAf and NEAf. This is primarily because dust deposition over EP from NWAf and NEAf is mainly concentrated in the northeast, near the southwest coast of NAm, where Fe : C ratios in phytoplankton cells are relatively higher compared to the areas dust from AU is deposited over EP (Fig. S10). The contribution (33.4 %) of dust from AU to marine phytoplankton carbon uptake in SO is lower compared to its contribution (51.5 %) to dust deposition over SO (compare Figs. 5 and 8), mainly due to high Fe : C ratio in phytoplankton cells in the southeast of AU, which is the primary area of dust from AU deposit over SO (Fig. S10). On the contrary, the contributions of the dust from SAf to carbon uptake for new growth in SO is larger compared to its contributions to dust deposition owing to low Fe : C ratio in phytoplankton cells in the southeast of SAf, where is the main regions of SAf's dust deposit over SO (Fig. S10). Therefore, spatial variations in Fe solubility and the Fe : C ratio in phytoplankton cells will to some extent lead to differences between the spatial distribution characteristics of dust deposition and the resulting spatial distribution characteristics of marine phytoplankton carbon uptake. Globally, dust from NEAf is the largest contributor to the marine phytoplankton carbon uptake driven by dust deposition which accounts for 30.0 % (1.7 Pg C yr−1) (Fig. 8), followed by NWAf (1.5 Pg C yr−1), accounting for 26.2 %. WAs (1.3 Pg C yr−1) and SAs (0.4 Pg C yr−1) are also important sources to annual total marine carbon uptake induced by dust deposition, accounting for 24.0 % and 6.4 %. Dust from AU and EAs account for 4.3 % and 3.4 % of the global marine carbon uptake for new growth driven by dust deposition, dust from SAf and MAf account for 3.4 % and 3.2 %, respectively. Dust from SAm, MNAs and NAm contribute relatively lower to the marine carbon uptake driven by dust deposition, less than 1 %, respectively.
The seasonal variation in marine phytoplankton carbon uptake is most pronounced in RS (Fig. 7). The highest marine phytoplankton carbon uptake in RS occurred in summer at 0.3 Pg C, which is about ten times higher than in winter, resulting in a drastic seasonal fluctuation occurred in RS (Fig. 7). During summer, dust deposition over RS increases from almost all dust sources, particularly NEAf and WAs (Fig. S12). Specifically, dust from NEAf contributes 0.2 Pg C, and dust from WAs contributes 0.1 Pg C to marine phytoplankton carbon uptake driven by dust deposition in RS. Additionally, the lowest Fe : C ratio in phytoplankton cells in RS further enhances the marine carbon uptake for new growth driven by dust deposition during summer. During winter, dust deposition in RS primarily from NEAf and WAs, could leading to 1.2 × 10⁻² and 2.1 × 10⁻² Pg C of marine phytoplankton carbon uptake (Fig. S12). The carbon uptake for new growth induced by dust deposition over NP and EI also exhibits large seasonal variations, with differences between seasons reaching 542.1 % and 438.8 %, respectively (Fig. 7). The highest marine phytoplankton carbon uptake driven by dust deposition in NP occurred in spring at 0.2 Pg C, while the lowest occurred in winter at 2.9 × 10⁻² Pg C. The marine phytoplankton carbon uptake in NP throughout the year is predominantly attributed to the dust from Asia, particularly from EAs and SAs (Fig. S12). The pronounced seasonal variations in dust emissions from EAs and SAs are the primary reasons for the large seasonal changes in carbon uptake induced by dust deposition in the NP (Fig. 3). During summer, marine phytoplankton carbon uptake driven by dust deposition in EI peaks at 0.9 Pg C, contrasting with its lowest uptake in autumn at 0.2 Pg C (Fig. 7). This fluctuation is primarily driven by changes in dust deposition over EI (Fig. 3). Substantial dust from NEAf and WAs deposits in EI during summer, sharply diminishing in autumn (Fig. S8).
Identifying the contribution of dust sources to deposition over oceans is key to quantify the dust-borne input of dFe to the ocean, which is critical for understanding its impact on marine ecosystems, the carbon cycle, and climate. In this study, CESM was employed to identify the contributions of various dust source regions to dust deposition, revealing that EA and EI are the major contributors to global dust deposition over the ocean, with contributions of 41.6 % and 23.7 %, respectively. These contributions are primarily due to the westward transport of dust from NEAf and NWAf, the largest dust emission sources, to the EA region, and the dominant southward transport of dust from WAs to EI. Additionally, dust deposition over the RS exhibits the largest seasonal variations among ocean areas, with fluctuations of 626.3 %, primarily due to a sudden large increase in deposited dust from NEAf over RS occurring exclusively in summer.
Based on the contribution relationship, we quantified the total Fe and dFe supplied to the ocean due to dust deposition and used the Fe : C ratio in phytoplankton cells to identify its effect on carbon uptake by phytoplankton in various oceans, we found that dust deposition onto the ocean supplies 11.1 Tg yr−1 of Fe and 0.4 Tg yr−1 of dFe, leading to a marine phytoplankton carbon uptake of 5.6 Pg C yr−1. Large marine phytoplankton carbon uptake driven by dust deposition occurs primarily in EA and EI, leading to 2.3 and 1.7 Pg C yr−1, respectively, because large amount of dust deposition over EA and EI. Marine phytoplankton carbon uptake driven by dust deposition is highest in summer (2.1 Pg C season−1), followed by spring (1.4 Pg C season−1) and winter (1.2 Pg C season−1), with the lowest uptake occurred in autumn (0.9 Pg C season−1). Marine phytoplankton carbon uptake caused by dust deposition in summer over the RS is 843.0 % higher than in other seasons, representing the largest seasonal variation among ocean areas. This significant variation is primarily due to the sharp increase in dust deposition from NEAf during summer and the lowest Fe : C ratio in phytoplankton cells in RS. Compared with previous studies, Myriokefalitakis et al. (2018) reported that total Fe emissions from dust sources in various models (CAM4, IMPACT, GEOS-Chem, and TM4-ECPL) ranged from 38 to 134 Tg total Fe yr−1, with a mean value of 71.5 ± 43 Tg total Fe yr−1, which is comparable with our result of 42.5 Tg Fe yr−1. Their simulations of soluble Fe from mineral dust ranged from 0.3 to 1.0 Tg dFe yr−1, with a mean value of approximately 0.7 ± 0.3 Tg dFe yr−1. The amount of Fe supplied to the ocean from dust deposition in our study (11.1 Tg yr−1) is close to the lower end of other global estimates (12.94 ± 0.31 Tg yr−1) presented by Myriokefalitakis et al. (2022).
The amount of dust deposition is fundamental in determining the marine carbon uptake for new growth to Fe supply from dust. Consequently, the relationship between dust deposition in various oceans and their respective dust sources elucidates the link between carbon uptake for new growth in each marine region and its dust sources. Currently, few studies have quantified the large-scale response of the carbon cycle to dust deposition. Mahowald et al. (2010) demonstrated that dust deposition trends increase ocean productivity by 6 % over the 20th century, leading to marine carbon uptake of 8 Pg C (equivalent to 4 ppm in atmospheric CO2). They combined the ecosystem component of the Biogeochemical Elemental Cycling (BEC) ocean model and a carbonate chemistry module to calculate partial pressure of CO2 and air-sea CO2 flux to estimate the variation of carbon. Although their carbon uptake estimate differs in magnitude and approach from ours, it offers a valuable point of reference. The air-sea CO2 flux reflects the net oceanic uptake of atmospheric CO2, which is determined by the ultimate fate of fixed carbon (e.g., export, remineralization, or trophic transfer). In contrast, the Fe : C ratio in phytoplankton cells reflects their physiological response to iron enrichment, directly influencing their capacity for photosynthetic carbon fixation. As a portion of the fixed carbon is later released through respiration, remineralization, or physical mixing, estimates based on Fe : C ratios in phytoplankton cells generally exceed the amount of carbon that is ultimately sequestered and captured in net air-sea CO2 fluxes. Although our carbon uptake estimates, based on Fe : C ratios in phytoplankton, may not be directly comparable to the air-sea CO2 flux estimates presented by Mahowald et al. (2010), the two approaches represent different yet complementary stages of the oceanic carbon cycle. Our study focuses on the initial carbon fixation response triggered by dust-borne iron inputs, while Mahowald et al. (2010) evaluated the net carbon sequestration resulting from ocean-atmosphere CO2 exchange. Additionally, their estimate of the influence on marine biogeochemistry was based on the increase of anthropogenic inorganic nitrogen and soluble Fe from atmospheric processing of dust and combustion sources, rather than from dust alone. Westberry et al. (2023) estimated that 2.55 × 10⁻² Pg C yr−1 of primary production was supported by dust deposition onto the ocean. The primary reason for the discrepancies between their results and us depends on the differing methodologies employed. Westberry et al. (2023) employed an observation-based empirical approach, utilizing the Carbon-based Production Model (CbPM) to estimate the net primary production response to dust deposition by comparing ocean color properties during 4 d periods before and after dust events. In contrast, our study aimed to quantify phytoplankton carbon uptake by identifying the contributions of dFe from various dust source regions to the ocean and applying Fe : C ratios in phytoplankton cells. Additionally, the approach used by Westberry et al. (2023) primarily captures short-term biological responses through changes in chlorophyll and phytoplankton carbon biomass, but it does not account for delayed ecosystem feedbacks. As a result, CbPM-based analyses may underestimate longer-term or region-specific productivity enhancements driven by dFe, particularly in HNLC regions where phytoplankton growth is strongly Fe-limited. In such regions, the biological response to atmospheric Fe deposition may be delayed or only weakly evident in short-term changes in ocean color properties. Consequently, empirical models such as CbPM, which rely on brief pre- and post-event comparisons of satellite-derived chlorophyll and phytoplankton carbon, may difficult to fully capture the longer-term or more subtle productivity enhancements induced by dust-borne Fe inputs. Moreover, satellite data are susceptible to atmospheric conditions and cloud cover, and satellite-derived ocean color products often rely on empirical inversion models, which may also contribute to the underestimation of their results. Furthermore, they provided limited insights into the evaluation of dust-induced marine phytoplankton carbon uptake, lacking a detailed analysis of the spatiotemporal variations and sources of this carbon up on a global scale. Our evaluation of marine phytoplankton carbon uptake was based on simulated dust deposition combined with multiple observation datasets, including global distribution of marine Fe solubility, total Fe concentration in the oceans, which would provide diverse perspectives and comprehensive view of marine ecological response to dust emission over the world.
The uncertainty of annual marine phytoplankton carbon uptake due to dust deposition (5.6 ± 0.2 Pg C yr−1) was estimated by interannual variations. The primary uncertainty is the interannual variability in the magnitude of marine dust deposition (approximately 550–600 Tg yr−1) and its spatial distribution. We also utilized dFe concentration data from the Coupled Model Intercomparison Project Phase 6 (CMIP6) to estimate marine phytoplankton carbon uptake driven by dust deposition. Based on dFe concentration data from CESM2 (2000–2014) historical simulations, the estimated marine phytoplankton carbon uptake driven by dust deposition was 2.2 Pg C yr−1, while that from Geophysical Fluid Dynamics Laboratory Earth System Model version 4 (GFDL-ESM4) (2010–2014) was 3.2 Pg C yr−1 (Fig. S13). It is important to note that Equation (4) is based on dissolved iron (dFe) concentrations. Some studies, such as Hamilton et al. (2020) and Bergas-Massó et al. (2023), report data for soluble Fe, which differs substantially from dFe. Specifically, colloidal Fe and complexing capacity – ranging from >200 kDa to <0.2 µm – are inferred from the difference between the dissolved and soluble fractions (Boye et al., 2010). Compared to the estimates derived from observational data, the spatial distributions of marine phytoplankton carbon uptake from CMIP6 models (CESM2 and GFDL-ESM4) show similar global patterns, with high uptake mainly observed in the EA and EI, particularly in the northwestern EI. The use of CESM2 and GFDL-ESM4 dFe data resulted in approximately 61 % and 43 % reductions, respectively, in estimated marine phytoplankton carbon uptake relative to observation-based estimates. For CESM2-based results, the reduction was particularly pronounced in the southern RS, where uptake decreased from 0.4 to 0.1 Pg C yr−1; the western Arabian Sea (in the EI), from 1.8 to 0.5 Pg C yr−1; and the north-central EA, from 2.2 to 0.7 Pg C yr−1 (compare Figs. 6 and S13). For GFDL-ESM4-based results, notable reductions were also observed in the north-central EA (from 2.2 to 0.9 Pg C yr−1) and the western Arabian Sea (from 1.8 to 0.7 Pg C yr−1), whereas an evident increase occurred in the EP, from 0.3 to 0.7 Pg C yr−1 (compare Figs. 6 and S13). Additionally, the uncertainties of the observed dFe data were assessed by comparing the observations with model data from CESM2 and GFDL-ESM4, extracted at the specific grid cells corresponding to the geographic locations of the observations. The results indicate that simulated values are often substantially lower than the observed data. Approximately 7 % of the CESM2-simulated dissolved Fe data are at least ten times lower than the observed values, and about 1 % are more than one hundred times lower. Similarly, about 4 % of the GFDL-ESM4-simulated dFe data are at least ten times lower than the observed values. On average, the dissolved Fe concentrations simulated by CESM2 and GFDL-ESM4 are ∼ 4–5 times lower than the observed values. The discrepancies between observed and simulated dFe can reach up to two orders of magnitude. As an inverse distance weighted interpolation method is used to estimate both Fe solubility and dFe concentrations, the spatial distribution and density of observational sites exert a significant influence on the interpolation results. For Fe solubility, observational data are dense in the EA, which may result in low interpolation uncertainty. In contrast, the central and southern EI are characterized by sparse observations, potentially leading to high interpolation uncertainty. For dFe, observational data are dense in both the EA and NA, supporting relatively accurate interpolation in these regions. In contrast, data scarcity in the southern EI may contribute to increased uncertainty. However, in the EA, where interpolation uncertainty is relatively low due to dense observational coverage, the modeled dFe concentrations significantly underestimate the dust-driven carbon uptake by marine phytoplankton compared to estimates based on observations. Specifically, the estimates based on CESM2 and GFDL-ESM4 are approximately 68 % and 59 % lower, respectively, than those derived from observed dFe data. These findings further underscore the importance of incorporating observational data in the estimation of the contribution of iron deposition to marine phytoplankton carbon uptake. Despite data scarcity and interpolation uncertainties, observation-based constraints substantially correct the underestimation of totally simulations, demonstrably lowering uncertainties in data-rich areas – with critical implications for optimizing future observing systems and observation-based methodologies. Compared with the results obtained using spatially variable parameters, the estimate of marine phytoplankton carbon uptake based on constant values for Fe content in dust (3.5 %), Fe solubility (2 %), and a mean Fe : C ratio of 19.4 µmol Fe mol−1 C in phytoplankton cells is approximately 21 % lower. Using constant values also reduces the spatial variability of the results, leading to a distribution pattern that largely reflects the spatial intensity of dust deposition (Fig. S14). Compared the result with that obtained using unfiltered Fe solubility data, the marine carbon uptake for new growth attributed to dust deposition decreased by 54.1 %, as the largest range of Fe solubility shifted from 50.0 % to 6.0 %. Although uncertainty remains in estimating the marine phytoplankton carbon uptake for new growth attributed to dust deposition, it can still provide a meaningful reflection of potential requirements of phytoplankton, it does provide an observation-based quantification for the specific contributions of dust depositions to marine phytoplankton carbon uptakes.
We incorporated monthly dFe concentration data from CESM2 (2000–2014) and GFDL-ESM4 (2010–2014) historical simulations provided by CMIP6 to complement the sparse observational data, thereby attempting to better capture seasonal variations in marine phytoplankton carbon uptake. The monthly dFe data from CESM2 indicate that the total amount of global marine phytoplankton carbon uptake driven by dust deposition is 0.7 Pg C in summer, followed by 0.6 Pg C in spring, and 0.4 Pg C in both autumn and winter. The monthly dFe data from GFDL-ESM4 show that marine phytoplankton carbon uptake driven by dust deposition is 1.0 Pg C in both spring and summer, and 0.6 Pg C in both autumn and winter. Although the carbon uptake by marine phytoplankton due to dust deposition assessed using CESM2 and GFDL-ESM4 dFe data differed in value across four seasons, the spatial distribution remained relatively consistent (compare Figs. S15 and S16).
In this study, we used data from 514 sites of Fe solubility and 3340 sites of dFe concentration across various oceans to interpolate and calculate the Fe : C ratio in phytoplankton cells. However, the somewhat nonuniform distribution of marine observations across the vast spatial span of the study increases uncertainties in the interpolation of Fe solubility and dFe concentrations. Compared to dFe concentration, there is substantially less data available on the distribution of Fe solubility. More measurements and consistent measurement techniques would aid in the assessment of Fe solubility in the future. We adopt a parameterization scheme from previous studies, assuming a linear relationship between cellular Fe : C ratios and dFe concentrations and using a piecewise linear formula to describe this dependency. However, using this approach to assess global marine phytoplankton carbon uptake in response to Fe supplied by dust deposition has certain limitations. The linear relationship reported in the original experiments was derived from a limited number of phytoplankton species under controlled conditions, and it is uncertain whether it applies universally to all phytoplankton groups across diverse oceanic regions, given the physiological and ecological differences among species. Moreover, the approach we used does not explicitly account for luxury uptake of Fe, in which cells may continue to accumulate intracellular Fe beyond what is required for immediate growth. Ignoring this process introduces uncertainty in the assessment of phytoplankton carbon uptake, particularly during transient high-iron events such as dust deposition, riverine input, or upwelling. We assumed that phytoplankton in both HNLC and LNLC regions might respond to dust deposition as a maximum estimate, considering Fe is particularly important for nitrogen fixing phytoplankton in LNLC regions. However, the phytoplankton growth by dust addition in LNLC regions relies not only on Fe, but also on phosphorus. Therefore, future estimations in LNLC regions should account for other nutrients to achieve more accurate results. The approach used to estimate Fe : C ratios in phytoplankton cells considers not only dust-borne Fe, but also other aerosol sources, such as pyrogenic and anthropogenic emissions, which often contain Fe with high solubility. As a result, applying such ratios to estimate marine phytoplankton carbon uptake driven solely by dust-derived Fe may lead to some degree of overestimation, particularly in remote ocean regions where dust is the predominant or only Fe source. We assumed that every grid where dust deposition occurred over the ocean all responded to its Fe supply to estimate its impact on marine phytoplankton carbon uptake, but this response also depends on phytoplankton distribution and species, potentially leading to an overestimation of the marine ecological response to carbon uptake. Phytoplankton growth is not unlimited with an increase in Fe, which heightens the risk of overestimating the marine ecological response to carbon uptake in high dust regions. Therefore, a reasonable growth threshold should be considered based on further observations and experiments.
The codes used to produce these results are available from the corresponding author upon reasonable request.
GEOTRACES intermediate data is available at https://doi.org/10.5285/ff46f034-f47c-05f9-e053-6c86abc0dc7e (GEOTRACES Intermediate Data Product Group, 2023).
The supplement related to this article is available online at https://doi.org/10.5194/bg-22-6445-2025-supplement.
YL and JZ conceptualized the framework of study. YL constructed the dataset and carried out the statistical analysis under the guidance of JZ YX provided the codes of interpolation, CL, QG and YS interpreted the results and improved figures presentation. PF and CL reviewed the manuscript and experiment. All authors contributed to the writing of the paper.
The contact author has declared that none of the authors has any competing interests.
Publisher's note: Copernicus Publications remains neutral with regard to jurisdictional claims made in the text, published maps, institutional affiliations, or any other geographical representation in this paper. While Copernicus Publications makes every effort to include appropriate place names, the final responsibility lies with the authors. Views expressed in the text are those of the authors and do not necessarily reflect the views of the publisher.
We sincerely thank Zongbo Shi from the School of Geography, Earth and Environmental Sciences, University of Birmingham, for invaluable discussions and constructive insights into this research.
This study was supported by the National Key R&D Plan (grant no. 2022YFE0135000).
This paper was edited by Frédéric Gazeau and reviewed by Joan Llort and one anonymous referee.
Aumont, O. and Bopp, L.: Globalizing results from ocean in situ iron fertilization studies, Glob. Biogeochem. Cycles, 20, https://doi.org/10.1029/2005GB002591, 2006.
Bergas-Massó, E., Ageitos, M. G., Myriokefalitakis, S., Miller, R. L., van Noije, T., Le Sager, P., Pinto, G. M., and García-Pando, C. P.: Pre-Industrial, Present and Future Atmospheric Soluble Iron Deposition and the Role of Aerosol Acidity and Oxalate Under CMIP6 Emissions, Earths Future, 11, e2022EF00335310, https://doi.org/10.1029/2022EF003353, 2023.
Bishop, J. K. B., Davis, R. E., and Sherman, J. T.: Robotic observations of dust storm enhancement of carbon biomass in the North Pacific, Science, 298, 817–821, https://doi.org/10.1126/science.1074961, 2002.
Boyd, P. W. and Ellwood, M. J.: The biogeochemical cycle of iron in the ocean, Nat. Geosci., 3, 675–682, https://doi.org/10.1038/ngeo964, 2010.
Boyd, P. W., Jickells, T., Law, C. S., Blain, S., Boyle, E. A., Buesseler, K. O., Coale, K. H., Cullen, J. J., de Baar, H. J. W., Follows, M., Harvey, M., Lancelot, C., Levasseur, M., Owens, N. P. J., Pollard, R., Rivkin, R. B., Sarmiento, J., Schoemann, V., Smetacek, V., Takeda, S., Tsuda, A., Turner, S., and Watson, A. J.: Mesoscale iron enrichment experiments 1993–2005: Synthesis and future directions, Science, 315, 612–617, https://doi.org/10.1126/science.1131669, 2007.
Boye, M., Nishioka, J., Croot, P., Laan, P., Timmermans, K. R., Strass, V. H., Takeda, S., and de Baar, H. J. W.: Significant portion of dissolved organic Fe complexes in fact is Fe colloids, Mar. Chem., 122, 20–27, https://doi.org/10.1016/j.marchem.2010.09.001, 2010.
Choobari, O. A., Zawar-Reza, P., and Sturman, A.: The global distribution of mineral dust and its impacts on the climate system: A review, Atmos. Res., 138, 152–165, https://doi.org/10.1016/j.atmosres.2013.11.007, 2014.
Dietze, H., Getzlaff, J., and Löptien, U.: Simulating natural carbon sequestration in the Southern Ocean: on uncertainties associated with eddy parameterizations and iron deposition, Biogeosciences, 14, 1561–1576, https://doi.org/10.5194/bg-14-1561-2017, 2017.
Félix-Bermúdez, A., Delgadillo-Hinojosa, F., Torres-Delgado, E. V., and Munoz-Barbosa, A.: Does Sea Surface Temperature Affect Solubility of Iron in Mineral Dust? The Gulf of California as a Case Study, J. Geophys. Res. Oceans., 125, https://doi.org/10.1029/2019JC015999, 2020.
GEOTRACES Intermediate Data Product Group: The GEOTRACES intermediate data product 2021v2 (IDP2021v2), NERC EDS British Oceanographic Data Centre NOC [data set], https://doi.org/10.5285/ff46f034-f47c-05f9-e053-6c86abc0dc7e, 2023.
Ginoux, P., Chin, M., Tegen, I., Prospero, J. M., Holben, B., Dubovik, O., and Lin, S. J.: Sources and distributions of dust aerosols simulated with the GOCART model, J. Geophys. Res. Atmos., 106, 20255–20273, https://doi.org/10.1029/2000JD000053, 2001.
Hamilton, D. S., Moore, J. K., Arneth, A., Bond, T. C., Carslaw, K. S., Hantson, S., Ito, A., Kaplan, J. O., Lindsay, K., Nieradzik, L., Rathod, S. D., Scanza, R. A., and Mahowald, N. M.: Impact of Changes to the Atmospheric Soluble Iron Deposition Flux on Ocean Biogeochemical Cycles in the Anthropocene, Global Biogeochemical Cycles, 34, e2019GB006448, https://doi.org/10.1029/2019GB006448, 2020.
Hamilton, D. S., Perron, M. M. G., Bond, T. C., Bowie, A. R., Buchholz, R. R., Guieu, C., Ito, A., Maenhaut, W., Myriokefalitakis, S., Olgun, N., Rathod, S. D., Schepanski, K., Tagliabue, A., Wagner, R., and Mahowald, N. M.: Earth, Wind, Fire, and Pollution: Aerosol Nutrient Sources and Impacts on Ocean Biogeochemistry, Annu. Rev. Mar. Sci., 14, 303–330, https://doi.org/10.1146/annurev-marine-031921-013612, 2022.
Hamilton, D. S., Baker, A. R., Iwamoto, Y., Gasso, S., Bergas-Masso, E., Deutch, S., Dinasquet, J., Kondo, Y., Llort, J., Myriokefalitakis, S., Perron, M. M. G., Wegmann, A., and Yoon, J.-E.: An aerosol odyssey: Navigating nutrient flux changes to marine ecosystems, Elementa-Sci. Anthrop., 11, https://doi.org/10.1525/elementa.2023.00037, 2023.
Hurrell, J. W., Holland, M. M., Gent, P. R., Ghan, S., Kay, J. E., Kushner, P. J., Lamarque, J. F., Large, W. G., Lawrence, D., Lindsay, K., Lipscomb, W. H., Long, M. C., Mahowald, N., Marsh, D. R., Neale, R. B., Rasch, P., Vavrus, S., Vertenstein, M., Bader, D., Collins, W. D., Hack, J. J., Kiehl, J., and Marshall, S.: The Community Earth System Model A Framework for Collaborative Research, Bull. Am. Meteorol. Soc., 94, 1339–1360, https://doi.org/10.1175/BAMS-D-12-00121.1, 2013.
Ito, A., Myriokefalitakis, S., Kanakidou, M., Mahowald, N. M., Scanza, R. A., Hamilton, D. S., Baker, A. R., Jickells, T., Sarin, M., Bikkina, S., Gao, Y., Shelley, R. U., Buck, C. S., Landing, W. M., Bowie, A. R., Perron, M. M. G., Guieu, C., Meskhidze, N., Johnson, M. S., Feng, Y., Kok, J. F., Nenes, A., and Duce, R. A.: Pyrogenic iron: The missing link to high iron solubility in aerosols, Sci. Adv., 5, https://doi.org/10.1126/sciadv.aau7671, 2019.
Ito, A., Ye, Y., Yamamoto, A., Watanabe, M., and Aita, M. N.: Responses of ocean biogeochemistry to atmospheric supply of lithogenic and pyrogenic iron-containing aerosols, Geol. Mag., 157, 741–756, https://doi.org/10.1017/S0016756819001080, 2020.
Jickells, T. D., An, Z. S., Andersen, K. K., Baker, A. R., Bergametti, G., Brooks, N., Cao, J. J., Boyd, P. W., Duce, R. A., Hunter, K. A., Kawahata, H., Kubilay, N., laRoche, J., Liss, P. S., Mahowald, N., Prospero, J. M., Ridgwell, A. J., Tegen, I., and Torres, R.: Global iron connections between desert dust, ocean biogeochemistry, and climate, Science, 308, 67–71, https://doi.org/10.1126/science.1105959, 2005.
Johnson, M. S. and Meskhidze, N.: Atmospheric dissolved iron deposition to the global oceans: effects of oxalate-promoted Fe dissolution, photochemical redox cycling, and dust mineralogy, Geosci. Model Dev., 6, 1137–1155, https://doi.org/10.5194/gmd-6-1137-2013, 2013.
Journet, E., Desboeufs, K. V., Caquineau, S., and Colin, J.-L.: Mineralogy as a critical factor of dust iron solubility, Geophys. Res. Lett., 35, https://doi.org/10.1029/2007GL031589, 2008.
Kanakidou, M., Myriokefalitakis, S., and Tsigaridis, K.: Aerosols in atmospheric chemistry and biogeochemical cycles of nutrients, Environ. Res. Lett., 13, https://doi.org/10.1088/1748-9326/aabcdb, 2018.
Kobayashi, H., Oka, A., Yamamoto, A., and Abe-Ouchi, A.: Glacial carbon cycle changes by Southern Ocean processes with sedimentary amplification, Sci. Adv., 7, https://doi.org/10.1126/sciadv.abg7723, 2021.
Kok, J. F., Adebiyi, A. A., Albani, S., Balkanski, Y., Checa-Garcia, R., Chin, M., Colarco, P. R., Hamilton, D. S., Huang, Y., Ito, A., Klose, M., Leung, D. M., Li, L., Mahowald, N. M., Miller, R. L., Obiso, V., Pérez García-Pando, C., Rocha-Lima, A., Wan, J. S., and Whicker, C. A.: Improved representation of the global dust cycle using observational constraints on dust properties and abundance, Atmos. Chem. Phys., 21, 8127–8167, https://doi.org/10.5194/acp-21-8127-2021, 2021.
Kurisu, M., Sakata, K., Nishioka, J., Obata, H., Conway, T. M., Hunt, H. R., Sieber, M., Suzuki, K., Kashiwabara, T., Kubo, S., Takada, M., and Takahashi, Y.: Source and fate of atmospheric iron supplied to the subarctic North Pacific traced by stable iron isotope ratios, Geochim. Cosmochim. Acta., 378, 168–185, https://doi.org/10.1016/j.gca.2024.06.009, 2024.
Lambert, F., Delmonte, B., Petit, J. R., Bigler, M., Kaufmann, P. R., Hutterli, M. A., Stocker, T. F., Ruth, U., Steffensen, J. P., and Maggi, V.: Dust-climate couplings over the past 800,000 years from the EPICA Dome C ice core, Nature, 452, 616–619, https://doi.org/10.1038/nature06763, 2008.
Li, W., Xu, L., Liu, X., Zhang, J., Lin, Y., Yao, X., Gao, H., Zhang, D., Chen, J., Wang, W., Harrison, R. M., Zhang, X., Shao, L., Fu, P., Nenes, A., and Shi, Z.: Air pollution-aerosol interactions produce more bioavailable iron for ocean ecosystems, Sci. Adv., 3, https://doi.org/10.1126/sciadv.1601749, 2017.
Longo, A. F., Feng, Y., Lai, B., Landing, W. M., Shelley, R. U., Nenes, A., Mihalopoulos, N., Violaki, K., and Ingall, E. D.: Influence of Atmospheric Processes on the Solubility and Composition of Iron in Saharan Dust, Environ. Sci. Technol., 50, 6912–6920, https://doi.org/10.1021/acs.est.6b02605, 2016.
Lough, A. J. M., Tagliabue, A., Demasy, C., Resing, J. A., Mellett, T., Wyatt, N. J., and Lohan, M. C.: Tracing differences in iron supply to the Mid-Atlantic Ridge valley between hydrothermal vent sites: implications for the addition of iron to the deep ocean, Biogeosciences, 20, 405–420, https://doi.org/10.5194/bg-20-405-2023, 2023.
Mahowald, N.: Aerosol Indirect Effect on Biogeochemical Cycles and Climate, Science, 334, 794–796, https://doi.org/10.1126/science.1207374, 2011.
Mahowald, N. M. and Luo, C.: A less dusty future?, Geophys. Res. Lett., 30, 1903, https://doi.org/10.1029/2003GL017880, 2003.
Mahowald, N. M., Baker, A. R., Bergametti, G., Brooks, N., Duce, R. A., Jickells, T. D., Kubilay, N., Prospero, J. M., and Tegen, I.: Atmospheric global dust cycle and iron inputs to the ocean, Global Biogeochem. Cycles, 19, https://doi.org/10.1029/2004GB002402, 2005.
Mahowald, N. M., Muhs, D. R., Levis, S., Rasch, P. J., Yoshioka, M., Zender, C. S., and Luo, C.: Change in atmospheric mineral aerosols in response to climate: Last glacial period, preindustrial, modern, and doubled carbon dioxide climates, J. Geophys. Res. Atmos., 111, https://doi.org/10.1029/2005JD006653, 2006.
Mahowald, N. M., Engelstaedter, S., Luo, C., Sealy, A., Artaxo, P., Benitez-Nelson, C., Bonnet, S., Chen, Y., Chuang, P. Y., Cohen, D. D., Dulac, F., Herut, B., Johansen, A. M., Kubilay, N., Losno, R., Maenhaut, W., Paytan, A., Prospero, J. A., Shank, L. M., and Siefert, R. L.: Atmospheric Iron Deposition: Global Distribution, Variability, and Human Perturbations, Annu. Rev. Mar. Sci., 1, 245–278, https://doi.org/10.1146/annurev.marine.010908.163727, 2009.
Mahowald, N. M., Kloster, S., Engelstaedter, S., Moore, J. K., Mukhopadhyay, S., McConnell, J. R., Albani, S., Doney, S. C., Bhattacharya, A., Curran, M. A. J., Flanner, M. G., Hoffman, F. M., Lawrence, D. M., Lindsay, K., Mayewski, P. A., Neff, J., Rothenberg, D., Thomas, E., Thornton, P. E., and Zender, C. S.: Observed 20th century desert dust variability: impact on climate and biogeochemistry, Atmos. Chem. Phys., 10, 10875–10893, https://doi.org/10.5194/acp-10-10875-2010, 2010.
Mahowald, N. M., Scanza, R., Brahney, J., Goodale, C. L., Hess, P. G., Moore, J. K., and Neff, J.: Aerosol Deposition Impacts on Land and Ocean Carbon Cycles, Curr. Clim. Change Rep., 3, 16–31, https://doi.org/10.1007/s40641-017-0056-z, 2017.
Matrin, J. H.: Glacial-interglacial CO2 change: the iron hypothesis, Paleoceanography, 5, 1–13, https://doi.org/10.1029/PA005i001p00001, 1990.
Mills, M. M., Ridame, C., Davey, M., La Roche, J., and Geider, R. J.: Iron and phosphorus co-limit nitrogen fixation in the eastern tropical North Atlantic, Nature, 429, 292–294, https://doi.org/10.1038/nature02550, 2004.
Moore, C. M., Mills, M. M., Arrigo, K. R., Berman-Frank, I., Bopp, L., Boyd, P. W., Galbraith, E. D., Geider, R. J., Guieu, C., Jaccard, S. L., Jickells, T. D., La Roche, J., Lenton, T. M., Mahowald, N. M., Maranon, E., Marinov, I., Moore, J. K., Nakatsuka, T., Oschlies, A., Saito, M. A., Thingstad, T. F., Tsuda, A., and Ulloa, O.: Processes and patterns of oceanic nutrient limitation, Nat. Geosci., 6, 701–710, https://doi.org/10.1038/NGEO1765, 2013.
Myriokefalitakis, S., Daskalakis, N., Mihalopoulos, N., Baker, A. R., Nenes, A., and Kanakidou, M.: Changes in dissolved iron deposition to the oceans driven by human activity: a 3-D global modelling study, Biogeosciences, 12, 3973–3992, https://doi.org/10.5194/bg-12-3973-2015, 2015.
Myriokefalitakis, S., Ito, A., Kanakidou, M., Nenes, A., Krol, M. C., Mahowald, N. M., Scanza, R. A., Hamilton, D. S., Johnson, M. S., Meskhidze, N., Kok, J. F., Guieu, C., Baker, A. R., Jickells, T. D., Sarin, M. M., Bikkina, S., Shelley, R., Bowie, A., Perron, M. M. G., and Duce, R. A.: Reviews and syntheses: the GESAMP atmospheric iron deposition model intercomparison study, Biogeosciences, 15, 6659–6684, https://doi.org/10.5194/bg-15-6659-2018, 2018.
Myriokefalitakis, S., Bergas-Massó, E., Gonçalves-Ageitos, M., Pérez García-Pando, C., van Noije, T., Le Sager, P., Ito, A., Athanasopoulou, E., Nenes, A., Kanakidou, M., Krol, M. C., and Gerasopoulos, E.: Multiphase processes in the EC-Earth model and their relevance to the atmospheric oxalate, sulfate, and iron cycles, Geosci. Model Dev., 15, 3079–3120, https://doi.org/10.5194/gmd-15-3079-2022, 2022.
Neale, R. B., Gettelman, A., Park, S., Chen, C.-C., Lauritzen, P. H., Williamson, D. L., Conley, A. J., Kinnison, D., Marsh, D., Smith, A. K., Vitt, F. M., Garcia, R., Lamarque, J.-F., Mills, M. J., Tilmes, S., Morrison, H., Cameron-Smith, P., Collins, W. D., Iacono, M. J., Easter, R. C., Liu, X., Ghan, S. J., Rasch, P. J., and Taylor, M. A.: Description of the NCAR Community Atmosphere Model (CAM 5.0), UCAR/NCAR – Library, https://n2t.net/ark:/85065/d7s46whd (last access: 2 November 2025), 2012.
Okin, G. S., Baker, A. R., Tegen, I., Mahowald, N. M., Dentener, F. J., Duce, R. A., Galloway, J. N., Hunter, K., Kanakidou, M., Kubilay, N., Prospero, J. M., Sarin, M., Surapipith, V., Uematsu, M., and Zhu, T.: Impacts of atmospheric nutrient deposition on marine productivity: Roles of nitrogen, phosphorus, and iron, Glob. Biogeochem. Cycles, 25, https://doi.org/10.1029/2010GB003858, 2011.
Oleson, W., Lawrence, M., Bonan, B., Flanner, G., Kluzek, E., Lawrence, J., Levis, S., Swenson, C., Thornton, E., Dai, A., Decker, M., Dickinson, R., Feddema, J., Heald, L., Hoffman, F., Lamarque, J., Mahowald, N., Niu, G., Qian, T. T., Randerson, J., Running, S., Sakaguchi, K., Slater, A., Stöckli, R., Wang, A. H., Yang, Z. L., Zeng, X., and Zeng, X.: Technical Description of version 4.0 of the Community Land Model (CLM) (No. NCAR/TN-478+STR), University Corporation for Atmospheric Research, https://doi.org/10.5065/D6FB50WZ, 2010.
Patra, P. K., Moore, J. K., Mahowald, N., Uematsu, M., Doney, S. C., and Nakazawa, T.: Exploring the sensitivity of interannual basin-scale air-sea CO2 fluxes to variability in atmospheric dust deposition using ocean carbon cycle models and atmospheric CO2 inversions, J. Geophys. Res. Biogeosciences, 112, https://doi.org/10.1029/2006JG000236, 2007.
Pavia, F. J., Anderson, R. F., Winckler, G., and Fleisher, M. Q.: Atmospheric Dust Inputs, Iron Cycling, and Biogeochemical Connections in the South Pacific Ocean from Thorium Isotopes, Glob. Biogeochem. Cycles, 34, https://doi.org/10.1029/2020GB006562, 2020.
Poulton, S. W. and Raiswell, R.: The low-temperature geochemical cycle of iron: From continental fluxes to marine sediment deposition, Am. J. Sci., 302, 774–805, https://doi.org/10.2475/ajs.302.9.774, 2002.
Raiswell, R. and Canfield, D. E.: The iron biogeochemical cycle past and present, Geochem. Perspect., 1, 1–220, https://doi.org/10.7185/geochempersp.1.1, 2012.
Scanza, R. A., Hamilton, D. S., Perez Garcia-Pando, C., Buck, C., Baker, A., and Mahowald, N. M.: Atmospheric processing of iron in mineral and combustion aerosols: development of an intermediate-complexity mechanism suitable for Earth system models, Atmos. Chem. Phys., 18, 14175–14196, https://doi.org/10.5194/acp-18-14175-2018, 2018.
Schlitzer, R., Anderson, R. F., Dodas, E. M., Lohan, M., Geibere, W., Tagliabue, A., Bowie, A., Jeandel, C., Maldonado, M. T., Landing, W. M., Cockwell, D., Abadie, C., Abouchami, W., Achterberg, E. P., Agather, A., Aguliar-Islas, A., van Aken, H. M., Andersen, M., Archer, C., Auro, M., de Baar, H. J., Baars, O., Baker, A. R., Bakker, K., Basak, C., Baskaran, M., Bates, N. R., Bauch, D., van Beek, P., Behrens, M. K., Black, E., Bluhm, K., Bopp, L., Bouman, H., Bowman, K., Bown, J., Boyd, P., Boye, M., Boyle, E. A., Branellec, P., Bridgestock, L., Brissebrat, G., Browning, T., Bruland, K. W., Brumsack, H.-J., Brzezinski, M., Buck, C. S., Buck, K. N., Buesseler, K., Bull, A., Butler, E., Cai, P., Camara Mor, P., Cardinal, D., Carlson, C., Carrasco, G., Casacuberta, N., Casciotti, K. L., Castrillejo, M., Chamizo, E., Chance, R., Charette, M. A., Chaves, J. E., Cheng, H., Chever, F., Christl, M., Church, T. M., Closset, I., Colman, A., Conway, T. M., Cossa, D., Croot, P., Cullen, J. T., Cutter, G. A., Daniels, C., Dehairs, F., Deng, F., Dieu, H. T., Duggan, B., Dulaquais, G., Dumousseaud, C., Echegoyen-Sanz, Y., Edwards, R. L., Ellwood, M., Fahrbach, E., Fitzsimmons, J. N., Flegal, A. R., Fleisher, M. Q., van de Flierdt, T., Frank, M., Friedrich, J., Fripiat, F., Froellje, H., Galer, S. J. G., Gamo, T., Ganeshram, R. S., Garcia-Orellana, J., Garcia-Solsona, E., Gault-Ringold, M., George, E., Gerringa, L. J. A., Gilbert, M., Godoy, J. M., Goldstein, S. L., Gonzalez, S. R., Grissom, K., Hammerschmidt, C., Hartman, A., Hassler, C. S., Hathorne, E. C., Hatta, M., Hawco, N., Hayes, C. T., Heimburger, L.-E., Helgoe, J., Heller, M., Henderson, G. M., Henderson, P. B., van Heuven, S., Ho, P., Horner, T. J., Hsieh, Y.-T., Huang, K.-F., Humphreys, M. P., Isshiki, K., Jacquot, J. E., Janssen, D. J., Jenkins, W. J., John, S., Jones, E. M., Jones, J. L., Kadko, D. C., Kayser, R., Kenna, T. C., Khondoker, R., Kim, T., Kipp, L., Klar, J. K., Klunder, M., Kretschmer, S., Kumamoto, Y., Laan, P., Labatut, M., Lacan, F., Lam, P. J., Lambelet, M., Lamborg, C. H., Le Moigne, F. A. C., Le Roy, E., Lechtenfeld, O. J., Lee, J.-M., Lherminier, P., Little, S., Lopez-Lora, M., Lu, Y., Masque, P., Mawji, E., McClain, C. R., Measures, C., Mehic, S., Menzel Barraqueta, J.-L., van der Merwe, P., Middag, R., Mieruch, S., Milne, A., Minami, T., Moffett, J. W., Moncoiffe, G., Moore, W. S., Morris, P. J., Morton, P. L., Nakaguchi, Y., Nakayama, N., Niedermiller, J., Nishioka, J., Nishiuchi, A., Noble, A., Obata, H., Ober, S., Ohnemus, D. C., van Ooijen, J., O'Sullivan, J., Owens, S., Pahnke, K., Paul, M., Pavia, F., Pena, L. D., Petersh, B., Planchon, F., Planquette, H., Pradoux, C., Puigcorbe, V., Quay, P., Queroue, F., Radic, A., Rauschenberg, S., Rehkamper, M., Rember, R., Remenyi, T., Resing, J. A., Rickli, J., Rigaud, S., Rijkenberg, M. J. A., Rintoul, S., Robinson, L. F., Roca-Marti, M., Rodellas, V., Roeske, T., Rolison, J. M., Rosenberg, M., Roshan, S., van der Loaff, M. M. R., Ryabenko, E., Saito, M. A., Salt, L. A., Sanial, V., Sarthou, G., Schallenberg, C., Schauer, U., Scher, H., Schlosser, C., Schnetger, B., Scott, P., Sedwick, P. N., Semiletov, I., Shelley, R., Sherrell, R. M., Shiller, A. M., Sigman, D. M., Singh, S. K., Slagter, H. A., Slater, E., Smethie, W. M., Snaith, H., Sohrin, Y., Sohst, B., Sonke, J. E., Speich, S., Steinfeldt, R., Stewart, G., Stichel, T., Stirling, C. H., Stutsman, J., Swarr, G. J., Swift, J. H., Thomas, A., Thorne, K., Till, C. P., Till, R., Townsend, A. T., Townsend, E., Tuerena, R., Twining, B. S., Vance, D., Velazquez, S., Venchiarutti, C., Villa-Alfageme, M., Vivancos, S. M., Voelker, A. H. L., Wake, B., Warner, M. J., Watson, R., van Weerlee, E., Weigand, M. A., Weinstein, Y., Weiss, D., Wisotzki, A., Woodward, E. M. S., Wu, J., Wu, Y., Wuttig, K., Wyatt, N., Xiang, Y., Xie, R. C., Xue, Z., Yoshikawa, H., Zhang, J., Zhang, P., Zhao, Y., Zheng, L., Zheng, X.-Y., Zieringer, M., Zimmer, L. A., Ziveri, P., Zunino, P., and Zurbrick, C.: The GEOTRACES Intermediate Data Product 2017, CHEMICAL GEOLOGY, 493, 210–223, https://doi.org/10.1016/j.chemgeo.2018.05.040, 2018.
Shaked, Y., Kustka, A. B., and Morel, F. M. M.: A general kinetic model for iron acquisition by eukaryotic phytoplankton, Limnol. Oceanogr., 50, 872–882, https://doi.org/10.4319/lo.2005.50.3.0872, 2005.
Shi, Z., Krom, M. D., Bonneville, S., Baker, A. R., Jickells, T. D., and Benning, L. G.: Formation of Iron Nanoparticles and Increase in Iron Reactivity in Mineral Dust during Simulated Cloud Processing, Environ. Sci. Technol, 43, 6592–6596, https://doi.org/10.1021/es901294g, 2009.
Shi, Z., Krom, M. D., Jickells, T. D., Bonneville, S., Carslaw, K. S., Mihalopoulos, N., Baker, A. R., and Benning, L. G.: Impacts on iron solubility in the mineral dust by processes in the source region and the atmosphere: A review, Aeolian Res., 5, 21–42, https://doi.org/10.1016/j.aeolia.2012.03.001, 2012.
Shi, Z. B., Woodhouse, M. T., Carslaw, K. S., Krom, M. D., Mann, G. W., Baker, A. R., Savov, I., Fones, G. R., Brooks, B., Drake, N., Jickells, T. D., and Benning, L. G.: Minor effect of physical size sorting on iron solubility of transported mineral dust, Atmos. Chem. Phys., 11, 8459–8469, https://doi.org/10.5194/acp-11-8459-2011, 2011a.
Shi, Z., Krom, M. D., Bonneville, S., Baker, A. R., Bristow, C., Drake, N., Mann, G., Carslaw, K., McQuaid, J. B., Jickells, T., and Benning, L. G.: Influence of chemical weathering and aging of iron oxides on the potential iron solubility of Saharan dust during simulated atmospheric processing, Global Biogeochem. Cycles, 25, https://doi.org/10.1029/2010GB003837, 2011b.
Shoenfelt, E. M., Winckler, G., Annett, A. L., Hendry, K. R., and Bostick, B. C.: Physical Weathering Intensity Controls Bioavailable Primary Iron (II) Silicate Content in Major Global Dust Sources, Geophys. Res. Lett., 46, 10854–10864, https://doi.org/10.1029/2019GL084180, 2019.
Spolaor, A., Vallelonga, P., Cozzi, G., Gabrieli, J., Varin, C., Kehrwald, N., Zennaro, P., Boutron, C., and Barbante, C.: Iron speciation in aerosol dust influences iron bioavailability over glacial-interglacial timescales, Geophys. Res. Lett., 40, 1618–1623, https://doi.org/10.1002/grl.50296, 2013.
Struve, T., Longman, J., Zander, M., Lamy, F., Winckler, G., and Pahnke, K.: Systematic changes in circumpolar dust transport to the Subantarctic Pacific Ocean over the last two glacial cycles, Proc. Natl. Acad. Sci. U.S.A., 119, https://doi.org/10.1073/pnas.2206085119, 2022.
Sunda, W. G. and Huntsman, S. A.: Iron uptake and growth limitation in oceanic and coastal phytoplankton, Mar. Chem., 50, 189–206, https://doi.org/10.1016/0304-4203(95)00035-P, 1995.
Tagliabue, A., Aumont, O., DeAth, R., Dunne, J. P., Dutkiewicz, S., Galbraith, E., Misumi, K., Moore, J. K., Ridgwell, A., Sherman, E., Stock, C., Vichi, M., Voelker, C., and Yool, A.: How well do global ocean biogeochemistry models simulate dissolved iron distributions?, Global Biogeochem. Cycles, 30, 149–174, https://doi.org/10.1002/2015GB005289, 2016.
Tagliabue, A., Bowie, A. R., Boyd, P. W., Buck, K. N., Johnson, K. S., and Saito, M. A.: The integral role of iron in ocean biogeochemistry, Nature, 543, 51–59, https://doi.org/10.1038/nature21058, 2017.
Tegen, I., Werner, M., Harrison, S. P., and Kohfeld, K. E.: Relative importance of climate and land use in determining present and future global soil dust emission, Geophys. Res. Lett., 31, https://doi.org/10.1029/2003GL019216, 2004.
Trapp, J. M., Millero, F. J., and Prospero, J. M.: Trends in the solubility of iron in dust-dominated aerosols in the equatorial Atlantic trade winds: Importance of iron speciation and sources, Geochem. Geophys. Geosy., 11, https://doi.org/10.1029/2009GC002651, 2010.
Twining, B. S., Rauschenberg, S., Morton, P. L., and Vogt, S.: Metal contents of phytoplankton and labile particulate material in the North Atlantic Ocean, Prog. Oceanogr., 137, 261–283, https://doi.org/10.1016/j.pocean.2015.07.001, 2015.
Wang, N. and Zhang, Y.: Long-term variations of global dust emissions and climate control, Environ. Pollut., 340, https://doi.org/10.1016/j.envpol.2023.122847, 2024.
Watson, A. J., Bakker, D. C. E., Ridgwell, A. J., Boyd, P. W., and Law, C. S.: Effect of iron supply on Southern Ocean CO2 uptake and implications for glacial atmospheric CO2, Nature, 407, 730–733, https://doi.org/10.1038/35037561, 2000.
Westberry, T. K., Behrenfeld, M. J., Shi, Y. R., Yu, H., Remer, L. A., and Bian, H.: Atmospheric nourishment of global ocean ecosystems, Science, 380, 515–519, https://doi.org/10.1126/science.abq5252, 2023.
Wiseman, N. A., Moore, J. K., Twining, B. S., Hamilton, D. S., and Mahowald, N. M.: Acclimation of phytoplankton Fe:C ratios dampens the biogeochemical response to varying atmospheric deposition of soluble iron, Global Biogeochem. Cycles, 37, https://doi.org/10.1029/2022GB007491, 2023.
Wolff, E. W., Barbante, C., Becagli, S., Bigler, M., Boutron, C. F., Castellano, E., de Angelis, M., Federer, U., Fischer, H., Fundel, F., Hansson, M., Hutterli, M., Jonsell, U., Karlin, T., Kaufmann, P., Lambert, F., Littot, G. C., Mulvaney, R., Roethlisberger, R., Ruth, U., Severi, M., Siggaard-Andersen, M. L., Sime, L. C., Steffensen, J. P., Stocker, T. F., Traversi, R., Twarloh, B., Udisti, R., Wagenbach, D., and Wegner, A.: Changes in environment over the last 800,000 years from chemical analysis of the EPICA Dome C ice core, Quat. Sci. Rev., 29, 285–295, https://doi.org/10.1016/j.quascirev.2009.06.013, 2010.
Zender, C. S., Bian, H. S., and Newman, D.: Mineral Dust Entrainment and Deposition (DEAD) model: Description and 1990s dust climatology, J. Geophys. Res. Atmos., 108, https://doi.org/10.1029/2002JD002775, 2003.
Zhang, C., Yao, X., Chen, Y., Chu, Q., Yu, Y., Shi, J., and Gao, H.: Variations in the phytoplankton community due to dust additions in eutrophication, LNLC and HNLC oceanic zones, Sci. Total Environ., 669, 282–293, https://doi.org/10.1016/j.scitotenv.2019.02.068, 2019.
Zhang, Y., Mahowald, N., Scanza, R. A., Journet, E., Desboeufs, K., Albani, S., Kok, J. F., Zhuang, G., Chen, Y., Cohen, D. D., Paytan, A., Patey, M. D., Achterberg, E. P., Engelbrecht, J. P., and Fomba, K. W.: Modeling the global emission, transport and deposition of trace elements associated with mineral dust, Biogeosciences, 12, 5771–5792, https://doi.org/10.5194/bg-12-5771-2015, 2015.
Zheng, Y., Zhao, T., Che, H., Liu, Y., Han, Y., Liu, C., Xiong, J., Liu, J., and Zhou, Y.: A 20-year simulated climatology of global dust aerosol deposition, Sci. Total Environ., 557, 861–868, https://doi.org/10.1016/j.scitotenv.2016.03.086, 2016.
Ziegler, M., Diz, P., Hall, I. R., and Zahn, R.: Millennial-scale changes in atmospheric CO2 levels linked to the Southern Ocean carbon isotope gradient and dust flux, Nat. Geosci., 6, 457–461, https://doi.org/10.1038/NGEO1782, 2013.