the Creative Commons Attribution 4.0 License.
the Creative Commons Attribution 4.0 License.
 | 18 Nov 2025
Dissolved organic carbon dynamics in a changing ocean: an ESM2M-COBALTv2 coupled model analysis
Aaron Wienkers
Charlotte Laufkötter
Dissolved organic carbon (DOC) constitutes a major component of the marine carbon cycle, yet its present contributions to carbon export, and the response to future climate change remain poorly constrained. Using ESM2M-COBALTv2 – GFDL's ocean biogeochemistry model COBALTv2 coupled to the ESM2M Earth System Model – we evaluate present-day DOC distribution and export and project their responses to a high-emission future scenario RCP8.5 to the year 2100.
Our model reproduces well the observed large-scale DOC patterns, with highest concentrations (70–80 µmol C kg−1) in subtropical gyres and lower values (40–50 µmol C kg−1) in subpolar and equatorial upwelling regions. Biological DOC production and remineralization rates are highest in nutrient-rich upwelling zones. The net DOC produced is then transported to the stratified oligotrophic gyres where DOC accumulates, thereby forming the observed global DOC distribution. Present-day global DOC export at 100 m is estimated at 1.6 Pg C yr−1, accounting for about 19 % of the total organic carbon (TOC) export modeled at that depth. By 1000 m, DOC export decreases sharply to 0.09 Pg C yr−1, solely because microbial remineralization removes a significant fraction of DOC as it descends deeper into the water column. At 100 m, globally integrated mixing-mediated export is nearly twice that of advection, especially in boundary current regions and subpolar gyres where strong seasonal mixing occurs, whereas advection dominates in subtropical gyres via large-scale subduction of accumulated DOC. At 1000 m, however, advection dominates, particularly in the North Atlantic where deep-water formation facilitates DOC export. Under future warming, intensified stratification and reduced nutrient supply drive a net decline in global DOC production. Nevertheless, upper-ocean DOC concentrations increase slightly, underscoring the continued importance of physical transport in redistributing DOC. The model projects a 6 % reduction in DOC export at 100 m, driven primarily by weakened mixing, and a 25 % reduction in advection-dominated deep export at 1000 m depth.
- Article
(13794 KB) - Full-text XML
- BibTeX
- EndNote


Dissolved organic carbon (DOC) constitutes one of the largest pools of bioreactive carbon in the ocean. Its vast inventory is approximated at 662 Pg C, comparable to the quantity of inorganic carbon in the atmosphere (Carlson and Hansell, 2015; Hansell et al., 2009). DOC plays an important role in the biogeochemical carbon cycling, and while the majority of modeling studies has focused on particulate organic carbon (POC) in the context of export production, DOC is estimated to contribute 20 % to total organic carbon (TOC) export (Hansell et al., 2009). However, this estimate comes with considerable uncertainties given the vast range in contemporary POC export estimates (Henson et al., 2022; Laufkötter et al., 2016; Bopp et al., 2013). Compounding this, the mechanisms behind DOC cycling and export – and their response to climate change – remain poorly constrained.
The predominant source of DOC is the extracellular release of photosynthate and other metabolites by phytoplankton (Carlson and Hansell, 2015). Complementary biochemical mechanisms affecting the DOC pool include (i) grazing and excretion by zooplankton and higher predators (Moran et al., 2022; Strom et al., 1997); (ii) release of cellular material via cell lysis by bacteria and vira (Lønborg et al., 2013; Keller and Hood, 2011; Middelboe and Lyck, 2002); and (iii) solubilization of POC to DOC by bacteria (Jiao et al., 2010; Nagata et al., 2000). The primary sink of DOC occurs through bacterial remineralization into dissolved inorganic carbon. These processes are profoundly influenced by ocean warming, both directly, through its impact on physiology and metabolic rates, and indirectly, through enhanced water-column stratification and ensuing decreased nutrient supply (Sallée et al., 2021; Bopp et al., 2013). Several studies have demonstrated that warming and elevated CO2 levels enhance primary production, which, in turn, increases the release of DOC. This process is often accompanied by a larger proportion of organic matter being released in dissolved form rather than as particulate organic matter (Flanjak et al., 2022; Novak et al., 2018; Kim et al., 2011). This shift has implications for trophic structure and carbon export, as POC and DOC have distinct roles in the ecosystem and are exported by different mechanisms. However, reduced nutrient availability, driven by increased stratification, is expected to decrease overall primary production and consequently limit the production of both DOC and POC. Additionally, as respiration rates rise with warming, the rapid utilization of DOC by microbial consumers – often referred to as the strengthening of the microbial loop – may counteract DOC accumulation (Lønborg et al., 2020).
The likelihood and timing of DOC being either remineralized or accumulated and exported are governed by its lability. DOC lability largely depends on its chemical composition, as well as environmental conditions, including abiotic factors and ecosystem composition (e.g., prokaryotic diversity) (Lønborg et al., 2020; Wagner et al., 2020). As a result, DOC is conventionally divided into different pools based on turnover times: labile (hours to days), semi-labile (weeks to months), semi-refractory (years to decades), and refractory (millennia). Labile DOC is very reactive and it serves as an easily available substrate for heterotrophic bacterial production, thereby not playing a significant role in carbon export. Semi-labile, semi-refractory, and refractory DOC, because of their slower turnover times, can accumulate and are susceptible to export to the deeper ocean.
Identifying the processes driving DOC dynamics and understanding their responses to future climate change holds relevance for improving constraints of the marine carbon cycle. Global ocean biogeochemical models are potent tools enabling analyses of carbon cycle across a range of spatial and temporal scales, including its responses to past and future climate changes. However, DOC export and dynamics, and their responses to future climate change, have been sparsely investigated in model studies. Available studies have primarily estimated DOC export under contemporary ocean conditions (Nowicki et al., 2022; Roshan and DeVries, 2017; Hansell et al., 2009), with some considerations of how the expansion of subtropical gyres – where DOC contributes to up to half of TOC export – might influence overall carbon export dynamics (Roshan and DeVries, 2017). The relative roles of advection and mixing in driving DOC export, as well as their potential future changes, remain largely unexplored in an Earth System Model (ESM).
The only existing estimate of a potential future reduction in DOC export, reported by Sreeush et al. (2024), projects a 4 % decrease below 100 m by 2100 under SSP3-7.0 scenario. However, it lacks an analysis of the underlying physical and biogeochemical drivers or a regional breakdown. To our knowledge, no studies have explicitly and comprehensively analyzed responses of DOC export, including its drivers and mechanisms, within a future climate projection using a fully coupled ESM. This leaves a significant gap in our understanding of the role of DOC in carbon cycling under climate change. By addressing this gap, we enhance constraints and advance our knowledge of the marine carbon cycle in a warming climate.
In this study, we examine DOC dynamics and export under present and future climate conditions in reference to the high-emission scenario RCP8.5. To this end, we analyze simulation output from the Carbon, Ocean Biogeochemistry and Lower Trophics version 2 (COBALTv2) model (Stock et al., 2020) embedded into the the Modular Ocean Model version 5 (MOM5) of the fully coupled Geophysical Fluid Dynamics Laboratory Earth System Model version 2M (GFDL ESM2M) (Dunne et al., 2012).
2.1 Physical model configuration
The GFDL ESM2M is a fully coupled ESM comprising integrated components representing the atmosphere, ocean, land, and sea ice, coupled through the Flexible Modeling System (FMS) infrastructure to conserve energy, mass, and tracer fluxes across component boundaries.
The physical ocean component (MOM5) utilises a tripolar horizontal grid with a nominal resolution of 1° increasing zonally to ° near the equator. The vertical discretisation consists of 50 levels with thickness increasing from 5 m at the surface to 170 m in the abyssal ocean. The model uses a rescaled vertical coordinate (z∗) which adjusts cell thickness with variations in sea surface height. MOM5 simulates ocean circulation through resolved dynamics and parametrised subgrid-scale processes, including mesoscale eddy-induced advection (Gent-McWilliams scheme), neutral diffusion, and vertical mixing processes. Vertical mixing is represented through a constant background diffusivity augmented by a tidal mixing parametrisation and the K-profile parametrisation (KPP) for boundary layer mixing. The model resolves the advection of physical and biogeochemical tracers using the MDPPM numerical scheme. The atmospheric component consists of the Atmospheric Model version 2 (AM2) with a horizontal resolution of 2° × 2.5° and 24 vertical pressure levels. The sea ice component (SIS) shares the same horizontal grid as the ocean component and employs a three-layer thermodynamic model for sea ice. The land component implements the Land Model version 3.0 (LM3.0), which simulates water, energy, and carbon cycling between vegetation and soil.
2.2 Biogeochemical model configuration
2.2.1 Ecosystem dynamics
The COBALTv2 model uses 33-tracers to simulate global scale dynamics of carbon, nitrogen, phosphorus, iron, and oxygen. It models the dynamics of a plankton food web organized by size and functional types into three classes of phytoplankton, three classes of zooplankton and a group of heterotrophic free-living bacteria. Phytoplankton types are represented as small, large, and diazotrophic phytoplankton. The distinction between small and large phytoplankton corresponds to an equivalent spherical diameter of about 10 µm, while diazotrophs are parameterized as Trichodesmium cyanobacteria. Phytoplankton take up nutrients only in inorganic form, including nitrate (NO3), ammonium (NH4), phosphate (PO4), dissolved inorganic iron (Fe) and silicate (SiO4). The uptake of NO3 and NH4 is modeled after O'Neill et al. (1989) where the presence of NH4 inhibits NO3 uptake and similarly, the presence of NO3 inhibits NH4 uptake. Diazotrophs combine N2-fixation and, if available, dissolved inorganic nitrogen to meet their nitrogen requirement (Holl and Montoya, 2005). Silica is only taken up by large phytoplankton. The uptake of nutrients is modeled after Michalis-Menten kinetics, assigning significantly lower half-saturation constants to small phytoplankton to represent the benefits of higher surface area to volume ratio in nutrient uptake. Nutrient and light co-limit photosynthesis, based on the formulation from Geider et al. (1997). Small phytoplankton exhibit greater chlorophyll-specific light absorption rates compared to large phytoplankton, attributed to their higher surface area to volume ratio. Nutrient limitation is modeled after Liebig's Law of the Minimum (von Liebig, 1840). The elemental ratios of phytoplankton are fixed but slightly diverge from Redfield ratio: small phytoplankton exhibit an N:P ratio of 20:1, diazotrophs 40:1, and large phytoplankton 12:1. Zooplankton are represented by three size-based classes: small, medium, and large zooplankton. Small zooplankton graze on bacteria and small phytoplankton, medium zooplankton graze on diazotrophs, large phytoplankton, and small zooplankton, and large zooplankton graze on diazotrophs, large phytoplankton, and medium zooplankton. Medium and large zooplankton are consumed by an implicit higher trophic-level predator. Zooplankton biomass-specific grazing rates decrease as their size increases (Hansen et al., 1994). Grazing follows a Holling's Type II functional response, incorporating density-dependent prey selection. Grazing half-saturation constants are the same for all of the zooplankton classes but calibrated against observed global patterns of phytoplankton biomass. Bacteria take up labile dissolved organic carbon. They are consumed by small zooplankton and subjected to implicit density-dependent mortality due to vira. Temperature-sensitive biological processes, namely phytoplankton nutrient uptake and growth, zooplankton grazing, bacterial uptake of DOC, are modeled after Eppley (1971) formulation: T=ekT, where T is the temperature in °C, and k temp is the temperature scaling factor, set to 0.063 °C−1. This value corresponds to a Q10 of 1.88, indicating that reaction rates nearly double for every 10 °C increase in temperature. The development of the model was carried out and described in detail, together with additional ecosystem equations, by Stock et al. (2020).
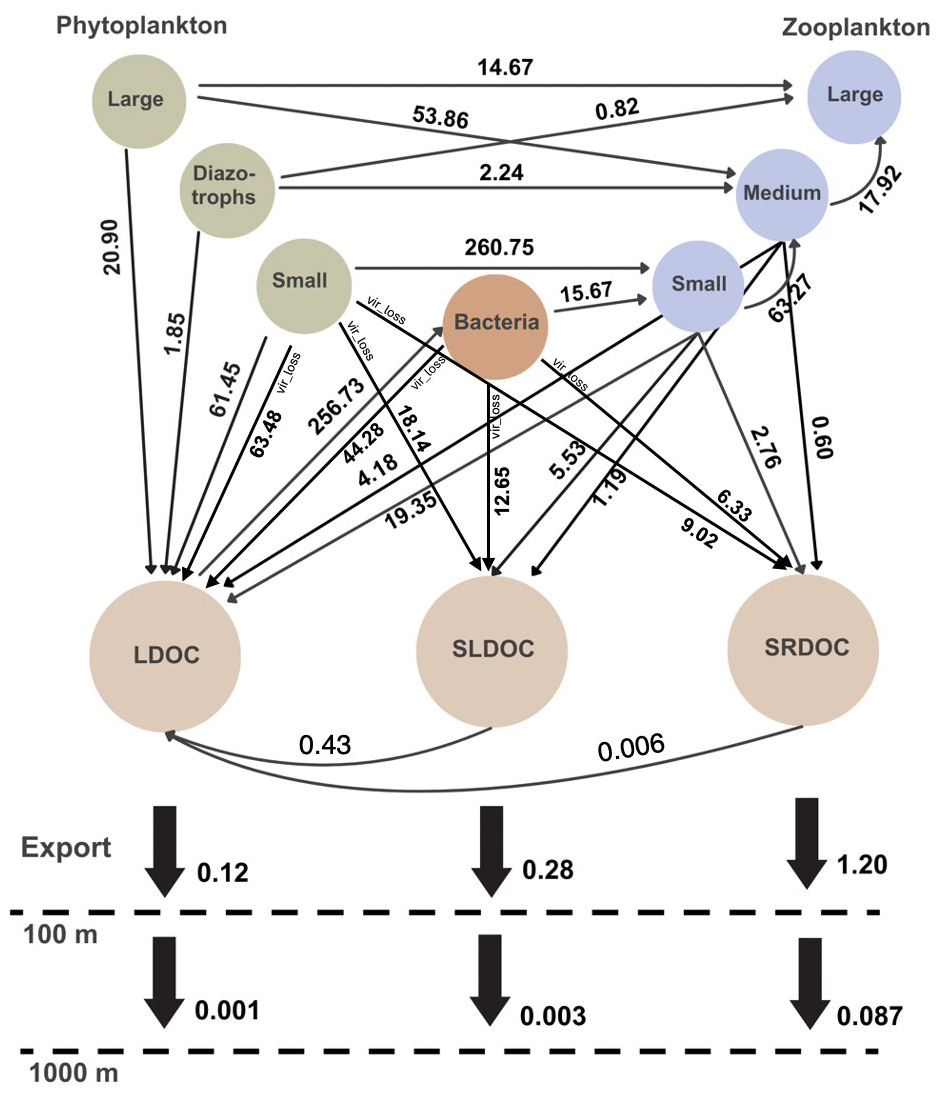
Figure 1Globally integrated DOC fluxes and grazing fluxes between food-web components in COBALTv2. Fluxes represent annual averages for 1990–2010, integrated over the upper 100 m. Viral losses denoted vir_loss. SLDOC and SRDOC decay fluxes computed from pool sizes and first-order rates. DOC export at 100 and 1000 m via corresponding pools shown. Units: Pg C yr−1.
2.2.2 DOC fluxes
Although nitrogen is the central currency of the model, the fixed ratio within the model allows us to translate the dissolved organic matter results into carbon terms, i.e., DOC. The main fluxes affecting DOC pools are quantified as present-day (1990–2010) averages and illustrated in Fig. 1. Hereon, future averages and future changes refer to the 2080–2000 period. DOC is categorized into three pools based on its lability: semi-refractory, semi-labile, and labile DOC. Labile DOC is the fast-reacting pool, taken up by bacteria and remineralized into inorganic carbon and nutrients. This pool is also the only temperature-sensitive DOC pool, as its remineralization depends on bacterial metabolism, which is modeled to have a temperature dependency (as described in the previous paragraph). Semi-labile DOC decays over seasonal timescales, while semi-refractory DOC decays over annual to decadal timescales, both ultimately decaying into the labile DOC pool. The refractory component is represented by a background of 42 µmol of DOC. Due to its millennial turnover timescales, its dynamics are not expected to significantly influence the shorter timescales analyzed in this study. Net primary production (NPP) is the primary source of organic matter in the system. The fraction of NPP exuded as labile DOC is constant at 13 %. Zooplankton egest 30 % of what they graze on, while the rest is assimilated. Egested organic matter is partitioned between particulate (detritus) and dissolved organic matter, depending on the zooplankton size class. Partitioning of egested organic matter to DOC is modeled to be for small zooplankton, for medium zooplankton, where the dissolved matter is then distributed among labile (70 %), semi-labile (20 %) and semi-refractory (10 %) DOC pools. Egestion of large zooplankton results in particulate detritus only. Small zooplankton and bacteria are subjected to constant losses due to viruses (viral infections), both resulting in 20 % of their respective production directed to DOC pools. For small zooplankton, the fractionation between labile, semi-labile, and semi-refractory DOC is 70 %, 20 %, and 10 %, while for bacteria it is 65 %, 20 %, and 15 %, respectively. Semi-labile and semi-refractory DOC decays into labile DOC by rates of 0.01 d−1 and 0.1 years−1, according to their typical turnover timescales. The pool of highest reactivity, labile DOM, is taken up and remineralized by bacteria. The riverine input contributes a combined 0.22 Pg C yr−1 of dissolved inorganic and organic carbon, with the latter comprising labile, semi-labile, and semi-refractory DOC (Stock et al., 2020).
To quantify the physical transport mechanisms of DOC, we extracted the vertical advective and turbulent mixing fluxes directly from the MOM5 ocean model component using a Finite Volume Method. For advective fluxes, the volume flux across each cell face is multiplied by the DOC concentration of the donor cell, capturing both horizontal and vertical transport. Turbulent mixing fluxes are derived from the internal physical mixing model, which includes vertical diffusion, K-profile parameterisation, and additional subgrid-scale processes (Dunne et al., 2012). DOC export at specified depth horizons (100 and 1000 m) is calculated by identifying the cell edge closest to the target depth and accumulating the exact flux through that level as a diagnostic at the model's output frequency. This method captures both downward and upward DOC transport; negative flux values indicate net upward movement (e.g., due to upwelling or turbulent mixing). The Finite Volume implementation ensures exact budget closure to machine precision, thereby enabling a precise separation of advective and mixing contributions to DOC export within each fixed-depth control volume.
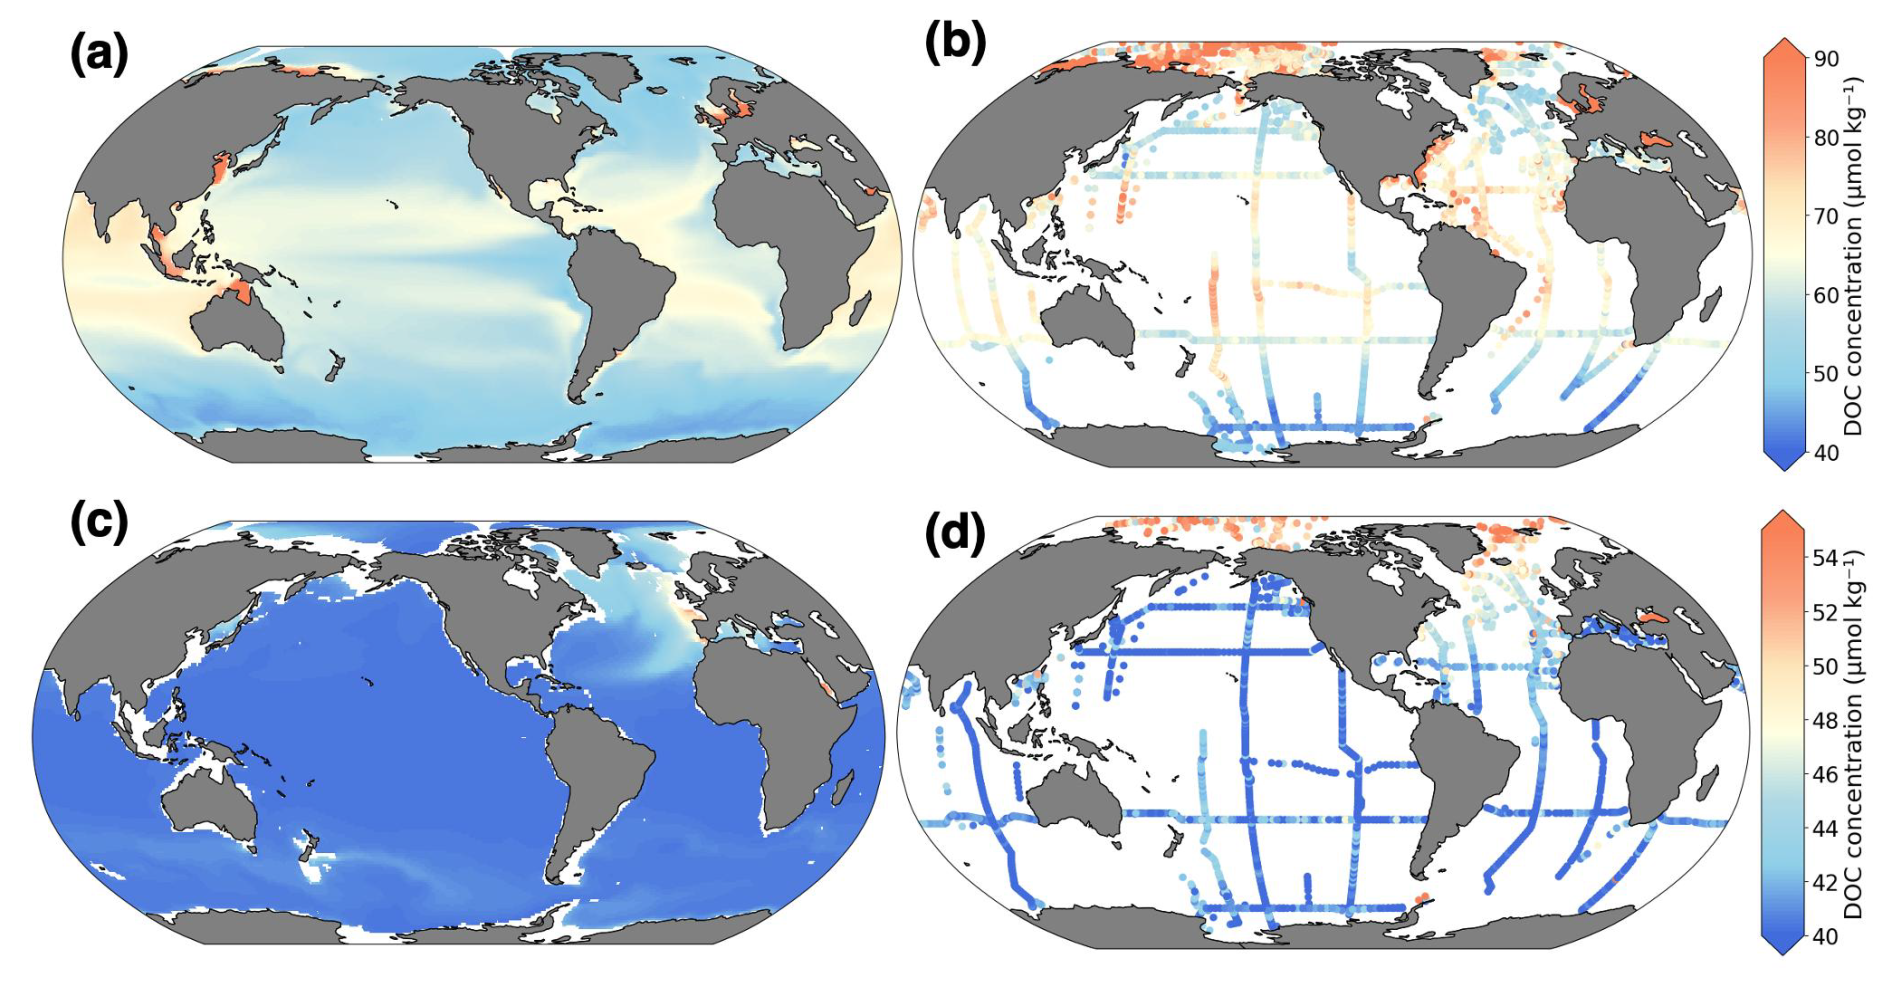
Figure 2Comparison of present-day modeled average DOC concentrations with observational data. (a, c) model; (b, d) observations from Hansell et al. (2021). Top (a, b): 0–100 m average; bottom (c, d): 990–1100 m average. Units: µmol C kg−1.
2.2.3 Tuning
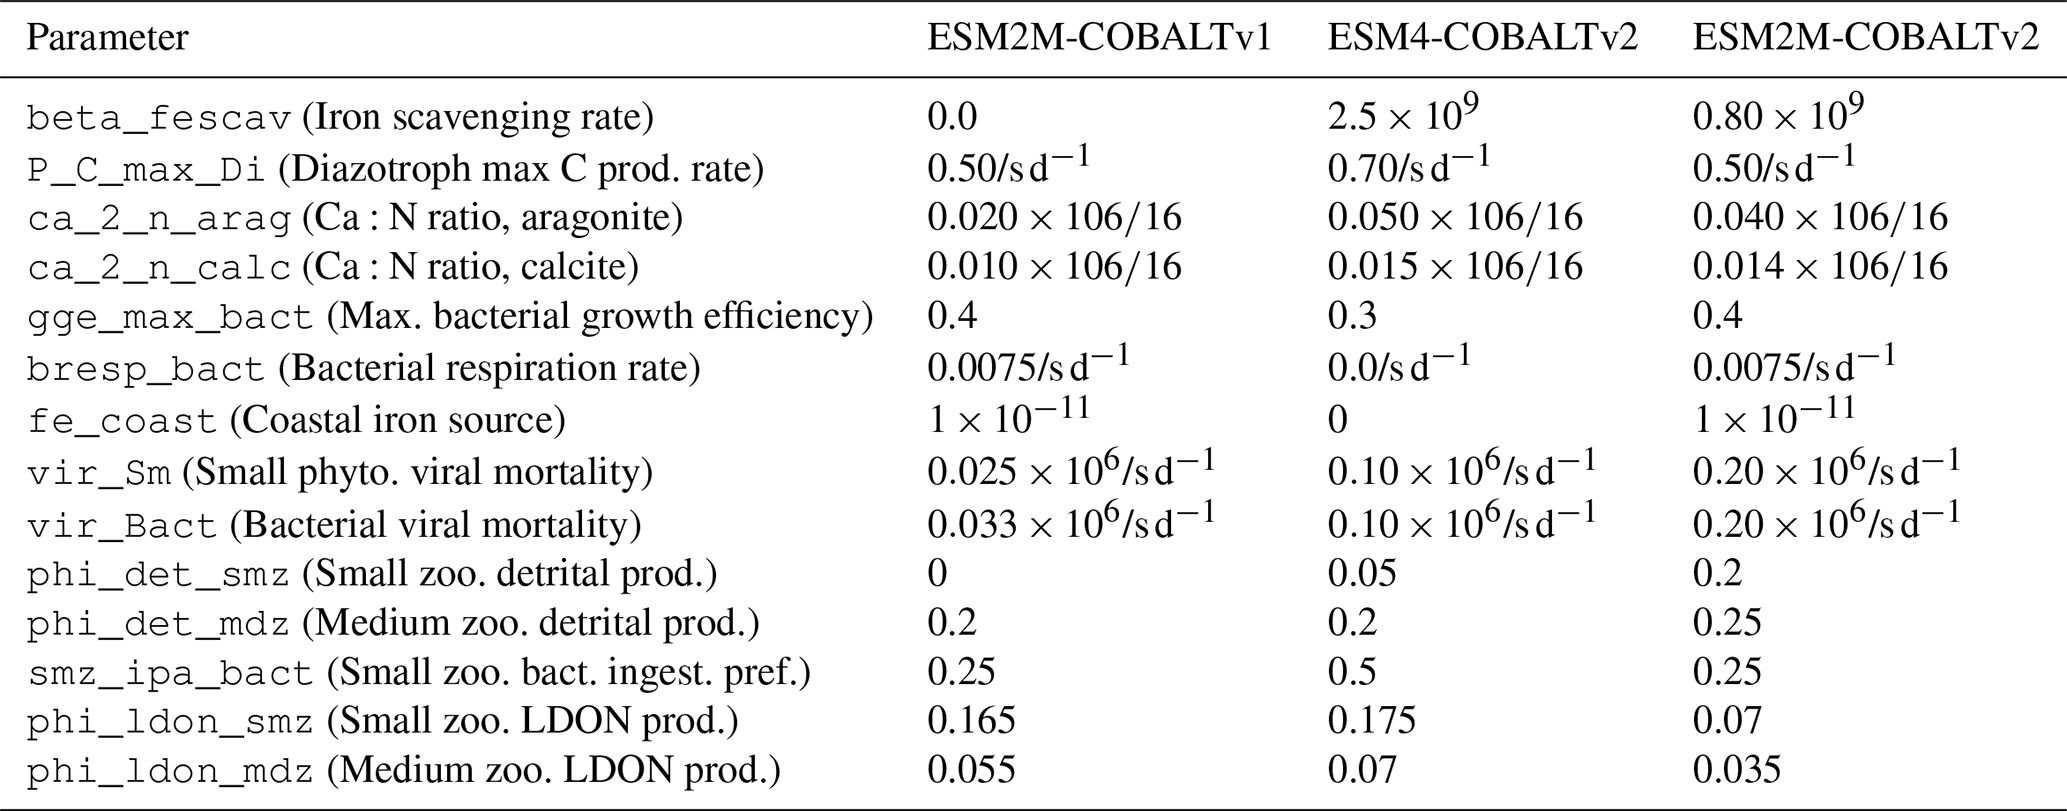
COBALTv2 was designed and tuned within the GFDL-ESM4.1 (Stock et al., 2020), driven by the MOM6 physical ocean model. To account for the resulting physical model differences compared to MOM5 within ESM2M (e.g. resolution and grid diffusivity and the follow-on influence on the large-scale physical circulation and transport fields), the biogeochemical model parameterisations were re-calibrated following the methodology established in Stock et al. (2020). Key biogeochemical free parameters were adjusted to achieve agreement with observational constraints including global primary production, ecosystem community composition, nutrient distribution/limitation, and carbon and nitrogen system variables. We summarize the key tuning differences in Table A1 in the Appendix, which lists the parameters that were adjusted and their values across model versions.
2.3 Simulation protocol
The simulation protocol followed the CMIP5 experimental design with modifications specific to our biogeochemical analysis. Each simulation was initialised from a 500 year pre-industrial spin-up of the updated COBALTv2 implementation, which consequently began from the equilibrated 1000 year pre-industrial spin-up run at GFDL as part of the CMIP5 submission. This statistical equilibrium of the coupled physical–biogeochemical system was evidenced by the globally integrated DOC inventory trends below 0.01 % per decade.
From this pre-industrial statistical equilibrium, we subsequently conducted simulations for three periods: (1) a land use spin-up (1700–1860) with preindustrial radiative forcing but time-varying land use changes; (2) a historical period (1860–2010) with observed atmospheric greenhouse gas concentrations, aerosol forcing, solar variability, and volcanic eruptions; and (3) a future projection phase (2010–2100) following the RCP8.5 high-emission scenario. A pre-industrial control simulation from the same initial conditions, integrating from 1700–2100 was also run alongside these experiments for comparison.
3.1 Present-day DOC distribution and comparison with observations
The modeled present-day DOC distribution in the upper 100 m of the ocean and corresponding observational data are presented in Fig. 2a and c. Highest DOC concentrations of 70–80 µmol C kg−1 are simulated in subtropical and tropical ocean regions, with lower concentrations of 40–50 µmol C kg−1 in subpolar regions and parts of equatorial upwelling zones. The simulated distribution shows broad consistency with observed values and patterns, as evidenced by a spatial correlation of 0.73, a small bias of −1.08 µmol C kg−1, and an rmse of 20.88 µmol C kg−1. At 1000 m depth, the model simulates low DOC concentrations of 40 µmol C kg−1 across most of the ocean, with higher concentrations of up to 50 µmol C kg−1 in the North Atlantic (Fig. 2c,d).
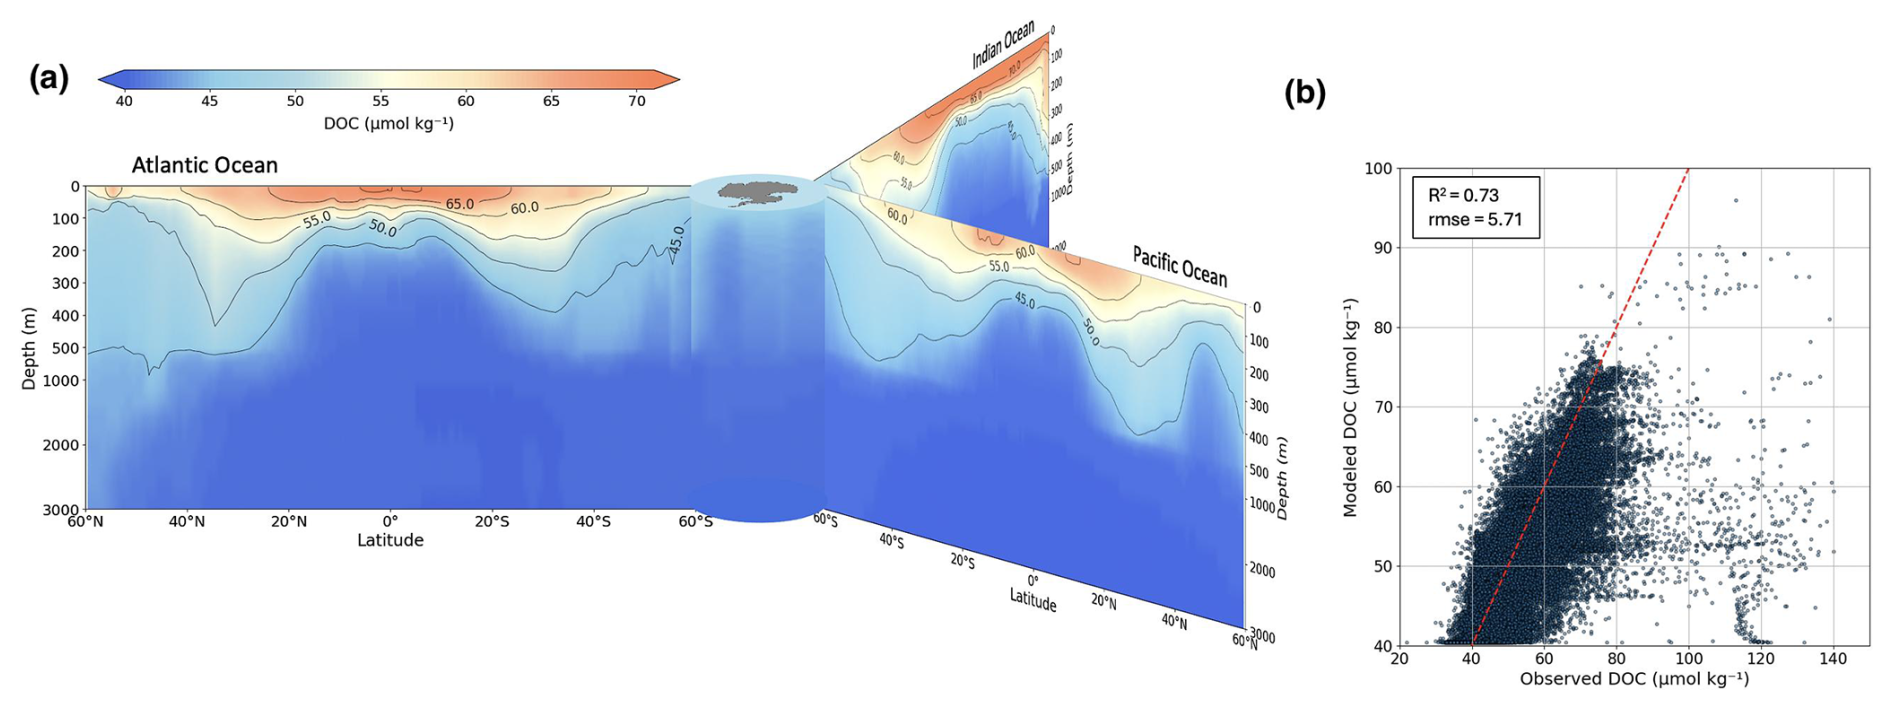
Figure 3Distribution of modeled DOC across depth via latitudinal transects (a) and model–observation comparison (b). Transects are 1990–2010 model output with isopycnals. Scatter uses Hansell et al. (2021) observations; includes 1:1 line and .
A comparison with other state-of-the-art biogeochemistry models indicates that the DOC distribution simulated by ESM2M-COBALTv2 is comparable to or outperforms that of other models. A thorough evaluation of DOC patterns by Stock et al. (2020) in the original configuration of COBALTv2, coupled to the CMIP6-generation model ESM4.1, similarly reveals strong agreement between modeled and observed DOC data. Comparable agreements are reported using other biogeochemical models, such as CESM2, where Sreeush et al. (2024) demonstrate a reasonable fit with observations. Lennartz et al. (2024) used a modified ESM incorporating macronutrient co-limitation on DOC uptake, thereby achieving a spatial correlation of R2= 0.55 for the surface ocean and R2= 0.75 when integrated over depth. Our model integrates temperature and multi-nutrient dependencies, providing an additional mechanistic layer to capture DOC cycling dynamics.
An area with significant disagreement between observations and model data is the Arctic, where observations show much higher values. This discrepancy can be attributed to several factors. Riverine inputs play a crucial role in Arctic DOC dynamics, with highly seasonal variability. More than 90 % of the annual river discharge into the Arctic Ocean occurs between May and June, with DOC concentrations increasing in tandem with increased water flow, leading to a peak in early summer (Fouest et al., 2013; Dittmar and Kattner, 2003; Cauwet and Sidorov, 1996). Observations are typically collected during this ice-free season, resulting in a temporal bias toward capturing the highest DOC concentrations. In contrast, the model (ESM2M-COBALTv2) does not dynamically resolve the riverine DOC contributions and their seasonality, but model uses prescribed, climatological concentrations for river carbonate constituents, thus only resolves the temporal variability of river DOC contributions due to freshwater variability but not due to DOC concentrations.
The present-day distribution of DOC in the ocean is a result of different drivers at play, including the main biological controls of DOC concentration and content, as well as the physical transport of DOC. DOC is largely generated in the high productivity zones of the surface ocean such as equatorial upwelling region and in the high latitudes, e.g., along western boundary currents, from where it is largely remineralized as well, and the net DOC is transported by ocean currents to subtropical gyres where it accumulates reaching the described high concentrations (Najjar et al., 2007). The subtropical ocean is highly stratified and the input of nutrients, including upward mixing and upwelling, is very limited leading to low productivity, both in terms of primary production and bacterial production. The distribution at 1000 m depth reveals low concentrations in vast ocean areas, with contrasting high concentration occurring in North Atlantic where the DOC-rich subtropical waters are transported via deep convection into the deep-water formation zone.
Figure 3a shows latitudinal transects of the Atlantic, Pacific, and Indian Oceans, based on model data, highlighting the accumulation of DOC in the centers of subtropical gyres across the three major ocean basins. DOC concentrations reach average values of about 65–70 µmol C kg−1 in the gyre centers. Concurrently, isopycnal surfaces deepen in the gyre centers, indicating waters with higher DOC concentration propagating into depth. This can be explained by the convergence of seawater in the centers of the gyres, where at the surface DOC accumulates and is downwelled further to depth due to negative Ekman pumping (Levy et al., 2013). In these areas, isopycnal surfaces indicating DOC values of ≥ 45 µmol C kg−1 extend towards mesopelgaic depths of 400–500 m. A deep-water formation zone feature is observed around 60°N in the Atlantic, where a localized area of higher DOC concentration extends deeper than surrounding regions.

Figure 4Present-day depth-integrated biological sources and sinks of DOC (0–100 m) and projected future changes. (a) DOC production (phytoplankton exudation, zooplankton egestion, viral losses); (c) remineralization; (b, d) future minus present.
3.2 Biological sources and sinks as primary constraints on DOC concentration and distribution
DOC source processes that are hereafter called DOC production processes include phytoplankton exudation (∼ 40 % of the total DOC production), zooplankton egestion (∼ 10 % of total DOC production), and viral losses (∼ 50 % of total DOC production). These relative contributions to DOC production hardly change over the simulation period. Highest DOC production rates take place in the equatorial upwelling zones where well-mixed waters bring a lot of nutrients enabling high productivity of the system (Fig. 4a). Due to similar mechanisms, high DOC production rates also arise along western boundary currents and in some coastal areas. The lowest DOC production zones are found in the stratified oligotrophic subtropical gyres and high-nutrient-low-chlorophyll zones, such as vast parts of Southern Ocean. The only modeled DOC sink is remineralization by heterotrophic bacteria. As bacterial communities graze on DOC and are also co-limited by nutrient availability, remineralization rates exhibit a similar spatial distribution to DOC production (Fig. 4c). However, production and remineralization processes are not tightly coupled due to variations in the lability of DOC, implicitly capturing biochemical and physicochemical factors that prevent bacterial communities from fully depleting DOC. While labile DOC is largely consumed by bacteria in the upper ocean, semi-labile and semi-refractory DOC contribute to longer-term DOC accumulation. This decoupling results in areas of net positive DOC production. The spatial distribution of net DOC production is illustrated in Fig. 4e. This pattern closely aligns with biologically productive regions (Fig. 4a, c). The equatorial Pacific region stands out as a hotspot of DOC production, exceeding 1.5 . Other productive areas of the ocean are equatorial upwelling regions in general, and temperate ocean that exhibit a highly seasonal cycle in productivity. Ocean currents then distribute this accumulated DOC, shaping the global distribution pattern observed in Fig. 2. We further explore and focus on the role of ocean circulation in shaping large-scale DOC dynamics in the Sect. 3.4.
Our DOC production pattern mirrors that of another ESM (Sreeush et al., 2024) and aligns closely with the pattern described by Hansell and Carlson (2001), but differs significantly from a DOC restoring approach by Roshan and DeVries (2017). The authors restore DOC in a circulation model to a neural network-derived global DOC estimate, bypassing biogeochemical feedbacks. In their model, net DOC production is high in the subtropical gyres and low in the equatorial upwelling area. These high subtropical net DOC production rates (reaching ∼ 15 ) are surprising given the strong nutrient scarcity that limits biological production in these regions. Our modeled net DOC production average for subtropical gyres (∼ 2 ) appears to align more closely with established biogeochemical expectations.
On the one hand, the fast surface currents of the equatorial Pacific require small time steps to be able to distinguish between production within the gyres and transport into the gyres. The 1 year timestep used by the transport matrix in the Roshan and DeVries (2017) study may falsely assign fast transport of DOC into the gyres to DOC production within the gyres.
On the other hand, some of the assumptions underlying DOC dynamics in COBALTv2 may require further refinement. To replicate their pattern in a fully-coupled marine biogeochemistry model, one would need to allow small pico/nanoplankton in the subtropical gyres to produce longer-lived semi-labile or semi-refractory DOC, and require larger plankton in upwelling areas to produce very little or short-lived DOC.
The projected future change in DOC production and remineralization (Fig. 3b and d) reveal distinct regional responses to environmental changes. North Atlantic shows a pronounced decrease in both DOC production and remineralization (blue regions, approximately −0.3 to −0.5 ). The equatorial Pacific displays a band of decreased biological DOC cycling (encompassing both production and bacterial remineralization), which could be related to changes in upwelling intensity or nutrient availability. A notable hotspot of increased DOC cycling (red regions, +0.3 to +0.5 ) appears in the South Atlantic gyre along the Benguela current, indicating intensification of biological activity in this region. The Southern Ocean exhibits a mixed response, with large areas showing decreased rates of biological DOC cycling.
Globally integrated DOC production rates show interannual variability but exhibit an overall steady decline of −2.4 Tg C yr−1. This decrease is likely driven by warming-induced stratification and reduced nutrient supply (Appendix, Fig. A2), which are key factors influencing biological DOC production. Remineralization rates, meanwhile, decline at a slower rate of −1.3 Tg C yr−1, possibly reflecting a mismatch between bacterial activity and primary production responses to rising upper ocean temperatures and associated physicochemical changes. Large areas of the ocean show significant mixed-layer shoaling, particularly pronounced in the Southern Ocean and North Atlantic where changes exceed 40 m (Appendix, Fig. A2). This widespread shoaling of the mixed layer could restrict the extent of vertical mixing and nutrient supply to the surface ocean, potentially explaining the projected decline in DOC production rates −2.4 Tg C yr−1). However, some regions like parts of the equatorial Pacific show mixed-layer deepening, suggesting regional variations in the factors controlling upper ocean structure.
These projected trends highlight the interplay between physical and biogeochemical drivers in shaping DOC dynamics under a future climate scenario. In interpreting these results, it is important to consider how certain model assumptions may influence the robustness of future projections. Our modeled distribution of DOC and other relevant biogeochemical variables aligns well with present-day observations (Fig. 2; Appendix, Fig. A1), although temperature-sensitive remineralization is currently applied only to labile DOC. Semi-labile and semi-refractory DOC pools use empirically based constant decay rates reflecting current conditions, so future temperature effects are partially captured through remineralization into labile DOC. These decay rates follow first-order kinetics representing net removal, thereby implicitly combining production and consumption processes. While suitable for analysis of present-day cycling, this formulation may introduce uncertainty in future projections. Ongoing model development aims to include environmentally sensitive decay rates for these pools to improve projection robustness. Similarly, DOC production ratios are prescribed as fixed values derived from empirical data and do not vary with environmental conditions. Although short-term environmental stress can transiently increase e.g., DOC exudation, such plastic responses are energetically costly and unlikely to persist over the multi-decadal timescales relevant to climate change. Evolutionary adaptation is expected to favor more efficient carbon allocation, supporting the use of fixed production ratios as a pragmatic approximation, which we note as an area for future refinement.
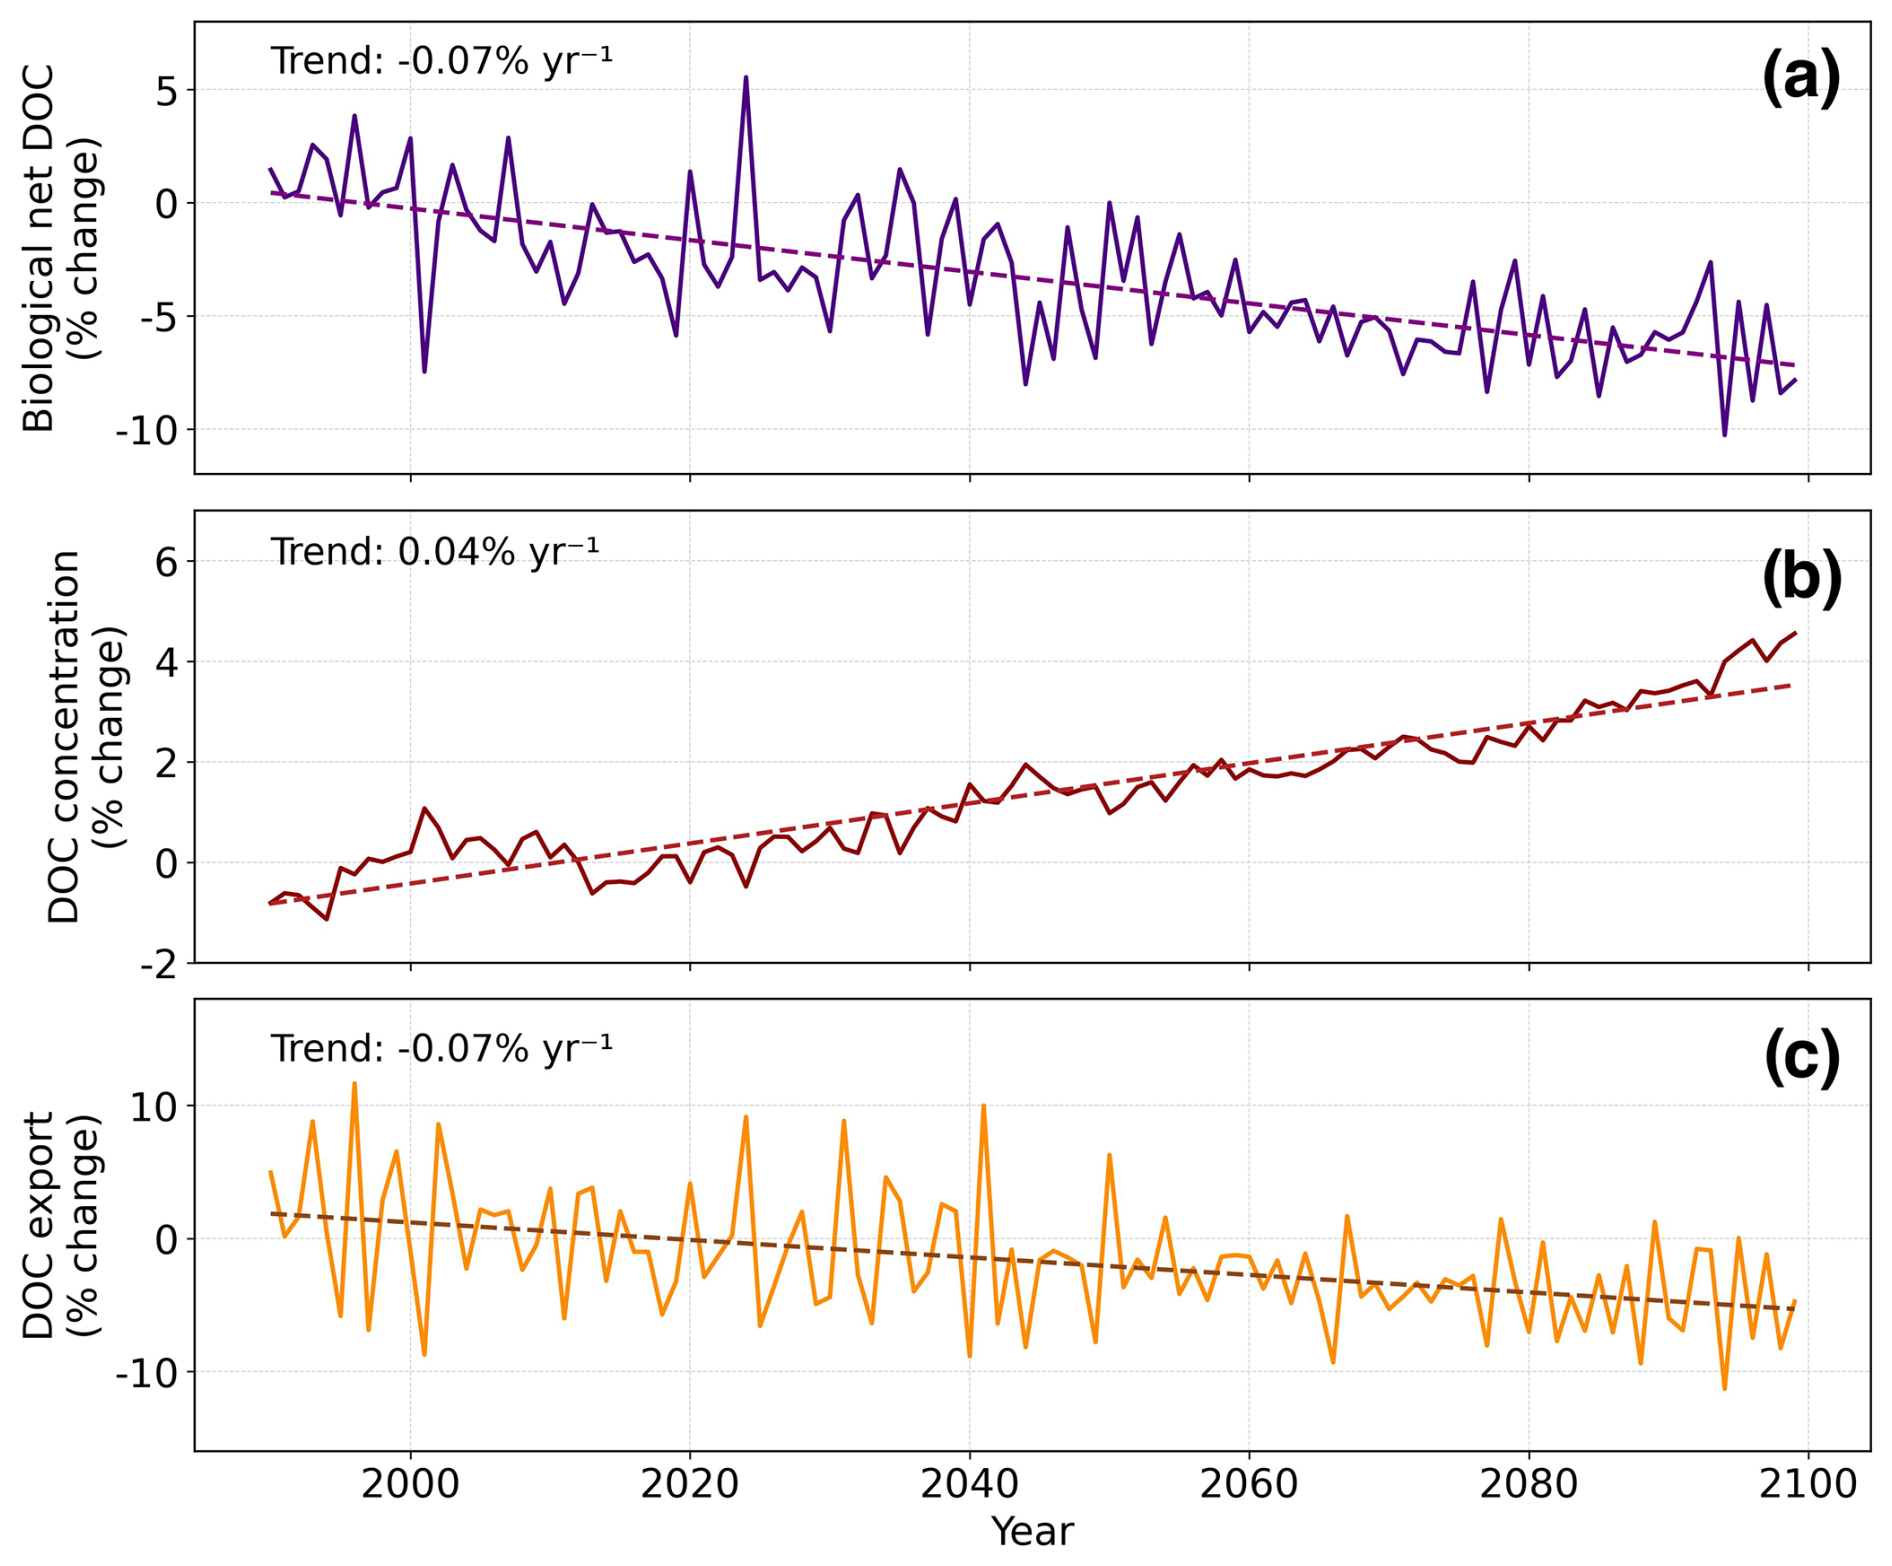
Figure 5Time series linking biological constraints to physical DOC export (1990–2100). (a) Net DOC production (sources–sink) over 0–100 m; (b) DOC concentration (0–100 m); (c) DOC export across 100 m. Expressed as % change relative to 1990–2010 mean; linear trends as dashed lines.
3.3 Linking biological constraints to physical DOC export
Isolating the trends of decreasing DOC production and a slower-decreasing remineralization (at approximately half the rate of production) reveals an overall decline in global net DOC production (calculated as the difference between production processes and remineralization; Fig. 5a). Yet, DOC concentration is simulated to increase in vast parts of the surface ocean (Fig. 5b). Ocean circulation plays a crucial role in redistributing and exporting DOC, significantly influencing its overall distribution, and concentration in the water column. When accounting for all fluxes affecting DOC, including advection- and mixing-mediated export (hereafter referred to as DOC export), and constant riverine input, upper 100 m DOC concentration shows an increasing trend of 0.04 % yr−1 (Fig. 5b).
DOC export through 100 m depth, on the other hand, is projected to decrease at a rate of −0.07 % yr−1 (Fig. 5c). The following section will present our findings on the distribution and dynamics of DOC export through 100 and 1000 m depths, along with future projections.
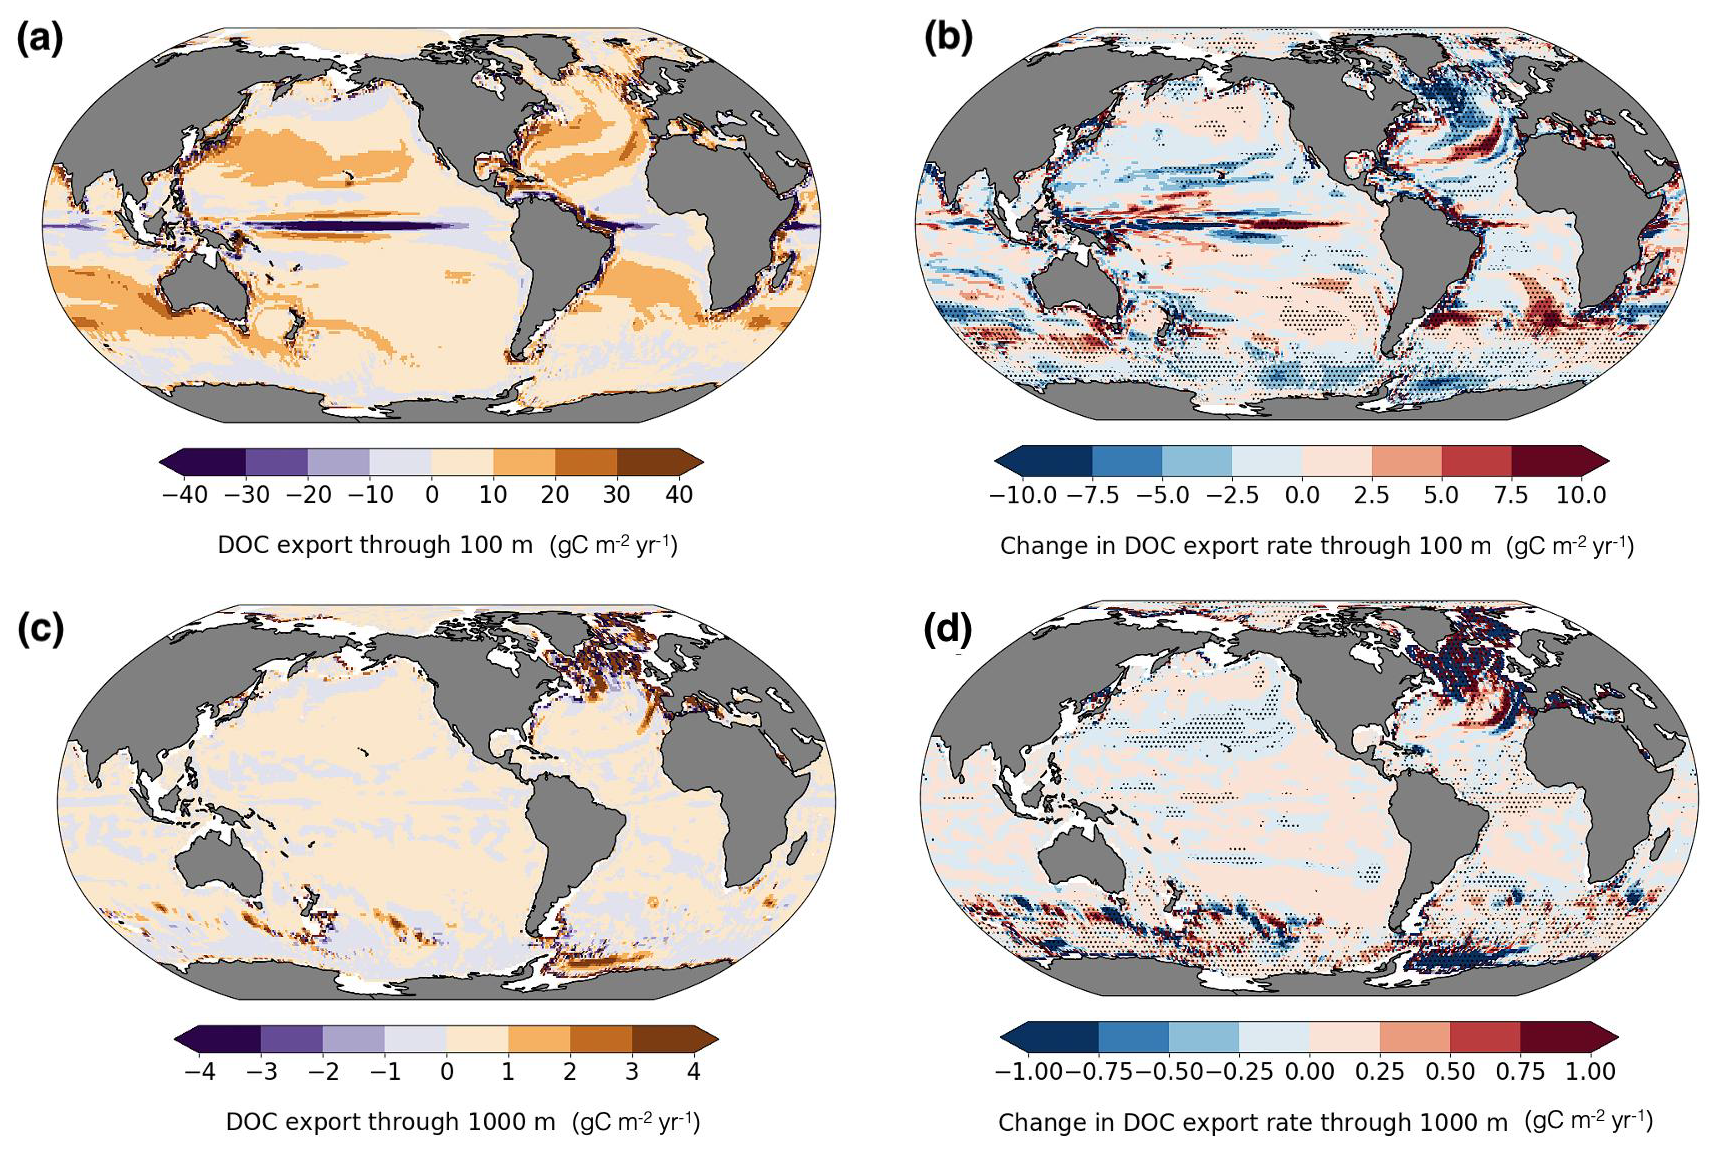
Figure 6DOC export rates at 100 and 1000 m and projected changes. Present-day (a, c); future minus present (b, d). Negative values indicate upward transport. Dots mark regions with significant changes (α=0.05).
3.4 DOC export
The model simulates a present-day global DOC export of 1.6 Pg C yr−1 at 100 m depth (Fig. 6a). For comparison, the modeled total oceanic DOC inventory is 704 Pg C under present-day conditions and decreases by 0.6 Pg C in the simulated future period, illustrating the scale of annual export in relation to the total DOC reservoir and its role in the marine carbon cycle. Our DOC export rate estimate agrees closely with the value reported by DeVries and Weber (2017) and remains within the range of previous estimates but slightly lower than 1.9 and 1.8 Pg C yr−1 reported by data-constrained global circulation models (Nowicki et al., 2022; Hansell et al., 2009, respectively), and 2.3 ± 0.6 Pg C yr−1 estimated using an artificial neural network-constrained biogeochemistry model (Roshan and DeVries, 2017). Studies using ESMs (CESM2, Sreeush et al., 2024; ESM4-COBALTv2, Stock et al., 2020; and IPSL-PISCES-v2, Aumont et al., 2015) reported DOC export rates of 2.0, 3.6, and 0.96 Pg C yr−1, respectively. While these studies provide valuable estimates under present-day conditions, the responses of DOC export and the underlying mechanisms to climate change remain sparsely investigated using global models.
Our model projects a modest decline (−0.1 Pg C yr−1) in the global 100 m DOC export when comparing present-day and future averages, resulting in a 1.5 Pg C yr−1 export rate (Fig. 6b; Fig A3), with mixing-mediated export showing greater sensitivity to future climate forcing than advective transport. To our knowledge, the only other study that examines future DOC export changes reports a decrease from 2.0 to 1.9 Pg C yr−1 under the SSP3-7.0 scenario. Considering that both projections reflect a strong climate change signal in high-emission futures, the projected decreases of 7 % and 5 % support the expectation of a continued downward trend.
Although export is conventionally reported at 100 m depth, it is also useful to analyze export at 1000 m, as it provides insight into longer-term carbon sequestration through DOC. Our simulations estimate a present-day export of 0.09 Pg C yr−1 at 1000 m depth (Fig. 6c). Export through 1000 m depth is approximately 20 times lower than at 100 m, indicating that DOC is overall highly susceptible to rapid remineralization (Lefévre et al., 1996). This suggests that DOC export is not an efficient carbon sequestration pathway, as it generally does not reach great depths, except in deep-water formation regions (Hansell et al., 2009). Indeed, the export is highest in the North Atlantic, accounting for roughly 60 % (0.048 Pg C yr−1) of global export at 1000 m depth, followed by high rates in the Weddell gyre (Fig. 6c). In future projections, there is a 25 % decrease in 1000 m export (from 0.09 to 0.06 Pg C yr−1; Fig. 6d; Fig. A4).
Despite good agreement with present-day observations, applying temperature sensitivity only to labile DOC may limit the accuracy of future projections. Semi-labile and semi-refractory DOC pools have empirically-based constant decay rates implicitly reflecting contemporary environmental conditions, so future temperature-driven changes are only partly captured through remineralization of these pools into labile DOC. Although this approach remains valid for contemporary DOC cycling, the lack of dynamic or mechanistic process representation adds uncertainty to climate change projections. Addressing this limitation, ongoing development of our model aims to incorporate environmentally sensitive decay rates for semi-labile and semi-refractory DOC pools to enhance the robustness of future projections.
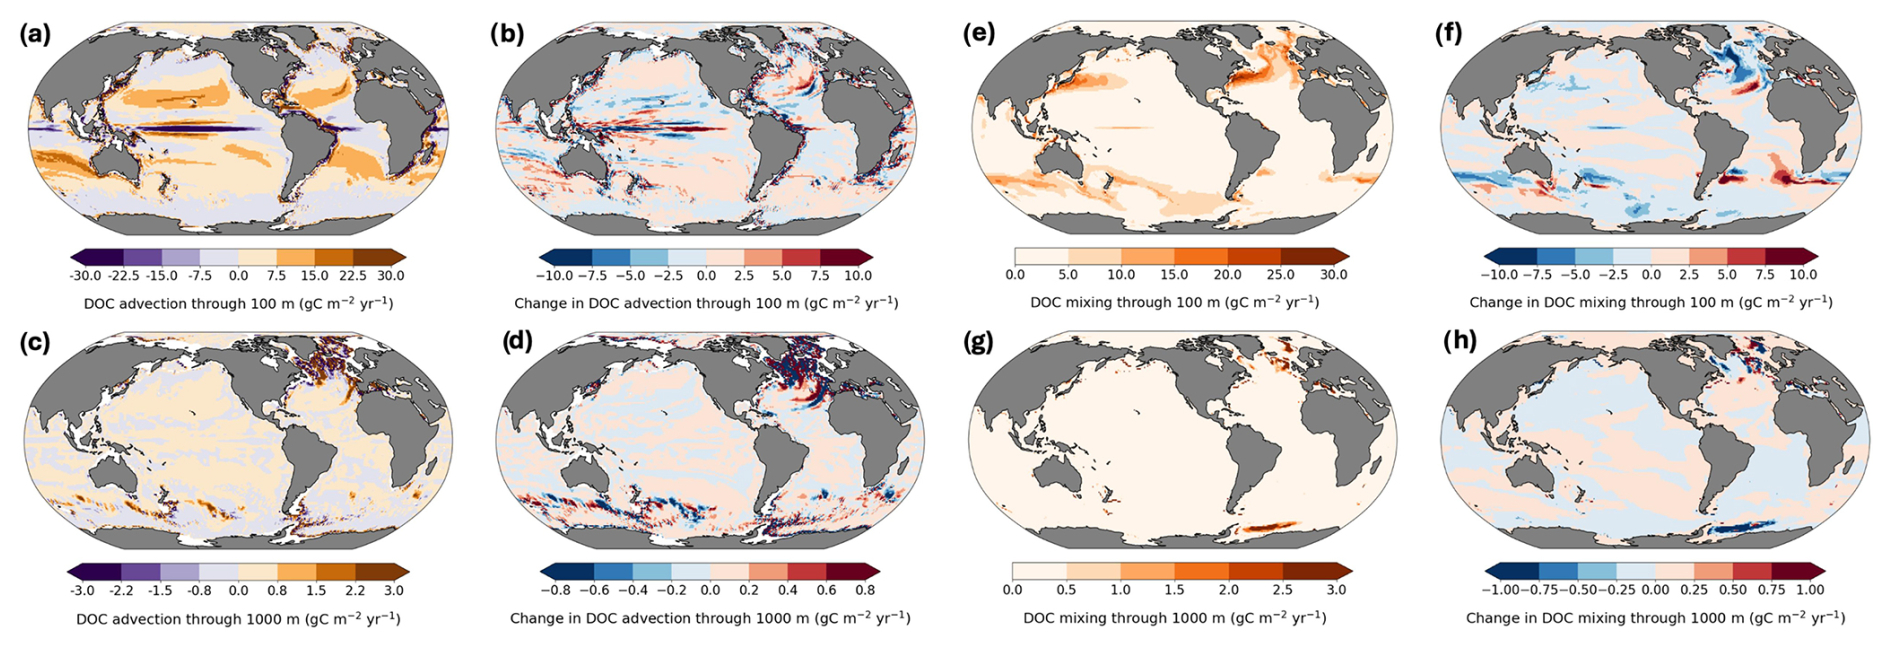
Figure 7Advection- vs mixing-mediated DOC export and projected changes at 100 and 1000 m. (a–d) advection; (e–h) mixing. Rates in . Negative values indicate upward transport.
The relative contributions of physical processes driving DOC export vary regionally and seasonally, and are expected to shift under climate change. Here, we further decompose these physical processes driving DOC export as advection and mixing fluxes. At 100 m depth, present-day global advective flux is 0.55 Pg C yr−1 (Fig. 7a), while the mixing flux is nearly double at 1.02 Pg C yr−1 (Fig. 7e). At 1000 m depth, in contrast, DOC export is dominated by advection (0.06 Pg C yr−1; Fig. 7c) rather than mixing (0.02 Pg C yr−1; Fig. 7g). This shift reflects the decreasing influence of vertical mixing with depth and the growing importance of large-scale circulation features such as the Atlantic Meridional Overturning Circulation (AMOC).
In the future scenario, the DOC advective flux at 100 m remains stable at 0.56 Pg C yr−1 (Fig. 7b), whereas the DOC mixing flux decreases to 0.94 Pg C yr−1 (Fig. 7f). At 1000 m, mixing remains nearly unchanged (Fig. 7h), while advection drops from 0.06 to 0.04 Pg C yr−1 (Fig. 7d).
The differential response of advection- and mixing-mediated DOC export to climate change can be tied to several mechanisms. Enhanced surface warming increases upper ocean stratification (Fig. A2), which inhibits vertical mixing and reduces DOC transport from the surface to the deeper layers. At the same time, projected weakening of the AMOC under warming scenarios decreases the advective transport at depth (Caesar et al., 2021; Rahmstorf et al., 2015). This is evident in the North Atlantic, where reduced formation of North Atlantic Deep Water diminishes an important pathway for deep DOC export (Fig. 7d). Furthermore, changes in wind patterns affect the intensity of upwelling in regions such as the Southern Ocean (Morrison and Hogg, 2013), further affecting advective fluxes.
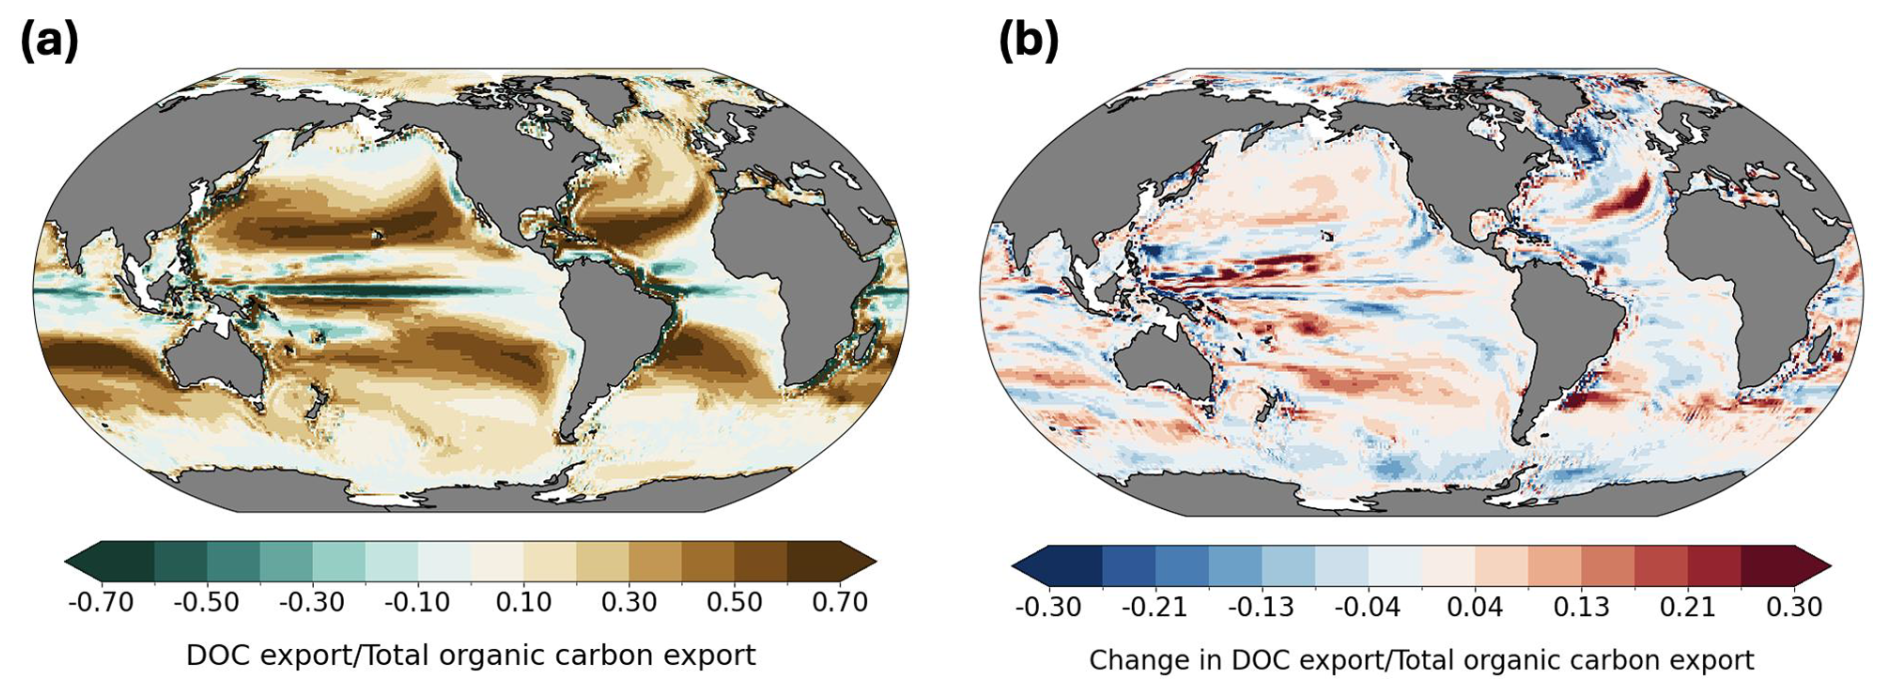
Figure 8DOC contribution to total organic carbon (TOC) export at 100 m: present-day ratio (a) and projected future change (b).
To better understand the spatial expression of these processes, we next examine regional DOC export patterns. At 100 m, DOC export varies regionally due to a combination of physical transport and biological production dynamics. The highest export rates (10–20 ) occur in subtropical gyres (Fig. 6a). DOC export in these regions is primarily advective, consistent with large-scale circulation and wind-driven convergence zones. Advection also plays a role in transport in regions with strong ocean currents, for example, along the southern flanks of the Gulf Stream and Kuroshio. In these areas, DOC is transported laterally and vertically along isopycnal surfaces, contributing to local subduction and export at 100 m depth. In western boundary currents such as the Gulf Stream and Kuroshio, and along the path of the Antarctic Circumpolar Current (ACC), our simulations also show hotspots of mixing-driven export (15–25 ), likely due to strong eddy fields and intense vertical exchange, although eddy-driven processes are not explicitly resolved at our model resolution and are instead parameterized. Based on our model, mixing-driven export exceeds advection-driven export, underscoring the role of turbulent mixing in transferring biologically produced DOC below 100 m. This is consistent with strong vertical DOC gradients at the base of the mixed layer, especially in regions of seasonal deepening, where winter entrainment redistributes DOC accumulated during growing season. Winter deepening has also been shown to contribute to organic carbon transport in subpolar gyres and parts of the Southern Ocean via entrainment of surface accumulated DOC (Bif and Hansell, 2019; Levy et al., 2013).
However, our model's nominal 1° resolution potentially underestimates the contribution of mixing, as it does not resolve submesoscale eddies and associated vertical velocities that enhance local mixing and transport (Resplandy et al., 2019). These processes are especially important in frontal zones and regions of strong density gradients (Lévy et al., 2012). Despite this limitation, the projected trends support the view that changes in large-scale circulation will dominate future shifts in DOC export at 1000 m depth rather than local mixing processes.
Our results indicate that DOC export at 100 m contributes 19 % to TOC export globally based on the present-day average (Fig. 8a), which is consistent with previous estimates of approximately 20 % (Roshan and DeVries, 2017; Hansell et al., 2009). The fraction of DOC contribution to TOC export is highest in subtropical gyres, reaching more than 70 %, reflecting the subduction of accumulated DOC transported from high productivity regions by poleward surface flows, but also very low POC export rates in this area. Roshan and DeVries (2017) report this contribution reaching up to 70 % in the subtropical ocean in their study. To support this result, we also provide a map of POC export distribution at 100 m depth, together with a map of its future changes in Appendix (Fig. A5). Globally integrated POC export flux in our model is 8.6 Pg yr−1. Equatorial upwelling counteracts export in these regions by bringing DOC back to the surface, as indicated by the negative values in Fig. 6a. In Fig. 8b we show the spatial pattern of future regional shifts in the relative contribution of DOC to TOC export flux. However, the globally integrated change in the ratio of DOC to TOC export is less than a 1 % increase (Fig. 8b). We do not present maps of DOC contribution to export at 1000 m depth, as it is very low (< 0.01 %). This further emphasizes that export of labile, semi-labile, or semi-refractory DOC is not an efficient long-term carbon sequestration pathway, as previously discussed and corroborated by other studies (Hansell et al., 2009; Nowicki et al., 2022). However, the model estimates that 2.2 Pg C yr−1 of DOC is remineralized within the 100–1000 m depth window, with 1.6 Pg C yr−1 exported from the surface and an additional 0.6 Pg C yr−1 produced locally. Therefore, the substantial quantity of exported DOC plays an important ecological role as a source of organic matter for mesopelagic organisms (Santana-Falcón et al., 2017; Carlson et al., 2010).
This study explores the roles of specific biological and physical processes in shaping DOC cycling, both under present-day conditions and in a future climate scenario. Results indicate that while biological production of DOC is highest in nutrient-rich equatorial upwelling zones and along active boundary currents, its surface and depth distribution, and long-term fate are largely determined by physical transport. The accumulation of DOC in stratified subtropical gyres, driven by downwelling and subduction, illustrates the important interaction between biogeochemical production and ocean circulation in sustaining carbon reservoirs in the upper ocean. The model reproduces the large-scale spatial patterns of observed DOC reasonably well. However, noticeable differences in high-latitude regions point to remaining uncertainties, especially regarding the role of riverine carbon inputs. These findings emphasize the need for improved representation of land-ocean carbon fluxes, particularly in Arctic regions where seasonal river discharge plays a major role in DOC variability. Further insight is gained from the analysis of DOC export processes. In the near-surface layers (top 100 m), DOC export is mainly influenced by seasonal mixing and vertical turbulent exchange. In contrast, export at greater depths is dominated by advective processes linked to deep-water formation and large-scale circulation. The projection under the RCP8.5 climate change scenario shows a general decline in DOC export, reflecting both the impact of reduced vertical mixing and circulation slowdown. Despite these changes and a decline in net biological DOC production, modest increases in surface DOC concentrations suggest that physical redistribution processes may moderate upper-ocean DOC levels to some extent. We recognize a limitation in our analyses concerning the dynamics of semi-labile and semi-refractory DOC pools, whose degradation rates are not explicitly sensitive to environmental drivers. Consequently, any conclusion regarding contribution of DOC to long-term carbon sequestration must be interpreted with caution. While our results suggest that rapid remineralization of labile DOC limits its contribution to long-term carbon storage, the role of the more refractory DOC pools, though not dynamically represented, may still be significant for carbon export. Anyhow, the role of DOC in upper-ocean carbon export remains ecologically and biogeochemically relevant. Also, its importance and contribution to TOC export varies regionally, with highest accumulation and contribution in subtropical gyres (19 % of TOC export due to DOC). Some limitations of this study stem from, for example, subgrid-scale processes such as submesoscale mixing that are not fully resolved, and the assumptions about biochemistry and lability of DOC pools and their decay remain simplified. Improving the representation of these processes, for example through higher-resolution modeling and updated parameterizations, or the inclusion of mechanistic formulations, will be beneficial to better understand the role of DOC in the marine carbon cycle under ongoing climate change.
ESM2M has been evaluated extensively in Dunne et al. (2012). However, COBALTv2 has not been operated within ESM2M before, as it has been developed for use in the successor ESM4. We therefore provide an evaluation of the most important variables for this study, where we show that overall the model is in good agreement with observations. Besides DOC concentrations, the variables considered were macronutrient (i.e., nitrate, phosphate and silicate) and chlorophyll concentrations, averaged over the upper 100 m (Fig. A1). Skill metrics we consistently considered were Pearson's correlation coefficient for spatial patterns, root mean square error for the data spread, and bias for the “direction” of model errors.
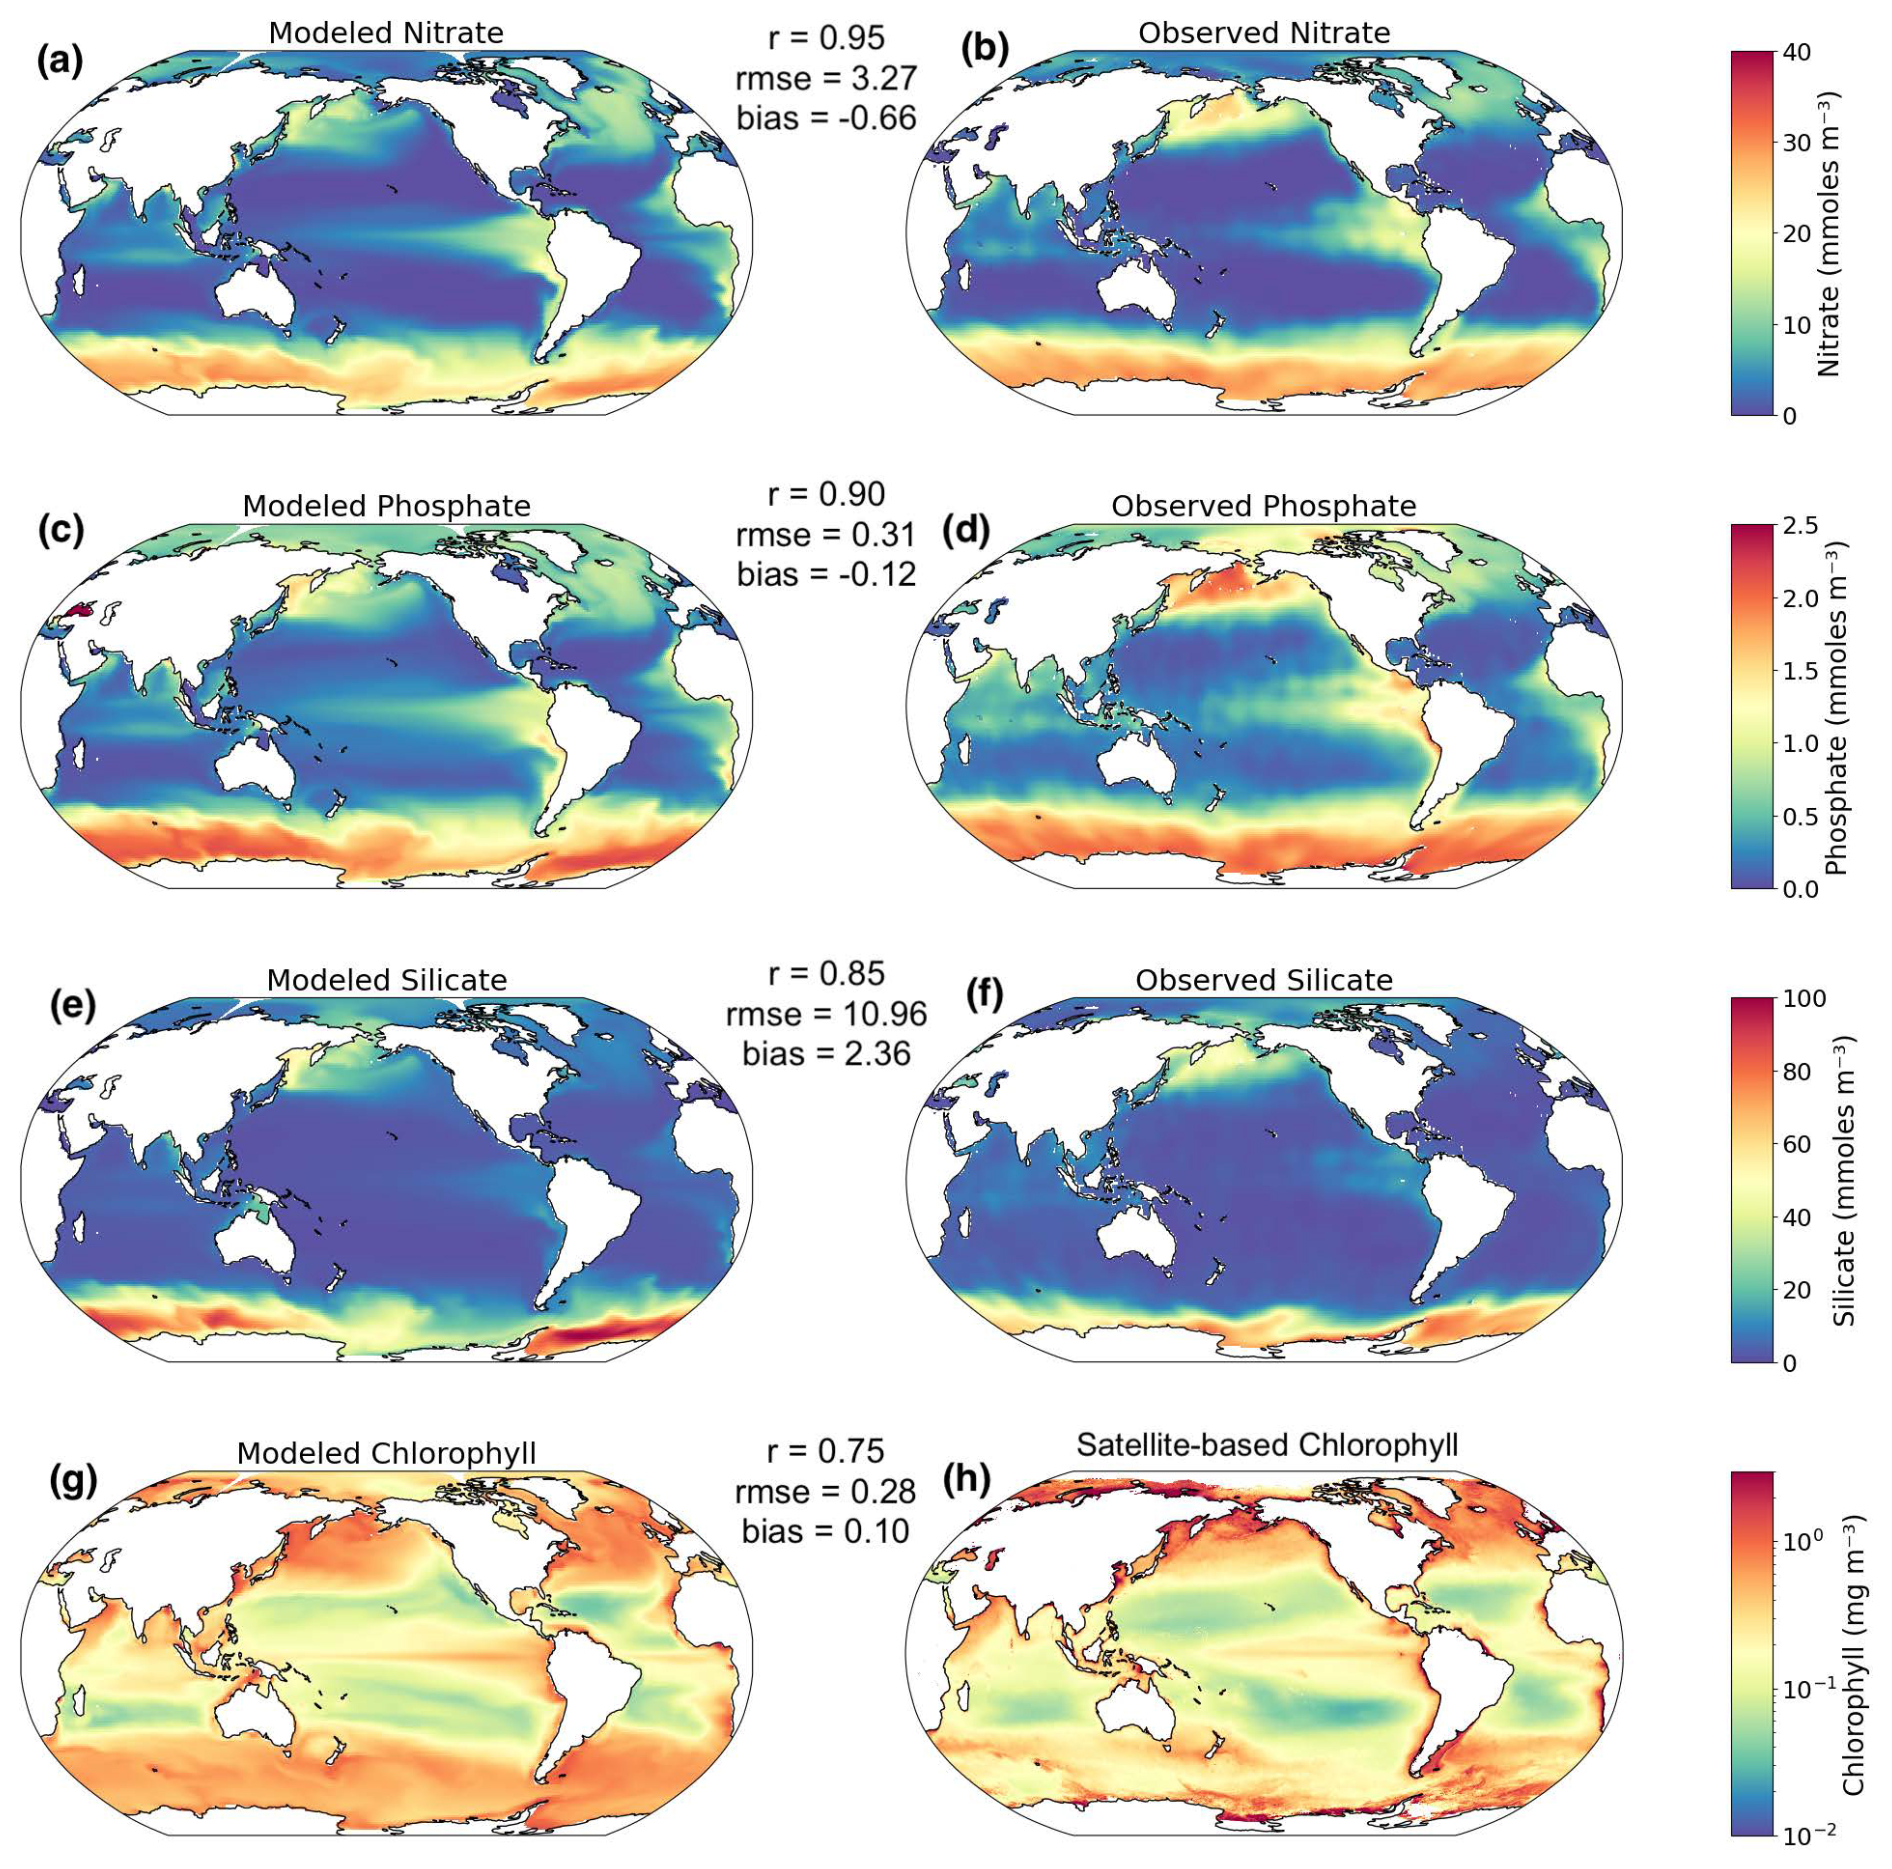
Figure A1Comparison of present-day modeled nutrient and chlorophyll concentrations with observations. Skill metrics (r, rmse, bias) shown for each field. WOA2018 macronutrients (Garcia et al., 2019); GlobColour Chl a (°).

Figure A2Projected future changes: (a) SST in °C; (b) mixed-layer depth in m.
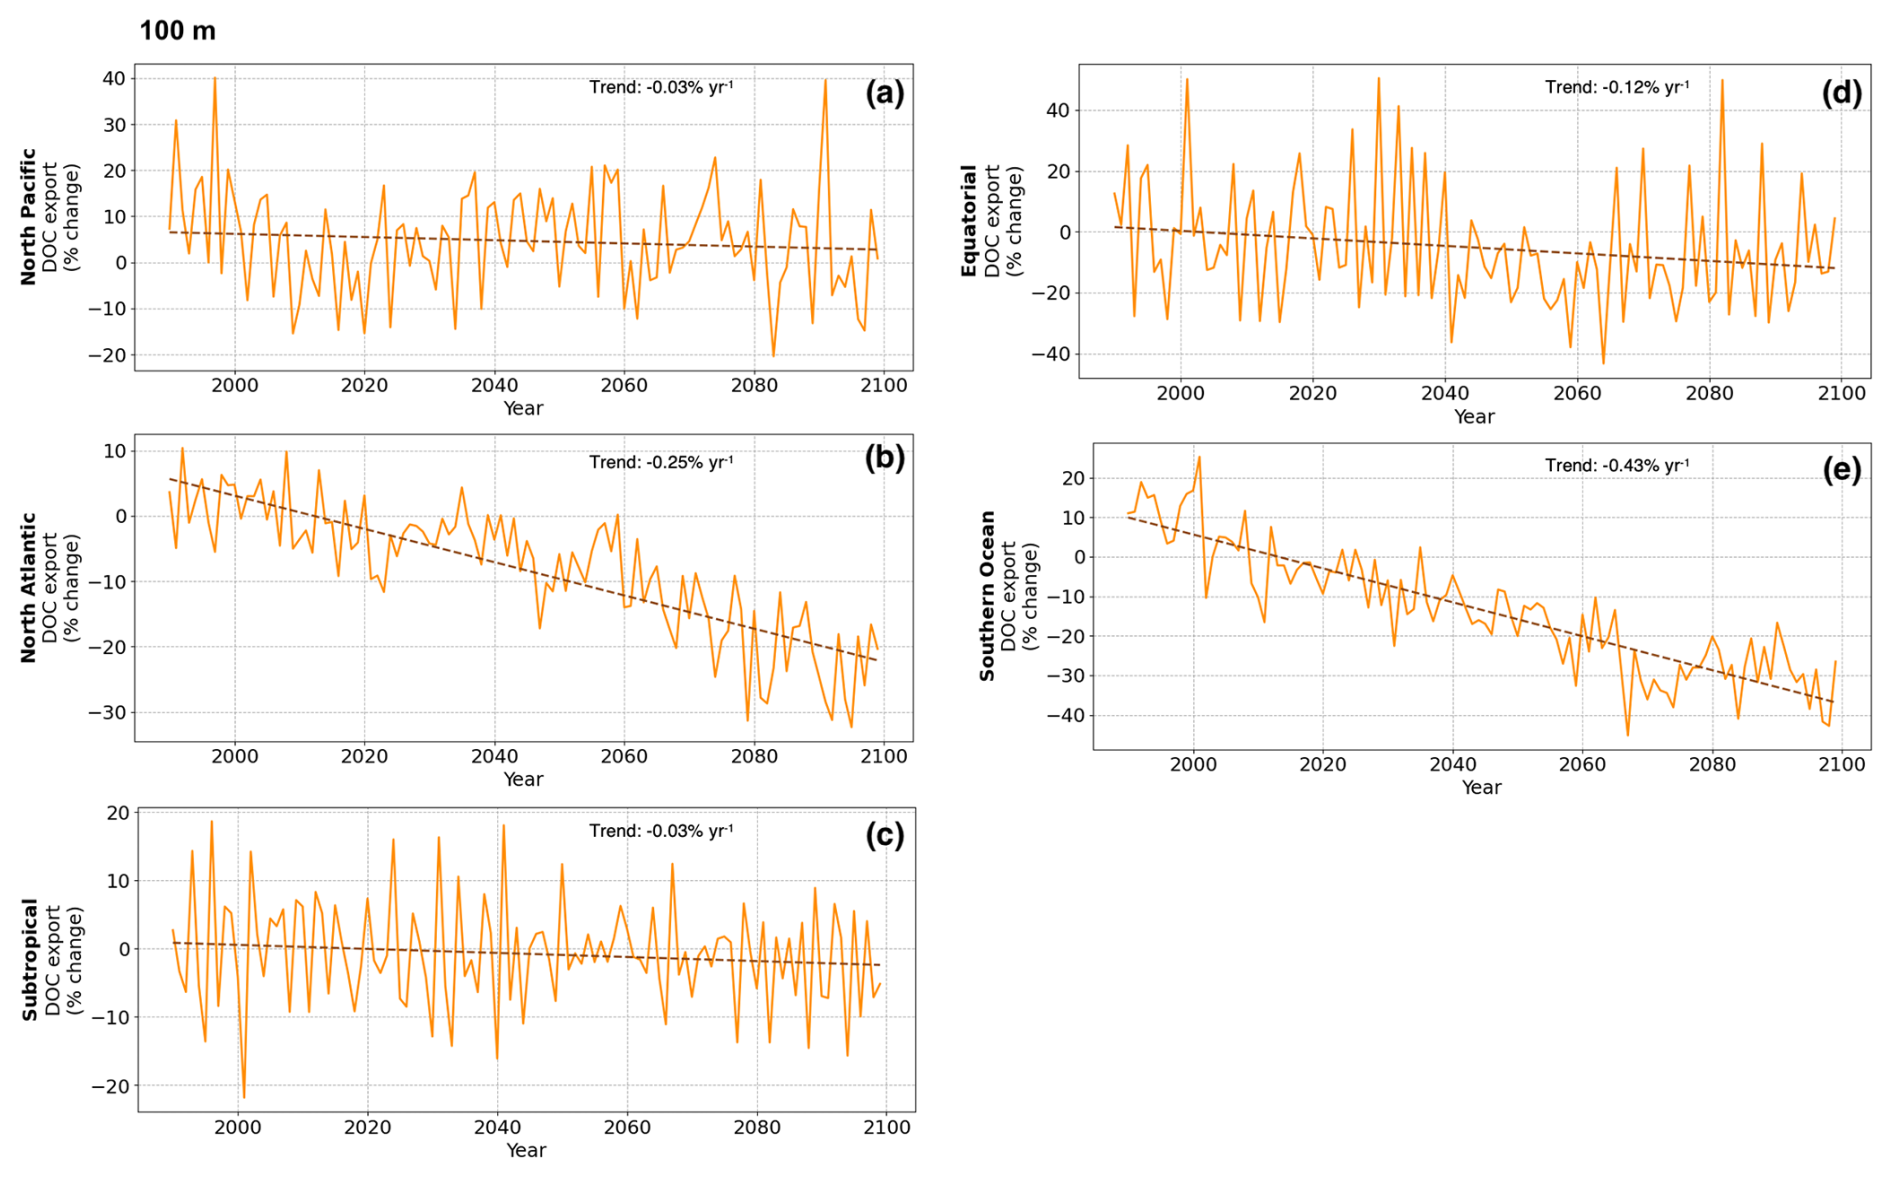
Figure A3Timeseries of regionally-integrated DOC export across 100 m (percent change relative to 1990–2010) for North Pacific, North Atlantic, Subtropical, Equatorial, Southern Ocean; dashed lines are linear trends.

Figure A4Timeseries of regionally-integrated DOC export across 1000 m (percent change relative to 1990–2010) for the same regions; dashed lines are linear trends.
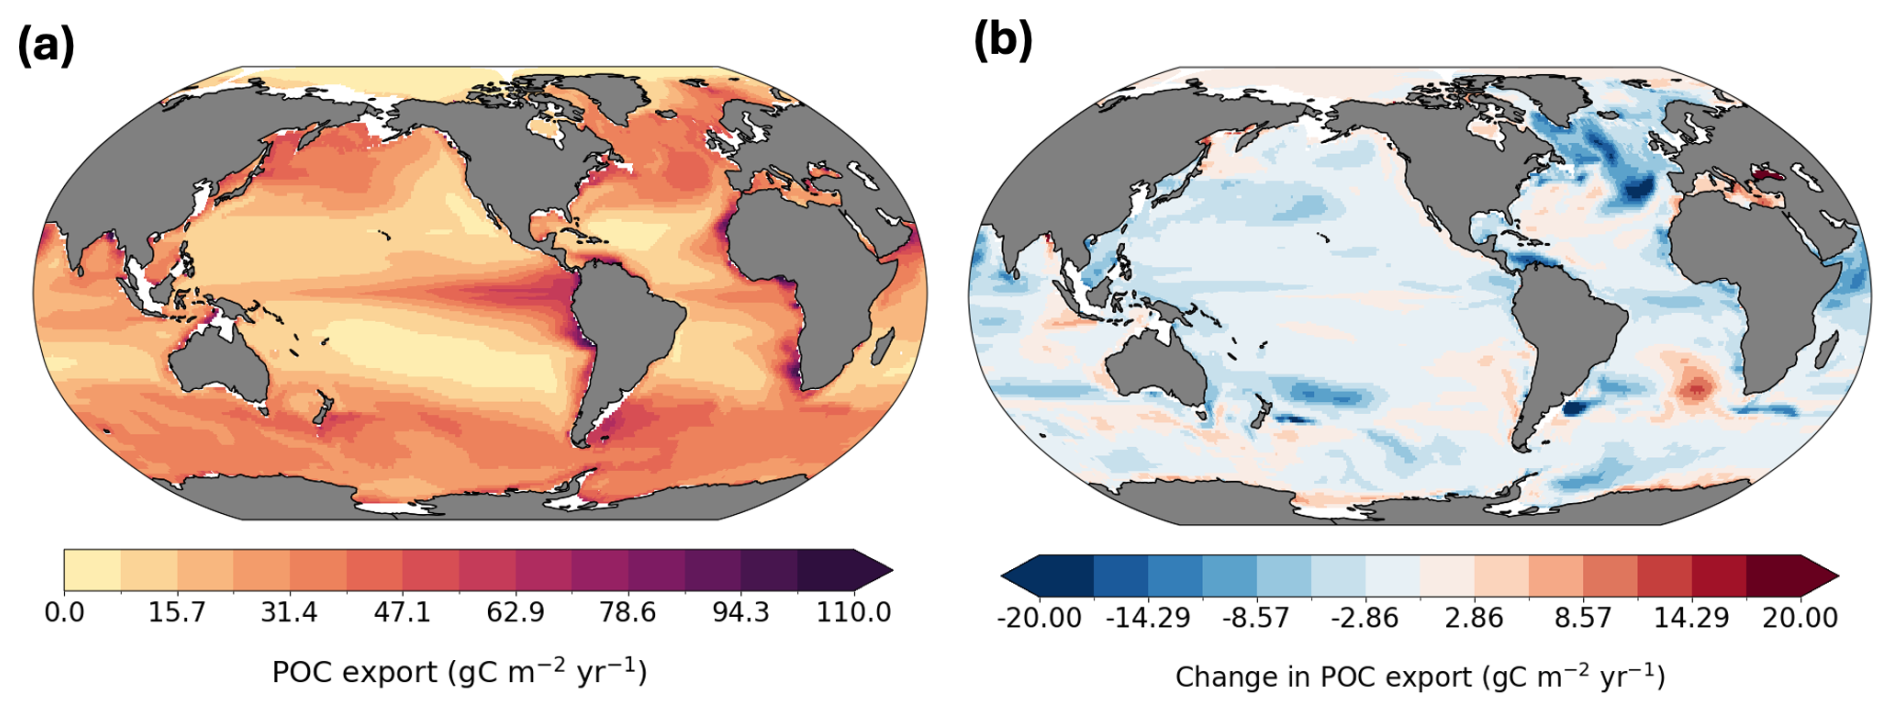
Figure A5Present-day POC export at 100 m (a) and projected future change (b).
Table A1Model tuning: parameter values used across model configurations.
The dissolved organic carbon (DOC) compilation dataset obtained from global ocean observations are provided by Hansell et al. (2021, https://doi.org/10.25921/s4f4-ye35). Macronutrient data were sourced from the World Ocean Atlas 2018 (Garcia et al., 2019). Chlorophyll a data were derived from the GlobColour merged satellite product (° resolution, Case 1 algorithm), developed and distributed by ACRI-ST, France. The COBALTv2-ESM2M model outputs used in the figures are publicly accessible via Zenodo: https://doi.org/10.5281/zenodo.15150328 (Flanjak, 2025). All other model outputs generated during this study are available from the corresponding author upon request.
LF and CL designed the study, with significant input from AW. AW configured the model set-up used for this study and ran the simulations. LF processed model output and conducted analyses of the study. LF wrote the initial manuscript draft. All authors discussed results and contributed to revising, editing, and writing of the paper.
The contact author has declared that none of the authors has any competing interests.
Publisher's note: Copernicus Publications remains neutral with regard to jurisdictional claims made in the text, published maps, institutional affiliations, or any other geographical representation in this paper. While Copernicus Publications makes every effort to include appropriate place names, the final responsibility lies with the authors. Views expressed in the text are those of the authors and do not necessarily reflect the views of the publisher.
We acknowledge the outstanding efforts of the members of the Geophysical Fluid Dynamics Laboratory in developing ESM2M and making the code publicly available. We also highly appreciate Charlie Stock's invaluable assistance in setting up the model and adjusting the COBALTv2 parameterizations and input files for use within ESM2M.
This work was supported by a grant from the Swiss National Supercomputing Centre (CSCS) un- 35 der project ID sm85 on Alps and Piz Daint. This work was supported by the Swiss State Secretariat for Education, Research and Innovation (SERI) under contract number MB22.00069. C.L. acknowledges support from the Swiss National Science Foundation under grant 203448.
This paper was edited by Peter Landschützer and reviewed by two anonymous referees.
Aumont, O., Ethé, C., Tagliabue, A., Bopp, L., and Gehlen, M.: PISCES-v2: an ocean biogeochemical model for carbon and ecosystem studies, Geosci. Model Dev., 8, 2465–2513, https://doi.org/10.5194/gmd-8-2465-2015, 2015. a
Bif, M. B. and Hansell, D. A.: Seasonality of Dissolved Organic Carbon in the Upper Northeast Pacific Ocean, Global Biogeochemical Cycles, 33, 526–539, https://doi.org/10.1029/2018GB006152, 2019. a
Bopp, L., Resplandy, L., Orr, J. C., Doney, S. C., Dunne, J. P., Gehlen, M., Halloran, P., Heinze, C., Ilyina, T., Séférian, R., Tjiputra, J., and Vichi, M.: Multiple stressors of ocean ecosystems in the 21st century: projections with CMIP5 models, Biogeosciences, 10, 6225–6245, https://doi.org/10.5194/bg-10-6225-2013, 2013. a, b
Caesar, L., McCarthy, G. D., Thornalley, D. J., Cahill, N., and Rahmstorf, S.: Current Atlantic Meridional Overturning Circulation weakest in last millennium, Nature Geoscience, 14, 118–120, https://doi.org/10.1038/s41561-021-00699-z, 2021. a
Carlson, C. A. and Hansell, D. A.: Chapter 3 – DOM Sources, Sinks, Reactivity, and Budgets, in: Biogeochemistry of Marine Dissolved Organic Matter (Second Edition), second edition edn., edited by: Hansell, D. A. and Carlson, C. A., Academic Press, Boston, https://doi.org/10.1016/B978-0-12-405940-5.00003-0, pp. 65–126, 2015. a, b
Carlson, C. A., Hansell, D. A., Nelson, N. B., Siegel, D. A., Smethie, W. M., Khatiwala, S., Meyers, M. M., and Halewood, E.: Dissolved organic carbon export and subsequent remineralization in the mesopelagic and bathypelagic realms of the North Atlantic basin, Deep Sea Research Part II Topical Studies in Oceanography, 57, 1433–1445, https://doi.org/10.1016/j.dsr2.2010.02.013, ecological and Biogeochemical Interactions in the Dark Ocean, 2010. a
Cauwet, G. and Sidorov, I.: The biogeochemistry of Lena River: organic carbon and nutrients distribution, Marine Chemistry, 53, 1–227, 1996. a
DeVries, T. and Weber, T.: The export and fate of organic matter in the ocean: New constraints from combining satellite and oceanographic tracer observations, Global Biogeochemical Cycles, 31, 535–555, https://doi.org/10.1002/2016GB005551, 2017. a
Dittmar, T. and Kattner, G.: The biogeochemistry of the river and shelf ecosystem of the Arctic Ocean: A review, Marine Chemistry, 83, 103–120, https://doi.org/10.1016/S0304-4203(03)00105-1, 2003. a
Dunne, J. P., John, J. G., Adcroft, A. J., Griffies, S. M., Hallberg, R. W., Shevliakova, E., Stouffer, R. J., Cooke, W., Dunne, K. A., Harrison, M. J., Krasting, J. P., Malyshev, S. L., Milly, P. C., Phillipps, P. J., Sentman, L. T., Samuels, B. L., Spelman, M. J., Winton, M., Wittenberg, A. T., and Zadeh, N.: GFDL's ESM2 global coupled climate-carbon earth system models. Part I: Physical formulation and baseline simulation characteristics, Journal of Climate, 25, 6646–6665, https://doi.org/10.1175/JCLI-D-11-00560.1, 2012. a, b, c
Eppley, R. W.: Temperature and phytoplankton growth in the sea, Fishery Bulletin, 70, 1063–-1085, 1971. a
Flanjak, L.: COBALTv2-ESM2M data for figures in manuscript Dissolved organic carbon dynamics in a changing ocean: A COBALTv2 – ESM2M coupled model analysis, Zenodo [data set], https://doi.org/10.5281/zenodo.15150328, 2025. a
Flanjak, L., Vrana, I., Kušan, A. C., Godrijan, J., Novak, T., Penezić, A., and Gašparović, B.: Effects of high temperature and nitrogen availability on the growth and composition of the marine diatom Chaetoceros pseudocurvisetus, Journal of Experimental Botany, 73, 4250–4265, https://doi.org/10.1093/jxb/erac145, 2022. a
Garcia, H. E., Weathers, K. W., Paver, C. R., Smolyar, I. V., Boyer, T. P., Locarnini, R. A., Zweng, M. M., Mishonov, A. V., Baranova, O. K., Seidov, D., and Reagan, J. R.: World ocean atlas 2018, Vol. 4: Dissolved inorganic nutrients (phosphate, nitrate and nitrate+ nitrite, silicate), National Oceanic and Atmospheric Administration (NOAA), https://doi.org/10.25923/ng6j-ey81, 2019. a, b
Geider, R., MacIntyre, H., and Kana, T.: Dynamic model of phytoplankton growth and acclimation: responses of the balanced growth rate and the chlorophyll a:carbon ratio to light, nutrient-limitation and temperature, Marine Ecology Progress Series, 148, 187–200, https://doi.org/10.3354/meps148187, 1997. a
Hansell, D. A. and Carlson, C. A.: Marine Dissolved Organic Matter and the Carbon Cycle, Oceanography, 14, 2001. a
Hansell, D. A., Carlson, C. A., Repeta, D. J., and Schlitzer, R.: DISSOLVED ORGANIC MATTER IN THE OCEAN: A CONTROVERSY STIMULATES NEW INSIGHTS, Oceanography, 22, 202–211, https://doi.org/10.5670/oceanog.2009.109, 2009. a, b, c, d, e, f, g
Hansell, D. A., Carlson, C. A., Amon, R. M. W., Álvarez Salgado, X. A., Yamashita, Y., Romera-Castillo, C., and Bif, M. B.: Compilation of dissolved organic matter (DOM) data obtained from global ocean observations from 1994 to 2021, Version 2 (NCEI Accession 0227166), Tech. rep., NOAA National Centers for Environmental Information [data set], https://doi.org/10.25921/s4f4-ye35, 2021. a, b, c
Hansen, B., Bjornsen, P. K., and Hansen, P. J.: The size ratio between planktonic predators and their prey, Limnology and Oceanography, 39, 395–403, https://doi.org/10.4319/lo.1994.39.2.0395, 1994. a
Henson, S. A., Laufkötter, C., Leung, S., Giering, S. L., Palevsky, H. I., and Cavan, E. L.: Uncertain response of ocean biological carbon export in a changing world, Nature Geoscience, 15, 248–254, https://doi.org/10.1038/s41561-022-00927-0, 2022. a
Holl, C. M. and Montoya, J. P.: Interactions between nitrate uptake and nitrogen fixation in continuous cultures of the marine diazotroph trichodesmium (cyanobacteria), Journal of Phycology, 41, 1178–1183, https://doi.org/10.1111/j.1529-8817.2005.00146.x, 2005. a
Jiao, N., Herndl, G. J., Hansell, D. A., Benner, R., Kattner, G., Wilhelm, S. W., Kirchman, D. L., Weinbauer, M. G., Luo, T., Chen, F., and Azam, F.: Microbial production of recalcitrant dissolved organic matter: long-term carbon storage in the global ocean, Nature Reviews Microbiology, 8, 593–599, https://doi.org/10.1038/nrmicro2386, 2010. a
Keller, D. P. and Hood, R. R.: Modeling the seasonal autochthonous sources of dissolved organic carbon and nitrogen in the upper Chesapeake Bay, Ecological Modelling, 222, 1139–1162, https://doi.org/10.1016/j.ecolmodel.2010.12.014, 2011. a
Kim, J. M., Lee, K., Shin, K., Yang, E. J., Engel, A., Karl, D. M., and Kim, H. C.: Shifts in biogenic carbon flow from particulate to dissolved forms under high carbon dioxide and warm ocean conditions, Geophysical Research Letters, 38, https://doi.org/10.1029/2011GL047346, 2011. a
Laufkötter, C., Vogt, M., Gruber, N., Aumont, O., Bopp, L., Doney, S. C., Dunne, J. P., Hauck, J., John, J. G., Lima, I. D., Seferian, R., and Völker, C.: Projected decreases in future marine export production: the role of the carbon flux through the upper ocean ecosystem, Biogeosciences, 13, 4023–4047, https://doi.org/10.5194/bg-13-4023-2016, 2016. a
Le Fouest, V., Babin, M., and Tremblay, J.-É.: The fate of riverine nutrients on Arctic shelves, Biogeosciences, 10, 3661–3677, https://doi.org/10.5194/bg-10-3661-2013, 2013. a
Lefévre, D., Denis, M., Lambert, C., and Miquel, J.-C.: Is DOC the main source of organic matter remineralization in the ocean water column?, Journal of Marine Systems, 7, 281–291, https://doi.org/10.1016/0924-7963(95)00003-8, 1996. a
Lennartz, S. T., Keller, D. P., Oschlies, A., Blasius, B., and Dittmar, T.: Mechanisms Underpinning the Net Removal Rates of Dissolved Organic Carbon in the Global Ocean, Global Biogeochemical Cycles, 38, https://doi.org/10.1029/2023GB007912, 2024. a
Levy, M., Bopp, L., Karleskind, P., Resplandy, L., Ethe, C., and Pinsard, F.: Physical pathways for carbon transfers between the surface mixed layer and the ocean interior, Global Biogeochemical Cycles, 27, 1001–1012, https://doi.org/10.1002/gbc.20092, 2013. a, b
Lévy, M., Ferrari, R., Franks, P. J. S., Martin, A. P., and Rivière, P.: Bringing physics to life at the submesoscale, Geophysical Research Letters, 39, https://doi.org/10.1029/2012GL052756, 2012. a
Lønborg, C., Middelboe, M., and Brussaard, C. P. D.: Viral lysis of Micromonas pusilla: impacts on dissolved organic matter production and composition, Biogeochemistry, 116, 231–240, https://doi.org/10.1007/s10533-013-9853-1, 2013. a
Lønborg, C., Carreira, C., Jickells, T., and Álvarez Salgado, X. A.: Impacts of Global Change on Ocean Dissolved Organic Carbon (DOC) Cycling, Frontiers in Marine Science, 7, https://doi.org/10.3389/fmars.2020.00466, 2020. a, b
Middelboe, M. and Lyck, P. G.: Regeneration of dissolved organic matter by viral lysis in marine microbial communities, Aquatic Microbial Ecology, 27, 187–194, https://doi.org/10.3354/ame027187, 2002. a
Moran, M. A., Ferrer-González, F. X., Fu, H., Nowinski, B., Olofsson, M., Powers, M. A., Schreier, J. E., Schroer, W. F., Smith, C. B., and Uchimiya, M.: The Ocean's labile DOC supply chain, Limnology and Oceanography, 67, 1007–1021, https://doi.org/10.1002/lno.12053, 2022. a
Morrison, A. K. and Hogg, A. M.: On the Relationship between Southern Ocean Overturning and ACC Transport, Journal of Physical Oceanography, 43, 140–148, https://doi.org/10.1175/JPO-D-12-057.1, 2013. a
Nagata, T., Fukuda, H., Fukuda, R., and Koike, I.: Bacterioplankton distribution and production in deep Pacific waters: Large–scale geographic variations and possible coupling with sinking particle fluxes, Limnology and Oceanography, 45, 426–435, https://doi.org/10.4319/lo.2000.45.2.0426, 2000. a
Najjar, R. G., Jin, X., Louanchi, F., Aumont, O., Caldeira, K., Doney, S. C., Dutay, J. C., Follows, M., Gruber, N., Joos, F., Lindsay, K., Maier-Reimer, E., Matear, R. J., Matsumoto, K., Monfray, P., Mouchet, A., Orr, J. C., Plattner, G. K., Sarmiento, J. L., Schlitzer, R., Slater, R. D., Weirig, M. F., Yamanaka, Y., and Yool, A.: Impact of circulation on export production, dissolved organic matter, and dissolved oxygen in the ocean: Results from Phase II of the Ocean Carbon-cycle Model Intercomparison Project (OCMIP-2), Global Biogeochemical Cycles, 21, https://doi.org/10.1029/2006GB002857, 2007. a
Novak, T., Godrijan, J., Pfannkuchen, D. M., Djakovac, T., Mlakar, M., Baricevic, A., Tanković, M. S., and Gašparović, B.: Enhanced dissolved lipid production as a response to the sea surface warming, Journal of Marine Systems, 180, 289–298, https://doi.org/10.1016/j.jmarsys.2018.01.006, 2018. a
Nowicki, M., DeVries, T., and Siegel, D. A.: Quantifying the Carbon Export and Sequestration Pathways of the Ocean's Biological Carbon Pump, Global Biogeochemical Cycles, 36, https://doi.org/10.1029/2021GB007083, 2022. a, b, c
Rahmstorf, S., Box, J. E., Feulner, G., Mann, M. E., Robinson, A., Rutherford, S., and Schaffernicht, E. J.: Exceptional twentieth-century slowdown in Atlantic Ocean overturning circulation, Nature Climate Change, 5, 475–480, https://doi.org/10.1038/nclimate2554, 2015. a
Resplandy, L., Lévy, M., and McGillicuddy Jr., D. J.: Effects of Eddy-Driven Subduction on Ocean Biological Carbon Pump, Global Biogeochemical Cycles, 33, 1071–1084, https://doi.org/10.1029/2018GB006125, 2019. a
Roshan, S. and DeVries, T.: Efficient dissolved organic carbon production and export in the oligotrophic ocean, Nature Communications, 8, https://doi.org/10.1038/s41467-017-02227-3, 2017. a, b, c, d, e, f, g
Sallée, J.-B., Pellichero, V., Akhoudas, C., Pauthenet, E., Vignes, L., Schmidtko, S., Garabato, A. N., Sutherland, P., and Kuusela, M.: Summertime increases in upper-ocean stratification and mixed-layer depth, Nature, 591, 592–598, https://doi.org/10.1038/s41586-021-03303-x, 2021. a
Santana-Falcón, Y., Álvarez-Salgado, X. A., Pérez-Hernández, M. D., Hernández-Guerra, A., Mason, E., and Arístegui, J.: Organic carbon budget for the eastern boundary of the North Atlantic subtropical gyre: major role of DOC in mesopelagic respiration, Scientific Reports, 7, 10129, https://doi.org/10.1038/s41598-017-10974-y, 2017. a
Sreeush, M. G., Kwon, E. Y., Lee, S. S., and Nellikkattil, A. B.: Anthropogenically Driven Changes in the Carbon to Phosphorus Ratio of Marine Dissolved Organic Matter, Global Biogeochemical Cycles, 38, https://doi.org/10.1029/2023GB008069, 2024. a, b, c, d
Stock, C. A., Dunne, J. P., Fan, S., Ginoux, P., John, J., Krasting, J. P., Laufkötter, C., Paulot, F., and Zadeh, N.: Ocean Biogeochemistry in GFDL's Earth System Model 4.1 and Its Response to Increasing Atmospheric CO2, Journal of Advances in Modeling Earth Systems, 12, https://doi.org/10.1029/2019MS002043, 2020. a, b, c, d, e, f, g
Strom, S. L., Benner, R., Ziegler, S., and Dagg, M. J.: Planktonic grazers are a potentially important source of marine dissolved organic carbon, Limnology and Oceanography, 42, 1364–1374, https://doi.org/10.4319/lo.1997.42.6.1364, 1997. a
von Liebig, J.: Die organische Chemie in ihrer Anwendung auf Agricultur und Physiologie, Vieweg, https://books.google.ch/books?id=T1K_pt_ETlMC (last access: 2 December 2024), 1840. a
Wagner, S., Schubotz, F., Kaiser, K., Hallmann, C., Waska, H., Rossel, P. E., Hansman, R., Elvert, M., Middelburg, J. J., Engel, A., Blattmann, T. M., Catalá, T. S., Lennartz, S. T., Gomez-Saez, G. V., Pantoja-Gutiérrez, S., Bao, R., and Galy, V.: Soothsaying DOM: A Current Perspective on the Future of Oceanic Dissolved Organic Carbon, Frontiers in Marine Science, 7, https://doi.org/10.3389/fmars.2020.00341, 2020. a