the Creative Commons Attribution 4.0 License.
the Creative Commons Attribution 4.0 License.
 | 19 Nov 2025
Forest favours conditions for convective precipitation in the Mediterranean Basin
Jolanda J. E. Theeuwen
Sarah N. Warnau
Imme B. Benedict
Stefan C. Dekker
Hubertus V. M. Hamelers
Chiel C. van Heerwaarden
The Mediterranean Basin is identified as a climate change hotspot and prone to future drying. Through carbon sequestration, forests may mitigate climate change and reduce future drying. Nevertheless, the effect of forests on freshwater availability in the Mediterranean Basin is uncertain. Trees contribute to enhanced evapotranspiration, which may enhance drying; the resulting impact on precipitation in the Mediterranean Basin, however, remains unclear. Here we use a simple model to simulate the development of the atmospheric boundary layer (ABL) to determine the impact of forest on convective rainfall potential. There is convective rainfall potential when (1) the ABL reaches the lifting condensation level, and (2) there is sufficient convective available potential energy. We model the ABL development over the Mediterranean Basin for a bare soil scenario (covered fully with bare soil) and a forest scenario (covered fully with forest) to determine its land cover sensitivity. In addition, we examine the sensitivity of the ABL to variations in soil moisture for the forest scenario specifically. We identify two distinct responses to forest in the Mediterranean Basin dependent on soil moisture content. Forest contributes to warming and drying in relatively dry regions (low soil moisture content) and to cooling and wetting in relatively wet regions (high soil moisture content). We find that both forest cover and soil moisture contribute to convective rainfall potential. In regions with a relatively high soil moisture content, forest cover positively influences both the convective available potential energy, and the crossing of the ABL and lifting condensation level. The results suggest that forestation in the Mediterranean Basin may contribute to local precipitation in relatively wet regions and reduce local precipitation in relatively dry regions.
- Article
(12014 KB) - Full-text XML
- BibTeX
- EndNote


Unsustainable land use and global warming lead to water scarcity and desertification in different regions across the globe (Bestelmeyer et al., 2015; Intergovernmental Panel on Climate Change (IPCC), 2023). Especially Mediterranean-type climate regions are identified as climate change hotspots (Ali et al., 2022; Diffenbaugh et al., 2008; Döll, 2009; Fraser et al., 2013) and are prone to drying (Pokhrel et al., 2021). Previous research estimated with high confidence that warming in the Mediterranean Basin has exceeded global average rates and temperature extremes and heatwaves have increased in intensity, number, and length, particularly during summer (Ali et al., 2022). Forestation initiatives that contribute to enhanced forest cover, such as forest restoration, afforestation, forest management and more, are carried out (United Nations Environment Programme, 2021) in the Mediterranean Basin, where they can contribute to carbon sequestration (Ruiz-Peinado et al., 2017).
In addition to affecting the climate through carbon sequestration, forests may increase freshwater availability when the increase in evapotranspiration promotes precipitation (Cui et al., 2022). It is expected that forests specifically may enhance rainfall in dry regions due to the buffering effect of Mediterranean forests on precipitation (O'Connor et al., 2021) as deep roots make deep soil moisture available during dry periods (Brunner et al., 2015). However, increased evapotranspiration can also reduce streamflow (Galleguillos et al., 2021) and therefore (Staal et al., 2024) some forests may contribute to local drying.
Forests are more likely to contribute to rainfall in regions characterized by high atmospheric moisture recycling ratios (Hoek van Dijke et al., 2022; Tuinenburg et al., 2022). Atmospheric moisture recycling describes the return of evaporated water over land and can be studied at different spatial scales. Local evaporation recycling, which is the return of evaporated water as precipitation locally, reduces local drying as evaporative losses are partially compensated for by rainfall (Theeuwen et al., 2023). In the Mediterranean Basin, forests seem to contribute more to local rainfall compared to all other Mediterranean-type climate regions, particularly during summer when the local recycling ratio is largest (Theeuwen et al., 2024). As the amount of evaporated water that recycles also seems to be influenced by vegetation, forests themselves could potentially increase moisture recycling and rainfall in regions that currently have low local recycling ratios (Theeuwen et al., 2024).
Atmospheric moisture recycling is often calculated using historical weather data (van der Ent et al., 2014; Hoek van Dijke et al., 2022; Tuinenburg et al., 2022) even though global changes are expected to affect the recycling ratio through changes in land-atmosphere interactions. A limited number of studies combines an Earth system model with a moisture tracking model to calculate the moisture recycling ratio for different land cover scenarios (De Hertog et al., 2024; Staal et al., 2025). In such a set-up, remote impacts on local precipitation cannot be excluded (De Hertog et al., 2024). To isolate the local effects of changes in land cover on local precipitation a different model approach is necessary; we need to use a set-up that models solely the local processes such that upwind processes do not affect the results. In this research we explore if forest creates favourable atmospheric conditions for local convective precipitation in the Mediterranean Basin.
First, we assess how the energy balance and evaporation are different over bare soil and forest and how these affect the development of the atmospheric boundary layer (ABL) and the level at which water vapor starts to condense (i.e., lifting condensation level, LCL). The ABL is the lower part of the atmosphere that grows from ∼ 100 m to several kilometres during the day due to the release of thermal heat at the Earth's surface. When the ABL crosses the LCL, water vapor in the ABL starts to condense and convective clouds can develop. The ABL and LCL cross when the ABL reaches a height equal to or larger than the LCL (ABL ≥ LCL).
Second, whereas the crossing of the ABL and LCL in itself has been considered an indicator of the probability of convective precipitation in previous research (e.g., Juang et al., 2007; Konings et al., 2010), there are more indicators which could be accounted for. Convective available potential energy (CAPE) is such an indicator (Yin et al., 2015). CAPE is a measure of the amount of energy that is available for deep convection. For the development of deep convective clouds that can produce rainfall, it has been suggested that CAPE needs to be equal to or larger than 400 J kg−1 (Yin et al., 2015). However, different processes may affect the exact amount of CAPE that is necessary to trigger deep convection (Yin et al., 2015). Nevertheless, to determine the convective rainfall potential we evaluate CAPE and assume that 400 J kg−1 is a sufficient amount of CAPE to trigger deep convection.
Finally, a stable layer or inversion can prevent air to rise and thus reduce convection, which is called convective inhibition (CIN) (Wallace and Hobbs, 2006). CIN represents the amount of energy that needs to be overcome, e.g., by heating or moistening the air, for convection to occur; a lower CIN allows convective clouds to develop more easily, and deep convection is unlikely for CIN ≥ 100 J kg−1 (Wallace and Hobbs, 2006). CAPE cannot be accessed when CIN is too large. In this study, we compare convective rainfall potential with CIN to get a better understanding if deep convective clouds are likely to develop.
It is expected that, compared to bare soil, forest cover enhances convective rainfall potential due to an increase in ABL height, a decrease in LCL height and an increase of CAPE. Due to the lower albedo of forests compared to bare soil the net surface radiation increases (Fig. 1), which enhances the latent and sensible heat fluxes (Bonan, 2008). An increase in these surface fluxes is beneficial for the deepening of the ABL (van Heerwaarden and Teuling, 2014) as well as the development of CAPE (Yin et al., 2015). In addition, evapotranspiration is expected to be larger over forest than over bare soil (Fig. 1). The larger amount of moisture present in the atmosphere reduces the LCL height (Yin et al., 2015). These changes are beneficial to the crossing of the ABL and LCL as well as to reaching a sufficient amount of CAPE. Finally, the increased vertical mixing over forests helps to reduce stable layers, and therefore, is expected to reduce CIN.
To simulate the development of the ABL throughout the day we use a model in which the ABL is represented as a homogenous “slab” with uniform properties. We evaluate the development of the ABL, the LCL and CAPE to investigate under which conditions the ABL and LCL cross and sufficient CAPE is available to trigger rainfall in the Mediterranean Basin. These results are compared to CIN to evaluate where deep convection may be inhibited. We simulate the ABL development in the entire Mediterranean Basin for the months May and June. To assess where in the Mediterranean Basin a mature forest may contribute to more rain locally, our study compares the occurrence of convective rainfall potential over bare soil and forest.
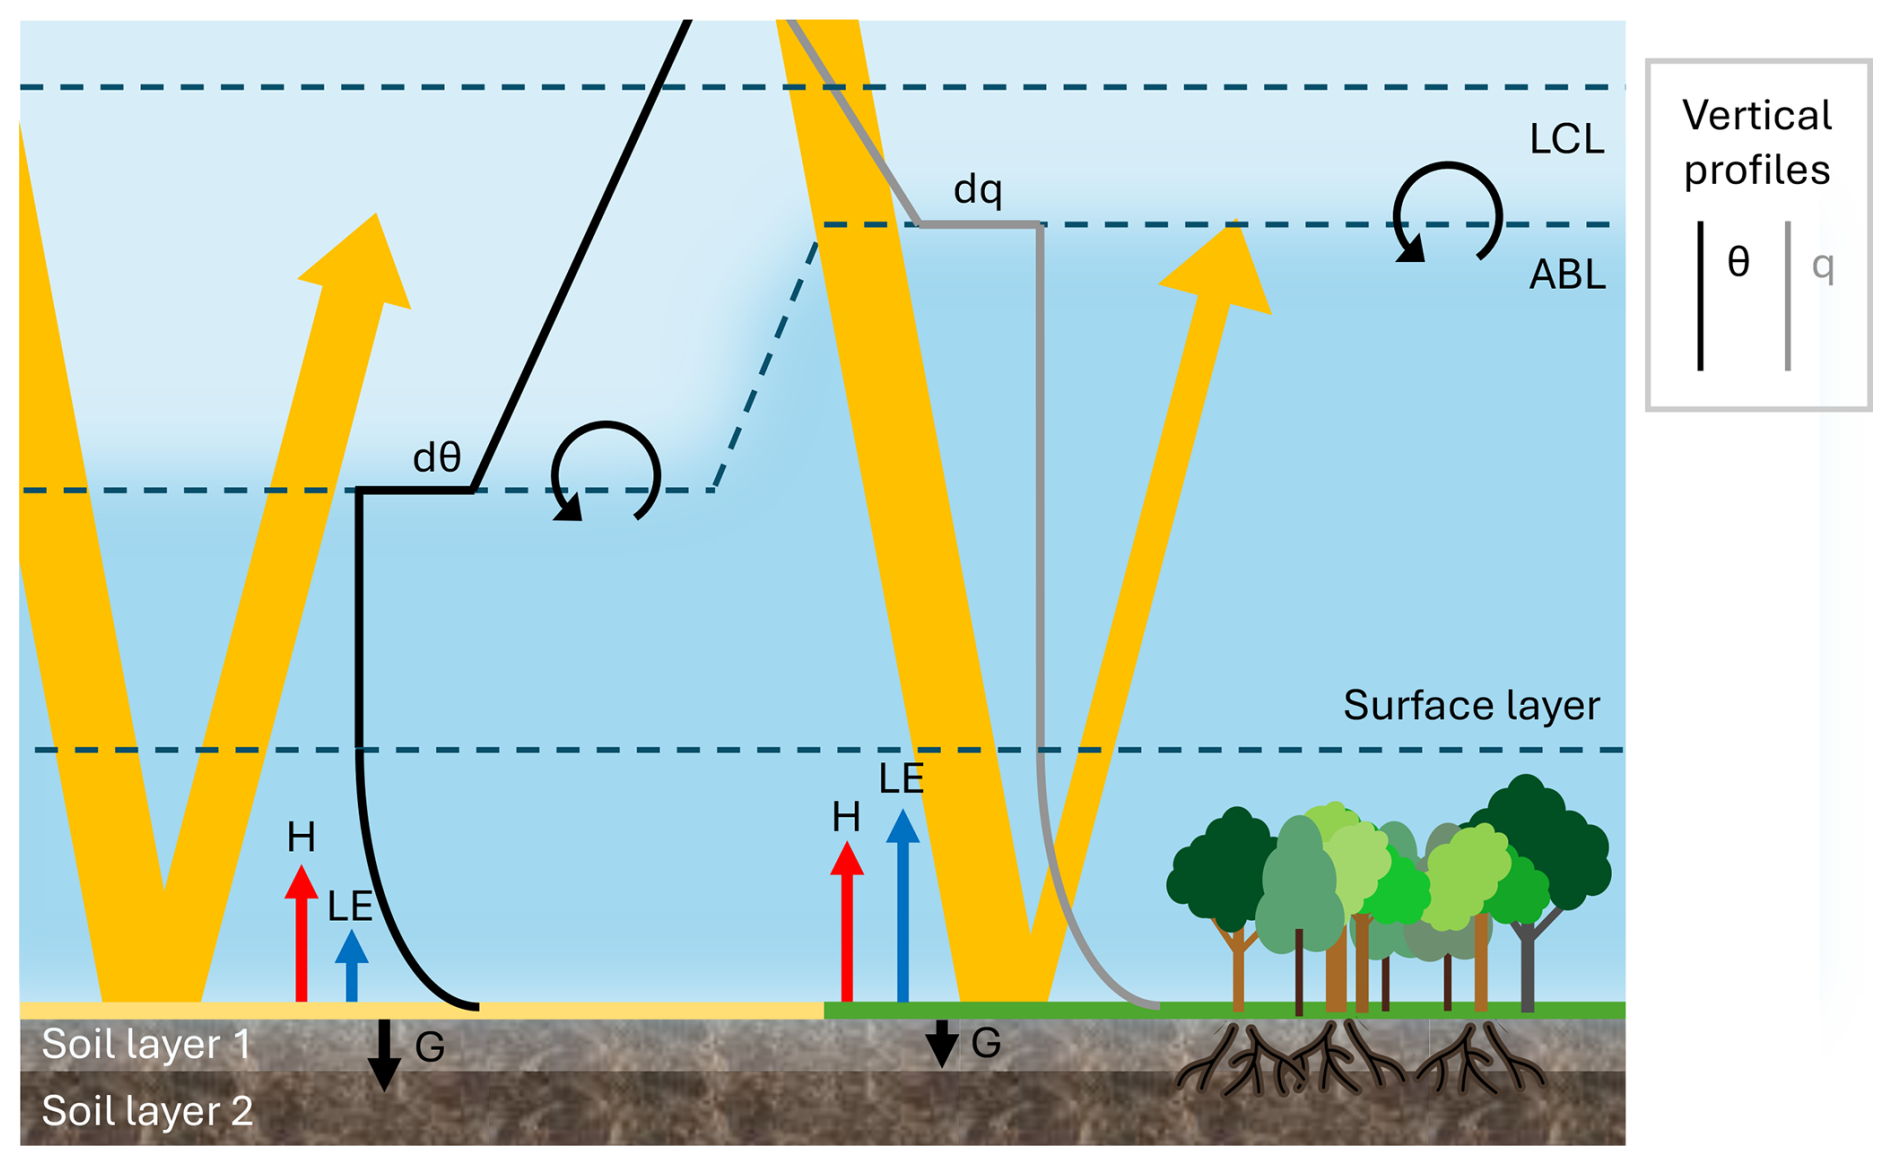
Figure 1Conceptual model that describes the vertical potential temperature (black) and specific humidity (grey) profiles of the atmospheric boundary layer (ABL) and the ABL development over two different land cover types (left: bare soil, right: forest). For the vertical profiles holds: moving towards the right θ and q increase. For the ABL over bare soil only the vertical temperature profile is shown and for the ABL over forest only the vertical humidity profile is shown. θ: potential temperature, q specific humidity, LCL: lifting condensation level, BLH: ABL height, dθ: jump in θ at the top of the ABL, dq: jump in q at the top of the ABL, H: sensible heat flux, LE: latent heat flux, G: ground heat flux. The circular arrows at the top of the ABL indicate entrainment from dry and warm air into the ABL. The yellow arrows indicate the incoming solar radiation and the part that is reflected back towards the atmosphere, which varies due to the different albedo of the two land cover types. Throughout the day the ABL deepens. Clouds can develop when the ABL and LCL cross.
We use the Chemistry Land-surface Atmosphere Soil Slab (CLASS) model (van Heerwaarden et al., 2010; Vilà-Guerau de Arellano et al., 2015) to test the sensitivity of the atmospheric boundary layer (ABL) and lifting condensation level (LCL) to land cover and soil moisture availability. We assess the impact of land cover and soil moisture on the potential for convective rainfall in the Mediterranean Basin in May and June for the years 2013–2022. This simulation is done for early summer as during this period the coupling between the land surface and atmosphere is stronger than in other seasons (Ardilouze et al., 2022; Lombardo and Bitting, 2024). Using this model we simulate the development of the ABL and LCL throughout the day (between 06:00 a.m. and 03:00 p.m. LT) for two land cover scenarios and five soil moisture scenarios. In this section, we describe the study region, CLASS model, input data, sampling of input data, experimental design, postprocessing, validation and analysis of the model output.
2.1 The Mediterranean Basin
The study region, the Mediterranean Basin, includes all regions located around the Mediterranean Sea that have a Mediterranean climate according to the Köppen climate classification (Fig. 2). Some additional small areas with a semi-arid climate were included to minimize fragmentation of the study region. The Mediterranean Basin is the largest of five major Mediterranean-type climate regions globally. A Mediterranean climate is characterized by wet winters with mild temperatures and dry and hot summers (Esler et al., 2018). Although precipitation falls predominantly in winter, during late spring and summer there is convective precipitation in the region (Fig. A1) (Treppiedi et al., 2023; Wallace and Hobbs, 2006). The region has multiple mountains with peaks up to 2400 m that promote local moisture recycling (Theeuwen et al., 2024). Throughout the Mediterranean Basin the soil moisture content varies between 0 and 0.4 m3 m−3 (Fig. 2). The study region consists of 2868 grid cells of 0.25°×0.25°, which means that it spans a distance of approximately 1400 km from north to south and approximately 4850 km from west to east. As the region is located in several time zones, we refer to the local solar time of each specific grid cell throughout the manuscript.
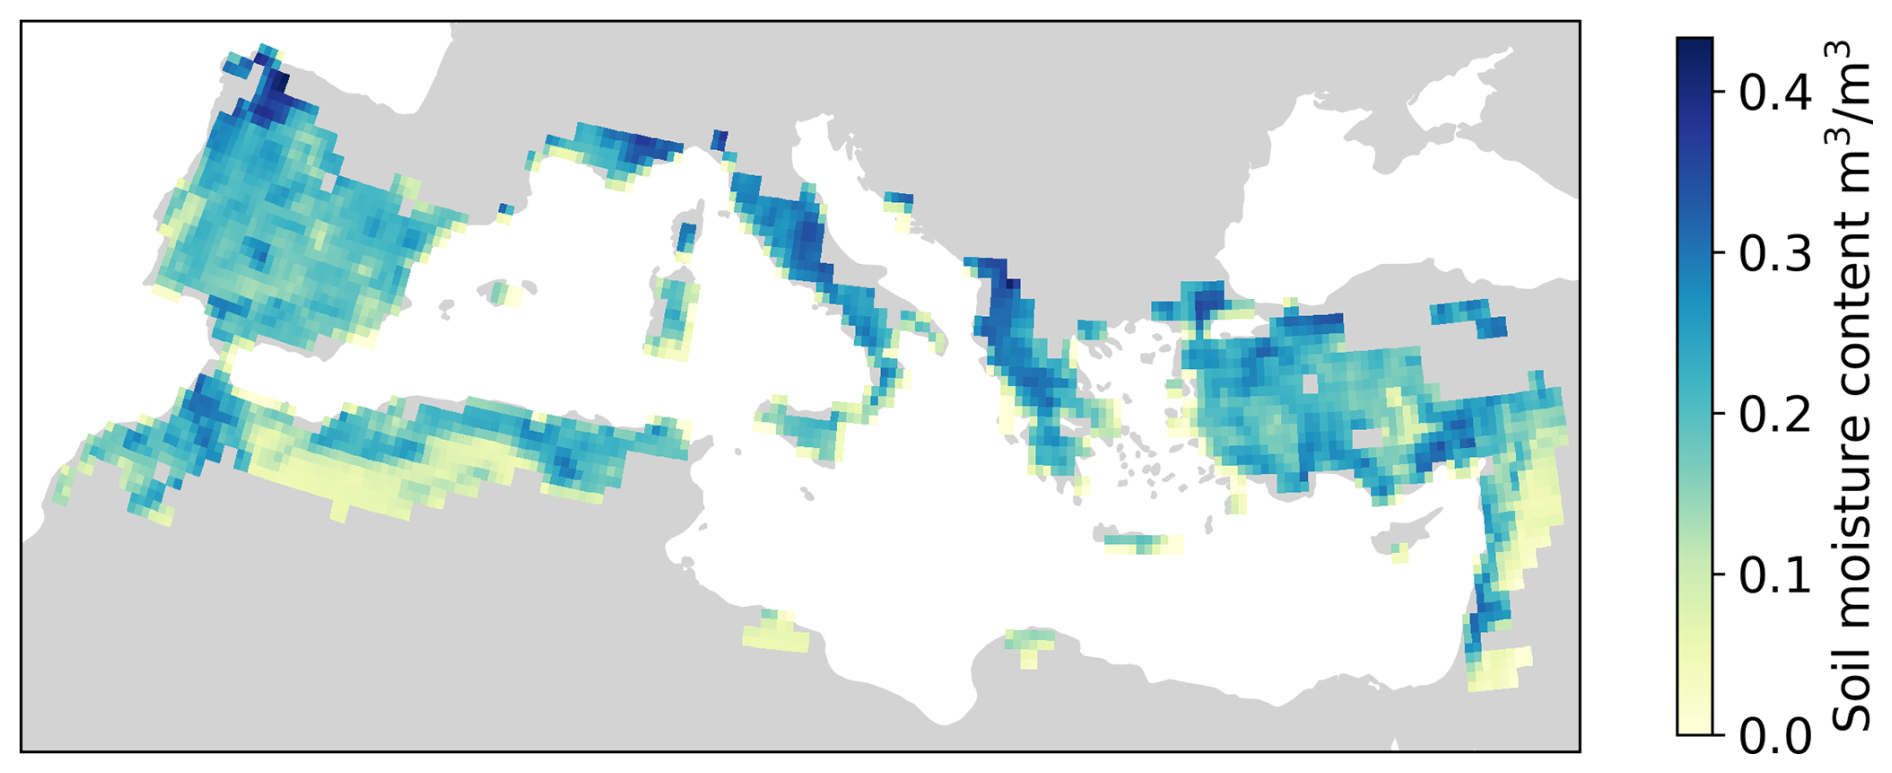
Figure 2The soil moisture content in the top layer for all regions around the Mediterranean Sea that have a Mediterranean climate according to the Köppen climate classification. This plot shows the mean soil moisture content in May and June for the years 2013–2022 and the data is obtained from ERA5.
2.2 The CLASS model
CLASS (Chemistry Land-surface Atmosphere Soil Slab) is a vertically integrated single column model that combines a mixed-layer-model for the atmosphere and a two-layer model for the land surface (van Heerwaarden et al., 2010; Vilà-Guerau de Arellano et al., 2015). The soil moisture and heat transport in and out of the soil are described with a two layer force-restore soil model. Force refers to the external inputs that affect soil moisture and temperature; restore refers to the intrinsic properties of the soil (Noilhan and Mahfouf, 1996). A slab model is used to simulate the development of the convective ABL (Tennekes, 1973; Tennekes and Driedonks, 1981). During the day, the ABL is well mixed and potential temperature and specific humidity within this layer can be represented by a single value, i.e., slab (Vilà-Guerau de Arellano et al., 2015). The exchange of heat and moisture between the soil and the atmosphere is regulated by a surface energy balance where the Penman-Monteith equation is used for closure (Monteith, 1965). The modelled atmospheric surface layer is based on the Monin–Obukhov similarity theory (Monin and Obukhov, 1954). In our set up, we used the land surface, radiation, mixed layer, shear growth, and surface layer modules. In addition, we used the land surface parameterization Jarvis-Stewart (Jarvis, 1976). Advection fluxes of heat and moisture were prescribed and large-scale subsidence was neglected. The advection fluxes account indirectly for large-scale horizontal atmospheric forcing. The LCL is calculated using constant air density (ρ), which results in extreme LCL values under dry conditions. However, it should be noted that under these dry conditions the potential for significant convection is unlikely. Finally, the integration timestep was 15 s and output was collected in 15 min interval means. The code for CLASS is available through http://classmodel.github.io/ (last access: 30 September 2025). Previous studies with CLASS that used observations for validation showed that the model reproduces the ABL processes well (Van Heerwaarden and Teuling, 2014; Wouters et al., 2019).
2.3 Model input
For our study, the input data for CLASS are divided into parameters and variables from which the latter group is split into variables that can directly be retrieved from data and variables that we needed to calculate (Table A1). The equations that we used to calculate these variables are presented in Appendix B. Variables were directly obtained from ERA5 data (Hersbach et al., 2020) or calculated from ERA5 data. We use ERA5 data as it provides the best available spatial and temporal coverage of the study region. However, the accuracy of the spatial and temporal variations in ERA5 surpasses the accuracy of its absolute values (Hersbach et al., 2020). Therefore, we need to carefully interpret our results and should mainly focus on spatial patterns as the absolute changes in the different variables are likely less meaningful. We used hourly ERA5 data, both “at pressure levels” and “at a single level” (Table A1). All parameter values were obtained from the ECMWF IFS documentation (ECMWF, 2010).
A typical ABL height in the morning is in the order of tens of meters to several hundred meters (Stull, 1988), so, first, we assumed that at 06:00 a.m. local time the boundary layer has a height of 100 m and is shear-mixed. Second, to calculate the soil moisture content for the soil sensitivity scenarios we used wilting point, field capacity and saturation for a medium textured soil as the most common soil types in the Mediterranean region are Cambisols (26 %), Calcisols (22 %), Leptosols (20 %), and Luvisols (10 %) (Allam et al., 2020), which vary from coarse to fine-textured. We assume that wilting point and field capacity are constant throughout the study region. Third, for the forest scenario we assumed a typical LAI for a mixed forest (LAI = 5 m2 m−2). Finally, for the albedo we assumed that the bare soil is light colored, which maximizes the difference between the albedo of a forest and albedo of bare soil.
To calculate the atmospheric conditions, we assumed a constant air density within the ABL and hydrostatic equilibrium. Furthermore, we assumed idealized linear profiles for the specific humidity and potential temperature.
2.4 Sampling
Due to the large number of days and grid cells in the study period and region we designed a specific sampling method for our input data that ensures a distribution that represents the entire Mediterranean Basin during this period. As the main aim of this study is to understand where in the Mediterranean Basin a forest may contribute to local rainfall we are mainly interested in spatial patterns in ABL development, and therefore, sample over the entire study region. The entire region is divided in 2868 grid cells of 0.25° × 0.25°. We decided to analyze the rainfall potential during the months May and June over a 10-year period (2013–2022). To obtain statistically significant results we conduct 20 runs per grid cell. To equally divide these runs over the 10-year study period we randomly select two days for each year. We study a 10-year period rather than a 30-year period to prevent an off-set in the model output due to a warming trend. The sampling resulted in a total amount of 57 360 samples. For each of these samples we ran the model using the specific input data for that location and day, resulting in a total of 20 model runs for each grid cell. The results are calculated including all samples after filtering (see Sect. 2.6). For the analyses on spatial variation, all samples per grid cell are used.
2.5 Experimental design
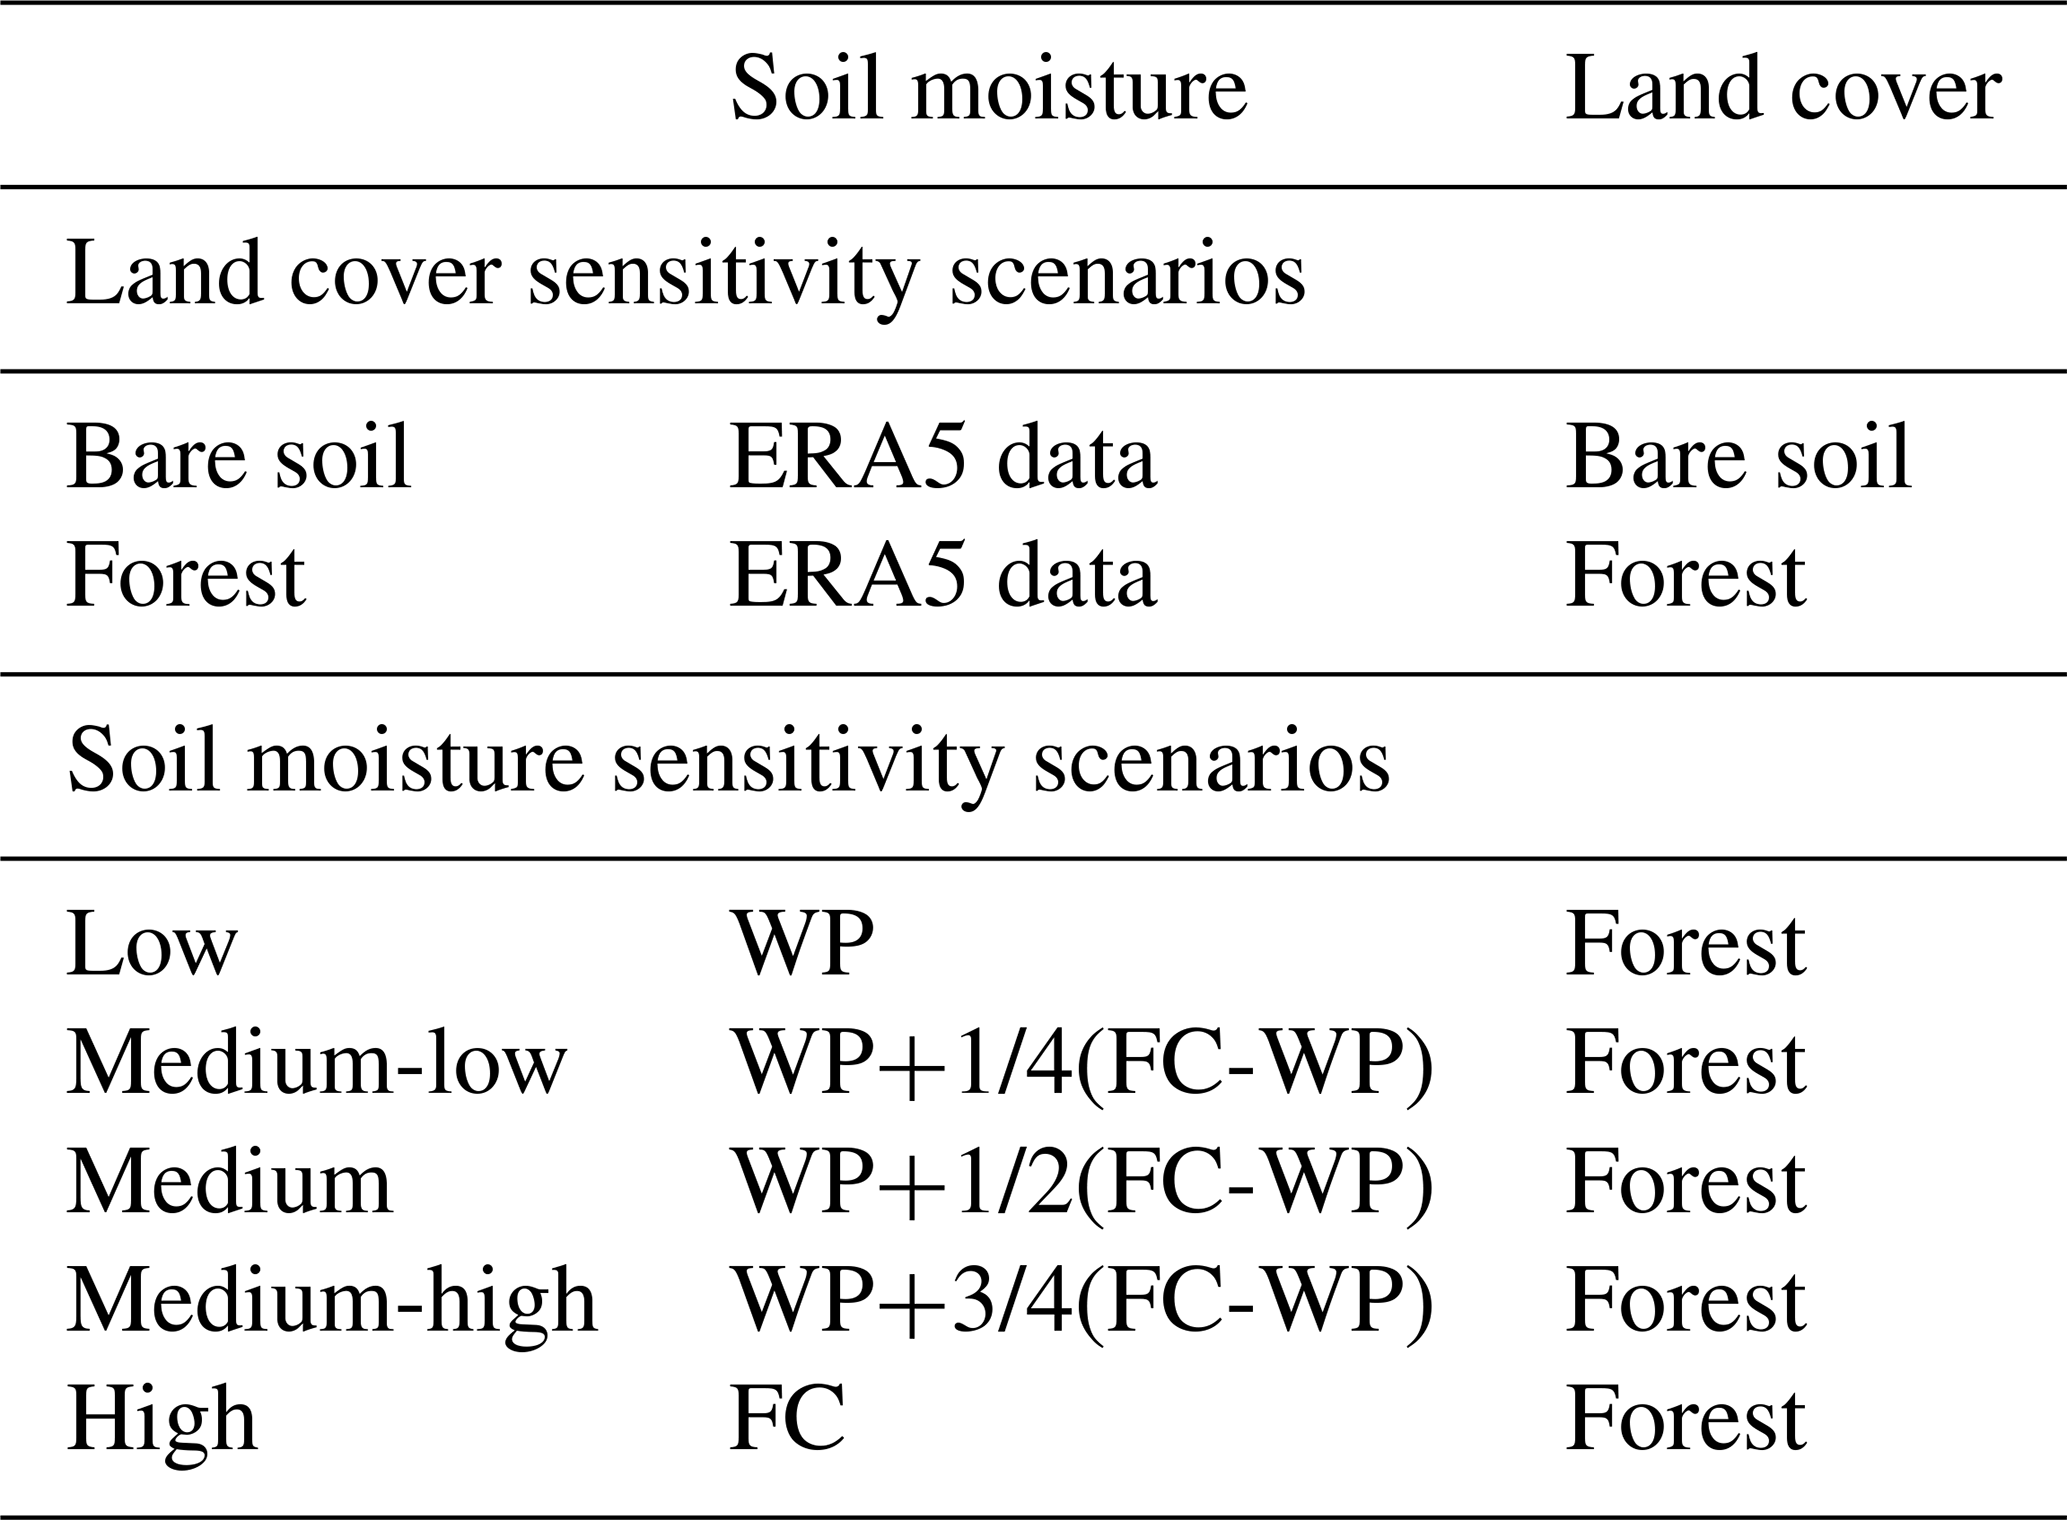
To study the influence of land cover and soil moisture on the LCL and the development of the ABL we designed two land cover scenarios and five soil moisture scenarios (Table 1). The development of the ABL over forest and bare soil is studied within grid cells specifically; the interactions between grid cells are not included in this model. For the land cover scenarios we vary the vegetation fraction, LAI, albedo, aerodynamic resistance, and roughness length for heat and momentum (Table A1). For the land cover scenarios, soil moisture varies among the grid cells and is obtained from ERA5. For the soil moisture scenarios the land is covered in forest. In these scenarios soil moisture is constant throughout the Mediterranean Basin for each simulation, however, soil moisture varies among different simulations, ranging from wilting point (WP) to field capacity (FC) (Table 1).
Table 1Experimental set-up describing the land cover and soil moisture scenarios. WP: wilting point and FC: field capacity. A more detailed description of the differences in input data for the bare soil runs and forest runs can be found in Table A1.
2.6 Postprocessing
To account for extreme values in our output data due to inconsistencies that are part of the input data, we filter out unrealistic output of CLASS by filtering the values of soil moisture of the top layer, relative humidity of the ABL, ABL height, potential temperature, and the jumps of potential temperature and specific humidity at the top of the ABL. The filters truncate the distribution for each of the variables and remove samples with values from below the 5th percentile and above the 95th percentile for all variables except the ABL height. As the ABL was not normally distributed we removed the simulations in which the ABL did not grow (≤ 100 m) and the variables above the 85th percentile. The exact filters can be found in Table A2.
29 957 Samples (52 %) pass the filter for both land cover type scenarios and these samples are used to study the land cover sensitivity. Due to the poor quality of the ERA5 data, specifically over dry regions, it was expected that there would be an error in the model output. The larger uncertainty in the ERA5 data for drier regions (https://confluence.ecmwf.int/display/CKB/ERA5, last access: 16 December 2024) explains why, after sampling, there are fewer samples available in relatively dry regions, i.e., low soil moisture, than in wet regions (Figs. A2 and A3). An increase in samples would not necessarily reduce this bias as it is expected that a similar percentage of samples will be filtered out.
After this postprocessing step, each grid cell had on average 10 ± 5 samples and there are 69 grid cells (2 %) without any samples. The model output may be biased as 48 % of the samples is discarded, mostly samples from dry regions. Therefore, the results from the dry regions need to be interpreted with care. However, it should be noted that for some grid cells in the dry regions more than only a few samples pass the filter. For example, coastal regions in the northern part of the Mediterranean Basin are relatively dry, yet, a relative large amount of samples passes the filter here. Regions where only a few samples pass the filter are locate in Libya, Lebanon, and Syria. Especially here, results need to be interpreted with care.
The samples that pass the forest filter (31 902 samples) were used to run CLASS for the soil moisture sensitivity scenarios as these scenarios are based on the forest scenario. However, due to different model input, CLASS produced some unrealistic output. We filtered this output using the same postprocessing filters as for the land cover scenarios (Table A2).
2.7 Validation
To validate the output of the CLASS model we compare different variables with the ERA5 data. We validate the output for the bare soil scenario using all grid cells that in reality have a short and tall vegetation cover that is equal to or smaller than 0.1 (Fig. A1). We obtain the short and tall vegetation cover from ERA5. In ERA5, short vegetation includes crops and mixed farming, irrigated crops, short grass, tall grass, tundra, semidesert, bogs and marshes, evergreen shrubs, deciduous shrubs, and water and land mixtures; tall vegetation includes evergreen trees, deciduous trees, mixed forest/woodland, and interrupted forest (Hersbach et al., 2023). However, not all these vegetation types are necessarily found in the study region. We validate the output for the forest scenario using all grid cells that in reality have a tall vegetation cover that is equal to or larger than 0.8 (Fig. A1a). As a result, 268 grid cells (9 %) are used to validate the bare soil scenario output, and 279 grid cells (10 %) are used to validate the forest scenario output (Fig. A1a). We validate the model output of the last time step (03:00 p.m. LT).
To validate the model output we studied the distribution of values for different output variables of CLASS and compared this to the distribution within the ERA5 data (at 03:00 p.m. LT). We study the distribution by calculating the mean, median and standard deviation of all samples for the relative humidity, potential temperature, boundary layer height and CAPE. These distributions show some discrepancies between the ERA5 data and the CLASS output (Table A3). The ERA5 data has some uncertainty due to biases in its underlying observations and models, making it challenging to interpret differences between ERA5 and CLASS. These biases are larger in dry areas compared to wet areas, though spatial and temporal patterns are less uncertain than absolute values. Therefore, we focus on the spatial patterns while interpreting our results.
2.8 Model output interpretation
To determine the convective rainfall potential from the model output we calculated the Convective Available Potential Energy (CAPE), Convective Inhibition (CIN), and whether the ABL and LCL cross (ABL ≥ LCL). CAPE is a measure for the potential for deep cloud development and the amount of water that can be condensed, while CIN represents the resistance to cloud formation by measuring how much energy is needed to initiate convection. The crossing of the ABL and LCL describes the potential onset of cloud development.
Near the surface an air parcel (i.e., a small package of air containing water vapor with uniform properties) may be cooler, and therefore heavier, than its environment, naturally resulting in a sinking motion. CIN is a measure for the amount of energy a parcel needs to reach the level at which it can rise freely. If a parcel is adiabatically (without heat transfer) lifted it may become warmer than its environment due to the vertical temperature gradient of the environment. If the parcel becomes warmer, and therefore less dense, than its environment it becomes buoyant and starts to rise. CAPE is the cumulative positive potential energy of a rising parcel that is warmer than its environment. We calculated CAPE and CIN using the cape_cin function of the MetPy python package (May et al., 2022) which uses the following equations:
These equations hold under the assumption that the parcel is lifted adiabatically until it reaches the LCL, passed the LCL it rises semi-adiabatically, i.e., condensation leaves the parcel (Wallace and Hobbs, 2006). In these equations Rd is the gas constant, EL is the pressure at the equilibrium level, LFC is the pressure at the level of free convection, SFC is the pressure at the surface level, Tv is the virtual temperature either of the parcel or the environment, and p is the atmospheric pressure.
For the input of these functions, surface pressure, and the profiles of potential temperature and specific humidity of the free atmosphere were assumed constant throughout the day and were obtained from the ERA5 input data. The potential temperature and specific humidity of the ABL and the jumps of potential temperature and specific humidity at the top of the ABL were obtained from the CLASS model output.
To analyze the sensitivity of different output variables and convective rainfall potential to land cover type we calculated the difference between both land cover scenarios for each sample specifically and the average of these differences for each grid cell. In addition, we determined the amount of samples that have sufficient CAPE as well as a crossing of the ABL and LCL. The latter is also done for the different soil moisture scenarios. To analyze the uncertainty of the convective rainfall potential we also study the convective rainfall potential for a change in ABL height, LCL and CAPE of ± 10 %. This small variation allows to study the relative sensitivity of the convective rainfall potential to variations in ABL height, LCL, and CAPE, and therefore, the robustness of the results.
3.1 Land cover sensitivity
The differences in boundary layer characteristics between the forest and bare soil scenarios show significant spatial variation (Figs. 3 and A4–A7). For ten different output variables, the anomalies between the forest scenario and bare soil scenario show the same spatial pattern (Fig. 3) which overlaps with the spatial variability of soil moisture content (Fig. 2). The difference between the forest and bare soil scenario for the different output variables of CLASS all statistically correlate to soil moisture, with the magnitude of the spearman rank correlation coefficients varying between 0.16 and 0.61 (both positive and negative correlations) (Fig. A8). Hence, the difference in the development of the ABL between the different types of land cover seems to be closely related to soil moisture content across the Mediterranean Basin. We identify two distinct mechanisms for boundary layer development, depending on soil moisture level: ABL moistening in wet regions and ABL heating and growth in dry regions.
Over a forest an additional amount of energy is available compared to over bare soil due to the lower albedo of the forest. For wet regions where soil moisture content is relatively large (Fig. 2), this additional energy that is available over a forest increases the latent heat flux whereas the sensible heat flux is relatively consistent or smaller than over bare soil (Fig. 3). The larger evapotranspiration flux over a forest enhances the moisture content of the ABL, enhancing the specific humidity (up to 0.002 kg kg−1), relative humidity (up to 20 %) and the jump in specific humidity at the top of the boundary layer (up to 0.002 kg kg−1; Fig. 3). As the sensible heat flux is smaller over a forest than over bare soil for some grid cells in the relatively wet regions, the potential temperature within the ABL is lower there as well (Fig. 3). The jump in potential temperature at the top of the ABL is slightly larger over forest than over bare soil.
In wet regions, CAPE is both larger as well as smaller over forest than over bare soil (differences up to 800 J kg−1; Fig. 3). For some of the mountainous regions in the Mediterranean Basin, CAPE tends to be much larger over forest than over bare soil (e.g., south Turkey, west of Greece and Adriatic coastline). For the relatively wet regions, the height of the ABL varies little between the forest and bare soil scenarios (Fig. 3) due to the relatively small difference in the sensible heat flux. The LCL varies also little between the forest and bare soil scenarios for most grid cells in the relatively wet regions (Fig. 3). However, for a few grid cells the LCL is lower over forest than over bare soil due to an increase in humidity.
For the relatively dry regions where the soil moisture content is relatively low (Fig. 2), the additional energy that is available over a forest compared to bare soil, due to the lower albedo, results in a larger sensible heat flux (up to 250 W m−2; Fig. 3). Compared to the relatively wet regions, less soil moisture is available for evapotranspiration in these relatively dry regions. The higher sensible heat flux contributes to the warming (up to 5 K) and drying (over −0.002 kg kg−1) of the ABL (Fig. 3), as well as the deepening of the ABL (up to 1 km). For these relatively dry regions, this strong development of the ABL for the forest cover scenario enhances the entrainment of warm and dry air from the free atmosphere into the ABL (Miralles et al., 2014). This entrainment contributes to the high potential temperatures over forest compared to bare soil where entrainment is likely smaller due to a weaker development of the ABL. In these dry regions, the latent heat flux varies little between the bare soil and forest scenarios, and therefore, the ABL is less humid in the forest scenario as in this scenario it grows deeper. The warmer and drier ABL contribute to a higher LCL over forest than bare soil. Furthermore, over these relatively dry regions, CAPE varies little between the two land cover scenarios, which shows that for the Mediterranean Basin, first, the presence of sufficient soil moisture seems to be necessary for CAPE to develop and, second, that solely a higher temperature does not necessarily enhance CAPE.
The dependency of the ABL development on soil moisture is highlighted further by the observed correlations between ABL characteristics and soil moisture content. For both land cover scenarios, the ABL height shows a negative correlation with soil moisture (Table A5), indicating the role of soil moisture in modulating the surface energy balance and, consequently, boundary layer growth. Over the Mediterranean Basin, the LCL also shows a negative correlation with soil moisture, with this relationship being more pronounced over forest than over bare soil (Table A5). This suggests that enhanced evapotranspiration in forested areas allows soil moisture to more effectively reduce the LCL, thereby potentially increasing the likelihood of ABL–LCL crossing. Despite this, no consistent correlation is observed between the difference in ABL height and LCL (ABL height minus LCL) and soil moisture (Table A5). Furthermore, CAPE does not show a clear relationship with soil moisture across the Mediterranean region (Table A5), suggesting that a change in the energy balance has a stronger impact on ABL growth than de development of CAPE.
There is a spatial variation in the sensitivity of the convective rainfall potential to land cover across the Mediterranean Basin (Fig. 4). Even though the ABL height and LCL show little variation between the two land cover types over the relatively wet regions the number of crossings is larger for the forest scenario (Fig. 4). Hence, only a small difference in the ABL height and/or LCL seems to have a significant impact on the convective rainfall potential. We find that 8.2 % of the samples have convective rainfall potential when the grid cells are covered in forest and 4.9 % of the samples have a rainfall potential when the grid cells are covered in bare soil (Fig. 4). Focusing on the two conditions for convective rainfall potential, for the bare soil scenario, 10 % of the samples have a crossing and 16 % of the samples have sufficient CAPE (≥ 400 J kg−1) and for the forest scenario, 26 % of the samples have a crossing and 32 % of the samples have sufficient CAPE (Fig. 4). Nevertheless, we see that most grid cells do not have a rainfall potential. The percentage of grid cells that has a rainfall potential is in the order of 1 % and 10 %. Despite that the number of samples with a rainfall potential may be low, there seems to be a clear relationship between the number of samples with a rainfall potential and the land cover type, i.e., a higher number of samples with rainfall potential over forest than over bare soil. This is also supported by the plot that shows the spatial variation (Fig. 4), which indicates a large number of grid cells with a rainfall potential over forest compared to bare soil.
For the western Iberian Peninsula, Italy, the Adriatic coastline and western Turkey, most of the grid cells show a larger convective rainfall potential for the forest scenario than the bare soil scenario (Fig. 4), yet, approximately thirty of the grid cells (1 %) show a smaller convective rainfall potential over forest (Fig. 4). For the relatively dry regions, the LCL is larger over forest than over bare soil, which explains why there is no convective rainfall potential here (Fig. 3). To test the robustness of the results we varied the ABL height, LCL, and CAPE with 10 %. Both for a 10 % increase as well as a 10 % decrease of these variables, the spatial variability of the sensitivity of the convective rainfall potential to land cover type is little affected. However, the total amount of samples with convective rainfall potential is affected (Figs. A9–A11).
Additionally, most grid cells have a CIN well below 100 J kg−1 for both land cover scenarios (Fig. A12), suggesting that inversions may be too weak to prevent deep convection. However, for some grid cells in both the bare soil and forest scenarios, CIN is close to or exceeds 100 J kg−1, indicating that deep convection is less likely here (Fig. A12). These grid cells are typically found in the south of the Mediterranean Basin, yet, both in relatively wet and dry regions. We do not observe a clear correlation between CIN and soil moisture (Table A5). For most grid cells, CIN varies only slightly between both land cover scenarios (Fig. A13). However, over forest, for a larger number of grid cells than for over bare soil, CIN is close to or exceeds 100 J kg−1 (Fig. A12). CIN is relatively large (≥ 75 J kg−1) in a small number of grid cells that show a convective rainfall potential, such as the south of Italy, as well as in grid cells that do not show a convective rainfall potential, such as in Israel, Libya and Morocco (Figs. 3 and A12).
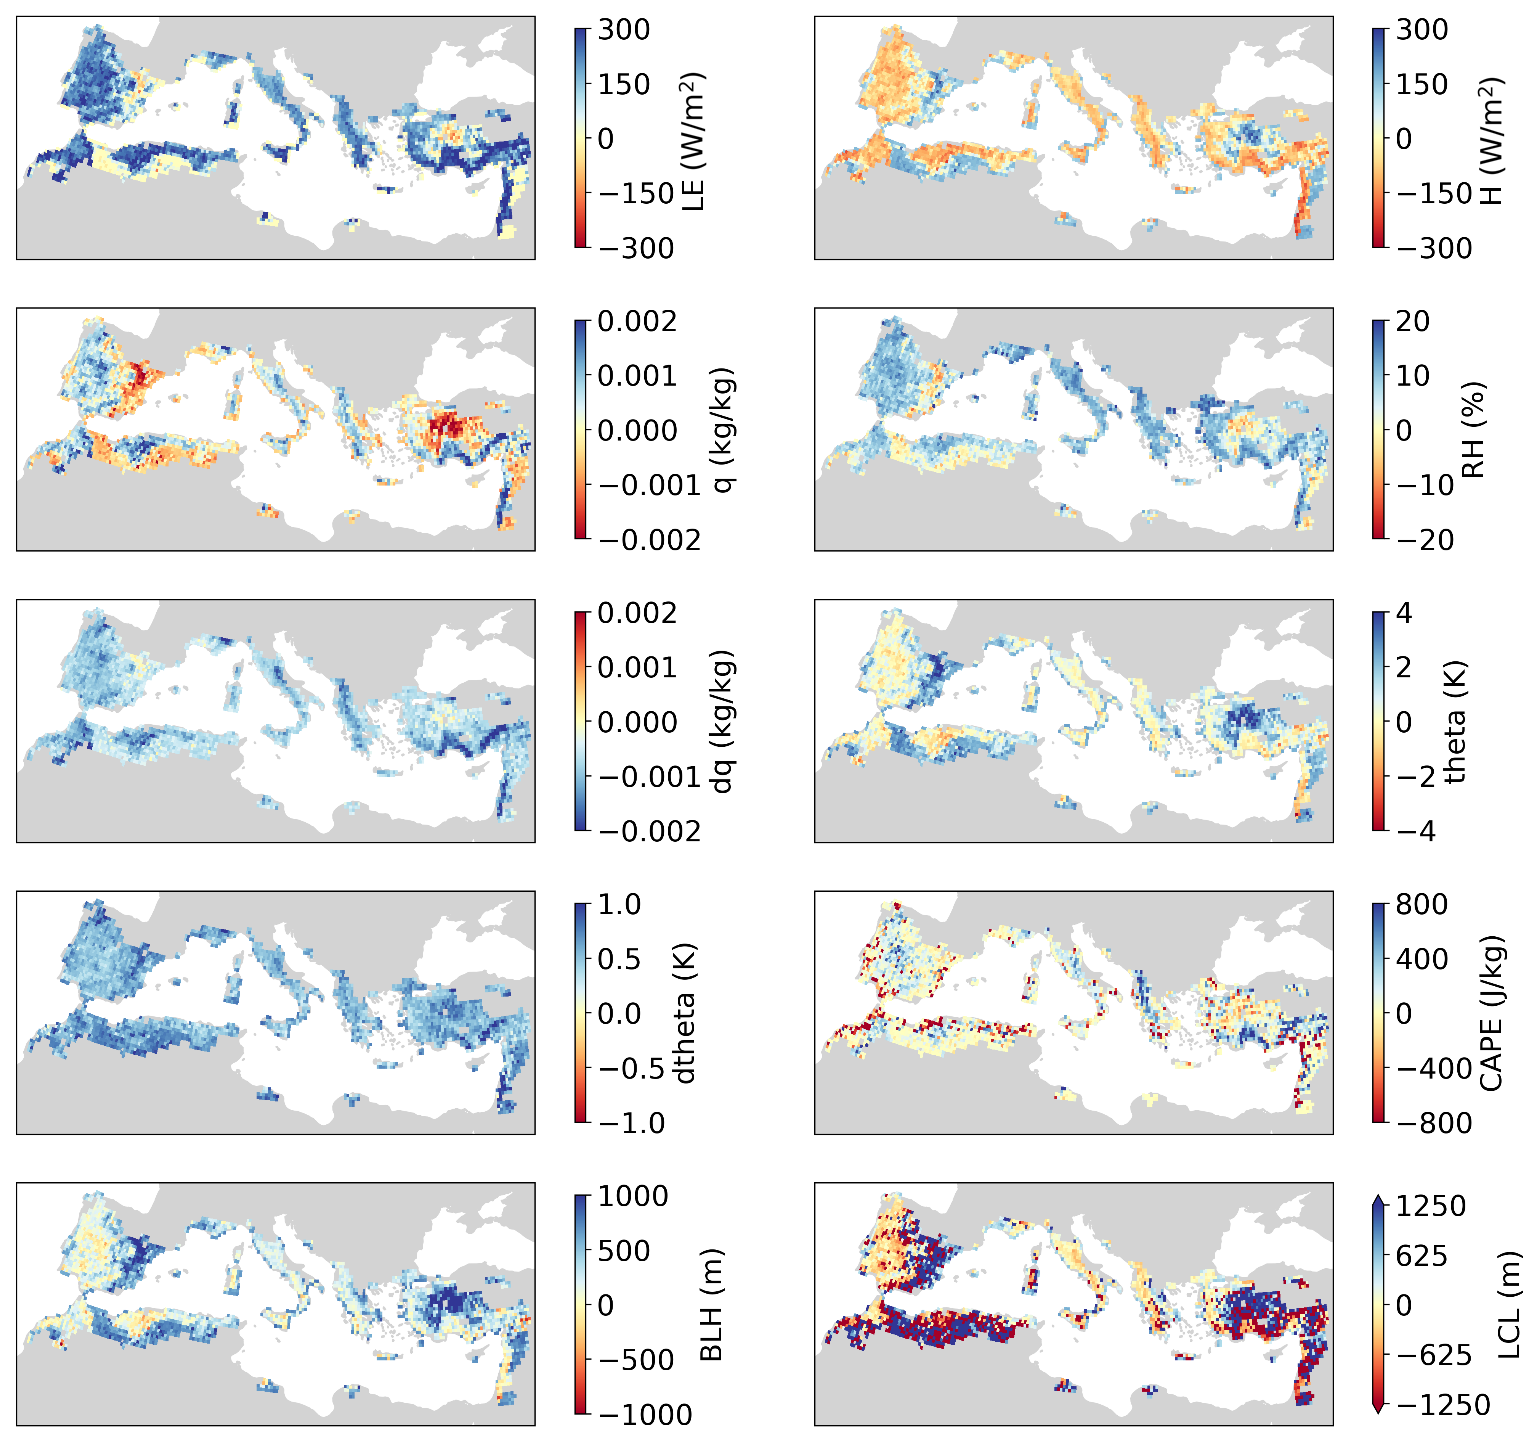
Figure 3Difference between forest scenario and bare soil scenario for different output variables of CLASS. Each grid shows the mean value of all samples for that specific grid cell. The total amount of samples per grid varies between 0 and 20 due to the postprocessing step. The output variables that are shown are the latent heat flux (LE), sensible heat flux (H), specific humidity (q), relative humidity (RH), jump in specific humidity at the top of the boundary layer (dq), potential temperature (θ), jump in potential temperature at the top of the boundary layer (dθ), convective available potential energy (CAPE), boundary layer height (BLH), and lifting condensation level (LCL). LE and H are surface fluxes, θ and q are by definition the mean within the ABL and the RH holds for the top of the ABL.
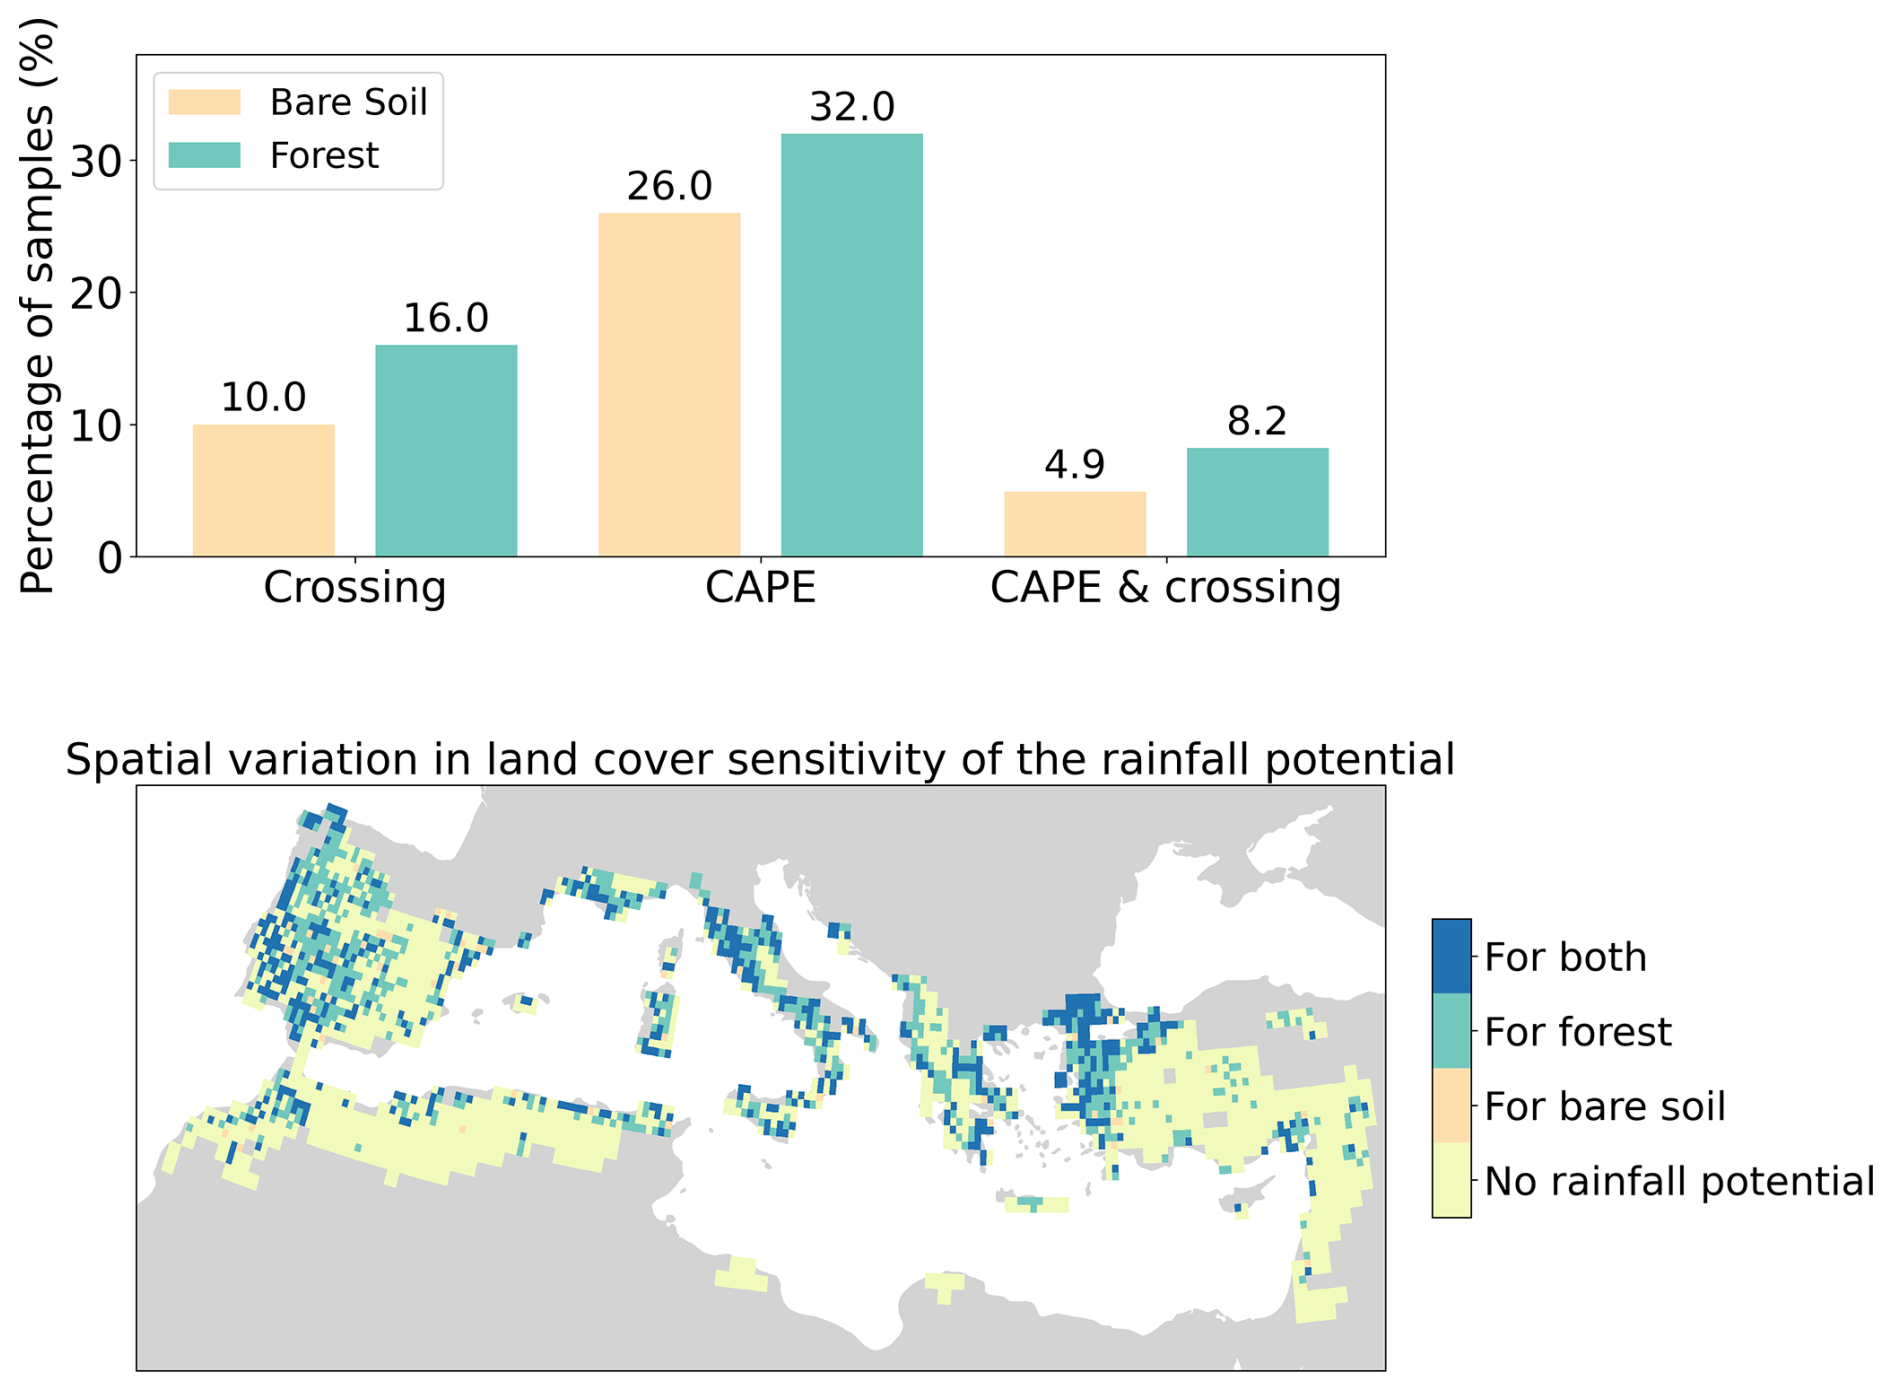
Figure 4Top: The percentage of samples with a crossing, sufficient CAPE (≥ 400 J kg−1), or both sufficient CAPE and a crossing for the Mediterranean Basin when covered in either forest or bare soil. Bottom: The spatial variability of the land cover sensitivity of the convective rainfall potential, i.e., there is both a crossing of the ABL and LCL (ABL ≥ LCL) and sufficient CAPE (≥ 400 J kg−1), if one or both of these conditions are not met there is no convective rainfall potential. This plot indicates for each grid cell if most samples have a convective rainfall potential over bare soil, forest or both land cover types or if they have no convective rainfall potential in any of the samples. These results are obtained from the model runs in which only the parameters that are related to land cover are varied. All other variables remain similar to the realistic situation and are obtained (directly or indirectly) from ERA5.
3.2 Soil moisture sensitivity
The model output for the different soil moisture scenarios shows that the fraction of samples with a crossing of the ABL and LCL at 03:00 p.m. LT increases linearly with soil moisture content (Fig. 5). This relationship is determined for soil moisture content ranging between the wilting point and field capacity. In addition, the fraction of samples for which CAPE exceeds 400 J kg−1 increases linearly with the soil moisture content (Fig. 5), supporting our previous finding that CAPE is larger over forest than over bare soil in relatively wet regions. With a change in soil moisture, the rate of change in the number of simulations with sufficient CAPE is larger (i.e., steeper slope) compared to the rate of change in the number of crossings. Finally, the fraction of samples with convective rainfall potential also increases linearly with soil moisture content. With a change in soil moisture the convective rainfall potential has a similar rate of change as the fraction of samples with a crossing (Fig. 5).
The convective rainfall potential does not increase everywhere in the Mediterranean basin when soil moisture increases (Fig. 5). In some grid cells in the central parts of the Iberian peninsula, Italy, Turkey, the Balkans, and northern Africa, convective rainfall potential is more pronounced when soil moisture equals the wilting point than when soil moisture equals field capacity (Fig. 5). This could be explained by a decrease in the sensible heat flux when soil moisture increases, minimizing the ABL development and crossing. However, a larger amount of grid cells show that the convective rainfall potential increases with an increase in soil moisture content.
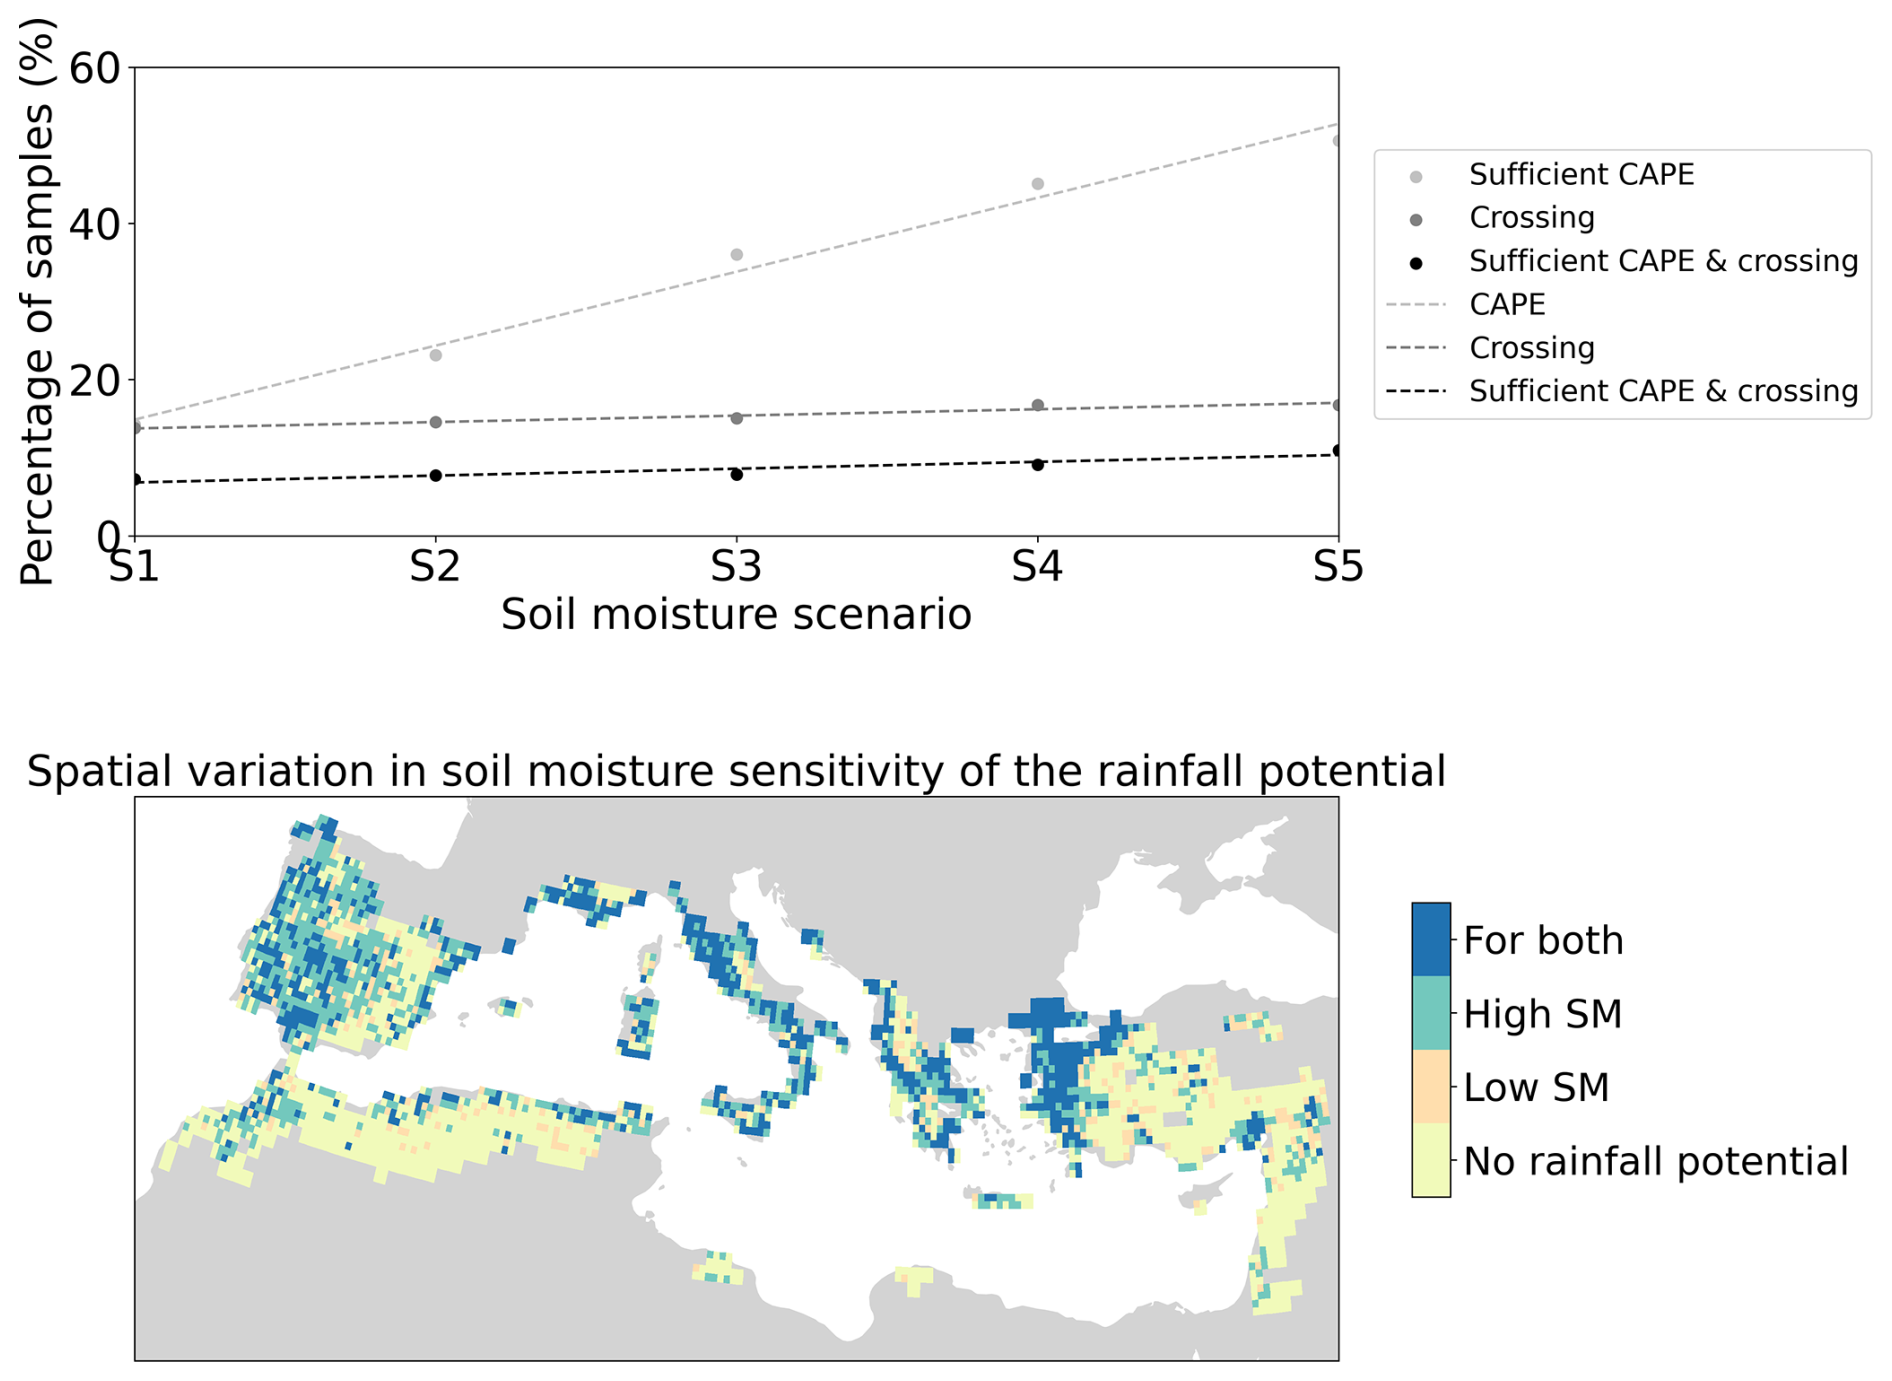
Figure 5Top: The percentage of samples with a crossing, sufficient CAPE (≥ 400 J kg−1), or both sufficient CAPE and a crossing for varying soil moisture content. The different soil moisture scenarios increase linearly from wilting point (S1, 0.15 m3 m−3) to field capacity (S5, 0.35 m3 m−3). The dotted lines are the regression lines (CAPE: R2 = 0.98, crossing: R2 = 0.93, CAPE & crossing: R2 = 0.87). Bottom: The spatial variability of the soil moisture sensitivity of the convective rainfall potential, i.e., there is both a crossing of the ABL and LCL (ABL ≥ LCL) and sufficient CAPE (≥ 400 J kg−1), if one or both of these conditions are not met there is no convective rainfall potential. This plot indicates for each grid cell if most samples have a convective rainfall potential for soil moisture scenario 1, soil moisture scenario 5, or both soil moisture scenarios, or no convective rainfall potential in any of the samples. These results are obtained from the model runs in which should moisture content is varied among the different cases. Land cover parameters represent the forest scenario. All other variables remain similar to the realistic situation and are obtained (directly or indirectly) from ERA5.
4.1 Boundary layer development under change
The land cover types bare soil and forest have a different impact on the atmospheric boundary layer (ABL) characteristics and the local convective rainfall potential in the Mediterranean Basin. In this study, we defined the convective rainfall potential as the combination of the occurrence of a crossing between the ABL and lifting condensation level (ABL ≥ LCL) and when there is sufficient convective available potential energy (≥ 400 J kg−1, CAPE). Under these conditions, parcels can rise over a depth great enough to trigger precipitation. However, this may be limited because of convective inhibition (CIN). As for most grid cells CIN is small (< 100 J kg−1), it is expected that it affects the convective rainfall potential only little. By definition, LCL and CAPE correlate as both are computed following a rising parcel. Therefore, changes that lead to an earlier LCL crossing may also result in an increase in CAPE (Yin et al., 2015). We find that convective rainfall potential is not necessarily higher for the forest scenario than for the bare soil scenario. The difference in convective rainfall potential between two land cover types varies with soil moisture. Forests mainly contribute to a higher convective rainfall potential over relatively wet regions. However, not all grid cells in the relatively wet regions have a higher convective rainfall potential over forest and some grid cells, specifically in the center of the Iberian Peninsula, show even a lower convective rainfall potential over forest than bare soil. The number of grid cells where convection is inhibited is rather low for both land cover type scenarios. However, CIN is slightly larger for the forest scenario than the bare soil scenario, indicating that forests may contribute negatively to convection to a small extent. Overall, in dry regions, few grid cells have a convective rainfall potential for either the bare soil- or forest scenario.
The soil moisture content also has an impact on whether a forest has a net cooling or warming effect. For relatively dry regions, comparing the bare soil- and forest scenario, the increased net radiation over forest is mainly transferred into sensible heat, contributing to the warming of the ABL. For relatively wet regions, the increase in net radiation over forest enhances evapotranspiration, preventing the potential temperature within the ABL to rise and even contributing to cooling in some locations. This cooling effect can explain why some locations have a convective rainfall potential in the bare soil scenario and not in the forest scenario as it minimizes the deepening of the ABL and heating through entrainment of warm air from the free atmosphere.
When soil moisture is varied across the Mediterranean Basin we find that, overall, the convective rainfall potential increases linearly with soil moisture content. However, for some grid cells across the basin, the convective rainfall potential decreases with increasing soil moisture content. These grid cells have a convective rainfall potential when soil moisture equals the wilting point, yet these cells do not have a convective rainfall potential when the soil moisture equals field capacity. This negative relation between soil moisture and convective rainfall potential could be explained by a stronger cooling effect over wetter soils. Additionally, it shows that the relationship between soil moisture and convective rainfall potential is more complex than the overall linear relationship that we found.
An increase in soil moisture does not necessarily relate linearly to evapotranspiration but their coupling is dependent on the aridity of the region and is stronger in relatively dry regions (Seneviratne et al., 2010). However, this stronger coupling in dry regions does not necessarily reflect in an increase in rainfall when soil moisture increases as only a limited range of free atmospheric conditions allows for convective rainfall potential (Findell and Eltahir, 2003a, b; Juang et al., 2007; Konings et al., 2011). This may explain why the effect of an increase in soil moisture on convective rainfall potential seems to be most pronounced close to regions that already have a convective rainfall potential for less soil moisture. Here the atmospheric conditions may already be near the threshold for convective rainfall potential.
In the eastern and southern Mediterranean Basin, atmospheric conditions appear to limit convective rainfall potential, as increasing soil moisture, even up to field capacity, does not effectively trigger precipitation (Findell and Eltahir, 2003a). This regional difference may be attributed to the large-scale atmospheric circulation patterns characteristic of the Mediterranean Basin, which create contrasting weather conditions between its eastern and western regions (Roberts et al., 2012). This climatic “see-saw” likely explains why enhanced soil moisture supports convective rainfall potential in the western Mediterranean but fails to do so in the eastern part. In the eastern Mediterranean, unfavorable free atmospheric conditions may inhibit the development of convective rainfall potential despite increased soil moisture.
4.2 Discussion on the simulation
The results presented here need to be interpreted carefully for several reasons. First, the CLASS model provides a simple description of the processes within the ABL and therefore, this study is limited to studying convective triggering through processes within the ABL. The model assumes that the upper atmosphere is not affected by the land cover. Consequently, we approximated the potential for convective precipitation using CAPE and the crossing of the ABL and LCL overlooking the contribution of mid-tropospheric moisture to convective precipitation. In this “simple” set-up, clouds are not explicitly modelled, and therefore, there is some uncertainty in the energy balance. Clouds increase the albedo as they partially reflect incoming radiation, which is not included in the model. This feedback would likely have a cooling effect (Cerasoli et al., 2021; Fraedrich and Kleidon, 1999), specifically over wet regions, which has a negative impact on the development of the ABL and CAPE (Seeley and Romps, 2015; Vilà-Guerau de Arellano et al., 2015).
Second, as the model describes the properties of the ABL with a single value, the horizontal spatial component is not taken into account. This horizontal spatial component is essential to simulate the impact of surface roughness on convection (Pielke, 2001) or to simulate the development of a sea breeze during the day. Hence, moisture convergence, which contributes to the development of convective precipitation, may be underestimated in the CLASS model. Nevertheless, advection of moisture and heat is prescribed in this model, and therefore, horizontal large scale forcing, which also affects convective rainfall, is accounted for in this model to some extent. The spatial component can be included in more complex models such as a large eddy simulation model. Although CLASS does not simulate all processes, it allows us to improve our understanding of the main interactions between the land surface and the ABL that are responsible for convective precipitation.
Third, ERA5 has some uncertainty, specifically over dry regions (https://confluence.ecmwf.int/display/CKB/ERA5, last access: 16 December 2024). However, by using ERA5 as input data we can represent the present-day climate realistically for a large region. To the best of our knowledge, this is the first study to use ERA5 as input data for CLASS. Previous studies mainly use in-situ observations as input for and validation of an ABL model (Vilà-Guerau de Arellano et al., 2004; Wouters et al., 2019), yet due to the size of our study region this was not possible. Relative to the uncertainty of exact values over dry regions, the spatial and temporal variation of the ERA5 data have a higher accuracy which is why we focus on the spatial patterns. Our results showed that a change in ABL height, LCL or CAPE of 10 % does not affect the spatial pattern of the land cover sensitivity of the convective rainfall potential (Figs. A9–A11), so the inaccuracy of the exact values may be of less importance.
Finally, a relatively large amount of samples is filtered out due to unrealistic model output resulting in uncertainty. This holds specifically for the relatively dry regions where for some grid cells a large fraction of the samples is removed. Nevertheless, in these dry regions, there is a significant amount of grid cells for which 50 % or more of the samples pass the filter. It is expected that for a larger number of samples the same percentage of samples will be filtered out, not necessarily reducing the uncertainty. Due to filtering and uncertainties in ERA5 data, the absolute values shown in Fig. 2 are less meaningful than the spatial patterns. Although the convective rainfall potential (Figs. 3 and 4) is calculated using these absolute values, variations in ABL height, LCL, and CAPE have only a minor effect on its overall spatial distribution (Figs. A8–A10). It should be noted that the aim of this study is not to give an accurate prediction of the hydrological effects of forestation, yet, it aims to identify in what regions forests may contribute to local rainfall.
4.3 The uncertainty of rainfall potential under global change
In line with previous literature, our results indicate that forests can have both cooling and warming effects in the Mediterranean Basin. Ruijsch et al. (2024) found that land restoration has a net cooling effect in parts of northern Africa due to increased evaporation, whereas Portmann et al. (2022) observed that forests have a net warming effect throughout the entire Mediterranean Basin. King et al. (2024) did not find a significant relation between temperature and forests in temperate regions. While these studies highlight the potential for both warming and cooling effects of forests, they do not acknowledge the dependence of these effects on soil moisture content. Nevertheless, the coupling between vegetation and soil moisture has been previously established (Bonan, 2008; Materia et al., 2022) and is especially strong in arid regions (Forzieri et al., 2017).
The larger precipitation potential over forests compared to bare soil that we found is also in line with previous climate modelling efforts that found a positive relation between terrestrial precipitation and forests (Fraedrich and Kleidon, 1999; Gibbard et al., 2005; Portmann et al., 2022). However, the impact of forests on local precipitation is less clear because the local and remote effects are not isolated in these model studies. There are some modelling efforts that were able to identify local reductions in precipitation resulting from deforestation (Luo et al., 2022; Winckler et al., 2017) as well as a data analysis effort that was able to identify a positive effect of vegetation on local water availability and precipitation (Cui et al., 2022). Our study supports these results that suggest that forests may enhance local precipitation.
Similar to previous studies, our results indicate a positive relation between CAPE and soil moisture content (Emanuel, 2023; Leutwyler et al., 2021; Liu et al., 2022). Even though we found that CAPE increases linearly with soil moisture, it is expected that this relationship is more complex. This is expected because first, convective storms might not develop over too wet soils due to a larger amount of energy that is needed to raise an air parcel from the surface to the level of free convection (Emanuel, 2023) and second, storms could also intensify when moving towards drier areas (Liu et al., 2022). Nevertheless, soil moisture availability seems to be an important factor to establish CAPE and convective rainfall potential, especially over mountainous regions (Liu et al., 2022), and as a result, precipitation is promoted over wet soils and reduced over dry soils during summer, indicating a soil moisture-rainfall feedback (Ardilouze et al., 2022; Findell and Eltahir, 2003b; Leutwyler et al., 2021).
By only modelling the local processes under current climate conditions, remote effects on convective rainfall potential as well as the impact of atmospheric warming are overlooked. For example, climate change may reduce local moisture recycling as under drier than normal conditions, local moisture recycling tends to be below average, and under wetter than normal conditions local moisture recycling tends to be above average (Theeuwen et al., 2023). In addition, drying due to climate change may negatively affect soil moisture. As ABL height and LCL correlate negatively with soil moisture, climate change may result in deeper boundary layers and higher LCLs. However, as LCL shows a stronger correlation with soil moisture over forest than bare soil, drying may have a stronger impact on the LCL over forests than over bare soil, negatively impacting rainfall potential. Nevertheless, atmospheric warming contributes to increased sea surface temperature and sea water evaporation, which may have a stronger impact on precipitation than forests (King et al., 2024). In addition, changes in land cover affect temperature and humidity, and therefore, will likely affect the transport of moisture and heat (Lian et al., 2022; Meier et al., 2021; Pielke, 2001; Portmann et al., 2022; Staal et al., 2024), and local and remote precipitation events (Theeuwen et al., 2024).
4.4 Forestation to enhance the convective rainfall potential locally
Forestation projects are realized around the globe with the aim of carbon sequestration to reduce global warming. In addition to this climatic effect, forests also influence the hydrological cycle and may alter precipitation patterns. Hence, to realize sustainable forestation initiatives it is crucial to better understand their hydrological effects. The results presented here may be used to evaluate where a mature forest may contribute to more rainfall locally, and therefore, where forestation may have positive hydrological effects.
The results suggest that for forestation efforts to contribute to convective rainfall, they need to be conducted in relatively wet regions. Not only sufficient soil moisture needs to be available, also a relatively humid atmosphere is beneficial to local moisture recycling (Theeuwen et al., 2023, 2024). Evidently, the soil moisture content and atmospheric humidity are closely linked (Seneviratne et al., 2010), specifically in regions that are neither extremely wet, nor extremely dry (Konings et al., 2011). Moving towards the south in the Mediterranean Basin, wetness decreases and convective inhibition slightly increases. This suggests that it is more likely that forestation enhances convective rainfall in the north than in the south of the Mediterranean Basin.
Furthermore, our results suggest that the conditions of the free atmosphere may affect where forestation efforts contribute to convective rainfall potential; these conditions vary across space. The climatic “see-saw” that has been observed in the Mediterranean Basin (Roberts et al., 2012) may explain why the atmospheric conditions in the western and northern parts of the basin seem to be more favorable to trigger convective rainfall potential over forests than the conditions in the east and south. Furthermore, forests mainly seem to contribute to a convective rainfall potential in grid cells adjacent to those already exhibiting significant convective rainfall potential over bare soil, likely because the atmospheric conditions in these areas are favorable for convective rainfall potential.
When zooming in on specific regions, especially coastal ones, we observe potential for convective rainfall enhancement through forestation. This is observed in Italy, Greece and northern Africa and corresponds to previous research efforts that show a negative relation between local evaporation recycling and the distance to the nearest coast (Theeuwen et al., 2024). However, for a few grid cells in these locations, convective rainfall is unlikely due to convective inhibition. Finally, mountains seem to promote the crossing of the ABL and LCL (e.g., in southern Turkey). Complex terrain enhances the sensitivity of convection to soil moisture (Liu et al., 2022). Therefore, our results suggest that forestation in coastal regions with elevated terrain and relatively high soil moisture may contribute to local rainfall, specifically in the northern and western part of the Mediterranean Basin. These elevated regions, and the northern part of the Mediterranean Basin, currently already receive most convective precipitation in the Mediterranean Basin (Fig. A1).
However, it should be noted that due to competing land use (e.g., agriculture or cities), soil type, or climatic conditions some of these areas are not suited for forestation efforts (Noce et al., 2017; Tóth et al., 2008). Additionally, the results presented here do not include the gradual development of a forest as a result of forestation and therefore merely give an indication of where forestation may have positive hydrological effects once the forest has matured. A more complex modelling study would be necessary to investigate the hydrological effects of forestation over time as these may cause temporal variation in the evaporation flux and energy balance.
The goal of this study was to investigate the impact of forestation on the convective rainfall potential in the Mediterranean Basin during early summer. There is convective rainfall potential when the atmospheric boundary layer (ABL) and lifting condensation level (LCL) cross and the convective available potential energy (CAPE) is at least 400 J kg−1. Using the CLASS model, the boundary layer development was simulated for two land cover scenarios: each grid cell covered fully in (1) bare soil, and (2) mature forest. We found that CAPE, the amount of crossings, and the convective rainfall potential are larger over forest than over bare soil in various locations within the Mediterranean Basin. Soil moisture relates to how the ABL develops over forest and bare soil and also to the uncertainty of the ABL development with higher uncertainty in relatively dry regions. In these relatively dry regions, forest contributes to the warming and drying of the ABL, resulting in a deepening of the ABL and increase of the LCL, which overall does not contribute to a crossing. In relatively wet regions, forest cover moistens the ABL and enhances CAPE, which overall contributes to convective rainfall potential. However, for a few relatively wet grid cells forest cover seems to reduce the convective rainfall potential compared to bare soil.
Furthermore, additional simulations with different soil moisture scenarios, ranging from wilting point to field capacity, underlined the crucial role of soil moisture for convective rainfall potential. Similar to the impact of forest cover on convective rainfall potential, for a few grid cells an increase in soil moisture has a negative impact on the convective rainfall potential suggesting that there is an optimal amount of soil moisture. Even though our results indicate the important role of soil moisture in reaching convective rainfall potential, it seems that for specific atmospheric conditions no crossing occurs, even when soil moisture content reaches field capacity. Nonetheless, our results suggest that, overall, there is a positive relation between soil moisture content and the convective rainfall potential.
In summary, mature forests mainly contribute to local rainfall in relatively wet regions, close to the coast and over elevated terrain. Thus, to potentially enhance local rainfall through forestation, forestation initiatives in the Mediterranean Basin could be conducted in coastal and elevated regions that are relatively wet. In such regions, the local return of evaporated water as rainfall may prevent local drying due to enhanced evaporation.
Table A1List of input variables for the CLASS model. The data inputs are divided into parameters and variables, from which the latter group is divided into variables that can directly be obtained from ERA5 data and variables that needed additional calculation steps. Constants are obtained from ECMWF IFS documentation (ECMWF, 2010).
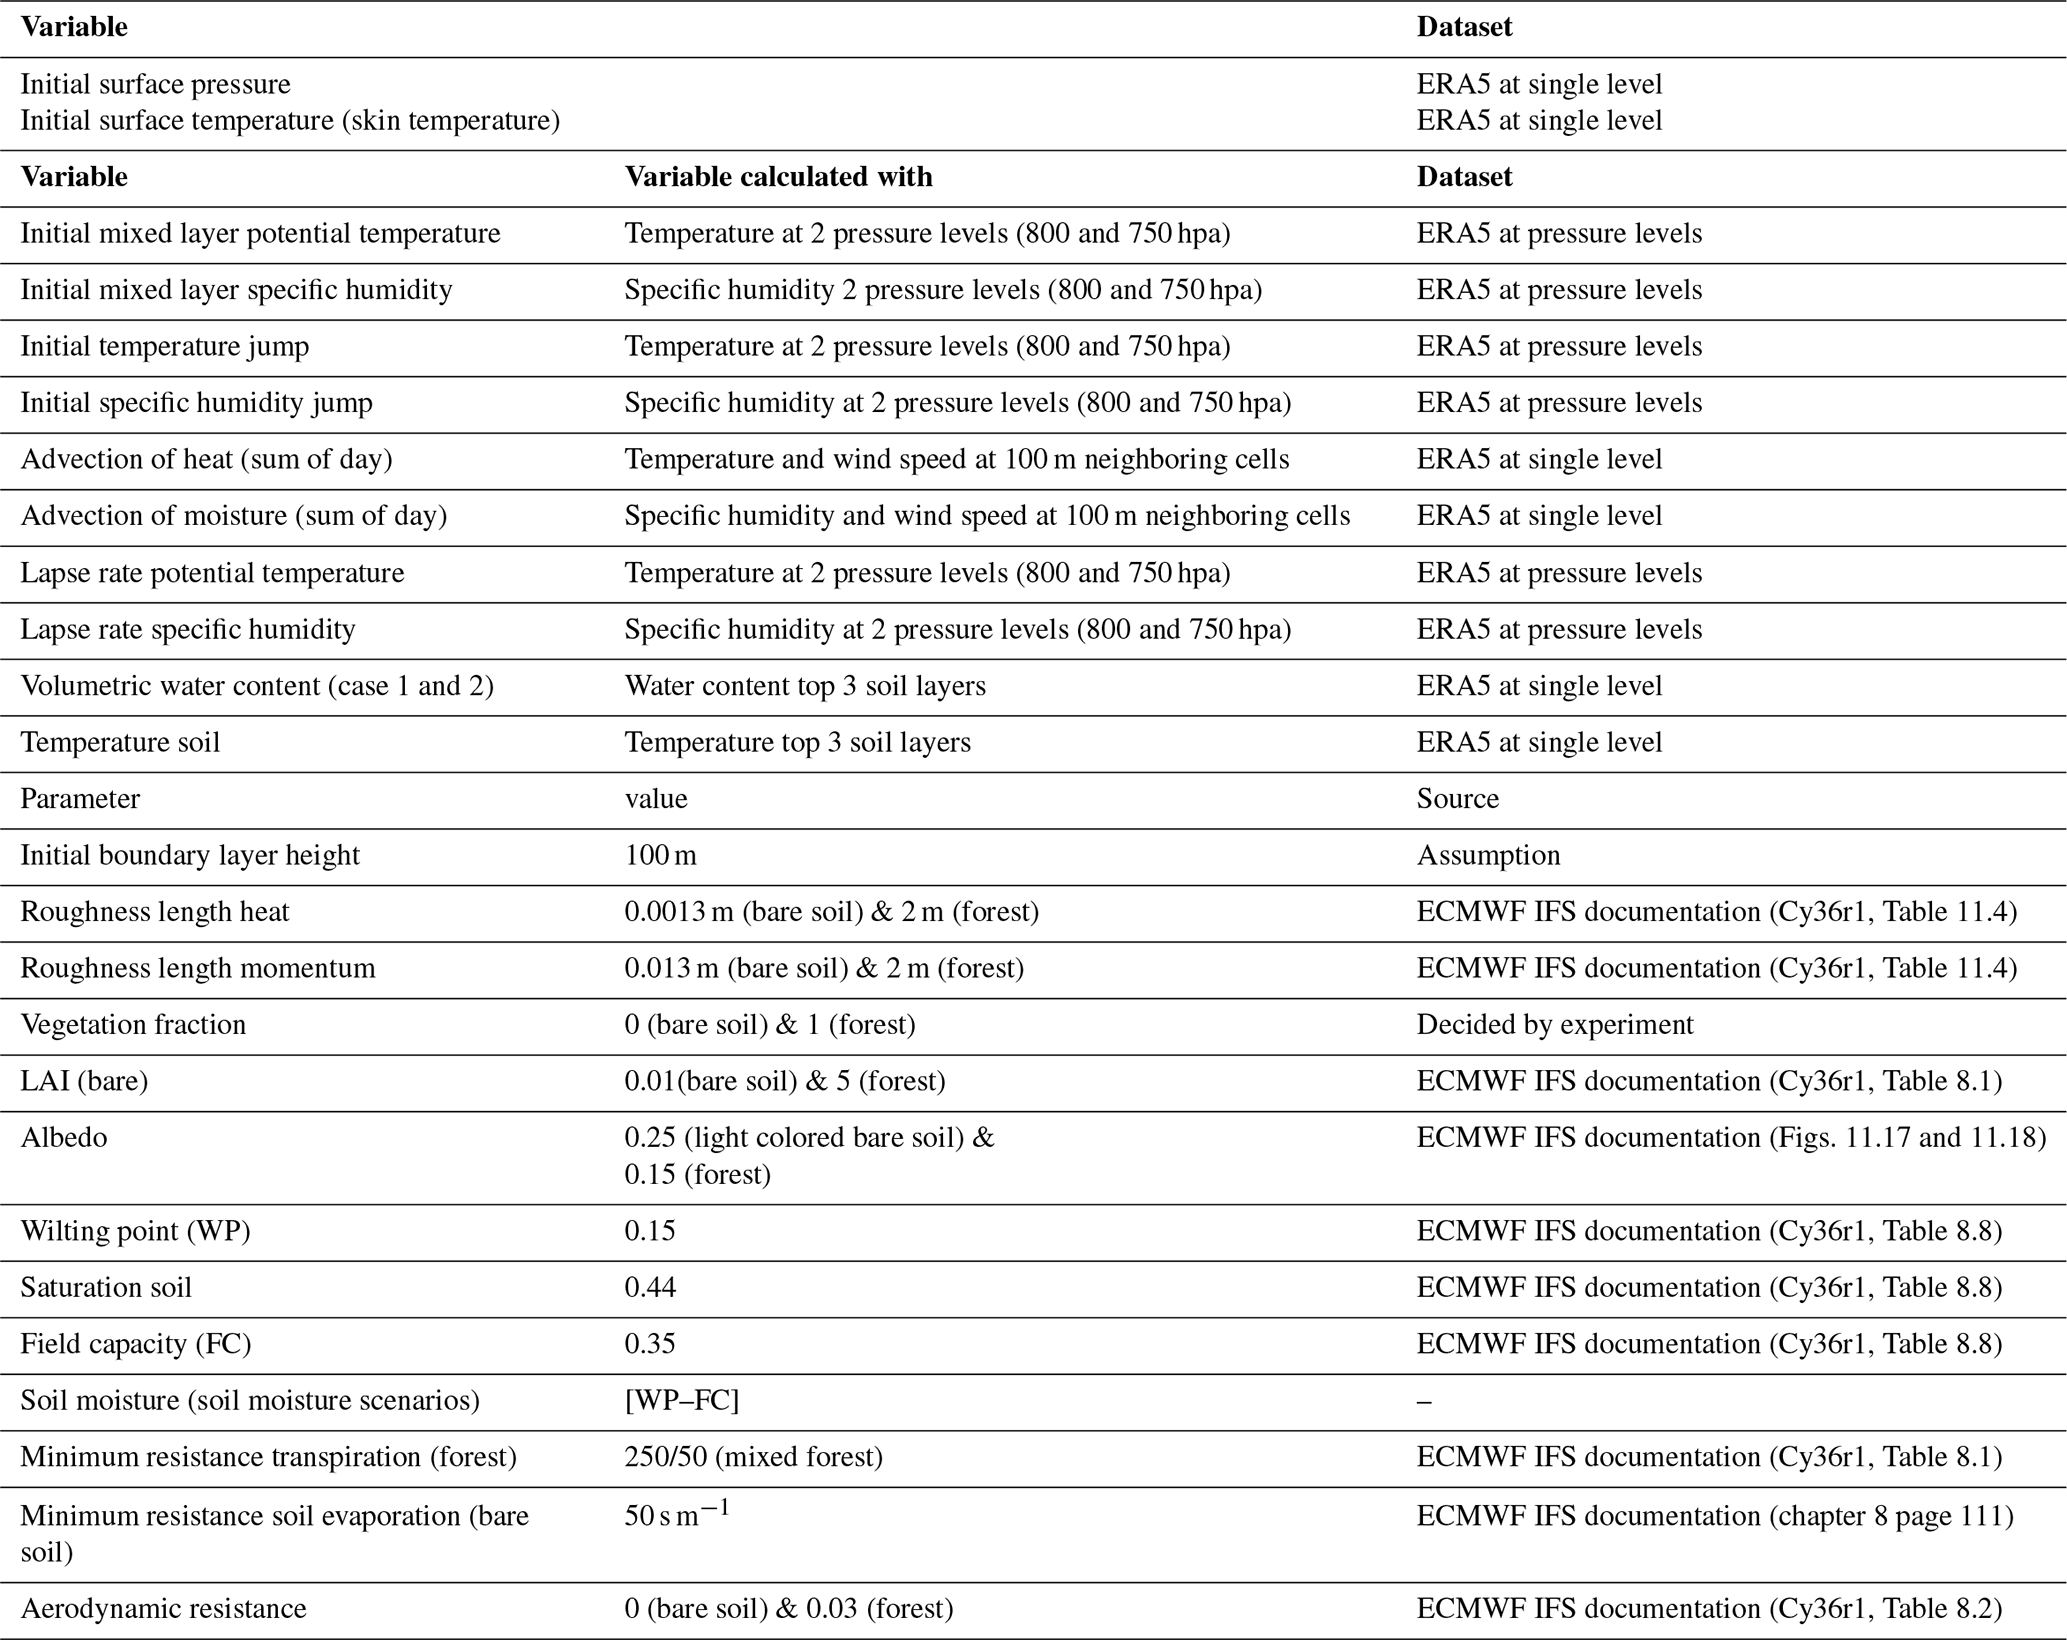
Table A2List of postprocessing filters that were applied to filter out the unrealistic output of CLASS.
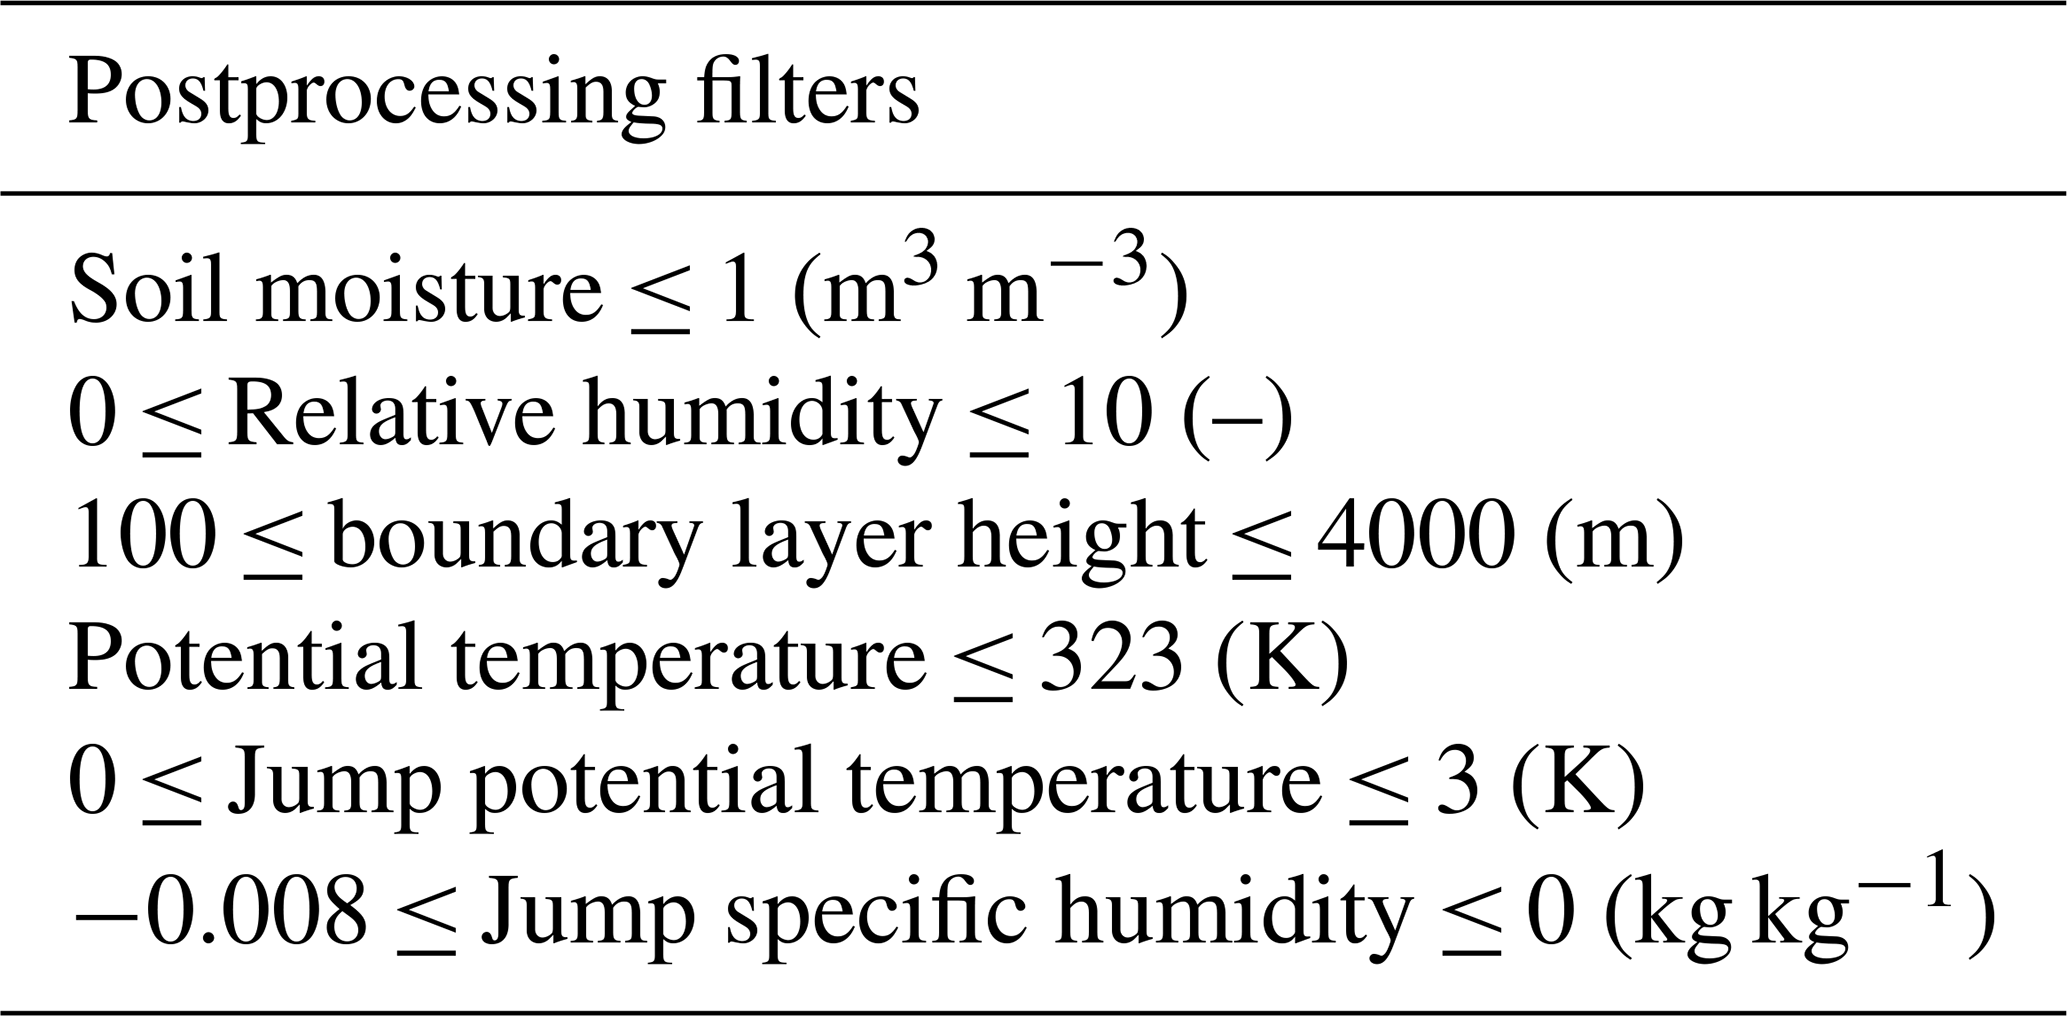
Table A3The mean, median, and standard deviation of different variables for the bare soil validation samples and the forest validation samples. For temperature we take the potential temperature from CLASS and the temperature at 2 m from ERA5. Following an ideal temperature profile, in the surface layer of the ABL the potential temperature is lower than in the mixed layer. It is not possible to make a comparison between bare soil and forest as these values are obtained for different locations.
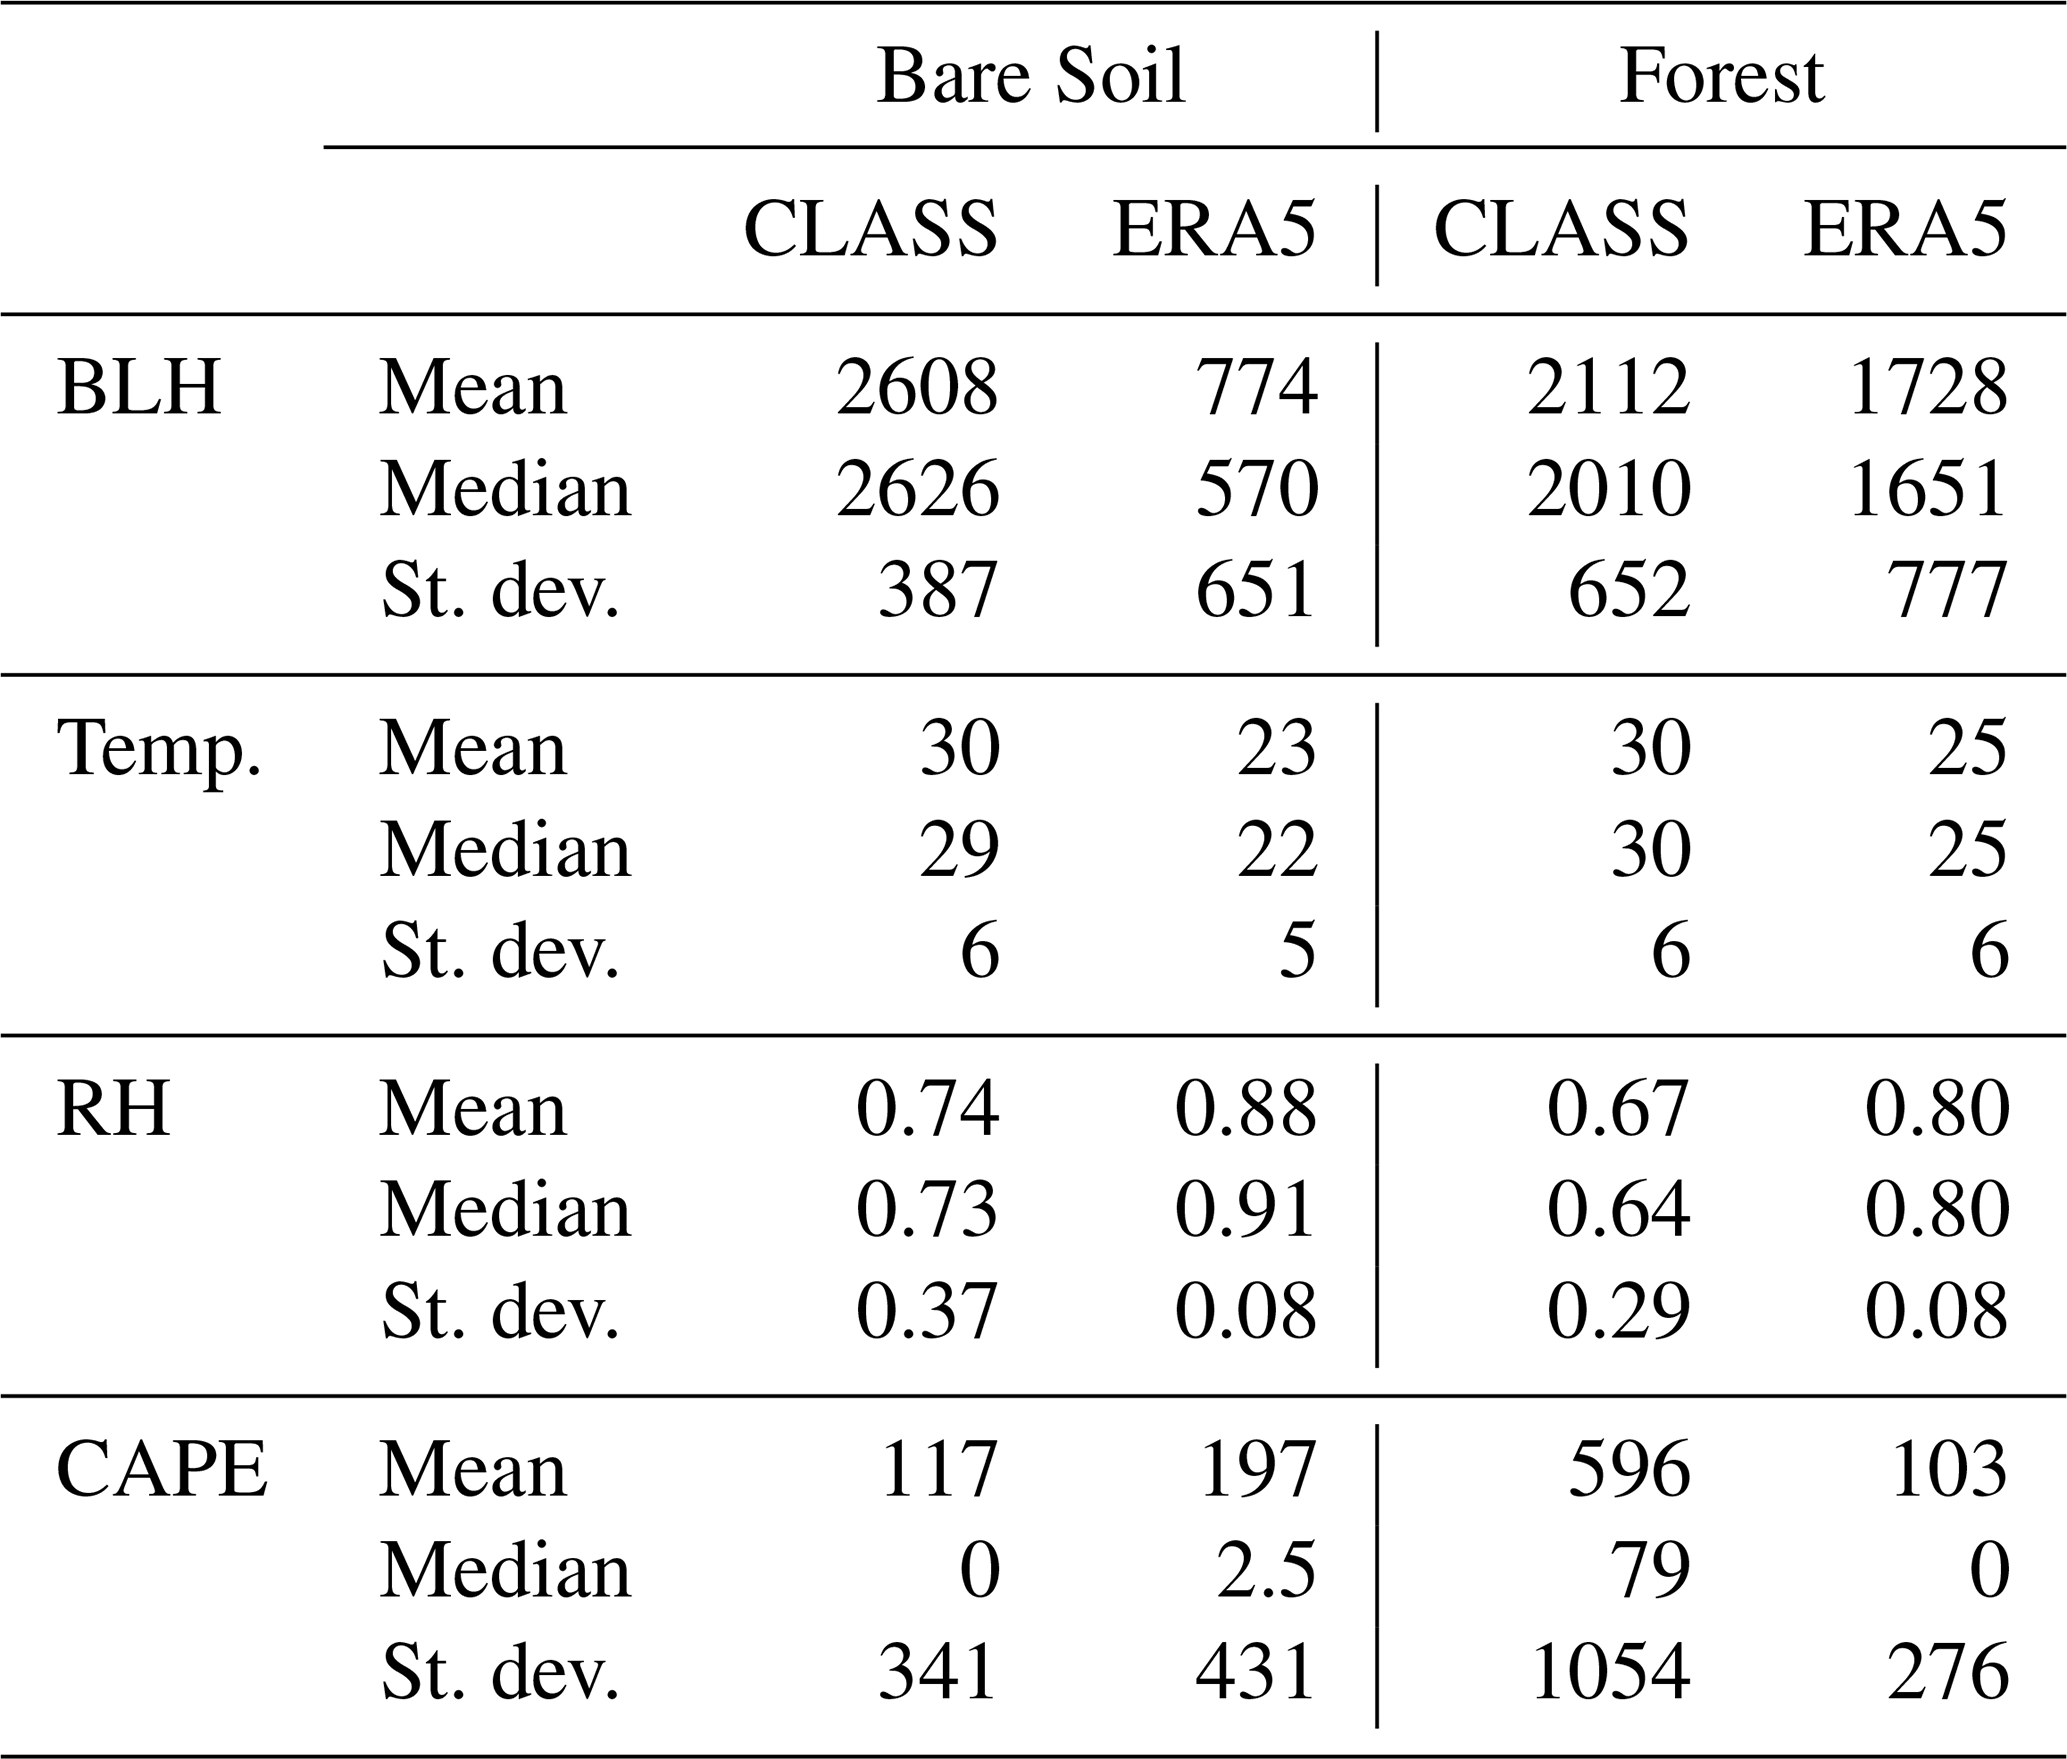
Table A4Minimum value of specific variables for samples with rainfall potential. If a single value is indicated there is only a lower “threshold”. If a range of values is indicated this variable has a lower and upper “threshold”. The upper “threshold” is the maximum value of all samples with rainfall potential. Besides the minimum and maximum we also show the 5th percentile and the 95th percentile.
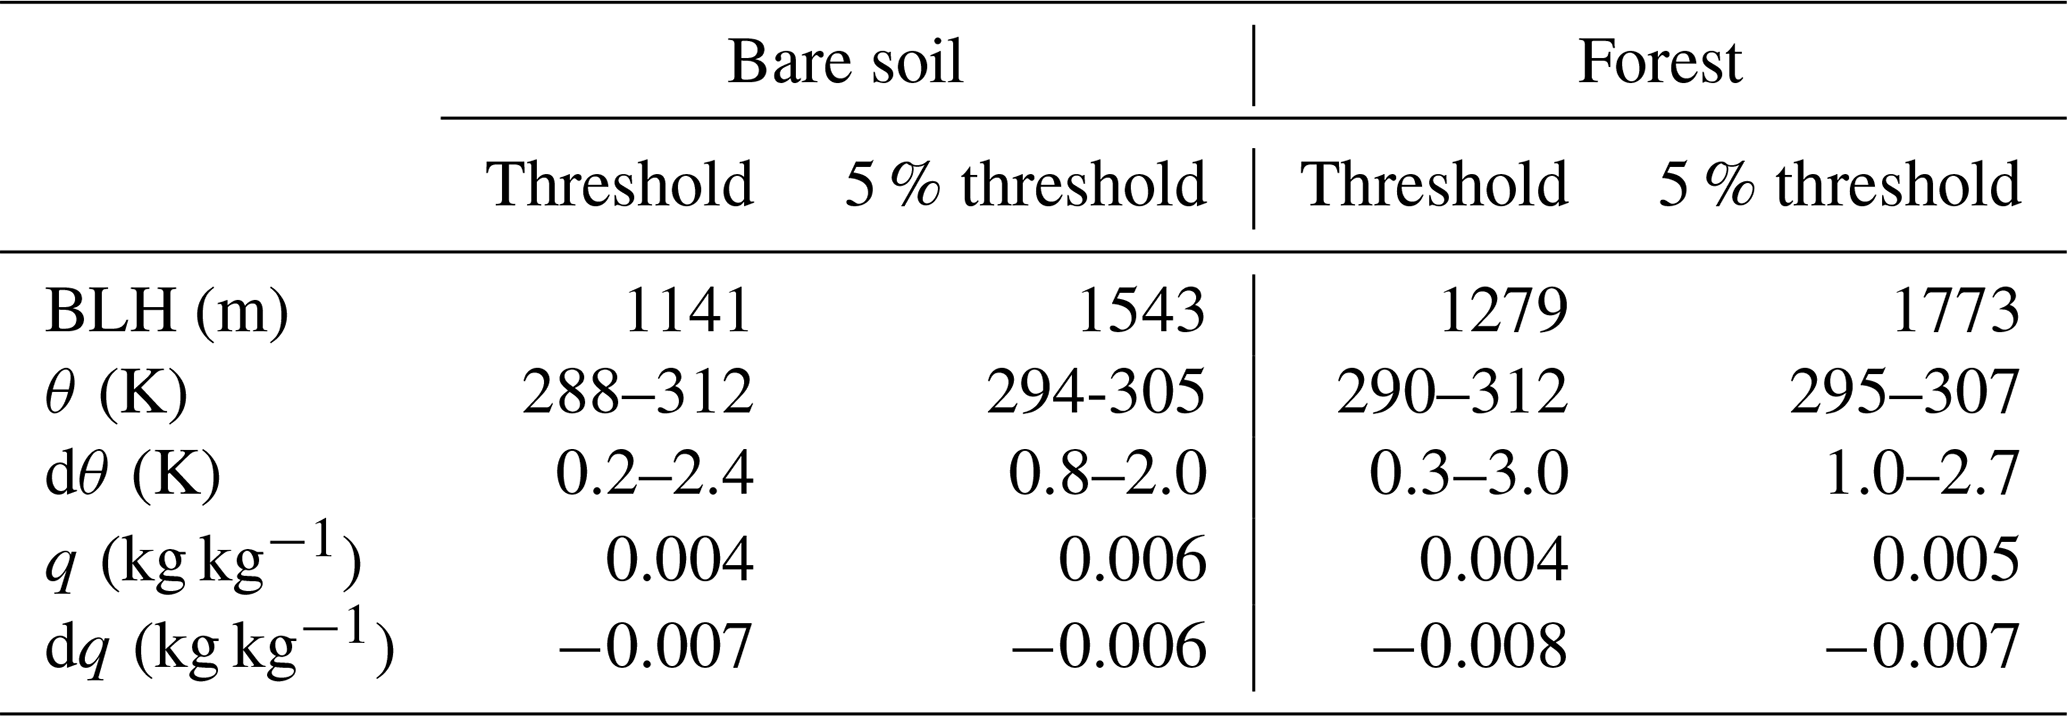
Table A5Spearman rank correlation between soil moisture and various atmospheric variables for the bare soil and forest scenarios.
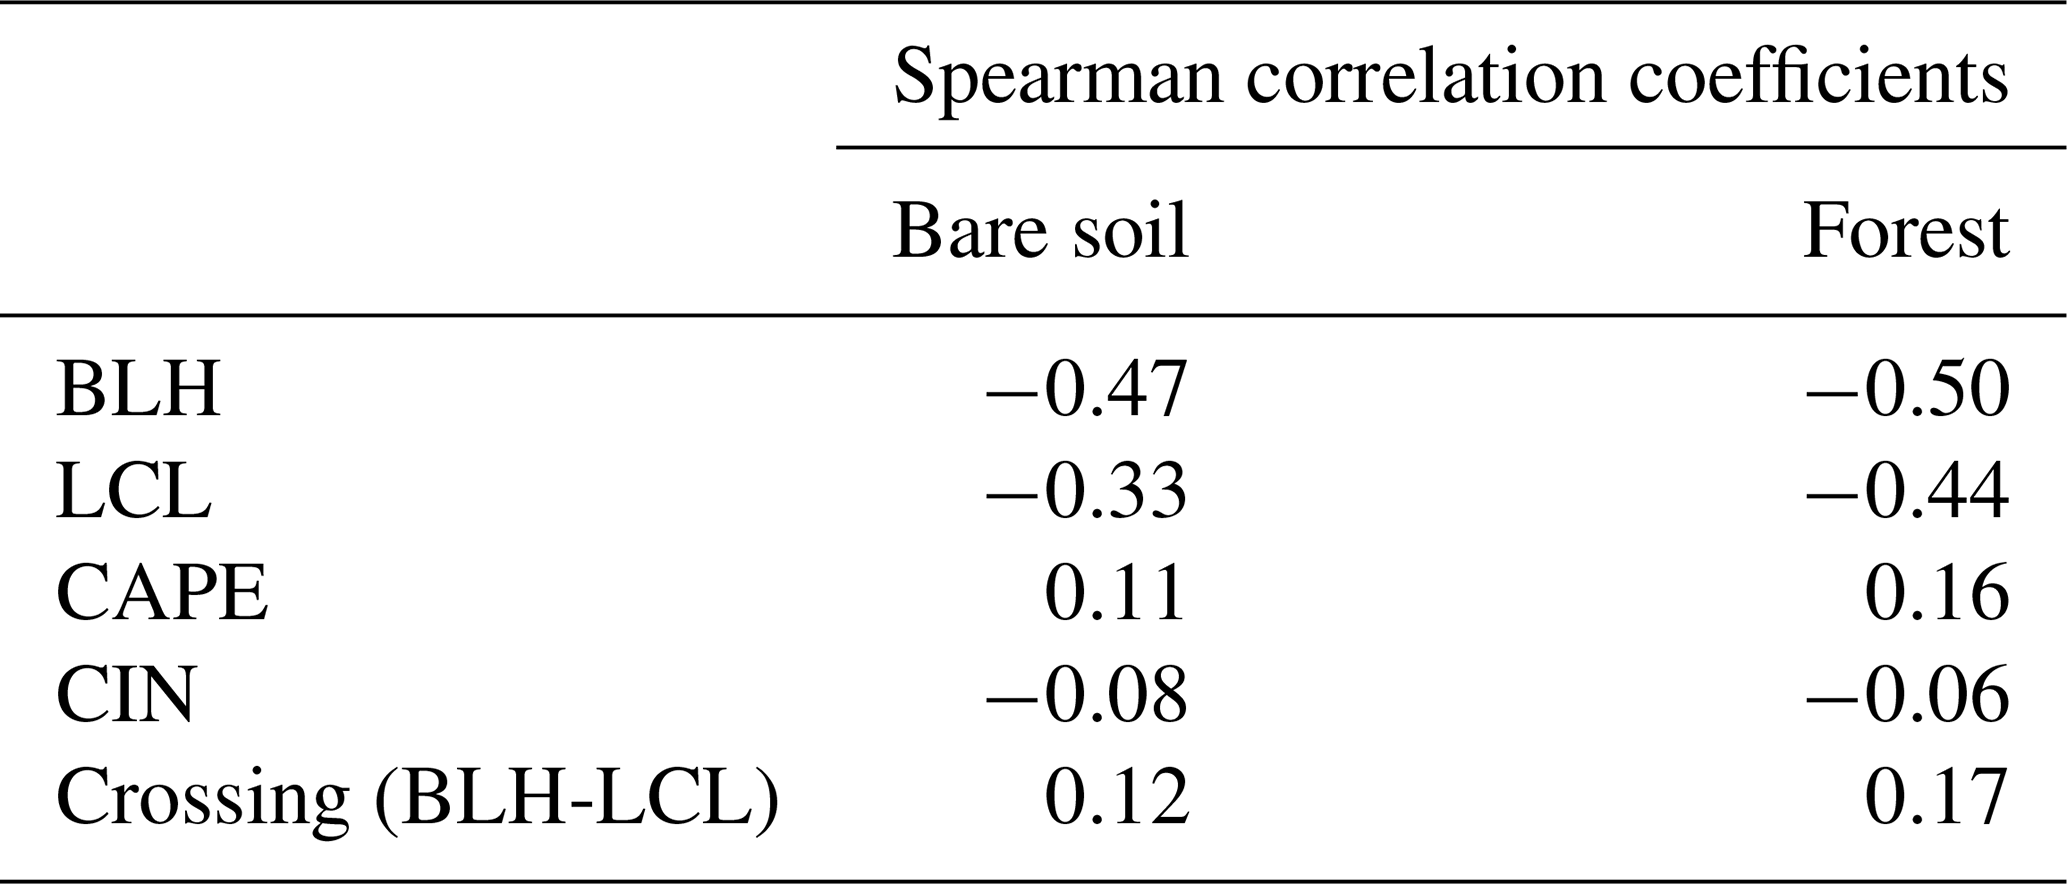
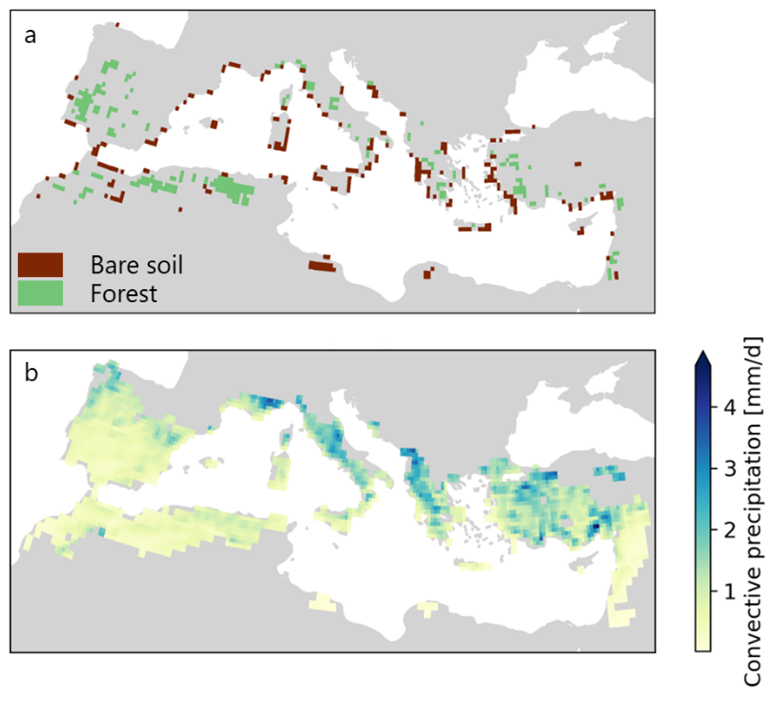
Figure A1Characteristics of the Mediterranean Basin. (a) Grid cells with mostly bare soil or forest cover. For grid cells with bare soil, both tall vegetation cover and short vegetation cover are smaller than or equal to 0.1. For grid cells with forest, tall vegetation cover is larger than or equal to 0.8. (b) Mean convective precipitation (mm d−1) for the months May and June between the years 2013 and 2022. The data for these plots is obtained from the ERA5 data set.

Figure A2The spatial distribution of the number of samples that pass through the filter for each grid cell in the Mediterranean Basin.
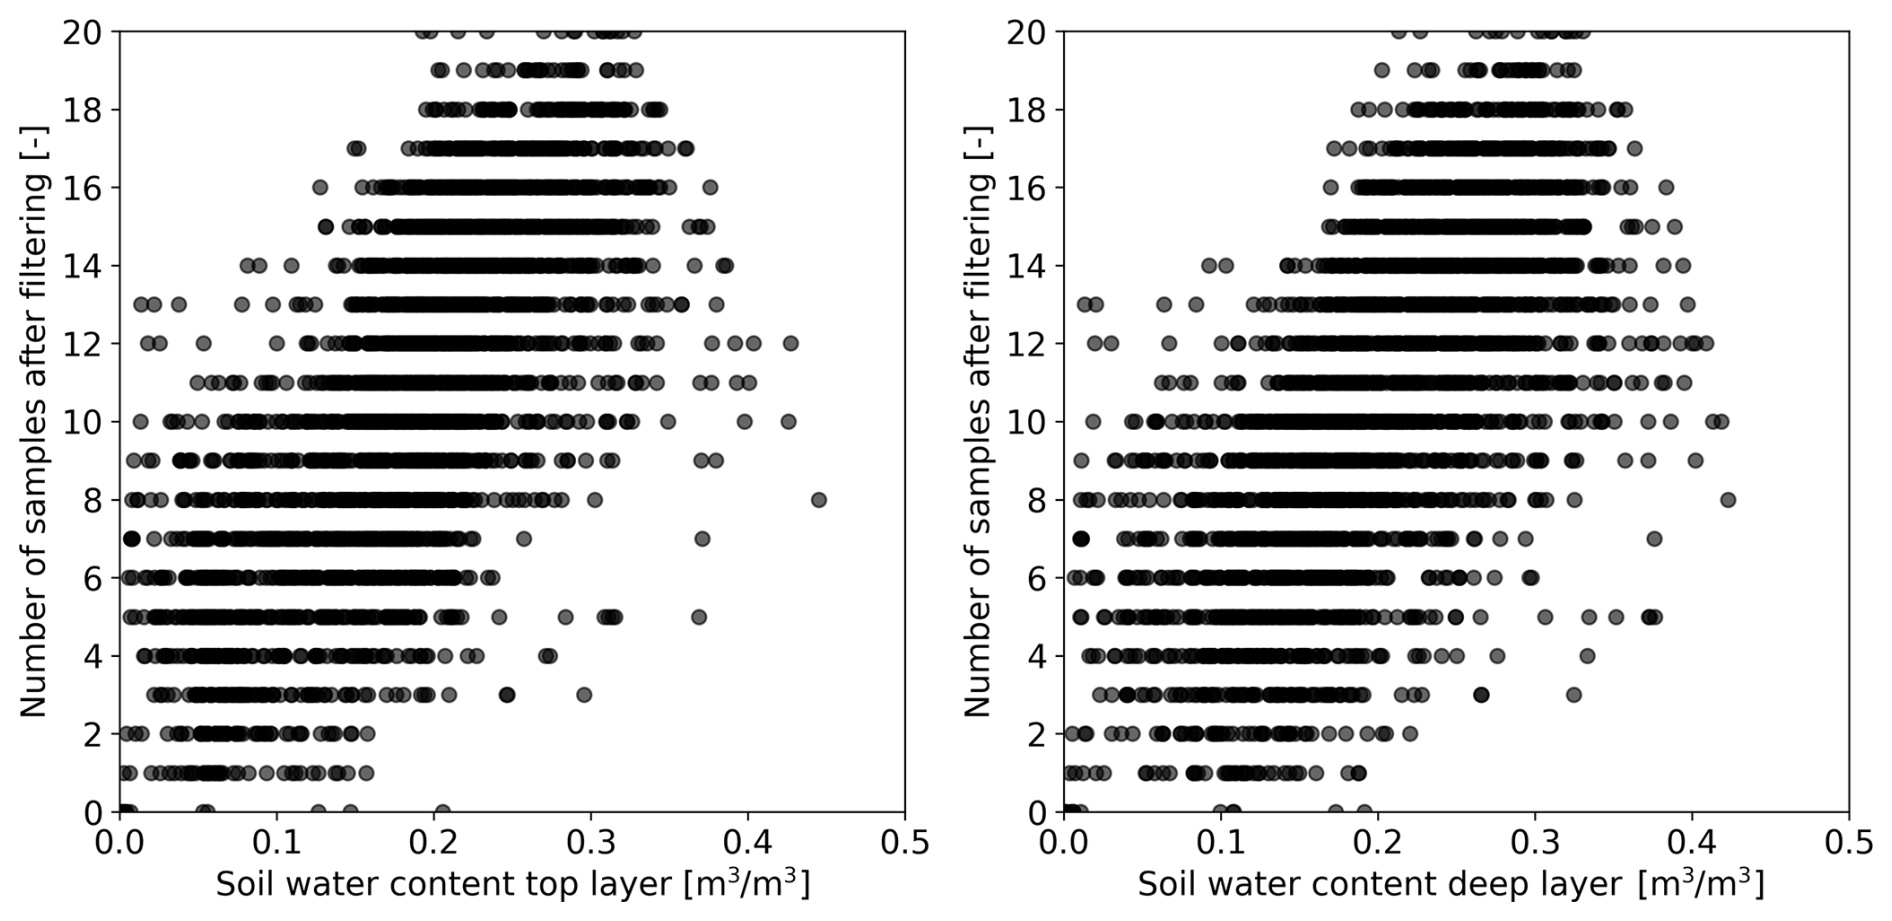
Figure A3The relationship between the mean soil water content for each grid cell and the number of samples for each grid cell after filtering for unrealistic output of CLASS. Soil water content in the top layer (left) and soil water content in the deep layer (right). Each scatter point represents one grid cell.
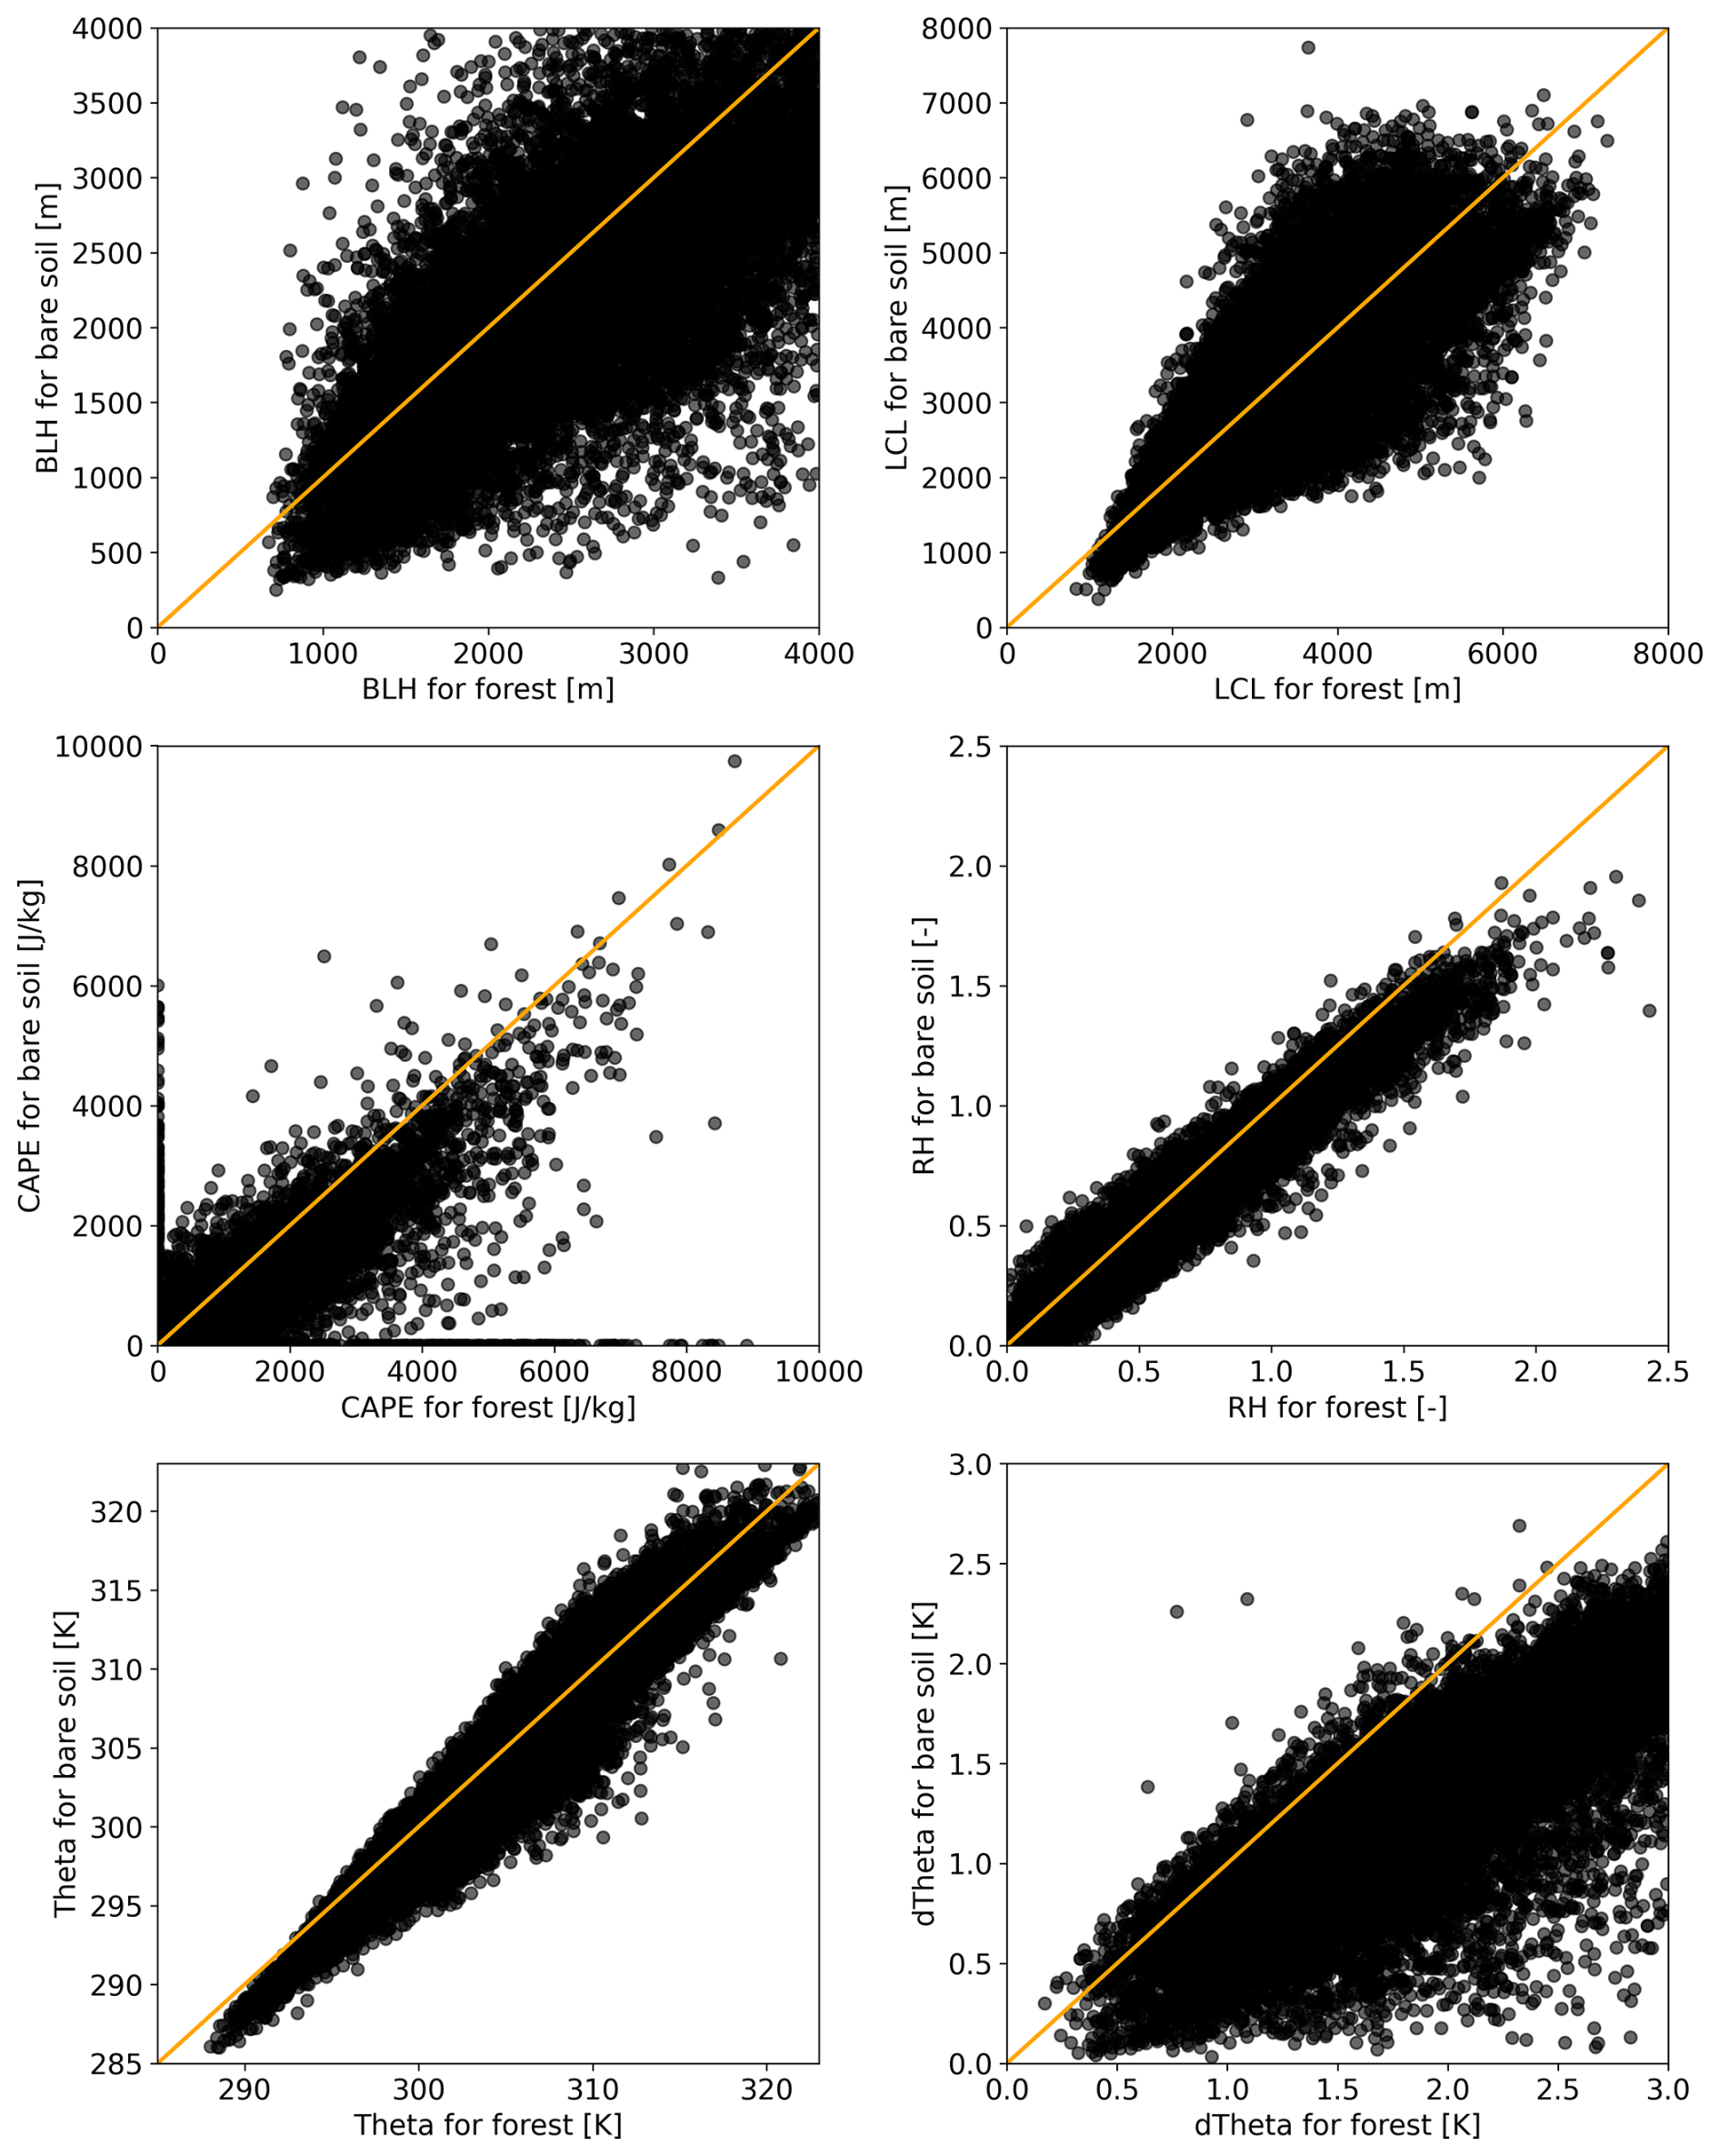
Figure A4Output of the bare soil scenario and forest scenario for all samples that pass the postprocessing filter for boundary layer height (BLH), lifting condensation level (LCL), convective available potential energy (CAPE), relative humidity (RH), potential temperature (θ), and the jump in potential temperature at the top of the boundary layer (dθ). The orange line indicates the identity line (x=y).
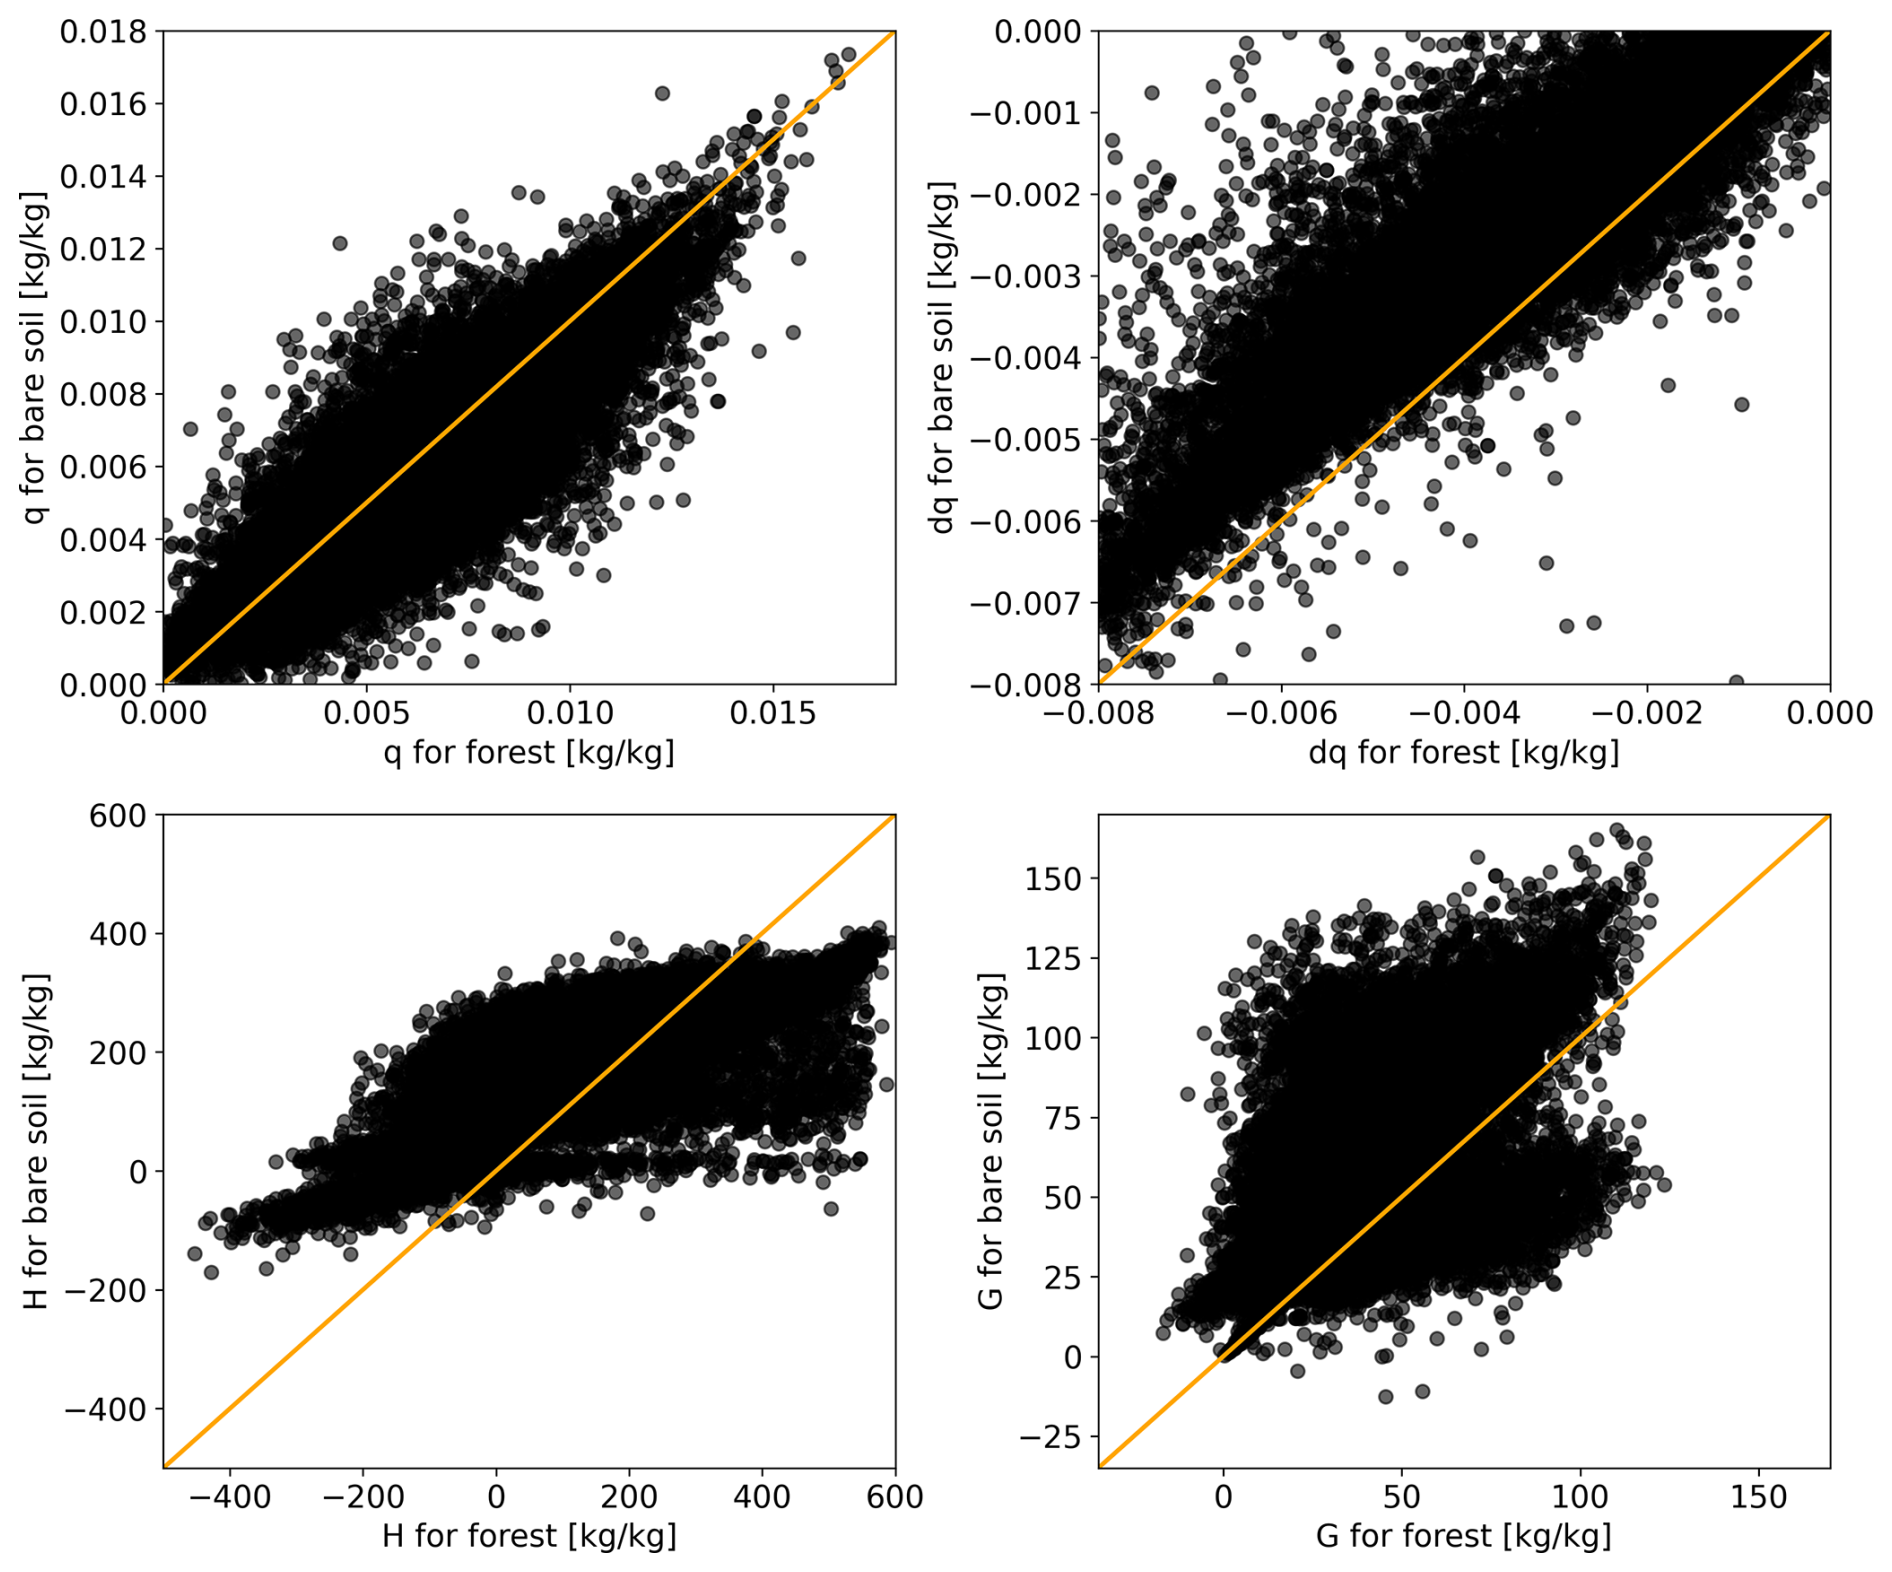
Figure A5Output of the bare soil scenario and forest scenario for all samples that pass the postprocessing filter at 03:00 p.m. LT for specific humidity (q), jump in specific humidity at the top of the boundary layer (dq), sensible heat flux (H), ground heat flux (G). The orange line indicates the identity line (x=y).
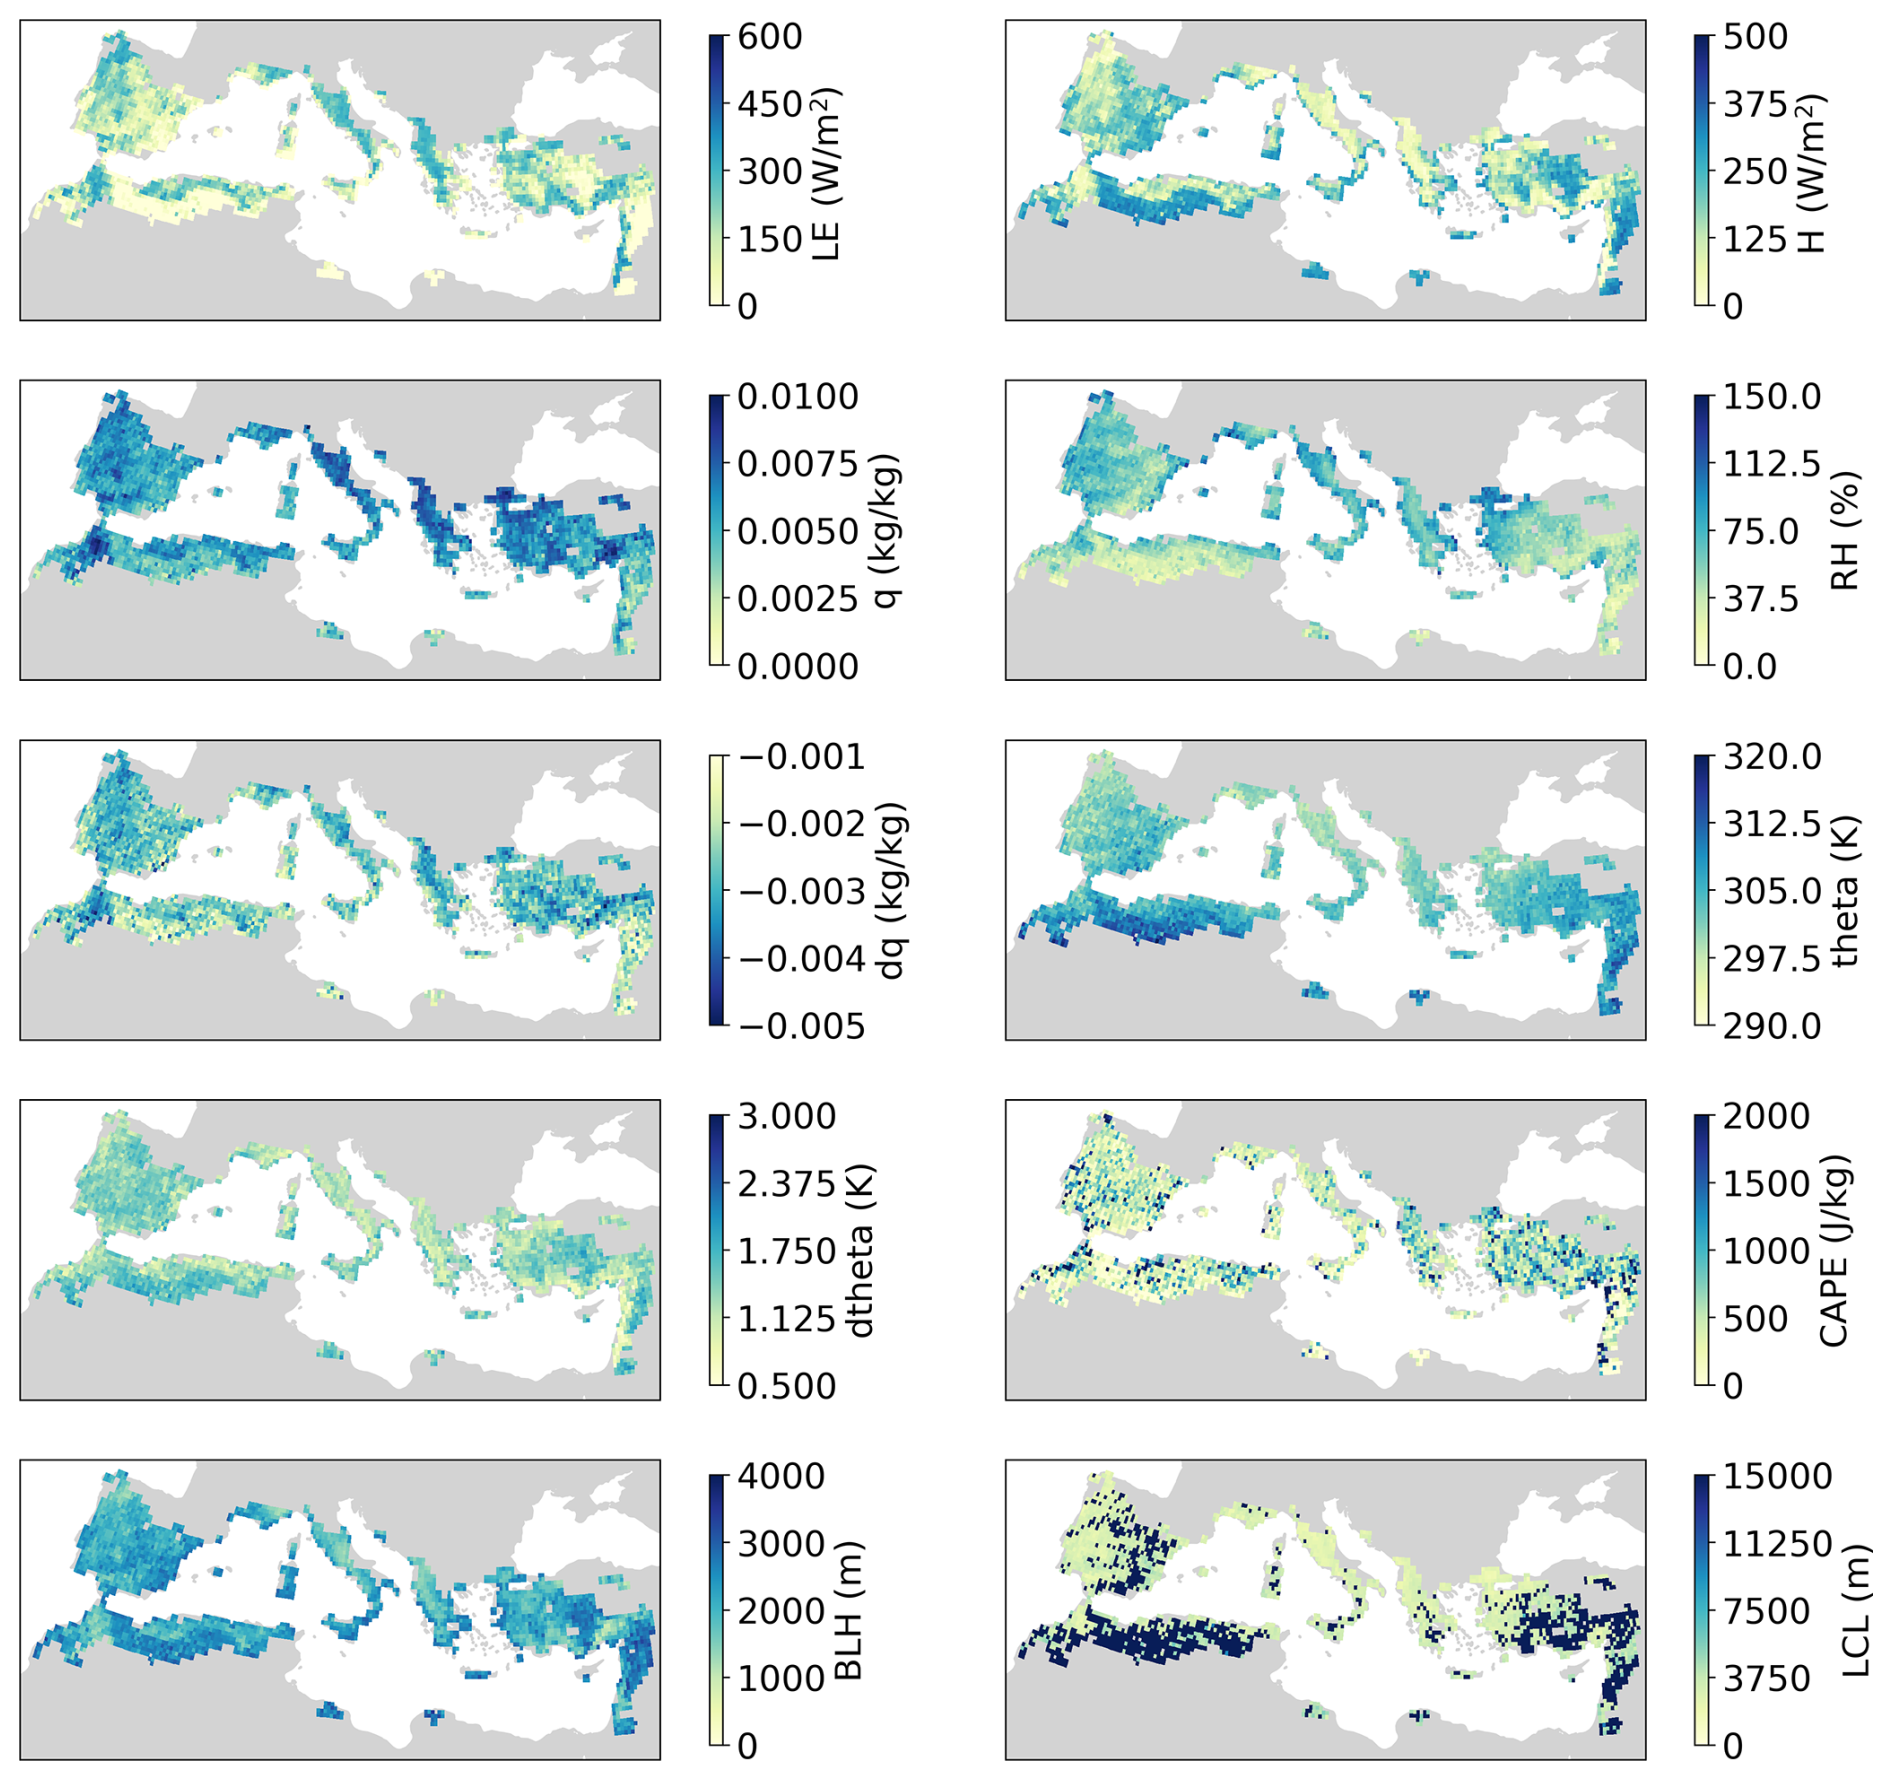
Figure A6CLASS output for the bare soil scenario. For each variable the mean value per grid cell is shown. Note that due to filtering the amount of samples varies among the grid cells. The output that is shown is the latent heat flux (LE), sensible heat flux (H), specific humidity (q), relative humidity (RH), jump in specific humidity at the top of the boundary layer (dq), potential temperature (θ), jump in potential temperature at the top of the boundary layer (dθ), convective available potential energy (CAPE), boundary layer height (BLH), and lifting condensation level (LCL).
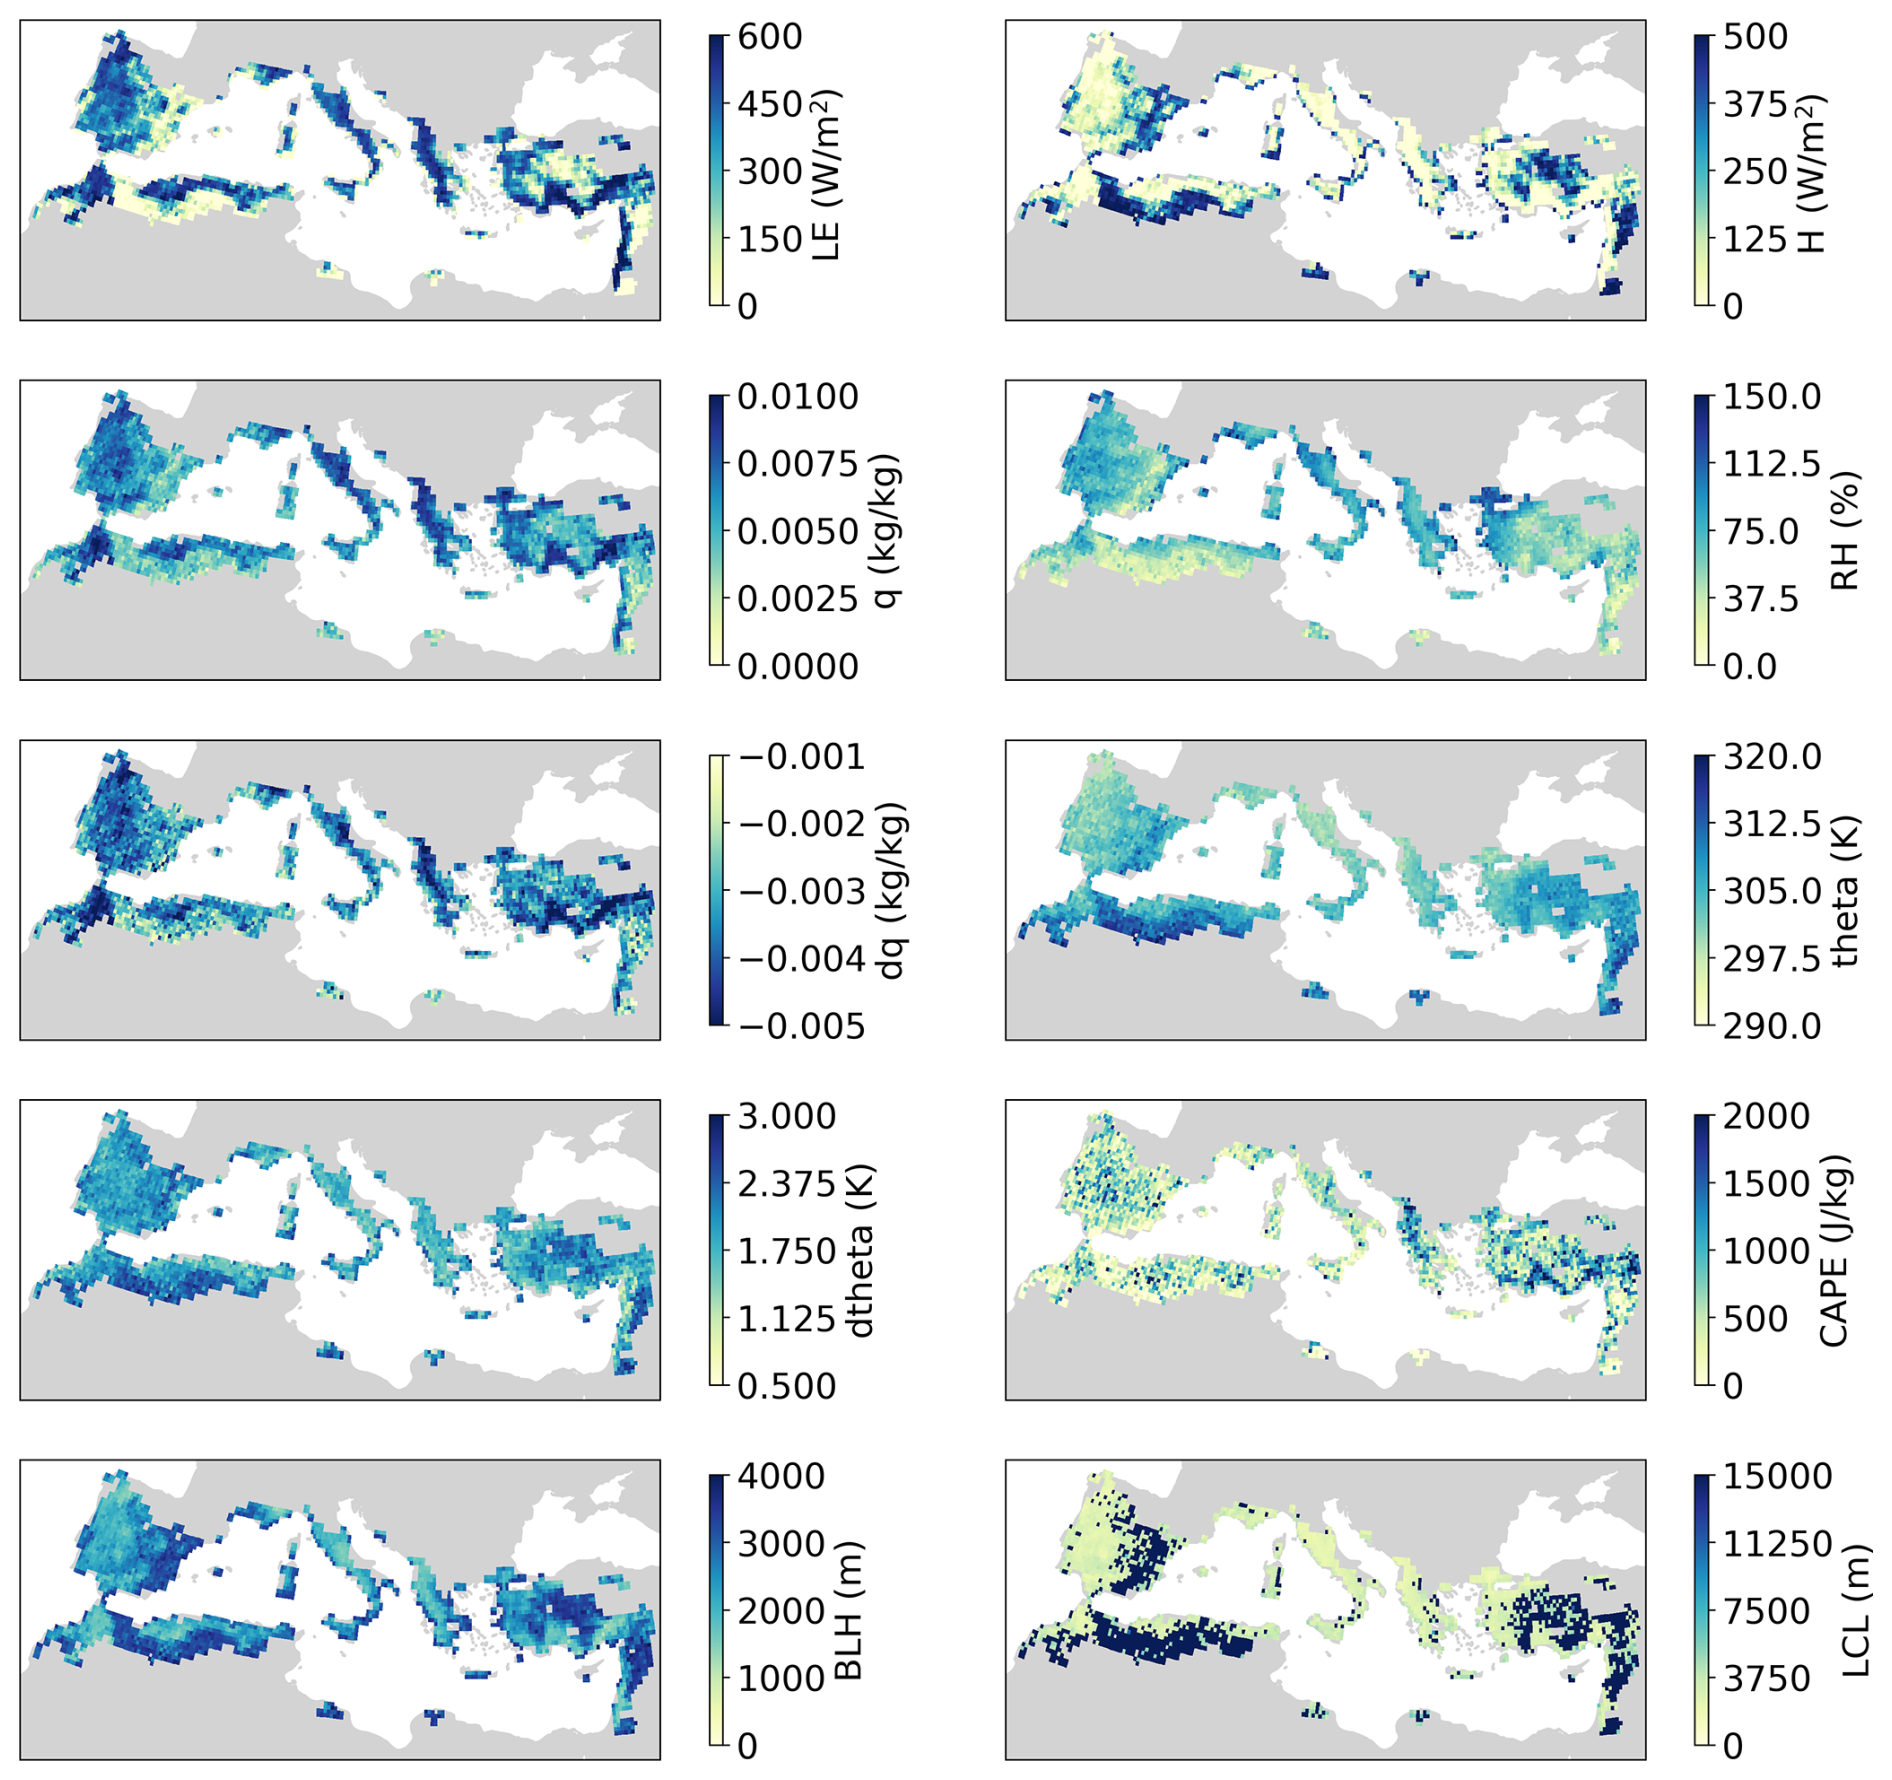
Figure A7CLASS output for the forest scenario. For each variable the mean value per grid cell is shown. Note that due to filtering the amount of samples varies among the grid cells. The output that is shown is the latent heat flux (LE), sensible heat flux (H), specific humidity (q), relative humidity (RH), jump in specific humidity at the top of the boundary layer (dq), potential temperature (θ), jump in potential temperature at the top of the boundary layer (dθ), convective available potential energy (CAPE), boundary layer height (BLH), and lifting condensation level (LCL).
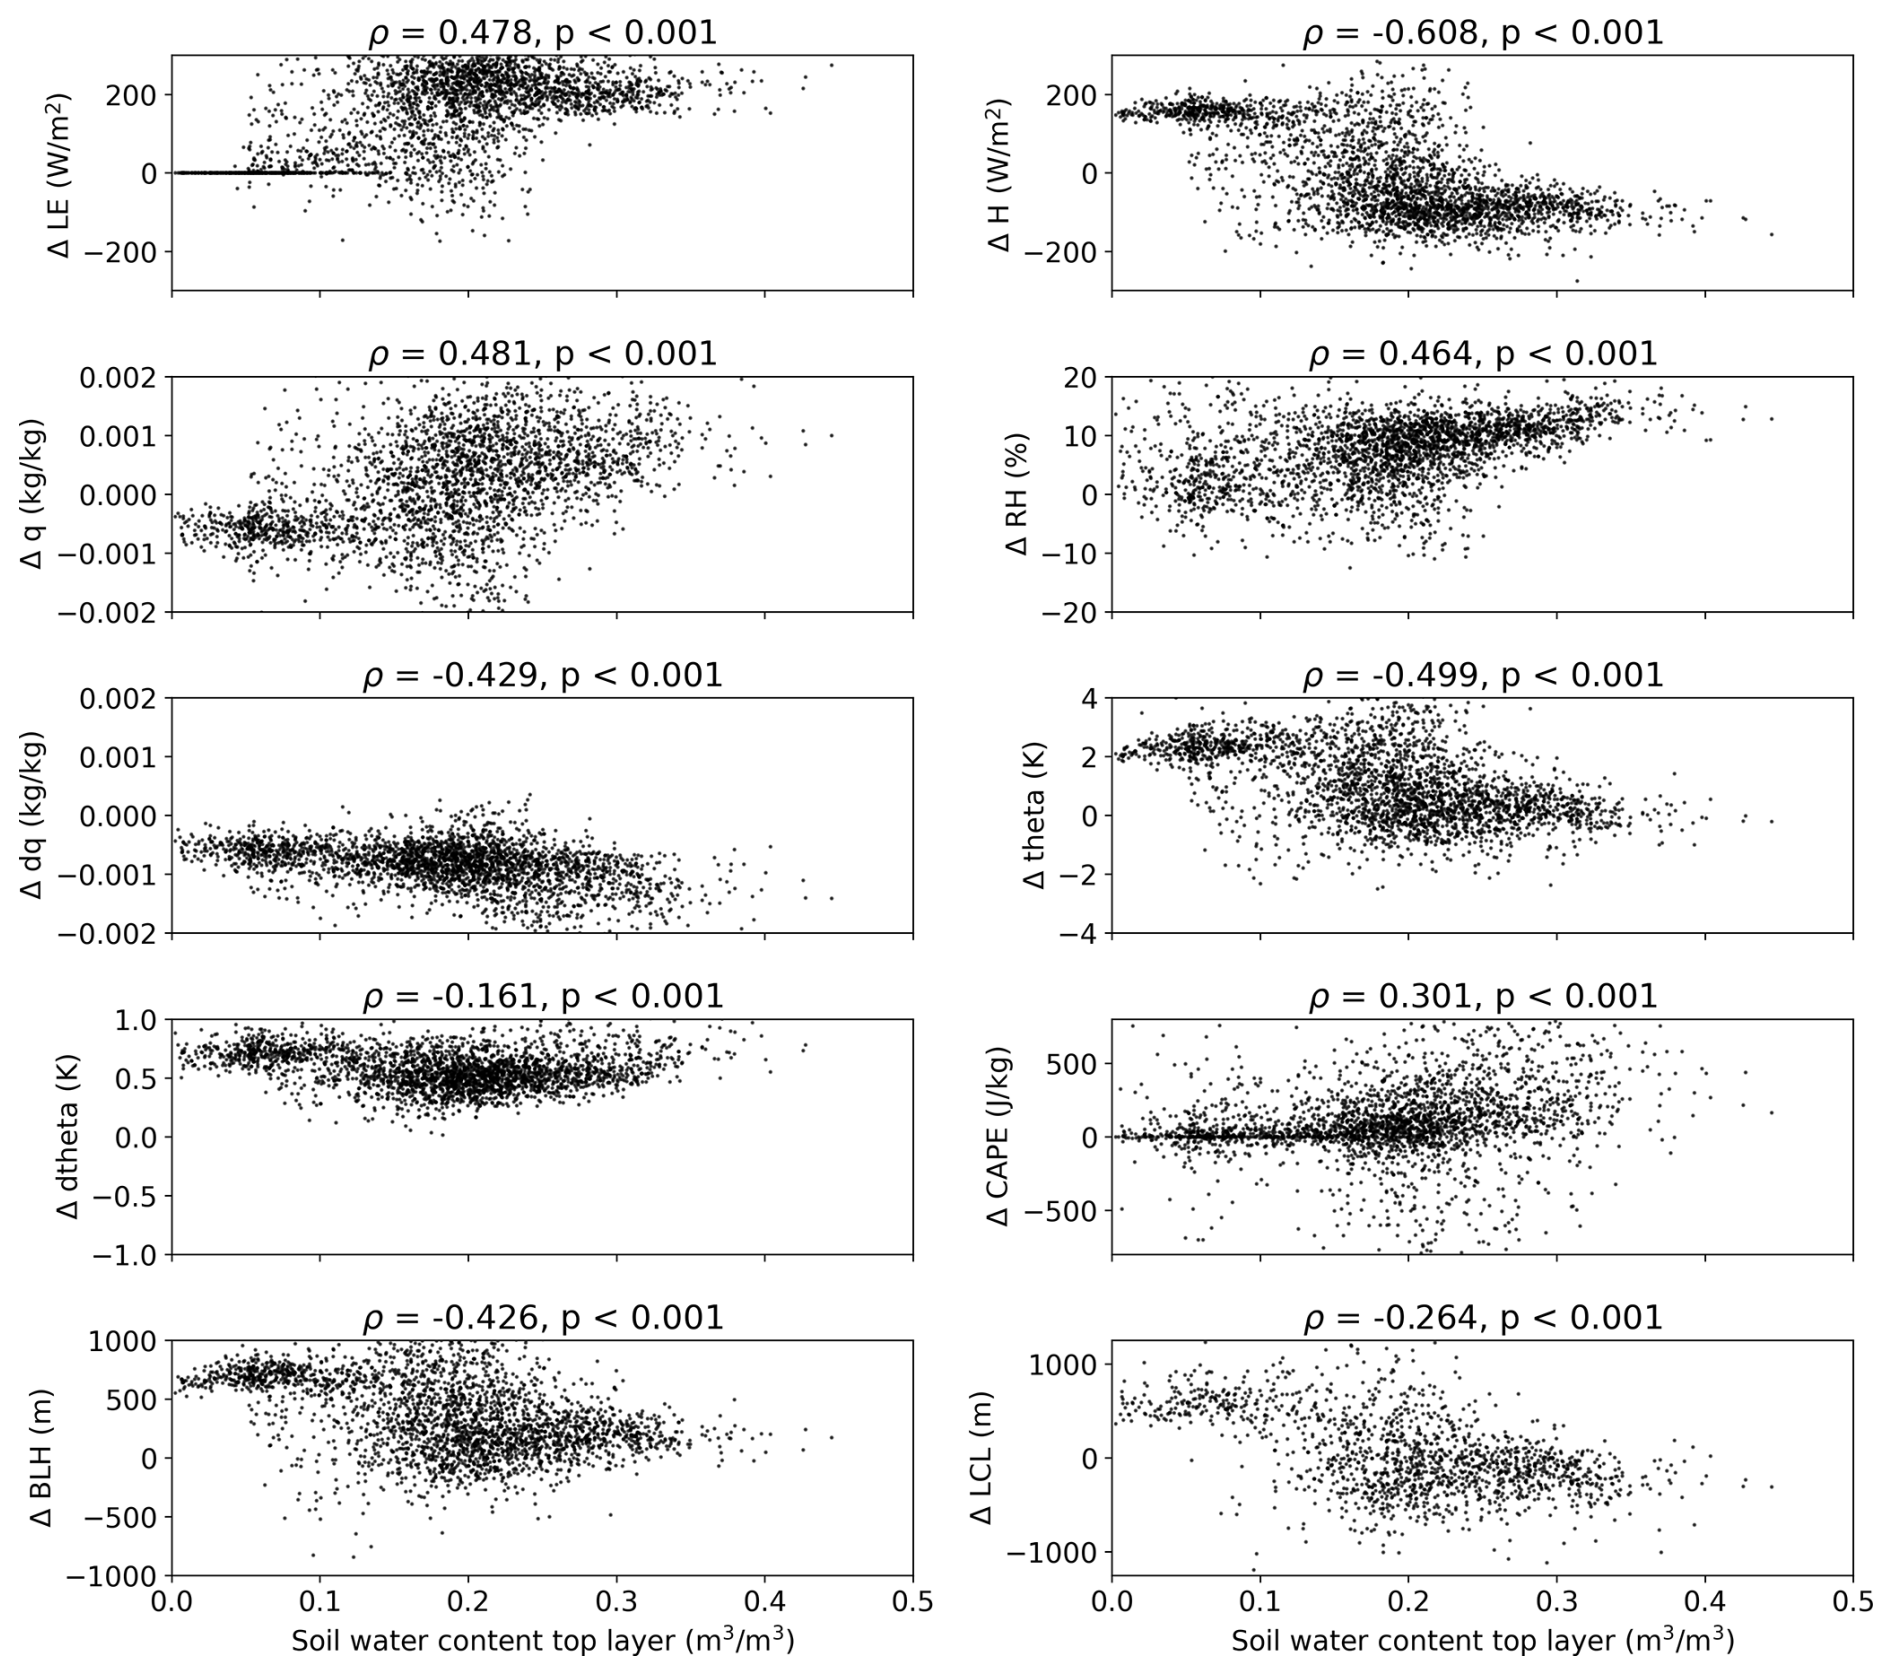
Figure A8The difference between the forest scenario and bare soil scenario for different output variables of CLASS plotted as function of soil moisture content of the top soil layer. Each dot represents one model run. The title of each plot shows the spearman rank correlation coefficient (ρ) and the corresponding p-value. The output that is shown is the latent heat flux (LE), sensible heat flux (H), specific humidity (q), relative humidity (RH), jump in specific humidity at the top of the boundary layer (dq), potential temperature (θ), jump in potential temperature at the top of the boundary layer (dθ), convective available potential energy (CAPE), boundary layer height (BLH), and lifting condensation level (LCL).
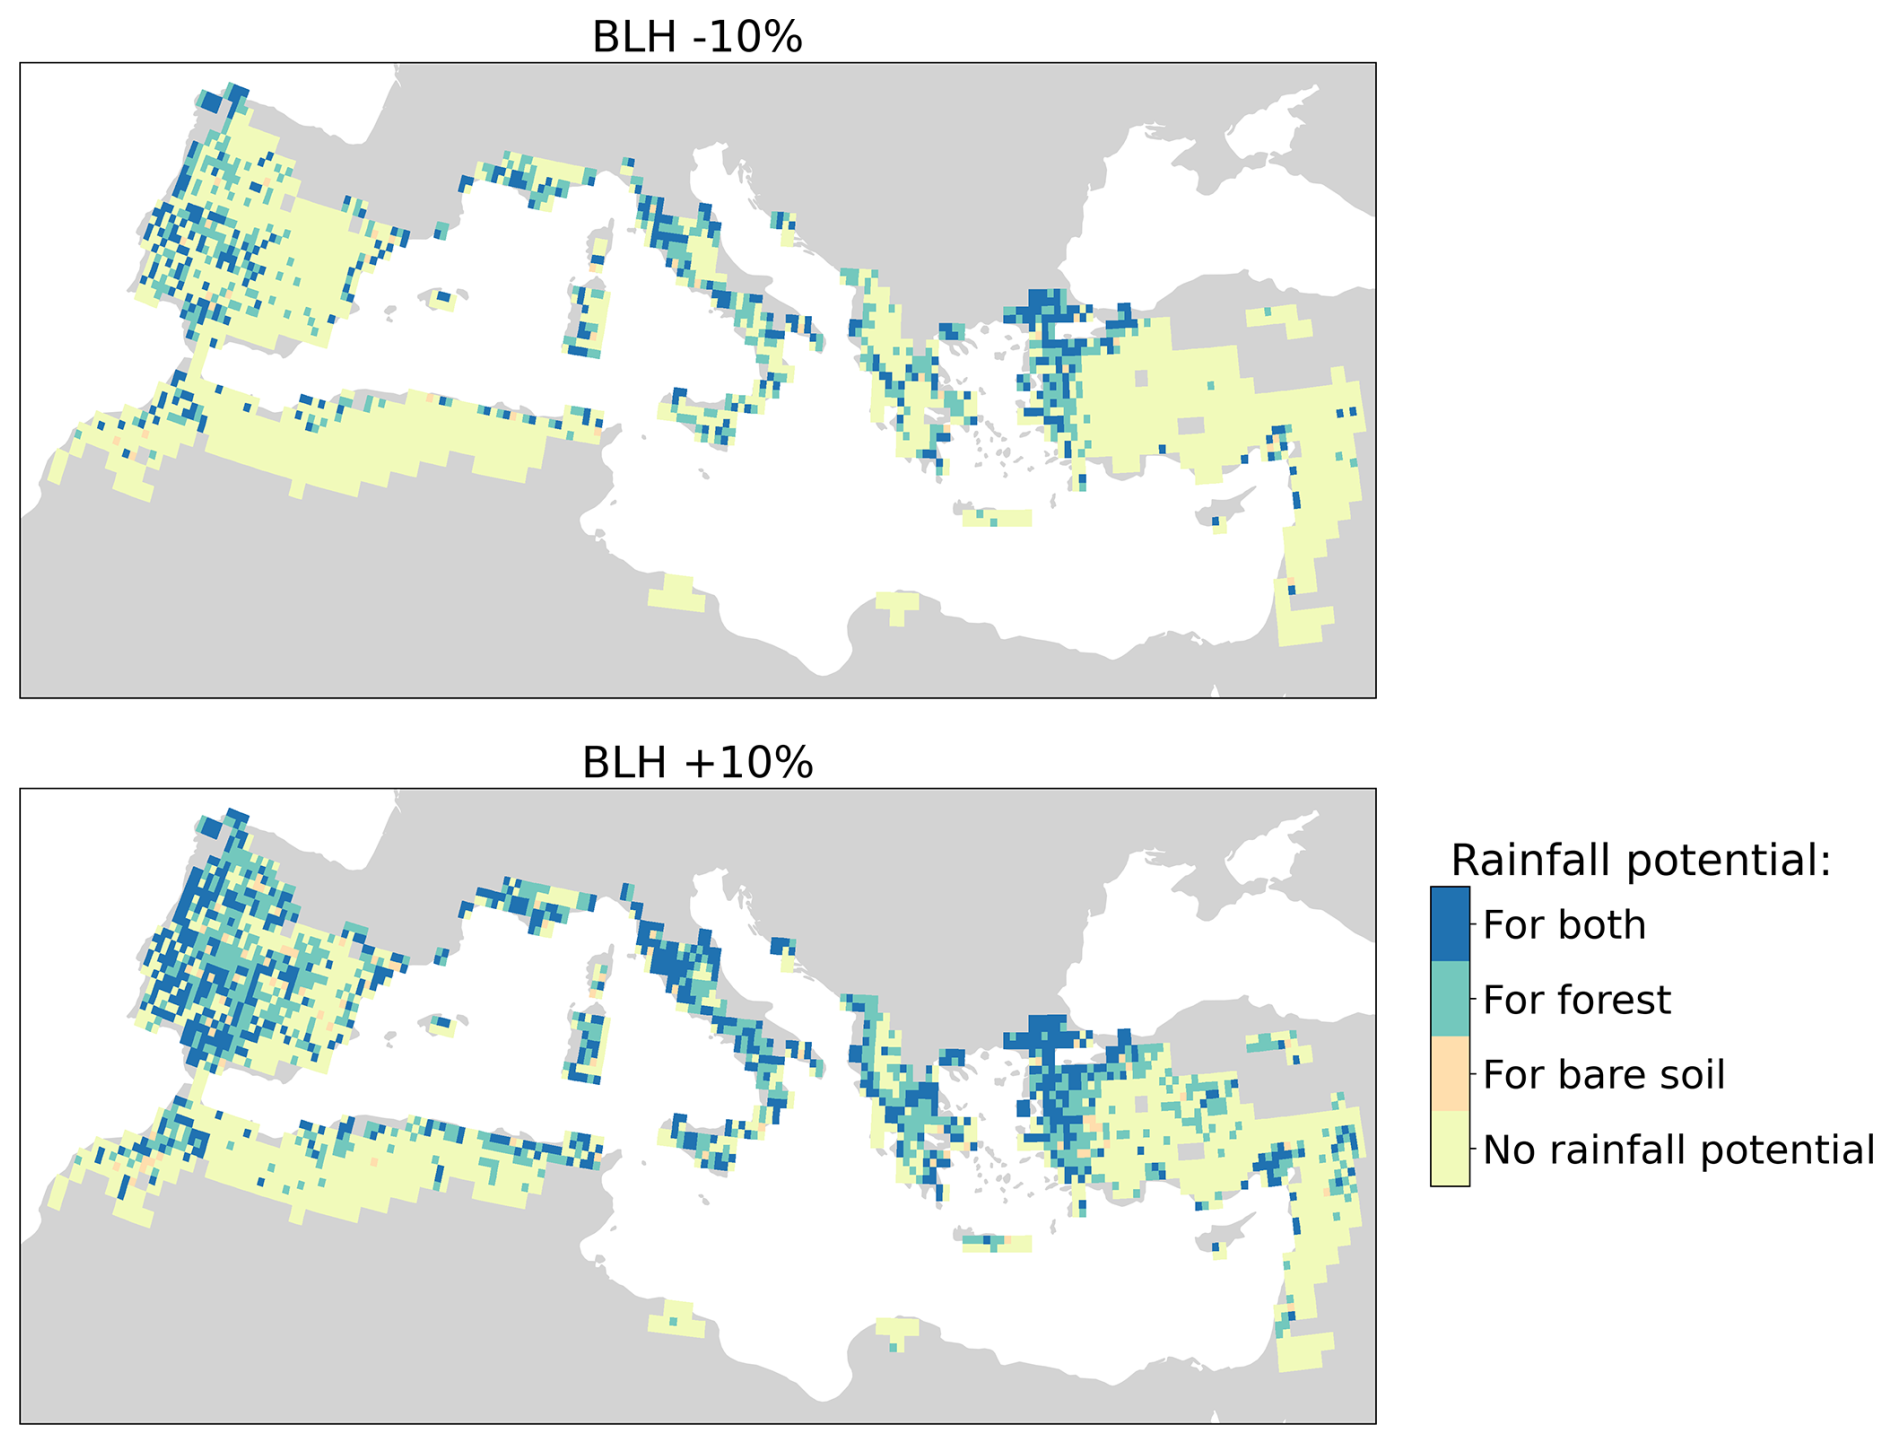
Figure A9Sensitivity of rainfall potential to a change in the boundary layer height (BLH). Top: a change in BLH of −10 %, bottom: a change in BLH of +10 %. This plot indicates for each grid cell if most samples have a rainfall potential over bare soil, forest, both land cover types or no rainfall potential in any of the samples.
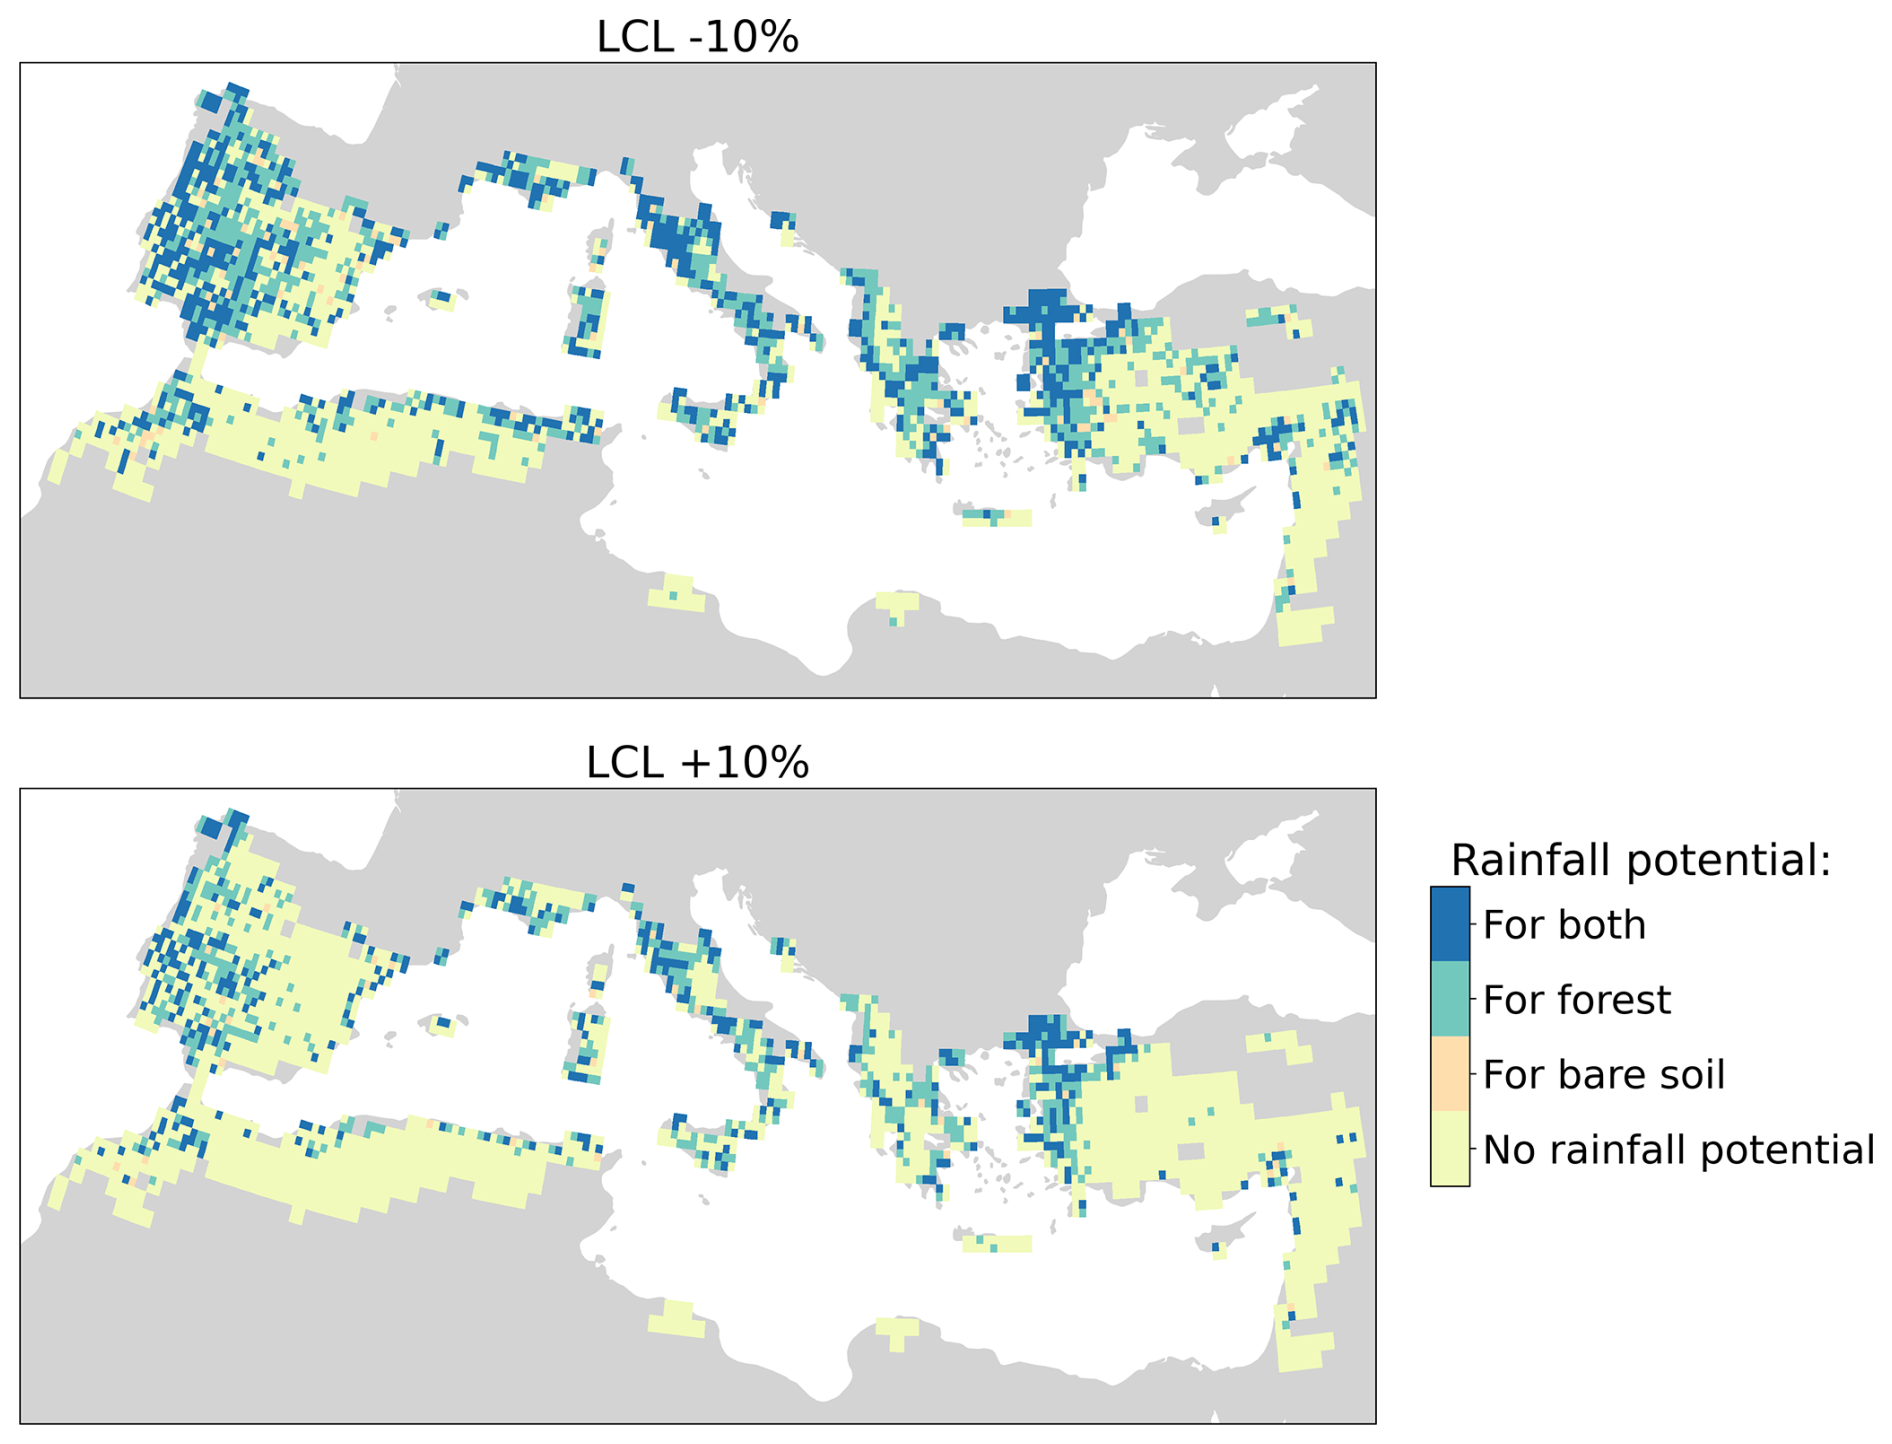
Figure A10Sensitivity of rainfall potential to a change in the lifting condensation level (LCL). Top: a change in LCL of −10 %, bottom: a change in LCL of +10 %. This plot indicates for each grid cell if most samples have a rainfall potential over bare soil, forest, both land cover types or no rainfall potential in any of the samples.
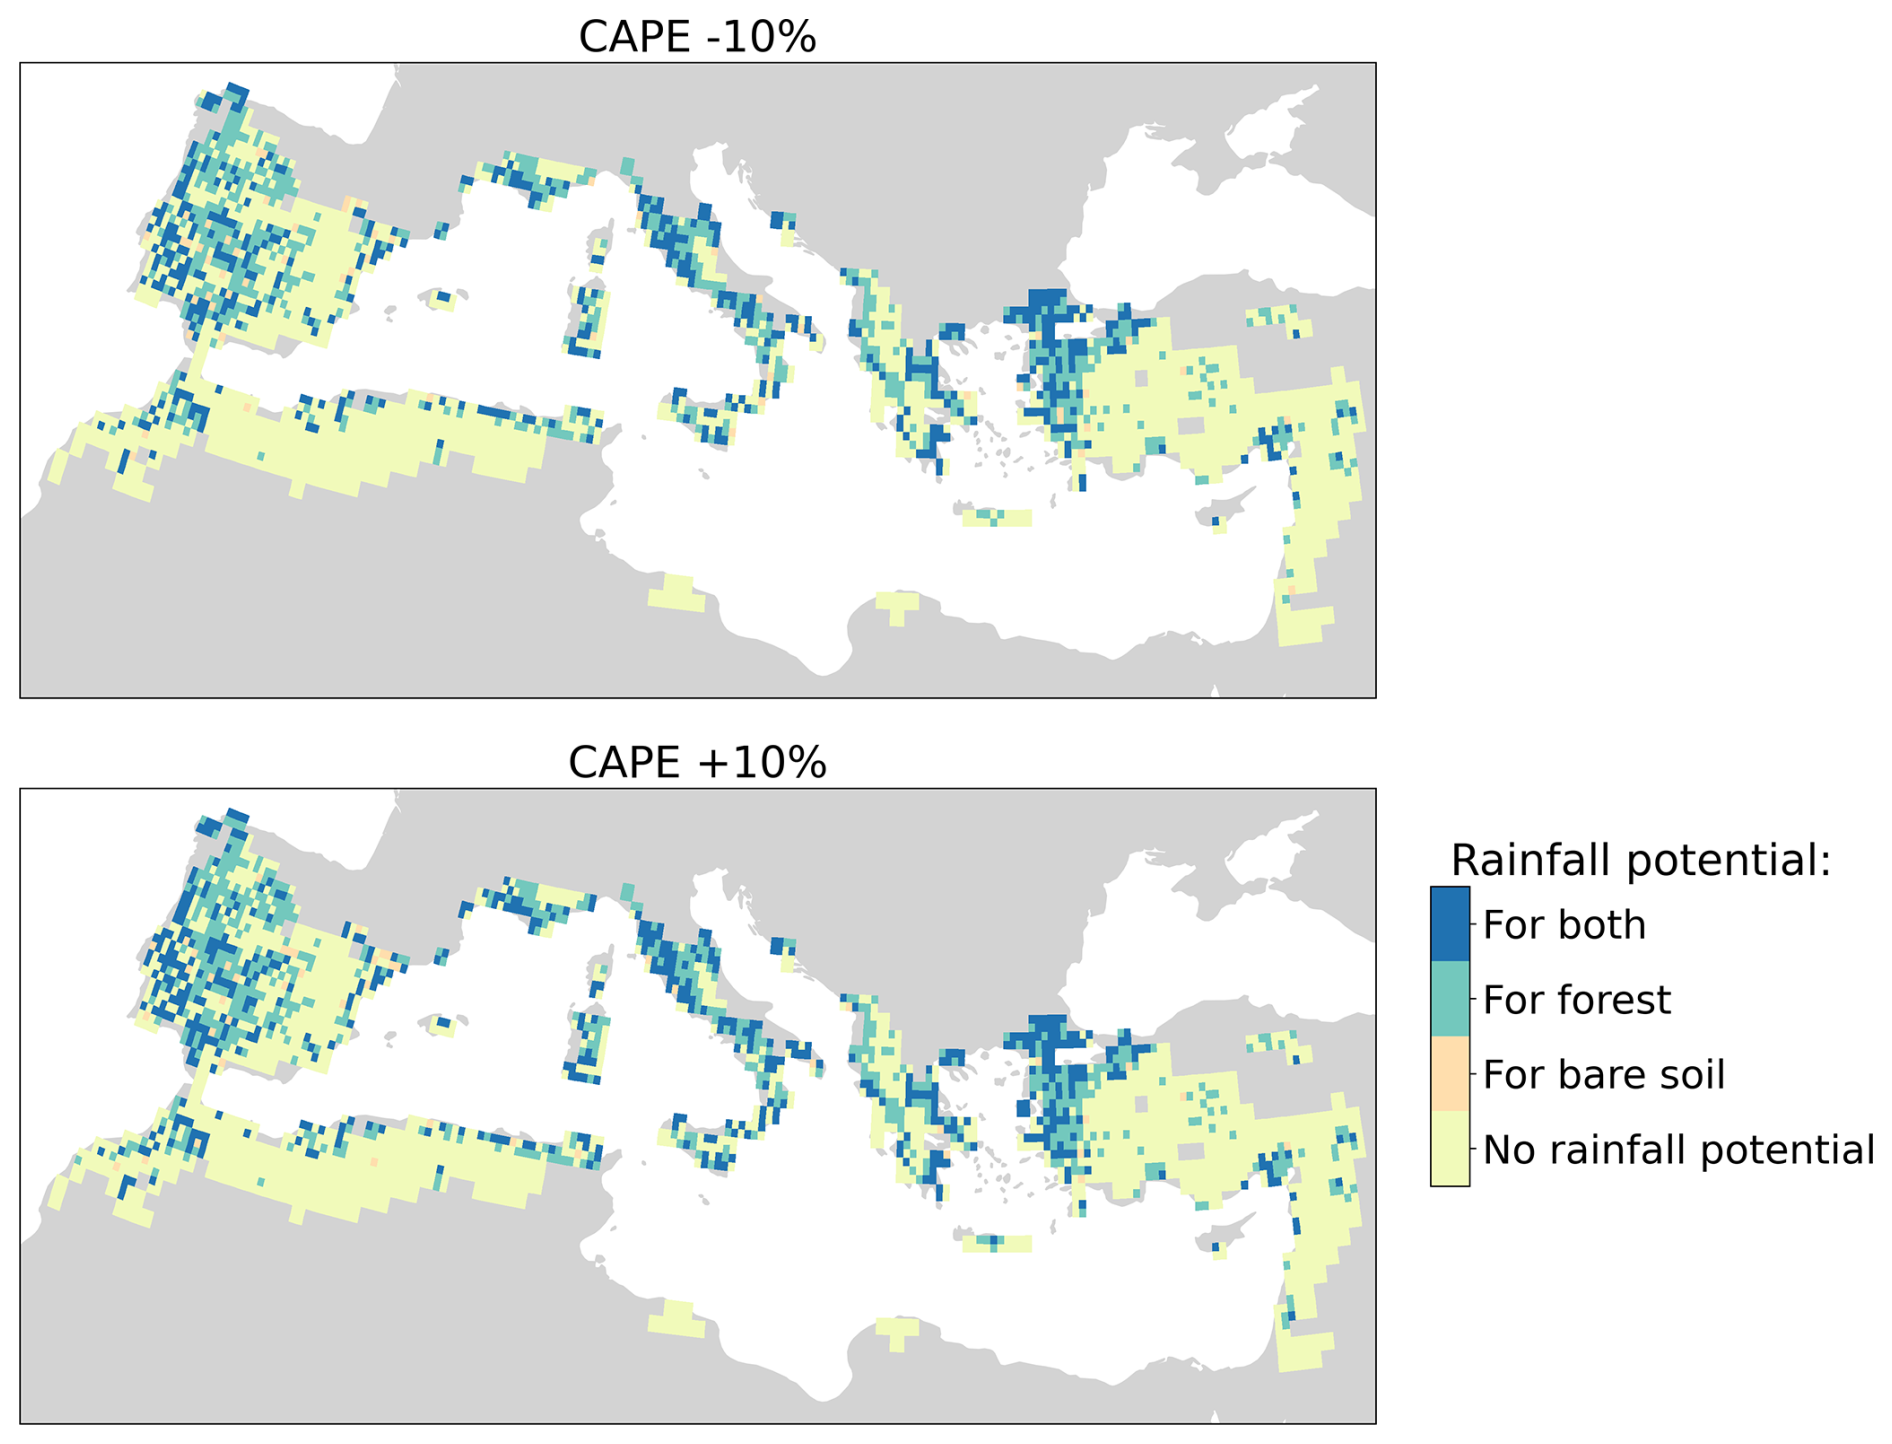
Figure A11Sensitivity of rainfall potential to a change in the convective available potential energy (CAPE). Top: a change in CAPE of −10 %, bottom: a change in CAPE of +10 %. This plot indicates for each grid cell if most samples have a rainfall potential over bare soil, forest, both land cover types or no rainfall potential in any of the samples.
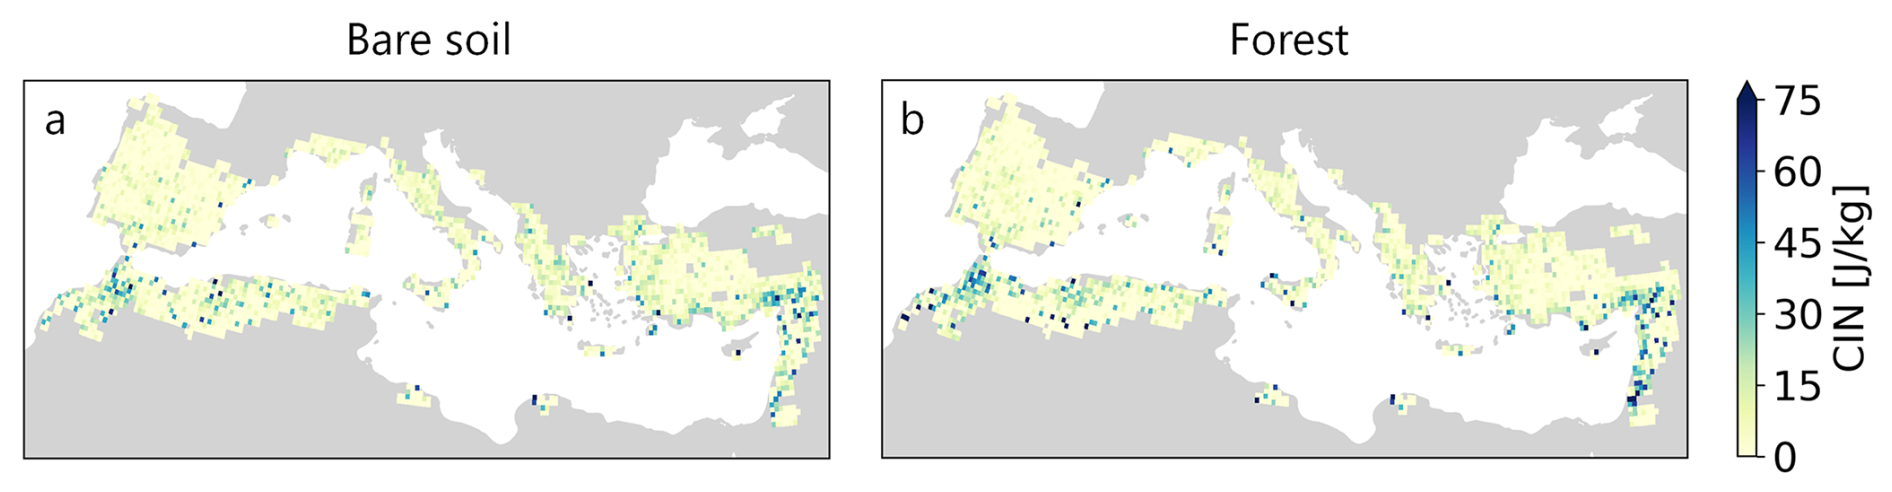
Figure A12Convective inhibition (CIN) for the bare soil (a) and forest (b) scenarios. The plots indicate the mean value of all runs for each grid cell separately.
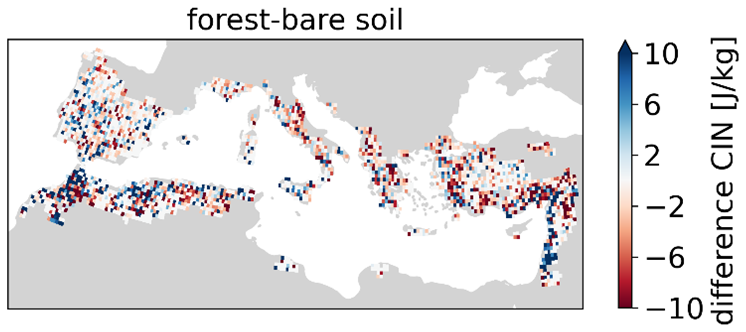
Figure A13The difference in CIN between the bare soil and forest scenario. This plot shows the difference between the mean CIN for each grid cell. This mean is calculated from all runs for each grid cell separately.
The following equations show how the potential temperature, lapse rate of the free atmosphere, the temperature jump at the top of the boundary layer and the advection of heat were calculated. Correspondingly, the specific humidity gradient of the free atmosphere, the specific humidity jump at the top of the boundary layer and the advection of moisture were calculated.
B1 Potential temperature
The potential temperature is derived from the temperature (T) and the corresponding pressure (P). CP is the specific heat capacity and R is the gas constant of air. . P0 is the standard reference pressure: 1013.25 hPa.
B2 Lapse rate
The lapse rate (γθ) is calculated using the potential temperature at two pressure levels (750 and 800 hPa). Using Eq. (B2) we derive:
Here, ρ equals the density of dry air (1.225 kg m−3) and g the gravitational constant (9.81 m s−2).
B3 Initial temperature jump at top boundary layer
The height of the ABL (h0) is set to 100 m. The temperature or the mixed ABL is assumed to be:
The temperature at the top of the boundary layer equals θFA(h0) and therefore the temperature jump at the top of the boundary layer is equal to:
In which Δz equals 50 m.
B4 Advection of heat
To calculate the fluxes between grid cells, the following equation is used:
Here, u is the zonal wind speed, v is the meridional wind speed, λ is the longitude, θ is the latitude, and rearth is the radius of the earth. We assume constant temperature and velocity with height within our boundary layer. We use the wind velocity at 100 m.
The code for CLASS is available through http://classmodel.github.io/ (last access: 30 September 2025) and https://doi.org/10.1017/CBO9781316117422 (Vilà-Guerau de Arellano et al., 2015).
The output from the CLASS model is made available on Zenodo (https://doi.org/10.5281/zenodo.14716230, Theeuwen et al., 2025). The ERA5 data is freely available at the Copernicus Climate Change Service (C3S) Climate Data Store https://cds.climate.copernicus.eu (last access: 10 December 2024, Hersbach et al., 2023). The shapefile of the study region is obtained from Theeuwen et al. (2024).
JJET designed the study with contributions from all authors, conducted the preprocessing and postprocessing steps, carried out the analyses, and wrote the first draft of the manuscript. SW conducted the model simulations, interpreted the output of CLASS, and was involved in the writing of the first draft of the manuscript. AS was involved in writing the first draft of the manuscript. All authors contributed to the discussion and the final version of the manuscript.
The contact author has declared that none of the authors has any competing interests.
Publisher’s note: Copernicus Publications remains neutral with regard to jurisdictional claims made in the text, published maps, institutional affiliations, or any other geographical representation in this paper. While Copernicus Publications makes every effort to include appropriate place names, the final responsibility lies with the authors. Views expressed in the text are those of the authors and do not necessarily reflect the views of the publisher.
This work was performed in the cooperation framework of Wetsus, European Centre of Excellence for Sustainable Water Technology (http://www.wetsus.nl, last access: 30 July 2025). Wetsus is co-funded by the European Union (Horizon Europe, LIFE, Interreg and EDRF), the Province of Fryslân and the Dutch Government: Ministry of Economic Affairs (TTT, SBO & PPS-I/TKI Water Technology), Ministry of Education, Culture and Science (TTT & SBO) and Ministry of Infrastructure and Water Management (National Growth Fund – UPPWATER). The authors like to thank the participants of the research theme “Natural water production” (DEME and The Weather Makers) for the fruitful discussions and their financial support. The authors would like to thank the participants of the natural water production theme (DEME and The Weather Makers) for the fruitful discussions and financial support.
This research has been supported by the Nederlandse Organisatie voor Wetenschappelijk Onderzoek (grant no. VI. Veni.202.170).
This paper was edited by Andrew Feldman and reviewed by two anonymous referees.
Ali, E., Cramer, W., Carnicer, J., Georgopoulou, E., Hilmi, N. J. M., Le Cozannet, G., and Lionello, P.: Cross-Chapter Paper 4: Mediterranean Region, Climate Change 2022: Impacts, Adaptation and Vulnerability. Contribution of Working Group II to the Sixth Assessment Report of the Intergovernmental Panel on Climate Change, Cambridge University Press, 2233–2272, https://doi.org/10.1017/9781009325844.021, 2022.
Allam, A., Moussa, R., Najem, W., and Bocquillon, C.: Hydrological cycle, Mediterranean basins hydrology, in: Water Resources in the Mediterranean Region, Elsevier, 1–21, https://doi.org/10.1016/B978-0-12-818086-0.00001-7, 2020.
Ardilouze, C., Materia, S., Batté, L., Benassi, M., and Prodhomme, C.: Precipitation response to extreme soil moisture conditions over the Mediterranean, Clim. Dynam., 58, 1927–1942, https://doi.org/10.1007/s00382-020-05519-5, 2022.
Bestelmeyer, B. T., Okin, G. S., Duniway, M. C., Archer, S. R., Sayre, N. F., Williamson, J. C., and Herrick, J. E.: Desertification, land use, and the transformation of global drylands, Front. Ecol. Environ., 13, 28–36, https://doi.org/10.1890/140162, 2015.
Bonan, G. B.: Forests and climate change: Forcings, feedbacks, and the climate benefits of forests, Science, 320, 1444–1449, https://doi.org/10.1126/science.1155121, 2008.
Brunner, I., Herzog, C., Dawes, M. A., Arend, M., and Sperisen, C.: How tree roots respond to drought, Front. Plant. Sci., 6, https://doi.org/10.3389/fpls.2015.00547, 2015.
Cerasoli, S., Yin, J., and Porporato, A.: Cloud cooling effects of afforestation and reforestation at midlatitudes, P. Natl. Acad. Sci. USA, 118, e2026241118, https://doi.org/10.1073/pnas.2026241118, 2021.
Cui, J., Lian, X., Huntingford, C., Gimeno, L., Wang, T., Ding, J., He, M., Xu, H., Chen, A., Gentine, P., and Piao, S.: Global water availability boosted by vegetation-driven changes in atmospheric moisture transport, Nat. Geosci., 15, 982–988, https://doi.org/10.1038/s41561-022-01061-7, 2022.
De Hertog, S. J., Lopez-Fabara, C. E., van der Ent, R., Keune, J., Miralles, D. G., Portmann, R., Schemm, S., Havermann, F., Guo, S., Luo, F., Manola, I., Lejeune, Q., Pongratz, J., Schleussner, C.-F., Seneviratne, S. I., and Thiery, W.: Effects of idealized land cover and land management changes on the atmospheric water cycle, Earth Syst. Dynam., 15, 265–291, https://doi.org/10.5194/esd-15-265-2024, 2024.
Diffenbaugh, N. S., Giorgi, F., and Pal, J. S.: Climate change hotspots in the United States, Geophys. Res. Lett., 35, https://doi.org/10.1029/2008GL035075, 2008.
Döll, P.: Vulnerability to the impact of climate change on renewable groundwater resources: A global-scale assessment, Environ. Res. Lett., 4, 035006, https://doi.org/10.1088/1748-9326/4/3/035006, 2009.
ECMWF: IFS Documentation CY36R1 – Part IV: Physical Processes, ECMWF, https://doi.org/10.21957/2loi3bxcz, 2010.
Emanuel, K.: On the physics of high CAPE, J. Atmos. Sci., 80, 2669–2683, https://doi.org/10.1175/JAS-D-23-0060.1, 2023.
Esler, K. J., Jacobsen, A. L., and Pratt, R. B.: The biology of Mediterranean-type ecosystems, 1st Edn., Oxford University Press, https://doi.org/10.1093/oso/9780198739135.001.0001, 2018.
Findell, K. L. and Eltahir, E. A. B.: Atmospheric Controls on Soil Moisture-Boundary Layer Interactions. Part I: Framework Development, J. Hydrometeorol., 4, 552–569, https://doi.org/10.1175/1525-7541(2003)004<0552:ACOSML>2.0.CO;2, 2003a.
Findell, K. L. and Eltahir, E. A. B.: Atmospheric controls on soil moisture-boundary layer interactions: Three-dimensional wind effects, J. Geophys. Res. Atmos., 108, https://doi.org/10.1029/2001JD001515, 2003b.
Forzieri, G., Alkama, R., Miralles, D. G., and Cescatti, A.: Satellites reveal contrasting responses of regional climate to the widespread greening of Earth, Science, 356, 1180–1184, https://doi.org/10.1126/science.aal1727, 2017.
Fraedrich, K. and Kleidon, A.: A green planet versus a desert world: Estimating the effect of vegetation extremes on the atmosphere, J. Climate, 12, 3156–3163, https://doi.org/10.1175/1520-0442(1999)012%3C3156:AGPVAD%3E2.0.CO;2, 1999.
Fraser, E. D. G., Simelton, E., Termansen, M., Gosling, S. N., and South, A.: “ Vulnerability hotspots”: Integrating socio-economic and hydrological models to identify where cereal production may decline in the future due to climate change induced drought, Agr. Forest Meteorol., 170, 195–205, https://doi.org/10.1016/j.agrformet.2012.04.008, 2013.
Galleguillos, M., Gimeno, F., Puelma, C., Zambrano-Bigiarini, M., Lara, A., and Rojas, M.: Disentangling the effect of future land use strategies and climate change on streamflow in a Mediterranean catchment dominated by tree plantations, J. Hydrol., 595, 126047, https://doi.org/10.1016/j.jhydrol.2021.126047, 2021.
Gibbard, S., Caldeira, K., Bala, G., Phillips, T. J., and Wickett, M.: Climate effects of global land cover change, Geophys. Res. Lett., 32, 1–4, https://doi.org/10.1029/2005GL024550, 2005.
Hersbach, H., Bell, B., Berrisford, P., Hirahara, S., Horányi, A., Muñoz-Sabater, J., Nicolas, J., Peubey, C., Radu, R., Schepers, D., Simmons, A., Soci, C., Abdalla, S., Abellan, X., Balsamo, G., Bechtold, P., Biavati, G., Bidlot, J., Bonavita, M., De Chiara, G., Dahlgren, P., Dee, D., Diamantakis, M., Dragani, R., Flemming, J., Forbes, R., Fuentes, M., Geer, A., Haimberger, L., Healy, S., Hogan, R. J., Hólm, E., Janisková, M., Keeley, S., Laloyaux, P., Lopez, P., Lupu, C., Radnoti, G., de Rosnay, P., Rozum, I., Vamborg, F., Villaume, S., and Thépaut, J. N.: The ERA5 global reanalysis, Q. J. Roy. Meteorol. Soc., 146, 1999–2049, https://doi.org/10.1002/qj.3803, 2020.
Hersbach, H., Bell, B., Berrisford, P., Biavati, G., Horányi, A., Muñoz Sabater, J., Nicolas, J., Peubey, C., Radu, R., Rozum, I., Schepers, D., Simmons, A., Soci, C., Dee, D., and Thépaut, J.-N.: ERA5 monthly averaged data on single levels from 1940 to present, Copernicus Climate Data Store [data set], https://doi.org/10.24381/cds.f17050d7, 2023.
Hoek van Dijke, A. J., Herold, M., Mallick, K., Benedict, I., Machwitz, M., Schlerf, M., Pranindita, A., Theeuwen, J. J. E., Bastin, J.-F., and Teuling, A. J.: Shifts in regional water availability due to global tree restoration, Nat. Geosci., 15, 363–368, https://doi.org/10.1038/s41561-022-00935-0, 2022.
Intergovernmental Panel on Climate Change (IPCC): Water Cycle Changes, in: Climate Change 2021 – The Physical Science Basis, Cambridge University Press, 1055–1210, https://doi.org/10.1017/9781009157896.010, 2023.
Jarvis, P. G.: The interpretation of the variations in leaf water potential and stomatal conductance found in canopies in the field, Philos. Trans. R. Soc. Lond., 273, 593–610, https://doi.org/10.1098/rstb.1976.0035, 1976.
Juang, J. Y., Porporato, A., Stoy, P. C., Siqueira, M. S., Oishi, A. C., Detto, M., Kim, H. S., and Katul, G. G.: Hydrologic and atmospheric controls on initiation of convective precipitation events, Water Resour. Res., 43, https://doi.org/10.1029/2006WR004954, 2007.
King, J. A., Weber, J., Lawrence, P., Roe, S., Swann, A. L. S., and Val Martin, M.: Global and regional hydrological impacts of global forest expansion, Biogeosciences, 21, 3883–3902, https://doi.org/10.5194/bg-21-3883-2024, 2024.
Konings, A. G., Katul, G. G., and Porporato, A.: The rainfall-no rainfall transition in a coupled land-convective atmosphere system, Geophys. Res. Lett., 37, https://doi.org/10.1029/2010GL043967, 2010.
Konings, A. G., Dekker, S. C., Rietkerk, M., and Katul, G. G.: Drought sensitivity of patterned vegetation determined by rainfall-land surface feedbacks, J. Geophys. Res.-Biogeo., 116, 1–15, https://doi.org/10.1029/2011JG001748, 2011.
Leutwyler, D., Imamovic, A., and Schär, C.: The continental-scale soil moisture-precipitation feedback in Europe with parameterized and explicit convection, J. Clim., 34, 5303–5320, https://doi.org/10.1175/JCLI-D-20, 2021.
Lian, X., Jeong, S., Park, C. E., Xu, H., Li, L. Z. X., Wang, T., Gentine, P., Peñuelas, J., and Piao, S.: Biophysical impacts of northern vegetation changes on seasonal warming patterns, Nat. Commun., 13, 3925, https://doi.org/10.1038/s41467-022-31671-z, 2022.
Liu, W., Zhang, Q., Li, C., Xu, L., and Xiao, W.: The influence of soil moisture on convective activity: a review, Theor. Appl. Climatol., 149, 221–232, https://doi.org/10.1007/s00704-022-04046-z, 2022.
Lombardo, K. and Bitting, M.: A Climatology of Convective Precipitation over Europe, Mon. Weather Rev., 152, 1555–1585, https://doi.org/10.1175/MWR-D-23, 2024.
Luo, X., Ge, J., Guo, W., Fan, L., Chen, C., Liu, Y. U., and Yang, L.: The biophysical impacts of deforestation on precipitation: results from the CMIP6 model intercomparison, J. Clim., 35, 3293–3311, https://doi.org/10.1175/JCLI-D-21-0689.1, 2022.
Materia, S., Ardilouze, C., Prodhomme, C., Donat, M. G., Benassi, M., Doblas-Reyes, F. J., Peano, D., Caron, L. P., Ruggieri, P., and Gualdi, S.: Summer temperature response to extreme soil water conditions in the Mediterranean transitional climate regime, Clim. Dynam., 58, 1943–1963, https://doi.org/10.1007/s00382-021-05815-8, 2022.
May, R. M., Goebbert, K. H., Thielen, J. E., Leeman, J. R., Camron, M. D., Bruick, Z., Bruning, E. C., Manser, R. P., Arms, S. C., and Marsh, P. T.: MetPy: A Meteorological Python Library for Data Analysis and Visualization, B. Am. Meteorol. Soc., 103, E2273–E2284, https://doi.org/10.1175/BAMS-D-21-0125.1, 2022.
Meier, R., Schwaab, J., Seneviratne, S. I., Sprenger, M., Lewis, E., and Davin, E. L.: Empirical estimate of forestation-induced precipitation changes in Europe, Nat. Geosci., 14, 473–478, https://doi.org/10.1038/s41561-021-00773-6, 2021.
Miralles, D. G., Teuling, A. J., Van Heerwaarden, C. C., and De Arellano, J. V. G.: Mega-heatwave temperatures due to combined soil desiccation and atmospheric heat accumulation, Nat. Geosci., 7, 345–349, https://doi.org/10.1038/ngeo2141, 2014.
Monin, A. S. and Obukhov, A. M.: Basic laws of turbulent mixing in the surface layer of the atmosphere, Tr. Akad. Nauk SSSR Geophiz. Inst, 24, 163–187, 1954.
Monteith, J. L.: Evaporation and environment, in: Symposia of the society for experimental biology, 19, 205–234, https://repository.rothamsted.ac.uk/item/8v5v7/evaporation-and-environment (last access: 14 November 2025), 1965.
Noce, S., Collalti, A., and Santini, M.: Likelihood of changes in forest species suitability, distribution, and diversity under future climate: The case of Southern Europe, Ecol. Evol., 7, 9358–9375, https://doi.org/10.1002/ece3.3427, 2017.
Noilhan, J. and Mahfouf, J.-F.: The ISBA land surface parameterisation scheme, Glob. Planet Change, 13, 145–159, https://doi.org/10.1016/0921-8181(95)00043-7, 1996.
O'Connor, J. C., Dekker, S. C., Staal, A., Tuinenburg, O. A., Rebel, K. T., and Santos, M. J.: Forests buffer against variations in precipitation, Glob. Change Biol., 27, 4686–4696, https://doi.org/10.1111/gcb.15763, 2021.
Pielke, S.: Influence of the spatial distribution of vegetation and soils on the prediction of cumulus convective rainfall, Rev. Geophys., 39, 151–177, https://doi.org/10.1029/1999RG000072, 2001.
Pokhrel, Y., Felfelani, F., Satoh, Y., Boulange, J., Burek, P., Gädeke, A., Gerten, D., Gosling, S. N., Grillakis, M., Gudmundsson, L., Hanasaki, N., Kim, H., Koutroulis, A., Liu, J., Papadimitriou, L., Schewe, J., Müller Schmied, H., Stacke, T., Telteu, C. E., Thiery, W., Veldkamp, T., Zhao, F., and Wada, Y.: Global terrestrial water storage and drought severity under climate change, Nat. Clim. Change, 11, 226–233, https://doi.org/10.1038/s41558-020-00972-w, 2021.
Portmann, R., Beyerle, U., Davin, E., Fischer, E. M., De Hertog, S., and Schemm, S.: Global forestation and deforestation affect remote climate via adjusted atmosphere and ocean circulation, Nat. Commun., 13, 5569, https://doi.org/10.1038/s41467-022-33279-9, 2022.
Roberts, N., Moreno, A., Valero-Garcés, B. L., Corella, J. P., Jones, M., Allcock, S., Woodbridge, J., Morellón, M., Luterbacher, J., Xoplaki, E., and Türkeş, M.: Palaeolimnological evidence for an east-west climate see-saw in the Mediterranean since AD 900, Glob. Planet. Change, 84–85, 23–34, https://doi.org/10.1016/j.gloplacha.2011.11.002, 2012.
Ruijsch, J., Teuling, A. J., Duveiller, G., and Hutjes, R. W. A.: The local cooling potential of land restoration in Africa, Commun. Earth Environ., 5, 495, https://doi.org/10.1038/s43247-024-01650-x, 2024.
Ruiz-Peinado, R., Bravo-Oviedo, A., López-Senespleda, E., Bravo, F., and del Río, M.: Forest management and carbon sequestration in the Mediterranean region: A review, For. Syst., 26, https://doi.org/10.5424/fs/2017262-11205, 2017.
Seeley, J. T. and Romps, D. M.: Why does tropical convective available potential energy (CAPE) increase with warming?, Geophys. Res. Lett., 42, 10429–10437, https://doi.org/10.1002/2015GL066199, 2015.
Seneviratne, S. I., Corti, T., Davin, E. L., Hirschi, M., Jaeger, E. B., Lehner, I., Orlowsky, B., and Teuling, A. J.: Investigating soil moisture-climate interactions in a changing climate: A review, Earth Sci. Rev., 99, 125–161, https://doi.org/10.1016/j.earscirev.2010.02.004, 2010.
Staal, A., Theeuwen, J. J. E., Wang-Erlandsson, L., Wunderling, N., and Dekker, S. C.: Targeted rainfall enhancement as an objective of forestation, Glob. Change Biol., 30, e17096, https://doi.org/10.1111/gcb.17096, 2024.
Staal, A., Meijer, P., Nyasulu, M. K., Tuinenburg, O. A., and Dekker, S. C.: Global terrestrial moisture recycling in Shared Socioeconomic Pathways, Earth Syst. Dynam., 16, 215–238, https://doi.org/10.5194/esd-16-215-2025, 2025.
Stull, R. B.: An introduction to boundary layer meteorology, 1st Edn., Kluwer Academic Publishers, ISBN 978-90-277-2768-8, 1988.
Tennekes, H.: A model for the dynamics of the inversion above a convective boundary layer, J. Atmos. Sci., 30, 558–567, https://doi.org/10.1175/1520-0469(1973)030%3C0558:AMFTDO%3E2.0.CO;2, 1973.
Tennekes, H. and Driedonks, A. G. M.: Basic entrainment equations for the atmospheric boundarly layer, Boundary Layer Meteorol., 20, 515–531, https://doi.org/10.1007/BF00122299, 1981.
Theeuwen, J. J. E., Staal, A., Tuinenburg, O. A., Hamelers, B. V. M., and Dekker, S. C.: Local moisture recycling across the globe, Hydrol. Earth Syst. Sci., 27, 1457–1476, https://doi.org/10.5194/hess-27-1457-2023, 2023.
Theeuwen, J. J. E., Dekker, S. C., Hamelers, B. V. M., and Staal, A.: Ecohydrological variables underlie local moisture recycling in Mediterranean-type climates, J. Geophys. Res.-Biogeo., 129, e2024JG008286, https://doi.org/10.1029/2024JG008286, 2024.
Theeuwen, J., Warnau, S., Benedict, I., Dekker, S., Hamelers, H., van Heerwaarden, C., and Staal, A.: Atmospheric boundary layer development over bare soil and forest in the Mediterranean Basin, Zenodo [data set], https://doi.org/10.5281/zenodo.14716230, 2025.
Tóth, G., Montanarella, L., Stolbovoy, V., Máté, F., Bódis, K., Jones, A., Panagos, P., and Van Liedekerke, M.: Soils of the European Union, EUR 23439 EN, Luxembourg (Luxembourg), OPOCE, https://doi.org/10.2788/87029, 2008.
Treppiedi, D., Cipolla, G., and Noto, L. V.: Convective precipitation over a Mediterranean area: From identification to trend analysis starting from high-resolution rain gauges data, Int. J. Climatol., 43, 293–313, https://doi.org/10.1002/joc.7758, 2023.
Tuinenburg, O. A., Bosmans, J. H. C., and Staal, A.: The global potential of forest restoration for drought mitigation, Environ. Res. Lett., 17, 034045, https://doi.org/10.1088/1748-9326/ac55b8, 2022.
United Nations Environment Programme: Ecosystem restoration for people, nature and climate: becoming #generationrestoration, United Nations Environment Programme, 51 pp., ISBN 978-92-807-3864-3, 2021.
van der Ent, R. J., Wang-Erlandsson, L., Keys, P. W., and Savenije, H. H. G.: Contrasting roles of interception and transpiration in the hydrological cycle – Part 2: Moisture recycling, Earth Syst. Dynam., 5, 471–489, https://doi.org/10.5194/esd-5-471-2014, 2014.
van Heerwaarden, C. C. and Teuling, A. J.: Disentangling the response of forest and grassland energy exchange to heatwaves under idealized land–atmosphere coupling, Biogeosciences, 11, 6159–6171, https://doi.org/10.5194/bg-11-6159-2014, 2014.
van Heerwaarden, C. C., Vilà-Guerau de Arellano, J., Gounou, A., Guichard, F., and Couvreux, F.: Understanding the daily cycle of evapotranspiration: A method to quantify the influence of forcings and feedbacks, J. Hydrometeorol., 11, 1405–1422, https://doi.org/10.1175/2010JHM1272.1, 2010.
Vilà-Guerau de Arellano, J., Gioli, B., Miglietta, F., Jonker, H. J. J., Baltink, H. K., Hutjes, R. W. A., and Holtslag, A. A. M.: Entrainment process of carbon dioxide in the atmospheric boundary layer, J. Geophys. Res. Atmos., 109, https://doi.org/10.1029/2004JD004725, 2004.
Vilà-Guerau de Arellano, J., van Heerwaarden, C. C., van Stratum, B. J. H., and van den Dries, K.: Atmospheric boundary layer: Integrating air chemistry and land interactions [software], Cambridge University Press, https://doi.org/10.1017/CBO9781316117422, 2015.
Wallace, J. M. and Hobbs, P. V.: Atmospheric science: an introductory survey, 2nd Edn., Elsevier, ISBN 978-01-273-2951-2, 2006.
Winckler, J., Reick, C. H., and Pongratz, J.: Robust identification of local biogeophysical effects of land-cover change in a global climate model, J. Climate, 30, 1159–1176, https://doi.org/10.1175/JCLI-D-16-0067.1, 2017.
Wouters, H., Petrova, I. Y., van Heerwaarden, C. C., Vilà-Guerau de Arellano, J., Teuling, A. J., Meulenberg, V., Santanello, J. A., and Miralles, D. G.: Atmospheric boundary layer dynamics from balloon soundings worldwide: CLASS4GL v1.0, Geosci. Model Dev., 12, 2139–2153, https://doi.org/10.5194/gmd-12-2139-2019, 2019.
Yin, J., Albertson, J. D., Rigby, J. R., and Porporato, A.: Land and atmospheric controls on initiation and intensity of moist convection: CAPE dynamics and LCL crossings, Water Resour. Res., 51, 8476–8493, https://doi.org/10.1002/2015WR017286, 2015.