the Creative Commons Attribution 4.0 License.
the Creative Commons Attribution 4.0 License.
 | 07 Feb 2025
Combined effects of topography, soil moisture, and snow cover regimes on growth responses of grasslands in a low- mountain range (Vosges, France)
Pierre-Alexis Herrault
Albin Ullmann
Damien Ertlen
Growth responses of low-mountain grasslands to climate warming are poorly understood despite very large surfaces being covered in central Europe. These grasslands are characterized by still-present agricultural exploitation and complex topographical features that limit species migration and increase differences in snow regimes. This study examined MODIS surface reflectances between 2000 and 2020 across the Vosges mountain grasslands to investigate trends and drivers of spatial patterns in the annual maximum NDVI (normalized difference vegetation index). We found that a majority of grasslands indicate no significant trends, which possibly reveals several environmental and ecological compensatory effects in response to warming in the Vosges Mountains. We also noted hotspots of browning grasslands (a decrease in annual maximum NDVI), largely overrepresented compared to the greening ones (an increase in annual maximum of NDVI), a pattern which contradicts most productivity signals highlighted in European high-mountain grasslands. Spatial patterns of browning are enhanced on north-facing slopes and at low elevations (<1100 m), where high-producing grasslands with dominant herbaceous communities prevail. A low soil water recharge also appears to be pivotal in explaining the probability of browning at the study site. Through the use of winter habitat indices, we noted high responsiveness of low-mountain grasslands to differences in intra-seasonal snow regimes, partly modulated by topographic features. Prolonged and time-continuous snow cover promotes higher peak productivity and shortened green-up periods. A high number of frost events results in lower peak productivity and prolonged green-up periods. We hypothesize that observed growth responses in the Vosges Mountains are indicative of long-term future responses to climate warming in high-mountain ranges. With shorter and more discontinuous snow cover, we expect higher diversity of growth responses in European low-mountain grasslands due to strong contextual effects and high terrain complexity.
- Article
(12479 KB) - Full-text XML
- BibTeX
- EndNote


Climate warming is impacting the biodiversity and the functioning of mountain grasslands. These grasslands have experienced warmer summers and longer snow-free periods over the last few decades (Beniston, 2000; Zeeman et al., 2017; Möhl et al., 2022). The effects on plant communities may be influenced by complex topographical characteristics (i.e. altitude, slope, and exposure; Hua et al., 2022; Choler, 2015; Graae et al., 2018). Moreover, agricultural practices such as mowing, grazing, or fertilizing contribute to conditioning the species composition or modifying their physiology (Gillet et al., 2016), which potentially leads to a large diversity of plastic responses at the community level (Bektaş et al., 2021). Thus, the effects of climate warming combined with agricultural abandonment in temperate mountain ranges are multiple, such as higher plant productivity (Choler et al., 2021), longer growing seasons (Pepin et al., 2022; Möhl et al., 2022), or migration of plant species to higher altitudes (Lenoir et al., 2008; Scherrer and Koerner, 2010), with possible time lags in the responses (Alexander et al., 2018; Bektaş et al., 2021). In Europe, most related studies are concentrated in the Alps and are focused on alpine grasslands above the tree line (nival, alpine, or high montane). In contrast, very few studies are focused on low-mountain ranges, which cover vast areas in Europe and around the world and which present specificities regarding topography, biodiversity, and snow regime.
These specificities can favour a large diversity of plastic responses in plant communities and present three main advantages for understanding mountain ecosystem responses to climate change (CC):
-
Because of lower altitudes and shorter distances to farms, low-mountain grasslands are strongly dependent on traditional disturbance regimes such as mowing or grazing. Two opposite drivers tend to affect grassland vegetation, notably plant diversity (Butler et al., 2009). Abandonment of management in less productive sites can promote taller species shading and out-competing smaller species (Stevens et al., 2015). The intensification of practices (defoliation and fertilization) in the most productive sites can favour the species adapted to high levels of disturbance with fast-growing and competitive characteristics (Plantureux et al., 2005). A recent resampling study of semi-natural grasslands (2005–2019) above 600 m, conducted in the Vosges and Jura mountains, showed contrasting results between the two mountain ranges, even if both are traditional low-mountain regions devoted to dairy farming (Nicod and Gillet, 2021). In the Vosges Mountains, plant communities were not different in 2005 and 2019, contrarily to the situation in the Jura Mountains, mainly due to the intensification of agriculture in the recent years.
-
Species present in low-mountain grasslands are limited in their ability to adjust to changing climatic conditions (Ashcroft, 2010; Keppel and Wardell-Johnson, 2012). They are restricted to small isolated peaks that greatly limit their dispersion and, thus, their maintenance (Sauer et al., 2011; Keppel et al., 2017). Low-mountain ranges can act as a “summit trap” for living species, while high-mountain species have larger surfaces for migration (Sauer et al., 2011). Specific responses to warming are also likely to differ depending on plant traits, whether structural (i.e. specific leaf area) or related to functional and reproductive strategies (Bucher et al., 2018; Siebenkäs et al., 2015).
For example, graminoids and forbs are likely to give different responses as they differ in terms of their functional and reproductive strategies
-
The temporal variability of the snow cover in low-mountain environments (Schönbein and Schneider, 2003) and its decrease (Dong and Menzel, 2020) could strongly influence the growth cycle of plant species. In particular, earlier snowmelt in spring (Choler, 2015; Cassou and Cattiaux, 2016), which promotes earlier growth in the year, exposes plant communities to episodes of frost or abrupt temperature changes, which, in turn, affects the productive capacity of certain species or phenologies.
Among plastic responses, phenology has been widely studied and notably refers to the timing and duration of events in species plant growth. It can allow for the acclimation of plant communities, mainly for their essential functions, such as productivity, while remote sensing time series (MODIS, Landsat) were widely considered for monitoring these parameters over large scales (Carlson et al., 2017; Piao et al., 2006). The productivity of mountain grasslands is frequently monitored using the maximum NDVI (normalized difference vegetation index) as it captures the peak of greenness (the maximum of photosynthetic activity) during the growing season, providing a valuable metric for comparing productivity across different sites and years. In contrast, the green-up period may be characterized using the time required to reach the peak of greenness (number of days between the start of the season and the day of the peak) or the time-integrated NDVI during this stage (Tomaszewska et al., 2020). Thus, indicators that capture the length of phenophases help to better understand how plant communities adapt to environmental factors in term of growth strategies. For temperate mountain grasslands, recent works showed predominant increasing NDVImax trends (greening), partly driven by topographical complexity, e.g. in terms of altitude and exposure (Choler et al., 2021; Filippa et al., 2022). Browning trends (decreasing NDVImax trends) were also highlighted at lower altitudes but to a lesser extent (Gartzia et al., 2016), and few studies have focused on the analysis of drivers that can explain the spatial variability of the recorded signal at the mountain range scale (Choler et al., 2021). Regarding plant growth strategies, recent findings showed that climate warming lead to earlier phenology (Winkler et al., 2019) and faster plant growth (Wang et al., 2020), but responses can differ according to the community because of different functional and reproductive strategies (Bektaş et al., 2021).
Furthermore, complex interaction effects of snow and terrain complexity on vegetation expansion or growth were underlined in cold-related habitats such as shrubs and grasslands (Ropars and Boudreau, 2012; Tape et al., 2012; Choler et al., 2021; Tomaszewska et al., 2020; Choler, 2015). Topographic complexity is a key determinant since it increases microclimatic heterogeneity according to climatic patchiness (or fragmentation) and the range of climatic conditions available (Graae et al., 2018). Therefore, one challenge consists of characterizing snow cover dynamics in complex topographic environments since climate warming is also often related to lower snow cover protection and more frequent exposure to freezing events resulting from early snowmelt, potentially limiting some species (Choler, 2015). Over the past decade, several studies combined MODIS NDSI (normalized difference snow index) time series and climate data for providing functional measures of snow conditions as adapted to cold-related species (Gudex-Cross et al., 2021; Zhu et al., 2017; Dietz et al., 2012). In particular, winter habitat indices (WHIs) are composite indices measuring snow cover duration or the exposure to freezing, qualifying how plants lack thermal refugia (i.e. the subnivium) and identifying snow-to-rain-dominated systems through monitoring snow cover variability. In low-mountain ranges affected by high intra-seasonal snow cover variability or earlier snowmelt, the latter variables could be of high interest to understand snow phenology effects on the growth response of mountain grasslands (Dong and Menzel, 2020).
In this study, MODIS time series (MOD09Q1) from 2000 to 2020 are used to assess the spatial variability of decennial peak productivity trends of mountain grasslands in a low-mountain range. Then, statistical analysis is performed to understand the influence of climatic and topographic variables on the derived spatial patterns of productivity. Lastly, the influence of snow cover dynamics on the growth response of mountain grasslands was investigated through the use of winter habitat indices and phenometrics. We sought to answer the following questions: (1) do low-mountain grasslands majorly express higher plant productivity in response to warming over time, as has already demonstrated for high-mountain grasslands? (2) Can the derived spatial patterns of productivity at the mountain range scale be explained by a combination of topo-climatic drivers? (3) How do contextual effects in snow cover regimes affect the growth response of grassland communities?
2.1 Study area
The Vosges Mountains, located in the northeast of France, make up a low-mountain range, with altitudes varying from 200 to 1425 m a.s.l. (Fig. 1). Due to the orientation of its primary drainage divide, which runs NNE–SSW, and depressions from the Atlantic Ocean, the region experiences a foehn effect, resulting in a climate that ranges from oceanic to (almost) semi-continental. This is evidenced by the significant rainfall gradient from west to east, with the main ridge of the Hautes Vosges receiving over 2300 mm yr−1 compared to the Upper Rhine Graben, which receives only 550 mm yr−1 in Colmar, located 20 km directly to the east. Winters are typically cold, while summers are mild (mean annual temperature of 11 °C).
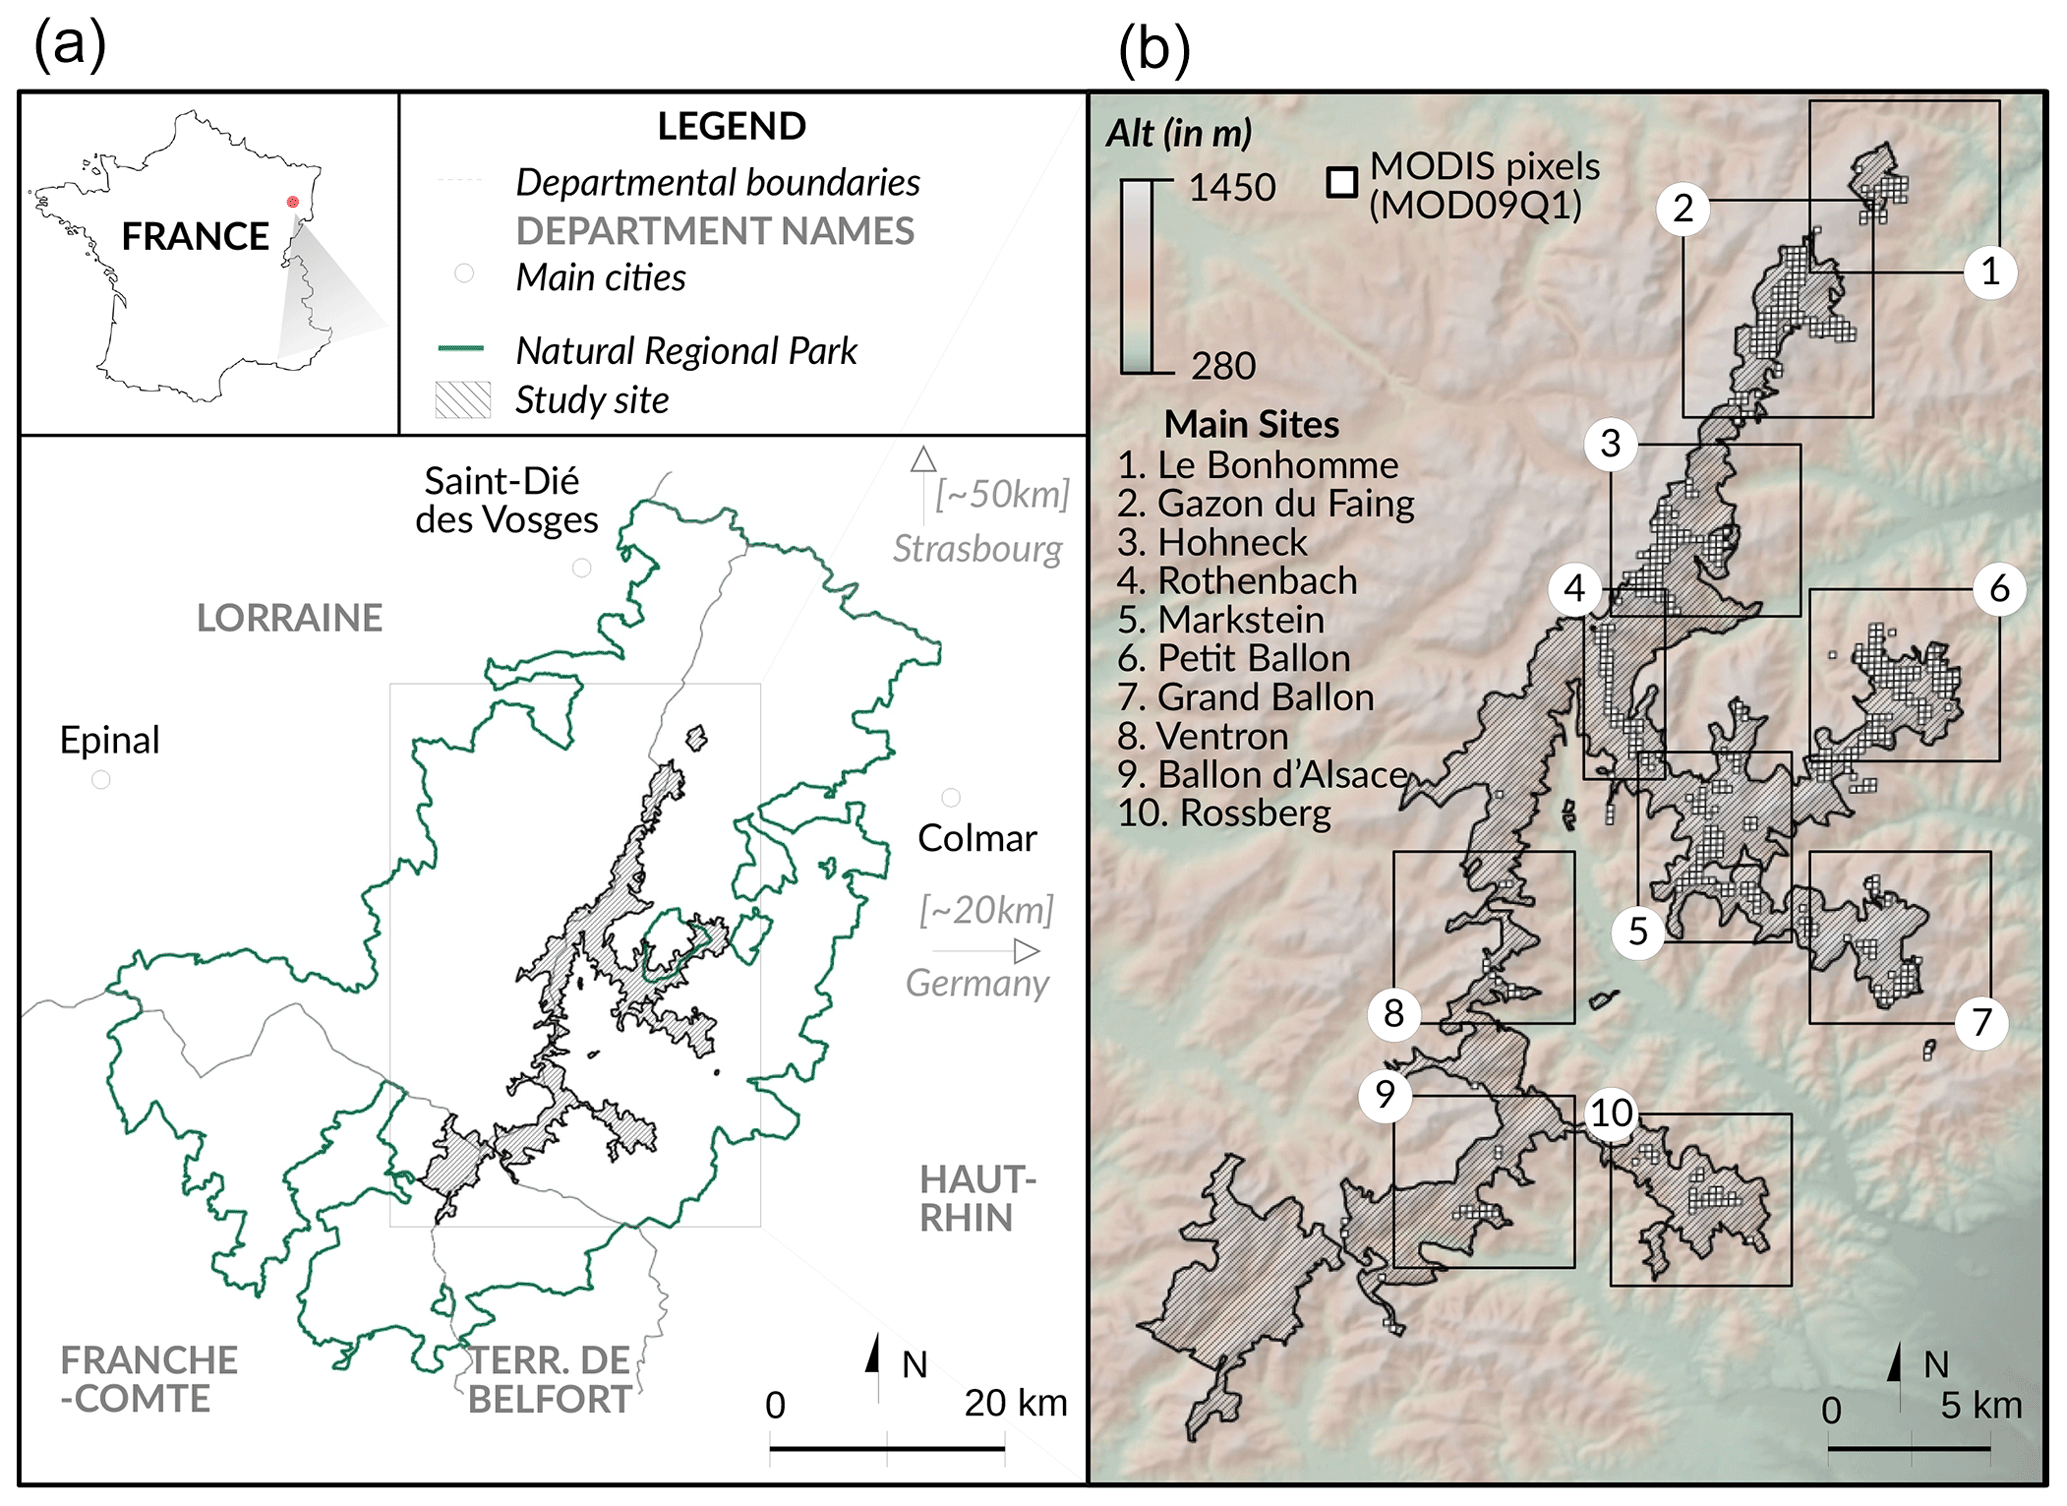
Figure 1(a) Location map of the study area; (b) distribution of the MODIS pixels selected across the 10 sites in the Vosges Mountains.
Our study area is located directly within the Hautes Vosges and is centred around the main central ridge extending from the Tanet site in the north to the Ballon d'Alsace in the south, representing around 3500 ha of high-altitude-mountain grasslands locally known as the Hautes Chaumes. They are inherited from ancestral grazing, dating from at least the Middle Ages (Goepp, 2007), and are currently operated by around 100 agricultural farms, mainly dairy cattle farms producing Munster cheese. They are largely colonized by forests on both sides (Lorraine to the east and Alsace to the west), but pastures and hay meadows are still present on the summits. After agricultural abandonment (1980s), numerous landscape and pastoral reopening initiatives were implemented through the actions of the Regional Natural Park and the farmers' union. Finally, these grasslands are part of the Natura 2000 European network and exhibit a high species diversity (Ferrez, 2017). They are composed of both herbaceous vegetation (graminoids and forbs) such as Nardus stricta L., Meum athamanticum (Jacq.), Festuca rubra, and Festuca ovina L. and shrubs where three species of Vaccinium are present (Vaccinium myrtillus L., Vaccinium uliginosum L., and Vaccinium vitis-idaea), as well as Calluna vulgaris L. Their soils range from acidic brown soils to ochre podzolic soils, passing through humiferous ochre-brown soils (Goepp, 2007).
2.2 Selection of pixels
Several spatial databases were used to delimit study sites in the Vosges Mountains. The first source was the database of the Regional Natural Park, which identifies protected sites such as NATURA 2000 or the Natural Reserve, including natural classes such as forests and grasslands. We selected sites with elevations above 900 m a.s.l. in the Hautes Vosges regions, corresponding to the altitude where mountain grasslands are first above tree line. These were merged to form the study area for this paper. To make the study easier to interpret at a finer scale, we divided it into 10 sites from north to south: Le Bonhomme, Gazon du Faing, Hohneck, Petit Ballon, Röthenbach, Markstein, Grand Ballon, Ventron, Rossberg, and Ballon d’Alsace (Fig. 1). Our second source was the CIGAL land cover database, which was produced in the region Grand Est and includes 54 land cover classes at level 4 (CIGAL – product description) based on the manual digitization of high-resolution satellite images. We selected the “mountain grasslands” class and updated it with very-high-resolution aerial images from 2020. We used a 1 m resolution digital elevation model (DEM) from the French National Mapping Institute (RGE IGN) to extract mountain grasslands located above 900 m a.s.l. This spatial coverage was then intersected with the MODIS grid corresponding to the MOD09Q1 product (250 m spatial resolution; see Sect. 2.3) to select candidate pixels. To ensure that each pixel was above the tree line, we removed pixels containing more than 10 % trees from the analysis. In total, we selected 536 pixels for further analysis.
2.3 MODIS-derived metrics
We used the MOD09A1 and MOD09Q1 (version 6) surface reflectance products corresponding to the tile h18.v4, downloaded from the Land Processed Distributed Active Archive Center (LP DAAC) using the MODIStsp R package between 1 October 2000 and 31 December 2020. Surface reflectance in the red (red), green (green), near-infrared (NIR), and mid-infrared (MIR) were used to calculate a normalized difference vegetation index (NDVI = (NIR−red)/(NIR+red)) at a resolution of 250 m and a normalized difference snow index (NDSI = (green−MIR)/(green+MIR)) at a resolution of 500 m (Salomonson and Appel, 2004).
Missing or low-quality data were identified by examining quality insurance information contained in MOD09Q1 products and interpolated using a cubic smoothing spline. Similarly to Choler (2015), NDVI and NDSI values that were 2 times larger or smaller than the average of the two preceding and following values were considered to be outliers and were excluded. Time series were gap filled using cubic spline interpolation with a moving window of length =2.
For each pixel, two phenological metrics providing indications of mountain grassland conditions during the growth season (approximately between April and September at the study site) were calculated:
-
The peak of value (PkV) is the maximum NDVI (NDVImax) registered during the growth season. The date of peak (DOP) is the day where PkV was recorded.
-
Time to peak (TTP, the duration of the green-up phase) corresponds to the number of days required to reach PkV from the start of the season (SOS). SOS was defined as the first day of the year reaching 20 % of the NDVI maximum amplitude, and the end of the season (EOS) is the first time point that exceeds 70 % of the NDVI amplitude maximum.
The “NDSI/NDVI >1” principle was used to detect the presence of snow. Our observation window starts on day of the year 250 (DOY250) in the previous year and extends to DOY150 in the present year (DOY250 year 1 through DOY150), allowing us to characterize the snow cover each year and to identify the first (first snow) and last (last snow) appearances of snow cover during the winter season. Three winter habitat indices (WHIs) were then calculated for every year from 2001 to 2020 for the winter season (October–June): (i) snow season length (SSL), (ii) spring frozen ground without snow (SFGWS), and (iii) snow cover variability (SCV). SSL is the number of days between first snow and last snow, while SCV is computed for the period from first snow to last snow by summing the snow days preceded by at least 2 snow-free days. We hypothesized that SCV may be responsible for abrupt variations in ground thermal regimes, which can alter the soil microorganisms. A high snow cover variability also indicates a low snowpack depth, leading to lower snow insulation for plant species. SFGWS is computed by summing the number of days with <0°, recorded as snow-free (Gudex-Cross et al., 2021; see Sect. 2.4. for the climatic datasets), and is summed for the period from SOS to DOP for each year. We hypothesized that an increase in SFGWS may have detrimental effects on plant growth (Baptist et al., 2010; Inouye, 2000), resulting in a decrease in productivity (PkV) and an increase in the length of green-up (TTP). We examined the relationships between WHIs using Pearson’s correlations and then created a multiband composite image with the final WHIs used in our analysis. This was done to identify sites with unique snow cover dynamics across the study area. We used the non-parametric, rank-based Mann–Kendall (MK) monotonic test to assess the significance of NDVI trends (p value <0.05). To investigate fluctuations over the period 2000–2020, we fitted linear models based on the Theil–Sen single median slope. Compared to the least-squared method, the Theil–Sen estimator is more robust against outliers due to its handling of extremities in the data.
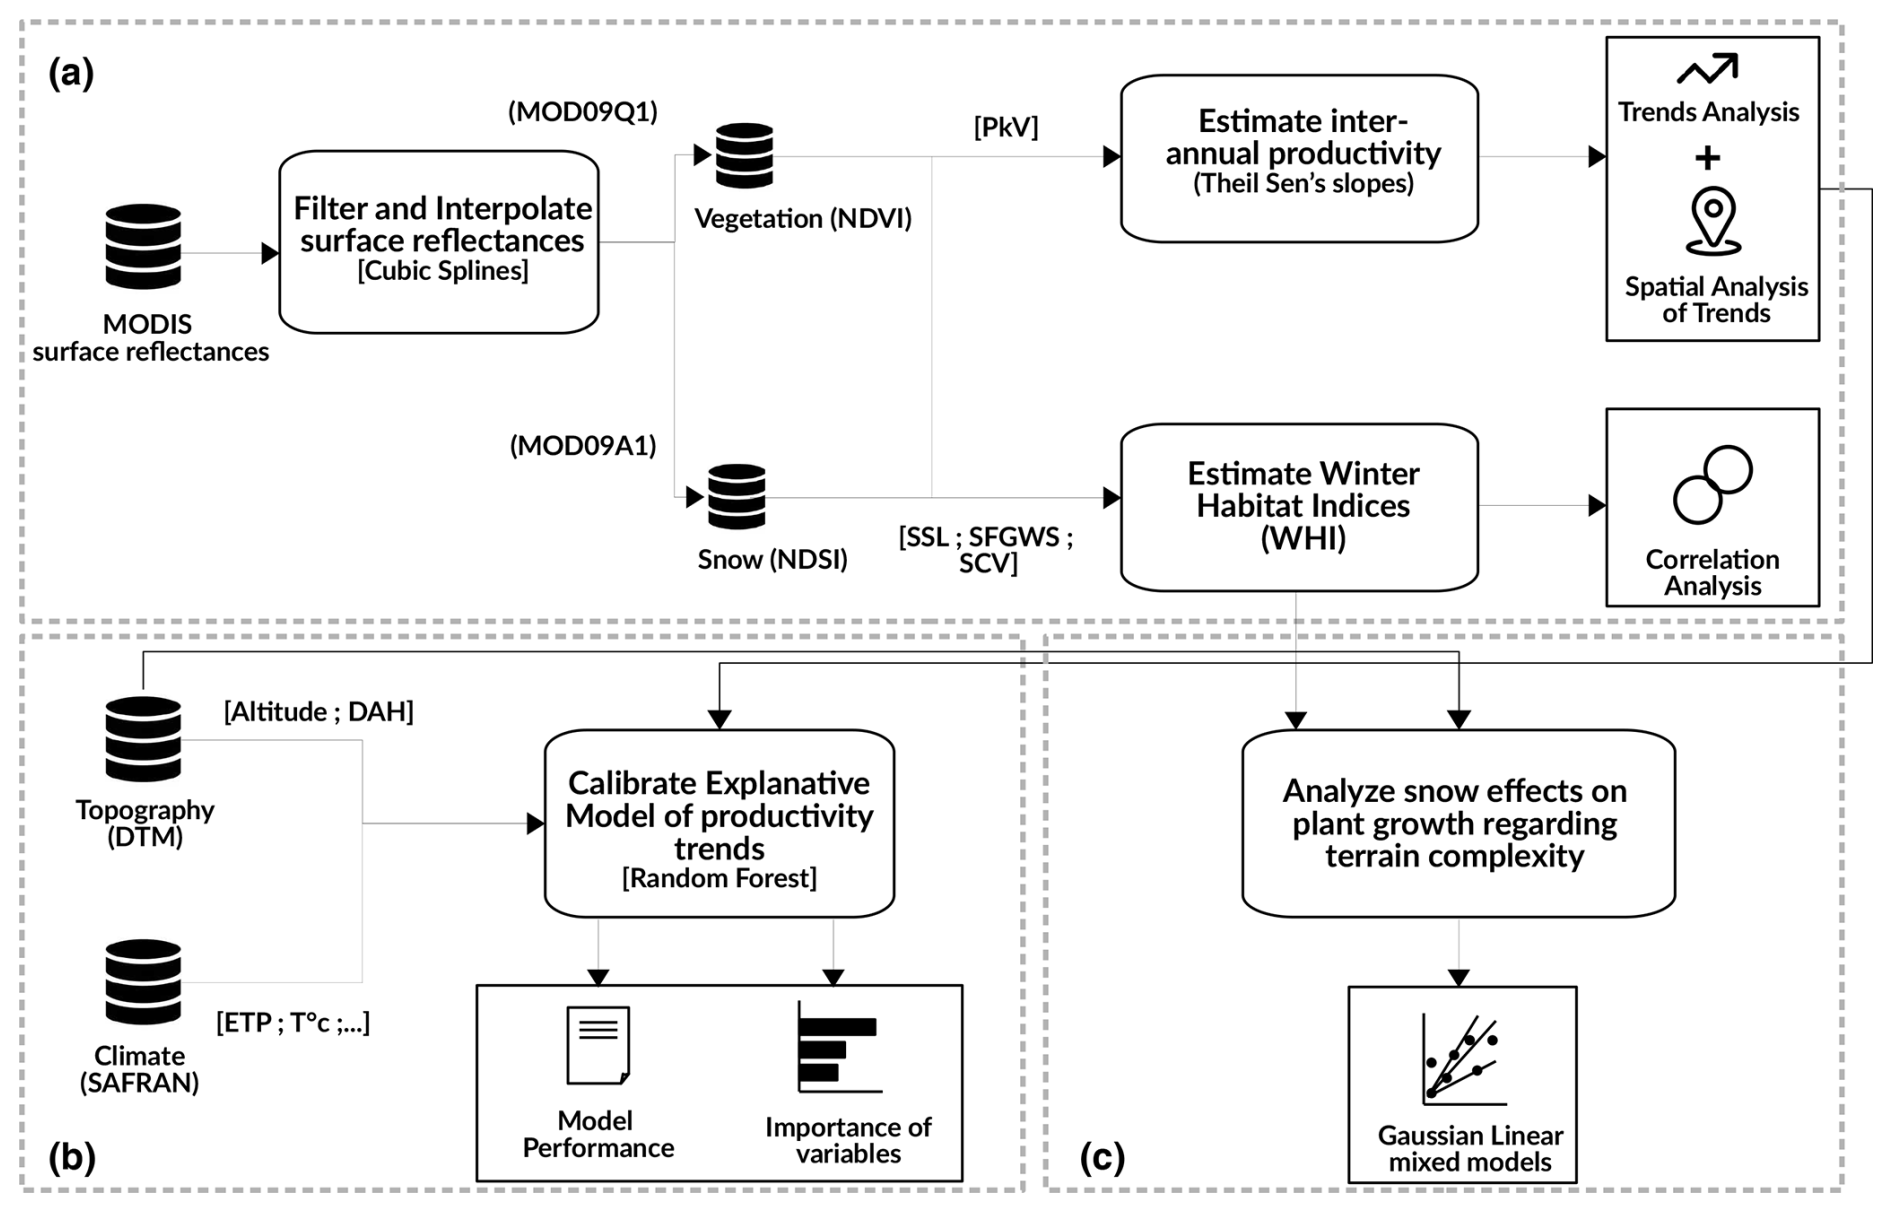
Figure 2Detailed flowchart of the methodology applied in this study to understand the growth response of mountain grasslands in the Vosges mountain range. Three main stages were identified: (a) aims to estimate phenological indicators and to calculate interannual peak productivity trends, (b) corresponds to the calibration of the explanative model to identify drivers of the spatial variability of peak productivity trends, and (c) has the objective of investigating contextual effects of intra-seasonal snow regimes on plant growth.
2.4 Climate and topographical metrics
We estimated terrain indices from the 1 m resolution digital elevation model (IGN). We calculated the mean, range, and standard deviation of elevation and the diurnal anisotropic heat (DAH) index. The DAH index takes into account the slope and the aspect and is calculated as follows: , where amax is the slope aspect receiving the maximum amount of heat, a is the aspect, and b is the slope angle. We defined amax as 198° (south southwest) as it corresponds, on average, to the earliest SOS over the study site in the past 20 years (Choler et al., 2021).
The daily grids provided by the SAFRAN-SURFEX/Crocus-MEPRA model chain (S2M) developed by Meteo France (Durand et al., 2009; Noilhan and Mahfouf, 1996; Ledoux et al., 1989) were used to derive climatic variables. To characterize summer warming, we computed the average of daily maximum temperatures during the summer months (June, July, and August; noted as T max). We computed the difference between precipitation (P) and evapotranspiration (ETP; noted as P–ETP). P–ETP differences were summed over the summer months to estimate fluctuations in the availability of rainwater for plants during the growing season. We also used the Soil Wetness Index (SWI) to measure the influence of soil moisture conditions on plant growth cycles (Soubeyroux et al., 2008). This index represents the soil moisture level over a specific period in the first 2 m of soil compared to its maximum water-holding capacity. Within the SAFRAN model, SWI is calculated based on meteorological inputs like precipitation, evapotranspiration, temperature, and wind. It ranges from 0 (completely dry soil) to 1 (fully saturated soil). We first summed the number of days with SWI indices lower than 0.7 (noted as SWIlow) over a period defined between SOS and DOP as this corresponds to the upper limit of the third quantile. We considered it to be that, below this value, the water reserve in the soil was low for soils above 900 m of the study area. Then, we calculated the ratio of SWIlow over the number of days between DOP and SOS. The median Theil–Sen slopes of all climatic variables over the past 20 years have been used as statistical predictors. Pearson correlation coefficients were used to measure covariance between variables.
2.5 Statistical analysis
2.5.1 Assessment of peak productivity trends and potential drivers
We used the non-parametric, rank-based Mann–Kendall (MK) monotonic test (significance at 5 % level) to classify NDVImax trends into three categories: no significant greening, positive greening, and browning. To investigate potential drivers of the spatial distribution of NDVImax trends, we developed a random forest (RF) regression model. RF models are a widely accepted approach to study relationships between biological patterns and environmental variables as they can address linear and non-linear effects (Revuelto et al., 2020; Choler et al., 2021; Revuelto et al., 2022). Due to the limited number of pixels belonging to the positive-greening class, we excluded it from our analysis, and we focused on explaining the categories of no significant greening (NSG) and negative greening (NG). Additionally, we used a synthetic minority oversampling technique (SMoTE) to address the unbalanced dataset (NG =67 and NSG =459). SMoTE is an oversampling technique which creates artificial synthetic samples for the minority class using nearest-neighbour classification (Chawla, 2010). This helps to overcome the risk of overfitting in the classification model compared to traditional random naive oversampling techniques. To evaluate the performance of the prediction models based on similar datasets, we used a repeated-holdout cross-validation method. Only non-synthesized candidates were used for this evaluation. For each run (100 in total), we randomly selected two-thirds of the training set to train the model and one-third for predictions. We computed the average Kappa score and average accuracy by class to evaluate the prediction results. We assessed predictor importance using the mean decrease in accuracy (MDA) and the mean increase in Gini, which quantify the model's stability and the purity of nodes and leaves. We used a permutation-based importance measure to determine the relative importance of each predictor and to quantify the effect of a dropped variable on model accuracy. Lastly, partial dependence plots were analysed to investigate relationships between the classification probabilities and the values taken for each predictor. In order to increase our understanding about negative trends in peak productivity, the drawn curves illustrate the predicted probability for the class of negative greening (browning).
We used the randomForest, caret, pdp, and performanceEstimation R packages.
2.5.2 Linking winter habitat indices with the growth response of mountain grasslands
We investigated the effects of winter habitat indices on the growth response of mountain grasslands. Two linear mixed models were computed with the pixel ID nested in the year as random variables to control for spatial and temporal pseudo-replications (Pinheiro and Bates, 2000): the first one was used to measure the effects of snow metrics on PkV, and the second one was used to investigate similar effects on TTP. SFGWS, SSL, SCV, altitude, and DAH were included as fixed factors. Interactions between the topographical variables (DAH and altitude) and SFGWS, SSL, or SCV were also calculated. All explanatory variables were standardized by retrieving means and dividing by standard deviations to compare the magnitude of model variables' responses directly. Correlations between covariates in full models were assessed with variance inflation factors (all VIFs <5; Murray et al., 2012; see Tables A1 and A2 in the Appendix). We compared the Akaike information criterion (AIC values, Burnham and Anderson, 2004) of the full model with a null model including random effects only to test if the selected variables really improve the understanding of TTP or PkV variation. The model was run with the nlme R package (Lindstrom and Bates, 1990).
Over the period 2000–2020, we found that the majority of pixels showed non-significant temporal trends (N=459 %, 85.6 %). We also highlighted significant (p<0.05) negative temporal trends (browning) in NDVImax for 12.5 % (N=67) of the 536 pixels, while only 1.9 % of pixels (N=10) exhibited significant positive trends (vegetation greening, Fig. 3). Herbaceous vegetation is overrepresented among the significant browning pixels at 76.1 % (N=51), and shrub vegetation is dominant among the significant greening trends at 90 % (N=9). Half of the browning trends (50.7 %, N=34) exhibited a coefficient value higher than −0.002, and only 10.4 % (N=7) were lower than −0.003. Lastly, non-significant pixels were recorded all over the massif, but significant trends were not spatially uniform, with hotspots of browning corresponding to the Hohneck, Petit Ballon, Markstein, and Rossberg sites. The few greening trends were rare and only recorded in Gazon du Faing, Petit Ballon, and Grand Ballon. They were quasi-exclusively located at the highest elevations (>1300 m).
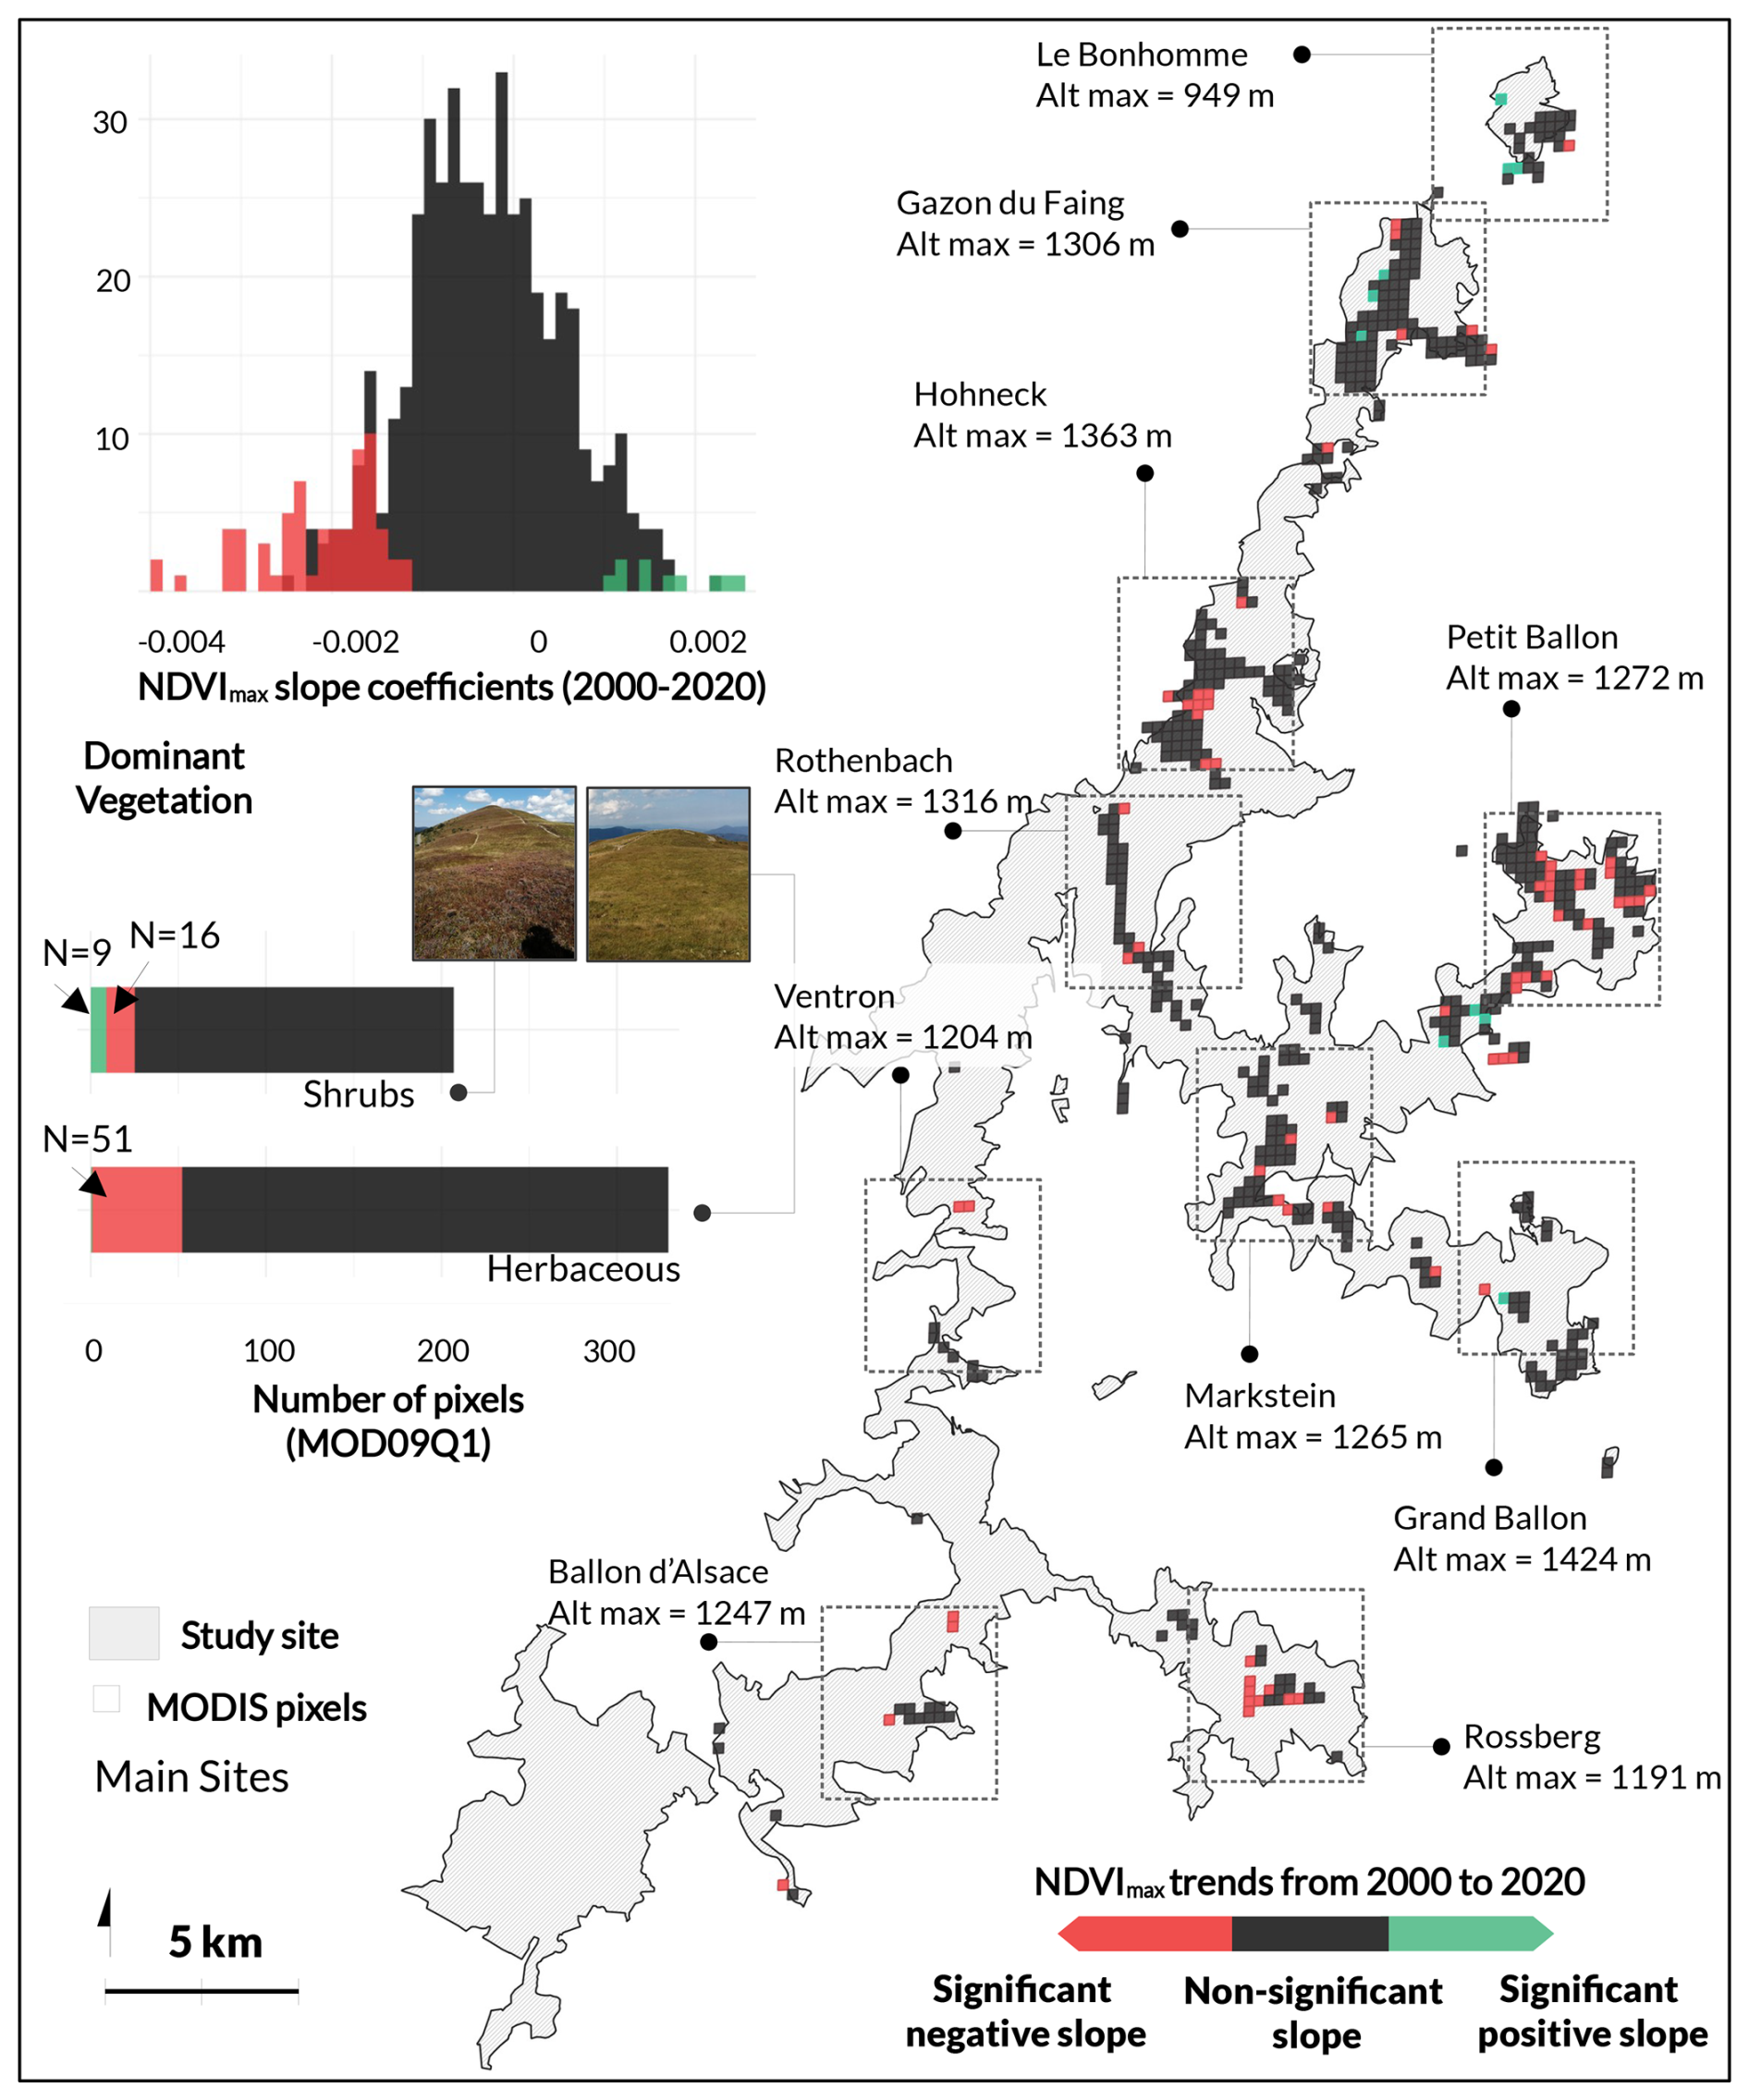
Figure 3(a) Spatial distribution of NDVImax trends. The colour represents the categories of NDVImax trends over the 2000–2020 period (red indicates significant negative NDVImax slope or browning, black indicates no significant NDVImax slope, and green indicates significant positive NDVImax slope or greening). Slopes were calculated using the Theil–Sen median slope. Levels of significance were estimated using a non-parametric, rank-based, Mann–Kendall monotonic test. (b) Frequency distribution of NDVImax trends for the 2000–2020 period. (c) Greening trends by dominant vegetation based on the CIGAL land cover class.
The model classified browning and non-significant pixels with an accuracy of 0.89 ± 0.05 % and 0.83 ± 0.03 %, respectively, corresponding to a global kappa of 0.52 ± 0.06 and an accuracy of 0.84 ± 0.03 %. The ranking of predictors shows that topographical variables such as elevation and DAH were important predictors, along with the SOS and SWI slopes (Fig. 4). They exhibited high mean decrease accuracy (MDA) and mean decrease Gini (MDG), indicating high suitability as predictors and a high contribution to the homogeneity of nodes and leaves. Partial dependence plots showed that the probability of detecting browning trends decreased with positive DAH (SSW) and increased with elevation between 900 and 1100 m (Fig. 5). However, it continuously decreased with increasing elevation after 1100 m. Results also showed that browning trends were enhanced by positive SOS slopes and higher SWI slopes. In fact, as the number of days with low soil humidity (SWI <0.7) increases so does the probability of finding browning tendencies. Lastly, a low MDG and/or MDA for T-max slopes and P–ETP slopes were found, meaning marginal or insignificant effects in the classification procedure.
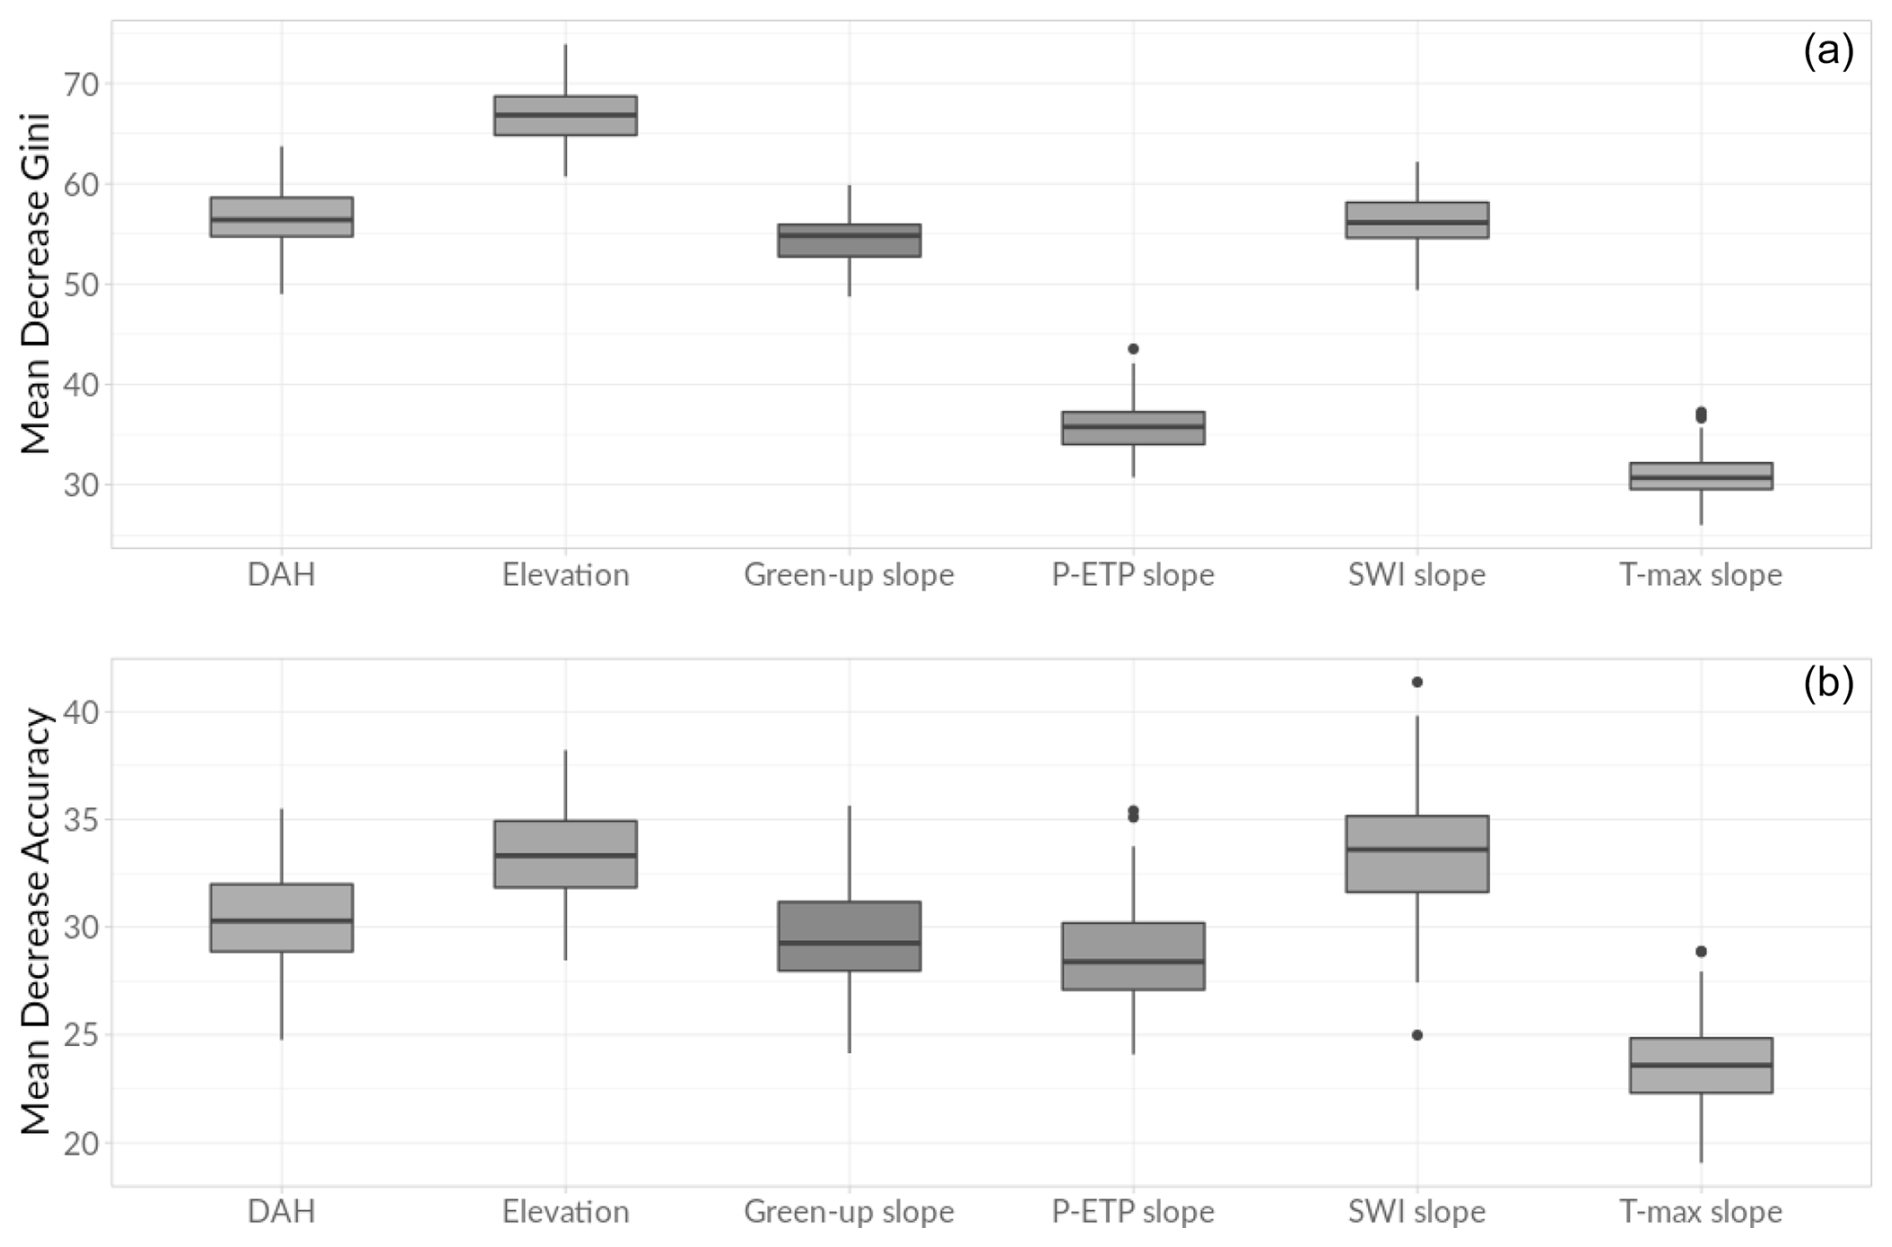
Figure 4(a) Contribution of predictors to the purity of nodes and leaves based on mean decrease Gini coefficient. (b) Predictor importance ranking based on mean decrease in accuracy (MDA) scores.
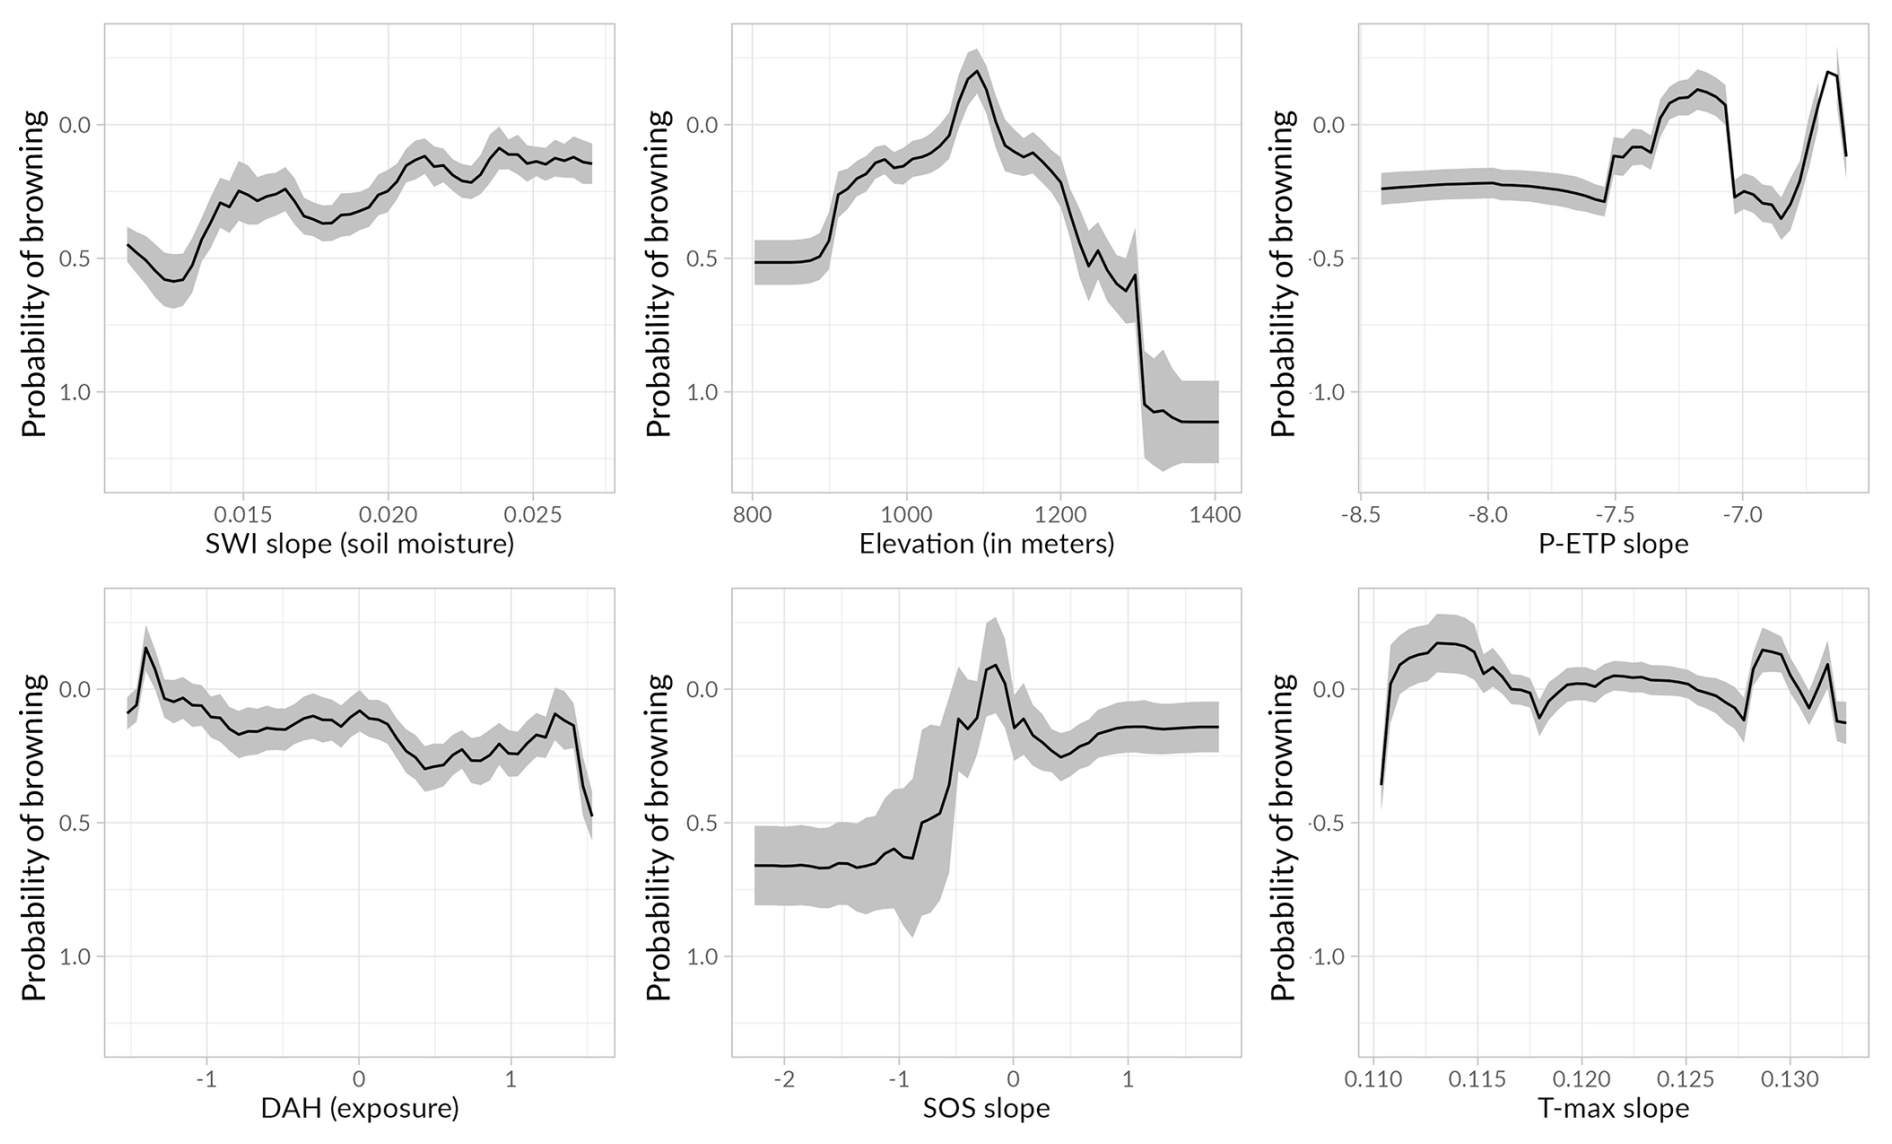
Figure 5Partial dependence plots illustrating the feature contribution of the six predictors to the browning class (the significant negative NDVImax slope). Each graph represents the influence (intensity and direction, positive or negative) of each predictor. The x axis represents the value of the predictor. The y axis represents the feature contribution or the change in predicted browning-class probability for a specific value of the predictor. The fitted line was estimated with a k nearest neighbour function, with Gaussian distance weighting.
MODIS WHI showed low to moderate correlations (Fig. A2). Snow season length and snow cover variability had the strongest correlation (Rho =0.64, p<0.001), followed by spring frozen ground without snow and snow season length (Rho , ) and then snow cover variability and spring frozen ground without snow (Rho , p<0.05). The combination of WHIs in a composite image highlights distinct zones of different snow cover dynamics dominated by either one WHI or a combination of them (Fig. 6). Hohneck, Röthenbach, Markstein, and the southern part of Rossberg, as well as some pixels of Grand Ballon, are some of the harshest and are dominated by long snow seasons with near-continuous snow cover or low snow cover variability. Gazon du Faing is also dominated by high snow season lengths but with larger snow cover variability and moderate spring frozen ground without snow. However, Petit Ballon, Le Bonhomme, Ballon d'Alsace, and the northern part of Rossberg are dominated by pixels exhibiting frequent spring frozen ground without snow, high snow cover variability, and relatively low snow season length.
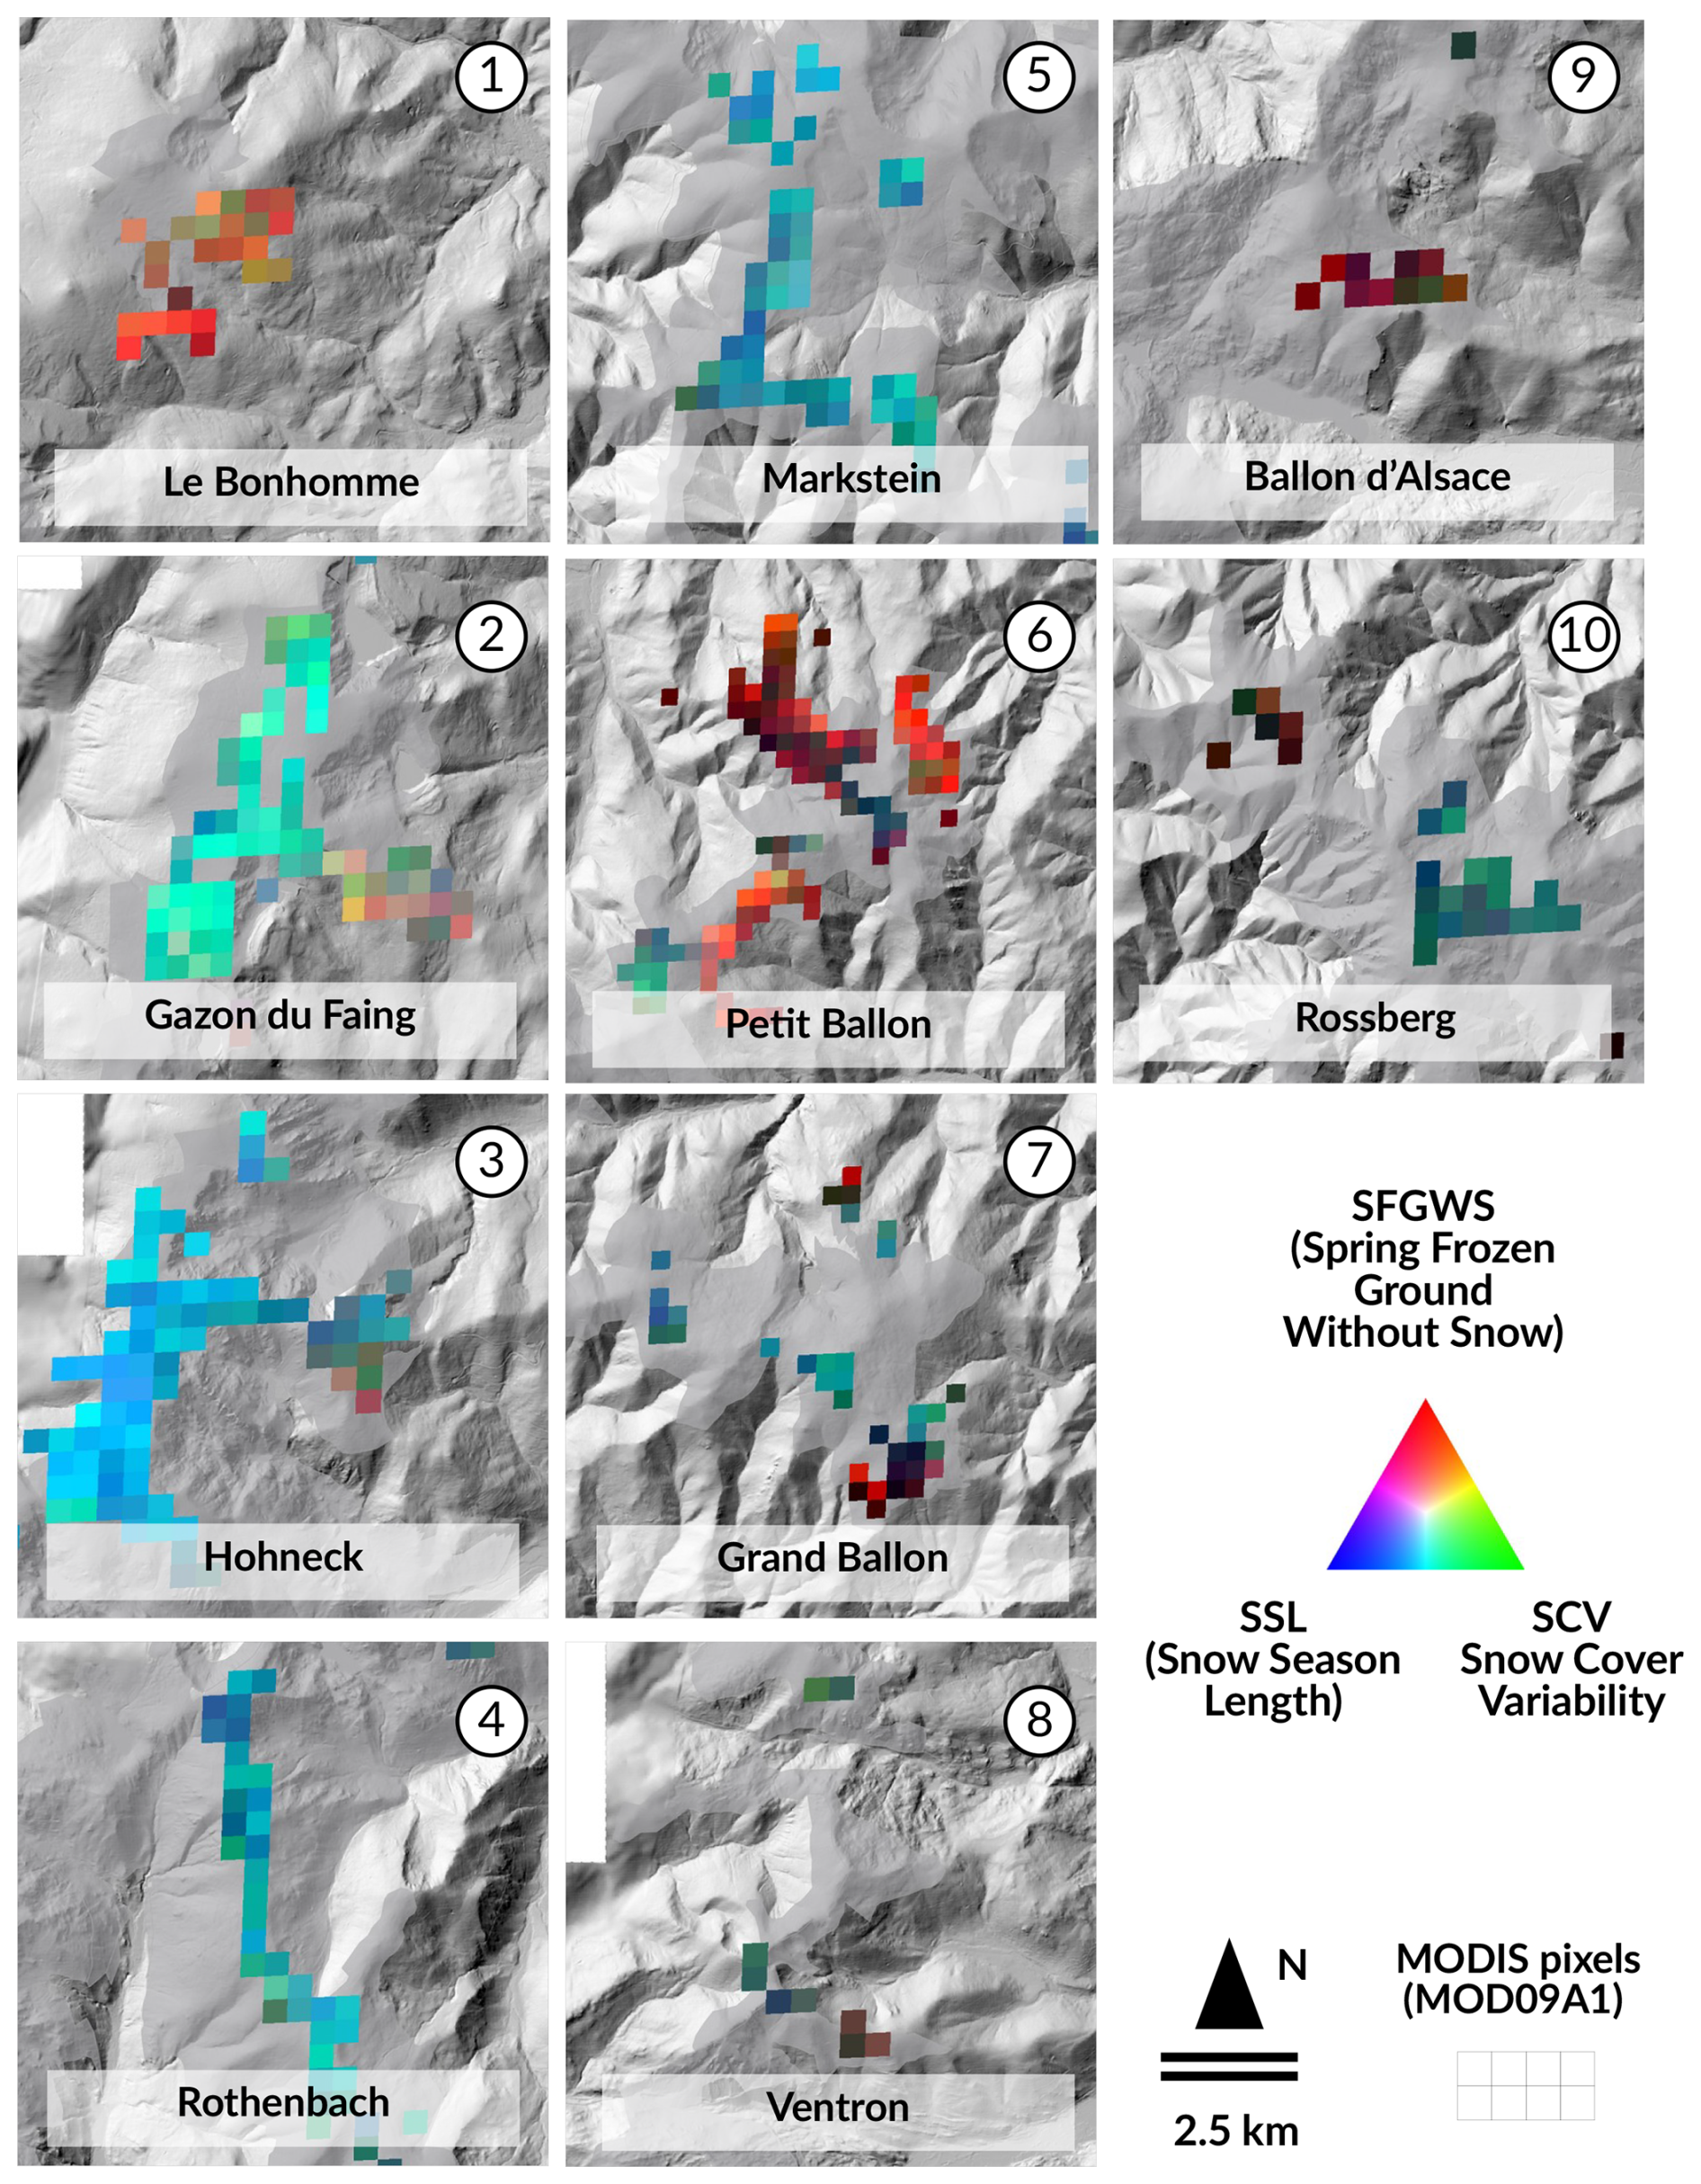
Figure 6Composite spatial patterns in the MODIS WHIs covering the periods from 2000–2001 to 2019–2020, highlighting areas with distinct snow cover dynamics across the Vosges Mountains. The spring frozen ground without snow (SFGWS) is in red, the snow season length (SSL) is in blue and the snow cover variability (SCV) is in green.
Table 1Summary table of model outputs (degrees of freedom (DOFs), slope estimates (and standard errors) of fixed variables, t values, and p values.

The slope of the relationship between TTP or PkV and significant variables of the linear mixed models were examined (Table 1). AIC values of full models were substantially smaller than those of null models (full-model AIC values were 25560.03 and 28687.59 and null-model AIC values were 28744.08 and 28744.08 for TTP and PkV, respectively), suggesting that explanatory variables used in the full model improved the understanding of the main drivers of phenometrics. The elevation of the pixel was associated with an increase in PkV (slope estimate =0.03; p<0.001) and a decrease in TTP (slope estimate ; p<0.001). DAH had no independent significant effect on PkV and TTP. Snow discontinuity was the variable with the largest effect (positive) on TTP (slope estimate =0.34; p<0.001). This effect was larger when the pixels were located at lower altitudes (Fig. 7a). It also had a positive effect on the peak of productivity (slope estimate =0.04; p<0.001). The latter effect was enhanced in pixels with higher DAH values and which were therefore situated on SSW-facing slopes (Fig. 7b). Snow discontinuity was associated with a decrease in TTP (slope estimate ; p<0.001). This effect was greater when the pixels were located at lower elevations (i.e. <1000 m; Fig. 7a). It was also an important driver of PkV (slope estimate =0.07; p<0.001). Lastly, SFGWS showed a positive association with TTP (slope estimate =0.24; p<0.01). This effect was more important in pixels located on east-facing slopes and at higher altitudes (Fig. 7a, b). The number of frozen days without snow in spring was also negatively associated with PkV (slope estimate ; p<0.001).
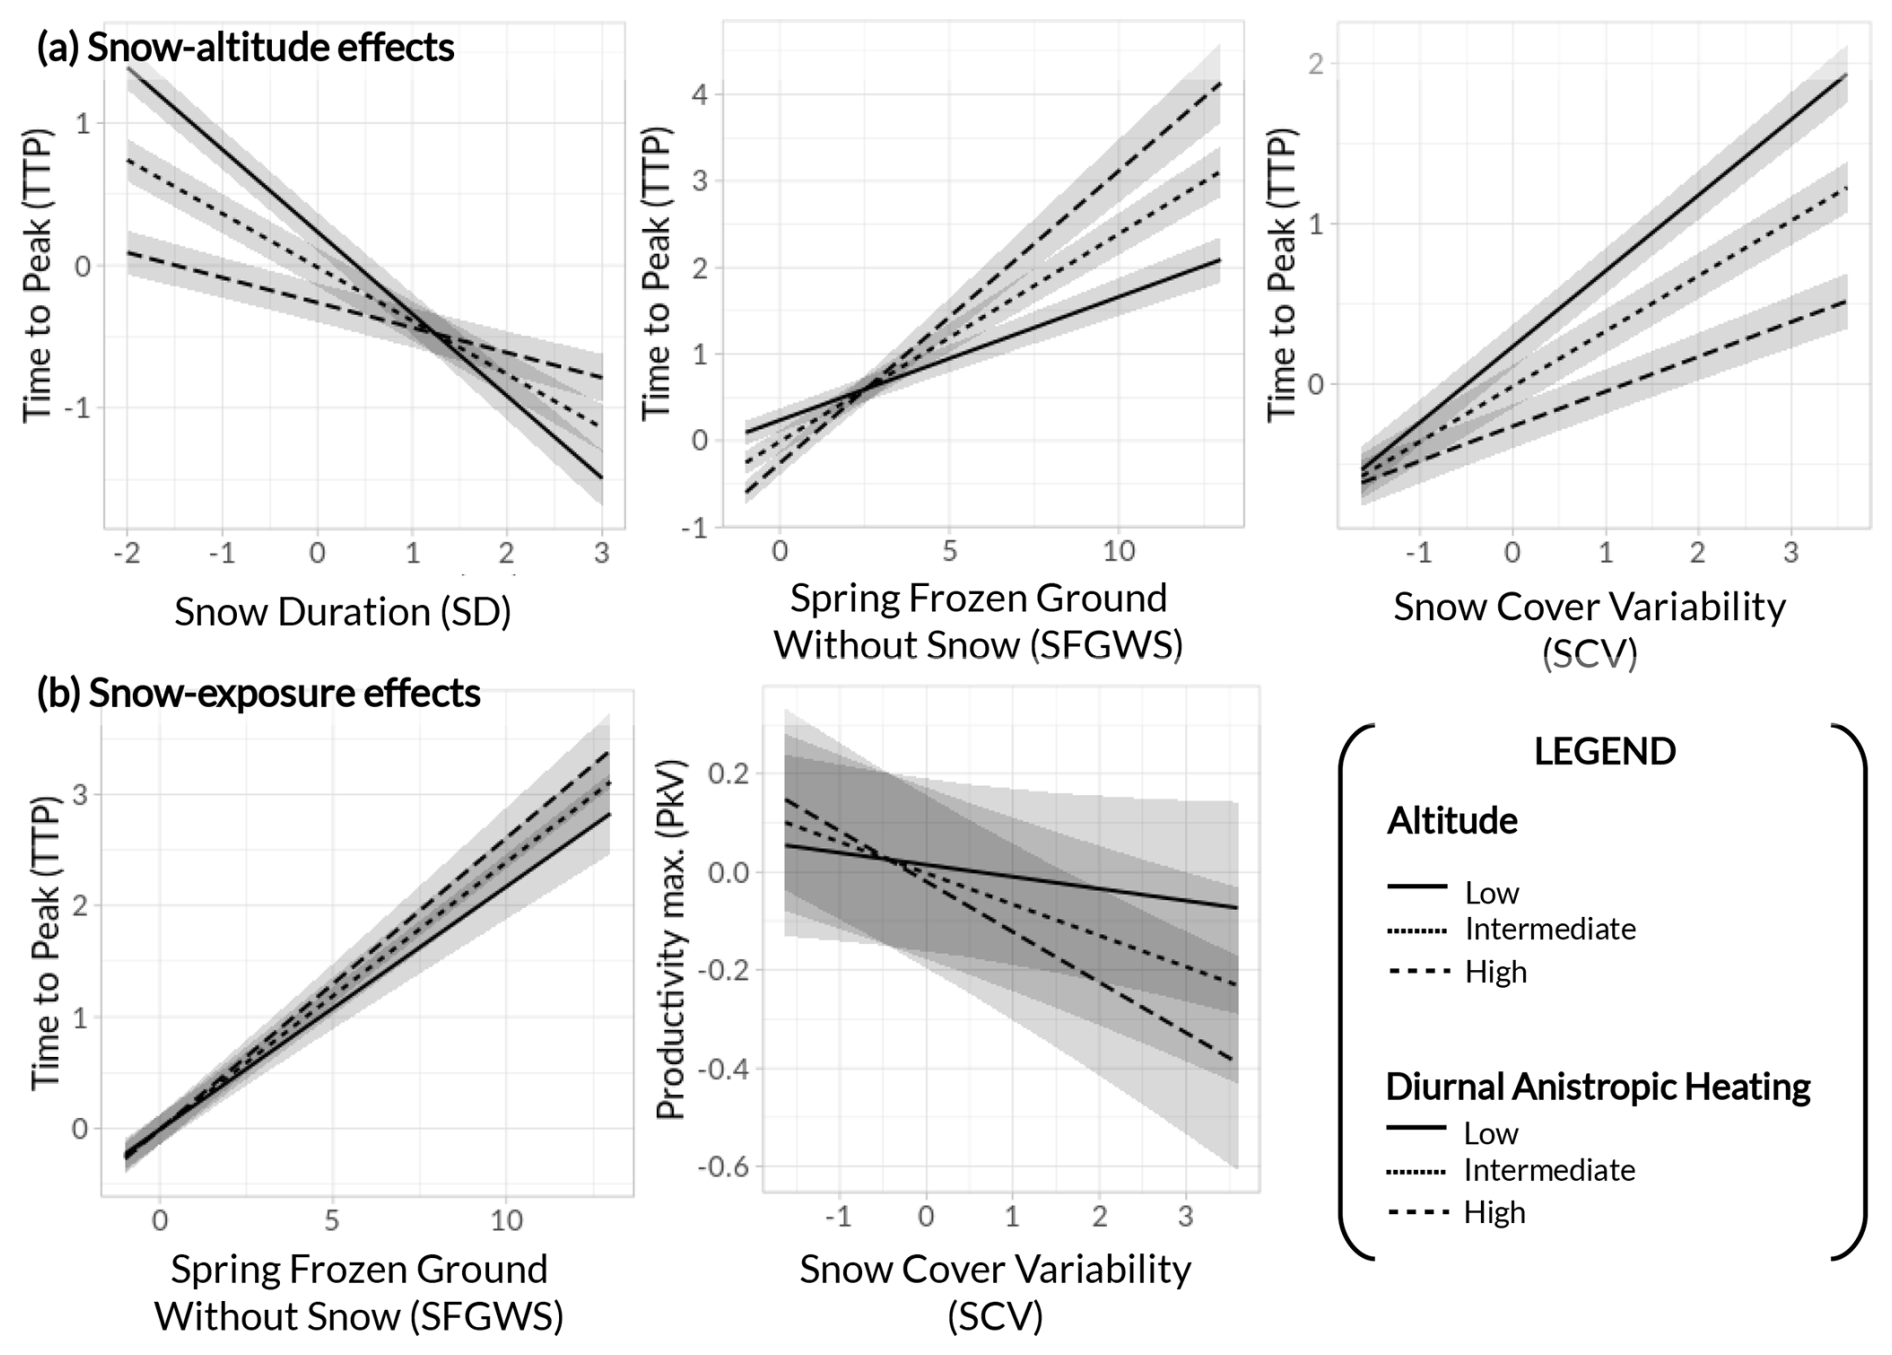
Figure 7Predicted effects of significant snow–terrain variable interactions on the growth response of mountain grasslands. Estimates resulting from linear mixed models; see Table 1. SFGWS indicates spring frozen ground without snow.
4.1 Vosges mountain grasslands predominantly exhibit non-significant trends and hotspots of decreases in the peak productivity
The majority of the 536 pixels in the study area between 2000 and 2020 demonstrated no significant trends. Overrepresentation of non-significant trends over significant ones is a common “statistical effect” in similar studies (Choler et al., 2021; Filippa et al., 2022), but this could also demonstrate several compensatory effects in relation to warming in the Vosges Mountains. Soil temperatures, nutrients, and moisture can limit plant reactions to rising air temperatures (Tape et al., 2012; Myers-Smith et al., 2015), while genetic adaptation can also help in protecting from changing environmental conditions (Bjorkman et al., 2017). Thus, stable peak productivity trends may also indicate compensatory effects due to the traits of local plant communities. A larger niche selection can increase phenotypic plasticity in local populations, which has strong implications for their ability to respond to environmental changes (Chevin and Lande, 2010; Jump and Peñuelas, 2005; Nicotra et al., 2010). Lastly, a 20-year period remains relatively short for purposes of investigating the ecosystem's responses to climate warming. This could explain a large part of the non-significance in our results. Linear trend tests can also mask non-linear responses over the studied time period, such as temporal reversal in peak productivity trends (decrease–increase or increase–decrease). Polynomial-based methods should thus be considered further to expand the range of trends detected (Rigal et al., 2020).
Overrepresentation of browning trends over greening contradicts most of the studies conducted in European or Asian high-mountain grasslands in recent decades (Choler et al., 2021; Carlson et al., 2017; Cao et al., 2015; Yang et al., 2019; Tomaszewska et al., 2020). However, it is in line with recent works highlighting non-uniform greening trends at the mountain range scale (Gartzia et al., 2016; Brookshire and Weaver, 2015). Interestingly, several analogies between the latter studies and our results can be drawn, notably because of the lower elevation range of the monitored grasslands. In particular, Gartzia et al. (2016) found preferential browning trends in the Pyrenees mountain grasslands from 1980 to the late 2000s at the lowest elevation of their study site (mean elevation =1900 m). Explanative factors are cattle grazing, which occurs preferentially on most productive dense grasslands on gentle slopes, and lower precipitation in late summer, which probably reduces soil water availability and thus affects biomass and greenness. Our findings show that pixels indicating decreases in greenness also mostly occurred in the lowest-elevation grasslands (i.e. high-producing grasslands) comprising dominant herbaceous communities. We hypothesize that a low elevation also naturally exposes them to summer droughts that are less and less compensated for by soil water availability due to reduced snowpack (Herberich et al., 2023; Brilli et al., 2011). Overall, our results support a high vulnerability of low-mountain grasslands in response to climate warming, even more so at lower altitudes, where species compositions are strongly dependent on grazing or mowing intensities.
Monitoring browning trends in low-mountain ranges is of interest for several reasons. Firstly, this indicates that the vegetation growth of low-mountain plant communities can be weakened and even inhibited by climate-warming-derived factors. Indeed, our results do not corroborate European-scale NDVI trends estimated by Kempf (2023), whose apparent trends showed increases in greenness over most of the European mountains. This strengthens the need for adapted spatial scales in satellite-based studies to investigate phenology or productivity trends in specific ecological habitats. The spatial resolution of satellite data is obviously a key point, but it is not the only one. The selection of monitored pixels, a delimited and consistent study area, and spatially aligned data (DEM, land cover maps) are all factors that will play a major role in further studies and, consequently, in our ability to observe exact trends (Cortés et al., 2021; Lewińska et al., 2023). Secondly, our findings support the assumption that similar trends could likely occur for plant communities located at similar elevations at the European scale, leading to wide-ranging implications for ecological functioning and land management (Grignolio et al., 2003; Duparc et al., 2013). This could modify the spatial distribution and available amount of grazing resources for domestic or wild herbivores. Recent works also showed that strong modifications in the phenology or productivity of mountain grasslands may have implications for different trophic levels, such as soil microorganisms or insects (Frei and Isotta, 2019; Frenzel, 2022). Thirdly, our results allow us to project further responses in higher-mountain grasslands as the temperature continues to rise. Indeed, the recorded signal for plant communities whose vertical migration is limited could be an expected response in high-mountain massifs since possibilities for migrating will be reduced in the future (Frei et al., 2014; Opedal et al., 2015). Previous studies showed that topographic complexity may favour horizontal migration, but its degree of compensation is currently unknown (Bickford et al., 2011; Hua et al., 2022).
Lastly, we found very few pixels (N=10) exhibiting greening trends over the studied time period. They share the same sites as pixels exhibiting browning trends but tend to be located at higher elevations and to be dominated by low-stature shrubs vegetation. Increasing peak productivity trends in grassland mountains due to shrubs have already been described in the past (Carlson et al., 2017; Dullinger et al., 2003; Cannone et al., 2007). We observed this mechanism on the Gazon du Faing site (N=7) in the form of local increases in ericaceous plants (Vaccinium myrtillus L), possibly provoked by the collapse of grazing due to the creation of a Natural Reserve.
4.2 Spatial patterns of browning grasslands are preferentially explained by topographic and soil water content variables
We found significant effects from the topographical variables on the probability of finding browning trends. This corroborates previous studies demonstrating the differential effects of topography on the timing or the performance of plant communities in mountain grasslands (Tomaszewska et al., 2020; Choler et al., 2021; Graae et al., 2018). The elevation, despite a little amplitude (900–1424 m) within our study area, was the most explanatory factor, with a tipping line around 1100 m. Beyond this altitude, the probability of finding browning progressively declined until the summit. Two explanations can be found: (1) 1100 m is the average rain–snow limit in the Vosges Mountains (Goepp, 2007), explaining the benefits arising from snow cover by plant communities above this line. Furthermore, a large part of the area above 1100 m includes summit with flat or gentle slopes facilitating snow accumulation. (2) Pixels selected above this line comprise a large part of low-producing grasslands with low-grazing and/or low-mowing intensities and shrubs. Consequently, their profile was less favourable to browning. Exposure was the second significant topographical factor. Pixels showing browning trends were more probable on north-facing slopes than in south-facing exposures. One possible explanation would be that grassland communities located on these aspects were the most impacted by snow cover reduction and were the most responsive to changing environmental conditions because of shorter acclimation. This situation was already noted by Choler et al. (2021) in the Alps, with a higher responsiveness to warming by ecosystems exhibiting lower NDVI values than expected given the topography.
Another interesting outcome of this research is the finding that the Soil Wetness Index slope is an important predictor of browning used to explain the presence of browning trends. The higher the number of “stressed” days, the higher the probability of meeting browning trends. Our findings support the conclusion of previous studies highlighting the soil moisture as a key control variable to explain the productive capacity of mountain plant communities (Luo et al., 2021; Marchin et al., 2018). Indeed, for grasslands with abundant soil water caused by abundant snowpack (longer snow season in early and late winter and/or spring–summer precipitation), warming had a positive effect on plant productivity (Corona-Lozada et al., 2019; Grigulis and Lavorel, 2020). Our results rather indicate that, for a large part of grasslands with probable insufficient soil water recharge, warming caused water limitation and negatively affected their peak productivity. This could be explained by the high soil porosity of the area, which is dominated by sandy soils. In line with these results, surprisingly, our findings also showed that browning pixels exhibit stable or slightly later SOS. It is important to note that we did not find any significant SOS slopes over the time period, revealing strong interannual variation in the onset of vegetation, partly driven by snowmelt (R=0.52, p<0.001). We hypothesize that, in a situation of delayed SOS provoked by delayed snowmelt, plants can be immediately exposed to high temperatures, leading to a decrease in productivity (Revuelto et al., 2022; Jonas et al., 2008).
Pixels showing browning were not significantly associated with climatic drivers, i.e. summer air temperature and the climatic balance variable. Our results are in line with previous studies showing inconsistencies between the recorded signal in productivity and climatic patterns derived from climatic gridding datasets (Choler et al., 2021). First, SAFRAN–Crocus datasets rely on a few meteorological stations above 1000 m, which explains the difficulties in reproducing climatic variables along the topographic gradient (Frei and Isotta, 2019; Vionnet et al., 2019). Second, the spatial resolution of SAFRAN–Crocus datasets (8 km) does not provide sufficient spatial variability over the Vosges Mountains with regard to the small size of the massif. Growth responses of mountain plant communities are dependent on subtle thermic variations enhanced by local landforms and soil characteristics (Giaccone et al., 2019; Huelber et al., 2011). The latter contextual effects could even be strengthened by the small size of a mountain range such as the Vosges. Third, mountain plant communities can express possible time lags in response to changing climatic conditions. Indeed, there may have been a plant recruitment provoked by warming events whose effects are not yet visible (Alexander et al., 2018). This can also depend on plant trait communities, such as dispersal mobility (Engler et al., 2009). Another example is a recent transplant experiment conducted in mountain grassland communities in the Alps showing that forbs experience longer acclimation than graminoids, probably due to the vernalization (flower bud) or allocation capacity of resources to stomatic growth (Bektaş et al., 2021).
4.3 Growth response of low-mountain grasslands showed high sensitivity to intra- and inter-seasonal fluctuations in snow cover that can be modulated by topographical effects
This study primarily focused on the productivity of mountain grasslands and their determinants, but the analysis of the snow cover effects, combined with topography, allows for a better understanding of contextual effects occurring in mountain environments (Fig. 6). Gazon du Faing, Hohneck, Röthenbach, and Markstein have the longest snow season. This can be explained by their higher altitude but also by their position on the main ridge, being directly exposed to the main western atmospheric flux and receiving the highest quantity of precipitation. In contrast, the Grand Ballon, being the highest point of the range but being more sheltered from westerly winds, presents a shorter snow season. Similarly, sites away from the main ridge (Petit Ballon, Ventron, and Rossberg) present a shorter season length and more exposure to frozen grounds. At a finer scale, the main ridge sites are also bordered on the east side by a cirque of glacial origin, where, locally, the snow accumulates in cornices and can remain until July (Wahl et al., 2007). However, it is difficult to quantify the influence of this phenomenon in pixels 250 m apart. Spectacular snow accumulation in the past is also documented along the “Route des Crêtes”, the road that follows the main ridge (Fig. A3).
We found a positive effect of the snow season length (SSL) on the productivity. Our results are in line with studies showing direct and indirect benefits provided by snow cover with regard to regulating soil temperature, soil water content, light, and nutrient availability (Starr and Oberbauer, 2003; Welker et al., 2005; Convey et al., 2018). Furthermore, we found a significant positive association between SSL and snowmelt (Pearson =0.83, p<0.001), which means that positive effects of SSL on plant growth also reflect the positive effects of snow timing, such as the last presence of snow. The latter variable has been largely identified as an essential predictor of interannual variations in the onset of vegetation, which can be independent of the snow season length (Choler, 2015; Revuelto et al., 2022; Francon et al., 2020). Thus, our results demonstrated that longer SSL promoted a shorter growth period. This is consistent with apparent strategies for alpine plant communities that reduce their growing seasons with faster plant growth (Körner and Kèorner, 1999). In our study, this effect is stronger at lower altitudes. We hypothesize that higher air temperatures after snowmelt, promoted by lower altitudes and associated with sufficient soil water recharge (due to longer SSL and/or delayed snowmelt), can accelerate plant growth (Jonas et al., 2008; Convey et al., 2018).
Our results also corroborate previous studies showing the detrimental effects of freezing events on plant growth (Klein et al., 2018; Liu et al., 2018), such as through root damage and limitations in the root uptake of nitrogen and in carbon allocation and storage (Pardee et al., 2018). Consistently, previous work confirms that an increase in frost days after the start of the season has negative effects on peak productivity and promotes a longer growth period. With warming, snowmelt is earlier, which induces potential spring freezing events that can damage the flower buds and leaves of frost-sensitive species (Inouye, 2000, 2008). These findings are also in line with previous studies indicating that root growth of alpine species can be slowed by low soil temperatures, which could possibly result in later maximal plant growth due to numerous spring freezing events (Nagelmüller et al., 2017). Furthermore, it is important to note that the latter effect is enhanced at lower altitudes and in south-facing slopes. One explanation is that earlier snowmelt mostly occurs in pixels with high sun radiation levels, while higher altitudes can favour more spring frost episodes because of lower air temperatures.
Lastly, we found a negative effect of the snow cover variability on the peak productivity of plant communities, with stronger relationships for grasslands located on south-facing slopes. We hypothesize that, because of high sun radiation levels associated with shallow snowpack, these grasslands firstly experience fluctuations in snow cover. Consequently, similarly to spring frost episodes, abrupt variations in ground thermal regimes can affect the growth rate of plant communities, notably in the early growing season. In line with this, future consequences of high snow cover variability in low-mountain ranges could also be bi-modal seasonal patterns because of two favourable sequences for growing season. For instance, a previous study conducted in the central Norwegian mountain ranges showed earlier onset of radial stems for different shrub species, closely linked to the rise of available soil moisture, which is associated with thawing soils or snowmelt and rising temperatures. The first phase of stem growth was then followed by a period of radial stem shrinkage before starting the main growth phase (Dobbert et al., 2022). Furthermore, it is important to note that the effects of snow depth on plant growth vary between studies, with significant (Wipf et al., 2009) or non-significant impacts (Revuelto et al., 2022). In the latter study, authors demonstrated the effects of the melt-out dates without observing significant effects of snow depth on plant responses in the Pyrenees. This could explain the lower statistical associations found between SCV and peak productivity for pixels located on north-facing slopes because of the more continuous remaining snowpack, even with low depths, caused by lower sun radiation levels.
We established that Vosges mountain grasslands exhibited predominant stable peak productivity trends between 2000 and 2020. Several environmental and ecological compensatory effects can be advanced to explain such results. Interestingly, grasslands showing positive trends in the peak of productivity were largely underrepresented compared to those with a negative signal. These latter grasslands are preferentially located in the lowest range of our study area. They are also covered by dominant herbaceous (graminoids and forbs) communities, revealing that high-producing grasslands are mostly impacted by these phenomena. Elevation and exposure are essential in explaining spatial patterns of peak productivity and phenology at the mountain range scale, while soil water content is pivotal to understand the productive capacity of species, notably in earlier growing seasons. We also found considerable differences in intra-seasonal snow regimes, with strong effects of snow duration, snow cover variability, and freezing events on plant growth.
We encourage the mountain ecology community to deeply investigate low-mountain-range ecosystems. Limitations in terms of vertical migration for species could indicate future plasticity or adaptation mechanisms in high-mountain plant communities with rising air temperature. Moreover, strong contextual effects on snow regimes and dwindling snow are likely to provoke a large diversity of growth responses in terms of both magnitude and temporal lags.
Finally, future works about the benefits arising from micro-refugia by plant communities in low-mountain ranges should be considered, notably for cold-related species. Observation data allowing us to investigate these micro-ecological habitats at large scales, such as UAVs and/or phenocams, will be essential to perform such research.
Table A1Variation inflation factors (VIFs) of all explanative variables in the linear mixed models.
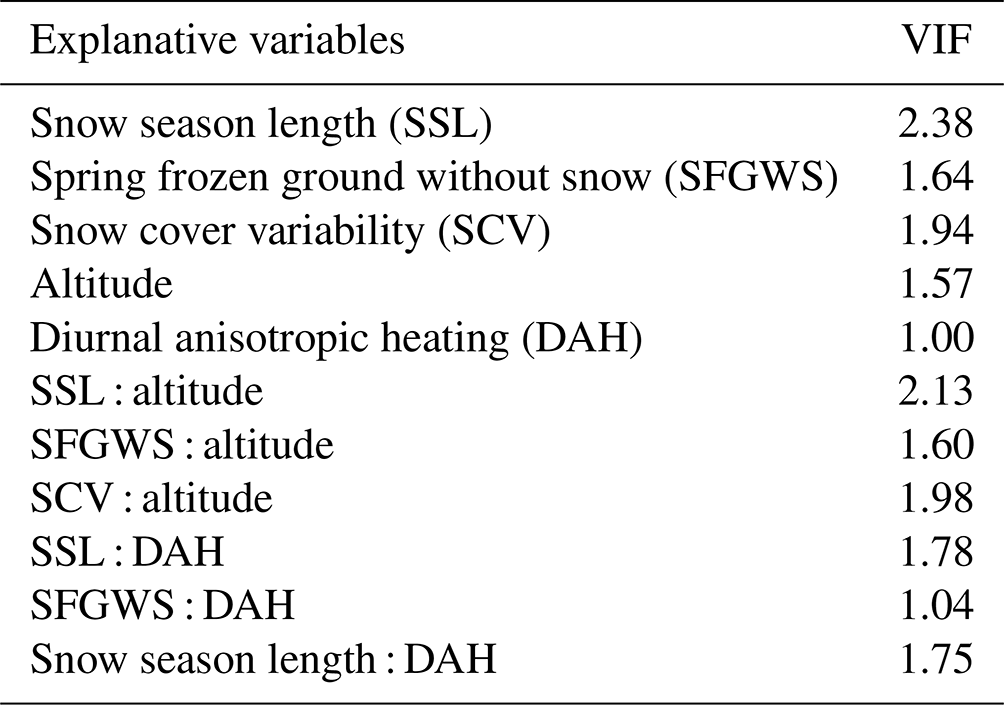
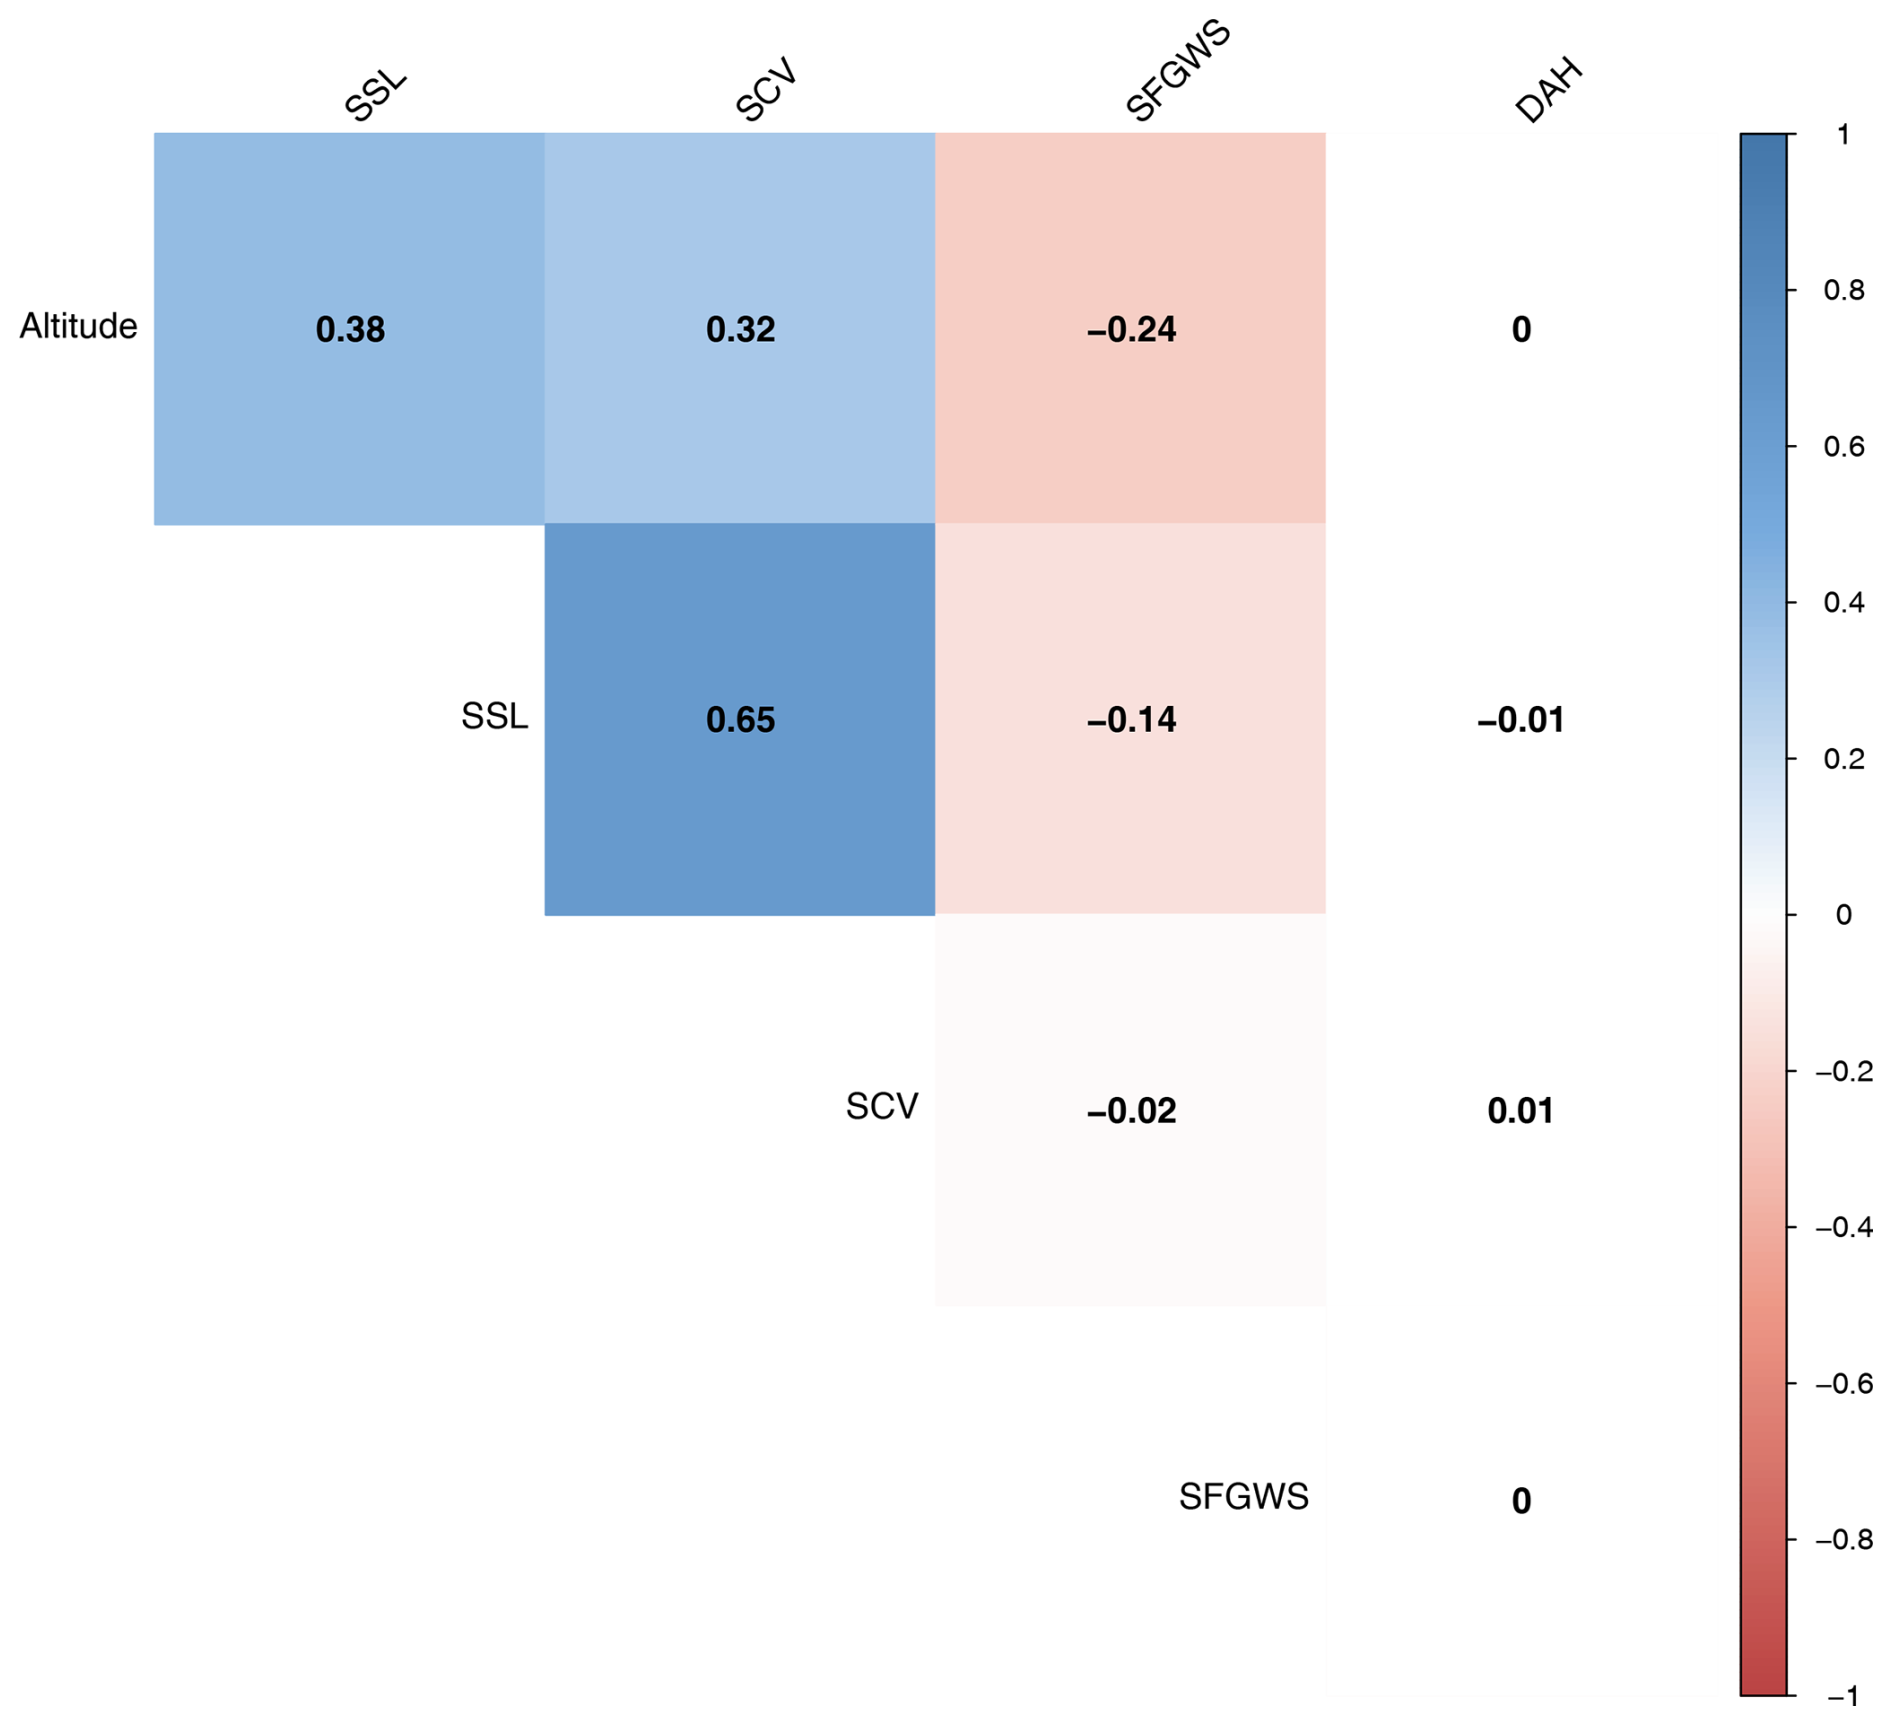
Figure A1Pearson correlation matrix between covariates included in the linear mixed models. Two digits after the comma are shown. Blue squares represent significant positive associations between two variables, pink squares represent the significant negative associations, while the white squares indicate no significant relationships between two covariates. Significance level at 0.05 was used.
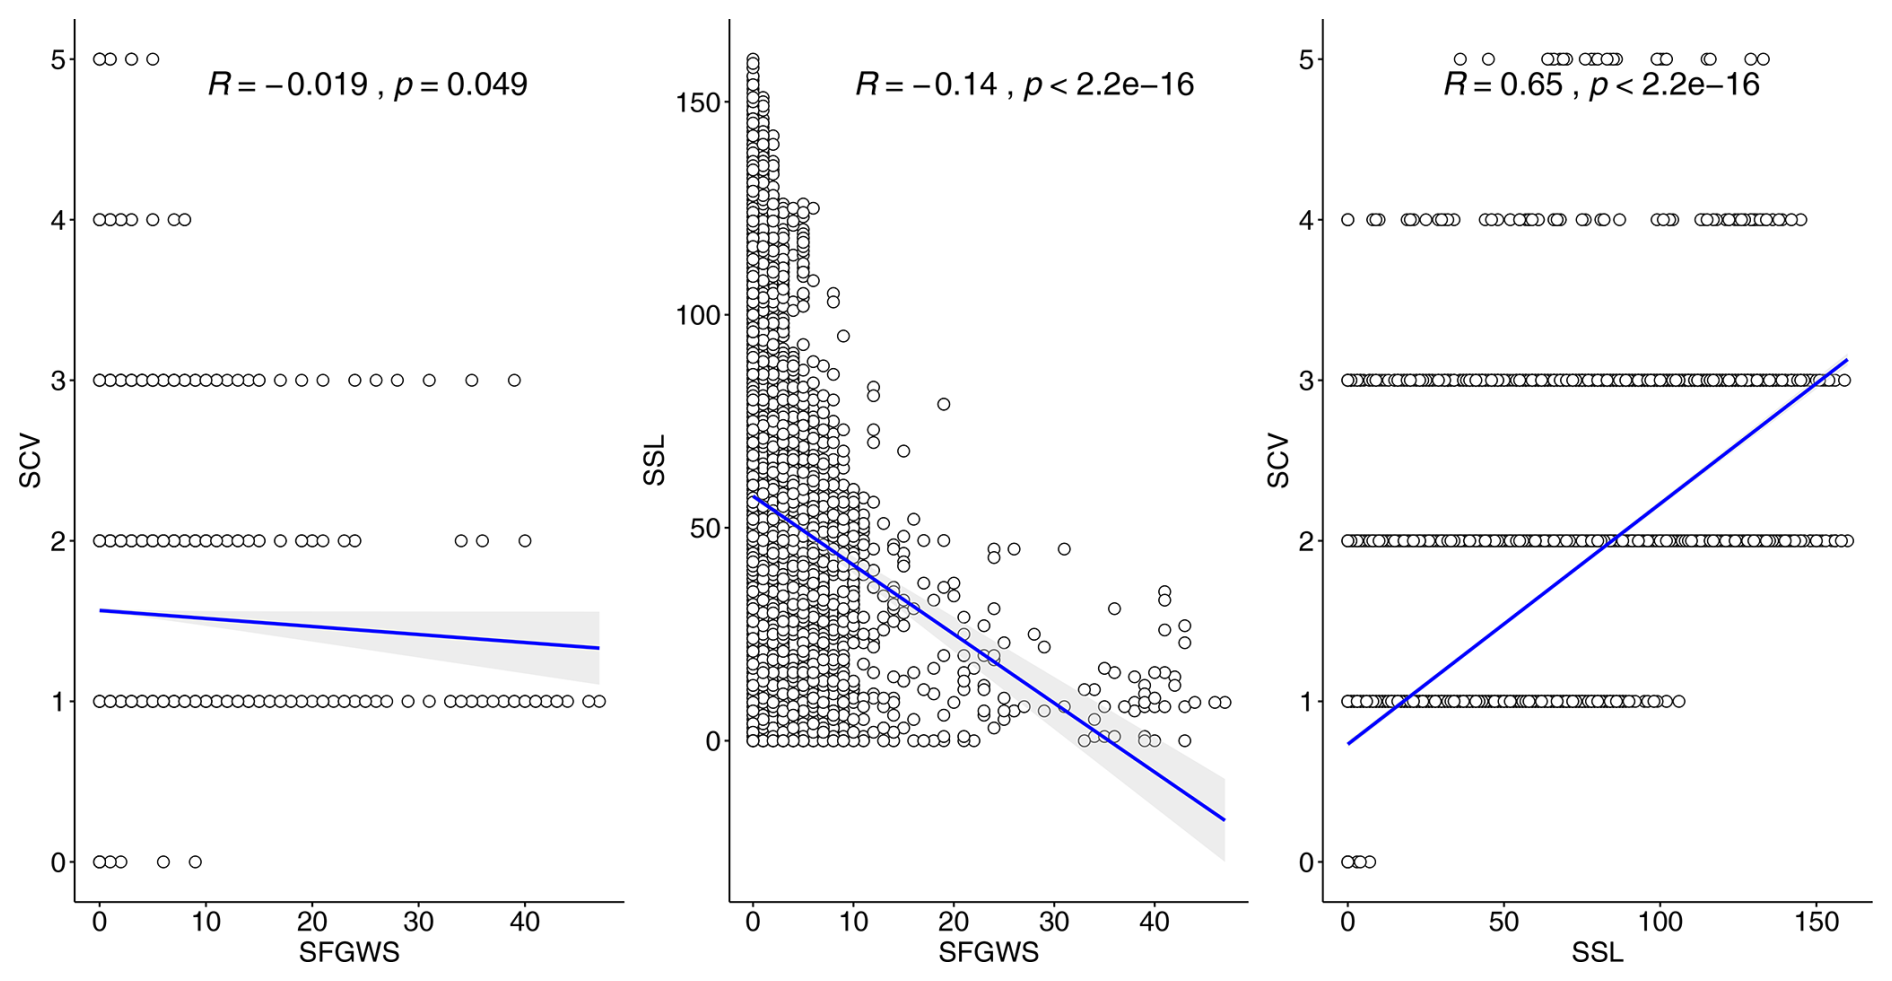
Figure A2Scatterplot of WHI indices. R corresponds to Pearson's Rho, and p is the p value of the significance test.
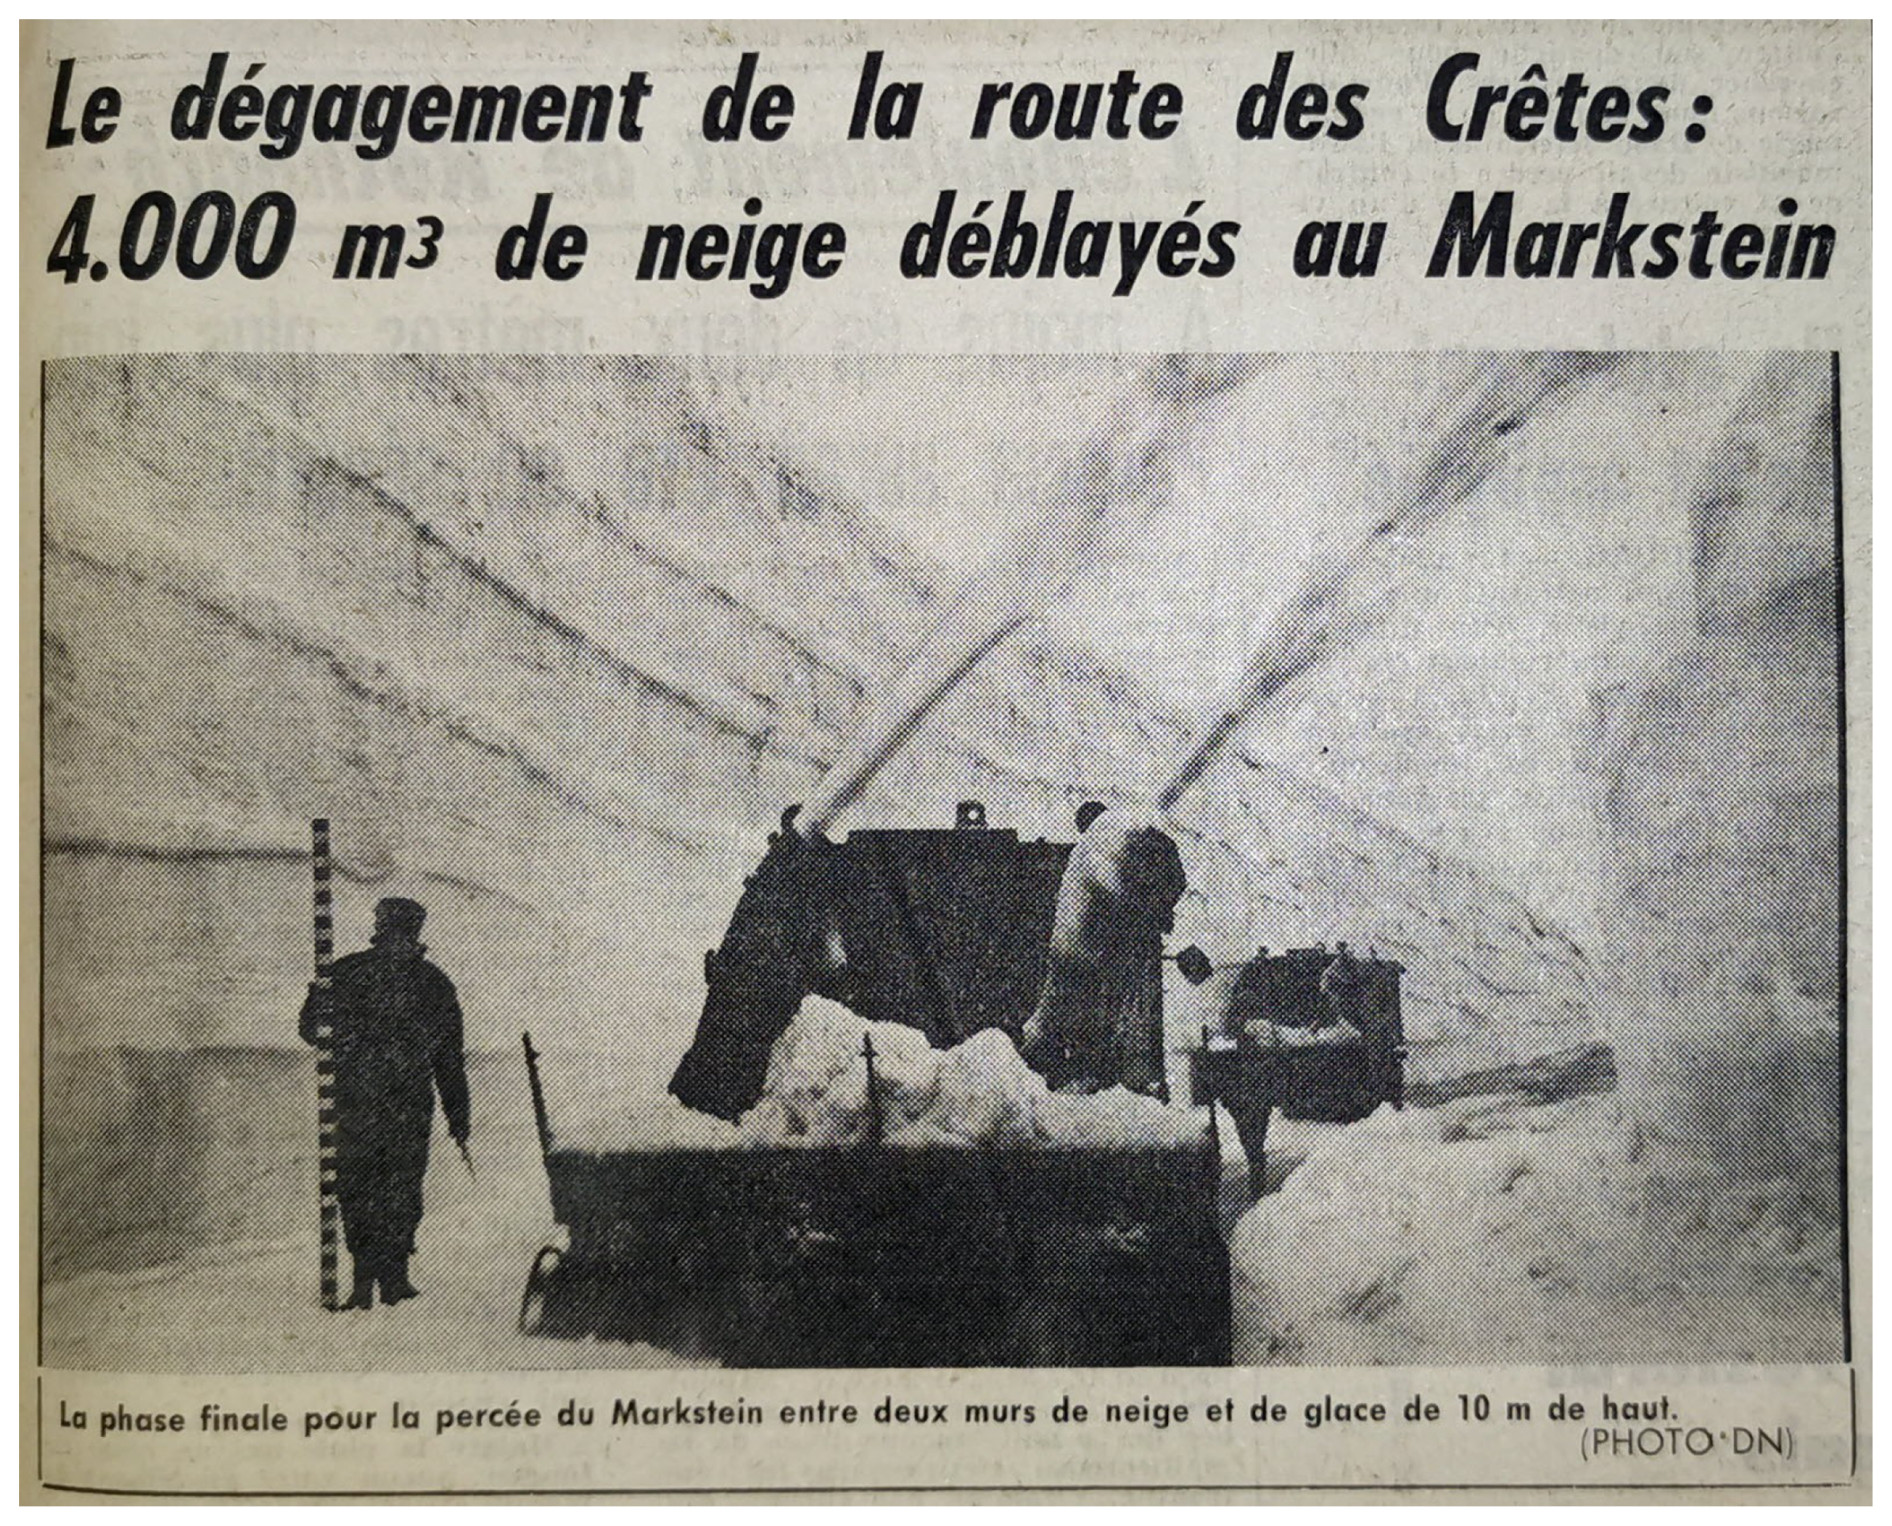
Figure A3Regional news clipping from 8 May 2021 in DNA (Dernières Nouvelles d'Alsace) illustrating spectacular snow accumulation on 19 May 1970 at the Markstein site, located on the main ridge of the study area. The snow drift has been measured to be about 10 m.
All data required to analyse the results and to replicate the research are available as separate CSV files in a Zenodo repository (https://doi.org/10.5281/zenodo.10204065, Herrault et al., 2024a). Software code and tutorials describing how to perform the statistical analyses are available in a GitHub repository (https://github.com/herrault/Article-Phenology-of-Low-Mountain-Grasslands/tree/main, Herrault et al., 2024b).
PAH and DE designed the study. PAH processed the satellite data and performed the statistical analysis. PAH wrote the manuscript with the help of DE. AU pre-processed the climate data and commented on the manuscript.
The contact author has declared that none of the authors has any competing interests.
Publisher’s note: Copernicus Publications remains neutral with regard to jurisdictional claims made in the text, published maps, institutional affiliations, or any other geographical representation in this paper. While Copernicus Publications makes every effort to include appropriate place names, the final responsibility lies with the authors.
This paper was edited by Andrew Feldman and reviewed by two anonymous referees.
Alexander, J. M., Chalmandrier, L., Lenoir, J., Burgess, T. I., Essl, F., Haider, S., Kueffer, C., McDougall, K., Milbau, A., and Nuñez, M. A.: Lags in the response of mountain plant communities to climate change, Glob. Change Biol., 24, 563–579, 2018. a, b
Ashcroft, M. B.: Identifying refugia from climate change, J. Biogeogr., 37, 1407–1413, https://doi.org/10.1111/j.1365-2699.2010.02300.x, 2010. a
Baptist, F., Yoccoz, N. G., and Choler, P.: Direct and indirect control by snow cover over decomposition in alpine tundra along a snowmelt gradient, Plant Soil, 328, 397–410, 2010.
Bektaş, B., Thuiller, W., Saillard, A., Choler, P., Renaud, J., Colace, M.-P., Della Vedova, R., and Münkemüller, T.: Lags in phenological acclimation of mountain grasslands after recent warming, J. Ecol., 109, 3396–3410, 2021. a, b, c, d
Environmental Change in Mountains and Uplands (1st ed.), Routledge, https://doi.org/10.4324/9781315824826, 2000. a
Bickford, C. P., Hunt, J. E., and Heenan, P. B.: Microclimate characteristics of alpine bluff ecosystems of New Zealand's South Island, and implications for plant growth, New Zeal. J. Ecol., 35, 273, 2011. a
Bjorkman, A. D., Vellend, M., Frei, E. R., and Henry, G. H.: Climate adaptation is not enough: warming does not facilitate success of southern tundra plant populations in the high Arctic, Glob. Change Biol., 23, 1540–1551, 2017. a
Brilli, F., Hörtnagl, L., Hammerle, A., Haslwanter, A., Hansel, A., Loreto, F., and Wohlfahrt, G.: Leaf and ecosystem response to soil water availability in mountain grasslands, Agr. Forest Meteorol., 151, 1731–1740, 2011. a
Brookshire, E. and Weaver, T.: Long-term decline in grassland productivity driven by increasing dryness, Nat. Commun., 6, 7148, https://doi.org/10.1038/ncomms8148, 2015. a
Bucher, S. F., König, P., Menzel, A., Migliavacca, M., Ewald, J., and Römermann, C.: Traits and climate are associated with first flowering day in herbaceous species along elevational gradients, Ecol. Evol., 8, 1147–1158, 2018. a
Burnham, K. P. and Anderson, D. R.: Multimodel inference: understanding AIC and BIC in model selection, Sociol. Method. Res., 33, 261–304, 2004. a
Butler, A. B., Martin, J. A., Palmer, W. E., and Carroll, J. P.: Winter use of south Florida dry prairie by two declining grassland passerines, Condor, 111, 511–522, 2009. a
Cannone, N., Sgorbati, S., and Guglielmin, M.: Unexpected impacts of climate change on alpine vegetation, Front. Ecol. Environ., 5, 360–364, 2007. a
Cao, R., Chen, J., Shen, M., and Tang, Y.: An improved logistic method for detecting spring vegetation phenology in grasslands from MODIS EVI time-series data, Agr. Forest Meteorol., 200, 9–20, 2015. a
Carlson, B. Z., Corona, M. C., Dentant, C., Bonet, R., Thuiller, W., and Choler, P.: Observed long-term greening of alpine vegetation – a case study in the French Alps, Environ. Res. Lett., 12, 114006, https://doi.org/10.1088/1748-9326/aa84bd, 2017. a, b, c
Cassou, C. and Cattiaux, J.: Disruption of the European climate seasonal clock in a warming world, Nat. Clim. Change, 6, 589–594, 2016. a
Chawla, N. V.: Data mining for imbalanced datasets: An overview, Data mining and knowledge discovery handbook, https://doi.org/10.1007/0-387-25465-X_40, 875–886, 2010. a
Chevin, L.-M. and Lande, R.: When do adaptive plasticity and genetic evolution prevent extinction of a density-regulated population?, Evolution, 64, 1143–1150, 2010. a
Choler, P.: Growth response of temperate mountain grasslands to inter-annual variations in snow cover duration, Biogeosciences, 12, 3885–3897, https://doi.org/10.5194/bg-12-3885-2015, 2015. a, b, c, d, e
Choler, P., Bayle, A., Carlson, B. Z., Randin, C., Filippa, G., and Cremonese, E.: The tempo of greening in the European Alps: Spatial variations on a common theme, Glob. Change Biol., 27, 5614–5628, 2021. a, b, c, d, e, f, g, h, i, j, k
Convey, P., Coulson, S., Worland, M., and Sjöblom, A.: The importance of understanding annual and shorter-term temperature patterns and variation in the surface levels of polar soils for terrestrial biota, Polar Biol., 41, 1587–1605, 2018. a, b
Corona-Lozada, M., Morin, S., and Choler, P.: Drought offsets the positive effect of summer heat waves on the canopy greenness of mountain grasslands, Agr. Forest Meteorol., 276, 107617, https://doi.org/10.1016/j.agrformet.2019.107617, 2019. a
Cortés, J., Mahecha, M. D., Reichstein, M., Myneni, R. B., Chen, C., and Brenning, A.: Where are global vegetation greening and browning trends significant?, Geophys. Res. Lett., 48, e2020GL091496, https://doi.org/10.1029/2020GL091496, 2021. a
Dietz, A. J., Wohner, C., and Kuenzer, C.: European snow cover characteristics between 2000 and 2011 derived from improved MODIS daily snow cover products, Remote Sens., 4, 2432–2454, 2012. a
Dobbert, S., Albrecht, E. C., Pape, R., and Löffler, J.: Alpine shrub growth follows bimodal seasonal patterns across biomes–unexpected environmental controls, Commun. Biol., 5, 793, https://doi.org/10.1038/s42003-022-03741-x, 2022. a
Dong, C. and Menzel, L.: Recent snow cover changes over central European low mountain ranges, Hydrol. Process., 34, 321–338, 2020. a, b
Dullinger, S., Dirnböck, T., Greimler, J., and Grabherr, G.: A resampling approach for evaluating effects of pasture abandonment on subalpine plant species diversity, J. Veg. Sci., 14, 243–252, 2003. a
Duparc, A., Redjadj, C., Viard-Crétat, F., Lavorel, S., Austrheim, G., and Loison, A.: Co-variation between plant above-ground biomass and phenology in sub-alpine grasslands, Appl. Veg. Sci., 16, 305–316, 2013. a
Durand, Y., Laternser, M., Giraud, G., Etchevers, P., Lesaffre, B., and Mérindol, L.: Reanalysis of 44 yr of climate in the French Alps (1958–2002): methodology, model validation, climatology, and trends for air temperature and precipitation, J. Appl. Meteorol. Clim., 48, 429–449, 2009. a
Engler, R., Randin, C. F., Vittoz, P., Czáka, T., Beniston, M., Zimmermann, N. E., and Guisan, A.: Predicting future distributions of mountain plants under climate change: does dispersal capacity matter?, Ecography, 32, 34–45, 2009. a
Ferrez, Y.: Guide phytosociologique des prairies du massif des Vosges et du Jura alsacien, Conservatoire botanique national de Franche-Comté, https://www.parc-vosges-nord.fr/wp-content/uploads/2018/11/guide-phytosociologiques-des-prairies-du-massif-vosgien.pdf (last access: 2 February 2025), 2017. a
Filippa, G., Cremonese, E., Galvagno, M., Bayle, A., Choler, P., Bassignana, M., Piccot, A., Poggio, L., Oddi, L., and Gascoin, S.: On the distribution and productivity of mountain grasslands in the Gran Paradiso National Park, NW Italy: A remote sensing approach, Int. J. Appl. Earth Obs., 108, 102718, https://doi.org/10.1016/j.jag.2022.102718, 2022. a, b
Francon, L., Corona, C., Till-Bottraud, I., Choler, P., Carlson, B., Charrier, G., Améglio, T., Morin, S., Eckert, N., and Roussel, E.: Assessing the effects of earlier snow melt-out on alpine shrub growth: the sooner the better?, Ecol. Indic., 115, 106455, https://doi.org/10.1016/j.ecolind.2020.106455, 2020. a
Frei, C. and Isotta, F. A.: Ensemble spatial precipitation analysis from rain gauge data: Methodology and application in the European Alps, J. Geophys. Res.-Atmos., 124, 5757–5778, 2019. a, b
Frei, E. R., Ghazoul, J., and Pluess, A. R.: Plastic responses to elevated temperature in low and high elevation populations of three grassland species, PLoS One, 9, e98677, https://doi.org/10.1371/journal.pone.0098677, 2014. a
Frenzel, T.: Effects of grassland management on arthropod diversity, 2022. a
Gartzia, M., Perez-Cabello, F., Bueno, C. G., and Alados, C. L.: Physiognomic and physiologic changes in mountain grasslands in response to environmental and anthropogenic factors, Appl. Geogr., 66, 1–11, 2016. a, b, c
Giaccone, E., Luoto, M., Vittoz, P., Guisan, A., Mariéthoz, G., and Lambiel, C.: Influence of microclimate and geomorphological factors on alpine vegetation in the Western Swiss Alps, Earth Surf. Proc. Land., 44, 3093–3107, 2019. a
Gillet, F., Mauchamp, L., Badot, P.-M., and Mouly, A.: Recent changes in mountain grasslands: a vegetation resampling study, Ecol. Evol., 6, 2333–2345, 2016. a
Goepp, S.: Origine, histoire et dynamique des Hautes-Chaumes du massif vosgien, Déterminismes environnementaux et actions de l'Homme, PhD thesis, Université Louis Pasteur-Strasbourg I, https://publication-theses.unistra.fr/public/theses_doctorat/2007/GOEPP_Stephanie_2007.pdf (last access: 2 February 2025), 2007. a, b, c
Graae, B. J., Vandvik, V., Armbruster, W. S., Eiserhardt, W. L., Svenning, J.-C., Hylander, K., Ehrlén, J., Speed, J. D., Klanderud, K., and Bråthen, K. A.: Stay or go–how topographic complexity influences alpine plant population and community responses to climate change, Perspectives in Plant Ecology, Evolution and Systematics, 30, 41–50, 2018. a, b, c
Grignolio, S., Parrini, F., Bassano, B., Luccarini, S., and Apollonio, M.: Habitat selection in adult males of Alpine ibex, Capra ibex ibex, Folia Zool., 52, 113–120, 2003. a
Grigulis, K. and Lavorel, S.: Simple field-based surveys reveal climate-related anomalies in mountain grassland production, Ecol. Indic., 116, 106519, https://doi.org/10.1016/j.ecolind.2020.106519, 2020. a
Gudex-Cross, D., Keyser, S. R., Zuckerberg, B., Fink, D., Zhu, L., Pauli, J. N., and Radeloff, V. C.: Winter Habitat Indices (WHIs) for the contiguous US and their relationship with winter bird diversity, Remote Sens. Environ., 255, 112309, https://doi.org/10.1016/j.rse.2021.112309, 2021. a
Herberich, M. M., Schädle, J. E., and Tielbörger, K.: Plant community productivity and soil water are not resistant to extreme experimental drought in temperate grasslands but in the understory of temperate forests, Sci. Total Environ., 891, 164625, https://doi.org/10.1016/j.scitotenv.2023.164625, 2023. a
Herrault, P.-A., Ullmann, A., and Ertlen, D.: Statistical analysis to investigate phenology of low mountain grasslands, https://doi.org/10.5281/zenodo.10204065, Zenodo [data set], 2024a. a
Herrault, P.-A., Ullmann, A., and Ertlen, D.: Statistical analysis to investigate phenology of low mountain grasslands, GitHub [software], https://github.com/herrault/Article-Phenology-of-Low-Mountain-Grasslands/tree/main(last access: 30 January 2025), 2024b. a
Hua, X., Ohlemüller, R., and Sirguey, P.: Differential effects of topography on the timing of the growing season in mountainous grassland ecosystems, Environ. Adv., 8, 100234, https://doi.org/10.1016/j.envadv.2022.100234, 2022. a, b
Huelber, K., Bardy, K., and Dullinger, S.: Effects of snowmelt timing and competition on the performance of alpine snowbed plants, Perspectives in Plant Ecology, Evolution and Systematics, 13, 15–26, 2011. a
Inouye, D. W.: The ecological and evolutionary significance of frost in the context of climate change, Ecol. Lett., 3, 457–463, 2000. a
Inouye, D. W.: Effects of climate change on phenology, frost damage, and floral abundance of montane wildflowers, Ecology, 89, 353–362, 2008. a
Jonas, T., Rixen, C., Sturm, M., and Stoeckli, V.: How alpine plant growth is linked to snow cover and climate variability, J. Geophys. Res.-Biogeo., 113, https://doi.org/10.1029/2007JG000680, 2008. a, b
Jump, A. S. and Peñuelas, J.: Running to stand still: adaptation and the response of plants to rapid climate change, Ecol. Lett., 8, 1010–1020, 2005. a
Kempf, M.: Enhanced trends in spectral greening and climate anomalies across Europe, Environ. Monit. Assess., 195, 260, 2023.
Keppel, G. and Wardell-Johnson, G. W.: Refugia: keys to climate change management, Glob. Change Biol., 18, 2389–2391, 2012. a
Keppel, G., Robinson, T. P., Wardell-Johnson, G. W., Yates, C. J., Van Niel, K. P., Byrne, M., and Schut, A. G.: A low-altitude mountain range as an important refugium for two narrow endemics in the Southwest Australian Floristic Region biodiversity hotspot, Ann. Bot., 119, 289–300, 2017. a
Klein, G., Rebetez, M., Rixen, C., and Vitasse, Y.: Unchanged risk of frost exposure for subalpine and alpine plants after snowmelt in Switzerland despite climate warming, Int. J. Biometeorol., 62, 1755–1762, 2018. a
Körner, C. and Kèorner, C.: Alpine plant life: functional plant ecology of high mountain ecosystems, Springer, 1999.
Ledoux, E., Girard, G., De Marsily, G., Villeneuve, J., and Deschenes, J.: Spatially distributed modeling: conceptual approach, coupling surface water and groundwater, Unsaturated flow in hydrologic modeling: Theory and practice, 435–454, 1989. a
Lenoir, J., Gégout, J.-C., Marquet, P. A., de Ruffray, P., and Brisse, H.: A significant upward shift in plant species optimum elevation during the 20th century, Science, 320, 1768–1771, 2008. a
Lewińska, K. E., Ives, A. R., Morrow, C. J., Rogova, N., Yin, H., Elsen, P. R., de Beurs, K., Hostert, P., and Radeloff, V. C.: Beyond “greening” and “browning”: Trends in grassland ground cover fractions across Eurasia that account for spatial and temporal autocorrelation, Glob. Change Biol., 29, 4620–4637, https://doi.org/10.1111/gcb.16800, 2023. a
Lindstrom, M. J. and Bates, D. M.: Nonlinear mixed effects models for repeated measures data, Biometrics, 673–687, https://doi.org/10.1002/0470013192.bsa441, 1990. a
Liu, Q., Piao, S., Janssens, I. A., Fu, Y., Peng, S., Lian, X., Ciais, P., Myneni, R. B., Peñuelas, J., and Wang, T.: Extension of the growing season increases vegetation exposure to frost, Nat. Commun., 9, 426, https://doi.org/10.1038/s41467-017-02690-y, 2018. a
Luo, M., Meng, F., Sa, C., Duan, Y., Bao, Y., Liu, T., and De Maeyer, P.: Response of vegetation phenology to soil moisture dynamics in the Mongolian Plateau, Catena, 206, 105505, https://doi.org/10.1371/journal.pone.0190313, 2021. a
Marchin, R. M., McHugh, I., Simpson, R. R., Ingram, L. J., Balas, D. S., Evans, B. J., and Adams, M. A.: Productivity of an Australian mountain grassland is limited by temperature and dryness despite long growing seasons, Agr. Forest Meteorol., 256, 116–124, 2018. a
Möhl, P., von Büren, R. S., and Hiltbrunner, E.: Growth of alpine grassland will start and stop earlier under climate warming, Nat. Commun., 13, 7398, https://doi.org/10.1038/s41467-022-35194-5, 2022. a, b
Murray, L., Nguyen, H., Lee, Y.-F., Remmenga, M. D., and Smith, D. W.: Variance inflation factors in regression models with dummy variables, Kansas State University, https://doi.org/10.4148/2475-7772.1034, 2012. a
Myers-Smith, I. H., Elmendorf, S. C., Beck, P. S., Wilmking, M., Hallinger, M., Blok, D., Tape, K. D., Rayback, S. A., Macias-Fauria, M., and Forbes, B. C.: Climate sensitivity of shrub growth across the tundra biome, Nat. Clim. Change, 5, 887–891, 2015. a
Nagelmüller, S., Hiltbrunner, E., and Körner, C.: Low temperature limits for root growth in alpine species are set by cell differentiation, AoB Plants, 9, plx054, https://doi.org/10.1093/aobpla/plx054, 2017. a
Nicod, C. and Gillet, F.: Recent changes in mountain hay meadows of high conservation value in eastern France, Appl. Veg. Sci., 24, e12573, https://doi.org/10.1111/avsc.12573, 2021. a
Nicotra, A. B., Atkin, O. K., Bonser, S. P., Davidson, A. M., Finnegan, E. J., Mathesius, U., Poot, P., Purugganan, M. D., Richards, C. L., and Valladares, F.: Plant phenotypic plasticity in a changing climate, Trends Plant Sci., 15, 684–692, 2010. a
Noilhan, J. and Mahfouf, J.-F.: The ISBA land surface parameterisation scheme, Global Planet. Change, 13, 145–159, 1996. a
Opedal, Ø. H., Armbruster, W. S., and Graae, B. J.: Linking small-scale topography with microclimate, plant species diversity and intra-specific trait variation in an alpine landscape, Plant Ecol. Divers., 8, 305–315, 2015. a
Pardee, G. L., Inouye, D. W., and Irwin, R. E.: Direct and indirect effects of episodic frost on plant growth and reproduction in subalpine wildflowers, Glob. Change Biol., 24, 848–857, 2018. a
Pepin, N., Arnone, E., Gobiet, A., Haslinger, K., Kotlarski, S., Notarnicola, C., Palazzi, E., Seibert, P., Serafin, S., and Schöner, W.: Climate changes and their elevational patterns in the mountains of the world, Rev. Geophys., 60, e2020RG000730, https://doi.org/10.1029/2020RG000730, 2022. a
Piao, S., Mohammat, A., Fang, J., Cai, Q., and Feng, J.: NDVI-based increase in growth of temperate grasslands and its responses to climate changes in China, Global Environ. Change, 16, 340–348, 2006. a
Pinheiro, J. C. and Bates, D. M.: Linear mixed-effects models: basic concepts and examples, Mixed-effects models in S and S-Plus, 3–56, 2000.
Plantureux, S., Peeters, A., and McCracken, D.: Biodiversity in intensive grasslands: Effect of management, improvement and challenges, Agron. Res., 3, 153–164, 2005. a
Revuelto, J., Billecocq, P., Tuzet, F., Cluzet, B., Lamare, M., Larue, F., and Dumont, M.: Random forests as a tool to understand the snow depth distribution and its evolution in mountain areas, Hydrol. Process., 34, 5384–5401, 2020. a
Revuelto, J., Gómez, D., Alonso-González, E., Vidaller, I., Rojas-Heredia, F., Deschamps-Berger, C., García-Jiménez, J., Rodríguez-López, G., Sobrino, J., and Montorio, R.: Intermediate snowpack melt-out dates guarantee the highest seasonal grasslands greening in the Pyrenees, Sci. Rep., 12, 18328, https://doi.org/10.1038/s41598-022-22391-x, 2022. a, b, c, d
Rigal, S., Devictor, V., and Dakos, V.: A method for classifying and comparing non-linear trajectories of ecological variables, Ecol. Indic., 112, 106113, https://doi.org/10.1016/j.ecolind.2020.106113, 2020. a
Ropars, P. and Boudreau, S.: Shrub expansion at the forest–tundra ecotone: spatial heterogeneity linked to local topography, Environ. Res. Lett., 7, 015501, https://doi.org/10.1088/1748-9326/7/1/015501, 2012. a
Salomonson, V. V. and Appel, I.: Estimating fractional snow cover from MODIS using the normalized difference snow index, Remote Sens. Environ., 89, 351–360, 2004.
Sauer, J., Domisch, S., Nowak, C., and Haase, P.: Low mountain ranges: summit traps for montane freshwater species under climate change, Biodivers. Conserv., 20, 3133–3146, 2011. a, b
Scherrer, D. and Koerner, C.: Infra-red thermometry of alpine landscapes challenges climatic warming projections, Glob. Change Biol., 16, 2602–2613, 2010. a
Schönbein, J. and Schneider, C.: Snow cover variability in the Black Forest region as an example of a German low mountain range under the influence of climate change, in: EGS-AGU-EUG Joint Assembly, 5993, 2003. a
Siebenkäs, A., Schumacher, J., and Roscher, C.: Phenotypic plasticity to light and nutrient availability alters functional trait ranking across eight perennial grassland species, AoB Plants, 7, plv029, https://doi.org/10.1093/aobpla/plv029, 2015. a
Soubeyroux, J.-M., Martin, E., Franchisteguy, L., Habets, F., Noilhan, J., Baillon, M., Regimbeau, F., Vidal, J.-P., Le Moigne, P., and Morel, S.: Safran-Isba-Modcou (SIM): Un outil pour le suivi hydrométéorologique opérationnel et les études, La Météorologie, 40–45, 2008. a
Starr, G. and Oberbauer, S. F.: Photosynthesis of arctic evergreens under snow: implications for tundra ecosystem carbon balance, Ecology, 84, 1415–1420, 2003. a
Stevens, C. J., Lind, E. M., Hautier, Y., Harpole, W. S., Borer, E. T., Hobbie, S., Seabloom, E. W., Ladwig, L., Bakker, J. D., and Chu, C.: Anthropogenic nitrogen deposition predicts local grassland primary production worldwide, Ecology, 96, 1459–1465, 2015. a
Tape, K. D., Hallinger, M., Welker, J. M., and Ruess, R. W.: Landscape heterogeneity of shrub expansion in Arctic Alaska, Ecosystems, 15, 711–724, 2012. a, b
Tomaszewska, M. A., Nguyen, L. H., and Henebry, G. M.: Land surface phenology in the highland pastures of montane Central Asia: Interactions with snow cover seasonality and terrain characteristics, Remote Sens. Environ., 240, 111675, https://doi.org/10.1016/j.rse.2020.111675, 2020. a, b, c, d
Vionnet, V., Six, D., Auger, L., Dumont, M., Lafaysse, M., Quéno, L., Réveillet, M., Dombrowski-Etchevers, I., Thibert, E., and Vincent, C.: Sub-kilometer precipitation datasets for snowpack and glacier modeling in Alpine terrain, Front. Earth Sci., 7, 182, https://doi.org/10.3389/feart.2019.00182, 2019. a
Wahl, L., Planchon, O., and David, P.-M.: Névés, corniches et risque d’avalanche dans les Hautes-Vosges, En hommage à Laurent Wahl, décédé le 18 décembre 2008, Revue Géographique de l'Est, 47, https://doi.org/10.4000/rge.1533, 2007. a
Wang, H., Liu, H., Cao, G., Ma, Z., Li, Y., Zhang, F., Zhao, X., Zhao, X., Jiang, L., and Sanders, N. J.: Alpine grassland plants grow earlier and faster but biomass remains unchanged over 35 years of climate change, Ecol. Lett., 23, 701–710, 2020. a
Welker, J., Fahnestock, J., Sullivan, P., and Chimner, R.: Leaf mineral nutrition of Arctic plants in response to warming and deeper snow in northern Alaska, Oikos, 109, 167–177, 2005. a
Winkler, D. E., Lin, M. Y.-C., Delgadillo, J., Chapin, K. J., and Huxman, T. E.: Early life history responses and phenotypic shifts in a rare endemic plant responding to climate change, Conserv. Physiol., 7, coz076, https://doi.org/10.1093/conphys/coz076, 2019. a
Wipf, S., Stoeckli, V., and Bebi, P.: Winter climate change in alpine tundra: plant responses to changes in snow depth and snowmelt timing, Clim. Change, 94, 105–121, 2009. a
Yang, J., Dong, J., Xiao, X., Dai, J., Wu, C., Xia, J., Zhao, G., Zhao, M., Li, Z., and Zhang, Y.: Divergent shifts in peak photosynthesis timing of temperate and alpine grasslands in China, Remote Sens. Environ., 233, 111395, https://doi.org/10.1016/j.rse.2019.111395, 2019. a
Zeeman, M., Mauder, M., Steinbrecher, R., Heidbach, K., Eckart, E., and Schmid, H.: Reduced snow cover affects productivity of upland temperate grasslands, Agr. Forest Meteorol., 232, 514–526, 2017. a
Zhu, L., Radeloff, V. C., and Ives, A. R.: Characterizing global patterns of frozen ground with and without snow cover using microwave and MODIS satellite data products, Remote Sens. Environ., 191, 168–178, 2017. a