the Creative Commons Attribution 4.0 License.
the Creative Commons Attribution 4.0 License.
 | 21 Nov 2025
Mature riparian alder forest acts as a strong and consistent carbon sink
Kaido Soosaar
Svyatoslav Rogozin
Dmitrii Krasnov
Ülo Mander
Alder forests are widespread across the Northern Hemisphere, often occupying riparian zones and enhancing soil fertility through symbiosis with nitrogen-fixing bacteria. Despite their ecological importance, the ecosystem-level carbon and water exchange of alder forests remains poorly studied, particularly under contrasting hydroclimatic conditions. We studied ecosystem carbon and water fluxes over three contrasting years (“wet”, “drought”, “recovery”) in a mature riparian grey alder forest in Estonia. The forest was a strong and consistent net carbon sink with annual net ecosystem exchange (NEE) ranging from −496 to −663 g C m−2 yr−1, gross primary production (GPP) from −1258 to −1420 g C m−2 yr−1, ecosystem respiration (ER) from 595 to 923 g C m−2 yr−1 and evapotranspiration (ET) varied from 194 to 342 kg H2O m−2 yr−1. Moderate soil water saturation (40 %–50 %) enhanced all ecosystem fluxes. In contrast, progressive drought reduced ER, ET, and to a much lesser extent GPP, with elevated EWUE and suppressed canopy conductance indicating strong stomatal regulation to limit water loss while maintaining carbon sequestration. While soil saturation affected canopy conductance, its effect was outweighed by vapour pressure deficit during the drought year, even after soil water availability recovered. We observed a full recovery in the following year, which was supported by favourable temperature and precipitation, although partially suppressed canopy conductance suggested some vulnerability to possible consecutive droughts in the future. Overall, the forest demonstrated drought resilience and high net carbon uptake across contrasting years, underscoring the capacity of riparian alder stands to sustain carbon sequestration under variable hydroclimatic conditions.
- Article
(6981 KB) - Full-text XML
- BibTeX
- EndNote


Terrestrial ecosystems play an essential role in restraining the rise of atmospheric carbon dioxide (CO2) concentrations and mitigating global warming (Pan et al., 2011; Piao et al., 2020). Over the preceding decades, they have sequestered approximately one-third of the total industrial carbon emissions (Friedlingstein et al., 2022). Forest ecosystems typically act as net carbon sinks, with the rate of photosynthetic uptake surpassing respiratory emissions on the annual scale (Harris et al., 2021). The strength of this carbon sink depends upon various factors, including, but not limited to, forest age, tree species composition, climatic conditions, soil properties, and management practices (Winkler et al., 2023). Moreover, a change in weather conditions or forest management decisions can turn a local carbon-sequestering forest stand into a net carbon source, thereby affecting ecosystem-atmosphere interactions at a regional scale (Hadden and Grelle, 2016; Lindroth et al., 1998). Thus, it is critical to evaluate the local forest carbon uptake in the face of varying climatic events (Allen et al., 2010; Bonan, 2008; Teskey et al., 2015).
Water availability plays a particularly critical role among the environmental factors affecting forest carbon uptake. Drought can reduce photosynthesis, increase tree mortality, and temporarily weaken or reverse a forest's sink function (Allen et al., 2010; Breshears et al., 2005; Cavin et al., 2013; Haberstroh et al., 2022; McDowell et al., 2008). The frequency and severity of extreme climate events, including droughts, have been growing in recent decades, a trend expected to continue (Fischer et al., 2021; Trenberth et al., 2014). The 2018 European drought was considered the most severe in the last 250 years (Gutierrez Lopez et al., 2021; Hari et al., 2020), resulting in a significant decline in forest carbon uptake and elevated tree mortality rates (Bastos et al., 2020; Buras et al., 2020; Haberstroh et al., 2022; Senf and Seidl, 2021; Smith et al., 2020). Improving our understanding of how forest carbon and water fluxes are modified during and after such events is crucial for assessing ecosystem resilience and informing adaptive forest management.
Riparian forests, located at the interface between terrestrial and aquatic systems, play a crucial role in mediating nutrient and carbon flows and are particularly sensitive to hydrological changes (Capon et al., 2013; Dybala et al., 2019; Naiman and Décamps, 1997). Grey alder (Alnus incana (L.) Moench.) is a typical pioneer species frequently occupying riparian zones and is widely spread in North America and Europe (Caudullo et al., 2017). Alder plantations can mitigate carbon losses in rewetted peatlands (Huth et al., 2018) and improve the soil structure of skid trails (Warlo et al., 2019). Their high adaptability also makes alders suitable for the afforestation of post-industrial sites (Krzaklewski et al., 2012). Owing to their symbiosis with atmospheric nitrogen-fixing bacteria (Benson, 1982; Rytter et al., 1989), alder trees play an essential role in forest soil nitrogen enrichment (Mander et al., 2008, 2021; Soosaar et al., 2011). Due to their rapid growth, alder species are frequently chosen for riparian buffer zones and short-rotation forestry (Aosaar et al., 2012; Rytter and Rytter, 2016; Uri et al., 2017).
However, ecosystem-level studies on carbon and water exchange in alder forests remain extremely limited. At the time of manuscript preparation, only two studies had reported ecosystem carbon exchange in grey alder forests. Uri et al. (2017) estimated net ecosystem production across an alder chronosequence using the carbon budgeting method. While informative, this traditional approach relies on discrete estimates of multiple carbon pools and fluxes and typically provides only an annual-scale assessment. In contrast, the eddy-covariance (EC) method provides continuous, high-frequency measurements of carbon and water fluxes between the ecosystem and the atmosphere, allowing for detecting intra-annual dynamics that can strongly influence the annual balance (Baldocchi, 2014). In our previous study (Krasnova et al., 2022), we conducted a two-year comparative analysis of EC carbon fluxes across four forested ecosystems, including the current site. That study focused on the effects of elevated air temperatures on carbon exchange and found that spring warming enhanced carbon uptake in the alder forest, indicating a positive temperature response during the early growing season. However, soil moisture variability, water fluxes, and post-drought recovery dynamics were beyond the scope of the analysis, leaving a substantial gap in our understanding of alder forest functioning.
In this study, we aim to investigate the ecosystem-level carbon and water exchange of a mature riparian alder forest stand in the hemiboreal zone in Estonia in relation to soil moisture variability. We utilise three years of EC flux measurements with contrasting hydroclimatic conditions: a “wet” year (2017), a “drought” year (2018), and a “recovery” year (2019). The specific objectives of this study are:
-
to quantify annual carbon and water exchange in an alder forest over three contrasting years;
-
to assess the influence of varying soil moisture conditions; and
-
to evaluate drought recovery and carry-over effects.
2.1 Study site and footprint area
The ecosystem in our study is a mature 40-year-old riparian grey alder (Alnus incana (L.) Moench) forest stand. It was established naturally following the abandonment of a wet meadow formerly used for haymaking and livestock grazing in southern Estonia. The terrain is flat, formed at the bottom of former periglacial lake systems, with an average elevation of 32 m a.s.l. and around 1 % inclination slope towards a tributary of the Kalli River. The average annual air temperature over the ten years before the study (2006–2016) was 6.6 °C with 627 mm yr−1 of precipitation (Eesti Keskkonnaagentuur). The soil at the study site is classified as a Gleyic Luvisol, a hydromorphic soil type typical of seasonally waterlogged riparian zones. The humus layer thickness is 15–20 cm. The upper soil layer is moderately fertile, with a relatively high organic matter content, moderate total carbon and nitrogen concentrations, and a balanced C:N ratio (Table C1). Bulk density is relatively high, suggesting some compaction, likely due to past land use and seasonal wetting and drying cycles. Poor drainage and a fine-textured subsoil limit infiltration, making the site sensitive to both waterlogging and rapid topsoil drying during drought.
The footprint area of the tower (Fig. 1) is 1.65 ha, 85 % of which (1.41 ha) is covered by grey alder. The river, birch and spruce trees and a narrow section of the adjacent clear-cut represent the remaining area at the edges of the footprint. The average stand height is 17.5 m, the stand density is 1520 trees per ha, the mean stem diameter at breast height is 15.6 cm, and the basal area is 30.5 m2 ha−1 (Mander et al., 2022). The understory is dominated by herbs (Filipendula ulmaria (L.) Maxim., Aegopodium podagraria L., Cirsium oleraceum (L.) Scop., Geum rivale L., Crepis paludosa L., mosses (Climacium dendroides (Hedw.) F. Weber & D. Mohr, Plagiomnium spp. and Rhytidiadelphus triquetrus (Hedw.) Warnst. Moench), shrubs (Rubus idaeus L., Frangula alnus L., Daphne mezereum L.) and young trees (Alnus incana, Prunus padus L.).
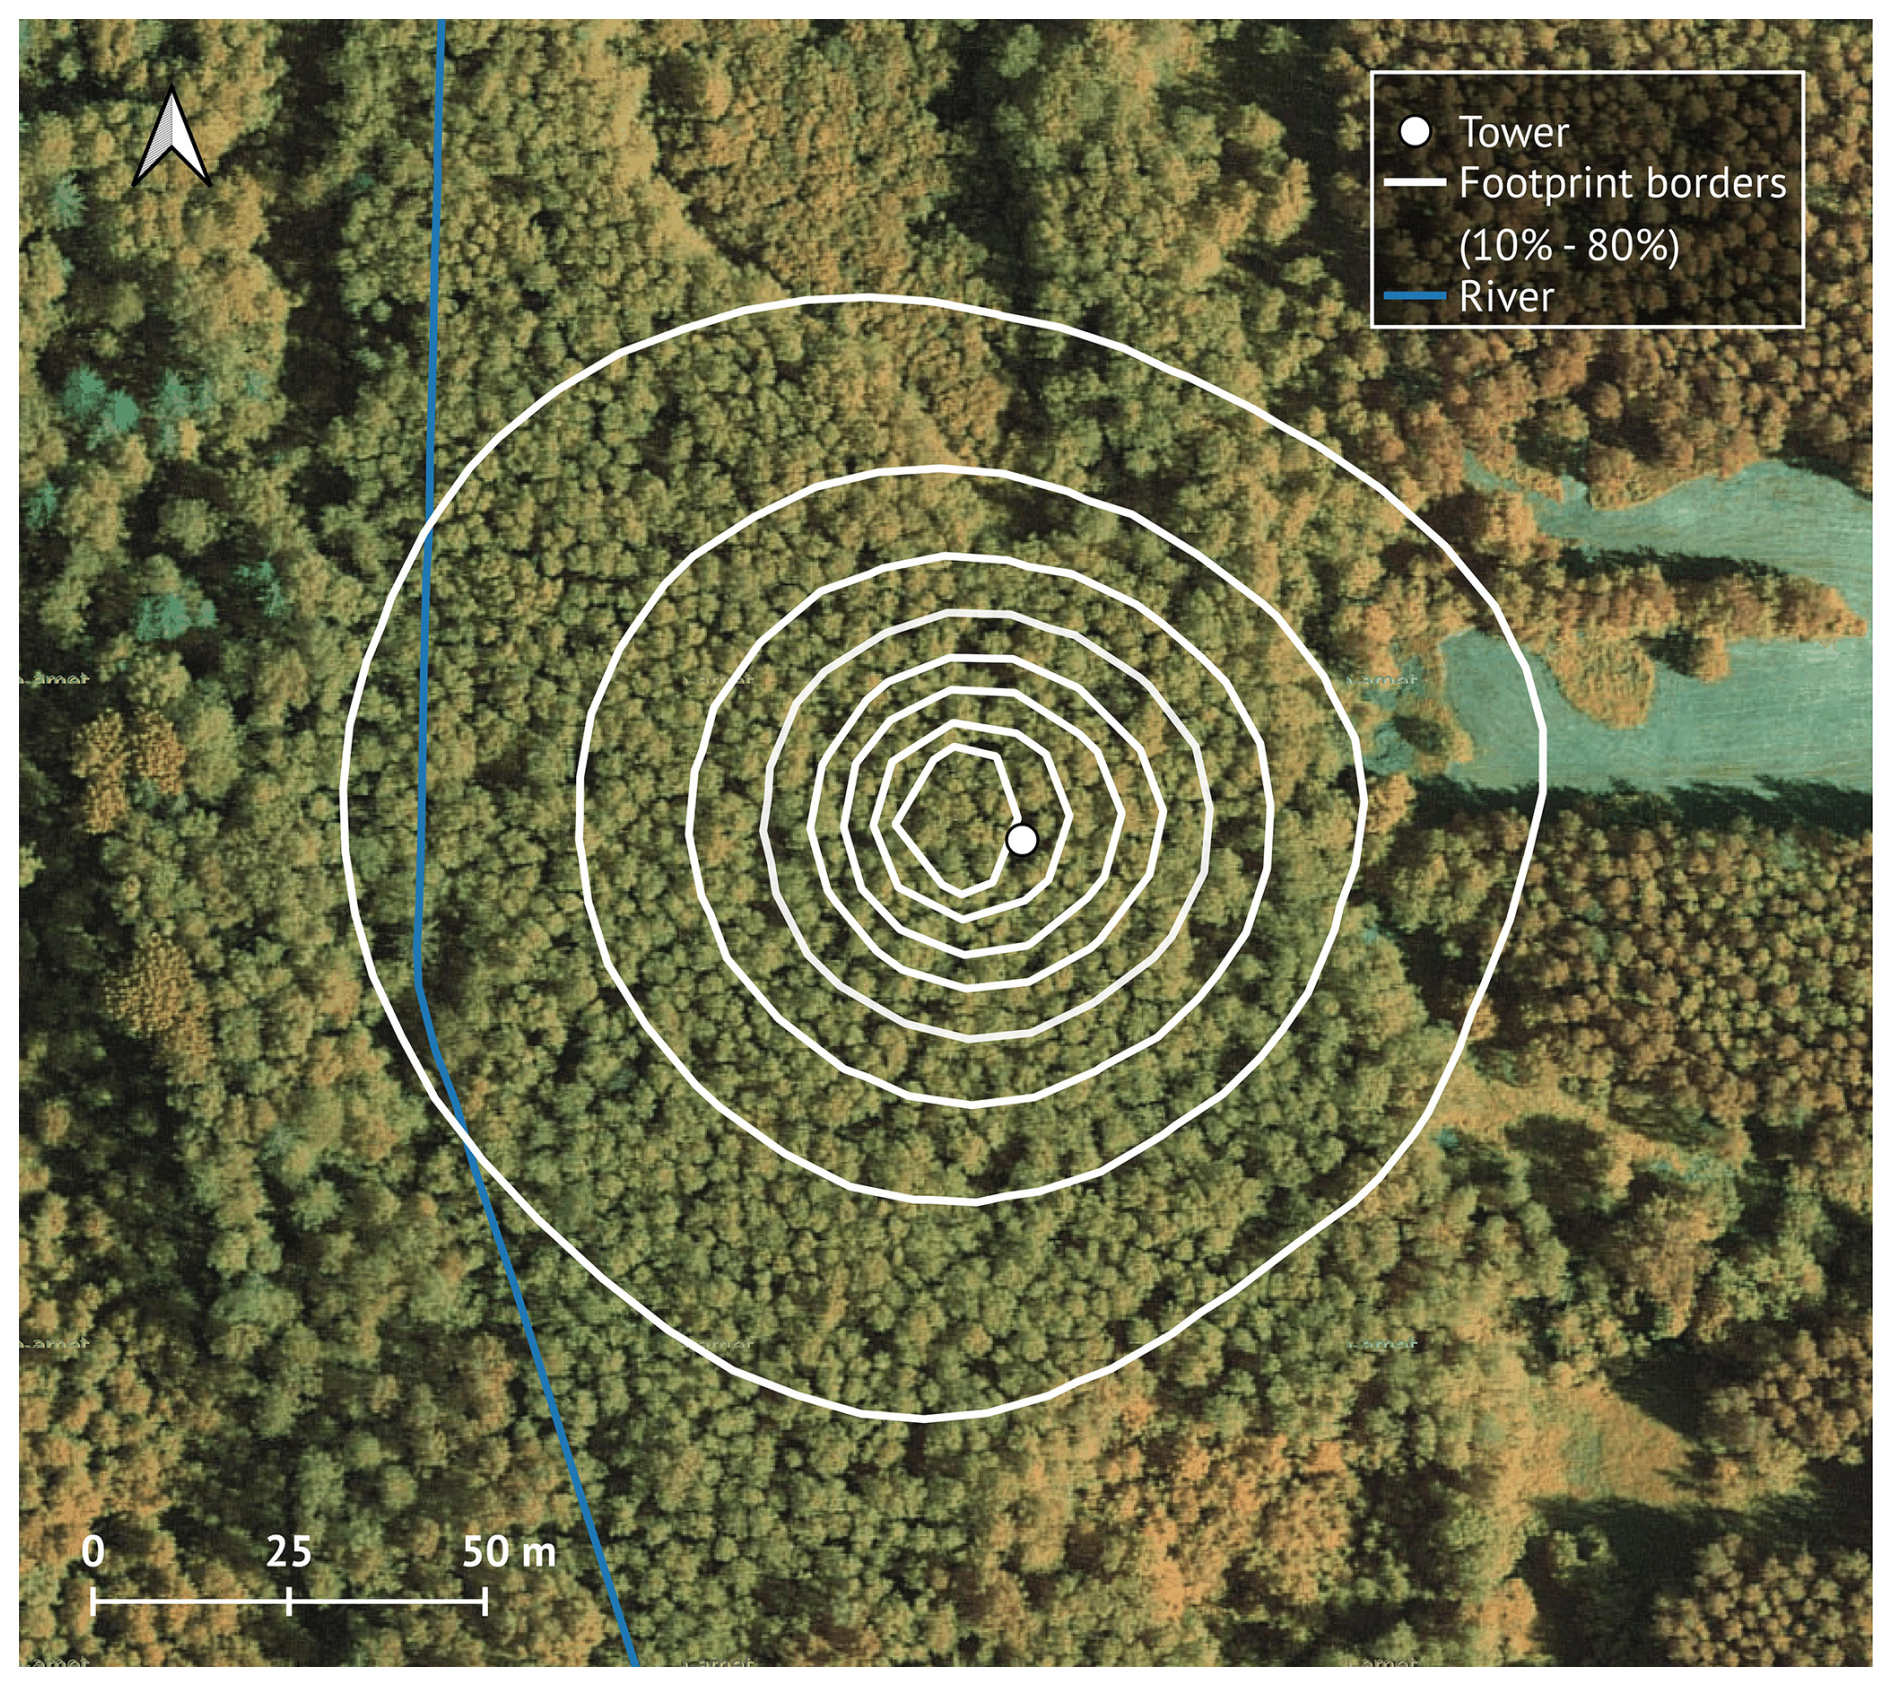
Figure 1Tower footprint area (10 %–80 %), Kljun model (Kljun et al., 2015); the blue line indicates the location of Kalli River. Map data: Estonian Land Board (Maa-amet), accessed via QGIS in 2023.
2.2 Instrumentation
The eddy-covariance (EC) setup consisted of a 3-D sonic anemometer Gill HS-50 (Gill Instruments Ltd., Lymington, Hampshire, UK) and enclosed CO2 and H2O gas-analyser LI-7200 (LI-COR Biosciences, Lincoln, NE, USA) measuring with 10 Hz frequency. The instruments were mounted on top of a 21 m scaffolding tower in spring 2017, with the first measurements starting on the 15 May 2017. Air temperature and relative humidity were measured using a Rotronic HC2A-S3 sensor (Rotronic AG, Bassersdorf, Switzerland), and shortwave radiation (Rg) was measured using a Kipp & Zonen CMP22 pyranometer (Kipp & Zonen B.V., Delft, The Netherlands). Twelve soil temperature (107, Campbell Scientific Inc., Logan, Utah, USA) and soil water content (ML3 ThetaProbe, Delta-T Devices, Burwell, Cambridge, UK) sensors were installed at 10 cm depth in the end of July 2017. Precipitation data were obtained from a nearby station, located around 2 km away from the site.
2.3 Fluxes calculation and post-processing
The fluxes of CO2 and latent heat (LE) were calculated as a covariance between vertical wind speeds and CO2 (or H2O) concentrations using EddyPro software (version 6.3.0, LI-COR Biosciences, USA) and averaged over the 30 min intervals. In the absence of a storage measuring profile system, we estimated flux storage using the tower-top method, which utilised half-hourly CO2 concentration measurements from the EC system. Net ecosystem exchange (NEE) was then calculated as the sum of eddy flux and storage. To eliminate periods of underdeveloped turbulence, we applied friction velocity filtering; the thresholds of 0.28 m s−1 for 2017–2018 and 0.22 m s−1 for 2019 were calculated with a moving point test (Papale et al., 2006). Fluxes during the half-hours with friction velocity values below these thresholds were removed from the analysis. To ensure adequate mixing conditions throughout the measurement period, we opted to remove not only nighttime half-hours, but also daytime NEE values associated with low friction velocity estimates.
In a previous study conducted at the same site by Mander et al. (2022), we noted that strong advection might be a feature of this forest site, with a rather dense canopy during the active vegetation period and a slight inclination towards the river tributary. To identify the periods when advection was significant, we applied the filtering method following Wharton et al. (2009) and Chi et al. (2019). Turbulence intensity parameters (Iw and Iu) were calculated for each half-hour as the ratios of vertical and horizontal wind velocity to turbulence intensity, respectively. For any half-hour, if Iw or Iu was outside of the window of mean plus one standard deviation estimated for the entire measurement period, advective conditions during this half-hour were considered non-negligible, and NEE and LE were filtered out. The remaining spikes in the dataset could be attributed to the simplification of the flux storage calculation procedure or the instrumental failure. Therefore, fluxes outside the common range (mean ±3 × standard deviation) were filtered out over a 14 d moving window (151 half-hour values). After all the filtering steps, 60 % in 2017, 66 % in 2018 and 65 % in 2019 of quality-controlled values remained.
Evapotranspiration (ET) was calculated by dividing the filtered LE by the latent heat of vaporisation (Allen et al., 1998). Energy balance closure (EBC) was 70 %, 71 % and 80 % in 2017, 2018 and 2019, respectively (Fig. A1). Given the simplified estimation of available energy in the absence of direct net radiation and ground heat flux measurements (see Appendix A for details), we chose not to apply any EBC correction to LE. This avoids introducing additional uncertainty and ensures that year-to-year comparisons of ET remain internally consistent.
In order to obtain fluxes aggregated over various time scales, we gap-filled NEE and ET using XGBoost as recommended by Vekuri et al. (2023). The hyperparameters were tuned during 5-fold cross-validation and included maximum tree depths (3, 5, 10, 15), regularisation strength with default 0, data sampling ratios (0.5, 0.75, 1), feature sampling ratios (0.4, 0.6, 0.8, 1), and minimum child weights (2, 5, 10). The hyperparameters were determined using all available data. A squared loss with a default learning rate of 0.1 was used as an objective function.
The partitioning of NEE into gross primary production (GPP) and ecosystem respiration (ER) was performed with the “nighttime” method in the ReddyProcWeb tool (Wutzler et al., 2018). Nighttime respiration was considered equal to nighttime gap-filled NEE values, while daytime ER was modelled in ReddyProcWeb using the air temperature dependence of measured nighttime values (Eq. 1)
where Rref (µmol m−2 s−1) is the respiration at the reference temperature; E0 (kJ mol−1) is the activation energy; T (°C) is the measured air temperature. Tref was set to 15 °C, and T0 was kept constant at −46.02 °C following Lloyd and Taylor (1994).
GPP was then calculated as the difference between gap-filled NEE and modelled ER. We chose to use the nighttime flux partitioning method because, unlike the daytime method, where GPP is modelled, here GPP is derived indirectly as a residual. This approach allowed us to further calculate canopy physiological response parameters. Following the micrometeorological convention, negative flux denotes uptake, while positive flux is a release from the ecosystem into the atmosphere.
2.4 Canopy physiological response parameters
To study the physiological response of the ecosystem to varying soil moisture conditions, we calculated additional parameters: ecosystem water use efficiency (EWUE), canopy photosynthetic capacity (GPPsat) and canopy conductance (Gc). Since these parameters characterise the vegetation activity, they were computed only for dry- (rainfall less than 1 mm d−1) active-canopy (GPP < −1 g C m−2 d−1 and ET > 0.25 mm d−1) days during the growing seasons. The start and end of each growing season were estimated by fitting a double-logistic curve to daily GPP sums and identifying the inflexion points, as outlined in Gonsamo et al. (2013). Canopy EWUE and Gc were calculated using only half-hours with sufficient light conditions. The threshold global radiation (Rg) value of 435 W m−2 was computed from the bin-averaged GPP-Rg response curve in summer (JJA) dry- and active-canopy days of all three years using breakpoint analysis to identify the flattening point of the curve.
Ecosystem water use efficiency (EWUE), defined as the amount of carbon obtained by the forest per unit of water lost to the atmosphere, can serve as an indicator of a forest's adaptability to changing water availability (Huang et al., 2015; Keenan et al., 2013; Yang et al., 2016). We calculated EWUE as the ratio of the sum of absolute GPP values to the sum of ET, using two approaches. First, to compute annual and May–September EWUE, we used period sums of GPP and ET, including all data points. Second, to characterise canopy-specific EWUE, we calculated daily values focusing solely on periods of active photosynthesis and transpiration. For this, we included only half-hourly measurements taken under sufficient light conditions and restricted calculations to dry, active-canopy days within the growing seasons. Although we did not explicitly partition ET into evaporation and transpiration components, our filtering approach ensures that canopy-driven water fluxes dominate the ET.
Canopy photosynthetic capacity (GPPsat) represents the forest's carbon uptake potential, i.e. how much carbon the ecosystem can sequester when light is not limiting (Aubinet et al., 2012; Chen et al., 2023; Fleischer et al., 2013; Musavi et al., 2017; Xu et al., 2020a). To obtain GPPsat, we used a Michaelis-Menten photosynthetic response model (Michaelis and Menten, 1913), fitted to half-hourly daytime (Rg > 15 W m−2) GPP and global radiation data (Eq. 2). The fits were done in 3 d running windows, using only dry and active-canopy days, and parameters we assigned to the middle of each window.
where α (µmol J−1) is the canopy light utilisation efficiency; GPPmax (µmol m−2 s−1) is the maximum GPP; Rg is global radiation (W m−2)
We chose the rectangular form of the light response curve over the more detailed non-rectangular one (Chen et al., 2023; Gilmanov et al., 2003; Musavi et al., 2017) because it demonstrated considerably better performance (a higher number of successful fits) with our dataset. However, a limitation of the simpler model is that the estimated GPPmax does not always correspond to the actual light saturation point. Therefore, we computed GPPsat as GPP at Rg of 1000 W m−2. Only the values from windows with significant fit parameters (p<0.05) and R2>0.5 were retained. For clarity in describing GPPsat variability, we use its absolute values, omitting the negative sign that typically denotes flux direction.
Canopy conductance (Gc) is a representation of stomatal conductance on the ecosystem level. We computed Gc by the inversion of the Penman-Monteith equation (Eqs. 3, 4) only for the dry active canopy under sufficient light (Rg > 435 W m−2):
where ρa is the air density (kg m−3); Cp is the specific heat capacity of air (J kg K−1); VPD is vapour pressure deficit (kPa); LE is latent heat flux (W m−2); γ is the psychrometric constant (kPa °C−1), Δ is the slope of the saturation vapor pressure curve (kPa °C−1); β is Bowen ratio; ga is aerodynamic conductance (m s−1); μ is wind speed (m s−1), and μ* is friction velocity (m s−1).
To evaluate differences among years, we first detrended the daily data by subtracting the multi-year average seasonal cycle. The resulting anomalies were compared across years using the Kruskal-Wallis test, followed by pairwise Wilcoxon rank-sum tests with Bonferroni correction for multiple comparisons.
2.5 The impact of varying soil moisture conditions
To evaluate the influence of soil moisture conditions on ecosystem functioning, we computed the soil saturation ratio (SSR) as the ratio of measured soil water content (SWC) to its 99th percentile across the entire observation period. We then analysed the response of carbon and water fluxes to SSR variability by binning the data into SSR intervals while controlling for the main environmental drivers that could otherwise overshadow the effects of soil moisture variability. Because of the strong seasonality of fluxes and the lack of LAI data, we restricted the analysis to summer months (JJA) to ensure a fully developed canopy.
Canopy photosynthetic capacity (GPPsat) was calculated for each 0.1 SSR bin using daytime data from dry- and active-canopy days. This was done both for data pooled across all three summers, to capture the overall response pattern, and separately for each summer to assess interannual variability. Using GPPsat rather than GPP allowed the removal of light as the primary driving factor.
To control for temperature effects on ER, we initially attempted to obtain ER at fixed temperature by fitting temperature response curves to measured nighttime ER data (nighttime NEE) in SSR bins. However, the range of air temperatures within bins was insufficient. Instead, we used reference ER at 15 °C (ERref) as provided by the ReddyProcWeb partitioning procedure, which allowed the impact of SSR on ER to be analysed independently of air temperature variability.
Because ET is strongly driven by VPD, we divided ET by VPD and calculated mean values for 0.05 SSR bins. To minimise the influence of evaporation, only half-hourly data from dry- and active-canopy days and under sufficient light conditions were included. Similarly, EWUE was normalised by daytime VPD before calculating averages for 0.05 SSR bins.
To examine how soil moisture modifies the sensitivity of canopy conductance, Gc was divided into 0.1 SSR bins, using data from all three summers. For each SSR bin, reference canopy conductance (Gc,ref) was estimated by fitting the Oren et al. (1999) model (Eq. 5):
where Gc is canopy conductance (mm s−1), m is the stomatal sensitivity, Gc,ref is reference canopy conductance at 1 kPa, VPD is vapour pressure deficit (kPa).
Although the slope () generally fell within the expected range of 0.5–0.7, three SSR classes with low R2 values (0.05, 0.03 and 0.15) exhibited notably lower slopes (0.23, 0.23 and 0.44, respectively; Table B1, Fig. B1). To evaluate whether Gc,ref estimates were biased by poor model fits, we derived an additional set of Gc,ref with fixed (Fig. B2). This approach improved R2 values, while Gc,ref estimates remained largely unchanged (Table B1). We therefore based subsequent analyses on Gc,ref values calculated with the fixed slope, while also indicating the alternative estimates in Fig. 6b. Similar analysis was carried out for each growing season separately to assess the interannual difference in Gc sensitivity to soil moisture variability.
2.6 Drought recovery and carry-over effects
To disentangle the possible carry-over effects of the drought year from the natural interannual variability, we applied a two-step approach combining model-based analysis of ecosystem fluxes with resistance, recovery and resilience indices. To ensure temporal consistency, we restricted the analysis to a common portion of the growing season (May–September) for each year.
First, we assessed whether observed interannual variability in GPP and ER could be attributed solely to changes in their primary environmental drivers (light and temperature, respectively). To do this, we estimated Michaelis-Menten light response curve parameters (Eq. 2) within a running three-day window using half-hourly daytime GPP and Rg data for each year separately. For ER, we utilised ERref and E0 parameters derived during flux partitioning in the ReddyProcWeb tool (Eq. 1). Each year's parameter set was then used to model GPP and ER across all three years using measured Rg and air temperature of each corresponding year. This cross-year modelling allowed us to test whether model parameters obtained for one year could accurately predict flux dynamics in other years. Differences between fluxes when applying parameters from a non-drought year to drought or recovery years (and vice versa) can thus highlight a possible carry-over effect, reflecting changes in ecosystem functioning that persist beyond immediate environmental conditions. We used the Kruskal-Wallis test with Bonferroni correction to assess whether differences between observed and cross-year modelled fluxes were statistically significant.
To further quantify the magnitude of the drought impact and evaluate the ecosystem's ability to recover, we calculated resistance (Rt), recovery (Rc), and resilience (Rs) indices for daily ecosystem parameters (Lloret et al., 2011; Portela et al., 2023). Performing the analysis on daily values allowed us to capture short-term fluctuations that could be partially masked by aggregating the parameters seasonally or annually. Resistance was calculated as the ratio of drought to pre-drought year, quantifying the immediate drought impact (Eq. 6). Recovery was computed as the ratio of recovery to drought year. Resilience was calculated as the ratio of recovery to the reference year, quantifying the ability of the ecosystem to return to pre-drought levels and allowing identification of potential carry-over effects.
The ecosystem parameters included daily values of carbon exchange components (GPP and ER) and their main driver-normalised versions (GPPsat and ERref), ET, transpiration (T), EWUE and Gc. Transpiration was estimated as the daily average of ET under sufficient light (Rg > 435 W m−2) for dry (rainfall less than 1 mm d−1) and active-canopy (GPP < −1 g C m−2 d−1 and ET > 0.25 mm d−1) days. To account for the strong day-to-day variability of these parameters, which could significantly bias average estimates, we applied non-parametric bootstrapping (n=5000), resampling daily values within each year independently. For each index, we report the bootstrapped mean and 95 % confidence intervals.
We acknowledge a limitation in the selection of a single reference year, 2017, which may not fully represent long-term baseline conditions. Consequently, both the magnitude and interpretation of the indices should be viewed in the context of this wet year reference. Additionally, we note that the interpretation of drought-induced changes in EWUE differs from that of other variables. While increases in EWUE may suggest that the ecosystem is coping under stress by maintaining carbon uptake relative to water loss, they often result from stomatal regulation and reduced transpiration, and thus may reflect a physiological stress response rather than enhanced functioning.
3.1 Weather conditions
Meteorological conditions across the three study years exhibited a clear seasonal pattern typical for the region (Fig. 2). The mean annual air temperature in 2017 was close to the 10-year average (6.6 °C), while both 2018 and 2019 were around 1 °C warmer (Table 1). Based on differences in precipitation (P) and soil water content (SWC), we categorised the years as “wet” (2017), “drought” (2018), and “recovery” (2019), reflecting conditions before, during and after the drought. Although in-situ SWC measurements began only in mid-July 2017, observations from a nearby station (Fig. C1) and visual assessments during instrumentation setup confirmed elevated SWC levels (including standing water) also in late spring and early summer of that year.
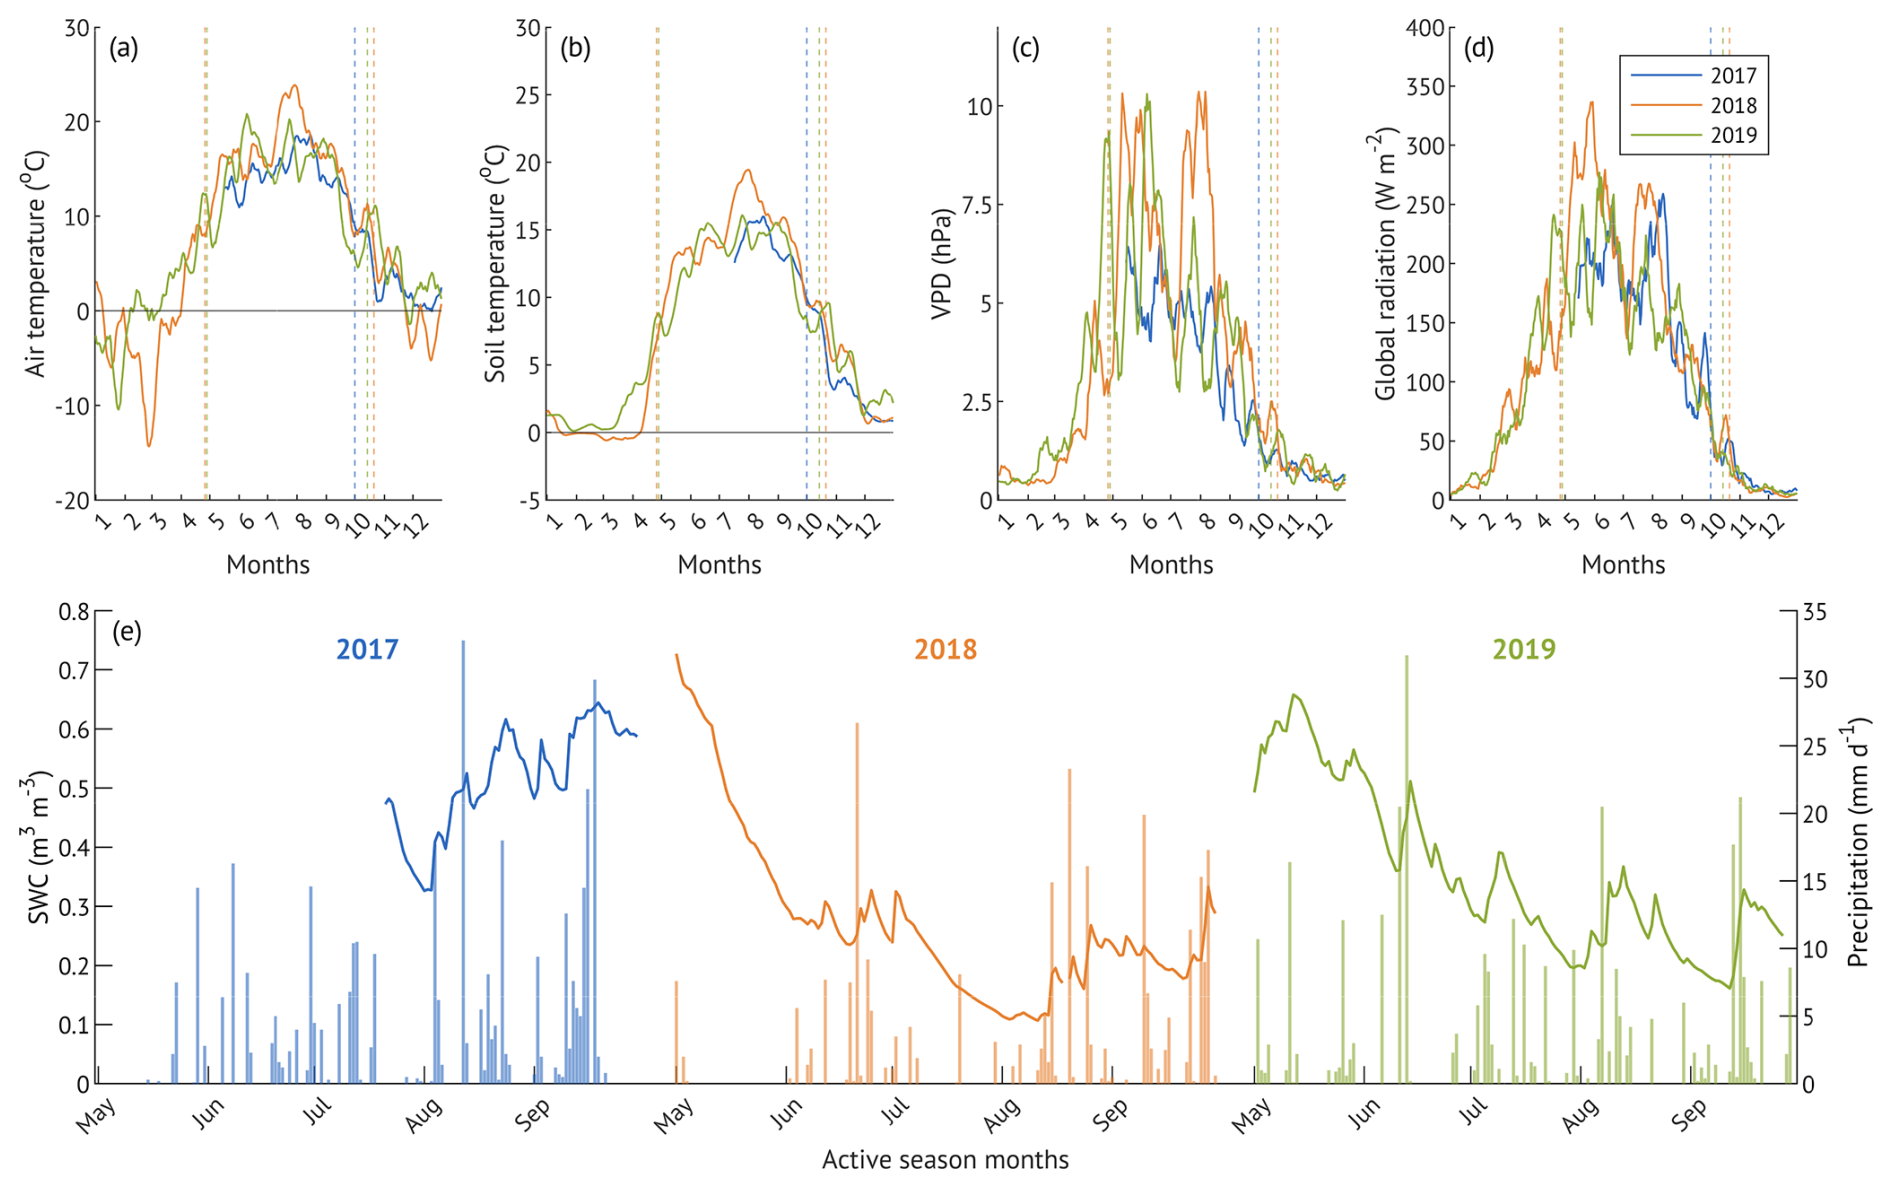
Figure 2Hydroclimatic conditions during the three studied years (a–d): 10 d running means of meteorological parameters; dashed lines denote the beginning and end of the corresponding growing seasons. Daily soil water content and cumulative daily precipitation (e) of May–September. x-axis ticks correspond to the beginning of each month.
Compared to the 12-year mean of 336 ± 75 mm, total May–September precipitation was 11 % higher in the “wet” year, 19 % lower in the “drought” year and similar in the “recovery” year, with all three years falling within the one standard deviation of the long-term mean (Table 1). However, the temporal distribution of the rainfall varied among the years (Fig. 2e).
In 2017, rainfall was skewed toward the second part of the season (August–September), resulting in elevated SWC (up to 0.64 m3 m−3) and localised flooding. In contrast, 2018 experienced extended dry spells in May and July, resulting in a pronounced soil moisture deficit (Fig. 2e). SWC declined from 0.73 to 0.28 m3 m−3 over 33 d in May (1 May–3 June, −0.014 m3 m−3 d−1) and from 0.33 to 0.11 m3 m−3 over 32 d in July (2 July–3 August, −0.007 m3 m−3 d−1). These periods of progressive drought coincided with elevated vapour pressure deficit (VPD), and the second part of July to early August period overlapped with high air temperatures, previously identified as a heatwave period (Krasnova et al., 2022). Total precipitation in the active season of 2018 was 27 % lower than in 2017.
In 2019, precipitation was more evenly distributed throughout the season, with no extended dry spells, resulting in intermediate SWC levels and cumulative precipitation 25 % higher than in 2018 and 10 % lower than in 2017 (Table 1). Although our SWC measurements were limited to the upper soil layer (10 cm depth), they remain representative of hydrological conditions affecting alder root activity, as roots are predominantly confined to shallow depths due to adaptation to waterlogged, compacted soils.
3.2 Interannual differences in accumulated fluxes
In each of the three study years, the alder forest acted as a net carbon sink (cumulative annual NEE < 0; Table 1). Cumulative NEE in the active vegetation season (May–September) accounted for 96 % of the total annual flux (97 % in 2018 and 95 % in 2019). Based on this seasonal share, we estimated the total annual NEE for 2017 to be −600 g C m−2 yr−1, reflecting a smaller net CO2 uptake than in 2018, but higher than in 2019. Following the same approach, we obtained estimates for annual GPP in 2017 (May–September GPP also accounting for an average of 96 % of the total), and subsequently calculated ER as the difference between GPP and NEE. Similarly, as the majority of evapotranspiration (ET) occurred during the active season (94 % in 2018 and 91 % in 2019), total annual ET and ecosystem water use efficiency (EWUE; GPP/ET) were estimated for 2017. Across the study period, the three-year means (±SD) for annual NEE, GPP, ER, and ET were −586 ± 85, −1330 ± 82, 743 ± 166 g C m−2 yr−1 and 264 ± 74 mm yr−1, respectively.
Table 1Annual and May–September average air temperature (Ta), soil temperature at 10 cm depth (Ts), global radiation (Rg), and soil water content at 10 cm depth (SWC); cumulative precipitation (P), net ecosystem exchange (NEE), gross primary production (GPP), ecosystem respiration (ER) and evapotranspiration (ET), ecosystem water use efficiency (EWUE) in the wet (2017), drought (2018) and recovery (2019) years. May–September values are shown in parentheses. Annual fluxes for 2017 (in italics) were estimated from the ratio of May–September values to the full year of measurements (see text for details). EWUE was calculated from the sums of GPP and ET for the corresponding periods.
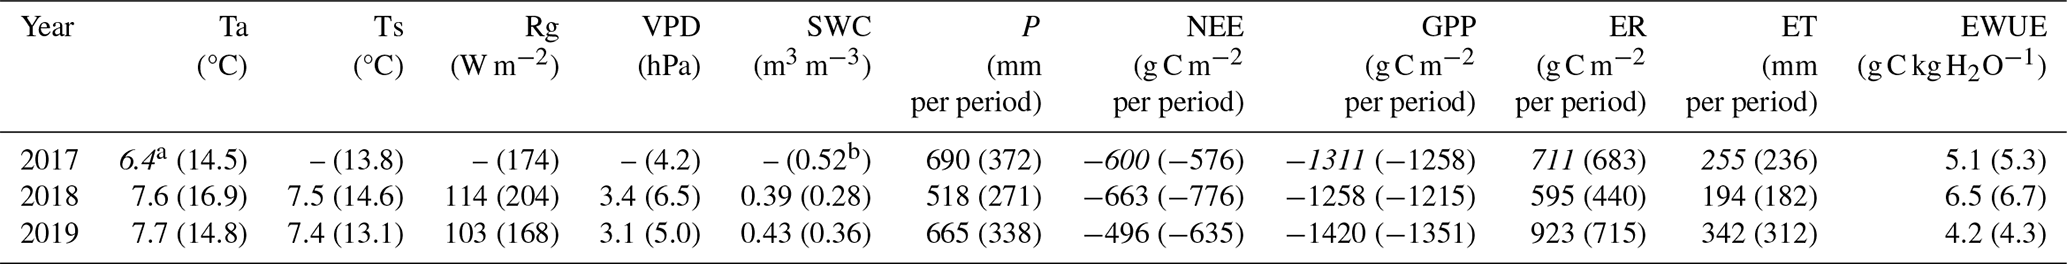
a data from the Estonian National Weather Service; b starting from 24 July 2017.
The net carbon uptake of the drought year was highest among the three years, with May–September NEE exhibiting a 35 % increase relative to the wet year (p<0.001). This enhanced net sink was a result of a significant 36 % reduction in ER (p<0.001), while the 3.4 % decline in cumulative GPP was not significant. In the recovery year, NEE during the active season was 18 % lower than in the drought year (p<0.001) yet remained similar to the wet year (+10 %, p=0.02). ER featured the largest interannual change, significantly increasing by 62.5 % (p<0.0001) in 2019 relative to 2018, but only 4.7 % above 2017, with no significant difference in daily fluxes during the active season (p>0.1). GPP increased moderately in the recovery year (+11 % compared to 2018, p=0.0004), while remaining statistically similar to the wet year (+7.4 %, p>0.1).
During the drought year, total evapotranspiration (ET) for the active season decreased significantly (p<0.001) by 23 % relative to the wet year. ET in the recovery year was the highest of the three years, exceeding the drought and wet years by 71 % and 32 %, respectively. Interannual differences in daily ET were significant across all years (p<0.001). The active season ratio was similar in wet and drought years (0.69 and 0.67, respectively) but increased in the recovery year (0.92). EWUE peaked in the drought year, reflecting stable carbon uptake under reduced water loss, and was lowest in the recovery year, both annually and seasonally (Table 1).
3.3 Seasonal dynamics of carbon and water fluxes, and canopy physiological response parameters
Carbon exchange components (NEE, GPP, ER) and ET exhibited clear seasonal patterns in all years, with a sharp increase in spring, peak rates around mid-summer, and a decline toward autumn, reflecting the phenological cycle of a deciduous forest in the hemiboreal zone (Fig. 2). However, the timing, magnitude and duration of flux peaks varied among the study years.
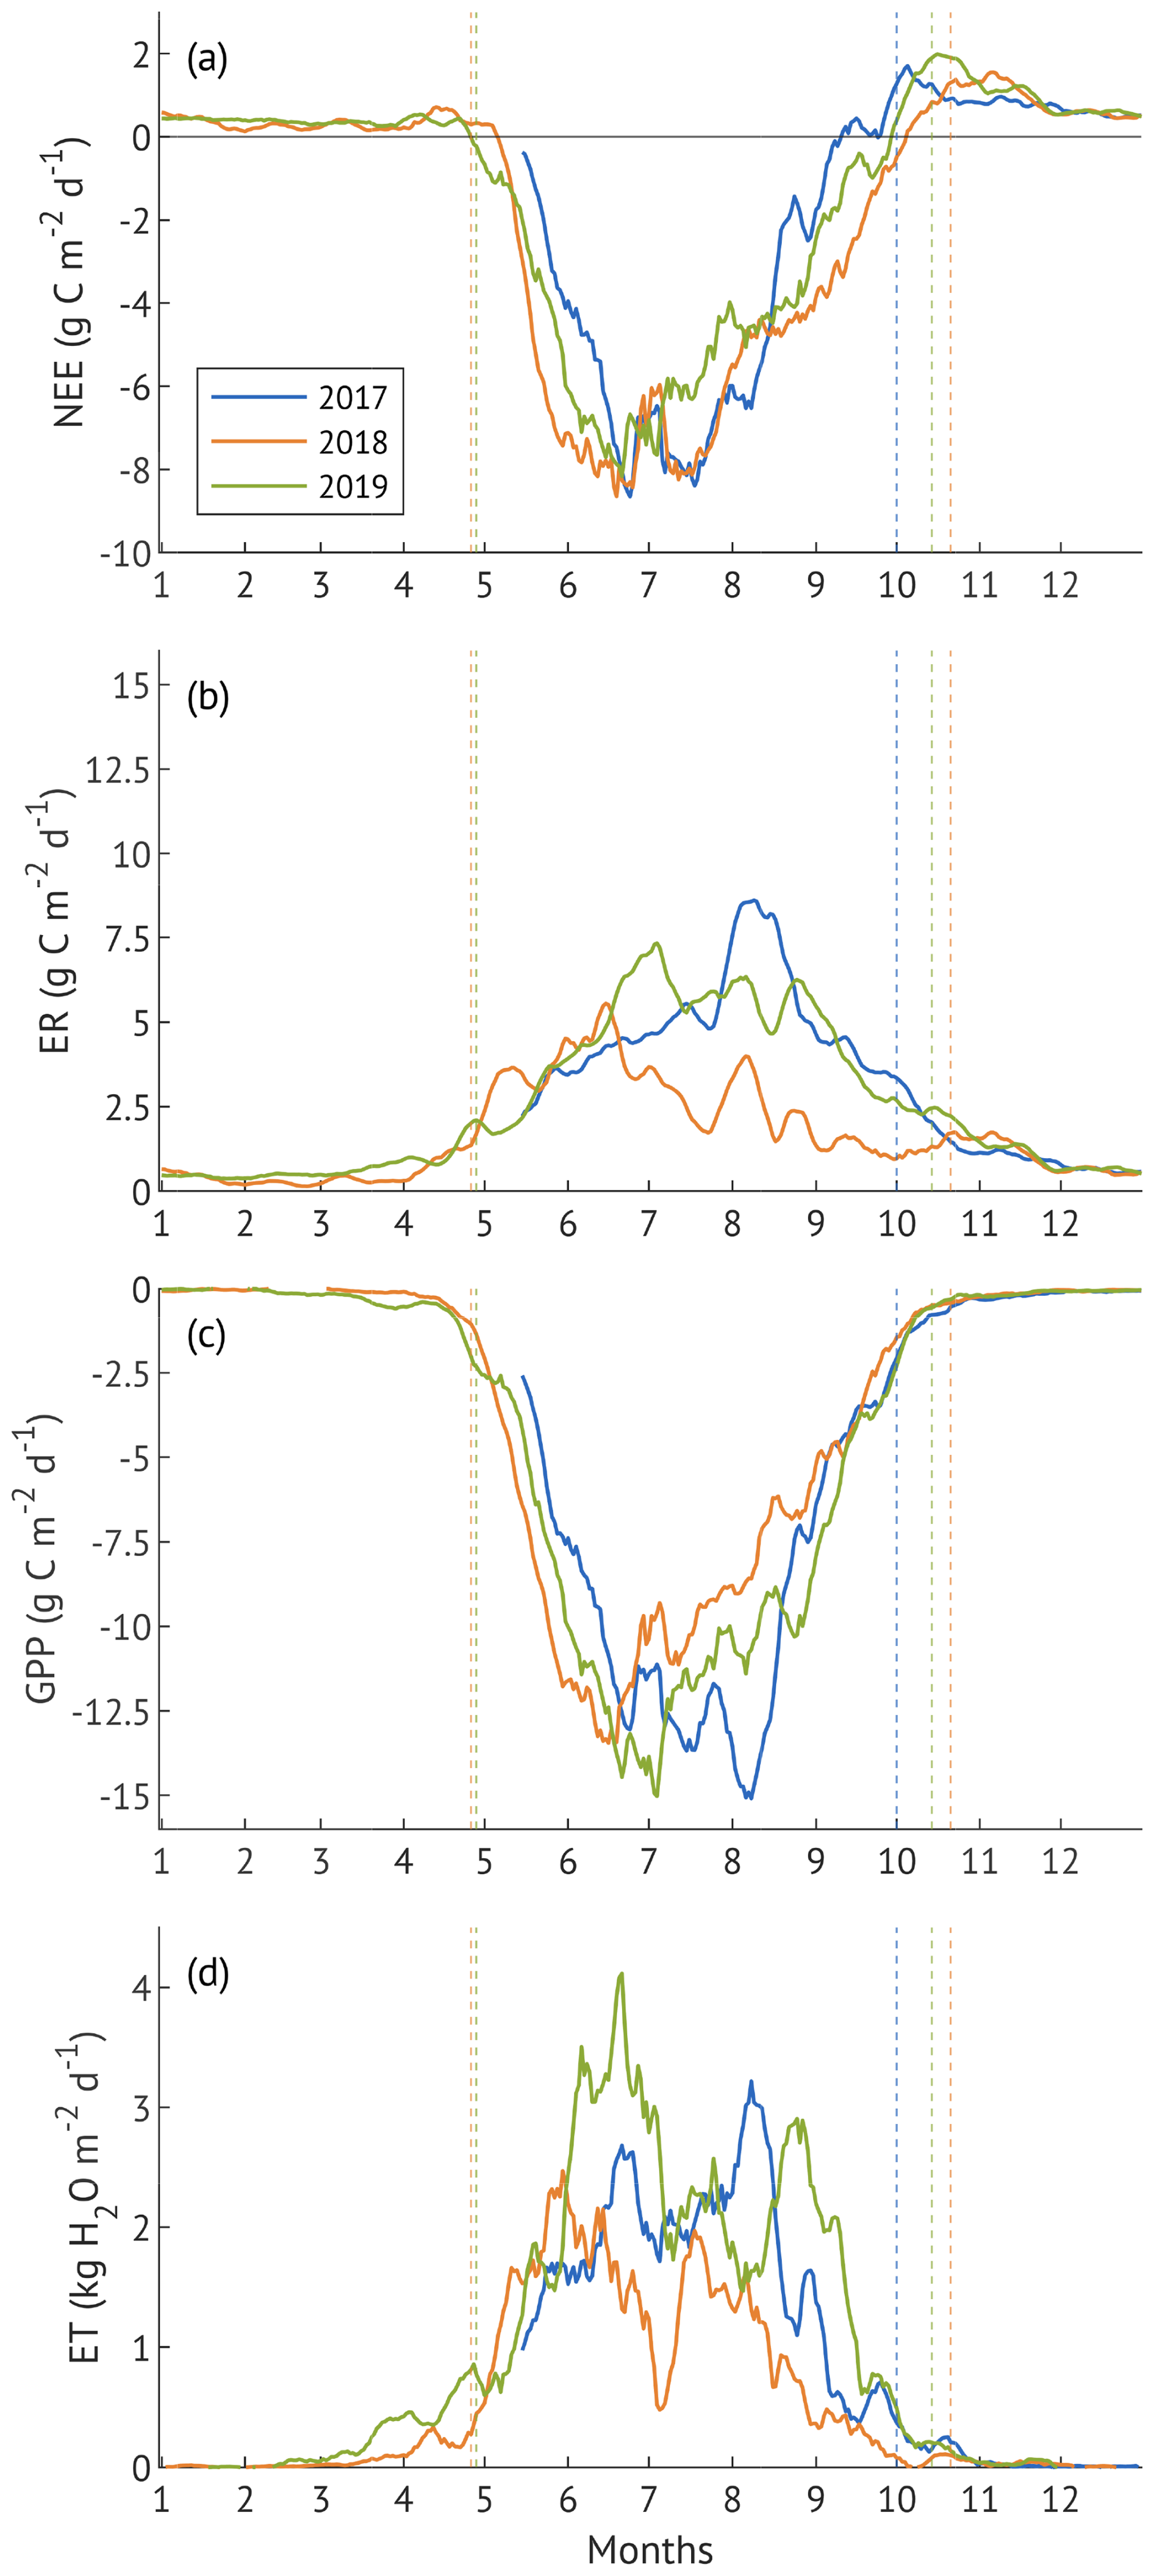
Figure 3Seasonal dynamics of net ecosystem exchange (NEE, a), ecosystem respiration (ER, b), gross primary production (GPP, c), evapotranspiration (ET, d) represented by 10 d running means. Vertical dashed lines are the borders of growing seasons. x-axis ticks correspond to the beginning of each month.
In 2017, lower spring and summer temperatures (Fig. 2) delayed the onset of ER, GPP and ET (Fig. 3b–d), all of which increased at a slower rate compared to 2018 and 2019. High SWC supported higher than in 2018 ET throughout the season, but lower VPD limited evaporative demand, resulting in ET rates below those in the recovery year (2019). All three fluxes peaked in August, following a period of warmer temperatures and clear-sky conditions, with ET exceeding the recovery year levels. Sustained ER during September-October contributed to an earlier decline in NEE compared to 2018 and 2019 (Fig. 3a).
In contrast, the 2018 drought year was characterised by higher spring and summer air and soil temperatures, elevated VPD, and a progressive decline in SWC, particularly in May and again from July onward. These conditions contributed to an earlier rise in ER, GPP and ET, followed by a sharp suppression of all fluxes once SWC became limiting. Despite high atmospheric demand, ET noticeably declined in July and August, consistent with water limitation. ER declined more than GPP in late summer, resulting in a more negative NEE, reflecting increased net carbon uptake toward the end of the growing season.
In the recovery year 2019, spring conditions resembled those of 2018, but lower air temperatures and a more uniform precipitation distribution prevented soil moisture depletion. Warm summer with peaking air temperatures in June supported earlier peaks in ER and GPP, with cooler and wetter conditions in July and August co-occurring with a moderate decline in both fluxes. ET exhibited two distinct peaks, in June and again in August–September, and remained almost consistently higher than in the other two years, supported by moderate VPD, ample SWC, and frequent rainfall events.
The seasonal dynamics of ER and GPP are primarily governed by their main environmental drivers, temperature and light, respectively. Moreover, daytime ER is modelled based on temperature, which can bias direct comparisons across years. Therefore, ERref (ER at reference temperature) and GPPsat (canopy photosynthetic capacity, i.e. GPP at saturating light) are more objective measures for evaluating interannual differences in seasonal variability (Fig. 4).
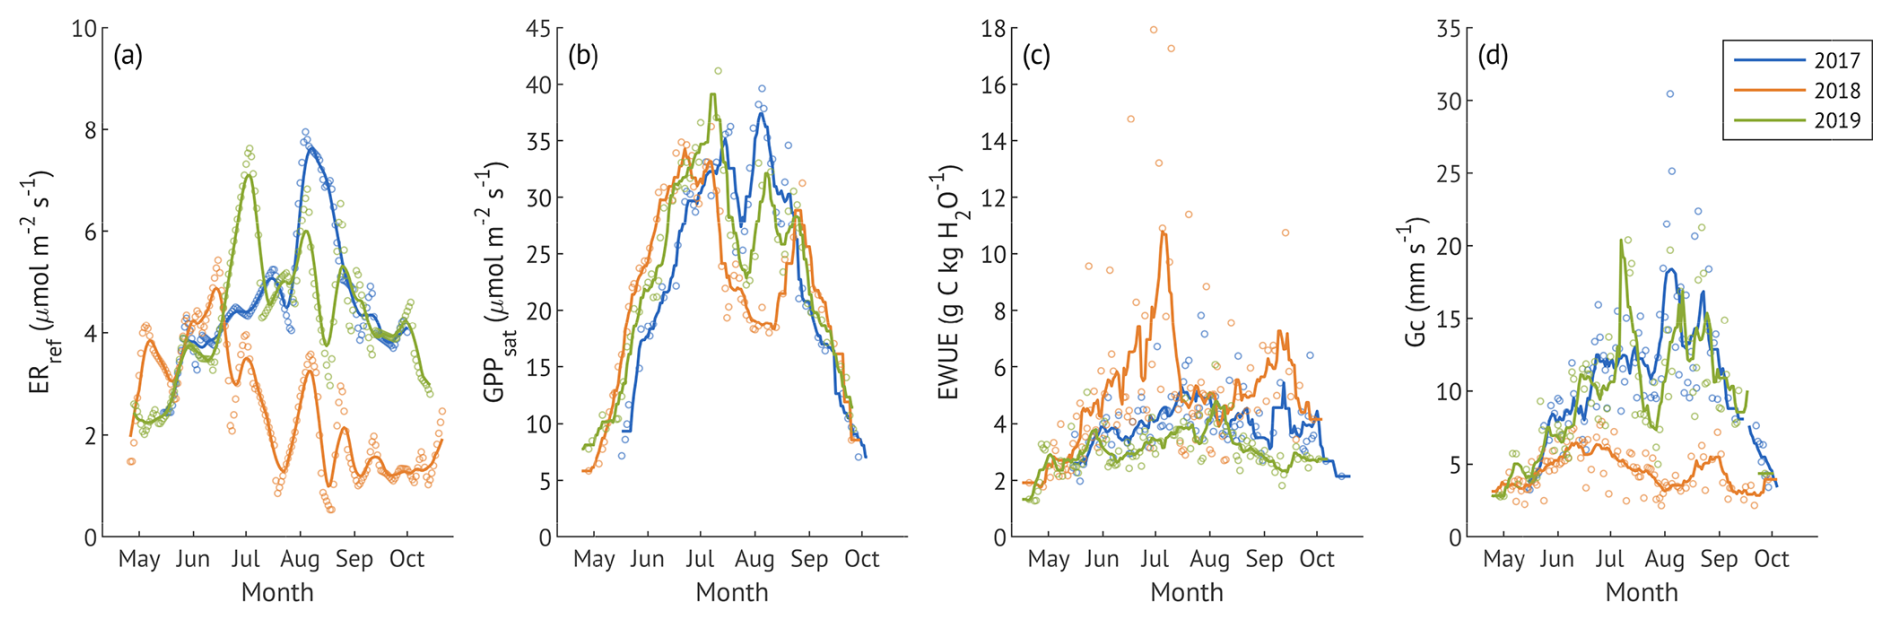
Figure 4Seasonal dynamics of reference ecosystem respiration (ERref, a) and canopy physiological response parameters: canopy photosynthetic capacity (GPPsat, b), water use efficiency (EWUE, c), and canopy conductance (Gc, c). Lines denote 10 d running means. x-axis ticks correspond to the beginning of each month. EWUE markers are daily values that were calculated from sums of GPP and ET filtered for the active photosynthesis and transpiration under sufficient light (Rg > 435 W m−2). GPPsat makers are the centres of 3 d running windows. Gc markers are the daily average values from the half-hourly estimates under sufficient light. All canopy parameters were obtained only for the days with <1 mm of rain, GPP > 1 g C m−2 d−1 and ET > 0.25 mm d−1 for three growing seasons.
ERref exhibited clear seasonal patterns across three years, with seasonal maxima in August 2017, May 2018, and June 2019 (Fig. 4a). The severe suppression of ERref from June to October 2018 confirms that factors beyond temperature strongly influenced ecosystem respiration during the drought year. In contrast, ERref remained relatively stable throughout active season in 2017 and 2019. Average ERref were 4.7 ± 1.3, 2.5 ± 1.2 and 4.3 ± 1.3 µmol m−2 s−1 in 2017–2019, respectively, with no significant difference detected between the wet and recovery years (p>0.1).
GPPsat peaked in June in all three years (Fig. 4b), followed by a sharp mid-summer decline coinciding with VPD peaks (Fig. 2c). In May and early June 2018, it was higher compared to the other years, but the late-summer rebound observed in 2017 and 2019 was absent. Despite these seasonal differences, the average values were similar 24.9 ± 9.1, 22.4 ± 7.5 and 23.5 ± 8.2 µmol m−2 s−1 in 2017, 2018, and 2019 (p>0.1). Canopy EWUE varied between the years (Fig. 4c), with the drought year demonstrating higher and more variable values (5.2 ± 2.9 g C kg H2O−1) than both 2017 (4.1 ± 1.0 g C kg H2O−1) and 2019 (3.2 ± 0.7 g C kg H2O−1) and peaking in July and September 2018. The difference between all three years was significant (p<0.001).
Canopy conductance (Gc) followed a similar seasonal pattern in the wet and recovery years, with higher values during summer relative to early and late in the growing season (Fig. 4c). Nevertheless, the difference between 2017 and 2019 was significant (p<0.001), with the recovery year exhibiting a lower average Gc (9.5 ± 4.4 mm s−1) compared to the wet 2017 year (11.1 ± 4.9 mm s−1). In contrast, Gc remained consistently low throughout the active season of the drought year, averaging 4.6 ± 1.4 mm s−1, significantly lower than both other years (p<0.001).
3.4 The impact of soil moisture variability
Over the three contrasting summers, only the data from the recovery year covered the majority of soil saturation ratio classes (SSR, SWC normalised to the 99th percentile), with the lowest SSR class occurring only in the drought year (Fig. 5). GPPsat demonstrated an optimum at 40 %–50 % saturation, declining at both lower and higher SSR. ERref increased from low to medium SSR and remained relatively stable with further increase in SSR. However, in 2017, ERref remained higher at high SSR than in the recovery year.
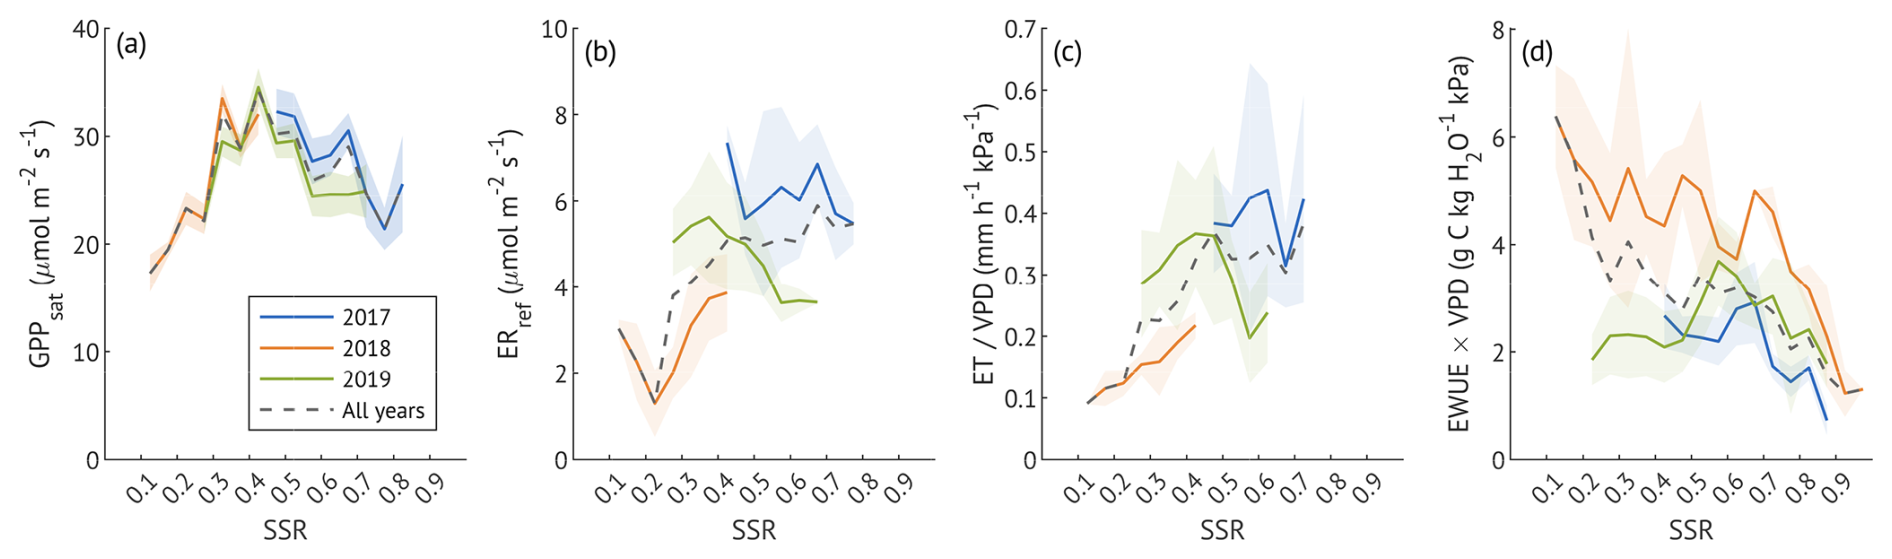
Figure 5The variation of canopy photosynthetic capacity (GPPsat, a), reference ecosystem respiration (ERref, b), normalised canopy evapotranspiration (, c) and normalised water use efficiency (EWUE × VPD, d) under different soil saturation ratios (SSR) in summer months (JJA) of three study years. GPPsat (a) is shown as the value estimated for each SSR class and year; shaded areas represent the 95 % confidence intervals. Other parameters (panels b–d) are shown as averages within 0.05 SSR bins; shaded areas denote ± 1 standard deviation. Dashed lines in all panels indicate results for all data pooled across years. For details on data filtering and calculations, see the corresponding section of the Methods.
Because both ET and EWUE are strongly influenced by VPD, we normalised them to isolate soil moisture effects (Fig. 5c–d). ET increased with SSR, reaching maximum values near 50 % before stabilising, similar to the pattern observed in ERref. In contrast, VPD-normalised EWUE declined with increasing SSR, but with distinct interannual differences. In 2017, EWUE remained low and relatively constant at moderate saturation (∼ 40 %–60 %), decreasing further only from 70 % saturation. In 2018, EWUE was higher across most SSR classes compared to other years, with only a minor decline from 10 % to 80 % and a drop near full saturation. The recovery year (2019) showed a unimodal response, with low EWUE at 20 %–50 %, a moderate rise at 60 %, and a decline at higher SSR.
To examine stomatal regulation under varying soil moisture conditions, we assessed the response of Gc to VPD across the SSR classes, both for all three growing seasons combined (Fig. 6a–b) and for each year separately (Fig. 6c). Reference Gc (Gc,ref, canopy conductance at 1 kPa VPD) was the highest at moderate saturation (45 %) and the lowest at the driest (15 %) and wettest (85 %) conditions when data from all years were pooled. This unimodal response was also evident in the wet and recovery years analysed separately. In contrast, during the drought year, Gc,ref remained low across all SSR classes, with only a small non-significant (overlapping CIs) increase at 35 %–55 %. Overall, Gc,ref in 2018 was about half the magnitude observed in the wet and recovery years at low to medium SSR, approaching recovery-year values only at SSR ≥65 %, when the Gc,ref of the other two years was suppressed.
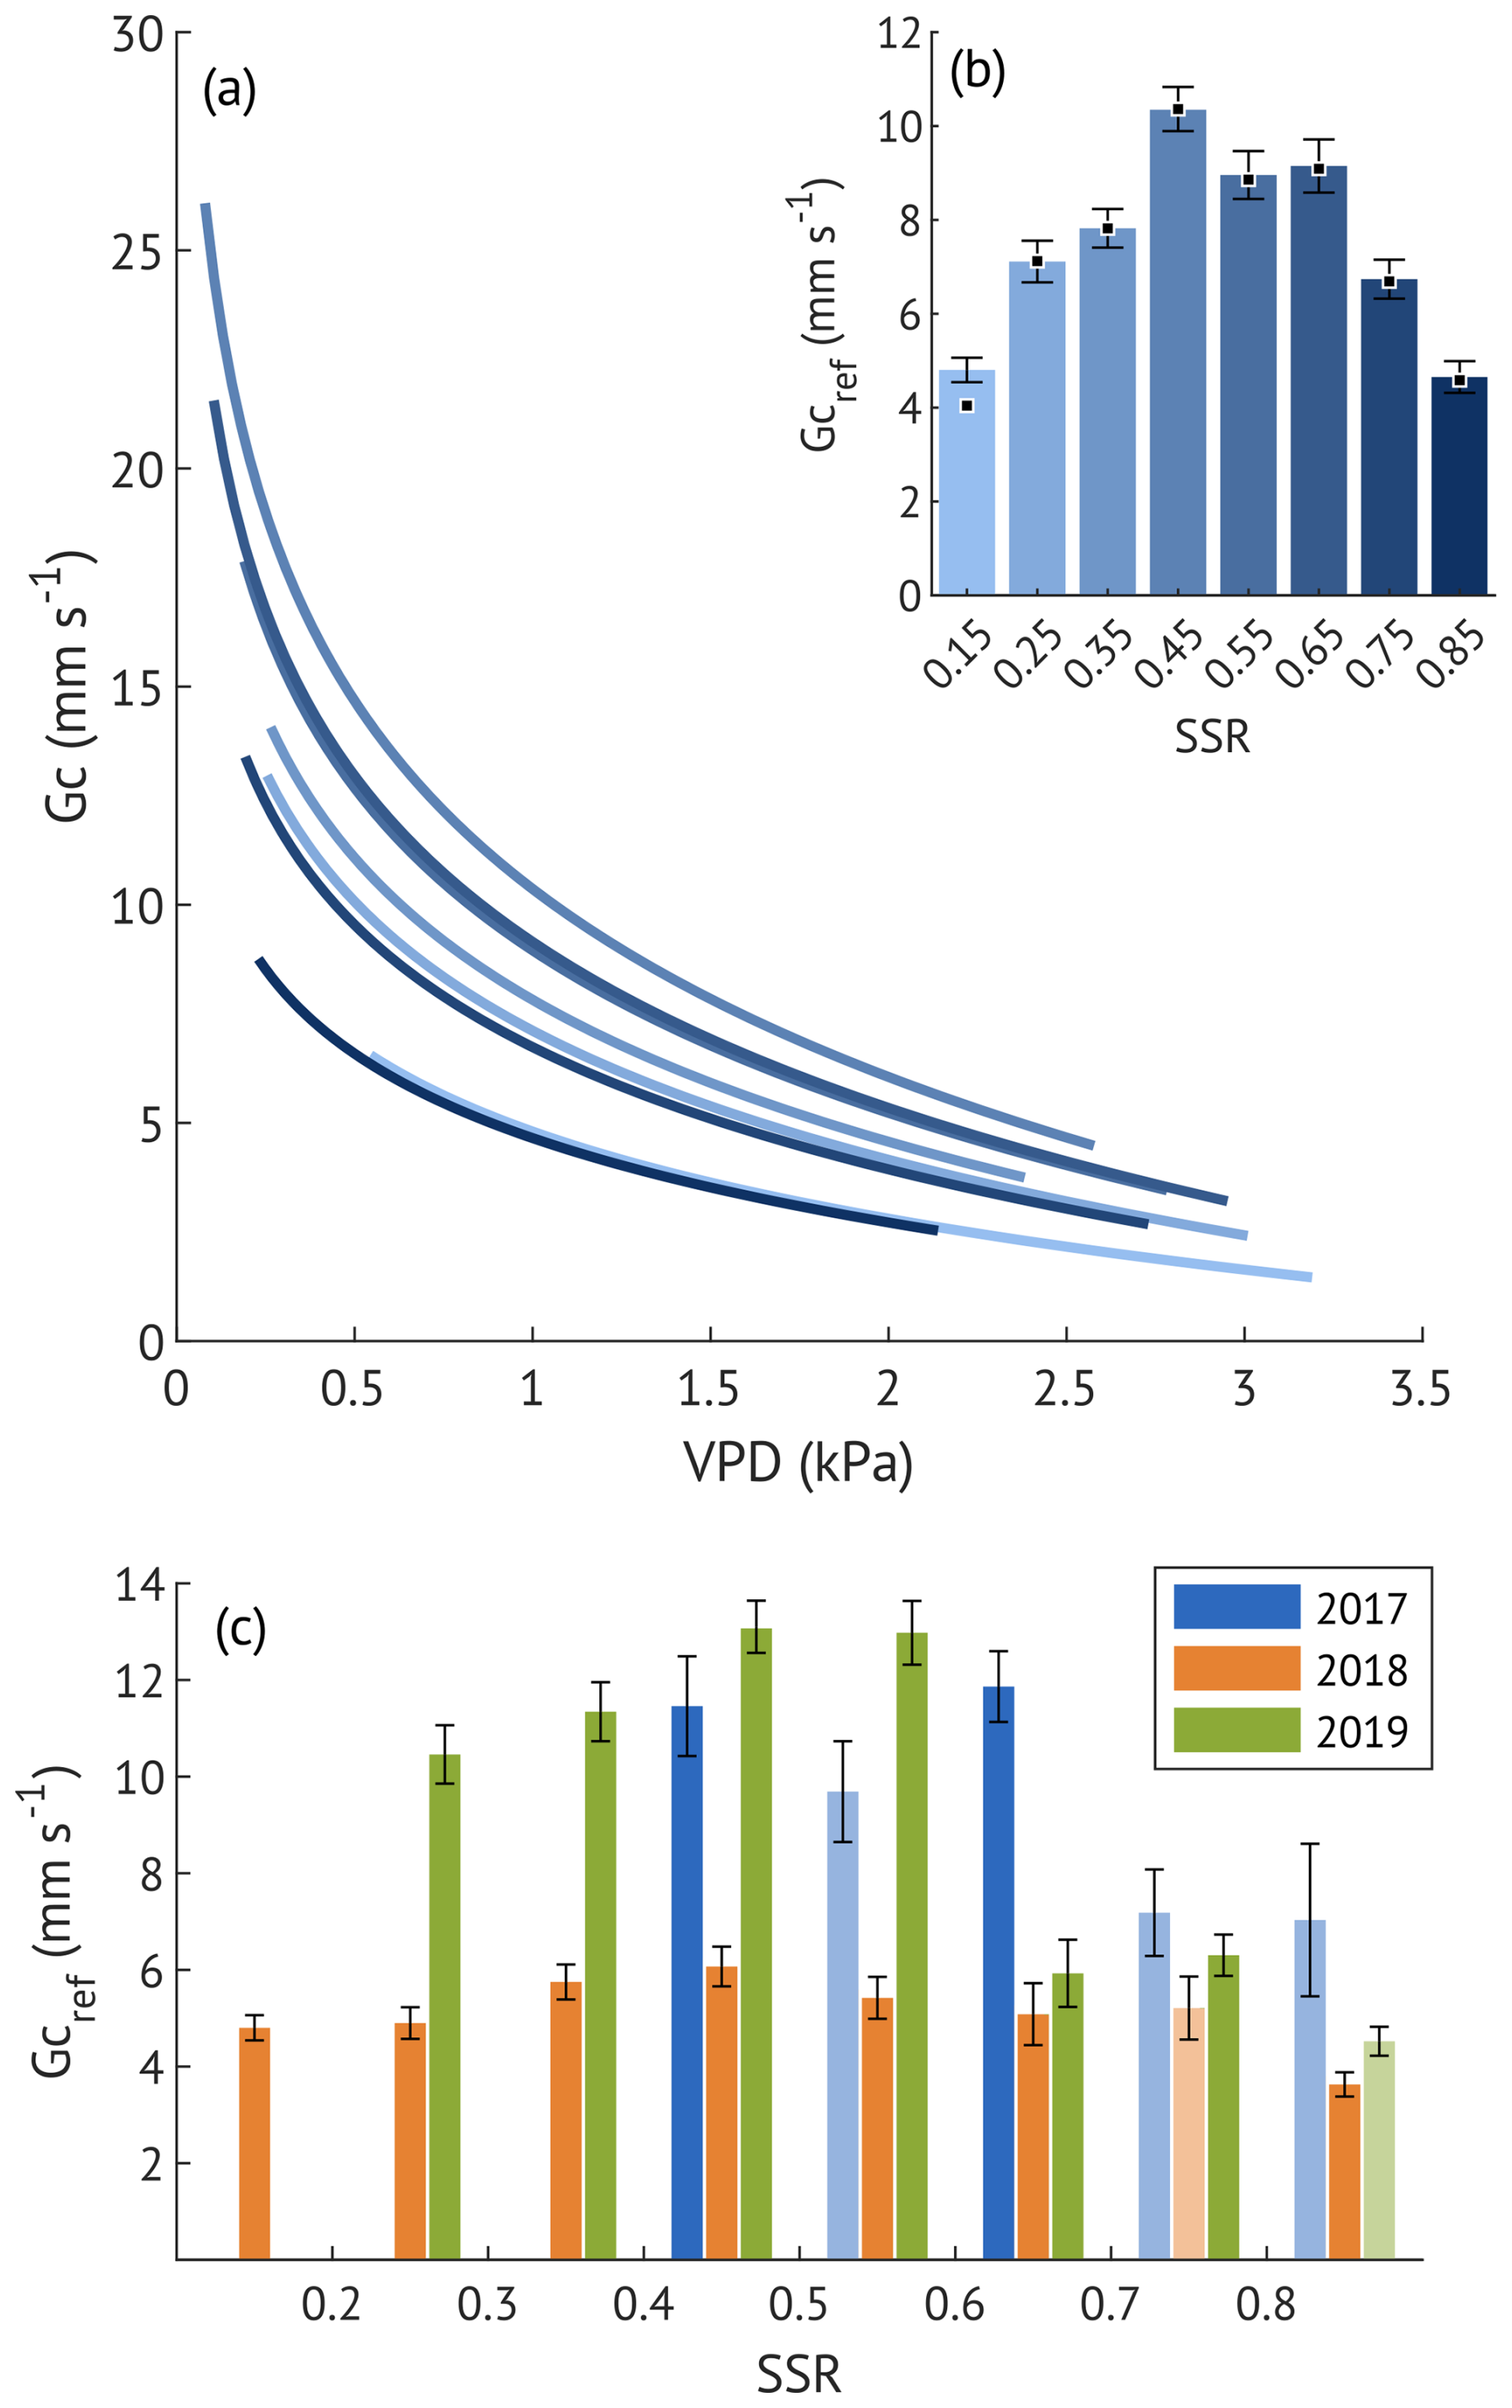
Figure 6(a) Sensitivity of canopy conductance (Gc) to vapour pressure deficit (VPD) across different soil saturation ratio (SSR) classes, indicated by shades of blue, with darker colours representing higher SSR. Curves represent the Oren et al. (1999) model (Eq. 5) with a fixed slope of 0.6. (b) Reference canopy conductance (Gc,ref) for each SSR class, where SSR values denote the midpoint of each 0.1 interval. Error bars represent 95 % confidence intervals. Squares indicate Gc,ref estimates derived from the variable-slope model (see Appendix B for more details). (c) Estimated Gc,ref per SSR class for each study year. Bars with lighter shading indicate lower quality model fits (R2<0.2). Error bars represent 95 % confidence intervals.
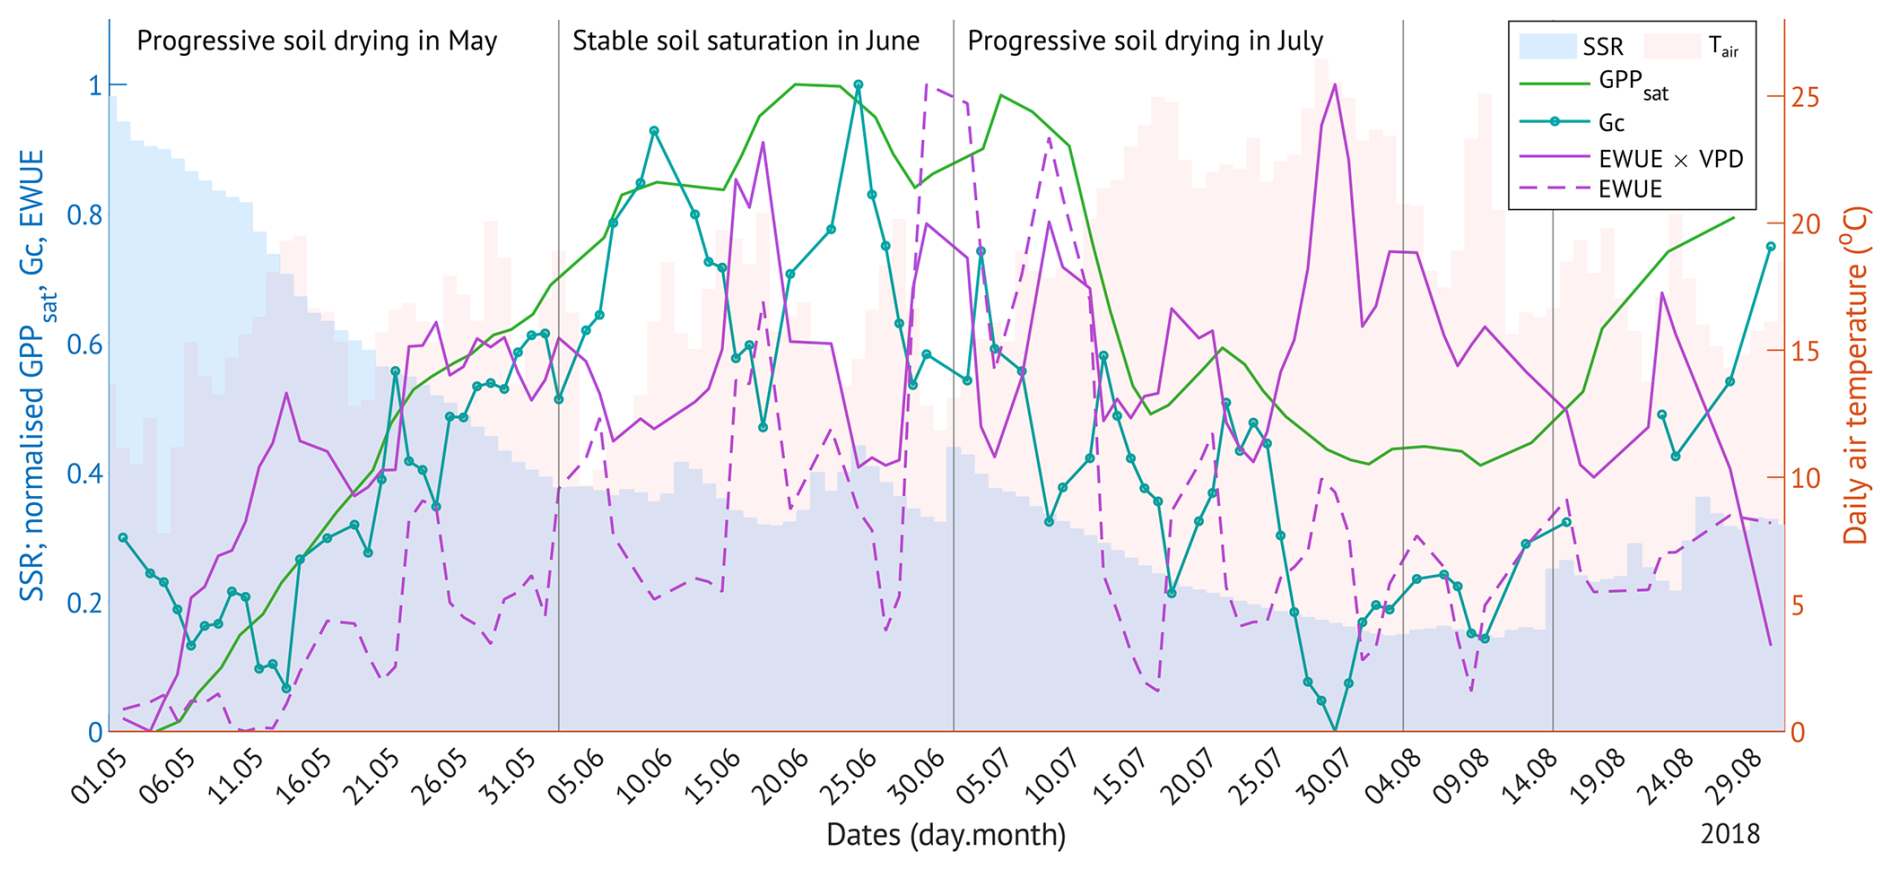
Figure 7The change in canopy physiological response parameters (photosynthetic capacity, GPPsat; canopy conductance, Gc; water use efficiency, EWUE) with the progressive soil drying in 2018. Shaded bars are the daily soil saturation ratio (SSR, blue) and the daily air temperature (red). All other values are normalised 3 d running means.
In May and July 2018, the forest under study experienced a progressive drought, with soil moisture declining in the absence of rainfall over multiple consecutive days (Fig. 7). SSR decreased from full saturation in early May to 37 % by the end of the month, remained between 30 %–50 % in June, and dropped further to 15 % over July, persisting at low levels through mid-August (Fig. 7). While the soil was drying in May, all canopy physiological response variables increased, with maximum values reached under moderate SSRs in June. During the progressive drought in July, most variables declined, with the exception of VPD-normalised EWUE, which reached its highest values under the driest conditions. In early August, when SSR remained at its minimum, GPPsat stabilised at approximately half of its June peak, while VPD-normalised EWUE fell from 75 % to 45 % of its maximum.
3.5 Drought recovery
To assess how the ecosystem recovered from drought, we compared daily GPP and ER of each year with cross-year modelled values from the other two years. The difference between observed and cross-year modelled daily GPP (Fig. 8a–c) was significant across all years (p<0.001), although the values of 2017 and 2019 GPP closely matched in August–September. In 2018, the suppression of GPP starting mid-June was also present in cross-year modelled values (Fig. 8a, c; dashed orange lines). Observed and cross-year modelled ER in 2017 and 2019 (Fig. 8d–f) did not differ significantly (p>0.1), while ER in 2018 was lower than cross-year modelled values (p<0.001).
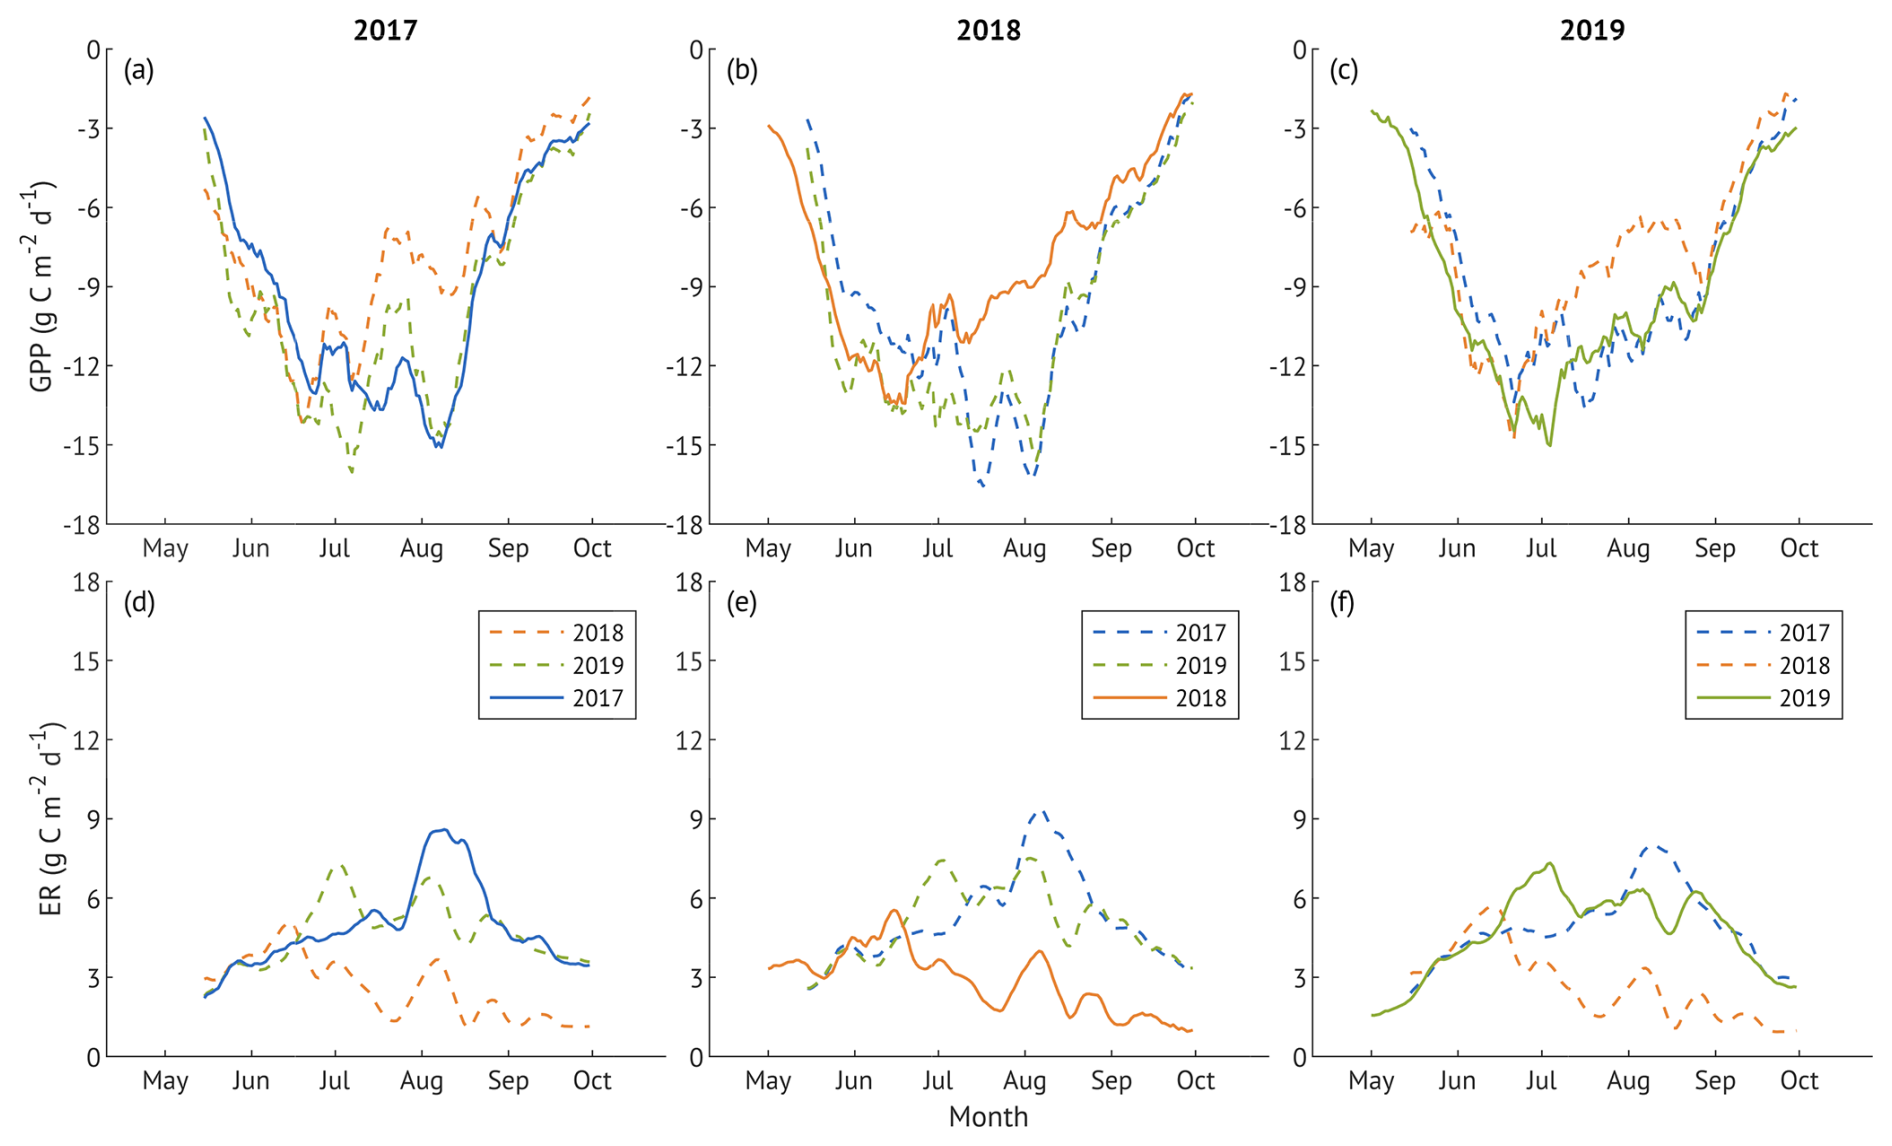
Figure 8Gross primary production (GPP; panels a–c) and ecosystem respiration (ER; panels d–f) during the growing seasons of 2017 (a, d), 2018 (b, e), and 2019 (c, f). Solid lines are observed GPP (upper panels) and ER (lower panels) for each year, while dashed lines are cross-year modelled fluxes calculated using the measured global radiation (for GPP) or air temperature (for ER) of each year with parameter sets derived from other study years. All lines represent 10 d running means.
To further quantify the drought impact and recovery of the daily ecosystem parameters (GPP, GPPsat, ER, ERref, ET, T, EWUE, Gc), we estimated resistance (Rt), recovery (Rt) and resilience (Rs) indices (Fig. 9). According to overlapping 95 % confidence intervals, no significant differences were detected between carbon fluxes and their driver-normalised versions (GPP vs. GPPsat; ER vs. ERref) for any of the indices.
The ecosystem's resistance (Rt) to drought exhibited considerable variation among the studied parameters. Carbon uptake (GPP and GPPsat) maintained moderate resistance (0.84 and 0.88, respectively), indicating partial suppression of daily photosynthetic activity in 2018. In contrast, respiratory fluxes (ER and ERref) exhibited much lower resistance (0.57 and 0.53, respectively). Water fluxes were likewise reduced, with Rt = 0.63 for evapotranspiration (ETtot) and Rt = 0.71 for transpiration (T). EWUE exhibited the highest resistance (∼ 1.38), whereas Gc was most affected, with Rt = 0.39.
All ecosystem parameters demonstrated full recovery (Rc > 1), with EWUE declining to values below the drought level (Rc = 0.58). Resilience (Rs) indices indicated a generally strong rebound in the year following drought (2019), with carbon and water fluxes returning to or exceeding pre-drought levels observed in 2017, and EWUE declining to even lower levels (Rs = 0.79), indicating a return to less constrained conditions. However, Gc exhibited lower resilience (Rs = 0.88), which may modulate ecosystem responses to future stress events.
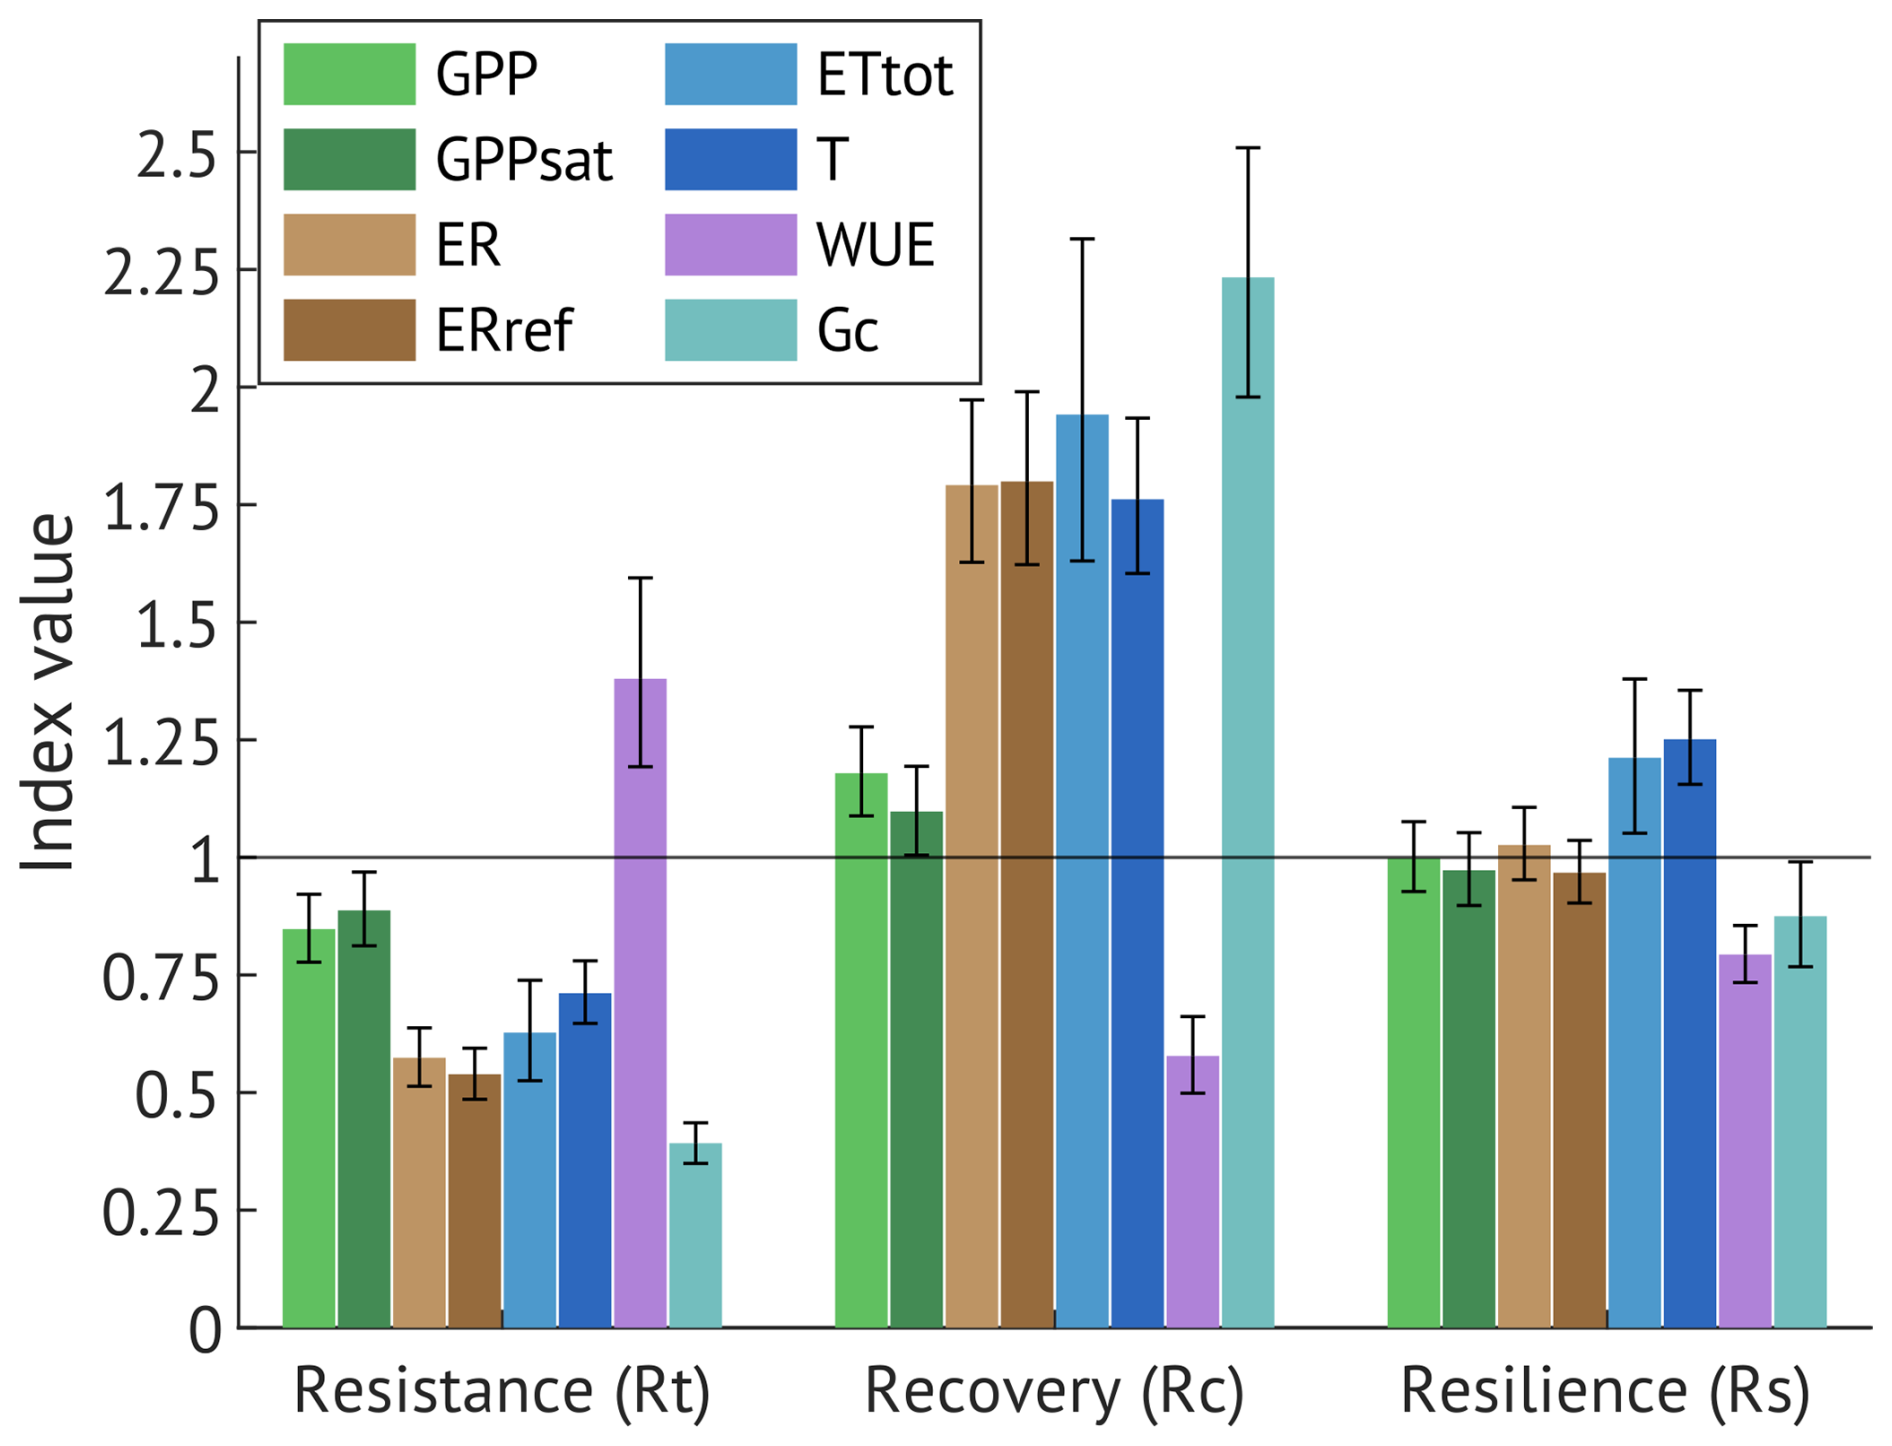
Figure 9Resistance (Rt), recovery (Rc) and resilience (Rs) indices of the gross primary production (GPP), canopy photosynthetic capacity (GPPsat), ecosystem respiration (ER), reference ecosystem respiration (ERref), evapotranspiration (ETtot), transpiration (T, calculated as filtered ET with maximum share of T), canopy water use efficiency (EWUE) and canopy conductance (Gc). Error bars are 95 % confidence intervals.
4.1 Alder forest as a strong net carbon sink
Alder is a widely distributed tree species across hemiboreal and temperate zones, commonly found in riparian buffers, yet data on alder forest ecosystem carbon exchange remain surprisingly limited. In a chronosequence of alder forest stands in Estonia studied by Uri et al. (2017), the two oldest sites (“Agali” and “Kolleste 2”) were of similar age to the current one (∼ 35 and ∼ 40 years old, respectively) at the time of measurements. Uri et al. (2017) applied a biometric methodology, which integrates stand biomass, production, litterfall, and monthly soil respiration measurements to estimate carbon exchange components. Although this approach differs from the eddy-covariance method used here and the results are not directly comparable, it is possible to approximate NEE, GPP, and ER from their data under a set of assumptions (see Appendix D for details). The calculated values of NEE, GPP, ER, and total soil respiration (Rs) from Uri et al. (2017), using two-year averages for Agali and one-year data for Kolleste 2, are summarised in Table 2 together with the sites' characteristics.
Table 2Site characteristics and carbon exchange parameters from the current study and from two mature alder forests reported in the chronosequence study by Uri et al. (2017). NEE, GPP, and ER for “Agali” and “Kolleste 2” were calculated using Rs data from Table 8 and Rh, NEP, and NPP data from Table 9 in that study, following the method described in the Appendix D.
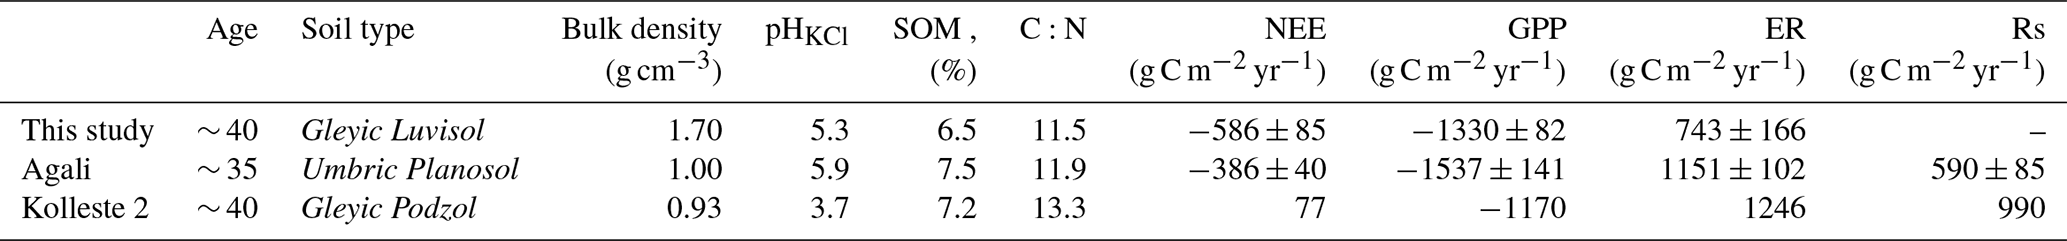
While our site acted as a strong net carbon sink, the two sites from Uri et al. (2017) were a much weaker sink (Agali) and a net carbon source (Kolleste 2). The GPP of our site was intermediate between the two, yet ecosystem respiration was 1.5 to 1.7 times lower. These differences can partly stem from contrasting soil properties: the current site's Gleyic Luvisol exhibited much higher bulk density (1.7 g cm−3), moderate acidity (pH 5.3), and lower soil organic matter content (6.5 %) compared to the other sites, which had lighter soils, higher SOM, and, in the case of Kolleste 2, strongly acidic conditions (pH 3.7). Higher bulk density likely limits soil aeration and microbial activity, reducing respiration rates and favouring net carbon uptake, while more acidic soils and higher organic matter at Kolleste 2 may promote microbial respiration, resulting in enhanced soil respiration and, consequently, net carbon release. However, it should be noted that the study periods differ; Uri et al. (2017) conducted measurements between 2011 and 2014, whereas the current study covers 2017 to 2019, and interannual weather variability during these periods may have contributed to observed differences in carbon fluxes.
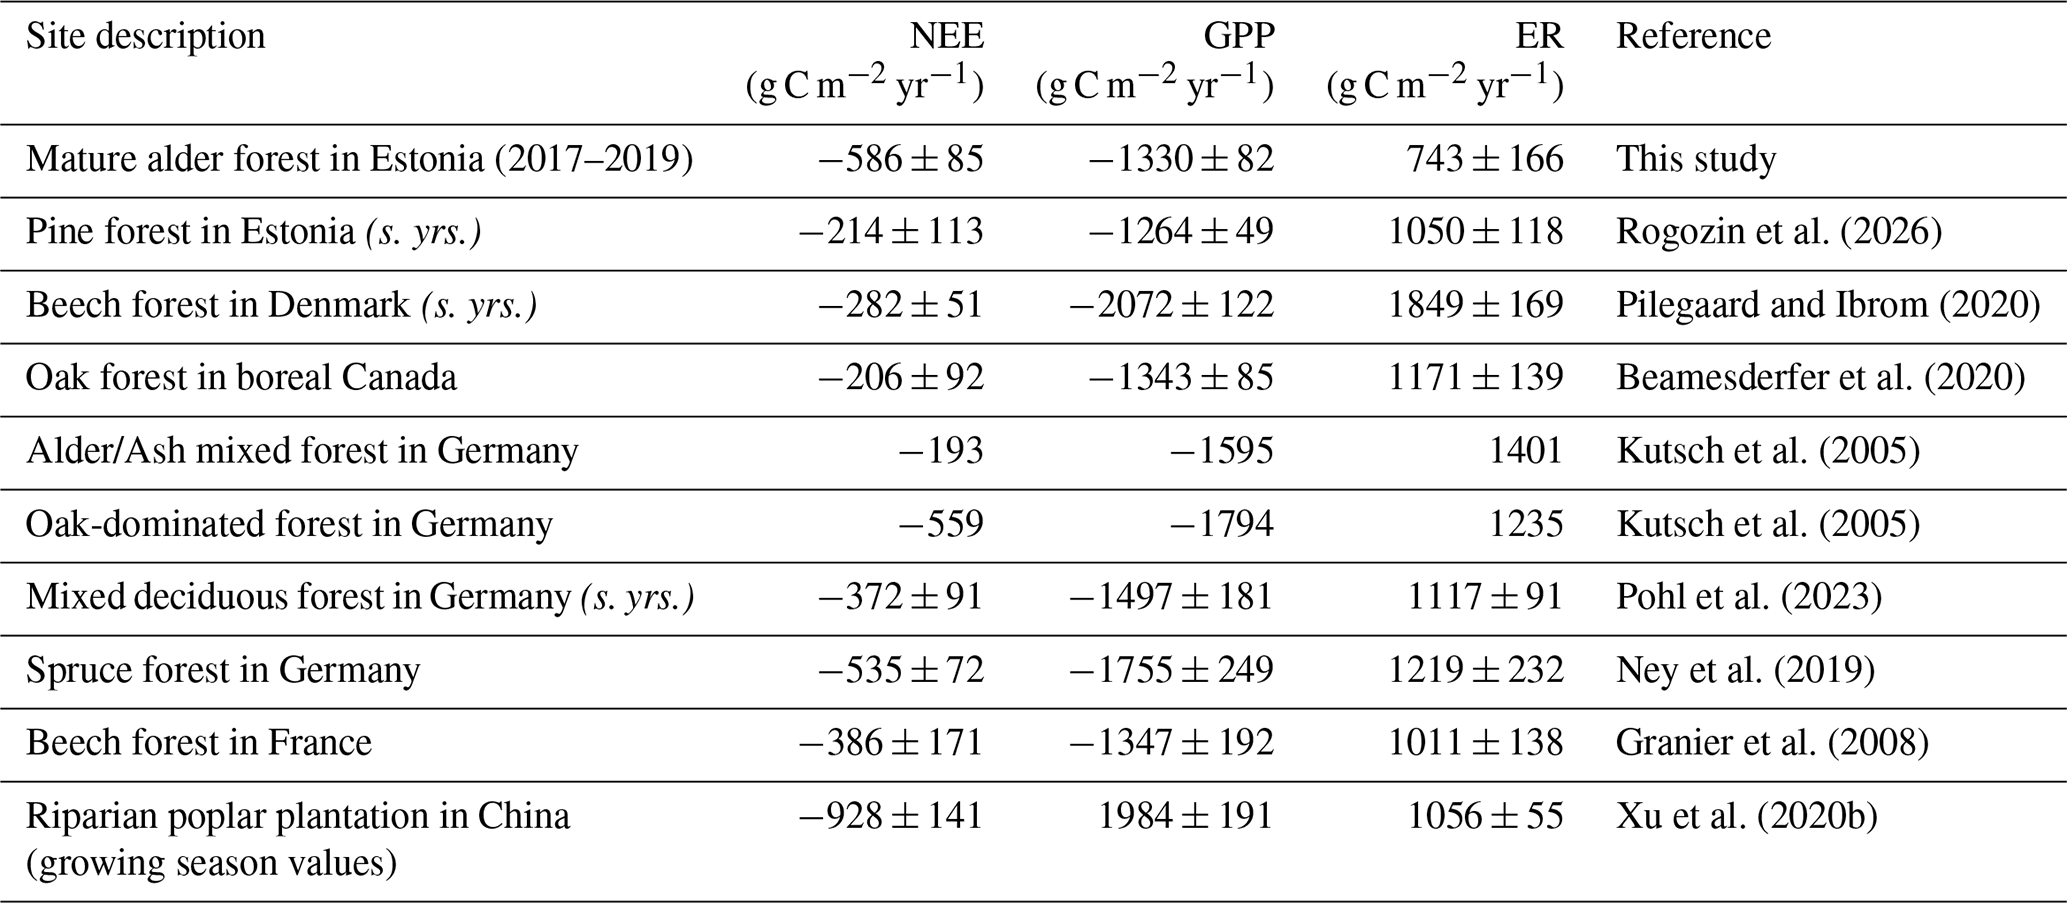
In the same years of measurement, a mature upland pine forest growing on sandy soil in Estonia exhibited similar GPP but higher ER, resulting in a weaker net carbon sink (Table 3). Compared to previously reported values for various broadleaved forests in boreal and hemiboreal zones, the NEE at our site exceeds most estimates but aligns with fluxes observed in more southern broadleaved and coniferous forests. While GPP at our site was comparable to that of boreal and hemiboreal forests, ER was, again, notably lower. In contrast, forests with a similar NEE range exhibited higher GPP but also greater ER, likely driven by their warmer climate with a longer active vegetation season.
Very low ER in our study likely reflects oxygen limitation in a compact, frequently wet mineral soil, rather than nutrient shortage. The slightly acidic soil with high bulk density forms conditions that reduce gas diffusion and favour anoxic microsites, suppressing microbial decomposition despite moderate total C. Together with restricted fine-root activity under dense, saturated conditions, these factors could lead to low ecosystem respiration. We note, however, that our observations are limited to three years with exceptional weather conditions, which may not fully capture the “typical” respiration rates of this forest.
Table 3Net ecosystem exchange (NEE), gross primary production (GPP), and ecosystem respiration (ER) reported for broadleaf forests and sites with values comparable to this study. “(s. yrs.)” indicates that averages were calculated using only the same years as in this study (2017–2019). All values are in g C m−2 yr−1, mean ±SD where available.
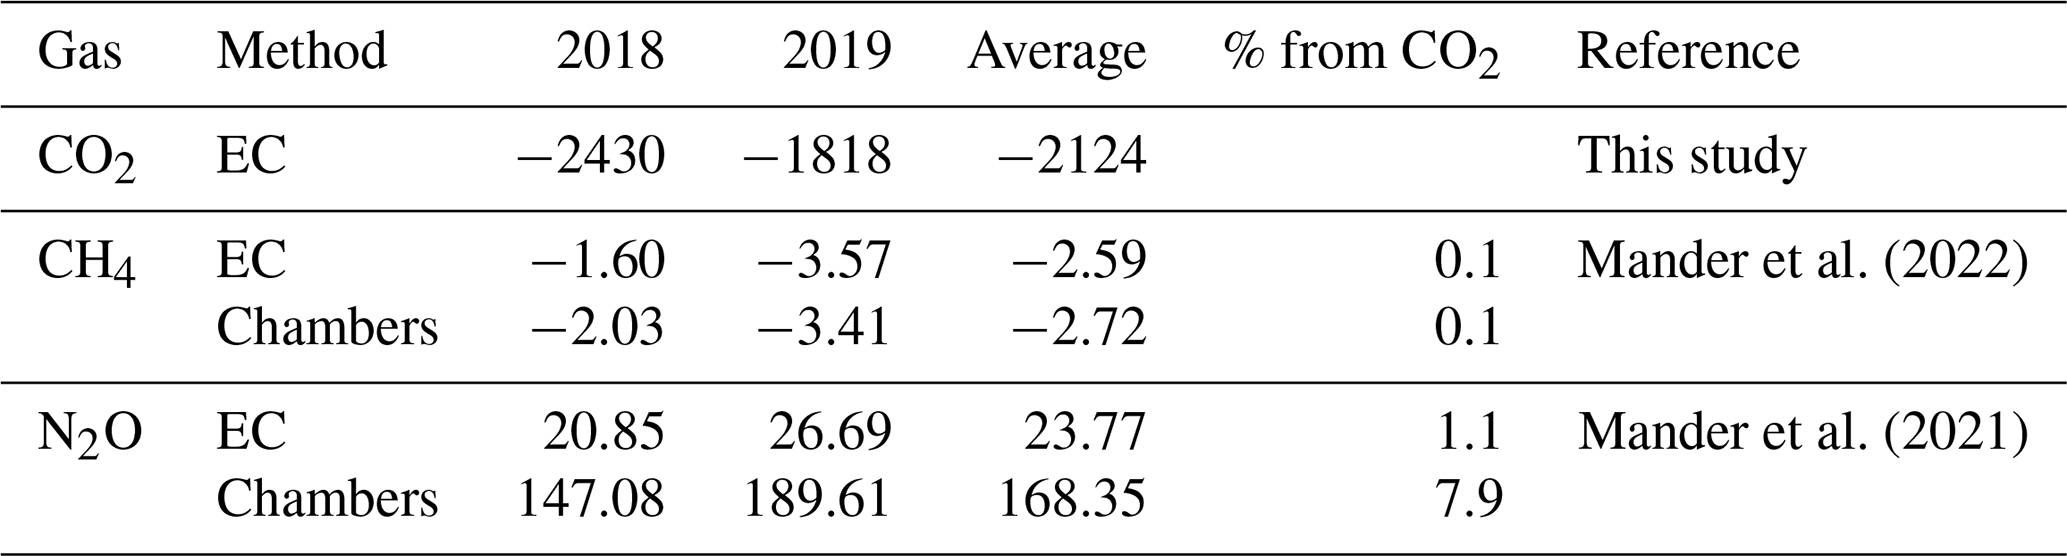
Anoxic conditions, combined with fluctuating soil moisture levels, are very favourable for methane (CH4) production (Dlugokencky et al., 2011; Feng et al., 2020; Flanagan et al., 2021). In addition, the high nitrogen content typical of alder forests could promote nitrous oxide (N2O) emissions (Butterbach-Bahl et al., 2013; Davidson et al., 2000). In principle, these non-CO2 fluxes could offset the strong net carbon sink observed in our study. However, chamber-based and eddy-covariance measurements at the site (Mander et al., 2021, 2022) indicate otherwise. On an annual scale, the alder stand functioned as a very minor CH4 sink, contributing merely 0.1 % to the total GHG global warming potential (Table E1). While annual N2O fluxes were positive, they represented just 1.1 % of total NEE in CO2-equivalent units (or 7.9 % based on chamber-derived estimates), too small to negate the forest's role as a substantial net CO2 sink.
4.2 Lower than expected evapotranspiration
Evapotranspiration (ET) integrates physical evaporation from soil and wet surfaces with plant transpiration, making it inherently complex (Brümmer et al., 2012; Jarvis, 1986; Jassal et al., 2009; Massmann et al., 2019) and difficult to quantify accurately (Fisher et al., 2017). Eddy covariance estimates are further affected by incomplete energy balance closure (Appendix A) (Amiro, 2009; Foken, 2008; Mauder et al., 2018, 2020). We chose to report the ET based on directly measured LE, as net radiation and ground heat flux were not available for accurate adjustment (Mauder et al., 2018).
Annual ET in the wet year 2017 (255 mm yr−1) and especially in the drought year 2018 (194 mm yr−1) were lower than expected for the boreal and hemiboreal region (Launiainen et al., 2022; Lindroth et al., 2020; Wang et al., 2021) and much lower than in the various riparian forests (Kochendorfer et al., 2011; Kowalska et al., 2020; Scott et al., 2004; Xu et al., 2020b). However, ET in the recovery year 2019 (342 mm yr−1) was closer to previously reported annual ET values in boreal and hemiboreal forests in 2015–2018 (Lindroth et al., 2020) and multi-year averages reported by Wang et al. (2021) (384 ± 12 mm yr−1) and Launiainen et al. (2022) (348 ± 26 mm yr−1). The average precipitation during the growing season in the latter study (383 ± 83 mm) was comparable to our wet (372 mm) and recovery (338 mm) years but exceeded the drought year (271 mm), indicating that lower atmospheric water supply likely contributed to the reduced ET in 2018. Lower ET under higher precipitation in the wet year may be explained by cooler summer temperatures reducing evaporative demand. On the other hand, lower energy balance closure levels in 2017 and 2018 (70 % and 71 %, respectively) might contribute to the ET underestimation (Fig. A1). Furthermore, the low ET with moderate GPP results in notably higher annual EWUE (5.3 ± 1.2 g C kg H2O−1), which exceeded values (0.9–4.1 g C kg H2O−1), previously reported for various forests (Jin et al., 2023; Niu and Liu, 2021; Xie et al., 2016; Zhou et al., 2014).
The evaporative index () in 2017 and 2018 (0.69 and 0.67, respectively) was consistent with values reported for other forested ecosystems (Williams et al., 2012), whereas a higher ratio of 0.92 in 2019 likely reflects the combined effects of a warm growing season and well-distributed precipitation, which stimulated both photosynthesis (Table 1) and transpiration (Fig. 9). As previously demonstrated by Eschenbach and Kappen (1999), alder's high leaf stomatal conductance supports enhanced transpiration under sufficient water supply, implying that conditions in 2019 may have been near optimal for maximising water and carbon exchange. We have to note that the evaporative index remained below one in all years of our study, which is surprising for a riparian forest that typically has access to additional water through lateral inputs, and thus ET would exceed P (Kochendorfer et al., 2011; Xu et al., 2020b). The shallow and narrow forest river near our study site likely provided only limited supplemental water. While this forest is experiencing seasonal flooding, it might be a result of historically formed high-density soils, rather than the river's impact in the three studied years.
4.3 Moderate soil water saturation enhances ecosystem fluxes
Soil moisture variability plays an important role in modulating ecosystem carbon exchange, although its effect is usually more pronounced in water-limited, rather than radiation-limited regions (Green et al., 2019; Kannenberg et al., 2024). Nevertheless, variable soil moisture conditions are intrinsic to riparian forests, where seasonal flooding and fluctuating groundwater table create a dynamic hydrological regime (Kowalska et al., 2020; Portela et al., 2023; Singer et al., 2014). On our site, the variation in soil saturation (SSR) levels caused a non-linear response of canopy gas exchange, with both very dry and very wet conditions constraining reference stomatal conductance (Gc,ref, Gc at 1 kPa of VPD), representing the maximum stomata aperture (Fig. 6). Soil moisture extremes impose both hydraulic and metabolic constraints: low saturation limits water supply to leaves, while high saturation can cause oxygen limitation in the rhizosphere, impairing root function and nutrient uptake (Kochendorfer et al., 2011; Kozlowski, 1997). The physiological optimum for canopy conductance at a moderate soil saturation (∼ 40 %–50 %) was reflected in photosynthetic capacity and transpiration, and enhanced carbon and water fluxes in the corresponding growing season periods of different years.
Relatively high values of photosynthetic capacity and ET, sustained into wetter ranges during summer months, especially during the colder year, may reflect adaptations to periodic flooding typical of riparian forests. Canopy EWUE declined with increasing soil water content in the wet year, consistent with a “relaxed” physiological state when water is not limiting. Reference respiration (ERref) also followed a similar saturation curve, with moderate soil moisture promoting optimal metabolic activity, while substrate constraints under lower saturation ratios reduced respiration rates.
4.4 Alder forest in the 2018 drought year
In 2018, low precipitation caused widespread soil moisture deficits across Europe, while extremely high air temperatures further intensified drought conditions through elevated VPD (Fu et al., 2020; Lindroth et al., 2020; Smith et al., 2020). Estonia also experienced two extended dry spells (in May and July), accompanied by an exceptional heat anomaly from mid-July to early August (Krasnova et al., 2022). These conditions produced a progressive summer drought at our site (Fig. 7).
In May, while the soil drying was faster than in July, it reached only ∼ 50 % soil saturation, which persisted through June. We found this moisture level to be optimum for ecosystem fluxes (Fig. 5) and plant stomatal activity (Fig. 6), although still constrained by the early stages of the growing season. The relatively low canopy conductance at that time likely reflected ongoing alder leaf development. Under these favourable early-season water conditions and warmer-than-average May temperatures, all fluxes and canopy physiological parameters gradually increased (Fig. 7).
Higher spring temperatures can enhance annual net carbon uptake by extending the growing season (Keenan et al., 2014; Wolf et al., 2013) and offsetting the influence of the forthcoming summer drought on the annual carbon balance (Angert et al., 2005; Kljun et al., 2006; Smith et al., 2020; Wolf et al., 2016). A similar pattern was reported for a riparian mixed broadleaf forest in the Czech Republic, where an anomalously warm spring in 2018 led to an increase in both GPP and ET, counteracting the negative effects of the summer drought (Kowalska et al., 2020). In boreal and hemiboreal regions, moderate spring warming typically coincides with ample soil moisture from snowmelt, ensuring sufficient water supply for early-season assimilation. However, enhanced spring productivity and transpiration can also accelerate soil water depletion, increasing susceptibility to summer drought (Bastos et al., 2020).
In July 2018, the soil moisture decreased further, reaching its minimum by August. Combined with extremely high temperatures and VPD peaks, the progressive drought suppressed all gas fluxes and vegetation activity (Fig. 7). The drought resistance indices, calculated for May–September, indicated average reductions of 15 %, 37 %, and 43 % in daily GPP, ET, and ER, respectively, relative to 2017 (Fig. 9). Although the resistance-based GPP decline in 2018 (Rt = 0.85) appears to contradict the negligible difference between cumulative May–September values in 2017 (−1258 g C m−2 per period) and 2018 (−1215 g C m−2 per period), this discrepancy results from the difference in temporal scale. Seasonal sums smooth out short-term variability: in 2018, higher GPP during the early growing season partly compensated for the pronounced reductions in mid- to late summer (Fig. 3), resulting in comparable seasonal totals. In contrast, the resistance index, derived from daily values, captures these episodic declines more accurately, reflecting the stronger suppression of photosynthesis during the drought period.
The reduction of GPP in summer 2018 is in line with observations from multiple sites across Europe (Fu et al., 2020; Lindroth et al., 2020) and can be attributed to stomatal regulation under the lack of soil water availability. Indeed, we estimated a 61 % decline in daily Gc over May–September 2018. After the initial increase in May-June, it continuously declined through July and remained low until the end of the growing season (Figs. 4d, 7). This explains the suppressed canopy photosynthetic capacity in August 2018, especially when compared to the peaking values in the reference year (Fig. 4b).
The Gc suppression was likely driven by high atmospheric demand (i.e. increasing VPD) rather than soil moisture depletion, as indicated by uniformly low values of Gc,ref across all SSR classes in the active season of 2018. High VPD can override soil moisture gradients, forcing sustained stomatal downregulation regardless of soil moisture variation (Novick et al., 2016). The reduction of stomatal conductance to prevent water loss has been previously documented across multiple plant species and forest types (Farquhar and Sharkey, 1982; Fu et al., 2020; Lindroth et al., 2020; van der Molen et al., 2011; Novick et al., 2016; Reichstein et al., 2002), reflecting a conservative hydraulic strategy of our study site.
Since both GPP and ET are mechanistically connected with stomatal regulation, the low ET resistance is not surprising; however, its sensitivity was much higher than that of GPP (37 % decline compared to only −15 %). Total ET includes both transpiration (T) and evaporation, though the latter is limited under drought. However, even when filtering only for the periods with maximum T contribution, the drop in daily values (−29 %) still exceeded that of GPP (Fig. 9). This additionally contradicts the findings of Lindroth et al. (2020), where the majority of sites demonstrated an increase in ET in the drought year. Boese et al. (2019) found that the sites with high seasonal dryness variability experienced a lower ET decrease rate during the progressive drought due to plant adaptations such as deeper root systems to access the water. However, at our site, high soil moisture variability is skewed towards flooding rather than drying, which is consistent with the sharp drop in ET over the course of the July progressive drought (Figs. 2, 3).
The greater ET sensitivity compared to GPP resulted in enhanced daily EWUE (+38 %, Fig. 9) over May–September. An elevated EWUE during drought has been previously reported, for example, for a boreal aspen stand in Canada (Krishnan et al., 2006) and a mixed deciduous forest in Switzerland (Wolf et al., 2013). However, responses appear to be species- and site-dependent; for example, no change in EWUE was observed in a Finnish forest under low rainfall conditions (Ge et al., 2014), while a decline in EWUE was reported for a pine forest in Finland under severe drought stress (Gao et al., 2017).
Although daily EWUE declined during progressive drought in July, VPD-normalised EWUE remained elevated throughout the drought, indicating that high atmospheric demand combined with soil moisture limitation drove the observed water use efficiency dynamics. Similar increases in VPD-normalised EWUE under moderate drought have been reported across forest and grassland ecosystems (Beer et al., 2009).
Interestingly, ER resistance was nearly twice as low as that of GPP (Fig. 9), pointing to a strong drought impact on soil microbial and root respiration. This reduction in ER effectively lengthened the period of ecosystem net carbon uptake and, combined with the favourable early-season conditions in May, resulted in the highest annual net carbon uptake of the three study years.
4.5 Drought recovery and carry-over effects
Drought can influence ecosystem functioning well beyond the event itself, with lagged effects persisting for years after water stress has ended (Kannenberg et al., 2020). In forests, such “drought legacy effects” are common and often span three to four years (Anderegg et al., 2015). They could be caused by the carbon depletion due to reduced uptake during the drought (Bréda et al., 2006; McDowell et al., 2008), the cost of repairing hydraulic damage (Anderegg et al., 2015; Kannenberg et al., 2019), changes in the nutrient cycle (Houle et al., 2016; Schlesinger et al., 2016), or from shifts in carbon allocation towards root development or canopy restoration (Arain et al., 2022; Doughty et al., 2014; Hikino et al., 2022), all of which can constrain subsequent tree growth and ecosystem functioning.
Although our study period was too short to assess long-term drought legacies, it allowed us to evaluate recovery and possible carry-over effects in the year following the 2018 drought. In 2019, GPP, ER, and ET reached their highest values of the three study years, both annually and over the active season (Table 1). Recovery and resilience indices indicated full recovery of all fluxes, with daily active-season ET and T even exceeding that of the reference year (Fig. 9).
While soil moisture was declining over the recovery year summer, the evenly distributed precipitation kept the favourable soil saturation rates over all months, contributing to the ecosystem recovery (Fig. 2). Soil water depletion in riparian systems can vary considerably depending on groundwater connectivity, precipitation patterns, and vegetation water use (Capon et al., 2013). In systems with strong hydrological connectivity to groundwater, depletion may be minor; however, under drought conditions or in systems with limited lateral or vertical recharge, significant drawdown can occur (Rohde et al., 2021; Rood et al., 2008). At our site, in the absence of runoff or drainage measurements, we cannot fully quantify the water balance, and our interpretation of groundwater connectivity remains speculative.
The nearly 30 % increase in annual ER in 2019 relative to the pre-drought year, and 55 % relative to 2018, likely reflected a combination of higher spring temperatures in the recovery year and a pronounced June–July peak in ERref, which cannot be explained by temperature alone (Fig. 4a). This interpretation is supported by the absence of differences in active-season daily ER between 2017 and 2019 when modelled using each other's temperature response parameters (Fig. 8d–e). Similarly, the resilience index of ER and ERref indicated a full rebound (Fig. 9). The suppressed ER observed during the 2018 drought may have led to the temporary accumulation of labile carbon within the ecosystem, providing a larger pool of carbon that could be available for subsequent physiological activity or decomposition. An increase in ecosystem respiration in the year following the drought was also observed in a beech forest in Denmark (Pilegaard and Ibrom, 2020), attributed to accumulated soil organic matter following suppressed heterotrophic respiration during the drought and autumn months, and for a ponderosa pine forest in the USA (Thomas et al., 2009), where the effect was linked to enhanced litter decomposition.
Likewise, the increase in GPP, though less pronounced than in ER, was caused by a combination of vegetation activity and meteorological conditions. In 2019, elevated temperatures and higher radiation compared to 2017 advanced the onset of the growing season. Enhanced GPPsat suggests that optimal temperature and VPD, rather than light, were the main drivers at that stage. Later in the season, GPPsat was lower than in 2017, yet cross-year modelled values converged, particularly in August (Fig. 8a), pointing to lower radiation as the primary carbon uptake constraint. As with ER, both GPPsat and GPP demonstrated full recovery (Fig. 9).
While transpiration and photosynthesis recovered, stomatal conductance did not fully return to the pre-drought level (Rs = 0.88), indicating that subtle physiological constraints persisted despite overall functional recovery, potentially limiting tolerance to future droughts. However, as these indices are based on a single pre-drought reference year, interannual variability in meteorological conditions may bias interpretation. Favourable conditions in 2019, including evenly distributed precipitation and a warm growing season, likely facilitated the rapid recovery, consistent with observations across diverse ecosystems (Schwalm et al., 2017).
In contrast, strong legacy effects on the carbon cycle have been observed following the 2018 drought in other European forests. For example, in a mixed deciduous forest in central Germany, NEP declined by 150 g C m−2 yr−1 in 2019, with reductions in both GPP (−281 g C m−2 yr−1) and ER (−132 g C m−2 yr−1) compared to the previous year (Pohl et al., 2023). European beech forests have exhibited particularly high sensitivity to drought, with observed tree mortality linked to hydraulic failure (Schuldt et al., 2020). More broadly, drought-induced tree mortality can have long-lasting consequences, with post-drought effects often persisting for months or years (Brodribb et al., 2020; Schwalm et al., 2017). Drought-related growth decline and canopy dieback have also been documented in various riparian trees (Kibler et al., 2021; Schnabel et al., 2022; Singer et al., 2013; Stella et al., 2013; Valor et al., 2020). Our site provided no visual or numerical evidence of increased tree mortality in the year following the drought. However, given that drought-induced mortality can manifest with a delay, it remains possible that long-term effects could emerge beyond the period of our study. Future monitoring would be critical to assessing whether the observed recovery is sustained or whether cumulative drought stress could compromise forest resilience over time.
The mature riparian grey alder forest under study remained a strong and consistent net carbon sink over three years with contrasting soil moisture conditions. While GPP was comparable to that of similar ecosystems, ER was generally lower, likely due to dense, poorly aerated soils and periodic flooding.
Moderate soil water saturation ratio (40 %–50 %) enhanced ecosystem fluxes, with flux rates generally persisting even at higher saturation levels. In contrast, the 2018 progressive drought mildly reduced GPP and, to a much greater extent, ER, while also suppressing ET. High EWUE and reduced Gc during the drought indicate stomatal regulation that minimised water loss while maintaining carbon uptake. The co-occurrence of elevated temperatures (driving high VPD) and prolonged dry spells (causing progressive drought) in 2018 was particularly detrimental, with the canopy conductance suppression primarily driven by elevated VPD, while soil moisture variation played a larger role in the other two years.
In the year following the drought, the forest exhibited an overall recovery, supported by high, but not extreme, temperatures and evenly distributed precipitation. The intermediate cumulative NEE was a result of elevated ER in spring to early summer, likely due to decomposition of residual organic matter from the preceding year. GPP also increased, although to a lesser extent, with canopy conductance remaining partially suppressed, suggesting a potential vulnerability to multi-year drought events.
Overall, our results demonstrate that this mature alder forest maintained both productivity and resilience following the 2018 drought, with only partial suppression of canopy conductance, highlighting the stability of this ecosystem under variable hydroclimatic conditions.
To assess the performance and consistency of turbulent energy flux measurements, we evaluated the energy balance closure (EBC) on a daily timescale for June-August of each study year (2017–2019). The turbulent fluxes were defined as the sum of latent (LE) and sensible (H) heat fluxes measured using the eddy covariance system. Since the components of available energy, net radiation (Rn) and ground heat flux (G), were not measured at our site, we used the following approach.
Rn was approximated using measured incoming shortwave radiation (Rg) and daily albedo values:
where α is surface albedo and Rg is daily incoming shortwave radiation in MJ m−2 d−1.
Rg was measured at the site, and daily albedo values were derived from MODIS (MCD43A3 v061), (Schaaf and Wang, 2021) using Google Earth Engine. Extracted albedo values were averaged black-sky and white-sky shortwave albedo components to approximate actual albedo under mixed sky conditions. The data were quality-controlled using MODIS-provided QA flags and seasonally averaged, resulting in mean albedo values of 0.161 ± 0.009, 0.154 ± 0.007 and 0.151 ± 0.007 in 2017, 2018 and 2019, respectively.
G was estimated as 5 % of Rn, following common practice for forest soils. We acknowledge that this approximation may slightly overestimate G under certain soil and moisture conditions but provides a reasonable estimate for comparative purposes. Only daytime (Rg > 15 W m−2) half-hourly records were included in the daily energy sums to ensure that energy components reflected active turbulent exchange.
While this approach is limited by the absence of direct measurements of Rn and G, it still provides a consistent method for comparing EBC across years. Since longwave radiation was not accounted for, the available energy may be slightly overestimated. Therefore, the true energy balance closure at the site is expected to be slightly higher than reported. Despite these limitations, and although the EBC values are on the lower end, they fall within the expected range for forested ecosystems. Moreover, the similar closure observed in 2017 and 2018 supports the interpretation that reduced evapotranspiration (ET) in the drought year (2018) was not driven by lower EBC but likely reflects actual physiological or environmental responses.
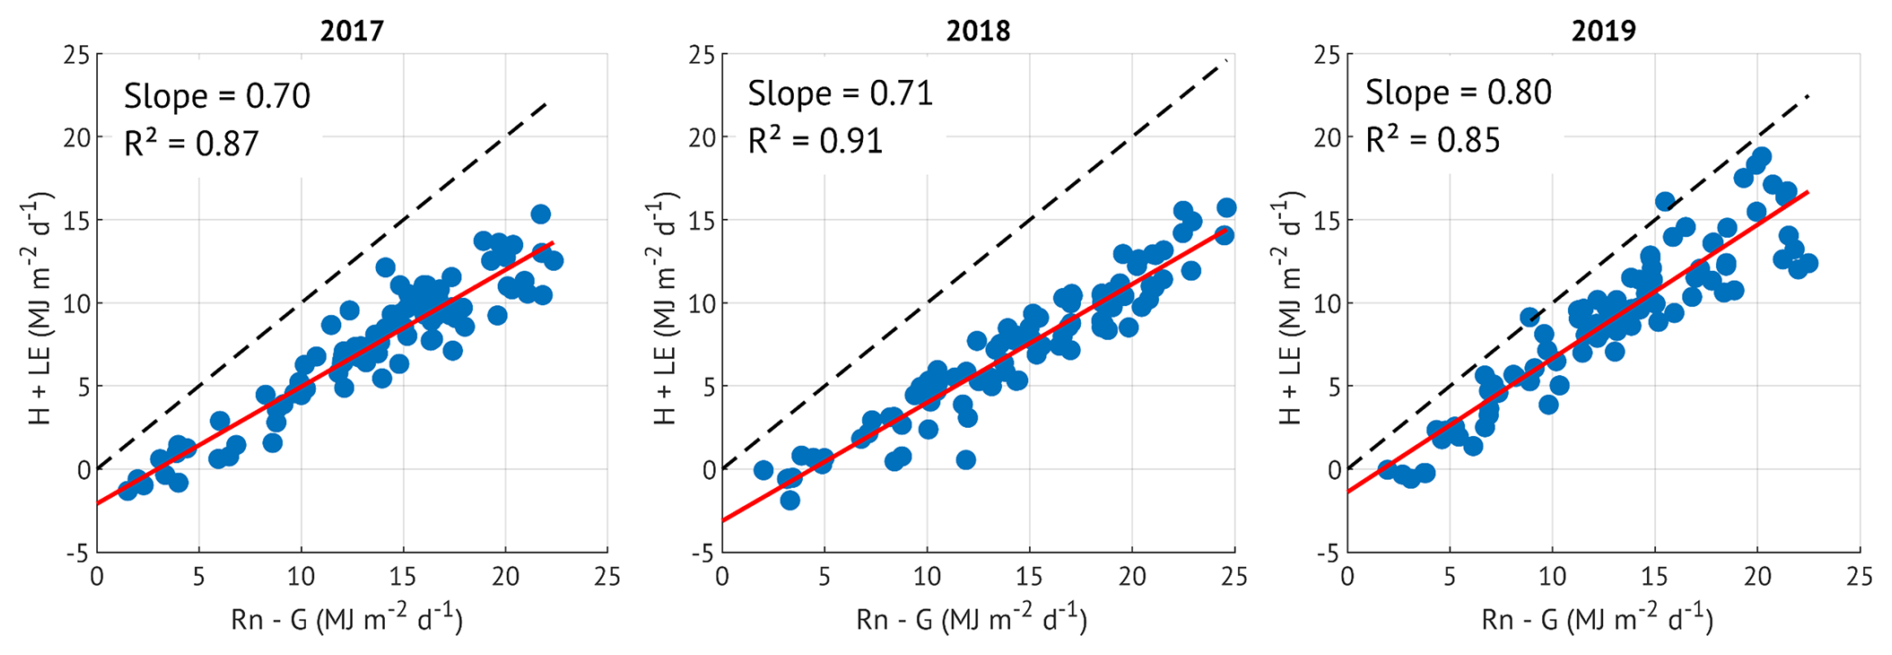
Figure A1Energy balance closure in June-August of the three study years. Available energy is represented by net radiation (Rn) minus soil heat flux (G), turbulent energy is a sum of sensible (H) and latent heat (LE) fluxes, all aggregated over daytime periods (Rg > 15 W m−2). The energy balance closure is expressed as the slope of the least squares regression, shown in red colour in each panel. The dashed lines are 1:1.
Table B1Parameters of Oren et al. (1999) canopy conductance sensitivity model.
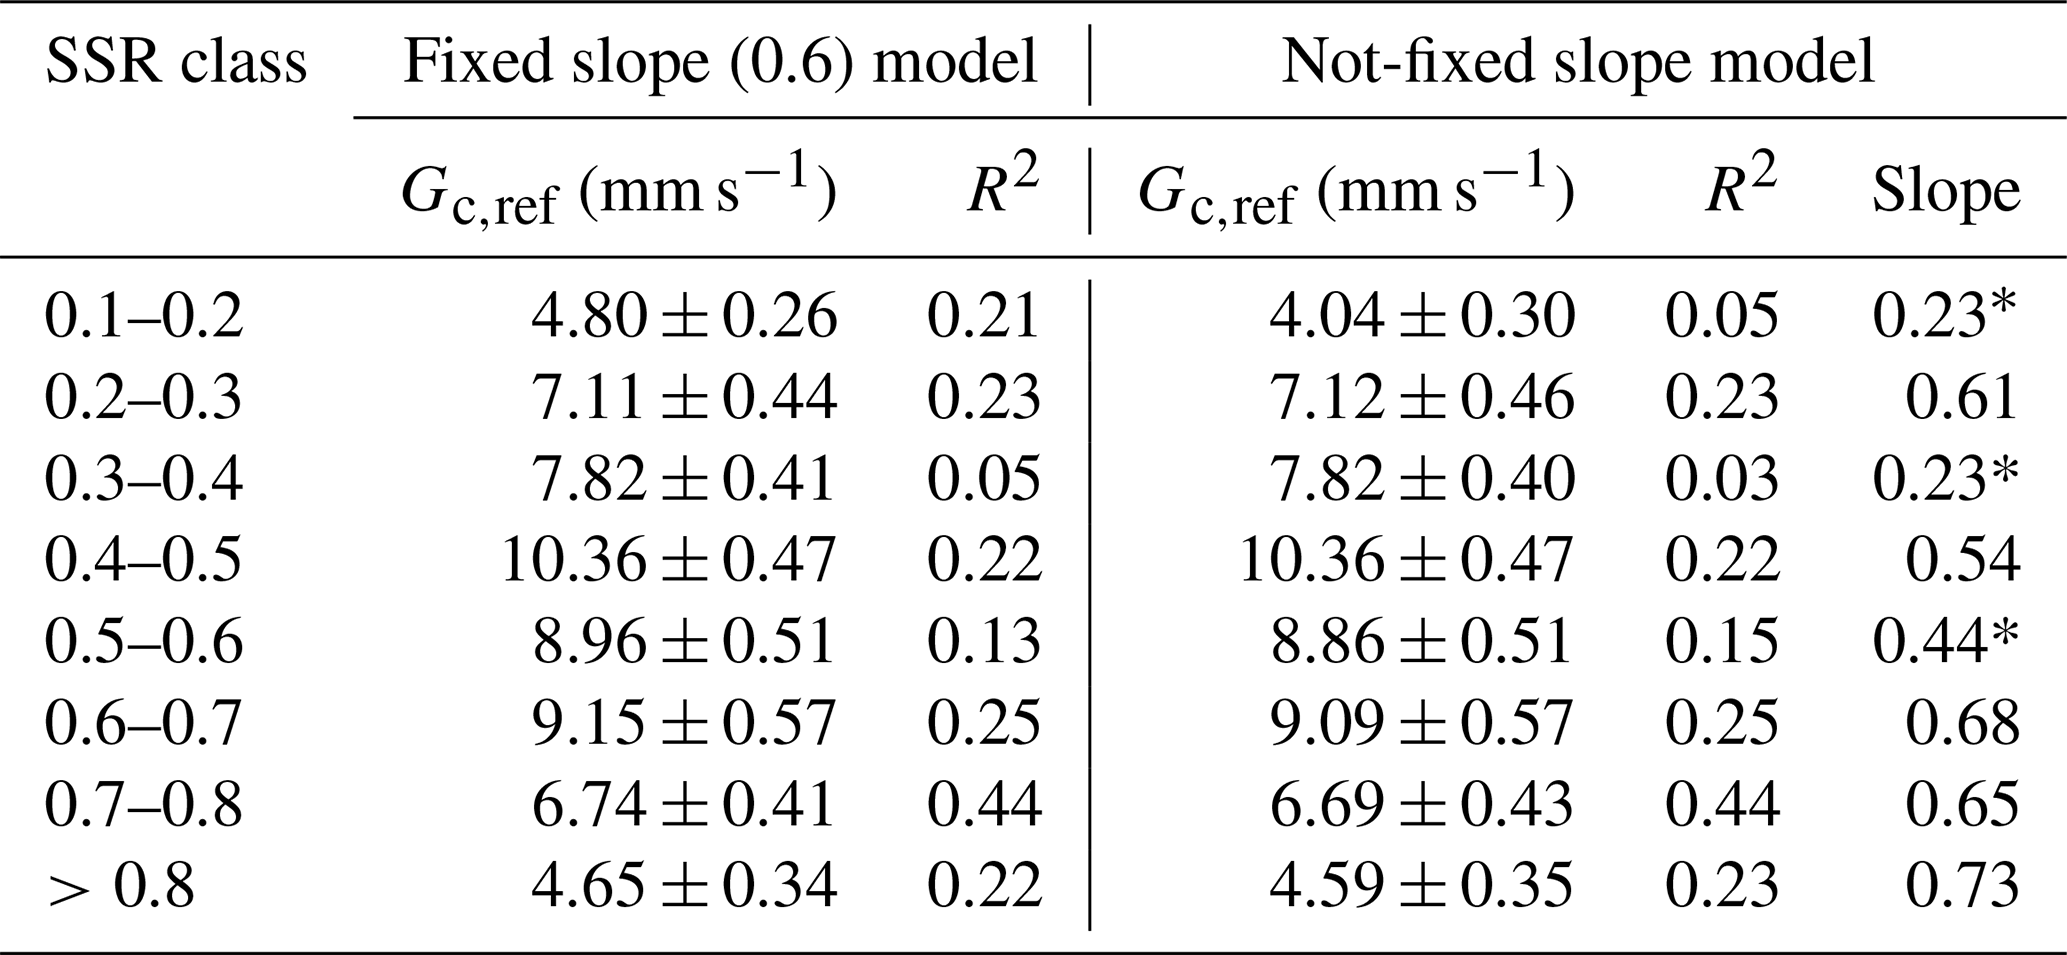
* Soil saturation ratio (SSR) classes, with a low slope corresponding to the low quality of the fit.
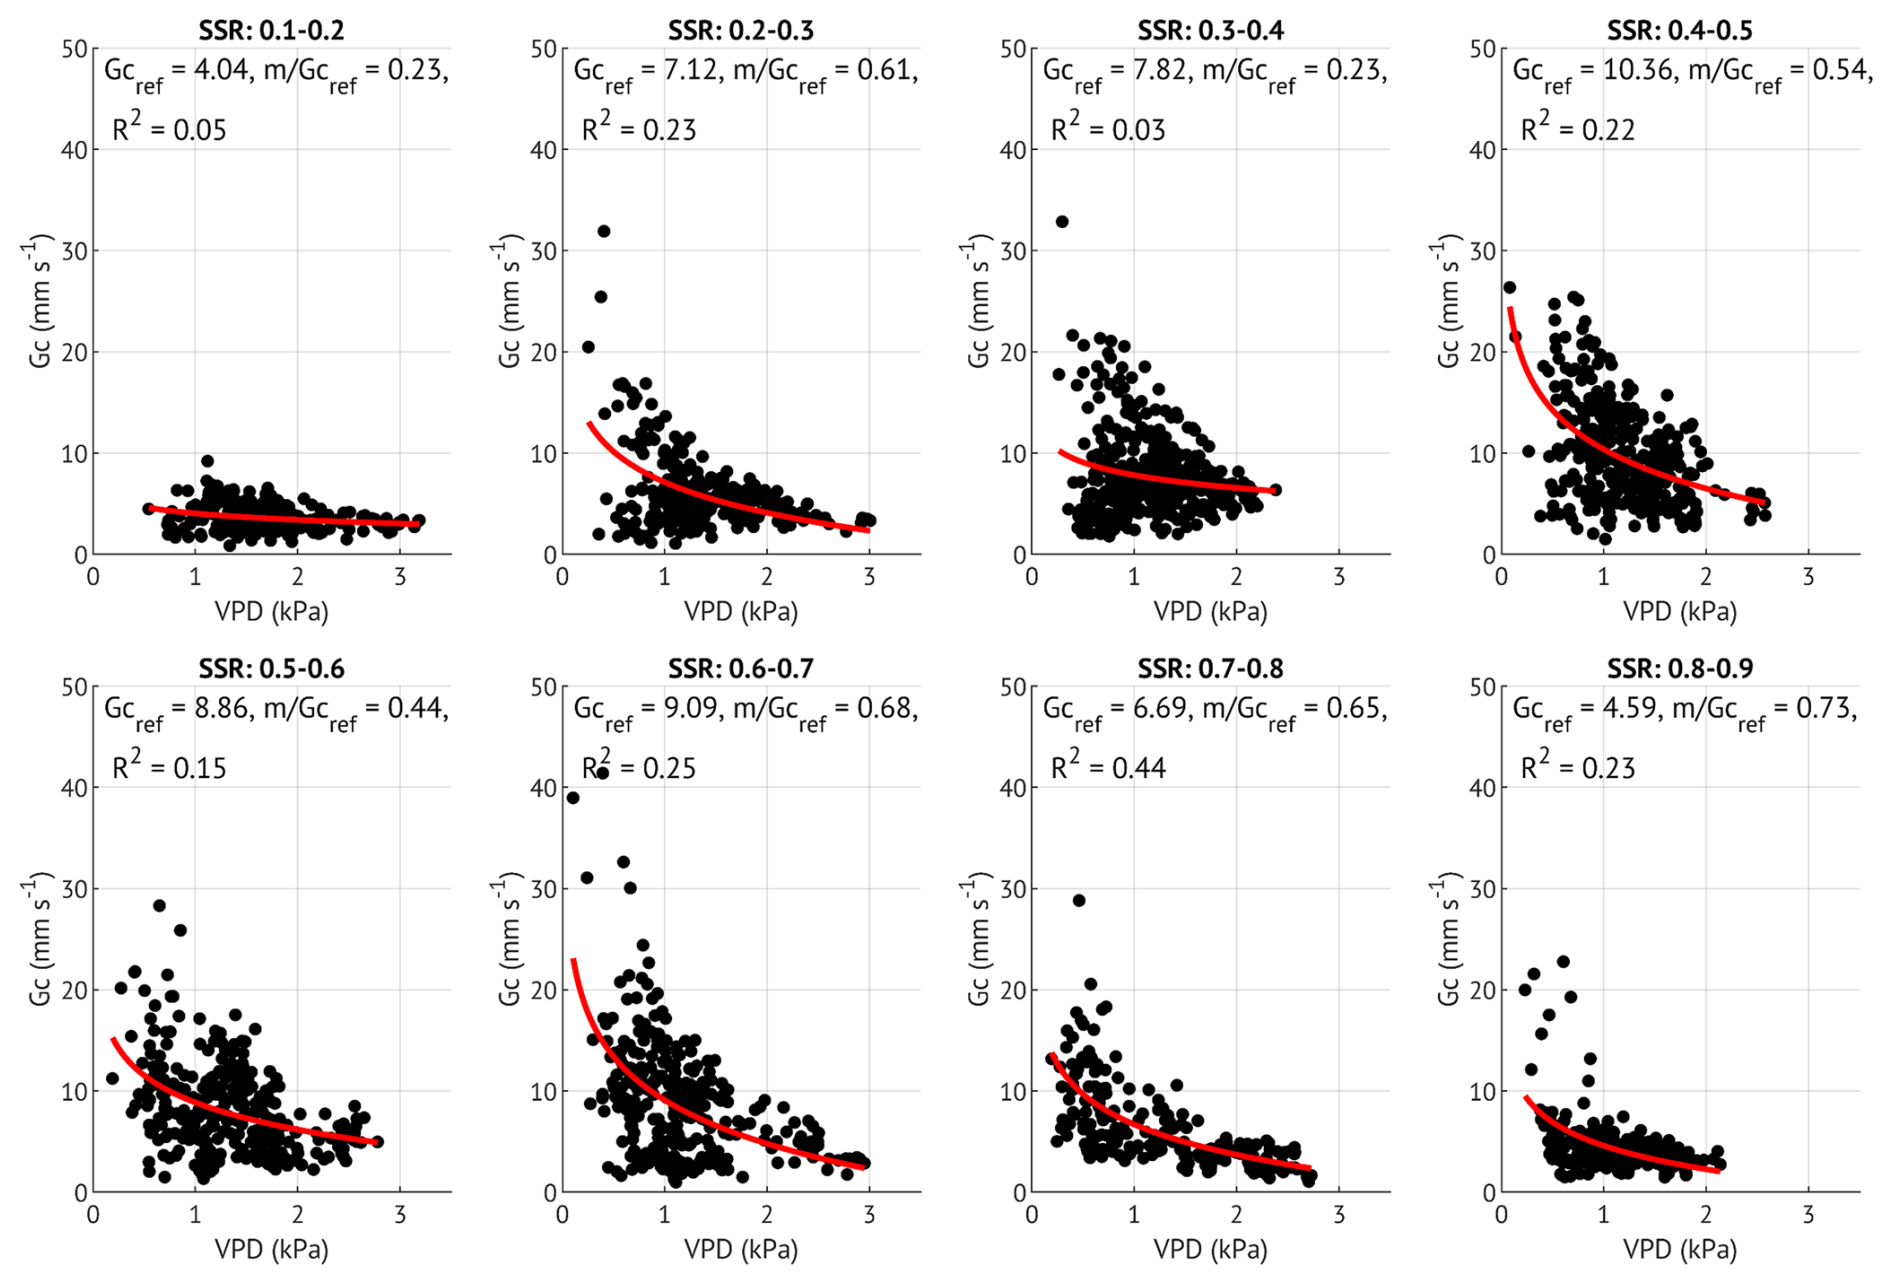
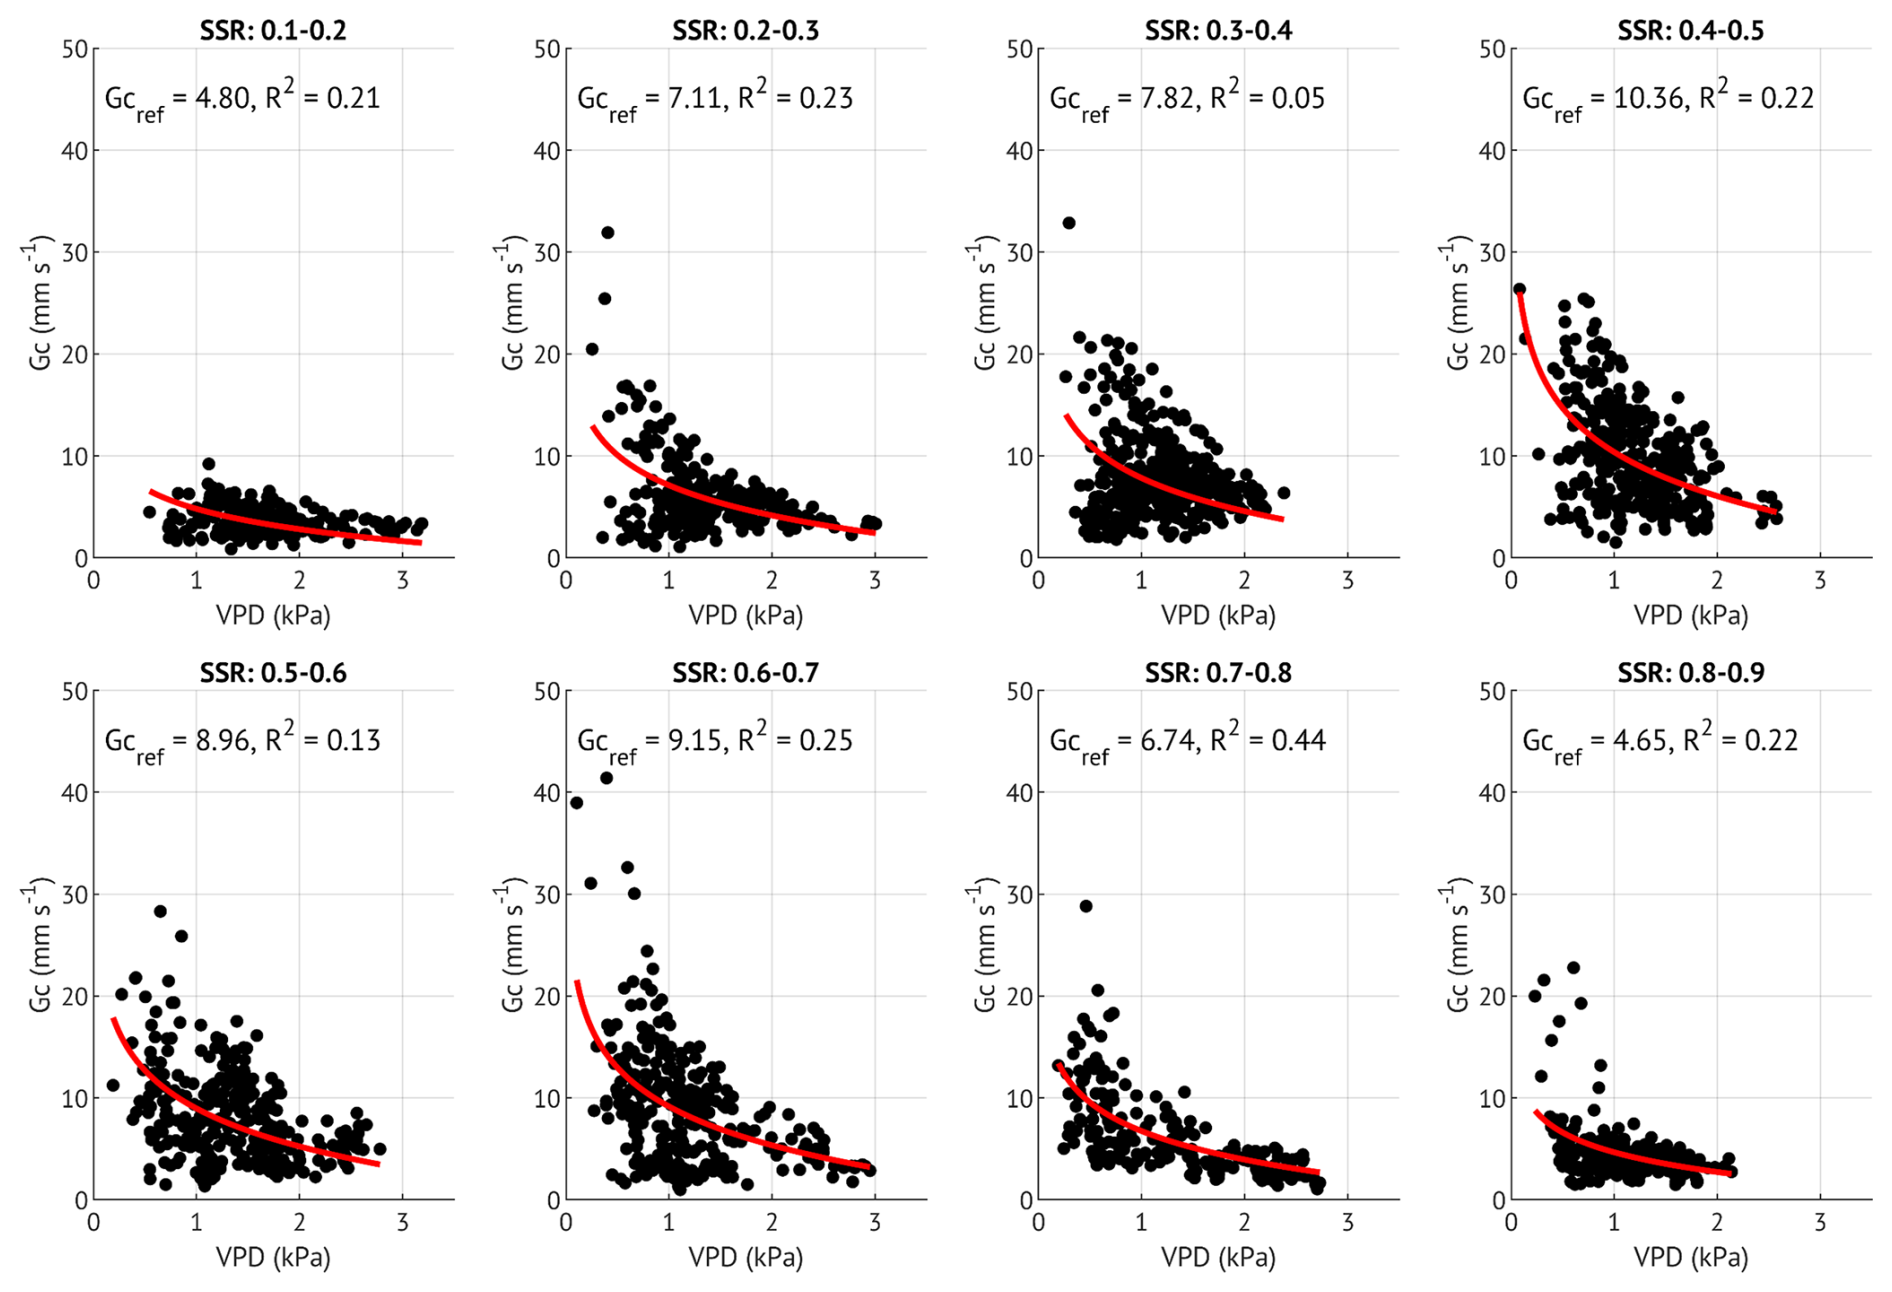
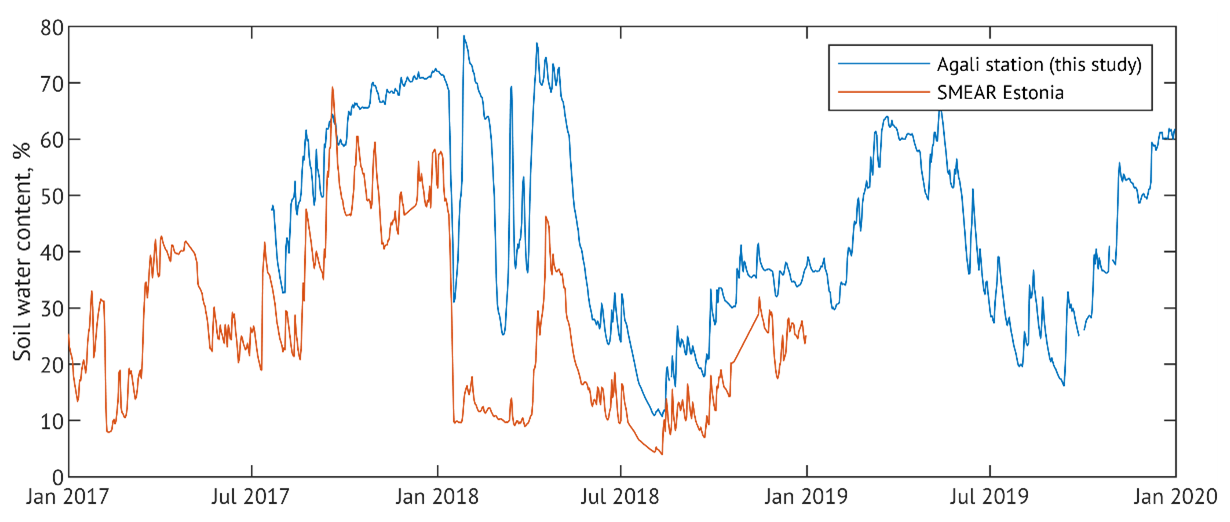
Table C1Soil physical-chemical properties of the study site. Mean and standard error values (in parentheses). DM – dry matter, SOM – soil organic matter, TC – total carbon, TN – total nitrogen.

For comparison with eddy-covariance estimates, net ecosystem exchange (NEE) from the biometric, inventory-based carbon budget was obtained as the negative of net ecosystem production (NEP):
Gross primary production (GPP) and total ecosystem respiration (ER) were derived from annual net primary production (NPP) and heterotrophic respiration (Rh) estimates using a fixed autotrophic respiration fraction. Autotrophic respiration (Ra) was assumed to represent 57 % of GPP, following the synthesis of boreal and temperate forest carbon budgets by Lindroth et al. (2020). Under this assumption, NPP can be expressed as:
where a is the fractional contribution of autotrophic respiration to GPP (here a=0.57). GPP was therefore calculated as:
Autotrophic respiration was then obtained as:
Total ecosystem respiration was computed as:
NEP from the carbon budget was then used as a consistency check:
Table E1The annual balance of the alder forest in 2018 and 2019 expressed in CO2 eq. (GWP100 = 1 for CO2, GWP100 = 27.9 for CH4 and GWP100 = 273 for N2O; IPCC, 2021).
The data are available upon request from the authors.
Article conceptualization was done by AK; data calculation and processing were performed by AK with valuable input from SR and DK; KS and ÜM acquired the funding and managed the Agali site; AK prepared the figures and wrote the article with editorial contributions from all authors.
The contact author has declared that none of the authors has any competing interests.
Publisher's note: Copernicus Publications remains neutral with regard to jurisdictional claims made in the text, published maps, institutional affiliations, or any other geographical representation in this paper. While Copernicus Publications makes every effort to include appropriate place names, the final responsibility lies with the authors. Views expressed in the text are those of the authors and do not necessarily reflect the views of the publisher.
The authors would like to thank Anonymous Reviewer #1 and Samuli Launiainen for their valuable suggestions, which allowed us to improve the study significantly. The research was supported by the Estonian Research Council projects IUT2-16, PRG-352 and PRG2032, the European Union Horizon programme under grant agreement No 101079192, and the European Research Council (ERC) under grant agreements No. 101096403 and No. 101160308.
The research was supported by the Estonian Research Council projects IUT2-16, PRG-352 and PRG2032, the European Union Horizon programme under grant agreement No 101079192, and the European Research Council (ERC) under grant agreements No 101096403 and No 101160308.
This paper was edited by Gabriel Singer and reviewed by Samuli Launiainen and one anonymous referee.
Allen, C. D., Macalady, A. K., Chenchouni, H., Bachelet, D., McDowell, N., Vennetier, M., Kitzberger, T., Rigling, A., Breshears, D. D., Hogg, E. H. (Ted), Gonzalez, P., Fensham, R., Zhang, Z., Castro, J., Demidova, N., Lim, J.-H., Allard, G., Running, S. W., Semerci, A., and Cobb, N.: A global overview of drought and heat-induced tree mortality reveals emerging climate change risks for forests, For. Ecol. Manag., 259, 660–684, https://doi.org/10.1016/j.foreco.2009.09.001, 2010.
Allen, R. G., Pereira, L. S., Raes, D., and Smith, M.: Crop evapotranspiration: guidelines for computing crop water requirements, Food and Agriculture Organization of the United Nations, Rome, 300 pp., ISBN 92-5-104219-5, 1998.
Amiro, B.: Measuring boreal forest evapotranspiration using the energy balance residual, J. Hydrol., 366, 112–118, https://doi.org/10.1016/j.jhydrol.2008.12.021, 2009.
Anderegg, W. R. L., Schwalm, C., Biondi, F., Camarero, J. J., Koch, G., Litvak, M., Ogle, K., Shaw, J. D., Shevliakova, E., Williams, A. P., Wolf, A., Ziaco, E., and Pacala, S.: Pervasive drought legacies in forest ecosystems and their implications for carbon cycle models, Science, 349, 528–532, https://doi.org/10.1126/science.aab1833, 2015.
Angert, A., Biraud, S., Bonfils, C., Henning, C. C., Buermann, W., Pinzon, J., Tucker, C. J., and Fung, I.: Drier summers cancel out the CO2 uptake enhancement induced by warmer springs, Proc. Natl. Acad. Sci., 102, 10823–10827, https://doi.org/10.1073/pnas.0501647102, 2005.
Aosaar, J., Varik, M., and Uri, V.: Biomass production potential of grey alder (Alnus incana (L.) Moench.) in Scandinavia and Eastern Europe: A review, Biomass Bioenergy, 45, 11–26, https://doi.org/10.1016/j.biombioe.2012.05.013, 2012.
Arain, M. A., Xu, B., Brodeur, J. J., Khomik, M., Peichl, M., Beamesderfer, E., Restrepo-Couple, N., and Thorne, R.: Heat and drought impact on carbon exchange in an age-sequence of temperate pine forests, Ecol. Process., 11, 7, https://doi.org/10.1186/s13717-021-00349-7, 2022.
Aubinet, M., Vesala, T., and Papale, D. (Eds.): Eddy covariance: A practical guide to measurement and data analysis, Springer Netherlands, Dordrecht, https://doi.org/10.1007/978-94-007-2351-1, 2012.
Baldocchi, D.: Measuring fluxes of trace gases and energy between ecosystems and the atmosphere – the state and future of the eddy covariance method, Glob. Change Biol., 20, 3600–3609, https://doi.org/10.1111/gcb.12649, 2014.
Bastos, A., Ciais, P., Friedlingstein, P., Sitch, S., Pongratz, J., Fan, L., Wigneron, J. P., Weber, U., Reichstein, M., Fu, Z., Anthoni, P., Arneth, A., Haverd, V., Jain, A. K., Joetzjer, E., Knauer, J., Lienert, S., Loughran, T., McGuire, P. C., Tian, H., Viovy, N., and Zaehle, S.: Direct and seasonal legacy effects of the 2018 heat wave and drought on European ecosystem productivity, Sci. Adv., 6, eaba2724, https://doi.org/10.1126/sciadv.aba2724, 2020.
Beamesderfer, E. R., Arain, M. A., Khomik, M., and Brodeur, J. J.: The impact of seasonal and annual climate variations on the carbon uptake capacity of a deciduous forest within the great lakes region of Canada, Journal of Geophysical Research: Biogeosciences, 125, e2019JG005389, https://doi.org/10.1029/2019JG005389, 2020.
Beer, C., Ciais, P., Reichstein, M., Baldocchi, D., Law, B. E., Papale, D., Soussana, J.-F., Ammann, C., Buchmann, N., Frank, D., Gianelle, D., Janssens, I. A., Knohl, A., Köstner, B., Moors, E., Roupsard, O., Verbeeck, H., Vesala, T., Williams, C. A., and Wohlfahrt, G.: Temporal and among-site variability of inherent water use efficiency at the ecosystem level, Glob. Biogeochem. Cycles, 23, https://doi.org/10.1029/2008GB003233, 2009.
Benson, D. R.: Isolation of frankia strains from alder actinorhizal root nodules, Appl. Environ. Microbiol., 44, 461–465, https://doi.org/10.1128/aem.44.2.461-465.1982, 1982.
Boese, S., Jung, M., Carvalhais, N., Teuling, A. J., and Reichstein, M.: Carbon–water flux coupling under progressive drought, Biogeosciences, 16, 2557–2572, https://doi.org/10.5194/bg-16-2557-2019, 2019.
Bonan, G. B.: Forests and climate change: forcings, feedbacks, and the climate benefits of forests, Science, 320, 1444–1449, https://doi.org/10.1126/science.1155121, 2008.
Bréda, N., Huc, R., Granier, A., and Dreyer, E.: Temperate forest trees and stands under severe drought: a review of ecophysiological responses, adaptation processes and long-term consequences, Ann. For. Sci., 63, 625–644, https://doi.org/10.1051/forest:2006042, 2006.
Breshears, D. D., Cobb, N. S., Rich, P. M., Price, K. P., Allen, C. D., Balice, R. G., Romme, W. H., Kastens, J. H., Floyd, M. L., Belnap, J., Anderson, J. J., Myers, O. B., and Meyer, C. W.: Regional vegetation die-off in response to global-change-type drought, Proc. Natl. Acad. Sci., 102, 15144–15148, https://doi.org/10.1073/pnas.0505734102, 2005.
Brodribb, T. J., Powers, J., Cochard, H., and Choat, B.: Hanging by a thread? Forests and drought, Science, 368, 261–266, https://doi.org/10.1126/science.aat7631, 2020.
Brümmer, C., Black, T. A., Jassal, R. S., Grant, N. J., Spittlehouse, D. L., Chen, B., Nesic, Z., Amiro, B. D., Arain, M. A., Barr, A. G., Bourque, C. P.-A., Coursolle, C., Dunn, A. L., Flanagan, L. B., Humphreys, E. R., Lafleur, P. M., Margolis, H. A., McCaughey, J. H., and Wofsy, S. C.: How climate and vegetation type influence evapotranspiration and water use efficiency in Canadian forest, peatland and grassland ecosystems, Agric. For. Meteorol., 153, 14–30, https://doi.org/10.1016/j.agrformet.2011.04.008, 2012.
Buras, A., Rammig, A., and Zang, C. S.: Quantifying impacts of the 2018 drought on European ecosystems in comparison to 2003, Biogeosciences, 17, 1655–1672, https://doi.org/10.5194/bg-17-1655-2020, 2020.
Butterbach-Bahl, K., Baggs, E. M., Dannenmann, M., Kiese, R., and Zechmeister-Boltenstern, S.: Nitrous oxide emissions from soils: how well do we understand the processes and their controls?, Philos. Trans. R. Soc. B Biol. Sci., 368, 20130122, https://doi.org/10.1098/rstb.2013.0122, 2013.
Capon, S. J., Chambers, L. E., Mac Nally, R., Naiman, R. J., Davies, P., Marshall, N., Pittock, J., Reid, M., Capon, T., Douglas, M., Catford, J., Baldwin, D. S., Stewardson, M., Roberts, J., Parsons, M., and Williams, S. E.: Riparian ecosystems in the 21st century: Hotspots for climate change adaptation?, Ecosystems, 16, 359–381, https://doi.org/10.1007/s10021-013-9656-1, 2013.
Caudullo, G., Welk, E., and San-Miguel-Ayanz, J.: Chorological maps for the main European woody species, Data Brief, 12, 662–666, https://doi.org/10.1016/j.dib.2017.05.007, 2017.
Cavin, L., Mountford, E. P., Peterken, G. F., and Jump, A. S.: Extreme drought alters competitive dominance within and between tree species in a mixed forest stand, Funct. Ecol., 27, 1424–1435, https://doi.org/10.1111/1365-2435.12126, 2013.
Chen, L., Keski-Saari, S., Kontunen-Soppela, S., Zhu, X., Zhou, X., Hänninen, H., Pumpanen, J., Mola-Yudego, B., Wu, D., and Berninger, F.: Immediate and carry-over effects of late-spring frost and growing season drought on forest gross primary productivity capacity in the Northern Hemisphere, Glob. Change Biol., https://doi.org/10.1111/gcb.16751, 2023.
Chi, J., Nilsson, M. B., Kljun, N., Wallerman, J., Fransson, J. E. S., Laudon, H., Lundmark, T., and Peichl, M.: The carbon balance of a managed boreal landscape measured from a tall tower in northern Sweden, Agric. For. Meteorol., 274, 29–41, https://doi.org/10.1016/j.agrformet.2019.04.010, 2019.
Davidson, E. A., Keller, M., Erickson, H. E., Verchot, L. V., and Veldkamp, E.: Testing a Conceptual Model of Soil Emissions of Nitrous and Nitric Oxides, BioScience, 50, 667–680, https://doi.org/10.1641/0006-3568(2000)050[0667:TACMOS]2.0.CO;2, 2000.
Dlugokencky, E. J., Nisbet, E. G., Fisher, R., and Lowry, D.: Global atmospheric methane: budget, changes and dangers, Philos. Trans. R. Soc. Math. Phys. Eng. Sci., 369, 2058–2072, https://doi.org/10.1098/rsta.2010.0341, 2011.
Doughty, C. E., Malhi, Y., Araujo-Murakami, A., Metcalfe, D. B., Silva-Espejo, J. E., Arroyo, L., Heredia, J. P., Pardo-Toledo, E., Mendizabal, L. M., Rojas-Landivar, V. D., Vega-Martinez, M., Flores-Valencia, M., Sibler-Rivero, R., Moreno-Vare, L., Viscarra, L. J., Chuviru-Castro, T., Osinaga-Becerra, M., and Ledezma, R.: Allocation trade-offs dominate the response of tropical forest growth to seasonal and interannual drought, Ecology, 95, 2192–2201, https://doi.org/10.1890/13-1507.1, 2014.
Dybala, K. E., Matzek, V., Gardali, T., and Seavy, N. E.: Carbon sequestration in riparian forests: A global synthesis and meta-analysis, Glob. Change Biol., 25, 57–67, https://doi.org/10.1111/gcb.14475, 2019.
Eschenbach, C. and Kappen, L.: Leaf water relations of black alder [Alnus glutinosa (L.) Gaertn.] growing at neighbouring sites with different water regimes, Trees, 14, 28–38, https://doi.org/10.1007/s004680050004, 1999.
Farquhar, G. D. and Sharkey, T. D.: Stomatal conductance and photosynthesis, Annu. Rev. Plant Physiol., 33, 317–345, https://doi.org/10.1146/annurev.pp.33.060182.001533, 1982.
Feng, H., Guo, J., Han, M., Wang, W., Peng, C., Jin, J., Song, X., and Yu, S.: A review of the mechanisms and controlling factors of methane dynamics in forest ecosystems, For. Ecol. Manag., 455, 117702, https://doi.org/10.1016/j.foreco.2019.117702, 2020.
Fischer, E. M., Sippel, S., and Knutti, R.: Increasing probability of record-shattering climate extremes, Nat. Clim. Chang., 11, 689–695, https://doi.org/10.1038/s41558-021-01092-9, 2021.
Fisher, J. B., Melton, F., Middleton, E., Hain, C., Anderson, M., Allen, R., McCabe, M. F., Hook, S., Baldocchi, D., Townsend, P. A., Kilic, A., Tu, K., Miralles, D. D., Perret, J., Lagouarde, J.-P., Waliser, D., Purdy, A. J., French, A., Schimel, D., Famiglietti, J. S., Stephens, G., and Wood, E. F.: The future of evapotranspiration: Global requirements for ecosystem functioning, carbon and climate feedbacks, agricultural management, and water resources, Water Resour. Res., 53, 2618–2626, https://doi.org/10.1002/2016WR020175, 2017.
Flanagan, L. B., Nikkel, D. J., Scherloski, L. M., Tkach, R. E., Smits, K. M., Selinger, L. B., and Rood, S. B.: Multiple processes contribute to methane emission in a riparian cottonwood forest ecosystem, New Phytol., 229, 1970–1982, https://doi.org/10.1111/nph.16977, 2021.
Fleischer, K., Rebel, K. T., van der Molen, M. K., Erisman, J. W., Wassen, M. J., van Loon, E. E., Montagnani, L., Gough, C. M., Herbst, M., Janssens, I. A., Gianelle, D., and Dolman, A. J.: The contribution of nitrogen deposition to the photosynthetic capacity of forests, Glob. Biogeochem. Cycles, 27, 187–199, https://doi.org/10.1002/gbc.20026, 2013.
Foken, T.: The energy balance closure problem: an overview, Ecol. Appl., 18, 1351–1367, https://doi.org/10.1890/06-0922.1, 2008.
Friedlingstein, P., O'Sullivan, M., Jones, M. W., Andrew, R. M., Gregor, L., Hauck, J., Le Quéré, C., Luijkx, I. T., Olsen, A., Peters, G. P., Peters, W., Pongratz, J., Schwingshackl, C., Sitch, S., Canadell, J. G., Ciais, P., Jackson, R. B., Alin, S. R., Alkama, R., Arneth, A., Arora, V. K., Bates, N. R., Becker, M., Bellouin, N., Bittig, H. C., Bopp, L., Chevallier, F., Chini, L. P., Cronin, M., Evans, W., Falk, S., Feely, R. A., Gasser, T., Gehlen, M., Gkritzalis, T., Gloege, L., Grassi, G., Gruber, N., Gürses, Ö., Harris, I., Hefner, M., Houghton, R. A., Hurtt, G. C., Iida, Y., Ilyina, T., Jain, A. K., Jersild, A., Kadono, K., Kato, E., Kennedy, D., Klein Goldewijk, K., Knauer, J., Korsbakken, J. I., Landschützer, P., Lefèvre, N., Lindsay, K., Liu, J., Liu, Z., Marland, G., Mayot, N., McGrath, M. J., Metzl, N., Monacci, N. M., Munro, D. R., Nakaoka, S.-I., Niwa, Y., O'Brien, K., Ono, T., Palmer, P. I., Pan, N., Pierrot, D., Pocock, K., Poulter, B., Resplandy, L., Robertson, E., Rödenbeck, C., Rodriguez, C., Rosan, T. M., Schwinger, J., Séférian, R., Shutler, J. D., Skjelvan, I., Steinhoff, T., Sun, Q., Sutton, A. J., Sweeney, C., Takao, S., Tanhua, T., Tans, P. P., Tian, X., Tian, H., Tilbrook, B., Tsujino, H., Tubiello, F., van der Werf, G. R., Walker, A. P., Wanninkhof, R., Whitehead, C., Willstrand Wranne, A., Wright, R., Yuan, W., Yue, C., Yue, X., Zaehle, S., Zeng, J., and Zheng, B.: Global Carbon Budget 2022, Earth Syst. Sci. Data, 14, 4811–4900, https://doi.org/10.5194/essd-14-4811-2022, 2022.
Fu, Z., Ciais, P., Bastos, A., Stoy, P. C., Yang, H., Green, J. K., Wang, B., Yu, K., Huang, Y., Knohl, A., Šigut, L., Gharun, M., Cuntz, M., Arriga, N., Roland, M., Peichl, M., Migliavacca, M., Cremonese, E., Varlagin, A., Brümmer, C., Gourlez de la Motte, L., Fares, S., Buchmann, N., El-Madany, T. S., Pitacco, A., Vendrame, N., Li, Z., Vincke, C., Magliulo, E., and Koebsch, F.: Sensitivity of gross primary productivity to climatic drivers during the summer drought of 2018 in Europe, Philos. Trans. R. Soc. B Biol. Sci., 375, 20190747, https://doi.org/10.1098/rstb.2019.0747, 2020.
Gao, Y., Markkanen, T., Aurela, M., Mammarella, I., Thum, T., Tsuruta, A., Yang, H., and Aalto, T.: Response of water use efficiency to summer drought in a boreal Scots pine forest in Finland, Biogeosciences, 14, 4409–4422, https://doi.org/10.5194/bg-14-4409-2017, 2017.
Ge, Z.-M., Kellomäki, S., Zhou, X., and Peltola, H.: The role of climatic variability in controlling carbon and water budgets in a boreal Scots pine forest during ten growing seasons, Boreal Environ. Res., 19, 181–194, 2014.
Gilmanov, T. G., Verma, S. B., Sims, P. L., Meyers, T. P., Bradford, J. A., Burba, G. G., and Suyker, A. E.: Gross primary production and light response parameters of four Southern Plains ecosystems estimated using long-term CO2-flux tower measurements, Glob. Biogeochem. Cycles, 17, https://doi.org/10.1029/2002GB002023, 2003.
Gonsamo, A., Chen, J. M., and D'Odorico, P.: Deriving land surface phenology indicators from CO2 eddy covariance measurements, Ecol. Indic., 29, 203–207, https://doi.org/10.1016/j.ecolind.2012.12.026, 2013.
Granier, A., Bréda, N., Longdoz, B., Gross, P., and Ngao, J.: Ten years of fluxes and stand growth in a young beech forest at Hesse, North-eastern France, Ann. For. Sci., 65, 704, https://doi.org/10.1051/forest:2008052, 2008.
Green, J. K., Seneviratne, S. I., Berg, A. M., Findell, K. L., Hagemann, S., Lawrence, D. M., and Gentine, P.: Large influence of soil moisture on long-term terrestrial carbon uptake, Nature, 565, 476–479, https://doi.org/10.1038/s41586-018-0848-x, 2019.
Gutierrez Lopez, J., Tor-ngern, P., Oren, R., Kozii, N., Laudon, H., and Hasselquist, N. J.: How tree species, tree size, and topographical location influenced tree transpiration in northern boreal forests during the historic 2018 drought, Glob. Change Biol., 27, 3066–3078, https://doi.org/10.1111/gcb.15601, 2021.
Haberstroh, S., Werner, C., Grün, M., Kreuzwieser, J., Seifert, T., Schindler, D., and Christen, A.: Central European 2018 hot drought shifts Scots pine forest to its tipping point, Plant Biol., 24, 1186–1197, https://doi.org/10.1111/plb.13455, 2022.
Hadden, D. and Grelle, A.: Changing temperature response of respiration turns boreal forest from carbon sink into carbon source, Agric. For. Meteorol., 223, 30–38, https://doi.org/10.1016/j.agrformet.2016.03.020, 2016.
Hari, V., Rakovec, O., Markonis, Y., Hanel, M., and Kumar, R.: Increased future occurrences of the exceptional 2018–2019 Central European drought under global warming, Sci. Rep., 10, 12207, https://doi.org/10.1038/s41598-020-68872-9, 2020.
Harris, N. L., Gibbs, D. A., Baccini, A., Birdsey, R. A., de Bruin, S., Farina, M., Fatoyinbo, L., Hansen, M. C., Herold, M., Houghton, R. A., Potapov, P. V., Suarez, D. R., Roman-Cuesta, R. M., Saatchi, S. S., Slay, C. M., Turubanova, S. A., and Tyukavina, A.: Global maps of twenty-first century forest carbon fluxes, Nat. Clim. Change, 11, 234–240, https://doi.org/10.1038/s41558-020-00976-6, 2021.
Hikino, K., Danzberger, J., Riedel, V. P., Hesse, B. D., Hafner, B. D., Gebhardt, T., Rehschuh, R., Ruehr, N. K., Brunn, M., Bauerle, T. L., Landhäusser, S. M., Lehmann, M. M., Rötzer, T., Pretzsch, H., Buegger, F., Weikl, F., Pritsch, K., and Grams, T. E. E.: Dynamics of initial carbon allocation after drought release in mature Norway spruce—Increased belowground allocation of current photoassimilates covers only half of the carbon used for fine-root growth, Glob. Change Biol., 28, 6889–6905, https://doi.org/10.1111/gcb.16388, 2022.
Houle, D., Lajoie, G., and Duchesne, L.: Major losses of nutrients following a severe drought in a boreal forest, Nat. Plants, 2, 16187, https://doi.org/10.1038/nplants.2016.187, 2016.
Huang, M., Piao, S., Sun, Y., Ciais, P., Cheng, L., Mao, J., Poulter, B., Shi, X., Zeng, Z., and Wang, Y.: Change in terrestrial ecosystem water-use efficiency over the last three decades, Glob. Change Biol., 21, 2366–2378, https://doi.org/10.1111/gcb.12873, 2015.
Huth, V., Hoffmann, M., Bereswill, S., Zak, D., and Augustin, J.: The climate warming effect of a fen peat meadow with fluctuating water table is reduced by young alder trees, Mires Peat, 1–18, https://doi.org/10.19189/MaP.2017.OMB.291, 2018.
IPCC: Climate Change 2021: The Physical Science Basis. Contribution of Working Group I to the Sixth Assessment Report of the Intergovernmental Panel on Climate Change, edited by: Masson-Delmotte, V., Zhai, P., Pirani, A., Connors, S. L., Péan, C., Berger, S., Caud, N., Chen, Y., Goldfarb, L., Gomis, M. I., Huang, M., Leitzell, K., Lonnoy, E., Matthews, J. B. R., Maycock, T. K., Waterfield, T., Yelekçi, O., Yu, R., and Zhou, B., Cambridge University Press, Cambridge, United Kingdom and New York, NY, USA, https://doi.org/10.1017/9781009157896, 2021.
Jarvis, P. J.: Coupling of carbon and water interactions in forest stands, Tree Physiol., 2, 347–368, https://doi.org/10.1093/treephys/2.1-2-3.347, 1986.
Jassal, R. S., Black, T. A., Spittlehouse, D. L., Brümmer, C., and Nesic, Z.: Evapotranspiration and water use efficiency in different-aged Pacific Northwest Douglas-fir stands, Agric. For. Meteorol., 149, 1168–1178, https://doi.org/10.1016/j.agrformet.2009.02.004, 2009.
Jin, C., Zha, T., Bourque, C. P.-A., Liu, P., Jia, X., Zhang, F., Yu, H., Tian, Y., Li, X., Kang, X., Guo, X., and Wang, N.: Multi-year trends and interannual variation in ecosystem resource use efficiencies in a young mixedwood plantation in northern China, Agric. For. Meteorol., 330, 109318, https://doi.org/10.1016/j.agrformet.2023.109318, 2023.
Kannenberg, S. A., Maxwell, J. T., Pederson, N., D'Orangeville, L., Ficklin, D. L., and Phillips, R. P.: Drought legacies are dependent on water table depth, wood anatomy and drought timing across the eastern US, Ecol. Lett., 22, 119–127, https://doi.org/10.1111/ele.13173, 2019.
Kannenberg, S. A., Schwalm, C. R., and Anderegg, W. R. L.: Ghosts of the past: how drought legacy effects shape forest functioning and carbon cycling, Ecol. Lett., 23, 891–901, https://doi.org/10.1111/ele.13485, 2020.
Kannenberg, S. A., Anderegg, W. R. L., Barnes, M. L., Dannenberg, M. P., and Knapp, A. K.: Dominant role of soil moisture in mediating carbon and water fluxes in dryland ecosystems, Nat. Geosci., 17, 38–43, https://doi.org/10.1038/s41561-023-01351-8, 2024.
Keenan, T. F., Hollinger, D. Y., Bohrer, G., Dragoni, D., Munger, J. W., Schmid, H. P., and Richardson, A. D.: Increase in forest water-use efficiency as atmospheric carbon dioxide concentrations rise, Nature, 499, 324–327, https://doi.org/10.1038/nature12291, 2013.
Keenan, T. F., Gray, J., Friedl, M. A., Toomey, M., Bohrer, G., Hollinger, D. Y., Munger, J. W., O'Keefe, J., Schmid, H. P., Wing, I. S., Yang, B., and Richardson, A. D.: Net carbon uptake has increased through warming-induced changes in temperate forest phenology, Nat. Clim. Change, 4, 598–604, https://doi.org/10.1038/nclimate2253, 2014.
Kibler, C. L., Schmidt, E. C., Roberts, D. A., Stella, J. C., Kui, L., Lambert, A. M., and Singer, M. B.: A brown wave of riparian woodland mortality following groundwater declines during the 2012–2019 California drought, Environ. Res. Lett., 16, 084030, https://doi.org/10.1088/1748-9326/ac1377, 2021.
Kljun, N., Black, T. A., Griffis, T. J., Barr, A. G., Gaumont-Guay, D., Morgenstern, K., McCaughey, J. H., and Nesic, Z.: Response of net ecosystem productivity of three boreal forest stands to drought, Ecosystems, 9, 1128–1144, https://doi.org/10.1007/s10021-005-0082-x, 2006.
Kljun, N., Calanca, P., Rotach, M. W., and Schmid, H. P.: A simple two-dimensional parameterisation for Flux Footprint Prediction (FFP), Geosci. Model Dev., 8, 3695–3713, https://doi.org/10.5194/gmd-8-3695-2015, 2015.
Kochendorfer, J., Castillo, E. G., Haas, E., Oechel, W. C., and Paw U., K. T.: Net ecosystem exchange, evapotranspiration and canopy conductance in a riparian forest, Agric. For. Meteorol., 151, 544–553, https://doi.org/10.1016/j.agrformet.2010.12.012, 2011.
Kowalska, N., Šigut, L., Stojanović, M., Fischer, M., Kyselova, I., and Pavelka, M.: Analysis of floodplain forest sensitivity to drought, Philos. Trans. R. Soc. B Biol. Sci., 375, 20190518, https://doi.org/10.1098/rstb.2019.0518, 2020.
Kozlowski, T. T.: Responses of woody plants to flooding and salinity, Tree Physiol., 17, 490, https://doi.org/10.1093/treephys/17.7.490, 1997.
Krasnova, A., Mander, Ü., Noe, S. M., Uri, V., Krasnov, D., and Soosaar, K.: Hemiboreal forests' CO2 fluxes response to the European 2018 heatwave, Agric. For. Meteorol., 323, 109042, https://doi.org/10.1016/j.agrformet.2022.109042, 2022.
Krishnan, P., Black, T. A., Grant, N. J., Barr, A. G., Hogg, E. H., Jassal, R. S., and Morgenstern, K.: Impact of changing soil moisture distribution on net ecosystem productivity of a boreal aspen forest during and following drought, Agric. For. Meteorol., 139, 208–223, https://doi.org/10.1016/j.agrformet.2006.07.002, 2006.
Krzaklewski, W., Pietrzykowski, M., and Woś, B.: Survival and growth of alders (Alnus glutinosa (L.) Gaertn. and Alnus incana (L.) Moench) on fly ash technosols at different substrate improvement, Ecol. Eng., 49, 35–40, https://doi.org/10.1016/j.ecoleng.2012.08.026, 2012.
Kutsch, W. L., Liu, C., Hormann, G., and Herbst, M.: Spatial heterogeneity of ecosystem carbon fluxes in a broadleaved forest in Northern Germany, Global Change Biology, 11, 70–88, https://doi.org/10.1111/j.1365-2486.2004.00884.x, 2005.
Launiainen, S., Katul, G. G., Leppä, K., Kolari, P., Aslan, T., Grönholm, T., Korhonen, L., Mammarella, I., and Vesala, T.: Does growing atmospheric CO2 explain increasing carbon sink in a boreal coniferous forest?, Glob. Change Biol., n/a, https://doi.org/10.1111/gcb.16117, 2022.
Lindroth, A., Grelle, A., and Morén, A.: Long-term measurements of boreal forest carbon balance reveal large temperature sensitivity, Glob. Change Biol., 4, 443–450, https://doi.org/10.1046/j.1365-2486.1998.00165.x, 1998.
Lindroth, A., Holst, J., Linderson, M.-L., Aurela, M., Biermann, T., Heliasz, M., Chi, J., Ibrom, A., Kolari, P., Klemedtsson, L., Krasnova, A., Laurila, T., Lehner, I., Lohila, A., Mammarella, I., Mölder, M., Löfvenius, M. O., Peichl, M., Pilegaard, K., Soosaar, K., Vesala, T., Vestin, P., Weslien, P., and Nilsson, M.: Effects of drought and meteorological forcing on carbon and water fluxes in Nordic forests during the dry summer of 2018, Philos. Trans. R. Soc. B Biol. Sci., 375, 20190516, https://doi.org/10.1098/rstb.2019.0516, 2020.
Lloret, F., Keeling, E. G., and Sala, A.: Components of tree resilience: effects of successive low-growth episodes in old ponderosa pine forests, Oikos, 120, 1909–1920, https://doi.org/10.1111/j.1600-0706.2011.19372.x, 2011.
Lloyd, J. and Taylor, J. A.: On the temperature dependence of soil respiration, Functional Ecology, 8, 315, https://doi.org/10.2307/2389824, 1994.
Mander, Ü., Lõhmus, K., Teiter, S., Uri, V., and Augustin, J.: Gaseous nitrogen and carbon fluxes in riparian alder stands, Boreal Environ. Res., 13, 231–241, 2008.
Mander, Ü., Krasnova, A., Escuer-Gatius, J., Espenberg, M., Schindler, T., Machacova, K., Pärn, J., Maddison, M., Megonigal, J. P., Pihlatie, M., Kasak, K., Niinemets, Ü., Junninen, H., and Soosaar, K.: Forest canopy mitigates soil N2O emission during hot moments, Npj Clim. Atmospheric Sci., 4, 39, https://doi.org/10.1038/s41612-021-00194-7, 2021.
Mander, Ü., Krasnova, A., Schindler, T., Megonigal, J. P., Escuer-Gatius, J., Espenberg, M., Machacova, K., Maddison, M., Pärn, J., Ranniku, R., Pihlatie, M., Kasak, K., Niinemets, Ü., and Soosaar, K.: Long-term dynamics of soil, tree stem and ecosystem methane fluxes in a riparian forest, Sci. Total Environ., 809, 151723, https://doi.org/10.1016/j.scitotenv.2021.151723, 2022.
Massmann, A., Gentine, P., and Lin, C.: When Does Vapor Pressure Deficit Drive or Reduce Evapotranspiration?, J. Adv. Model. Earth Syst., 11, 3305–3320, https://doi.org/10.1029/2019MS001790, 2019.
Mauder, M., Genzel, S., Fu, J., Kiese, R., Soltani, M., Steinbrecher, R., Zeeman, M., Banerjee, T., De Roo, F., and Kunstmann, H.: Evaluation of energy balance closure adjustment methods by independent evapotranspiration estimates from lysimeters and hydrological simulations, Hydrol. Process., 32, 39–50, https://doi.org/10.1002/hyp.11397, 2018.
Mauder, M., Foken, T., and Cuxart, J.: Surface-energy-balance closure over land: a review, Bound.-Layer Meteorol., 177, 395–426, https://doi.org/10.1007/s10546-020-00529-6, 2020.
McDowell, N., Pockman, W. T., Allen, C. D., Breshears, D. D., Cobb, N., Kolb, T., Plaut, J., Sperry, J., West, A., Williams, D. G., and Yepez, E. A.: Mechanisms of plant survival and mortality during drought: why do some plants survive while others succumb to drought?, New Phytol., 178, 719–739, https://doi.org/10.1111/j.1469-8137.2008.02436.x, 2008.
Michaelis, L. and Menten, M. L.: Die kinetik der invertinwirkung, Biochem Z, 49, 352, 1913.
Musavi, T., Migliavacca, M., Reichstein, M., Kattge, J., Wirth, C., Black, T. A., Janssens, I., Knohl, A., Loustau, D., Roupsard, O., Varlagin, A., Rambal, S., Cescatti, A., Gianelle, D., Kondo, H., Tamrakar, R., and Mahecha, M. D.: Stand age and species richness dampen interannual variation of ecosystem-level photosynthetic capacity, Nat. Ecol. Evol., 1, 1–7, https://doi.org/10.1038/s41559-016-0048, 2017.
Naiman, R. J. and Décamps, H.: The ecology of interfaces: Riparian zones, Annu. Rev. Ecol. Syst., 28, 621–658, https://doi.org/10.1146/annurev.ecolsys.28.1.621, 1997.
Ney, P., Graf, A., Bogena, H., Diekkrüger, B., Drüe, C., Esser, O., Heinemann, G., Klosterhalfen, A., Pick, K., Pütz, T., Schmidt, M., Valler, V., and Vereecken, H.: CO2 fluxes before and after partial deforestation of a Central European spruce forest, Agric. For. Meteorol., 274, 61–74, https://doi.org/10.1016/j.agrformet.2019.04.009, 2019.
Niu, X. and Liu, S.: Drought affected ecosystem water use efficiency of a natural oak forest in central china, Forests, 12, 839, https://doi.org/10.3390/f12070839, 2021.
Novick, K. A., Ficklin, D. L., Stoy, P. C., Williams, C. A., Bohrer, G., Oishi, A. C., Papuga, S. A., Blanken, P. D., Noormets, A., Sulman, B. N., Scott, R. L., Wang, L., and Phillips, R. P.: The increasing importance of atmospheric demand for ecosystem water and carbon fluxes, Nat. Clim. Change, 6, 1023–1027, https://doi.org/10.1038/nclimate3114, 2016.
Oren, R., Sperry, J. S., Katul, G. G., Pataki, D. E., Ewers, B. E., Phillips, N., and Schäfer, K. V. R.: Survey and synthesis of intra- and interspecific variation in stomatal sensitivity to vapour pressure deficit, Plant Cell Environ., 22, 1515–1526, https://doi.org/10.1046/j.1365-3040.1999.00513.x, 1999.
Pan, Y., Birdsey, R. A., Fang, J., Houghton, R., Kauppi, P. E., Kurz, W. A., Phillips, O. L., Shvidenko, A., Lewis, S. L., Canadell, J. G., Ciais, P., Jackson, R. B., Pacala, S. W., McGuire, A. D., Piao, S., Rautiainen, A., Sitch, S., and Hayes, D.: A large and persistent carbon sink in the world's forests, Science, 333, 988–993, https://doi.org/10.1126/science.1201609, 2011.
Papale, D., Reichstein, M., Aubinet, M., Canfora, E., Bernhofer, C., Kutsch, W., Longdoz, B., Rambal, S., Valentini, R., Vesala, T., and Yakir, D.: Towards a standardized processing of Net Ecosystem Exchange measured with eddy covariance technique: algorithms and uncertainty estimation, Biogeosciences, 3, 571–583, https://doi.org/10.5194/bg-3-571-2006, 2006.
Piao, S., Wang, X., Park, T., Chen, C., Lian, X., He, Y., Bjerke, J. W., Chen, A., Ciais, P., Tømmervik, H., Nemani, R. R., and Myneni, R. B.: Characteristics, drivers and feedbacks of global greening, Nat. Rev. Earth Environ., 1, 14–27, https://doi.org/10.1038/s43017-019-0001-x, 2020.
Pilegaard, K. and Ibrom, A.: Net carbon ecosystem exchange during 24 years in the Sorø Beech Forest – relations to phenology and climate, Tellus B Chem. Phys. Meteorol., 72, 2020.
Pohl, F., Werban, U., Kumar, R., Hildebrandt, A., and Rebmann, C.: Observational evidence of legacy effects of the 2018 drought on a mixed deciduous forest in Germany, Sci. Rep., 13, 10863, https://doi.org/10.1038/s41598-023-38087-9, 2023.
Portela, A. P., Gonçalves, J. F., Durance, I., Vieira, C., and Honrado, J.: Riparian forest response to extreme drought is influenced by climatic context and canopy structure, Sci. Total Environ., 881, 163128, https://doi.org/10.1016/j.scitotenv.2023.163128, 2023.
Reichstein, M., Tenhunen, J. D., Roupsard, O., Ourcival, J., Rambal, S., Miglietta, F., Peressotti, A., Pecchiari, M., Tirone, G., and Valentini, R.: Severe drought effects on ecosystem CO2 and H2O fluxes at three Mediterranean evergreen sites: revision of current hypotheses?, Glob. Change Biol., 8, 999–1017, https://doi.org/10.1046/j.1365-2486.2002.00530.x, 2002.
Rogozin, S., Krasnova, A., Mander, Ü., Uri, V., and Soosaar, K.: Long-term carbon sequestration and heatwave resilience in an old hemiboreal upland coniferous forest, Agricultural and Forest Meteorology, 376, 110895, https://doi.org/10.1016/j.agrformet.2025.110895, 2026.
Rohde, M. M., Stella, J. C., Roberts, D. A., and Singer, M. B.: Groundwater dependence of riparian woodlands and the disrupting effect of anthropogenically altered streamflow, Proc. Natl. Acad. Sci. U. S. A., 118, e2026453118, https://doi.org/10.1073/pnas.2026453118, 2021.
Rood, S. B., Pan, J., Gill, K. M., Franks, C. G., Samuelson, G. M., and Shepherd, A.: Declining summer flows of Rocky Mountain rivers: Changing seasonal hydrology and probable impacts on floodplain forests, J. Hydrol., 349, 397–410, https://doi.org/10.1016/j.jhydrol.2007.11.012, 2008.
Rytter, L. and Rytter, R.-M.: Growth and carbon capture of grey alder (Alnus incana (L.) Moench.) under north European conditions – Estimates based on reported research, For. Ecol. Manag., 373, 56–65, https://doi.org/10.1016/j.foreco.2016.04.034, 2016.
Rytter, L., Šlapokas, T., and Granhall, U.: Woody biomass and litter production of fertilized grey alder plantations on a low-humified peat bog, For. Ecol. Manag., 28, 161–176, https://doi.org/10.1016/0378-1127(89)90001-7, 1989.
Schaaf, C. and Wang, Z.: MODIS/Terra+Aqua BRDF/Albedo Daily L3 Global – 500m V061, NASA Land Processes Distributed Active Archive Center [data set], https://doi.org/10.5067/MODIS/MCD43A3.061, 2021.
Schlesinger, W. H., Dietze, M. C., Jackson, R. B., Phillips, R. P., Rhoades, C. C., Rustad, L. E., and Vose, J. M.: Forest biogeochemistry in response to drought, Glob. Change Biol., 22, 2318–2328, https://doi.org/10.1111/gcb.13105, 2016.
Schnabel, F., Purrucker, S., Schmitt, L., Engelmann, R. A., Kahl, A., Richter, R., Seele-Dilbat, C., Skiadaresis, G., and Wirth, C.: Cumulative growth and stress responses to the 2018–2019 drought in a European floodplain forest, Glob. Change Biol., 28, 1870–1883, https://doi.org/10.1111/gcb.16028, 2022.
Schuldt, B., Buras, A., Arend, M., Vitasse, Y., Beierkuhnlein, C., Damm, A., Gharun, M., Grams, T. E. E., Hauck, M., Hajek, P., Hartmann, H., Hiltbrunner, E., Hoch, G., Holloway-Phillips, M., Körner, C., Larysch, E., Lübbe, T., Nelson, D. B., Rammig, A., Rigling, A., Rose, L., Ruehr, N. K., Schumann, K., Weiser, F., Werner, C., Wohlgemuth, T., Zang, C. S., and Kahmen, A.: A first assessment of the impact of the extreme 2018 summer drought on Central European forests, Basic and Applied Ecology, 45, 86–103, https://doi.org/10.1016/j.baae.2020.04.003, 2020.
Schwalm, C. R., Anderegg, W. R. L., Michalak, A. M., Fisher, J. B., Biondi, F., Koch, G., Litvak, M., Ogle, K., Shaw, J. D., Wolf, A., Huntzinger, D. N., Schaefer, K., Cook, R., Wei, Y., Fang, Y., Hayes, D., Huang, M., Jain, A., and Tian, H.: Global patterns of drought recovery, Nature, 548, 202–205, https://doi.org/10.1038/nature23021, 2017.
Scott, R. L., Edwards, E. A., Shuttleworth, W. J., Huxman, T. E., Watts, C., and Goodrich, D. C.: Interannual and seasonal variation in fluxes of water and carbon dioxide from a riparian woodland ecosystem, Agric. For. Meteorol., 122, 65–84, https://doi.org/10.1016/j.agrformet.2003.09.001, 2004.
Senf, C. and Seidl, R.: Persistent impacts of the 2018 drought on forest disturbance regimes in Europe, Biogeosciences, 18, 5223–5230, https://doi.org/10.5194/bg-18-5223-2021, 2021.
Singer, M. B., Stella, J. C., Dufour, S., Piégay, H., Wilson, R. J. S., and Johnstone, L.: Contrasting water-uptake and growth responses to drought in co-occurring riparian tree species, Ecohydrology, 6, 402–412, https://doi.org/10.1002/eco.1283, 2013.
Singer, M. B., Sargeant, C. I., Piégay, H., Riquier, J., Wilson, R. J. S., and Evans, C. M.: Floodplain ecohydrology: Climatic, anthropogenic, and local physical controls on partitioning of water sources to riparian trees, Water Resour. Res., 50, 4490–4513, https://doi.org/10.1002/2014WR015581, 2014.
Smith, N. E., Kooijmans, L. M. J., Koren, G., van Schaik, E., van der Woude, A. M., Wanders, N., Ramonet, M., Xueref-Remy, I., Siebicke, L., Manca, G., Brümmer, C., Baker, I. T., Haynes, K. D., Luijkx, I. T., and Peters, W.: Spring enhancement and summer reduction in carbon uptake during the 2018 drought in northwestern Europe, Philos. Trans. R. Soc. B Biol. Sci., 375, 20190509, https://doi.org/10.1098/rstb.2019.0509, 2020.
Soosaar, K., Mander, Ü., Maddison, M., Kanal, A., Kull, A., Lõhmus, K., Truu, J., and Augustin, J.: Dynamics of gaseous nitrogen and carbon fluxes in riparian alder forests, Ecol. Eng., 37, 40–53, https://doi.org/10.1016/j.ecoleng.2010.07.025, 2011.
Stella, J. C., Riddle, J., Piégay, H., Gagnage, M., and Trémélo, M.-L.: Climate and local geomorphic interactions drive patterns of riparian forest decline along a Mediterranean Basin river, Geomorphology, 202, 101–114, https://doi.org/10.1016/j.geomorph.2013.01.013, 2013.
Teskey, R., Wertin, T., Bauweraerts, I., Ameye, M., Mcguire, M. A., and Steppe, K.: Responses of tree species to heat waves and extreme heat events, Plant, Cell & Environment, 38, 1699–1712, https://doi.org/10.1111/pce.12417, 2015.
Thomas, C. K., Law, B. E., Irvine, J., Martin, J. G., Pettijohn, J. C., and Davis, K. J.: Seasonal hydrology explains interannual and seasonal variation in carbon and water exchange in a semiarid mature ponderosa pine forest in central Oregon, J. Geophys. Res. Biogeosciences, 114, https://doi.org/10.1029/2009JG001010, 2009.
Trenberth, K. E., Dai, A., van der Schrier, G., Jones, P. D., Barichivich, J., Briffa, K. R., and Sheffield, J.: Global warming and changes in drought, Nat. Clim. Chang., 4, 17–22, https://doi.org/10.1038/nclimate2067, 2014.
Uri, V., Kukumägi, M., Aosaar, J., Varik, M., Becker, H., Soosaar, K., Morozov, G., Ligi, K., Padari, A., Ostonen, I., and Karoles, K.: Carbon budgets in fertile grey alder (Alnus incana (L.) Moench.) stands of different ages, For. Ecol. Manag., 396, 55–67, https://doi.org/10.1016/j.foreco.2017.04.004, 2017.
Valor, T., Camprodon, J., Buscarini, S., and Casals, P.: Drought-induced dieback of riparian black alder as revealed by tree rings and oxygen isotopes, For. Ecol. Manag., 478, 118500, https://doi.org/10.1016/j.foreco.2020.118500, 2020.
van der Molen, M. K., Dolman, A. J., Ciais, P., Eglin, T., Gobron, N., Law, B. E., Meir, P., Peters, W., Phillips, O. L., Reichstein, M., Chen, T., Dekker, S. C., Doubková, M., Friedl, M. A., Jung, M., van den Hurk, B. J. J. M., de Jeu, R. A. M., Kruijt, B., Ohta, T., Rebel, K. T., Plummer, S., Seneviratne, S. I., Sitch, S., Teuling, A. J., van der Werf, G. R., and Wang, G.: Drought and ecosystem carbon cycling, Agric. For. Meteorol., 151, 765–773, https://doi.org/10.1016/j.agrformet.2011.01.018, 2011.
Vekuri, H., Tuovinen, J.-P., Kulmala, L., Papale, D., Kolari, P., Aurela, M., Laurila, T., Liski, J., and Lohila, A.: A widely-used eddy covariance gap-filling method creates systematic bias in carbon balance estimates, Sci. Rep., 13, 1720, https://doi.org/10.1038/s41598-023-28827-2, 2023.
Wang, T., Zhang, H., Zhao, J., Guo, X., Xiong, T., and Wu, R.: Shifting contribution of climatic constraints on evapotranspiration in the boreal forest, Earths Future, 9, e2021EF002104, https://doi.org/10.1029/2021EF002104, 2021.
Warlo, H., von Wilpert, K., Lang, F., and Schack-Kirchner, H.: Black Alder (Alnus glutinosa (L.) Gaertn.) on Compacted Skid Trails: A Trade-off between Greenhouse Gas Fluxes and Soil Structure Recovery?, Forests, 10, 726, https://doi.org/10.3390/f10090726, 2019.
Wharton, S., Schroeder, M., Paw U, K. T., Falk, M., and Bible, K.: Turbulence considerations for comparing ecosystem exchange over old-growth and clear-cut stands for limited fetch and complex canopy flow conditions, Agric. For. Meteorol., 149, 1477–1490, https://doi.org/10.1016/j.agrformet.2009.04.002, 2009.
Williams, C. A., Reichstein, M., Buchmann, N., Baldocchi, D., Beer, C., Schwalm, C., Wohlfahrt, G., Hasler, N., Bernhofer, C., Foken, T., Papale, D., Schymanski, S., and Schaefer, K.: Climate and vegetation controls on the surface water balance: Synthesis of evapotranspiration measured across a global network of flux towers, Water Resour. Res., 48, https://doi.org/10.1029/2011WR011586, 2012.
Winkler, K., Yang, H., Ganzenmüller, R., Fuchs, R., Ceccherini, G., Duveiller, G., Grassi, G., Pongratz, J., Bastos, A., Shvidenko, A., Araza, A., Herold, M., Wigneron, J.-P., and Ciais, P.: Changes in land use and management led to a decline in Eastern Europe's terrestrial carbon sink, Commun. Earth Environ., 4, 1–14, https://doi.org/10.1038/s43247-023-00893-4, 2023.
Wolf, S., Eugster, W., Ammann, C., Häni, M., Zielis, S., Hiller, R., Stieger, J., Imer, D., Merbold, L., and Buchmann, N.: Contrasting response of grassland versus forest carbon and water fluxes to spring drought in Switzerland, Environ. Res. Lett., 8, 035007, https://doi.org/10.1088/1748-9326/8/3/035007, 2013.
Wolf, S., Keenan, T. F., Fisher, J. B., Baldocchi, D. D., Desai, A. R., Richardson, A. D., Scott, R. L., Law, B. E., Litvak, M. E., Brunsell, N. A., Peters, W., and van der Laan-Luijkx, I. T.: Warm spring reduced carbon cycle impact of the 2012 US summer drought, Proc. Natl. Acad. Sci., 113, 5880–5885, https://doi.org/10.1073/pnas.1519620113, 2016.
Wutzler, T., Lucas-Moffat, A., Migliavacca, M., Knauer, J., Sickel, K., Šigut, L., Menzer, O., and Reichstein, M.: Basic and extensible post-processing of eddy covariance flux data with REddyProc, Biogeosciences, 15, 5015–5030, https://doi.org/10.5194/bg-15-5015-2018, 2018.
Xie, J., Chen, J., Sun, G., Zha, T., Yang, B., Chu, H., Liu, J., Wan, S., Zhou, C., Ma, H., Bourque, C. P.-A., Shao, C., John, R., and Ouyang, Z.: Ten-year variability in ecosystem water use efficiency in an oak-dominated temperate forest under a warming climate, Agric. For. Meteorol., 218–219, 209–217, https://doi.org/10.1016/j.agrformet.2015.12.059, 2016.
Xu, H., Xiao, J., Zhang, Z., Ollinger, S. V., Hollinger, D. Y., Pan, Y., and Wan, J.: Canopy photosynthetic capacity drives contrasting age dynamics of resource use efficiencies between mature temperate evergreen and deciduous forests, Glob. Change Biol., 26, 6156–6167, https://doi.org/10.1111/gcb.15312, 2020a.
Xu, H., Zhang, Z., Xiao, J., Chen, J., Zhu, M., Cao, W., and Chen, Z.: Environmental and canopy stomatal control on ecosystem water use efficiency in a riparian poplar plantation, Agric. For. Meteorol., 287, 107953, https://doi.org/10.1016/j.agrformet.2020.107953, 2020b.
Yang, Y., Guan, H., Batelaan, O., McVicar, T. R., Long, D., Piao, S., Liang, W., Liu, B., Jin, Z., and Simmons, C. T.: Contrasting responses of water use efficiency to drought across global terrestrial ecosystems, Sci. Rep., 6, 23284, https://doi.org/10.1038/srep23284, 2016.
Zhou, S., Yu, B., Huang, Y., and Wang, G.: The effect of vapor pressure deficit on water use efficiency at the subdaily time scale, Geophys. Res. Lett., 41, 5005–5013, https://doi.org/10.1002/2014GL060741, 2014.
- Abstract
- Introduction
- Methods
- Results
- Discussion
- Conclusions
- Appendix A: Energy balance closure
- Appendix B: Sensitivity of canopy conductance to VPD in different soil saturation classes
- Appendix C: Site soil properties
- Appendix D: Estimation of NEE, GPP and ER from carbon budget data
- Appendix E: Contribution of N2O and CH4 to the CO2-based global warming potential of the mature alder forest
- Data availability
- Author contributions
- Competing interests
- Disclaimer
- Acknowledgements
- Financial support
- Review statement
- References