the Creative Commons Attribution 4.0 License.
the Creative Commons Attribution 4.0 License.
 | 25 Nov 2025
New observations confirm the progressive acidification in the Mozambique Channel
Nicolas Metzl
Claire Lo Monaco
Aline Tribollet
Jean-François Ternon
Frédéric Chevallier
Marion Gehlen
New observations obtained in 2021 and 2022 are presented and used to investigate the trend of the carbonate system (including pHT and aragonite saturation state, Ωar) in the southern sector of the Mozambique Channel. Using historical and new data in April–May we observed an acceleration of the acidification ranging from −0.012 decade−1 in 1963–1995 to −0.027 (±0.003) decade−1 in 1995–2022. Result from a neural network (FFNN) model for all seasons also suggests faster pH trend in recent decades, −0.011 decade−1 over 1985–1995 and −0.018 decade−1 over 1995–2022. In May 2022 we estimated Ωar of 3.49, about 0.3 lower than observed in May 1963 (Ωar=3.86). The lowest Ωar value of 3.23 was evaluated from the FFNN model in September 2023 that corresponds to the hypothetical critical threshold value (3.25) for coral reefs. In 2025 a marine heat wave was observed in this region (sea surface temperature up to 30 °C) and data from a BGC-Argo float indicate that sea surface pH was the lowest in January 2025 (pHT=7.95) whereas Ωar was the lowest in March 2025 (Ωar=3.2). A projection of the CT concentrations based on observed anthropogenic CO2 in subsurface water and future anthropogenic CO2 emissions scenario, suggests that a risky level for corals (Ωar<3) could be reached as soon as year 2034.
- Article
(4227 KB) - Full-text XML
-
Supplement
(1371 KB) - BibTeX
- EndNote


The ocean plays a major role in reducing the impact of climate change by absorbing more than 90 % of the excess heat in the climate system (Cheng et al., 2025; Forster et al., 2025) and about 25 % of human released CO2 (Friedlingstein et al., 2025). The oceanic CO2 uptake also changes the chemistry of seawater reducing its buffering capacity (Revelle and Suess, 1957) and leading to a process known as ocean acidification (OA) with potential impacts on marine organisms and ecosystems (Fabry et al., 2008; Doney et al., 2009, 2020; Gattuso et al., 2015; Schönberg et al., 2017; Cornwall et al., 2021). Global ocean models or Earth System Models predict that, due to future anthropogenic CO2 emissions and global warming, the sea surface pH could decrease by 0.4 and aragonite saturation state (Ωar) could be as low as 3 in the tropics by 2100 (Hoegh-Guldberg et al., 2007; Kwiatkowski et al., 2020; Jiang et al., 2023; Findlay et al., 2025). However, current global ocean models cannot fully replicate observations and not yet simulating all processes that govern ocean acidification (e.g. seasonal cycles of CT and AT, accumulation of Cant, etc. …). Long-term observations of the carbonate system are needed to compare and validate model results (Tilbrook et al., 2019).
The first estimate of the decadal pH change based on CO2 fugacity (fCO2) observations in the global ocean (using SOCAT data, Bakker et al., 2014) suggests a decrease of pH ranging between −0.003 decade−1 (±0.005) in the North Pacific and −0.024 decade−1 (±0.005) in the Indian Ocean over 1981–2011 (Lauvset et al., 2015). Reconstruction methods also based on SOCAT observations evaluated a global ocean decrease of pH in surface waters of −0.0181 (±0.0001) decade−1 (Iida et al., 2021), −0.0166 (±0.0010) decade−1 (Ma et al., 2023) and −0.017 (±0.004) decade−1 (Chau et al., 2024). These studies also highlighted the regional differences of the pH and aragonite saturation state (Ωar) trends. This calls for dedicated studies at regional scale in order to better interpret the inter-annual to multi-decadal changes of the oceanic carbonate system as the trends and associated uncertainties depend on the data available. Compared to other basins, observations are sparse in the Indian Ocean (Lauvset et al., 2015; Bakker et al., 2016, 2024). However, thanks to a new cruise conducted in 2019, it has been shown that the Mozambique Channel experienced an acceleration with respect to the acidification in recent years, a pH trend of −0.023 decade−1 (±0.005) over 1995–2019 (Lo Monaco et al., 2021). In a more recent analysis Chakraborty et al. (2024) used several methods, including a high resolution model dedicated to the Indian Ocean and found an acceleration of the pH trend of −0.011 (±0.00) decade−1 in 1980–1989 to −0.019 (±0.004) decade−1 in 2010–2019. Both studies concluded that strengthening of acidification trend was mainly driven by ocean CO2 uptake.
In this study, we present new data obtained in January 2021 and April–May 2022 in the Mozambique Channel and used the results of a FFNN model (Chau et al., 2024) extended to 2023 to explore the decadal trends of the carbonate system over 1963–2023. We also use these data to validate a projection of the acidification in the near future. To highlight CO2 source anomalies when the ocean was exceptionally warm, results from a BGC-Argo float in the Mozambique Channel in 2024–2025 are also presented.
Table 1List of cruises in the Mozambique Channel from SOCAT-v2024 (Bakker et al., 2024).
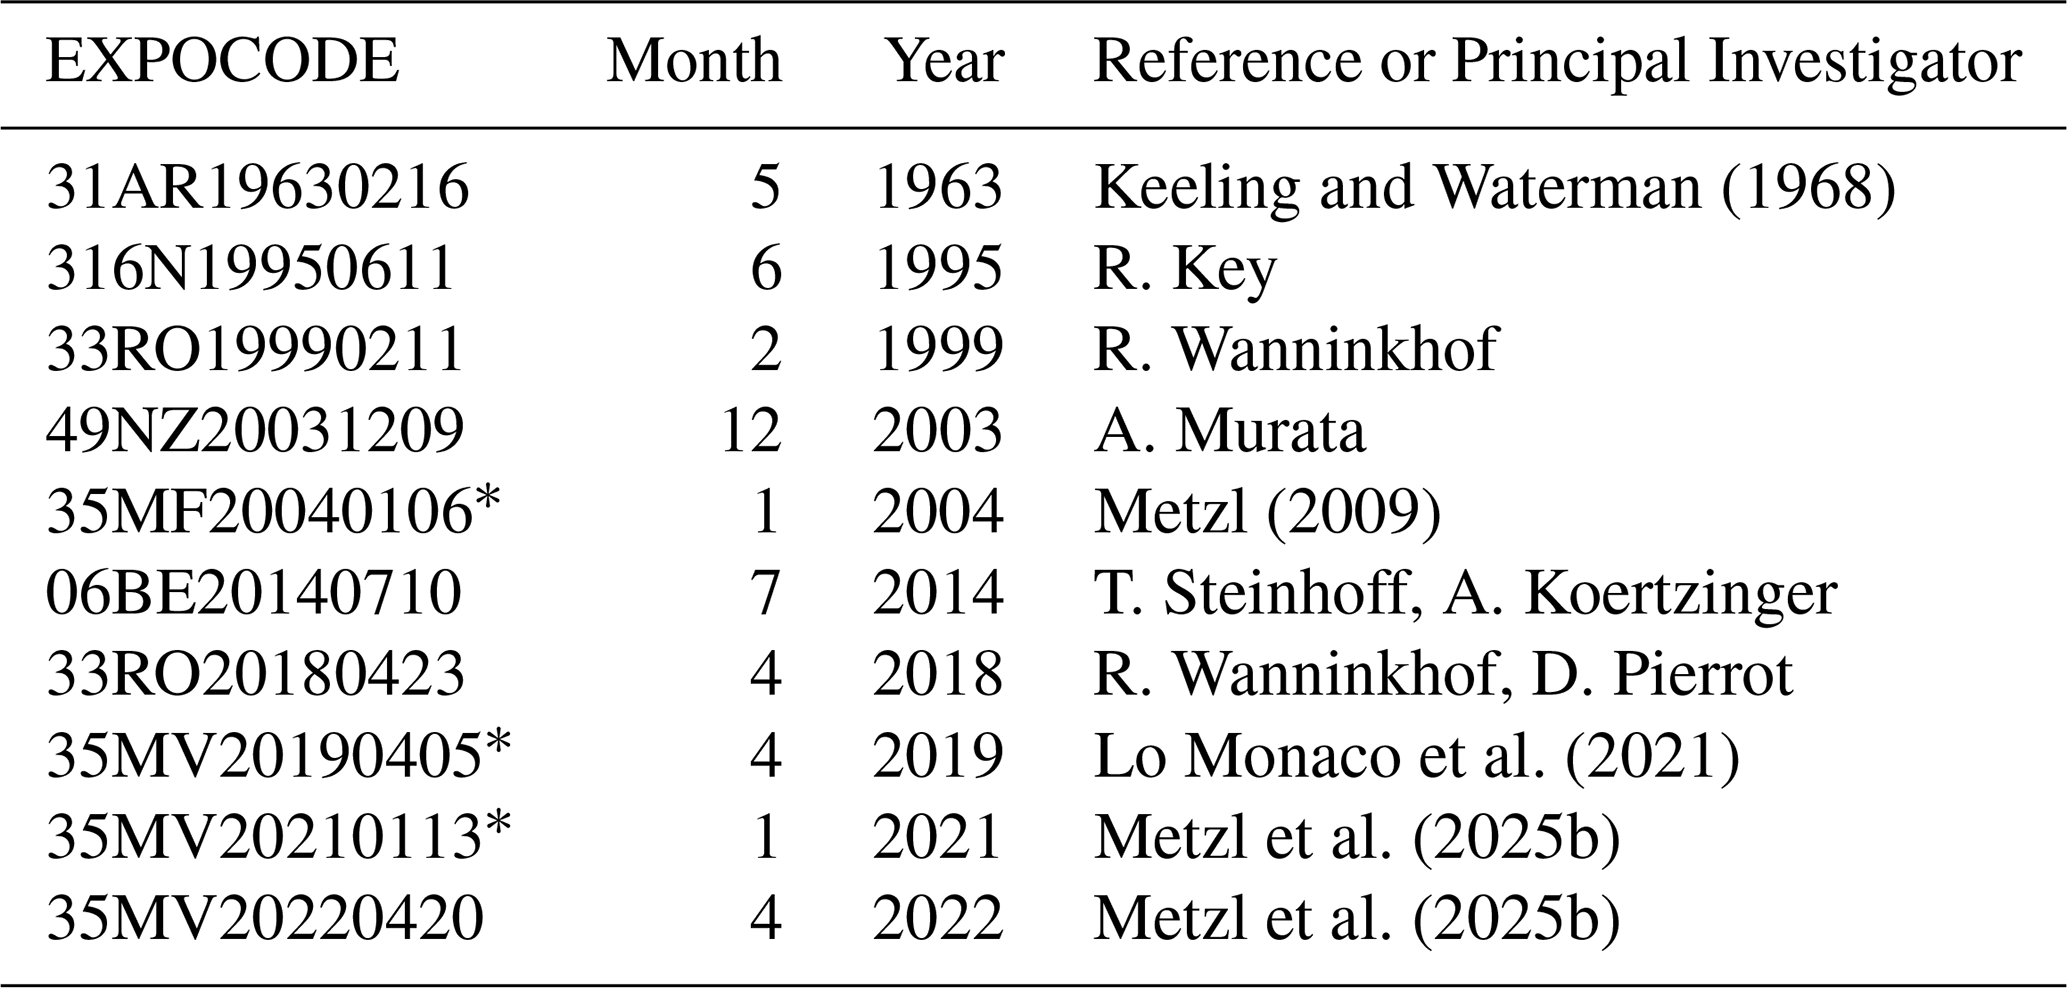
∗ For these cruises underway AT CT data available at https://doi.org/10.17882/102337 (Metzl et al., 2024).
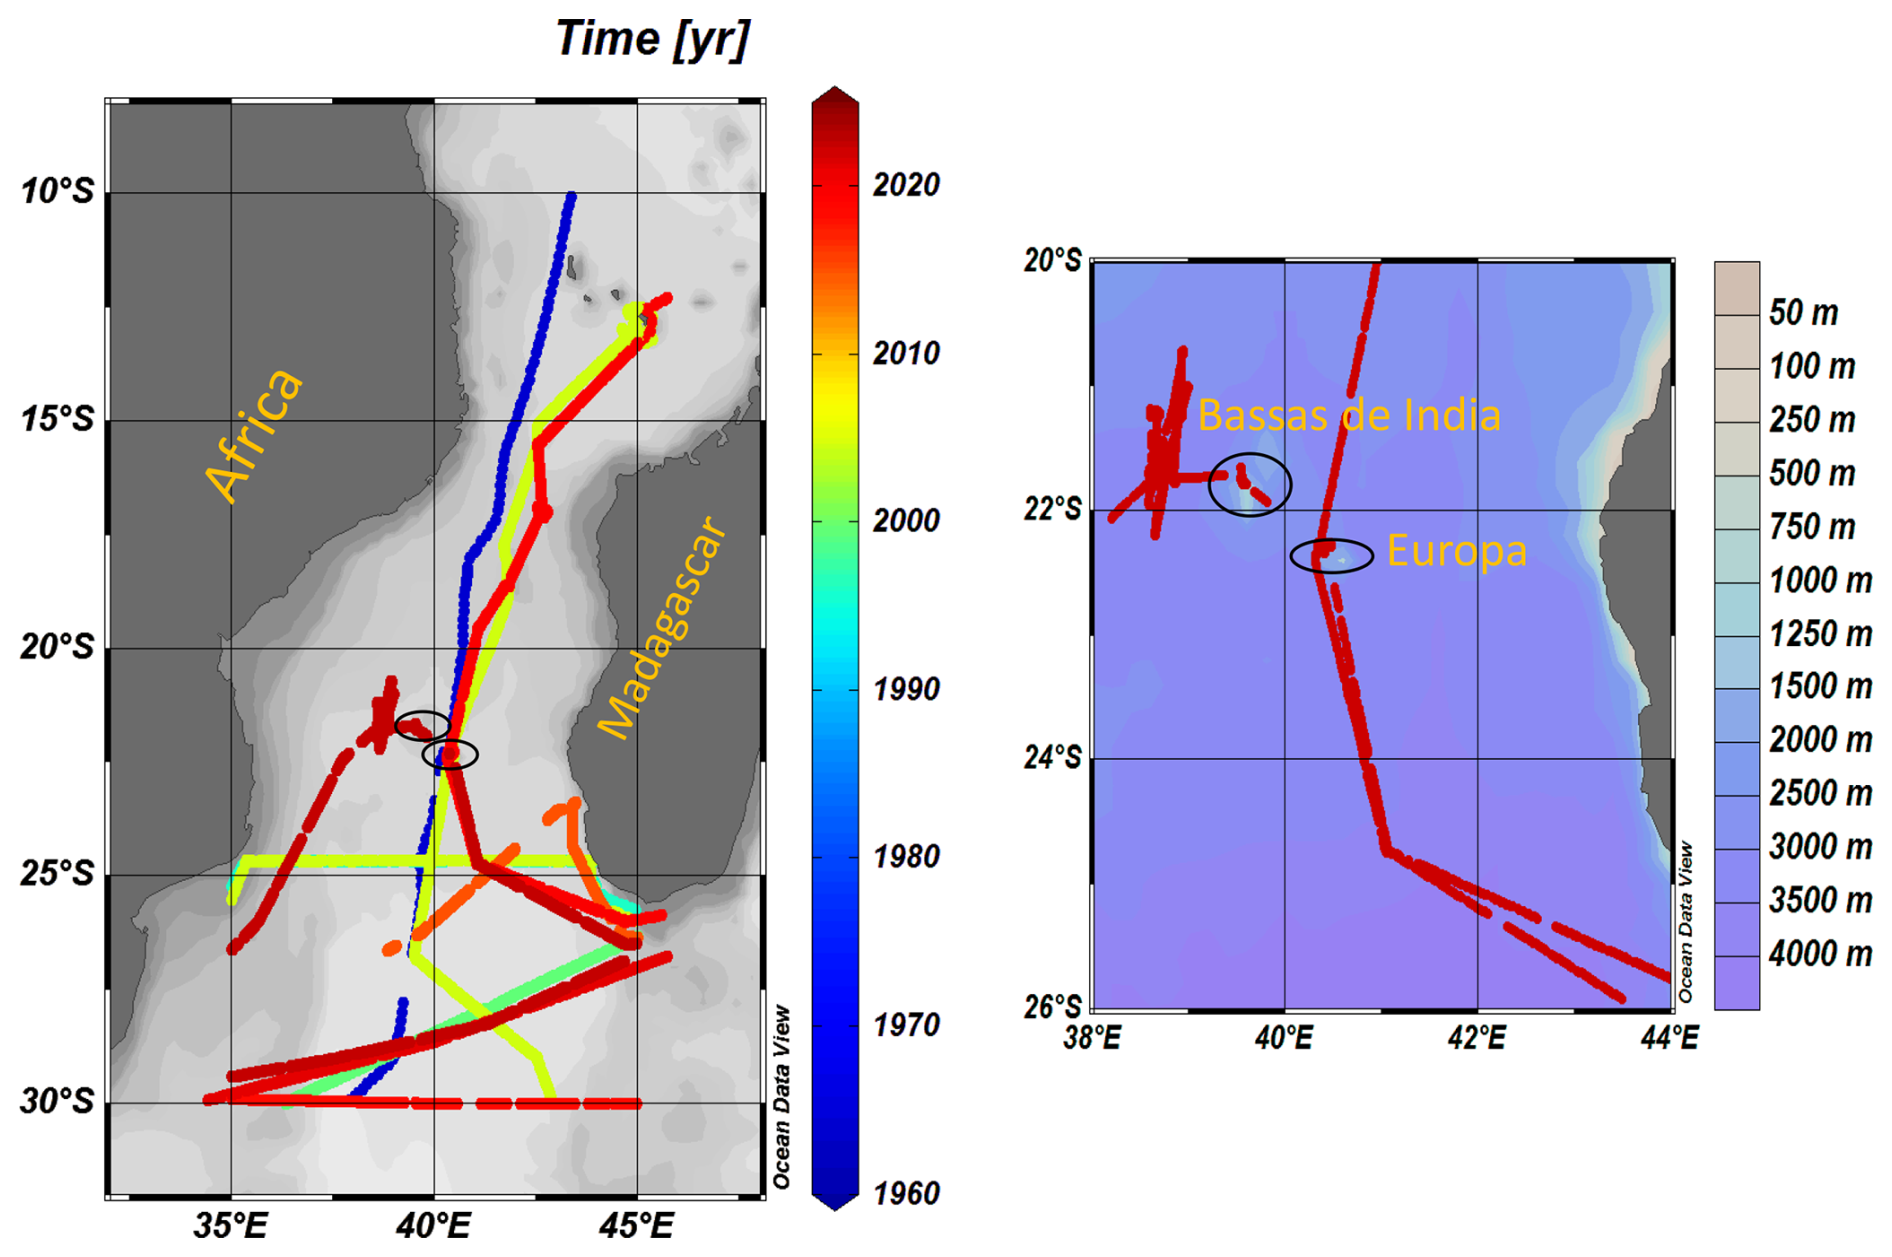
Figure 1Left: Tracks of cruises in the Mozambique Channel in the SOCAT data-base, version v2024 (Bakker et al., 2016, 2024). This includes recent OISO-31 and RESILIENCE cruises in 2021 and 2022. Color code is for Year. Black circles identified the coral reefs locations. Right: Tracks of cruises near the coral reefs area. Figures produced with ODV (Schlitzer, 2018).
2.1 Data selection
To explore the long-term change of the carbonate system in this region, we selected the fCO2 SOCAT data, version v2024 (Bakker et al., 2016, 2024). With recent cruises conducted on-board the ship Marion-Dufresne in January 2021 (OISO-31) and April–May 2022 (RESILIENCE) this includes 10 cruises in the Mozambique Channel (Table 1 and Fig. 1). Some of these cruises were previously described to analyze the distribution air-sea CO2 fluxes and pH changes in the Mozambique Basin and the African coastal zone (Metzl et al., 2025b). Here we focus on the data obtained in the southern Mozambique Channel. To complete the shipboard data after 2022 we also used data from a BGC-Argo float (WMO ID 7902123) that was launched onboard R/V Sonne in the Mozambique Channel in late 2024. During some cruises (2004, 2019 and 2021) continuous underway AT and CT measurements were also performed (data available in Metzl et al., 2025a). These AT and CT data are used to compare and validate results of the pH trends based on fCO2 data.
2.2 Methods
The methods for surface underway fCO2 and AT CT measurements were described in previous studies (e.g. Lo Monaco et al., 2021). For fCO2 measurements during OISO-11 (2004), CLIM-EPARSES (2019), OISO-31 (2021) and RESILIENCE (2022) cruises, sea-surface water was continuously equilibrated with a “thin film” type equilibrator thermostated with surface seawater (Poisson et al., 1993) and xCO2 in the dried gas was measured with a non-dispersive infrared analyzer (NDIR, Siemens Ultramat 6F). Standard gases for calibration (around 280, 350 and 490 ppm) were measured every 6 h. The sea surface temperature (SST) and equilibrium temperature were measured using SBE21 and SBE38 probes (accuracy 0.002 °C) respectively. During the RESILIENCE cruise the difference of SST and equilibrium temperature was on average °C (n=6416). For all cruises, the sea surface salinity (measured with SBE21) was regularly checked with discrete samples and has been corrected if some drift was observed. The fCO2 in situ data were corrected for warming using corrections proposed by Copin-Montégut (1988, 1989). Note that when incorporated in the SOCAT data-base, the original fCO2 data are recomputed (Pfeil et al., 2013) using temperature correction from Takahashi et al. (1993). Given the very small difference between equilibrium temperature and sea surface temperature, the fCO2 data from SOCAT used in this analysis (Bakker et al., 2024) are almost identical (within 1 µatm) to the original fCO2 values.
During 3 cruises, in January 2004 (OISO-11), April 2019 (CLIM-EPARSES) and January 2021 (OISO-31), AT and CT were measured continuously in surface water using a potentiometric titration method (Edmond, 1970) in a closed cell. For calibration, we used the Certified Referenced Materials provided by Andrew Dickson (SIO, University of California). Based on repeatability from duplicate analyses of continuous sea surface sampling at the same location (when the ship was stopped) we estimated the accuracy for both AT and CT better than 4 µmol kg−1 (Metzl et al., 2025a). The AT and CT data for these cruises are available at the Seanoe platform (https://doi.org/10.17882/102337, Metzl et al., 2024). These data offered comparisons and validation for the calculations of the carbonate system properties using fCO2 data and AT Salinity relationship.
2.3 Carbonate system calculation and AT Salinity relationship
When two of the carbonate system properties are measured (here either fCO2, AT or CT) they can be used to calculate other species and the saturation state of aragonite (Ωar). Here we used the CO2sys program (version CO2sys_v2.5, Orr et al., 2018) with K1 and K2 dissociation constants from Lueker et al. (2000) and KSO4 constant from Dickson (1990). The total boron concentration is calculated according to Uppström (1974). When using fCO2 data to derive pHT (pHT for Total Scale) or CT, one needs AT concentrations that can be derived from salinity (e.g. Millero et al., 1998). Here we used the AT/Salinity relationship adapted to the Mozambique Channel (Lo Monaco et al., 2021).
2.4 CMEMS-LSCE-FFNN model
The fCO2 data are not available each year and only for few seasons (Table 1). To complete the observations we used the results from an ensemble of feed-forward neural network model (CMEMS-LSCE-FFNN or FFNN for simplicity here, Chau et al., 2024). Based on the SOCAT gridded datasets this model composes surface ocean carbonate system fields at 0.25×0.25 square degree resolution and monthly scale. The reconstructed fCO2 is used to derive monthly surface CT, pHT and aragonite and calcite saturation states, as well as air-sea CO2 fluxes. A full description of the model is presented in Chau et al. (2024) and the datasets including uncertainties are available under the DOI https://doi.org/10.48670/moi-00047 (Copernicus Marine Service, 2024a).
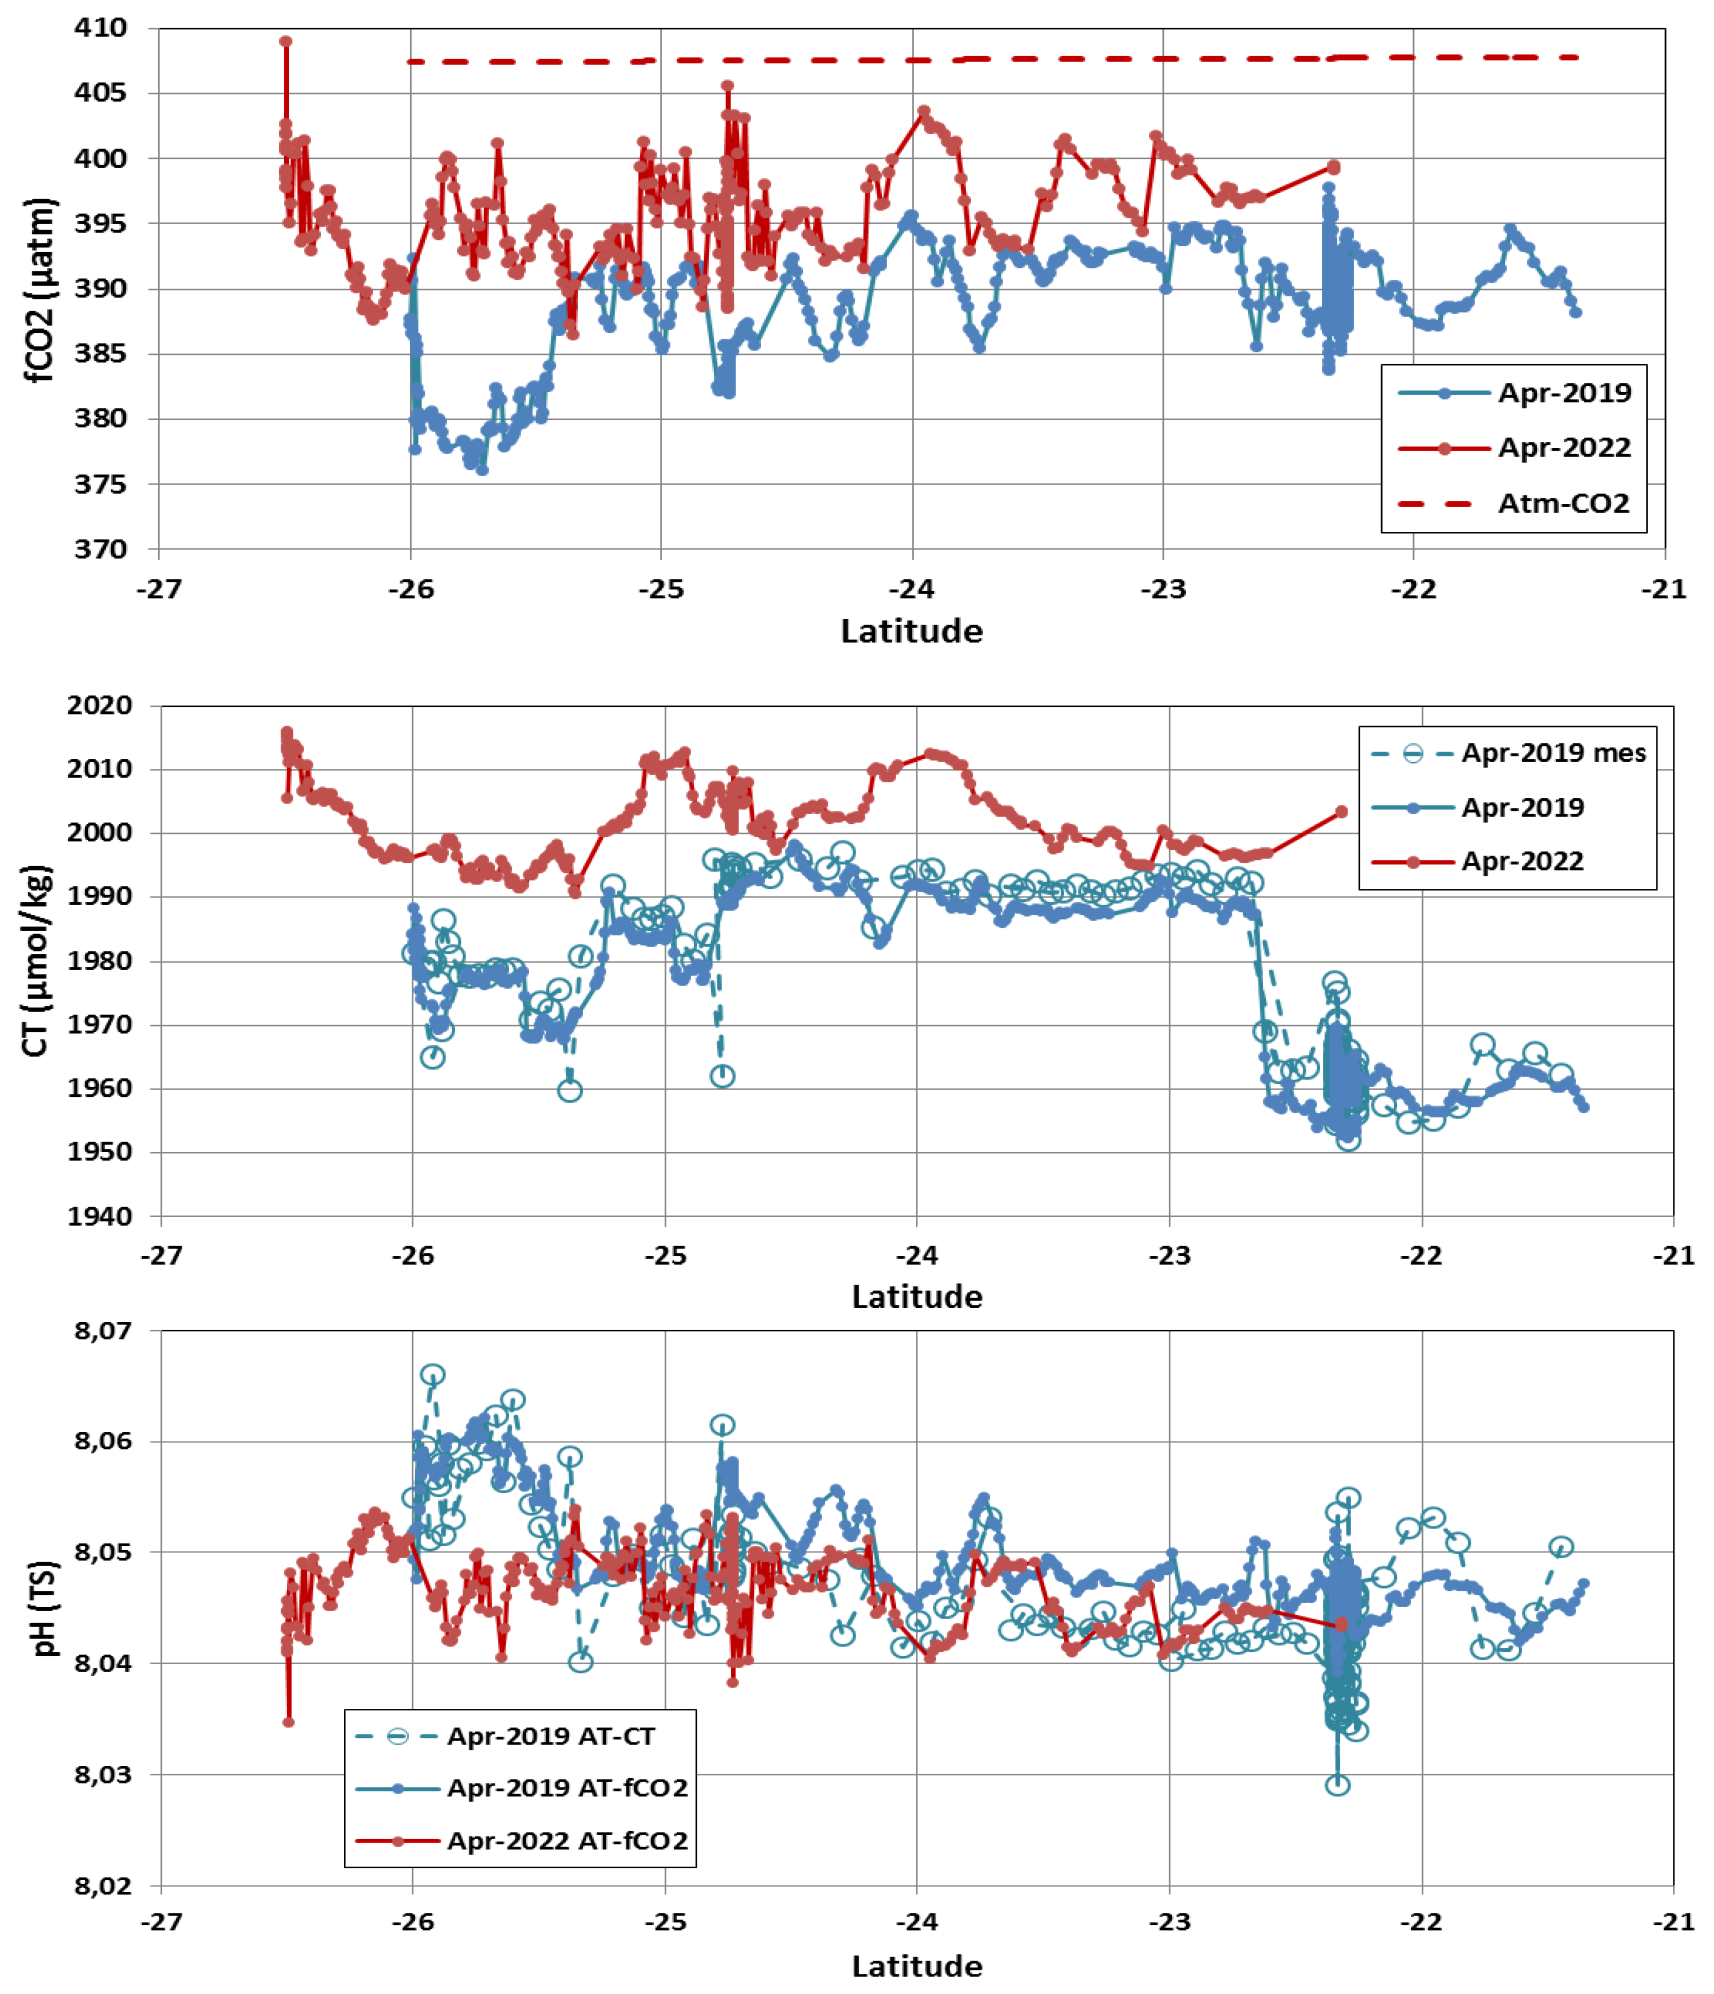
Figure 2Distribution of measured fCO2 (µatm), calculated CT (µmol kg−1) and calculated pHT (TS) along a repeated track in April 2019 (blue) and April 2022 (red) in the southern Mozambique Channel. The dashed red line is for atmospheric fCO2 in 2022. The underway CT measurements in 2019 are also shown (open circles) as well as pHT calculated using measured AT and CT. Average values for the latitudinal band 23–26° S are presented in Table 2.
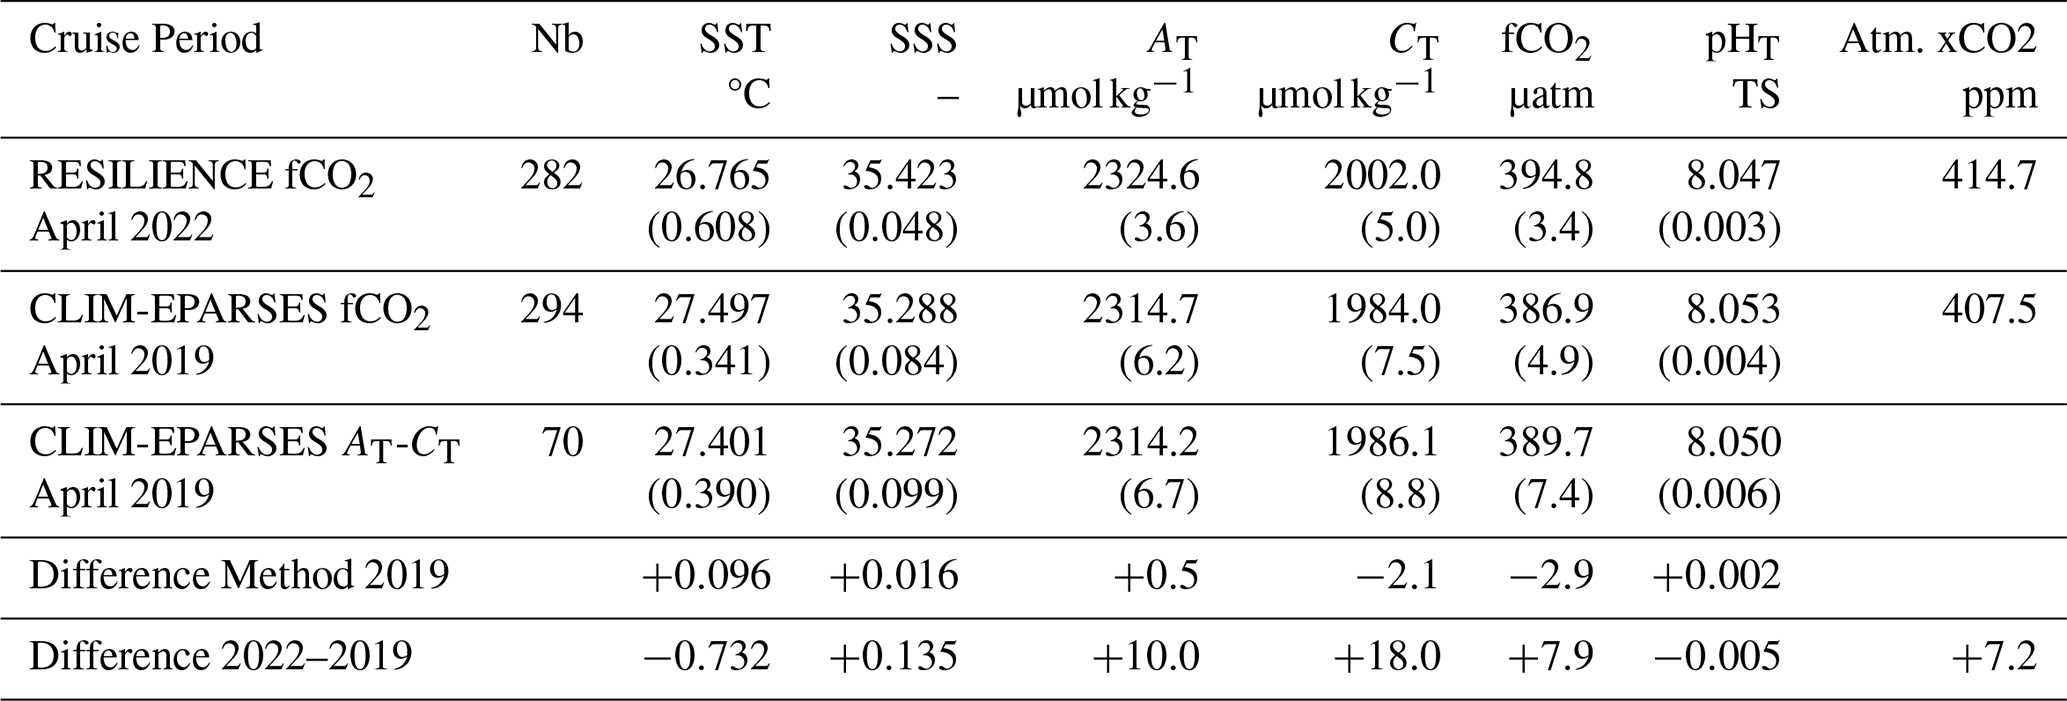
Table 2Mean values of underway sea surface observations and their difference obtained along the same track in 2019 and 2022 in the region 23–26° S (see Fig. 2). Nb is the number of data. Standard-deviations are in bracket. For 2019 (CLIM-EPARSES cruise), the results from underway AT-CT measurements are listed allowing calculation of fCO2 and pH based on the AT-CT pairs which permit comparisons with those derived from fCO2 measurements.
3.1 A Repeated line in 2019 and 2022
In April 2019 and 2022 underway measurements were conducted for fCO2. The measurements of AT and CT were also performed in 2019. The tracks of the cruises enabled to select the data obtained along the same track and for the same season in the southern Channel in order to compare the observations three years apart (Fig. 2). Given the variability observed around Europa Island and the front identified at 22.5° S in April 2019 (Fig. 2) the data were averaged in the band 23–26° S. The mean values over the same latitudinal band (23–26° S) show significant differences between 2019 and 2022 (Table 2). In 2022 the ocean was slightly colder and saltier. Consequently, AT concentrations were also higher in 2022 but the salinity normalized AT (N-AT normalized at salinity 35) were the same with a difference of +1.1 µmol kg−1. As expected, due to the CO2 uptake, the oceanic fCO2 and CT concentrations were higher in 2022 and pHT was lower. The increase of oceanic fCO2 over 3 years (+7.9 µatm) was almost the same as in the atmosphere (+7.0 µatm). At constant AT, salinity and temperature, the observed fCO2 change would translate in an increase of +4.4 µmol kg−1 for CT when we observed an increase of +18 µmol kg−1 (Table 2). We interpret this difference as being due to the regional circulation. In April 2019 southward currents would import low CT and AT whereas in April 2022 northward currents would transport colder and saltier waters with higher CT and AT. This reversed circulation is confirmed with the ADCP data recorded during the cruises as well as from the geostrophic currents (Metzl et al., 2022; Ternon et al., 2023).
For pHT, the decrease of −0.005 over three years, i.e. −0.0017 yr−1, is surprisingly close to what is generally observed at global scale and over several decades ( yr−1, Chau et al., 2024). Finally, we note that the difference between 2019 and 2022 measurements is much higher than that obtained when comparing measured and calculated AT CT values (Table 2). This confirms the use of fCO2 data and adapted relationship to derive the carbonate system properties in this region (Lo Monaco et al., 2021; Metzl et al., 2025b), and to explore the seasonal cycles and long-term trends described in the next sections.
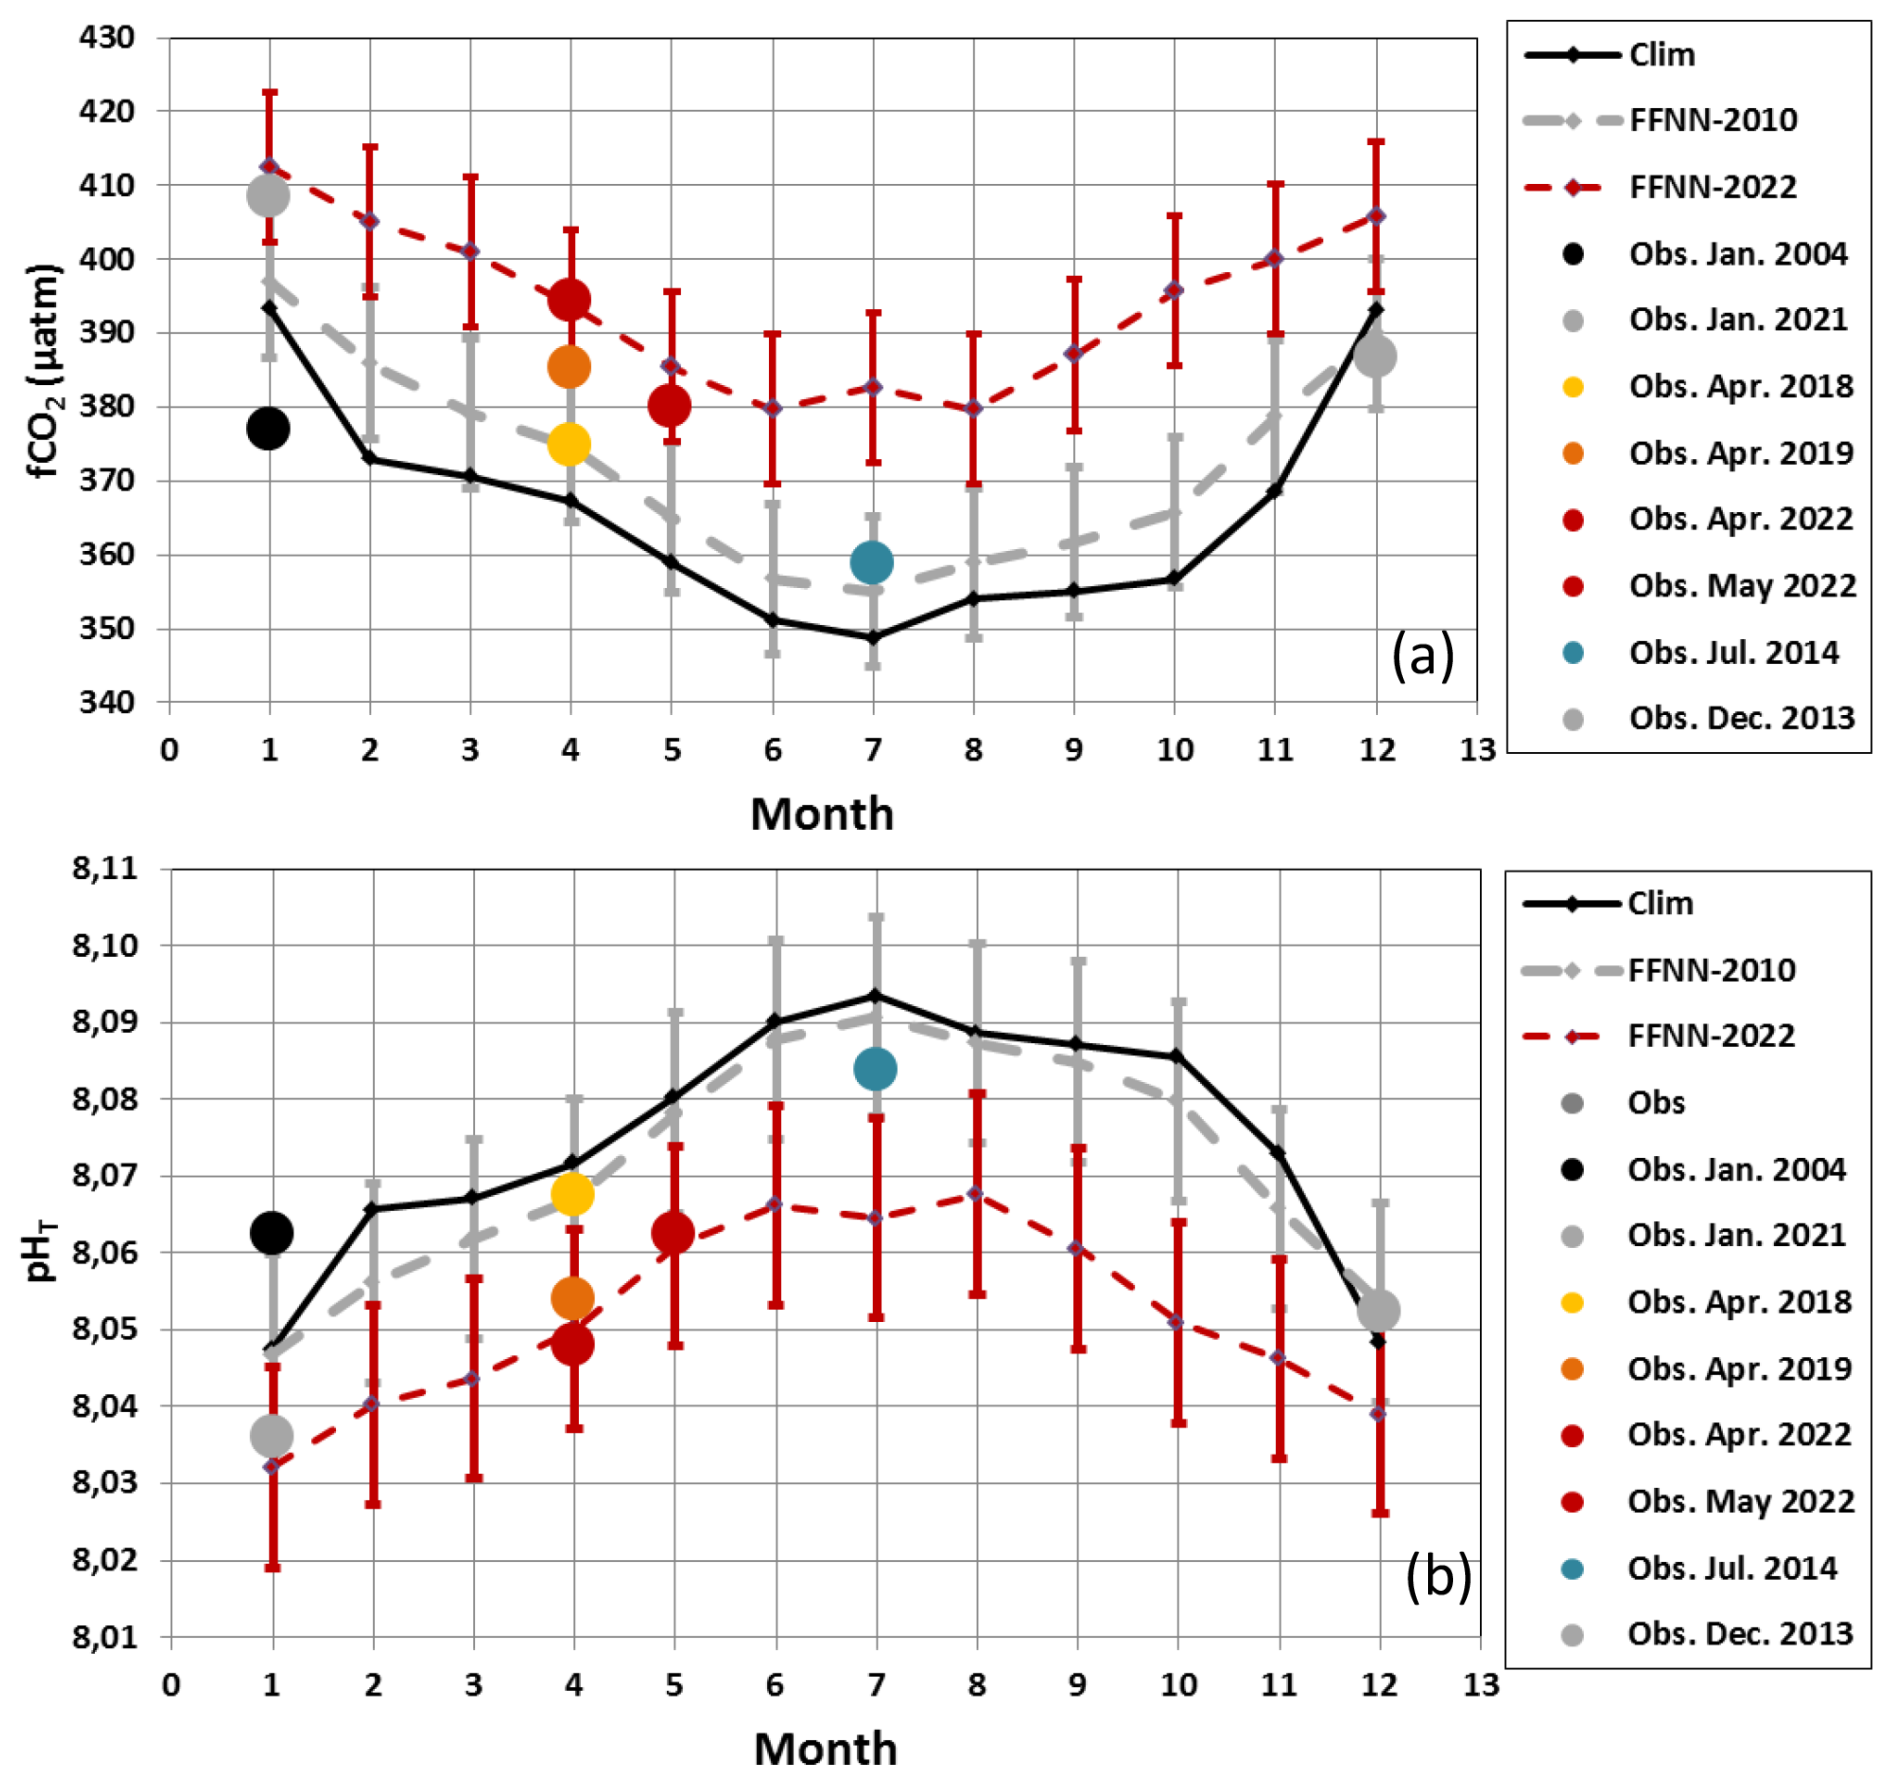
Figure 3Seasonal cycle of (a) fCO2 (µatm) and (b) pHT in the southern Mozambique Channel (24–30° S). Average observations are presented for each cruise (colored circles). The full seasonal cycles are shown for the monthly climatology (reference year 2010, Fay et al., 2024) and for the FFNN model for years 2010 and 2022 with respective error bars.
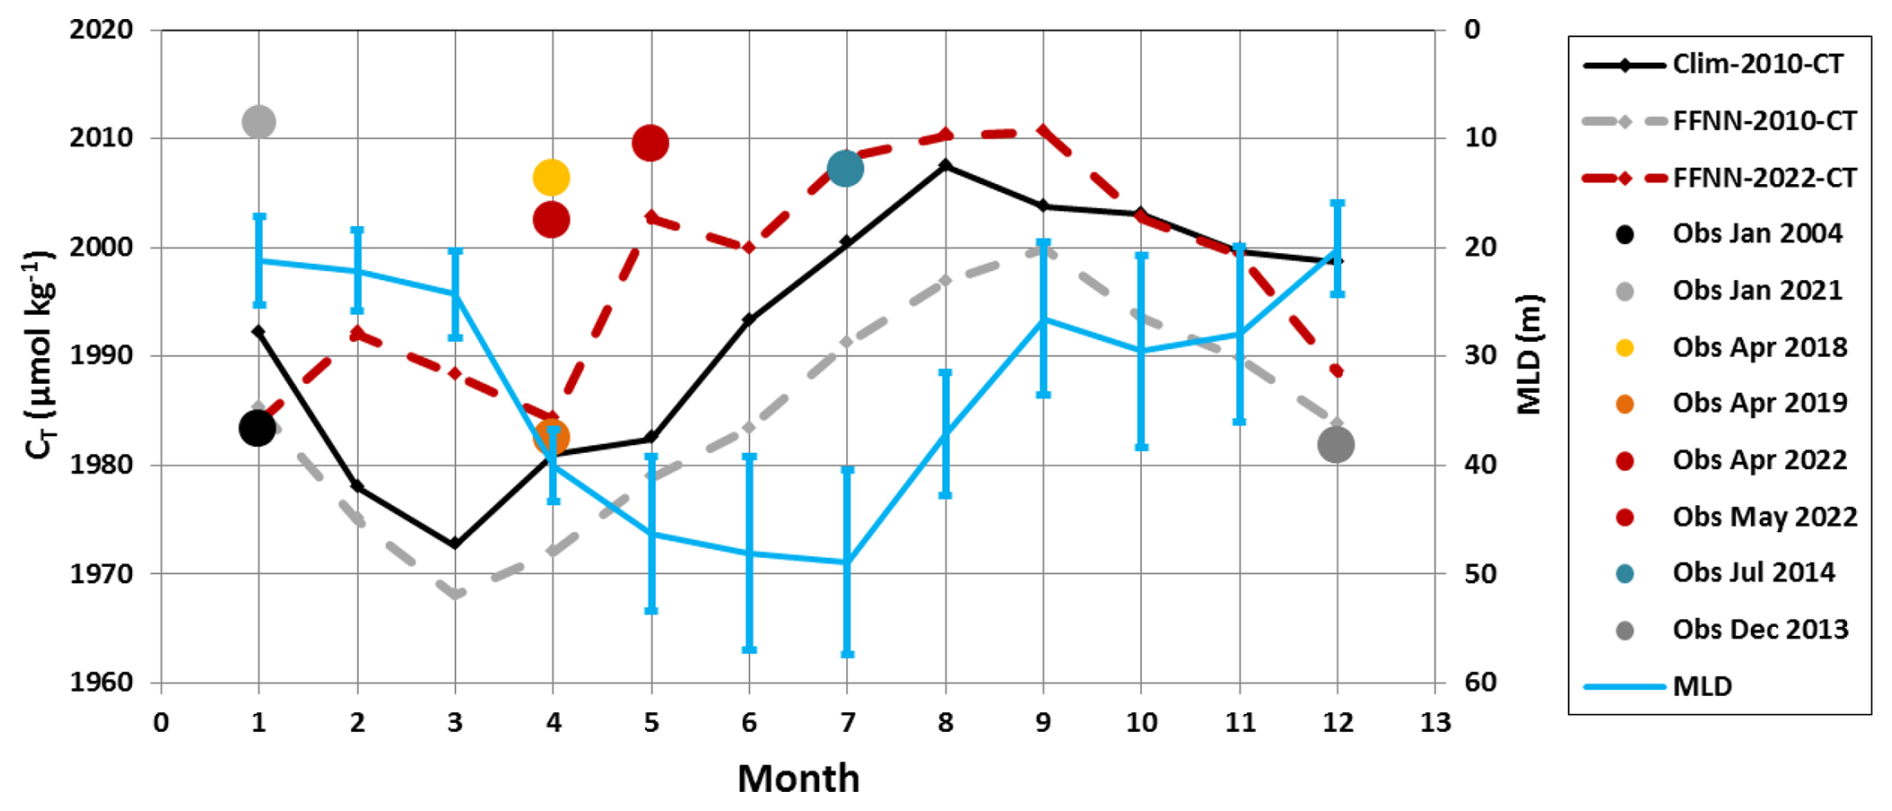
Figure 4Seasonal cycle of CT (µmol kg−1) in the southern Mozambique Channel (24–30° S). Average observations are presented for each cruise (colored circles). The full seasonal cycles are shown based on the monthly climatology for a reference year 2010 (Fay et al., 2024) and the FFNN-LSCE model for year 2010 (Chau et al., 2024). The mixed-layer depth (MLD in m, blue line) is averaged in this region (from multi-year reprocessed monthly data, ARMOR3D L4, https://doi.org/10.48670/moi-00052, Copernicus Marine Service, 2024b).
3.2 Seasonal variations
In the Mozambique Channel, where SST presents large seasonal variations (up to 4 °C), fCO2 is mainly controlled by temperature like in the Indian subtropics (e.g. Metzl et al., 1998; Takahashi et al., 2002; Bates et al., 2006). In this region, observations are not available for all seasons (Table 1) but the seasonal range derived from the climatology (Fay et al., 2024) or the FFNN model (Chau et al., 2024) is coherent compared to the data (Figs. 3, S1). The observations and the models indicate that between January and July fCO2 decreases by about 50 µatm while pHT increases (0.03 to 0.04 units). This is a large signal compared to the expected decadal change (about +20 µatm decade−1 for fCO2 and −0.017 decade−1 for pHT); therefore, to derive and interpret the trends, data have to be selected for the same season. As opposed to fCO2, CT presents lower concentrations in February–April and higher ones in July–August (Fig. 4). When the mixed-layer depth (MLD) is shallow in December–March the decrease of CT is probably linked to biological activity but this is not clearly quantified (Lo Monaco et al., 2021). The progressive CT increase of about +30 µmol kg−1 from March to August is likely driven by vertical mixing when MLD is deeper in austral winter (Fig. 4).
This seasonality was well observed from repeated measurements at stations located along 25° S in June 1995 and December 2003 (Fig. S2). In June 1995 when the MLD reached 80 m, CT concentrations were homogeneous within the MLD layer. The same was true for the anthropogenic CO2 concentrations (Cant) here evaluated using the TrOCA method (Touratier et al., 2007). On the opposite, in December 2003, when the MLD was shallower, CT presented a sharp increase within the subsurface layer whereas Cant concentrations were unrealistic in surface seawaters. Although from 1995 to 2003 the CT concentrations would increase by around +7 µmol kg−1 due to the anthropogenic CO2 uptake in that region (Murata et al., 2010; Metzl et al., 2025b), N-CT (normalized CT at salinity 35) in June 1995 were almost the same as in December 2003 coherent with the seasonal cycle derived from the climatology (Fig. 4).
The seasonal variations of fCO2 and pHT in the Mozambique Channel appear thus linked to both temperature and mixing process with competition between the two drivers (Fig. S3). In addition to the rising atmospheric CO2, these two processes probably also drive inter-annual, decadal and long-term change of fCO2 and pHT in the region as the Indian Ocean experienced a pronounced warming (Cheng et al., 2025). Specifically, in the southern Mozambique Channel the SST has increased by °C per decade since the 1960s (Fig. S4), a signal that should be taken into account when interpreting the decadal trends of carbonate properties and CO2 fluxes. In January 2025 the SST anomaly reached +1.6 °C at 25° S in the Channel.
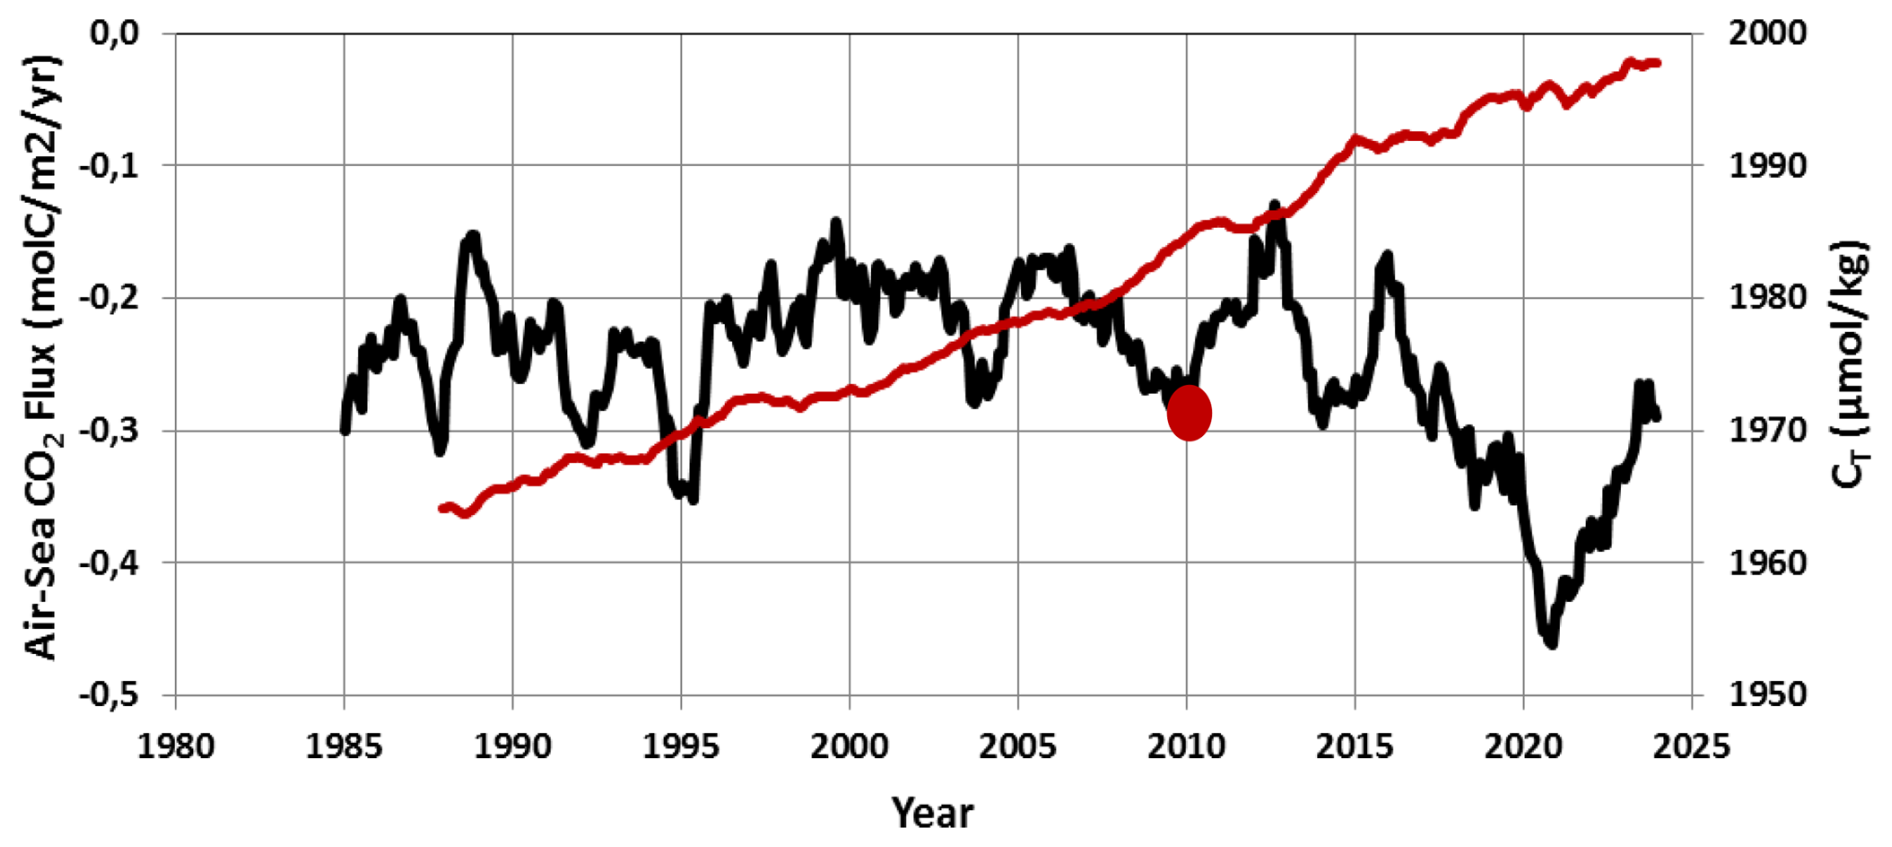
Figure 5Time-series of air-sea CO2 flux (black, negative for ocean sink) and CT concentration (red) averaged in the southern Mozambique Channel (24–30° S) based on the FFNN-LSCE model over 1985–2023. For CT, the result is presented with a 36-month running mean. Also shown is the climatological value of the flux for year 2010 in this region (red circle, Fay et al., 2024).
3.3 Trends in the Southern Mozambique Channel (1963–2023)
In this region, the ocean is a permanent CO2 sink leading to a gradual increase of CT concentrations and decrease of pHT. The air-sea CO2 flux derived from the FFNN model is on average −0.249 (±0.063) mol C m−2 yr−1 (Fig. 5) in the range of the climatology (−0.3 mol C m−2 yr−1, Fay et al., 2024). The FFNN model also suggests that the sink reinforced over 2016–2021 with a perceptible faster increase of CT (Fig. S5).
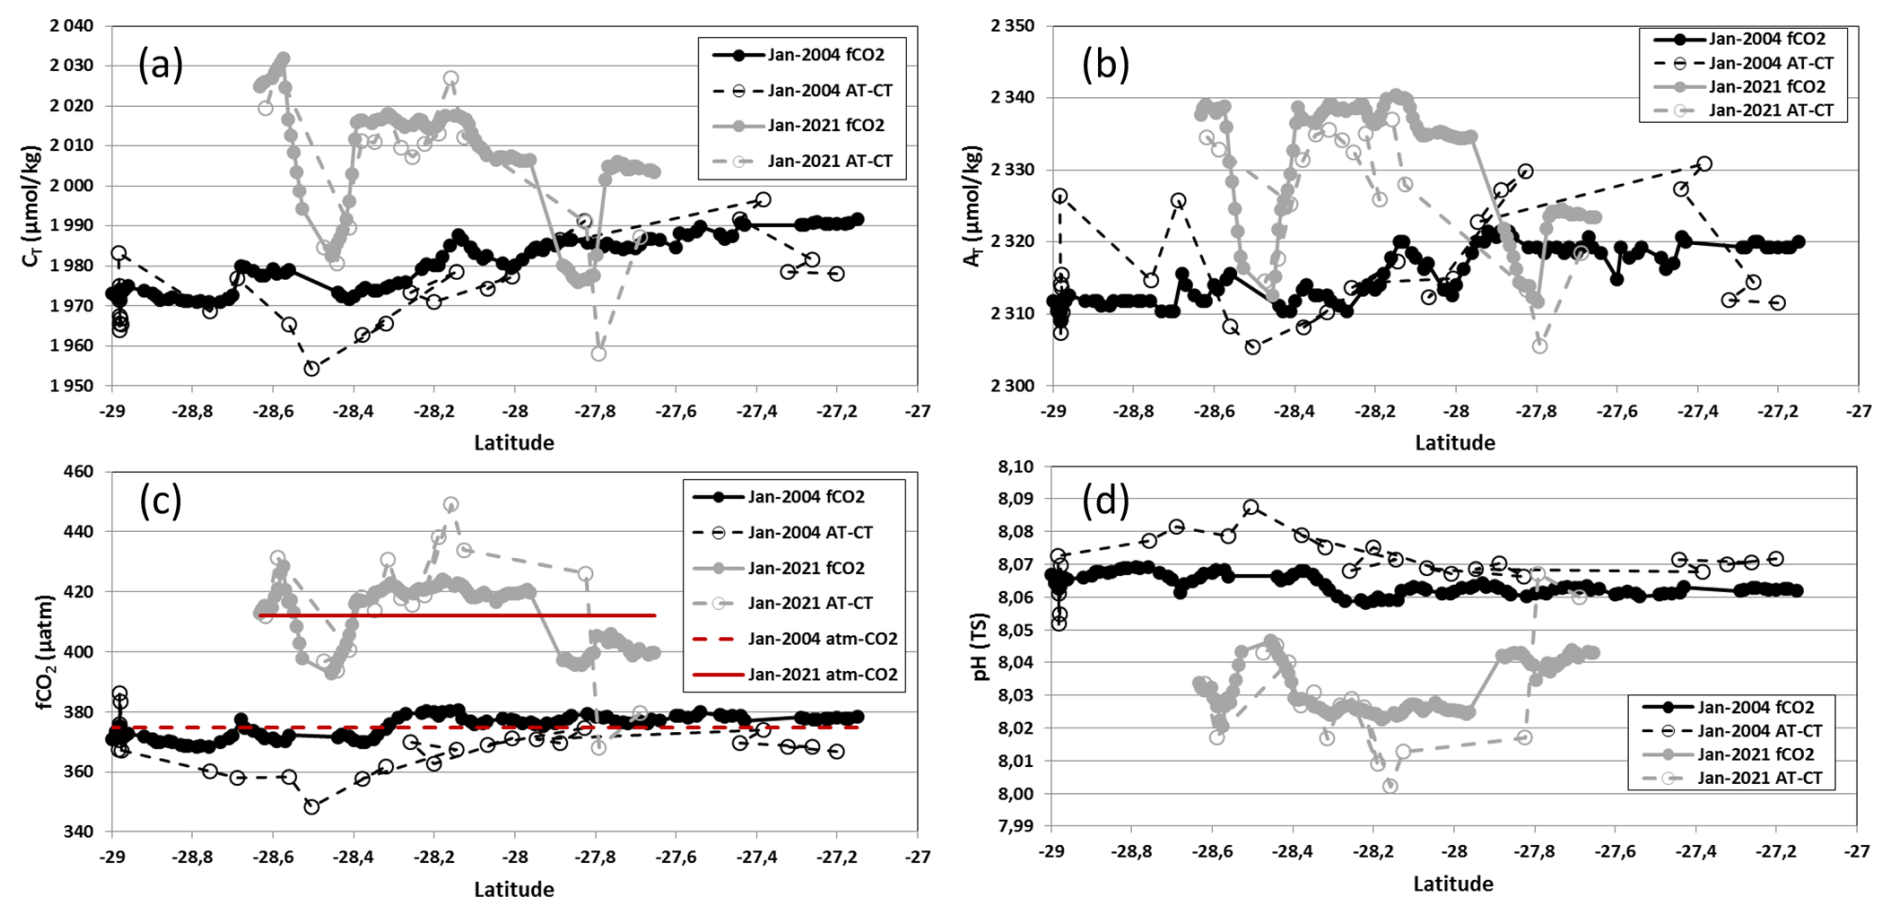
Figure 6Distribution of measured or calculated CT (a, µmol kg−1), AT (b, µmol kg−1), fCO2 (c, µatm) and pHT (d) along the same track in January 2004 (black symbols) and January 2021 (grey symbols). Values derived from fCO2 measurements are in filled symbols/lines, those from the AT CT measurements in open symbols/dashed lines. In (c) the red lines represent the atmospheric CO2 in 2004 and 2021. Average values and their differences are presented in Table 3.
Table 3Mean values of underway sea surface observations and their difference obtained in the same region (27–29° S/40–43° E) in January 2004 and 2021. Nb is the number of data. Standard-deviations are in bracket. The results are presented for both methods (underway fCO2 or AT-CT measurements) and fCO2, pHT calculated with AT-CT pairs compared with those derived from fCO2 measurements. The last lines are the difference for 2021 minus 2004 and errors associated to the measurements or calculations (*).
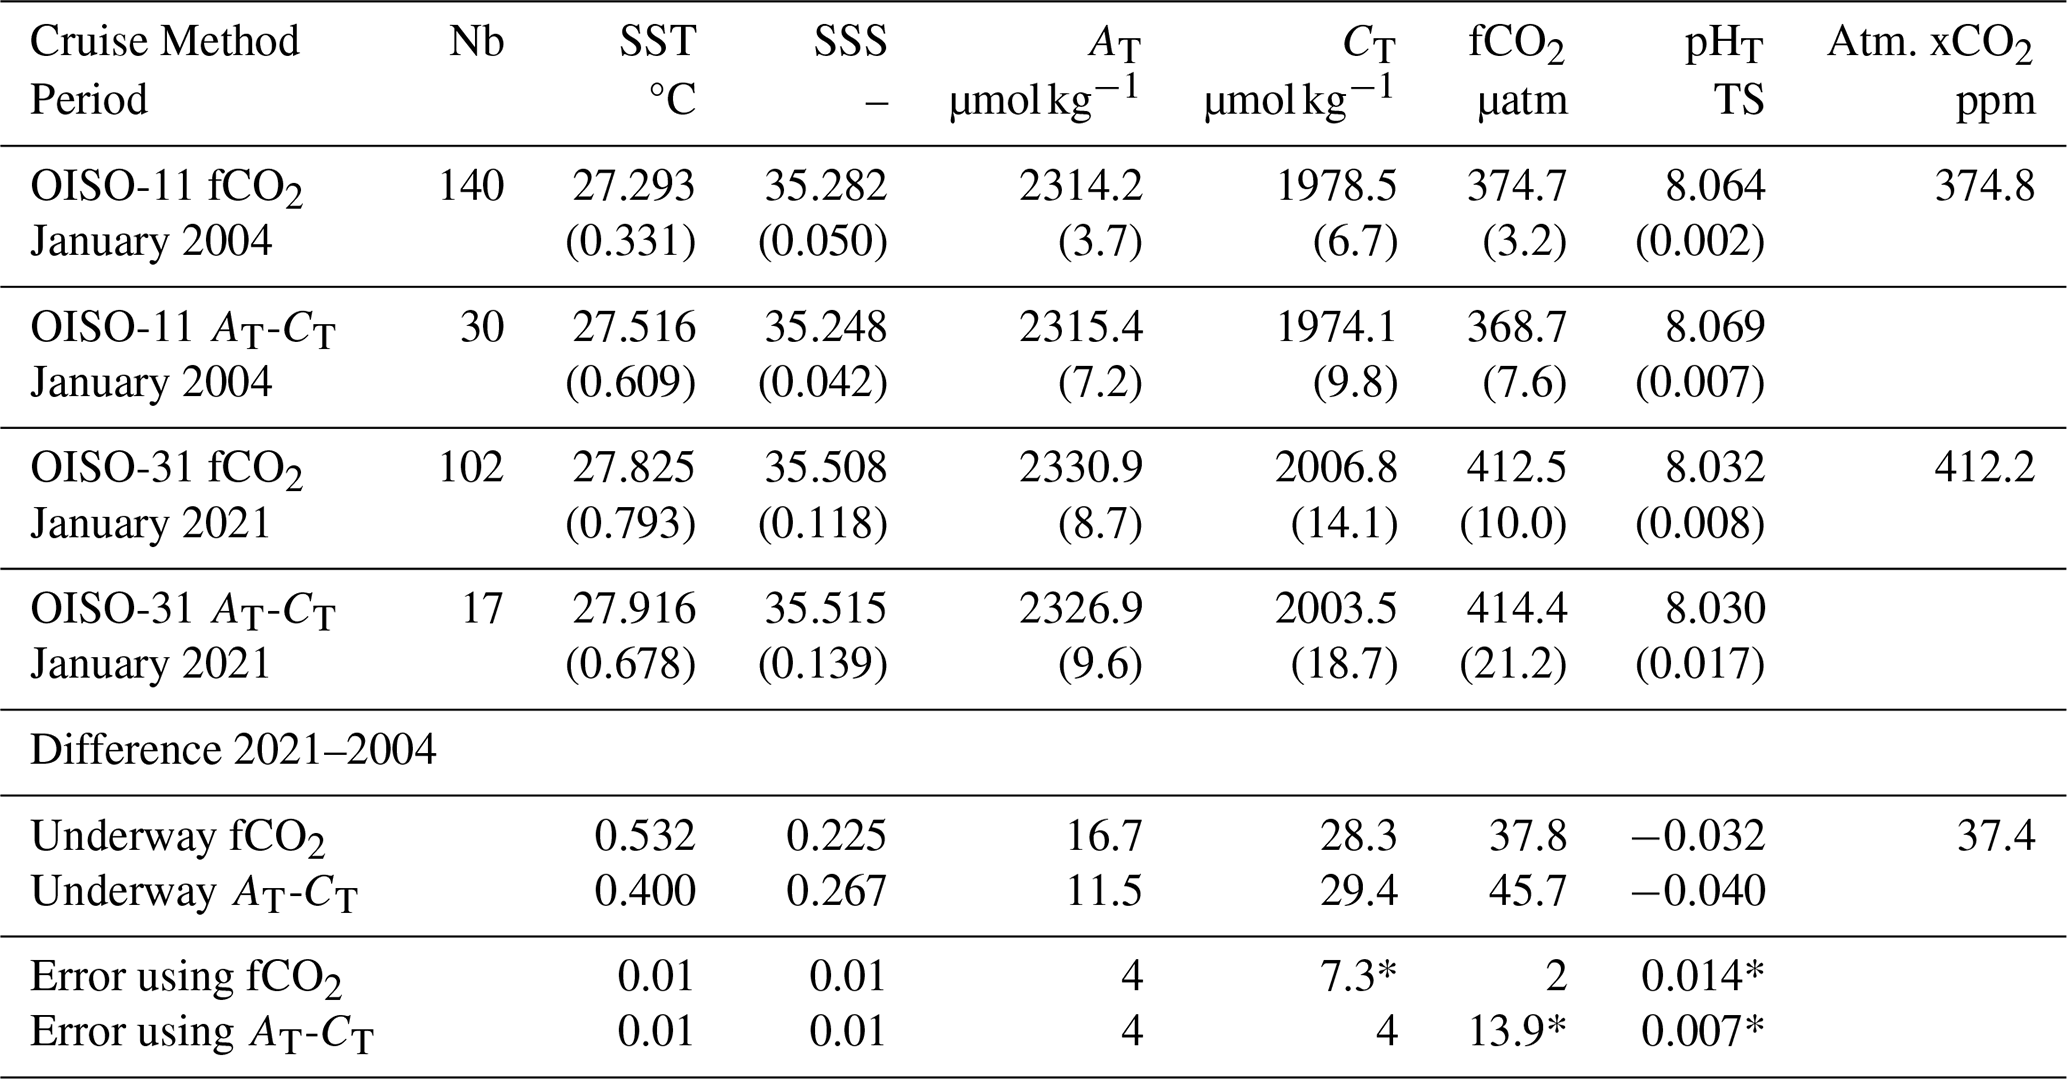
3.3.1 Decadal trend from fCO2 and AT CT data: January 2004 and 2021
We started the analysis of the decadal change by comparing observations obtained in January 2004 and 2021 when data were available for both underway fCO2, AT and CT measurements. The comparison is focused along the tracks occupied in the same region (27–29° S/40–43° E, Fig. 6, Table 3). For both cruises the differences between measurements and calculations are in the range of the errors in the CO2sys calculations (errors on measurements and constants K1, K2, Orr et al., 2018). For example, in January 2004 the pHT calculated with AT and CT measurements was 8.069 against 8.064 when using the fCO2 data and the relationship. In 2021 the pHT were respectively 8.030 and 8.032 (Table 3). For CT the difference between calculated and measured CT was only 4.4 µmol kg−1 in 2004 and −1.9 µmol kg−1 in 2021 when the observed increase over 17 years is around 28 µmol kg−1. We noticed that in 2021, the properties present a high variability along the track linked to the presence of eddies. The CT and AT concentrations could vary by about 20 to 40 µmol kg−1 at meso-scale but this has a small impact on calculated fCO2 and pHT, and when properties are averaged along the track (Table 3). For both periods the ocean fCO2 was close to atmospheric CO2, i.e. near equilibrium (fCO-fCOfCO µatm in 2004 and 0.37±10.04 µatm in 2021). Although there were some differences of pHT calculated from the two data-sets (underway fCO2 or AT CT data), the estimated pHT change of −0.032 or −0.040 over 17 years was large compared to the uncertainty of the CO2sys calculation. This would correspond to a pHT trend varying between −0.0019 and −0.0023 yr−1. This comparison of observations in January 2004 and 2021 supports the use of the selected relationship for pH calculations based on all fCO2 data available over 1963–2023 in order to explore the long-term trend described in the next section.
Table 4Trends of properties in the southern Mozambique Channel derived from observations and the FFNN model. For observations, the trends are evaluated for April–May season only (based on few data-points identified as red circles in Fig. 7). For FFNN, trends are estimated for all seasons or only for January, April, May and July. Standard-deviations are in bracket.
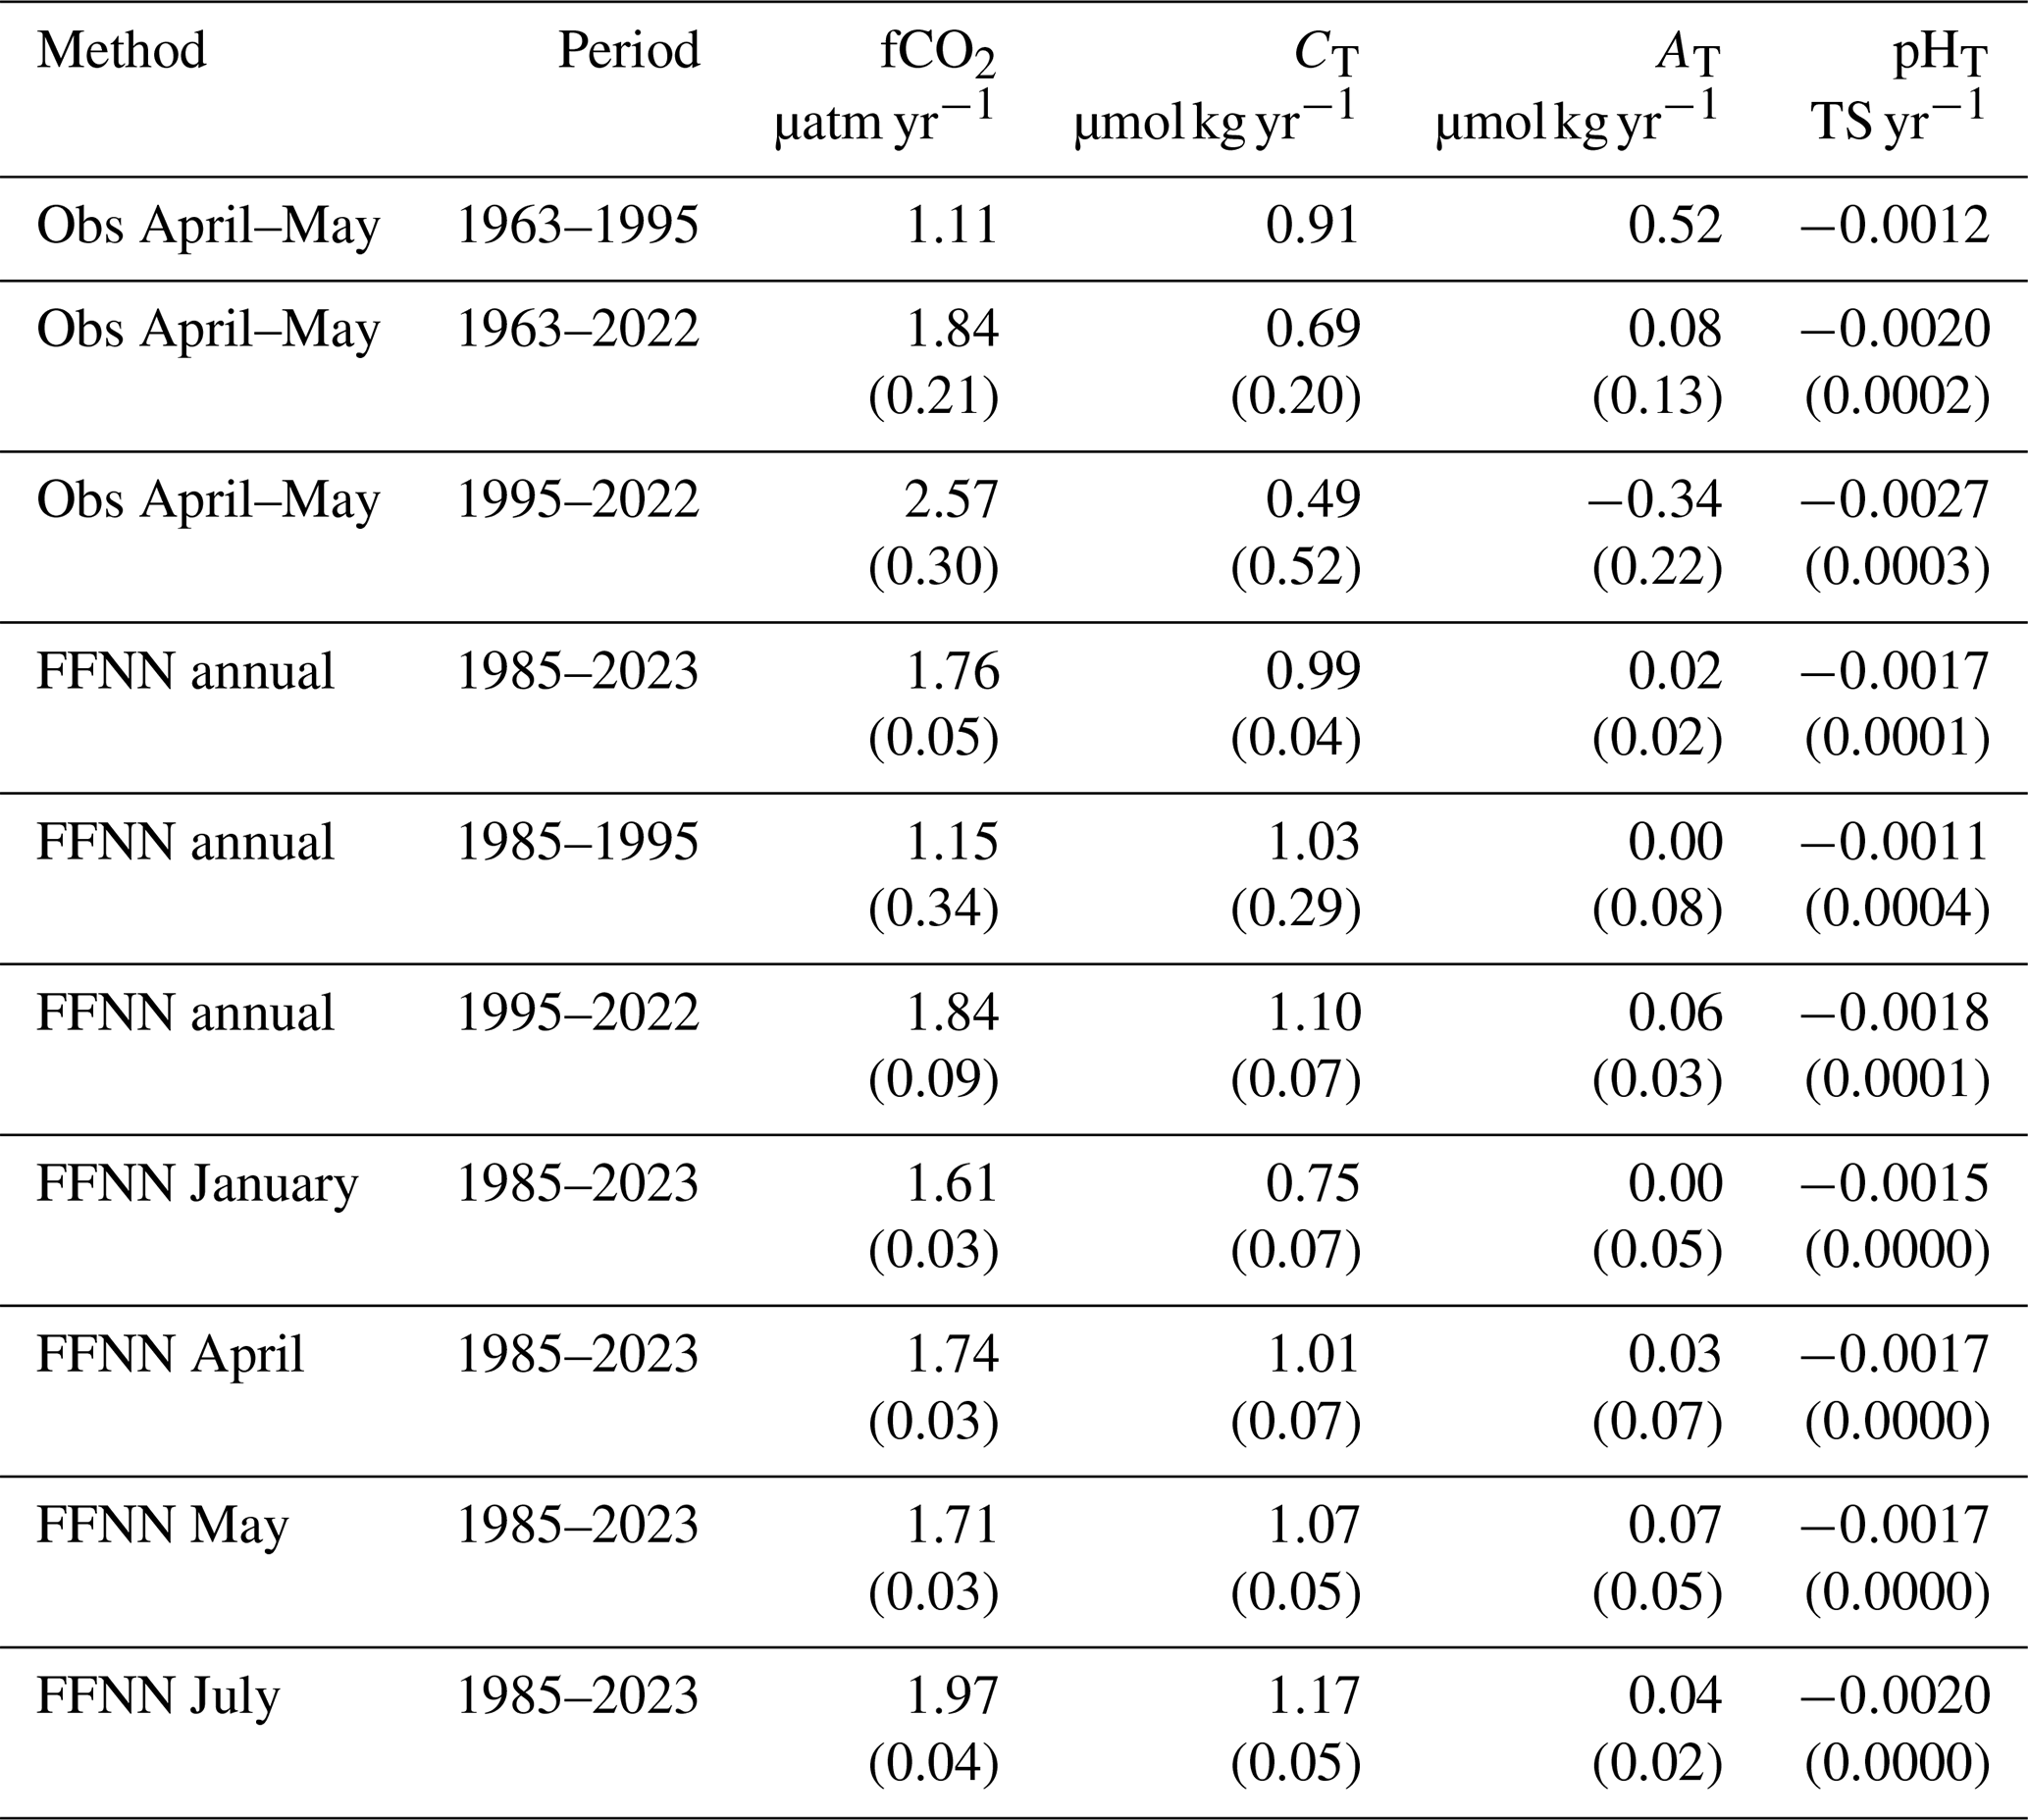
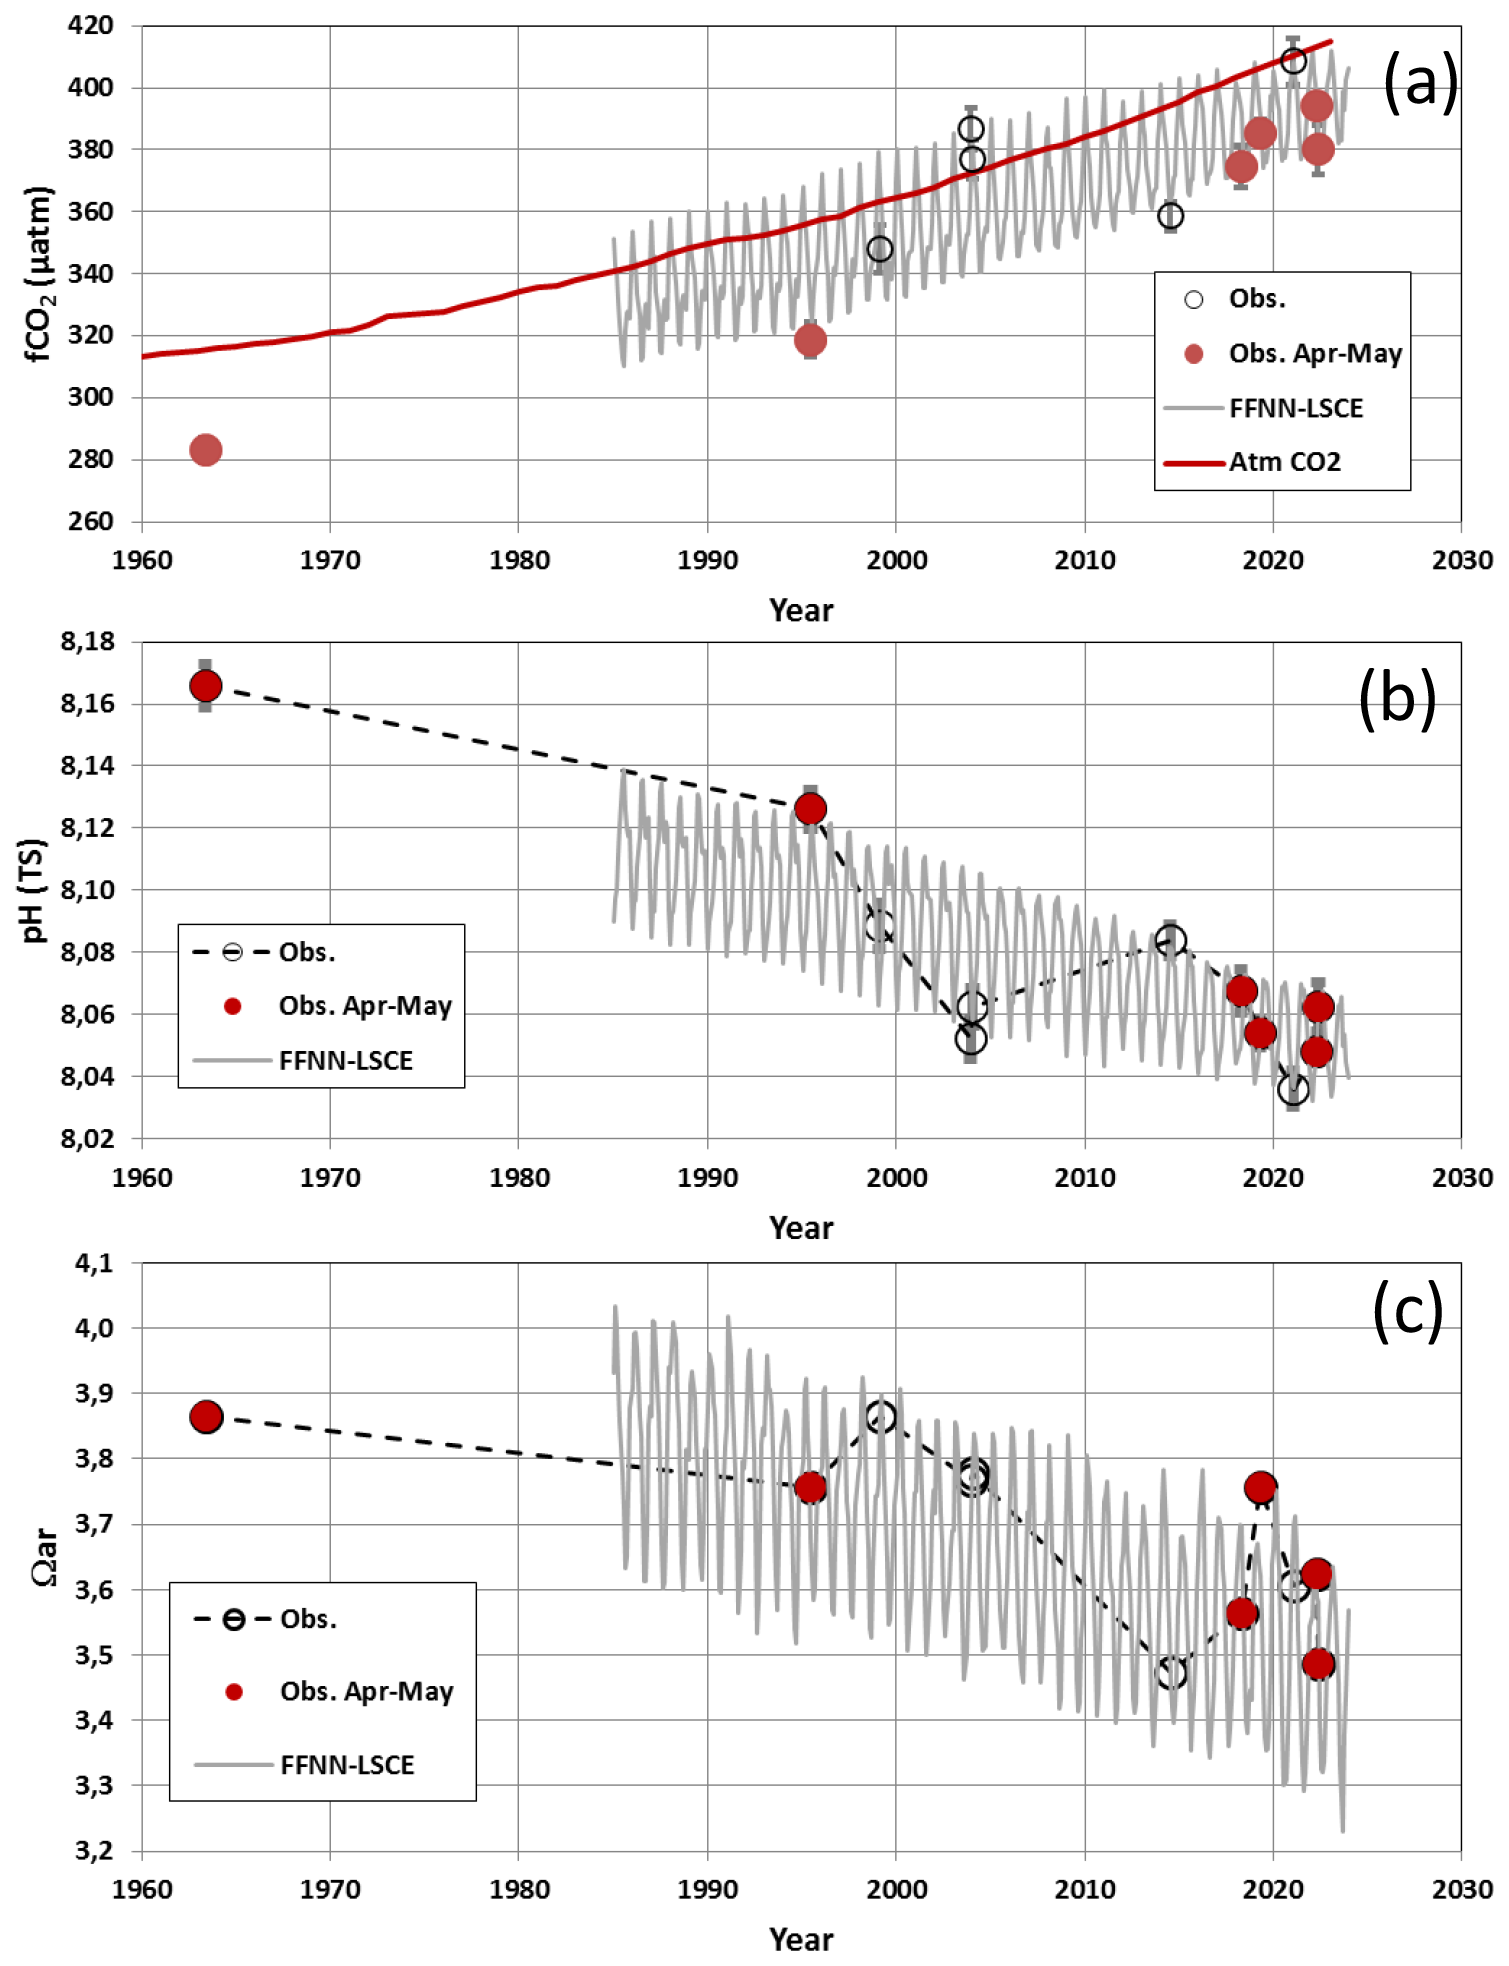
Figure 7Time-series of fCO2 (a), pHT (b) and Ωar (c) in the southern Mozambique Channel (24–30° S) based on averaged observations (circles) and the FFNN-LSCE model over 1985–2023. In (a) the red line represents the atmospheric CO2. Available observations are shown for all seasons but the trends (Table 4) evaluated using only April–May data (red circles).
3.3.2 Multi-decadal trends from fCO2 data (1963–2023)
For long-term trends, we used fCO2 observations and observations-based reconstructions averaged in the region 24–30° S (Table 4). As the observations are not available for all seasons, we selected the period April–May to calculate the trends from the data (same season for the first and the last cruises in 1963 and 2022) whereas the FFNN model offers information for all seasons. Back in the 1960s, the observations in 1963 indicate that the ocean was a CO2 sink in May (Fig. 7a), the value of ΔfCO µatm being almost the same as observed in May 2022 (ΔfCO µatm). This suggests a strong link between ocean and atmospheric fCO2 (Fig. S6).
For the first observational period, the changes between 1963 and 1995 indicated a pHT decrease of −0.040. Over 32 years this pHT change was driven by the CT increase (effect on pH), the AT increase (effect on pH) and the warming of 0.95 °C (effect on pH). Between 1995 and 2022 the observed decrease accelerated to −0.0027 (±0.0003) yr−1 (Table 4). In contrast, the neural network suggested smaller pHT trends. However, as in the observations, the annual pHT change from the model was faster in recent decades (−0.0018 yr−1 over 1995–2022 against −0.0011 yr−1 over 1985–1995, Table 4). The model also suggested different trends depending on the season. The pHT trend appeared indeed faster in July (when the ocean CO2 sink is stronger) than in January or April (Table 4).
The new data in 2021 and 2022 and the FFNN model extended to 2023 confirmed a previous analysis in the Mozambique Channel (Lo Monaco et al., 2021) with a pHT trend of −0.0023 yr−1 (±0.00048) over 1995–2019. Our new results in the southern Mozambique Channel are also in the range of the pHT trends previously evaluated at basin scale in the Indian Ocean, −0.0027 yr−1 (±0.0005) over 1991–2011 (Lauvset et al., 2015). High resolution ocean models applied to the northern Indian Ocean also suggest an acceleration of the acidification, with pHT trend reaching −0.0019 yr−1 (±0.0004) in 2010–2019 (Chakraborty et al., 2024), somehow lower than our estimate based on observations at regional scale in the Mozambique Channel (−0.0027 yr−1 ±0.0003 in 1995–2022, Table 4).
The aragonite saturation state (Ωar) was lower during austral summer (July–September). In May 1963, we estimated an aragonite saturation state of 3.86 (Fig. 7c). It dropped to 3.49 in May 2022, a value close to that observed in July 2014 (3.47). The lowest Ωar value of 3.23 was identified in September 2023 from the FFNN model. At that period, Ωar was lower than 3.3 in the south of 20° S in the Mozambique Channel (Fig. S7). This is close to the hypothetical critical threshold of Ωar=3.25, i.e. a risky level for coral reefs in the ocean claimed by Hoegh-Guldberg et al. (2007). Note that there are reefs know to thrive at Ωar<3.0 like at volcanic CO2 seeps in Papua New Guinea (Ωar=2.41, Strahl et al., 2015; see also review by Camp et al., 2018) but that their species composition and coral cover are different than at ambient conditions (i.e. Ωar>3.3 considering Hoegh-Guldberg et al., 2007). However, Strahl et al. (2015) showed that calcification rate seems to vary among coral species, suggesting take conclusions of Hoegh-Guldberg et al. (2007) with caution. With an annual trend of −0.010 yr−1 for Ωar over 1985–2023, a value of 3.3 would be reached in 2060 in summer whereas it was already observed in 2020 in winter with possible consequences on reef species composition and functioning (Tribollet et al., 2009, 2019; Schönberg et al., 2017; Camp et al., 2018; Eyre et al., 2018; Cornwall et al., 2021).
Although there are differences depending on the season and the method (in-situ observations, extrapolation of sparse in-situ observations through a FFNN model) all results suggest an acceleration of the acidification in the last few years (Table 4, Fig. 7) and a decrease of Ωar that are mainly driven by the CT increase through continuous ocean CO2 uptake (Ma et al., 2023). Given the rapid change of atmospheric CO2 in the recent years (up to +3.77 ppm yr−1 in 2024, Lan et al., 2025) how the carbonate system will change in the near future in this region and will impact corals reefs that are abundant (from Europa to Mayotte in the Mozambique Chanel) and subject to global warming, marine heat waves (e.g. Mawren et al., 2022; Alaguarda et al., 2022), ocean acidification, higher frequency of tropical cyclones and anthropogenic pressures (overfishing for instance), remains an important question.
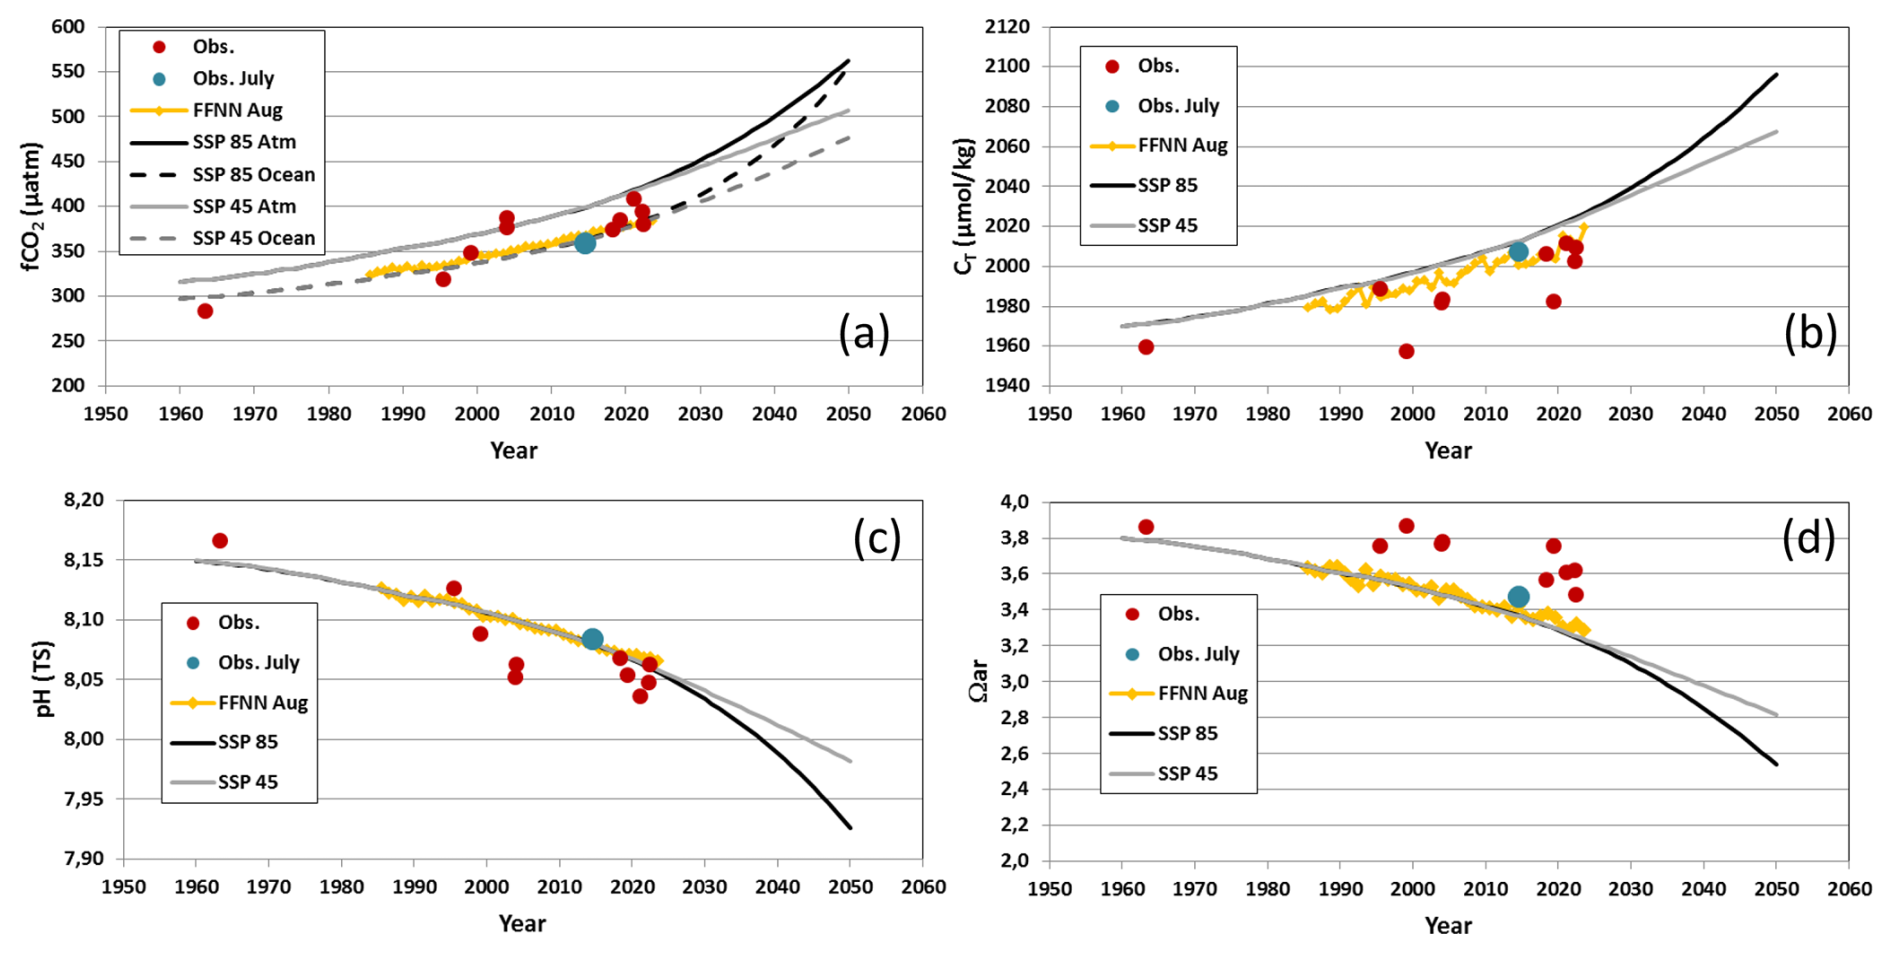
Figure 8Time-series of (a) atmospheric and oceanic fCO2, (b) CT concentrations, (c) pHT and (d) Ωar in the southern Mozambique Channel based on a reconstruction for August for two scenario (SSP85, black line, SSP45 grey lines). Averaged observations (all seasons, July in blue) and the FFNN-LSCE model over 1985–2023 in August (orange) are also shown.
3.4 Projection in the near future
A recent analysis found that the Cant concentrations in subsurface water in the Mozambique Basin were positively related to atmospheric CO2 with a slope of (Metzl et al., 2025b, Fig. S8). Here, we assume that this relationship is valid for the southern Mozambique Channel. To reconstruct the past and future change of the carbonate system properties we calculated the CT concentration over 1960–2100 by correcting CT for each year using the relationship between Cant and atmospheric CO2.
For future atmospheric CO2, we used two SSP emissions scenarios (Shared Socioeconomic Pathways, Meinshausen et al., 2020), a “high” emission scenario SSP5-8.5 and a stabilization scenario SSP2-4.5 (Fig. 8a). To explore the change of the aragonite saturation state, we applied this model (Eq. 2) for August when Ωar is the lowest. Temperature and salinity were fixed from the climatology in August (SST = 22.685 °C; SSS = 35.303) and fCO2, pHT and Ωar were calculated each year with the CT AT pairs using version CO2sys_v2.5 (Orr et al., 2018). The reconstructed CT, fCO2, pHT and Ωar for August compared well with the observations (in July) and with the FFNN model in August (Fig. 8; Table S1, Fig. S9) indicating that the simulation captured the decadal evolution of the properties. For the future, differences between the two scenarios (SSP5-8.5 and SSP2-4.5) are pronounced after 2030 (Fig. 8). For the high scenario the CT concentrations reaches 2060 µmol kg−1 in 2040 and pHT is as low as 8. In both scenarios, the carbonate ion concentrations dropped below 200 µmol kg−1 in 2028. As noted above, the aragonite saturation state based on observations was 3.47 in July 2014 (Fig. 7c and blue symbol in Fig. 8d) and the lowest Ωar value of 3.23 occurred in August–September 2023 (from the FFNN model, Figs. 7c and 8d). The same is estimated in the projection (Fig. 7d), close to the critical threshold of Ωar=3.25 for tropical coral reef.
As of January 2025, the atmospheric CO2 is 426 and 450 ppm should be reached in 2030 in the high scenario SSP5-8.5 (Fig. 8a). In a global ocean model it has been suggested that at 450 ppm Ωar would be around 3 in the South Indian Ocean and the Mozambique Channel, against 4 for pre-industrial Ωar (Fig. 4 in Hoegh-Guldberg et al., 2007). In our simulation, at 450 ppm, Ωar is equal to 3.13 against 3.8 based on observations in May 1963. Extrapolating our result back in time, we estimated pHT at 8.18 and Ωar equal to 4 at 280 ppm, close to the pre-industrial value estimated from dedicated reconstructions (Lo Monaco et al., 2021) or in global ocean models (Hoegh-Guldberg et al., 2007; Jiang et al., 2023).
Our calculation suggests that for a high emission scenario a risky level for corals (Ωar<3, Hoegh-Guldberg et al., 2007) could be reached as soon as year 2034, i.e. in the next 10 years. This calls for maintaining regular carbonate system observations in this region, if possible at all seasons, in order to follow at best their evolution and the potential impact on the channel ecosystem and especially coral reefs in the context of global warming and acidification that will dramatically persist in the near future.
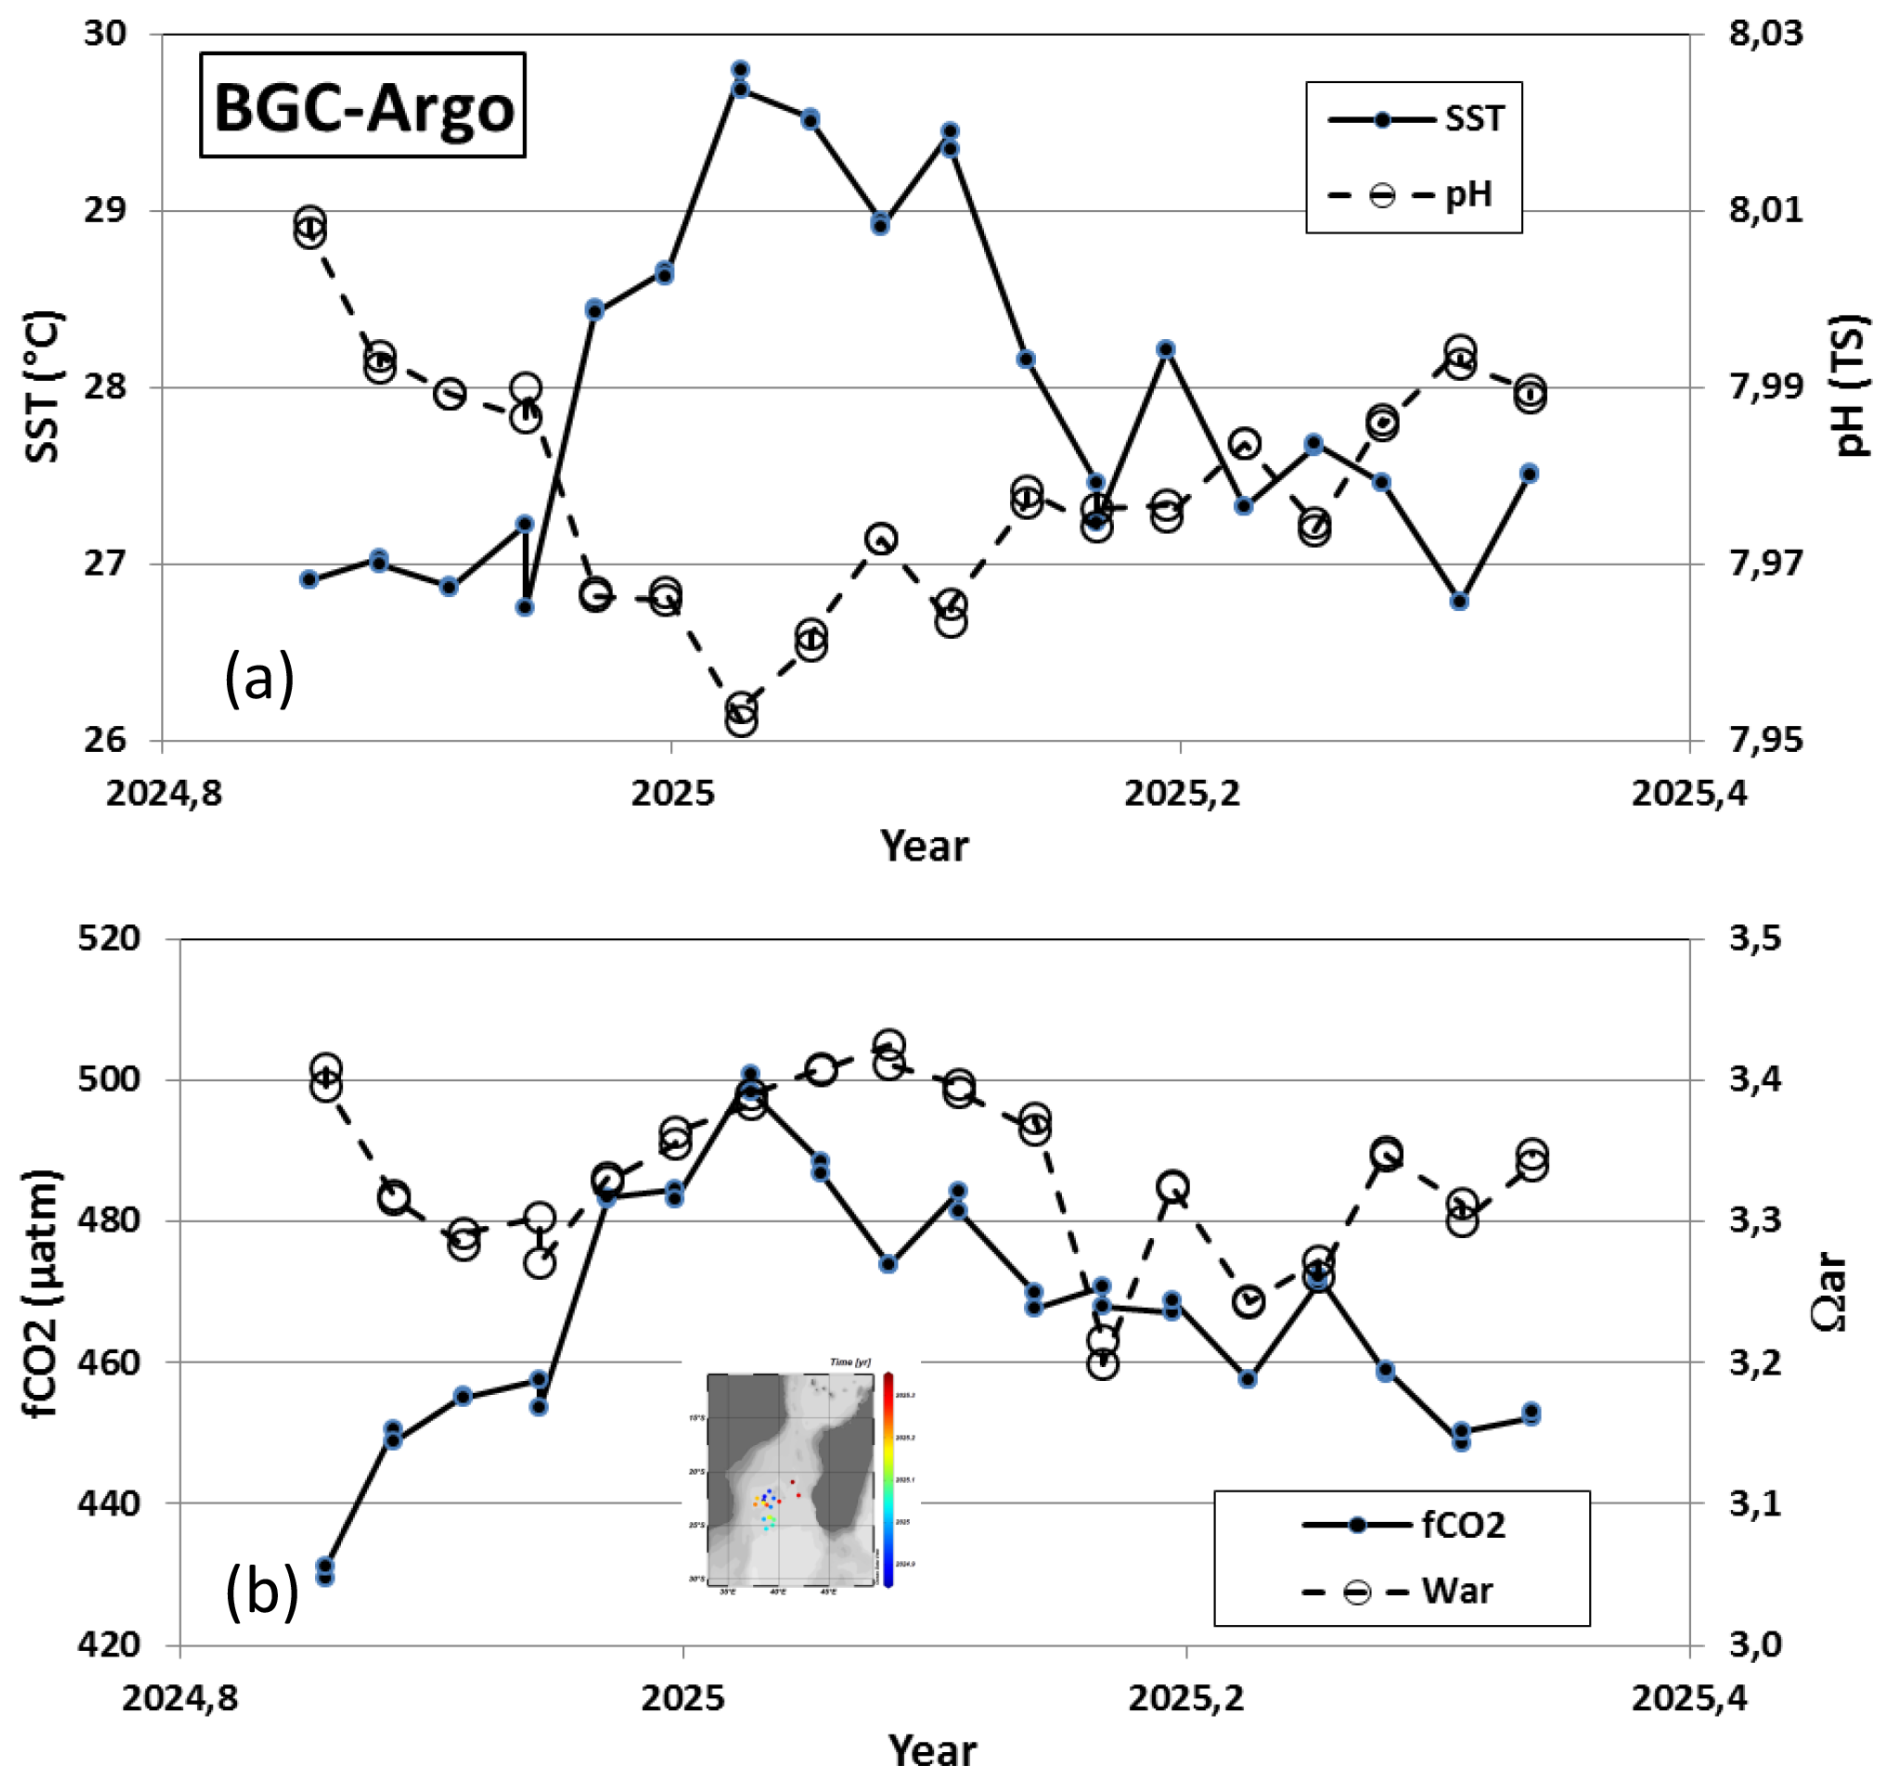
Figure 9Time-series of (a) SST and pHT, and (b) fCO2 and Ωar in the southern Mozambique Channel based on BGC-Argo data (WMO7902123) in November 2024 to May 2025 (location of data in the insert map). Data from https://www.mbari.org/products/data-repository/, last access 9 May 2025. Insert map produced with ODV (Schlitzer, 2018).
3.5 A large anomaly observed in 2025
As mentioned above, fCO2 data are relatively sparse in the Mozambique Channel and should be obtained for all seasons. To complete the shipboard observations, biogeochemical (BGC) Argo floats have been developed and successfully used for 10 years for air-sea CO2 flux estimates and/or acidification especially in the Southern Ocean in the frame of the SOCCOM project (e.g. Sarmiento et al., 2023; Mazloff et al., 2023). The floats record profiles down to 1000 or 2000 m at a 10 d frequency. In November 2024, a BGC-Argo float (WMO ID 7902123) was launched in the Mozambique Channel at 38.51° E/22.65° S (last profile used here recorded on 4 May 2025). The fCO2 and Ωar from the pHT float data were calculated using CO2sys as for the shipboard data (Sect. 2.3). Interestingly, the float recorded high temperature in January 2025 (up to 29.8 °C, Fig. 9a), a signal probably linked to a MHW (Fig. S10) that occurred at high frequency in this region (Mawren et al., 2022). Sea surface temperature from reanalysis products suggests a temperature as high as 31 °C in this region in January 2025 (Fig. S10). Consequently, the sea surface fCO2 derived from the float pHT data reached values above 480 µatm (Fig. 9b). This leads to a strong CO2 source anomaly, in line with CO2 fluxes anomalies associated to MHW in the South Indian subtropics (e.g. Li et al., 2024). The lowest pHT of 7.95 was recorded on 11 January 2025, i.e. lower than the pHT derived from the FFNN model (Fig. 7b). The aragonite saturation state derived from the BGC-Argo data reached 3.2 in March 2025, the same as that which we estimate in 2025 from the simulation (Fig. 8d). The observations from the BGC-Argo offer important information to complement the shipboard data and should be used along with SOCAT data to test constraint data-based products.
New observations in 2021 and 2022 and historical fCO2 data available since 1963 in the Mozambique Channel were used to evaluate the decadal trends of the carbonate system in this region. With adapted relationship for this region, we calculated CT concentrations, pHT and Ωar. This calculation is first validated with in-situ AT and CT measurements obtained in January 2004, April 2019 and January 2021. Based on the data in January 2004 and 2021, we found a pHT decrease of −0.032 (using fCO2 data) and −0.040 (using AT CT data) over 17 years. Because the seasonality is large, the decadal trends based on fCO2 observations in 1963–2022 are evaluated for one season only (April–May). A FFNN model that reconstructed the monthly fields of the carbonate system is also used to investigate the trends for all seasons, but restricted to the period 1985–2023.
In this region where the ocean is a permanent CO2 sink of −0.25 (±0.06) mol C m−2 yr−1, fCO2 observations available in April–May translate an acceleration of the acidification ranging from −0.012 decade−1 in 1963–1995 to −0.027 (±0.003) decade−1 in 1995–2022. Result from the FFNN model for all seasons suggest smaller pHT trends but, like in the observations, the decrease of pHT was faster in recent decades, −0.011 decade−1 over 1985–1995 and −0.018 decade−1 over 1995–2022. The FFNN model also suggests a faster trend in austral winter when the ocean CO2 sink is stronger and when the aragonite saturation state (Ωar) is low. In May 2022 we estimated Ωar=3.49, about 0.3 lower than observed in May 1963 (Ωar=3.86). The lowest Ωar value of 3.23 was evaluated from the FFNN model in September 2023 that corresponds to the potential critical threshold value (3.25) for net reef accretion (Hoegh-Guldberg et al., 2007) and could conduct to net reef dissolution (Eyre et al., 2018; Tribollet et al., 2019; Cornwall et al., 2021).
A simple reconstruction and projection of the CT concentrations based on anthropogenic CO2 in subsurface water and emissions scenario, suggests that the aragonite saturation state could be as low as 3 in the next 10 years. Following a previous work (Lo Monaco et al., 2021), the new data presented here clearly reveal the progressive acidification in the Mozambique Channel and its acceleration in the recent decade with potential impacts on ecosystem including corals reefs areas like at Europa and Bassa de India. In a context where there is no sign of a slowdown in anthropogenic emissions, this already obvious acidification is alarming for the ocean health (Gattuso et al., 2015) and potential feedback on the ocean carbon cycle in general (e.g. Barrett et al., 2025). Understanding and quantifying the future response of phytoplanktonic and reef species in the context of global warming and acidification calls for adapted ocean biogeochemical models (Cornwall et al., 2021) to take into account dynamics of bioerosion processes (see Schönberg et al., 2017). In the Mozambique Channel, observations are still very sparse and the new observations presented here, including recent BGC-Agro data, offer important information to validate regional and global biogeochemical models that are not yet able to simulate correctly the seasonal cycle and decadal variability of the oceanic carbonate system. We strongly claim for maintaining regular sampling of ocean carbonate system parameters to reduce the model uncertainties and for adapted strategies at both scientific and political actions in the future.
Data used in this study are available in SOCAT (Bakker et al., 2016, http://www.socat.info, last access: 10 June 2025) for fCO2 surface data, in GLODAP (Lauvset et al., 2022a, b, http://www.glodap.info, last access: 10 June 2025) for water-column data. The AT and CT underway data from OISO and CLIM-EPARSES cruises are available in Seanoe (https://www.seanoe.org, last access: 10 June 2025, https://doi.org/10.17882/95414, Metzl et al., 2023, and https://doi.org/10.17882/102337, Metzl et al., 2024). The BGC-Argo float data with derived carbon parameters are available from SOCCOM (https://soccom.org, last access: 2 October 2024, https://www.mbari.org/products/data-repository/, last access: 10 May 2025). The CMEMS-LSCE-FFNN model data are available at E.U. Copernicus Marine Service Information (https://resources.marine.copernicus.eu/products, last access: 3 May 2025, https://doi.org/10.48670/moi-00047, Copernicus Marine Service, 2024a). The Mixed layer depth data are publicly available on the CMEMS website: https://data.marine.copernicus.eu/products (last access: 17 April 2025, Multi Observation Global Ocean ARMOR3D L4 MULTIOBS_GLO_PHY_TSUV_3D_MYNRT_015_012).
The supplement related to this article is available online at https://doi.org/10.5194/bg-22-7187-2025-supplement.
CLM and NM are co-investigators of the ongoing OISO project. AT was chief scientist of the CLIM-EPARSES 2019 cruise and JFT was chief scientist of the RESILIENCE cruise. MG and FC developed the CMEMS-LSCE-FFNN model and provided the model results. NM started the analysis, wrote the draft of the manuscript and prepared the figures with contributions from all co-authors.
The contact author has declared that none of the authors has any competing interests.
Publisher's note: Copernicus Publications remains neutral with regard to jurisdictional claims made in the text, published maps, institutional affiliations, or any other geographical representation in this paper. While Copernicus Publications makes every effort to include appropriate place names, the final responsibility lies with the authors. Views expressed in the text are those of the authors and do not necessarily reflect the views of the publisher.
The OISO program was supported by the French institutes INSU (Institut National des Sciences de l'Univers) and IPEV (Institut Polaire Paul-Emile Victor), OSU Ecce-Terra (at Sorbonne Université), the French programs SOERE/Great-Gases and ICOS-France. We thank the French Oceanographic Fleet for financial and logistic support for the OISO program (https://campagnes.flotteoceanographique.fr/series/228/, last access: 10 January 2025). The CLIM-EPARSES project was supported by TAAF (Terres Australes et Antarctic Françaises), IRD (Institut de Recherche pour le Développement), Fondation Prince Albert II de Monaco (http://www.fpa2.org, last access: 3 November 2025), INSU (Institut National des Sciences de l'Univers), CNRS (Centre National de Recherche Scientifique), Museum National d'Histoire Naturelle (MNHN), UMRs LOCEAN-IPSL, ENTROPIE and LSCE. The RESILIENCE cruise (https://doi.org/10.17600/18001917, Ternon et al., 2023) was supported by the French National Oceanographic Fleet, by the Belmont Forum Ocean Front Change project, by the ISblue project and by the French National program LEFE (Les Enveloppes Fluides et l'Environnement). We thank the captains and crew of R.R.V. Marion-Dufresne and the staff at IFREMER, GENAVIR and IPEV. We also thank Guillaume Barut, Jonathan Fin and Claude Mignon for their help during the OISO, CLIM-EPARSES and RESILIENCE cruises. The development of the neural network model benefited from funding by the French INSU-GMMC project PPR-Green-Grog (grant no. 5-DS-PPR-GGREOG), the EU H2020 project AtlantOS (grant no. 633211), as well as through the Copernicus Marine Environment Monitoring Service (project 83-CMEMS-TAC-MOB). We acknowledge the Southern Ocean Carbon and Climate Observations and Modeling (SOCCOM) Project funded by the National Science Foundation, Division of Polar Programs (NSF PLR-1425989 and OPP-1936222). We thank all colleagues who contributed to the quality control of ocean data made available through GLODAP (http://www.glodap.info, last access: 10 June 2025). The Surface Ocean CO2 Atlas (SOCAT, http://www.socat.info, last access: 10 June 2025) is an international effort, endorsed by the International Ocean Carbon Coordination Project (IOCCP), the Surface Ocean Lower Atmosphere Study (SOLAS) to deliver a uniformly quality-controlled surface ocean CO2 database. We thank Hermann Bange associate editor, and anonymous reviewers for their positive reports and comments that helped revising the manuscript.
This research has been supported by the Centre National de la Recherche Scientifique (SNO OISO; SOERE/Great-Gases; CLIM-EPARSES; RESILIENCE and PPR-Green-Grog, grant no. 5-DSPPR-GGREOG), the Sorbonne Université (SNO OISO), the Institut de Recherche pour le Développement (CLIM-EPARSES and RESILIENCE), and the European Commission Horizon 2020 framework program (AtlantOS, grant no. 633211).
This paper was edited by Hermann Bange and reviewed by two anonymous referees.
Alaguarda, D., Brajard, J., Coulibaly, G., Canesi, M., Douville, E., Le Cornec, F., Lelabousse, C., and Tribollet, A.:54 years of microboring community history explored by machine learning in a massive coral from Mayotte (Indian Ocean), Front. Mar. Sci., 9, 899398, https://doi.org/10.3389/fmars.2022.899398, 2022.
Bakker, D. C. E., Pfeil, B., Smith, K., Hankin, S., Olsen, A., Alin, S. R., Cosca, C., Harasawa, S., Kozyr, A., Nojiri, Y., O'Brien, K. M., Schuster, U., Telszewski, M., Tilbrook, B., Wada, C., Akl, J., Barbero, L., Bates, N. R., Boutin, J., Bozec, Y., Cai, W.-J., Castle, R. D., Chavez, F. P., Chen, L., Chierici, M., Currie, K., de Baar, H. J. W., Evans, W., Feely, R. A., Fransson, A., Gao, Z., Hales, B., Hardman-Mountford, N. J., Hoppema, M., Huang, W.-J., Hunt, C. W., Huss, B., Ichikawa, T., Johannessen, T., Jones, E. M., Jones, S. D., Jutterström, S., Kitidis, V., Körtzinger, A., Landschützer, P., Lauvset, S. K., Lefèvre, N., Manke, A. B., Mathis, J. T., Merlivat, L., Metzl, N., Murata, A., Newberger, T., Omar, A. M., Ono, T., Park, G.-H., Paterson, K., Pierrot, D., Ríos, A. F., Sabine, C. L., Saito, S., Salisbury, J., Sarma, V. V. S. S., Schlitzer, R., Sieger, R., Skjelvan, I., Steinhoff, T., Sullivan, K. F., Sun, H., Sutton, A. J., Suzuki, T., Sweeney, C., Takahashi, T., Tjiputra, J., Tsurushima, N., van Heuven, S. M. A. C., Vandemark, D., Vlahos, P., Wallace, D. W. R., Wanninkhof, R., and Watson, A. J.: An update to the Surface Ocean CO2 Atlas (SOCAT version 2), Earth Syst. Sci. Data, 6, 69–90, https://doi.org/10.5194/essd-6-69-2014, 2014.
Bakker, D. C. E., Pfeil, B., Landa, C. S., Metzl, N., O'Brien, K. M., Olsen, A., Smith, K., Cosca, C., Harasawa, S., Jones, S. D., Nakaoka, S., Nojiri, Y., Schuster, U., Steinhoff, T., Sweeney, C., Takahashi, T., Tilbrook, B., Wada, C., Wanninkhof, R., Alin, S. R., Balestrini, C. F., Barbero, L., Bates, N. R., Bianchi, A. A., Bonou, F., Boutin, J., Bozec, Y., Burger, E. F., Cai, W.-J., Castle, R. D., Chen, L., Chierici, M., Currie, K., Evans, W., Featherstone, C., Feely, R. A., Fransson, A., Goyet, C., Greenwood, N., Gregor, L., Hankin, S., Hardman-Mountford, N. J., Harlay, J., Hauck, J., Hoppema, M., Humphreys, M. P., Hunt, C. W., Huss, B., Ibánhez, J. S. P., Johannessen, T., Keeling, R., Kitidis, V., Körtzinger, A., Kozyr, A., Krasakopoulou, E., Kuwata, A., Landschützer, P., Lauvset, S. K., Lefèvre, N., Lo Monaco, C., Manke, A., Mathis, J. T., Merlivat, L., Millero, F. J., Monteiro, P. M. S., Munro, D. R., Murata, A., Newberger, T., Omar, A. M., Ono, T., Paterson, K., Pearce, D., Pierrot, D., Robbins, L. L., Saito, S., Salisbury, J., Schlitzer, R., Schneider, B., Schweitzer, R., Sieger, R., Skjelvan, I., Sullivan, K. F., Sutherland, S. C., Sutton, A. J., Tadokoro, K., Telszewski, M., Tuma, M., van Heuven, S. M. A. C., Vandemark, D., Ward, B., Watson, A. J., and Xu, S.: A multi-decade record of high-quality fCO2 data in version 3 of the Surface Ocean CO2 Atlas (SOCAT), Earth Syst. Sci. Data, 8, 383–413, https://doi.org/10.5194/essd-8-383-2016, 2016.
Bakker, D. C. E., Alin, S. R., Bates, N., Becker, M., Gkritzalis, T., Jones, S. D., Kozyr, A., Lauvset, S. K., Metzl, N., Nakaoka, S., O'Brien, K. M., Olsen, A., Pierrot, D., Steinhoff, T., Sutton, A. J., Takao, S., Tilbrook, B., Wada, C., Wanninkhof, R., Akl, J., Arbilla, L. A., Arruda, R., Azetsu-Scott, K., Barbero, L., Beatty, C. M., Berghoff, C. F., Bittig, H. C., Burger, E. F., Campbell, K., Cardin, V., Collins, A., Coppola, L., Cronin, M., Cross, J. N., Currie, K. I., Emerson, S. R., Enright, M. P., Enyo, K., Evans, W., Feely, R. A., Flohr, A., Gehrung, M., Glockzin, M., González-Dávila, M., Hamnca, S., Hartman, S., Howden, S. D., Kam, K., Kamb, L., Körtzinger, A., Kosugi, N., Lefèvre, N., Lo Monaco, C., Macovei, V. A., Maenner Jones, S., Manalang, D., Martz, T. R., Mdokwana, B., Monacci, N. M., Monteiro, P. M. S., Mordy, C., Morell, J. M., Murata, A., Neill, C., Noh, J.-H., Nojiri, Y., Ohman, M., Olivier, L., Ono, T., Petersen, W., Plueddemann, A. J., Prytherch, J., Rehder, G., Rutgersson, A., Santana-Casiano, J. M., Schlitzer, R., Send, U., Skjelvan, I., Sullivan, K. F., T'Jampens, M., Tadokoro, K., Telszewski, M., Theetaert, H., Tsanwani, M., Vandemark, D., van Ooijen, E., Veccia, M. H., Voynova, Y. G., Wang, H., Weller, R. A., and Woosley, R. J.: Surface Ocean CO2 Atlas Database Version 2024 (SOCATv2024) (NCEI Accession 0293257), NOAA National Centers for Environmental Information [data set], https://doi.org/10.25921/9wpn-th28 (last access: 30 June 2024), 2024.
Barrett, R. C., Carter, B. R., Fassbender, A. J., Tilbrook, B., Woosley, R. J., Azetsu-Scott, K., Feely, R. A., Goyet, C., Ishii, M. Murata, A., and Pérez, F. F.: Biological responses to ocean acidification are changing the global ocean carbon cycle. Global Biogeochemical Cycles, 39, e2024GB008358. https://doi.org/10.1029/2024GB008358, 2025.
Bates, N. R., Pequignet, A. C., and Sabine, C. L.: Ocean carbon cycling in the Indian Ocean: 1. Spatiotemporal variability of inorganic carbon and air-sea CO2 gas exchange, Global Biogeochem. Cycles, 20, GB3020, https://doi.org/10.1029/2005GB002491, 2006.
Camp, E. F., Schoepf, V., Mumby, P. J., Hardtke, L. A., Rodolfo-Metalpa, R., Smith, D. J., and Suggett, D. J.: The Future of Coral Reefs Subject to Rapid Climate Change: Lessons from Natural Extreme Environments, Front. Mar. Sci., 5, 4, https://doi.org/10.3389/fmars.2018.00004, 2018.
Chakraborty, K., Joshi, A. P., Ghoshaln P. K., Baduru, B., Valsala, V., Sarma V. V. S. S., Metzl, N., Gehlen, M., Chevallier, F., and Lo Monaco, C.: Indian Ocean acidification and its driving mechanisms over the last four decades (1980–2019), Global Biogeochemical Cycles, 38, e2024GB008139, https://doi.org/10.1029/2024GB008139, 2024.
Chau, T.-T.-T., Gehlen, M., Metzl, N., and Chevallier, F.: CMEMS-LSCE: a global, 0.25°, monthly reconstruction of the surface ocean carbonate system, Earth Syst. Sci. Data, 16, 121–160, https://doi.org/10.5194/essd-16-121-2024, 2024.
Cheng, L., Abraham, J., Trenberth, K.E., Reagan, J., Zhang, H.-M., Storto, A., Von Schuckmann, K., Pan, Y., Zhu, Y., Mann, M. E., Zhu, J., Wang, F., Yu, F., Locarnini, R., Fasullo, J., Huang, B., Graham, G., Yin, X., Gouretski, V., Zheng, F., Li, Y., Zhang, B., Wan, L., Chen, X., Wang, D., Feng, L., Song, X., Liu, Y., Reseghetti, F., Simoncelli, S., Chen, G., Zhang, R., Mishonov, A., Tan, Z., Wei, W., Yuan, H., Li, G., Ren, Q., Cao, L., Lu, Y., Du, J., Lyu, K., Sulaiman, A., Mayer, M., Wang, H., Ma, Z., Bao, S., Yan, H., Liu, Z., Yang, C., Liu, X., Hausfather, Z., Szekely, T., and Gues, F.: Record High Temperatures in the Ocean in 2024, Adv. Atmos. Sci., 42, 1092–1109, https://doi.org/10.1007/s00376-025-4541-3, 2025.
Copernicus Marine Service: Surface ocean carbon fields, Copernicus Marine Service [data set], https://doi.org/10.48670/moi-00047, 2024a.
Copernicus Marine Service: Multi Observation Global Ocean 3D Temperature Salinity Height Geostrophic Current and MLD, Copernicus Marine Service [data set], https://doi.org/10.48670/moi-00052, 2024b.
Copin-Montégut, C.: A new formula for the effect of temperature on the partial pressure of CO2 in seawater. Corrigendum, Marine Chemistry, 27, 143–144, https://doi.org/10.1016/0304-4203(89)90034-0, 1989.
Copin-Montégut, C.: A new formula for the effect of temperature on the partial pressure of CO2 in seawater, Marine Chemistry, 25, 29–37, https://doi.org/10.1016/0304-4203(88)90012-6, 1988.
Cornwall, C. E., Comeau, S., Kornder, N. A., Perry, C. T., van Hooidonk, R., DeCarlo, T. M., Pratchett, M. S., Anderson, K. D., Browne, N., Carpenter, R., Diaz-Pulido, G., D'Olivo, J. P., Doo, S. S., Figueiredo, J., Fortunato, S. A. V., Kennedy, E., Lantz, C. A., McCulloch, M. T., González-Rivero, M., Schoepf, V., Smithers, S. G., and Lowe, R. J.: Global declines in coral reef calcium carbonate production under ocean acidification and warming, P. Natl. Acad. Sci. USA, 118, e2015265118, https://doi.org/10.1073/pnas.2015265118, 2021.
Dickson, A. G.: Standard potential of the reaction: AgCl(s) H2(g) = Ag(s) + HCl(aq), and the standard acidity constant of the ion HSO4– in synthetic sea water from 273.15 to 318.15 K, J. Chem. Thermodyn. 22, 113–127, https://doi.org/10.1016/0021-9614(90)90074-Z, 1990.
Doney, S. C., Fabry, V. J., Feely, R. A., and Kleypas, J. A.: Ocean acidification: The other CO2 problem, Annu. Rev. Mar. Sci., 1, 169–192, https://doi.org/10.1146/annurev.marine.010908.163834, 2009.
Doney, S. C., Busch, D. S., Cooley, S. R., and Kroeker, K. J.: The impacts of ocean acidification on marine ecosystems and reliant human communities, Annu. Rev. Environ. Resour., 45, https://doi.org/10.1146/annurev-environ-012320-083019, 2020.
Edmond, J. M.: High precision determination of titration alkalinity and total carbon dioxide content of sea water by potentiometric titration, Deep-Sea Res., 17, 737–750, https://doi.org/10.1016/0011-7471(70)90038-0, 1970.
Eyre, B. D., Cyronak, T., Drupp, P., De Carlo, E. H., Sachs, J. P., and Andersson, A. J.: Coral reefs will transition to net dissolving before end of century, Science, 359, 908–911, https://doi.org/10.1126/science.aao1118, 2018.
Fabry, V. J., Seibel, B. A., Feely, R. A., and Orr, J. C.: Impacts of ocean acidification on marine fauna and ecosystem processes, ICES J. Mar. Sci., 65, 414–432, https://doi.org/10.1093/icesjms/fsn048, 2008.
Fay, A. R., Munro, D. R., McKinley, G. A., Pierrot, D., Sutherland, S. C., Sweeney, C., and Wanninkhof, R.: Updated climatological mean ΔfCO2 and net sea–air CO2 flux over the global open ocean regions, Earth Syst. Sci. Data, 16, 2123–2139, https://doi.org/10.5194/essd-16-2123-2024, 2024.
Findlay, H.S., Feely, R.A., Jiang, L.-Q., Pelletier, G., and Bednaršek, N.: Ocean Acidification: Another Planetary Boundary Crossed, Glob. Change Biol., 31, e70238, https://doi.org/10.1111/gcb.70238, 2025.
Forster, P. M., Smith, C., Walsh, T., Lamb, W. F., Lamboll, R., Cassou, C., Hauser, M., Hausfather, Z., Lee, J.-Y., Palmer, M. D., von Schuckmann, K., Slangen, A. B. A., Szopa, S., Trewin, B., Yun, J., Gillett, N. P., Jenkins, S., Matthews, H. D., Raghavan, K., Ribes, A., Rogelj, J., Rosen, D., Zhang, X., Allen, M., Aleluia Reis, L., Andrew, R. M., Betts, R. A., Borger, A., Broersma, J. A., Burgess, S. N., Cheng, L., Friedlingstein, P., Domingues, C. M., Gambarini, M., Gasser, T., Gütschow, J., Ishii, M., Kadow, C., Kennedy, J., Killick, R. E., Krummel, P. B., Liné, A., Monselesan, D. P., Morice, C., Mühle, J., Naik, V., Peters, G. P., Pirani, A., Pongratz, J., Minx, J. C., Rigby, M., Rohde, R., Savita, A., Seneviratne, S. I., Thorne, P., Wells, C., Western, L. M., van der Werf, G. R., Wijffels, S. E., Masson-Delmotte, V., and Zhai, P.: Indicators of Global Climate Change 2024: annual update of key indicators of the state of the climate system and human influence, Earth Syst. Sci. Data, 17, 2641–2680, https://doi.org/10.5194/essd-17-2641-2025, 2025.
Friedlingstein, P., O'Sullivan, M., Jones, M. W., Andrew, R. M., Hauck, J., Landschützer, P., Le Quéré, C., Li, H., Luijkx, I. T., Olsen, A., Peters, G. P., Peters, W., Pongratz, J., Schwingshackl, C., Sitch, S., Canadell, J. G., Ciais, P., Jackson, R. B., Alin, S. R., Arneth, A., Arora, V., Bates, N. R., Becker, M., Bellouin, N., Berghoff, C. F., Bittig, H. C., Bopp, L., Cadule, P., Campbell, K., Chamberlain, M. A., Chandra, N., Chevallier, F., Chini, L. P., Colligan, T., Decayeux, J., Djeutchouang, L. M., Dou, X., Duran Rojas, C., Enyo, K., Evans, W., Fay, A. R., Feely, R. A., Ford, D. J., Foster, A., Gasser, T., Gehlen, M., Gkritzalis, T., Grassi, G., Gregor, L., Gruber, N., Gürses, Ö., Harris, I., Hefner, M., Heinke, J., Hurtt, G. C., Iida, Y., Ilyina, T., Jacobson, A. R., Jain, A. K., Jarníková, T., Jersild, A., Jiang, F., Jin, Z., Kato, E., Keeling, R. F., Klein Goldewijk, K., Knauer, J., Korsbakken, J. I., Lan, X., Lauvset, S. K., Lefèvre, N., Liu, Z., Liu, J., Ma, L., Maksyutov, S., Marland, G., Mayot, N., McGuire, P. C., Metzl, N., Monacci, N. M., Morgan, E. J., Nakaoka, S.-I., Neill, C., Niwa, Y., Nützel, T., Olivier, L., Ono, T., Palmer, P. I., Pierrot, D., Qin, Z., Resplandy, L., Roobaert, A., Rosan, T. M., Rödenbeck, C., Schwinger, J., Smallman, T. L., Smith, S. M., Sospedra-Alfonso, R., Steinhoff, T., Sun, Q., Sutton, A. J., Séférian, R., Takao, S., Tatebe, H., Tian, H., Tilbrook, B., Torres, O., Tourigny, E., Tsujino, H., Tubiello, F., van der Werf, G., Wanninkhof, R., Wang, X., Yang, D., Yang, X., Yu, Z., Yuan, W., Yue, X., Zaehle, S., Zeng, N., and Zeng, J.: Global Carbon Budget 2024, Earth Syst. Sci. Data, 17, 965–1039, https://doi.org/10.5194/essd-17-965-2025, 2025.
Gattuso, J.-P., Magnan, A., Billé, R., Cheung, W. W. L., Howes, E. L., Joos, F., Allemand, D., Bopp, L., Cooley, S., Eakin, M., Hoegh-Guldberg, O., Kelly, R. P., Pörtner, H.-O., Rogers, A. D., Baxter, J. M., Laffoley, D., Osborn, D., Rankovic, A., Rochette, J., Sumaila, U. R., Treyer, S., and Turley, C.: Contrasting futures for ocean and society from different anthropogenic CO2 emissions scenarios, Science, 349, aac4722, https://doi.org/10.1126/science.aac4722, 2015.
Hoegh-Guldberg, O., Mumby, P. J., Hooten, A. J., Steneck ,R. S., Greenfield, P., Gomez, E., Harvell, C. D., Sale, P. F., Edwards, A. J., Caldeira, K., Knowlton, N., Eakin, C. M., Iglesias-Prieto, R., Muthiga, N., Bradbury, R. H., Dubi, A., and Hatziolos, M. E.: Coral Reefs Under Rapid Climate Change and Ocean Acidification, Science, 14, 1737–1742, https://doi.org/10.1126/science.1152509, 2007.
Iida, Y., Takatani, Y., Kojima, A., and Ishii, M.: Global trends of ocean CO2 sink and ocean acidification: an observation based reconstruction of surface ocean inorganic carbon variables, J. Oceanogr., 77, 323–358, https://doi.org/10.1007/s10872-020-00571-5, 2021.
Jiang, L.-Q., Dunne, J., Carter, B. R., Tjiputra, J. F., Terhaar, J., Sharp, J. D., Olsen, A., Alin, S., Bakker, D. C. E., Feely, R. A., Gattuso, J.-P., Hogan, P., Ilyina, T., Lange, N., Lauvset, S. K., Lewis, E. R., Lovato, T., Palmieri, J., Santana-Falcón, Y., Schwinger, J., Séférian, R., Strand, G., Swart, N., Tanhua, T., Tsujino, H., Wanninkhof, R., Watanabe, M., Yamamoto, A., and Ziehn, T.: Global surface ocean acidification indicators from 1750 to 2100, J. Adv. Model. Earth Sy., 15, e2022MS003563, https://doi.org/10.1029/2022MS003563, 2023.
Keeling, C. D. and Waterman, L. S.: Carbon dioxide in surface ocean waters: 3. Measurements on Lusiad Expedition 1962–1963, J. Geophys. Res., 73, 4529–4541, https://doi.org/10.1029/JB073i014p04529, 1968.
Kwiatkowski, L., Torres, O., Bopp, L., Aumont, O., Chamberlain, M., Christian, J. R., Dunne, J. P., Gehlen, M., Ilyina, T., John, J. G., Lenton, A., Li, H., Lovenduski, N. S., Orr, J. C., Palmieri, J., Santana-Falcón, Y., Schwinger, J., Séférian, R., Stock, C. A., Tagliabue, A., Takano, Y., Tjiputra, J., Toyama, K., Tsujino, H., Watanabe, M., Yamamoto, A., Yool, A., and Ziehn, T.: Twenty-first century ocean warming, acidification, deoxygenation, and upper-ocean nutrient and primary production decline from CMIP6 model projections, Biogeosciences, 17, 3439–3470, https://doi.org/10.5194/bg-17-3439-2020, 2020.
Lan, X., Tans, P., and Thoning, K. W.: Trends in globally-averaged CO2 determined from NOAA Global Monitoring Laboratory measurements, Version Monday, 05-May-2025 16:38:58 MDT, https://doi.org/10.15138/9N0H-ZH07, 2025.
Lauvset, S. K., Gruber, N., Landschützer, P., Olsen, A., and Tjiputra, J.: Trends and drivers in global surface ocean pH over the past 3 decades, Biogeosciences, 12, 1285–1298, https://doi.org/10.5194/bg-12-1285-2015, 2015.
Lauvset, S. K., Lange, N., Tanhua, T., Bittig, H. C., Olsen, A., Kozyr, A., Alin, S., Álvarez, M., Azetsu-Scott, K., Barbero, L., Becker, S., Brown, P. J., Carter, B. R., da Cunha, L. C., Feely, R. A., Hoppema, M., Humphreys, M. P., Ishii, M., Jeansson, E., Jiang, L.-Q., Jones, S. D., Lo Monaco, C., Murata, A., Müller, J. D., Pérez, F. F., Pfeil, B., Schirnick, C., Steinfeldt, R., Suzuki, T., Tilbrook, B., Ulfsbo, A., Velo, A., Woosley, R. J., and Key, R. M.: GLODAPv2.2022: the latest version of the global interior ocean biogeochemical data product, Earth Syst. Sci. Data, 14, 5543–5572, https://doi.org/10.5194/essd-14-5543-2022, 2022a.
Lauvset, S. K., Lange, N., Tanhua, T., Bittig, H. C., Olsen, A., Kozyr, A., Alin, S. R., Álvarez, M., Azetsu-Scott, K., Barbero, L., Becker, S., Brown, P. J., Carter, B. R., Cotrim da Cunha, L., Feely, R. A., Hoppema, M., Humphreys, M. P., Ishii, M., Jeansson, E., Jiang, L.-Q., Jones, S. D., Lo Monaco, C., Murata, A., Müller, J. D., Pérez, F. F., Pfeil, B., Schirnick, C., Steinfeldt, R., Suzuki, T., Tilbrook, B., Ulfsbo, A., Velo, A., Woosley, R. J., and Key, R. M.: Global Ocean Data Analysis Project version 2.2022 (GLODAPv2.2022) (NCEI Accession 0257247), NOAA National Centers for Environmental Information [data set], https://doi.org/10.25921/1f4w-0t92 (last access: 4 June 2025), 2022b.
Li, C., Burger, F. A., Raible, C. C., and Frölicher, T. L.: Observed regional impacts of marine heatwaves on sea-air CO2 exchange, Geophysical Research Letters, 51, e2024GL110379, https://doi.org/10.1029/2024GL110379, 2024.
Lo Monaco, C., Metzl, N., Fin, J., Mignon, C., Cuet, P., Douville, E., Gehlen, M., Trang Chau, T. T., and Tribollet, A.: Distribution and long-term change of the sea surface carbonate system in the Mozambique Channel (1963–2019), Deep-Sea Research Part II, 186–188, 104936, https://doi.org/10.1016/j.dsr2.2021.104936, 2021.
Lueker, T. J., Dickson, A. G., and Keeling, C. D.: Ocean pCO(2) calculated from dissolved inorganic carbon, alkalinity, and equations for K-1 and K-2: validation based on laboratory measurements of CO2 in gas and seawater at equilibrium, Marine Chemistry, 70, 105–119, https://doi.org/10.1016/S0304-4203(00)00022-0, 2000.
Ma, D., Gregor, L., and Gruber, N.: Four decades of trends and drivers of global surface ocean acidification, Global Biogeochemical Cycles, 37, e2023GB007765, https://doi.org/10.1029/2023GB007765, 2023.
Mawren, D., Hermes, J., and Reason, C. J. C.: Marine heatwaves in the Mozambique Channel, Clim. Dynam., 58, 305–327, https://doi.org/10.1007/s00382-021-05909-3, 2022.
Mazloff, M. R., Verdy, A., Gille, S. T., Johnson, K. S., Cornuelle, B. D., and Sarmiento, J.: Southern Ocean acidification revealed by biogeochemical-Argo floats, Journal of Geophysical Research-Oceans, 128, e2022JC019530, https://doi.org/10.1029/2022JC019530, 2023.
Meinshausen, M., Nicholls, Z. R. J., Lewis, J., Gidden, M. J., Vogel, E., Freund, M., Beyerle, U., Gessner, C., Nauels, A., Bauer, N., Canadell, J. G., Daniel, J. S., John, A., Krummel, P. B., Luderer, G., Meinshausen, N., Montzka, S. A., Rayner, P. J., Reimann, S., Smith, S. J., van den Berg, M., Velders, G. J. M., Vollmer, M. K., and Wang, R. H. J.: The shared socio-economic pathway (SSP) greenhouse gas concentrations and their extensions to 2500, Geosci. Model Dev., 13, 3571–3605, https://doi.org/10.5194/gmd-13-3571-2020, 2020.
Metzl, N., Louanchi, F., and Poisson, A.: Seasonal and interannual variations of sea surface carbon dioxide in the subtropical indian ocean, Mar. Chem., 60, 131–146, https://doi.org/10.1016/S0304-4203(98)00083-8, 1998.
Metzl, N.: Decadal increase of oceanic carbon dioxide in Southern Indian Ocean surface waters (1991–2007), Deep-Sea Res. Pt. II, 56, 607–619, https://doi.org/10.1016/j.dsr2.2008.12.007, 2009.
Metzl, N., Lo Monaco, C., Tribollet, A., and Kartavtseff A.: CLIM-EPARSES 1 cruise: S-ADCP data, SEANOE [data set], https://doi.org/10.17882/89702, 2022.
Metzl, N., Fin, J., Lo Monaco, C., Mignon, C., Alliouane, S., Antoine, D., Bourdin, G., Boutin, J., Bozec, Y., Conan, P., Coppola, L., Douville, E., Durrieu de Madron, X., Gattuso, J.-P., Gazeau, F., Golbol, M., Lansard, B., Lefèvre, D., Lefèvre, N., Lombard, F., Louanchi, F., Merlivat, L., Olivier, L., Petrenko, A., Petton, S., Pujo-Pay, M., Rabouille, C., Reverdin, G., Ridame, C., Tribollet, A., Vellucci, V., Wagener, T., and Wimart-Rousseau, C.: A synthesis of ocean total alkalinity and dissolved inorganic carbon measurements from 1993 to 2022: the SNAPO-CO2-v1 dataset, SEANOE [data set], https://doi.org/10.17882/95414, 2023.
Metzl, N., Fin, J., Lo Monaco, C., Mignon, C., Alliouane, S., Bombled, B., Boutin, J., Bozec, Y., Comeau, S., Conan, P., Coppola, L., Cuet, P., Ferreira, E., Gattuso, J.-P., Gazeau, F., Goyet, C., Grossteffan, E., Lansard, B., Lefèvre, D., Lefèvre, N., Leseurre, C., Lombard, F., Petton, S., Pujo-Pay, M., Rabouille, C., Reverdin, G., Ridame, C., Rimmelin-Maury, P., Ternon, J.-F., Touratier, F., Tribollet, A., Wagener, T., and Wimart-Rousseau, C.: An updated synthesis of ocean total alkalinity and dissolved inorganic carbon measurements from 1993 to 2023: the SNAPO-CO2-v2 dataset, SEANOE [data set], https://doi.org/10.17882/102337, 2024.
Metzl, N., Fin, J., Lo Monaco, C., Mignon, C., Alliouane, S., Bombled, B., Boutin, J., Bozec, Y., Comeau, S., Conan, P., Coppola, L., Cuet, P., Ferreira, E., Gattuso, J.-P., Gazeau, F., Goyet, C., Grossteffan, E., Lansard, B., Lefèvre, D., Lefèvre, N., Leseurre, C., Petton, S., Pujo-Pay, M., Rabouille, C., Reverdin, G., Ridame, C., Rimmelin-Maury, P., Ternon, J.-F., Touratier, F., Tribollet, A., Wagener, T., and Wimart-Rousseau, C.: An updated synthesis of ocean total alkalinity and dissolved inorganic carbon measurements from 1993 to 2023: the SNAPO-CO2-v2 dataset, Earth Syst. Sci. Data, 17, 1075–1100, https://doi.org/10.5194/essd-17-1075-2025, 2025a.
Metzl, N., Lo Monaco, C., Barut, G., and Ternon, J.-F.: Contrasting trends of the ocean CO2 sink and pH in the Agulhas current system and the Mozambique Basin, South-Western Indian Ocean (1963–2023), Deep-Sea Res. Pt. II, 220, 105459, https://doi.org/10.1016/j.dsr2.2025.105459, 2025b.
Millero, F. J., Lee, K., and Roche, M.: Distribution of alkalinity in the surface waters of the major oceans, Mar. Chem., 60, 111–130, https://doi.org/10.1016/S0304-4203(97)00084-4, 1998.
Murata, A., Kumamoto, Y., Sasaki, K., Watanabe, S., and Fukasawa, M.: Decadal increases in anthropogenic CO2 along 20° S in the South Indian ocean, J. Geophys. Res., 115, C12055, https://doi.org/10.1029/2010JC006250, 2010.
Orr, J. C., Epitalon, J.-M., Dickson, A. G., and Gattuso, J.-P.: Routine uncertainty propagation for the marine carbon dioxide system, Marine Chemistry, 207, 84–107, https://doi.org/10.1016/j.marchem.2018.10.006, 2018.
Pfeil, B., Olsen, A., Bakker, D. C. E., Hankin, S., Koyuk, H., Kozyr, A., Malczyk, J., Manke, A., Metzl, N., Sabine, C. L., Akl, J., Alin, S. R., Bates, N., Bellerby, R. G. J., Borges, A., Boutin, J., Brown, P. J., Cai, W.-J., Chavez, F. P., Chen, A., Cosca, C., Fassbender, A. J., Feely, R. A., González-Dávila, M., Goyet, C., Hales, B., Hardman-Mountford, N., Heinze, C., Hood, M., Hoppema, M., Hunt, C. W., Hydes, D., Ishii, M., Johannessen, T., Jones, S. D., Key, R. M., Körtzinger, A., Landschützer, P., Lauvset, S. K., Lefèvre, N., Lenton, A., Lourantou, A., Merlivat, L., Midorikawa, T., Mintrop, L., Miyazaki, C., Murata, A., Nakadate, A., Nakano, Y., Nakaoka, S., Nojiri, Y., Omar, A. M., Padin, X. A., Park, G.-H., Paterson, K., Perez, F. F., Pierrot, D., Poisson, A., Ríos, A. F., Santana-Casiano, J. M., Salisbury, J., Sarma, V. V. S. S., Schlitzer, R., Schneider, B., Schuster, U., Sieger, R., Skjelvan, I., Steinhoff, T., Suzuki, T., Takahashi, T., Tedesco, K., Telszewski, M., Thomas, H., Tilbrook, B., Tjiputra, J., Vandemark, D., Veness, T., Wanninkhof, R., Watson, A. J., Weiss, R., Wong, C. S., and Yoshikawa-Inoue, H.: A uniform, quality controlled Surface Ocean CO2 Atlas (SOCAT), Earth Syst. Sci. Data, 5, 125–143, https://doi.org/10.5194/essd-5-125-2013, 2013.
Poisson, A., Metzl, N., Brunet, C., Schauer, B., Bres, B., Ruiz-Pino, D., and Louanchi, F.: Variability of sources and sinks of CO2 in the western Indian and southern oceans during the year 1991, J. Geophys. Res., 98, 22759–22778, https://doi.org/10.1029/93JC02501, 1993.
Revelle, R. and Suess, H. E.: Carbon dioxide exchange between atmosphere and ocean and the question of an increase of atmospheric CO2 during the past decades, Tellus, 9, 18–27, https://doi.org/10.1111/j.2153-3490.1957.tb01849.x, 1957.
Sarmiento, J. L., Johnson, K. S., Arteaga, L. A., Bushinsky, S. M., Cullen, H. M., Gray, A. R., Hotinski, R. M., Maurer, T. L., Mazloff, M. R., Riser, S. C., Russell, J. L., Schofield, O. M., and Talley, L. D.: The Southern Ocean Carbon and Climate Observations and Modeling (SOCCOM) project: A review, Progress in Oceanography, 219, 103130, https://doi.org/10.1016/j.pocean.2023.103130, 2023.
Schlitzer, R.: Ocean Data View, http://odv.awi.de (last access: 6 March 2018), 2018.
Schönberg, C. H. L., Fang, J. K. H., Carreiro-Silva, M., Tribollet, A., and Wisshak, M.: Bioerosion: the other ocean acidification problem, ICES (Int. Counc. Explor. Sea) J. Mar. Sci., fsw254 https://doi.org/10.1093/icesjms/fsw254, 2017.
Strahl, J., Stolz, I., Uthicke, S., Vogel, N., Noonan, S. H. C., and Fabricius, K. E.: Physiological and ecological performance differs in four coral taxa at a volcanic carbon dioxide seep. COMPARATIVE BIOCHEMISTRY AND PHYSIOLOGY A-MOLECULAR & INTEGRATIVE PHYSIOLOGY, 184, 179–186, https://doi.org/10.1016/j.cbpa.2015.02.018, 2015.
Takahashi, T., Olafsson, J., Goddard, J. G., Chipman, D. W., and Sutherland, S. C.: Seasonal variation of CO2 and nutrients in the high-latitude surface oceans: A comparative study, Global Biogeochem. Cycles, 7, 843–878, https://doi.org/10.1029/93GB02263, 1993.
Takahashi, T., Sutherland, S. C., Sweeney, C., Poisson, A., Metzl, N., Tilbrook, B., Bates, N.,Wanninkhof, R., Feely, R. A., Sabine, C., Olafsson, J., and Nojiri, Y.: Global Sea-Air CO2 Flux Based on Climatological Surface Ocean pCO2, and Seasonal Biological and Temperature Effect, Deep-Sea Res. Pt. II, 49, 1601–1622, https://doi.org/10.1016/S0967-0645(02)00003-6, 2002.
Ternon, J.-F., Noyon, M., Penven, P., Herbette, S., Artigas, L. F., Toullec, J., Blanc, M., Lebourges-Dhaussy, A., Annasawmy, A. P., Comby, C., Sudre, F., Lo Monaco, C., Cloete, R., Ryan, P., Pichegru, L., Penry, G., and Chandelier, G.: Resilience – fRonts, EddieS and marIne LIfe in the wEstern iNdian oCEan, in 19 April–24 May 2022, MD237 R/V marion Dufresne (Tech. Rep.), Cruise report, 107 pp., https://doi.org/10.17600/18001917, 2023.
Tilbrook, B., Jewett, E. B., DeGrandpre, M. D., Hernandez-Ayon, J. M., Feely, R. A., Gledhill, D. K., Hansson, L., Isensee, K., Kurz, M. L., Newton, J. A., Siedlecki, S. A., Chai, F., Dupont, S., Graco, M., Calvo, E., Greeley, D., Kapsenberg, L., Lebrec, M., Pelejero, C., Schoo, K. L., and Telszewski, M.: An Enhanced Ocean Acidification Observing Network: From People to Technology to Data Synthesis and Information Exchange, Frontiers in Marine Science, 6, 337, https://doi.org/10.3389/fmars.2019.00337, 2019.
Touratier, F., Azouzi, L., and Goyet, C.: CFC-11, Δ14C and 3H tracers as a means to assess anthropogenic CO2 concentrations in the ocean, Tellus B, 59, 318–325, https://doi.org/10.1111/j.1600-0889.2006.00247.x, 2007.
Tribollet, A., Godinot, C., Atkinson, M., and Langdon, C.: Effects of elevated pCO2 on dissolution of coral carbonates by microbial euendoliths, Global Biogeochem. Cycles, 23, GB3008, https://doi.org/10.1029/2008GB003286, 2009.
Tribollet, A., Chauvin, A., and Cuet, P.: Carbonate dissolution by reef microbial borers: a biogeological process producing alkalinity under different pCO2 conditions, Facies, 65, 2, https://doi.org/10.1007/s10347-018-0548-x, 2019.
Uppström, L. R.: The boron/chlorinity ratio of deep-sea water from the Pacific Ocean, Deep-Sea Research and Oceanographic Abstracts, 21, 161–162, https://doi.org/10.1016/0011-7471(74)90074-6, 1974.