the Creative Commons Attribution 4.0 License.
the Creative Commons Attribution 4.0 License.
 | 15 Feb 2025
Interferences caused by the biogeochemical methane cycle in peats during the assessment of abandoned oil wells
Sebastian F. A. Jordan
Stefan Schloemer
Martin Krüger
Tanja Heffner
Marcus A. Horn
Martin Blumenberg
In the global effort to reduce anthropogenic methane emissions, millions of abandoned oil and gas wells are suspected to be prominent, although thus far often overlooked, methane sources. Recent studies have highlighted the hundreds of thousands of undocumented abandoned wells in North America as major methane sources, sometimes emitting up to several tons of methane per year. In Germany, approximately 25 000 abandoned wells have been described; these wells have been well documented, and the data are publicly available. Here, we present a methodological approach to assess emissions, particularly methane, from cut and buried abandoned wells, which are typical of wells in Germany. We sampled eight oil wells in a peat-rich environment, with four wells in a forest (referred to as Forest), three wells at an active peat extraction site (referred to as Peat), and one well in a meadow (referred to as Meadow). All three areas are underlain by peat. At each site, we sampled a 30 m × 30 m grid and a corresponding 20 m × 20 m reference grid. Three of the eight wells and reference sites exhibited net methane emissions. In each case, the reference sites emitted more methane than the respective well site, with the highest net emission (∼ 110 nmol CH4 m−2 s−1) observed at one of these reference sites. All methane-emitting sites were located within the active peat extraction area. Detailed soil gas characterization revealed no methane-to-ethane or methane-to-propane ratios typical of reservoir gas; instead, it showed a typical biogenic composition and isotopic signature (mean δ13C-CH4 of −63 ‰). Thus, the escaping methane did not originate from the abandoned wells nor the associated oil reservoir. Furthermore, isotopic signatures of methane and carbon dioxide suggest that the methane from the peat extraction site was produced by acetoclastic methanogens, whereas the methane at the Meadow site was produced by hydrogenotrophic methanogens. However, our genetic analysis showed that both types of methanogens were present at both sites, suggesting that other factors control the dominant methane production pathway. Subsequent molecular biological studies confirmed that aerobic methanotrophic bacteria were also important and that their relative abundance was highest at the peat extraction site. Furthermore, the composition of the methanotrophic community varied between sites and depths. The aerobic methane oxidation rates were highest at the peat extraction site, potentially oxidizing a multiple of the emitted methane and, thus, likely providing an effective microbial methane filter.
For the assessment of potential leakage from cut and buried abandoned wells, our results highlight the need to combine methane emissions with soil gas characterization in comparison to a suitable reference site. Monitoring that relies exclusively on methane emissions may result in the erroneous classification of naturally occurring emissions as well integrity failure.
- Article
(6491 KB) - Full-text XML
-
Supplement
(1500 KB) - BibTeX
- EndNote


Methane is one of the key greenhouse gases contributing to climate change. However, it also has a particular role in climate change mitigation, as its atmospheric lifetime is especially short (Saunois et al., 2020). This makes methane a prominent political target, as emission reduction may quickly result in a decreasing atmospheric concentration and, thus, a climate effect. In total, 156 countries participate in the Global Methane Pledge, which aims to reduce global methane emissions by 30 % by 2030 (IEA, 2024).
The fossil fuel sector is the second-largest anthropogenic methane source. Methane emissions from this sector not only include emissions from active production but also methane leakage from millions of abandoned oil and gas wells due to well integrity failure, as found by recent studies in regions in the USA and Canada (Samano et al., 2022; Williams et al., 2021). The permanently increasing number of abandoned oil and gas wells is a rising problem at the global scale (Bowman et al., 2023; Williams et al., 2021; Riddick et al., 2020), and this issue is predicted to intensify in the future during the transition to renewable energy sources. Present-day abandonment procedures depend on national regulations and are often similar in different countries, although they have differed strongly in the past. However, the greatest impact on a country's abandoned well situation is probably the extent to which these regulations are properly enforced. Some countries have also been struggling with undocumented or orphaned wells (Boutot et al., 2022). Different well abandonment practices throughout history have resulted in various well abandonment scenarios: in some cases, only the well head has been closed, everything has been left in place, and the well casing has remained unplugged (Pekney et al., 2018; Williams et al., 2021); in other cases, an open bore hole has been left in the ground (Pekney et al., 2018; Lebel et al., 2020) or the wells have been properly plugged and cut and the remains have been buried (Davies et al., 2014; Schout et al., 2019; Cahill et al., 2023). Thus, in order to maximize economic and environmental benefits (Kang et al., 2021), authorities and scientists have been trying to identify particularly high emitters (Bowman et al., 2023) or wells with a high risk of integrity failure (Cahill and Samano, 2022), as financial resources for the proper decommissioning of wells are limited (Raimi et al., 2021; Agerton et al., 2023). In Germany, for example, the first regulations date back to 1904; these regulations have been refined every few decades until the latest update in 2006 (von Goerne et al., 2010). In this region, all kinds of wells (exploration, production, appraisal, and injection wells) are generally decommissioned and buried (Landesamt für Bergbau, Energie und Geologie (LBEG), 1998).
It is not possible to detect methane emissions from such (buried) wells using the same methods employed for wells with visible surface installations, such as those often found in the USA and Canada (Williams et al., 2021; Lebel et al., 2020). For cut and buried wells (e.g., in Germany, the Netherlands, and the UK), single measurements made atop the well locations are insufficient (Schout et al., 2019). In this case, upward-migrating natural gas can be subject to several physical and biogeochemical processes, for example, microbial oxidation is able to alter concentrations and even the isotopic composition (Whiticar, 2020). Moreover, leaking gas can migrate away from a well's location (Dennis et al., 2022; Forde et al., 2019a), disperse through the soil, and potentially be oxidized by methanotrophic microorganisms on its way to the atmosphere (Forde et al., 2022). Thus, false-negative results would be obtained with respect to the well integrity. In addition, biogenic methane can be microbially produced in shallow anoxic soils by methanogenesis. Methanogenesis takes place due to organic carbon degradation, which is facilitated via a complex network of trophically linked microorganisms (e.g., intermediary ecosystem metabolism; Drake et al., 2009), ultimately resulting in methane production when alternative electron acceptors except for carbon dioxide are depleted (Whiticar, 2020). This process is mainly carried out by three types of anaerobic archaea in more than 30 genera: (1) acetoclastic methanogens that convert acetate to methane and carbon dioxide, (2) hydrogenotrophic methanogens that reduce carbon dioxide to methane with hydrogen, and (3) methylotrophic methanogens that disproportionate methyl groups to methane and carbon dioxide (Liu and Whitman, 2008). Although most methanogenic species are hydrogenotrophs, two-thirds of biologically produced methane is derived from acetate (Liu and Whitman, 2008). Combining the isotopic composition of methane and the relation of methane to the sum of ethane and propane is a commonly used method to distinguish natural gas (generally thermogenic) from biogenic methane (Whiticar, 2020). However, methane can also be oxidized to carbon dioxide by anaerobic and aerobic methanotrophs along its way to the atmosphere, which shifts the isotopic composition, adding more complexity. In the case of organic-matter-rich soils or soils with a high groundwater table, methane production can outweigh its consumption, leading to substantial methane emissions (Le Mer and Roger, 2001; Lai, 2009). To put this into perspective, upland forests are known to act as methane sinks, taking up to ∼ 4 nmol CH4 m−2 s−1 from the atmosphere, whereas natural wetlands emit up to ∼ 600 nmol CH4 m−2 s−1; however, this latter value can be topped by rice paddy fields, which emit over 2000 nmol CH4 m−2 s−1 (Oertel et al., 2016). In general, these processes take place in the active zone of the soil, but environments with biogenic methane generation are especially prone to the generation of false-positive well leakage classifications.
Wetlands and peat-rich areas are examples of such complex environments and are associated with ∼ 2700 abandoned wells in Germany (mainly in northern Germany), translating to roughly 15 % of all abandoned German wells (∼ 25 000; NIBIS® Kartenserver, 2014b; Wittnebel et al., 2023). Thus, these areas act as an ideal test bed for method testing. Peat-rich areas are biogeochemically complex and are defined as former raised or ombrotrophic bogs, rich fens, or other types of peat-accumulating wetlands. In pristine ecosystems, vegetation takes up carbon dioxide from the atmosphere and produces biomass. Peat accumulates as plant litter and is only partially decomposed due to oxygen limitation (Turetsky et al., 2014; Frolking et al., 2006) below the partially aerated and very thin vadose zone. However, most raised bogs in central Europe have been drained in the past for agricultural use, forest cultivation, and peat extraction for fuel or horticultural purposes (Pfadenhauer and Klötzli, 1996; Laine et al., 2013). After drainage, most of these wetlands have changed from net carbon sinks to net carbon sources (Frolking et al., 2006). This is due to the ultimate remineralization of once stored organic matter to carbon dioxide (Abdalla et al., 2016). As a consequence, methane emission decreases drastically, as the aerated soils enable aerobic methane oxidation to CO2 and methanogenesis is restricted to deeper layers (Sundh et al., 1994; Abdalla et al., 2016). Nonetheless, the greenhouse gas balance changes with drainage and differs depending on land use (Abdalla et al., 2016). Methane emissions are thought to stop altogether in peatlands used for forestry or agriculture (Abdalla et al., 2016, and references therein). However, previous studies have pointed to substantial methane emissions from ditches draining the peats, and these emissions can even reach the magnitude of emissions from virgin peatlands (Sundh et al., 2000). The extraction of peat results in accelerated carbon loss and increased greenhouse gas emissions, as peat decomposition associated with end use (e.g., combustion and use in horticulture) comprises the majority of total emissions (Cleary et al., 2005). Due to this general complexity with respect to methane- and carbon-dioxide-related biogeochemical processes in soils, one has to look closely to delicately allocate methane emission to natural or anthropogenic (e.g., abandoned wells) sources.
Globally, only very few countries, e.g., the USA and Canada (Bowman et al., 2023), include emission from abandoned wells in their yearly greenhouse gas inventory. Within the framework of a Federal Institute for Geosciences and Natural Resources (Bundesanstalt für Geowissenschaften und Rohstoffe – BGR) project “Leakage assessment of buried wells in Germany”, we aim to fill this knowledge gap for Germany by studying a representative subset of abandoned wells. We use the term “abandoned well” here to refer to a former oil or gas well in Germany as well as to dry wells, auxiliary wells, and other wells related to hydrocarbon production that have been decommissioned and buried in accordance with the guidelines in force at the time (von Goerne et al., 2010). This includes plugging and backfilling of the well, cutting the well, removing the wellhead and the shallow casings, and reconditioning of the area (e.g., for agricultural use).
Here, we present a first detailed study of eight wells in a complex methane-rich setting in northern Germany. Environments with high in situ biogenic methane generation might lead to a false-positive well leakage classification based on surface emission measurements if the methane source (shallow biogenic vs. thermogenic natural gas) is not correctly determined. We present our principal methodological approach, a combination of geochemical and microbial techniques, to evaluate methane emissions from cut and buried abandoned wells. In this paper, we focus on the results from this small study area, including overall methane emissions and identifying the source of the methane, and thus allocate the emissions to the abandoned wells or to in situ methanogenic processes. In addition, the microbiological methods enabled us to quantify the methane oxidation potential of the soil, i.e., the methanotrophic methane filter function, and identify key organisms feeding on the soil methane.
2.1 Study site
The sampling and field measurements were conducted near Steimbke (Lower Saxony, northern Germany), an area with ongoing and historical industrial peat production, in March and April 2022. Additional samples were taken from the peat extraction site in April 2023 and from reference sites in November 2023. Three oil fields were located around Steimbke. From these three, we focused on the Steimbke-Nord field. Data, including the location, depth, and date of drilling of wells, related to this oil field; data on the other ∼ 25 000 (abandoned, producing, and exploration) wells in Germany; and data on the oil and gas fields are publicly available via the NIBIS MAP SERVER (NIBIS® Kartenserver, 2014a, b). We used this database to locate about 200 wells in the vicinity of Steimbke-Nord, including 159 abandoned production wells. The oil-bearing geological horizons were located at 500–700 m depth in the Malm and Dogger horizons (both Jurassic), covering an area of about 1.5 km2. The wells were drilled between 1942 and 1950 and are typically 570–695 m deep. In total, 3×10⁸ t of oil (as well as 2.9×10⁹ m3 of oil-associated natural gas) was produced before 1964 (https://nibis.lbeg.de/cardomap3/?permalink=WeOGYg3, last access: 3 May 2024). We studied and sampled eight abandoned wells, each with respective reference measurements (Fig. 1, Table 1). To investigate methane emissions related to abandoned onshore wells, cut and buried wells in the southeastern part of this oil field, covering an area of ∼ 0.2 km2 (Fig. 1), were targeted. The eight wells are situated in areas representing three different land use types. Three wells (R-WA 272, R-WA 254, and R-WA 264) are located in the western part of the area, where active peat mining is ongoing, with the bare peat directly at the surface (hereafter referred to as the Peat site). Before the peat extraction in the active area began, the Peat site was also an agricultural meadow that was probably temporarily grazed and regularly fertilized with manure like the meadow at well site R-WA 275, ∼ 350 m to the east (hereafter referred to as the Meadow site). Two of the four wells from the forest area (dominated by birch trees and pines) are located between the active Peat site and the Meadow (R-WA 273 and R-WA 274), whereas the remaining two are situated in a larger forested area ∼ 225 m to the north and northeast, respectively (hereafter referred to as the Forest site). In the case of the Forest and Meadow sites, the topsoil above the peat layer was sampled, whereas the peat was sampled directly at the Peat site. Regarding the pH of the Peat site, Welpelo et al. (2024) published a pH of ∼ 3.5 for a nearby rewetted part of the peat extraction area, about 2.5 km away, as well as additional physicochemical parameters. Residue from the drilling and/or production was only visible to the naked eye in the Forest area. Here, cement residue, likely from the rig cellar or associated infrastructure; sand from the backfill procedure; and small depressions were signs of former activity. No remnants of the former well itself, like wellheads, old horsehead pumps, or any kind of piping, were visible. All sample sites are situated in peat-rich areas, and the majority of sites include about 1.0 m or more of raised-bog peat either below the topsoil (Forest and Meadow sites) or as bare peat (Peat site) (https://nibis.lbeg.de/cardomap3/?permalink=1baQ8yzX, last access: 3 May 2024). The peat depth in this area was taken from a geological exploration in 1983. An exemplary soil profile is shown in Fig. 2d; this profile was drilled near our peat reference site (∼ 50 m west). These profiles show a peat thickness of ∼ 1.9–2.6 m for the Peat site, with about 1 m or more having being extracted since ∼ 2017. For sites R-WA 273, R-WA 274, and R-WA 275, the state agency (https://nibis.lbeg.de/cardomap3/?permalink=1uIMU2yt, last access: 3 May 2024) has estimated a peat thickness of more than 2 m. However, for sites R-WA 211 and R-WA 209, peat was confirmed to have a depth of more than 30 cm, although its entire thickness is unknown.
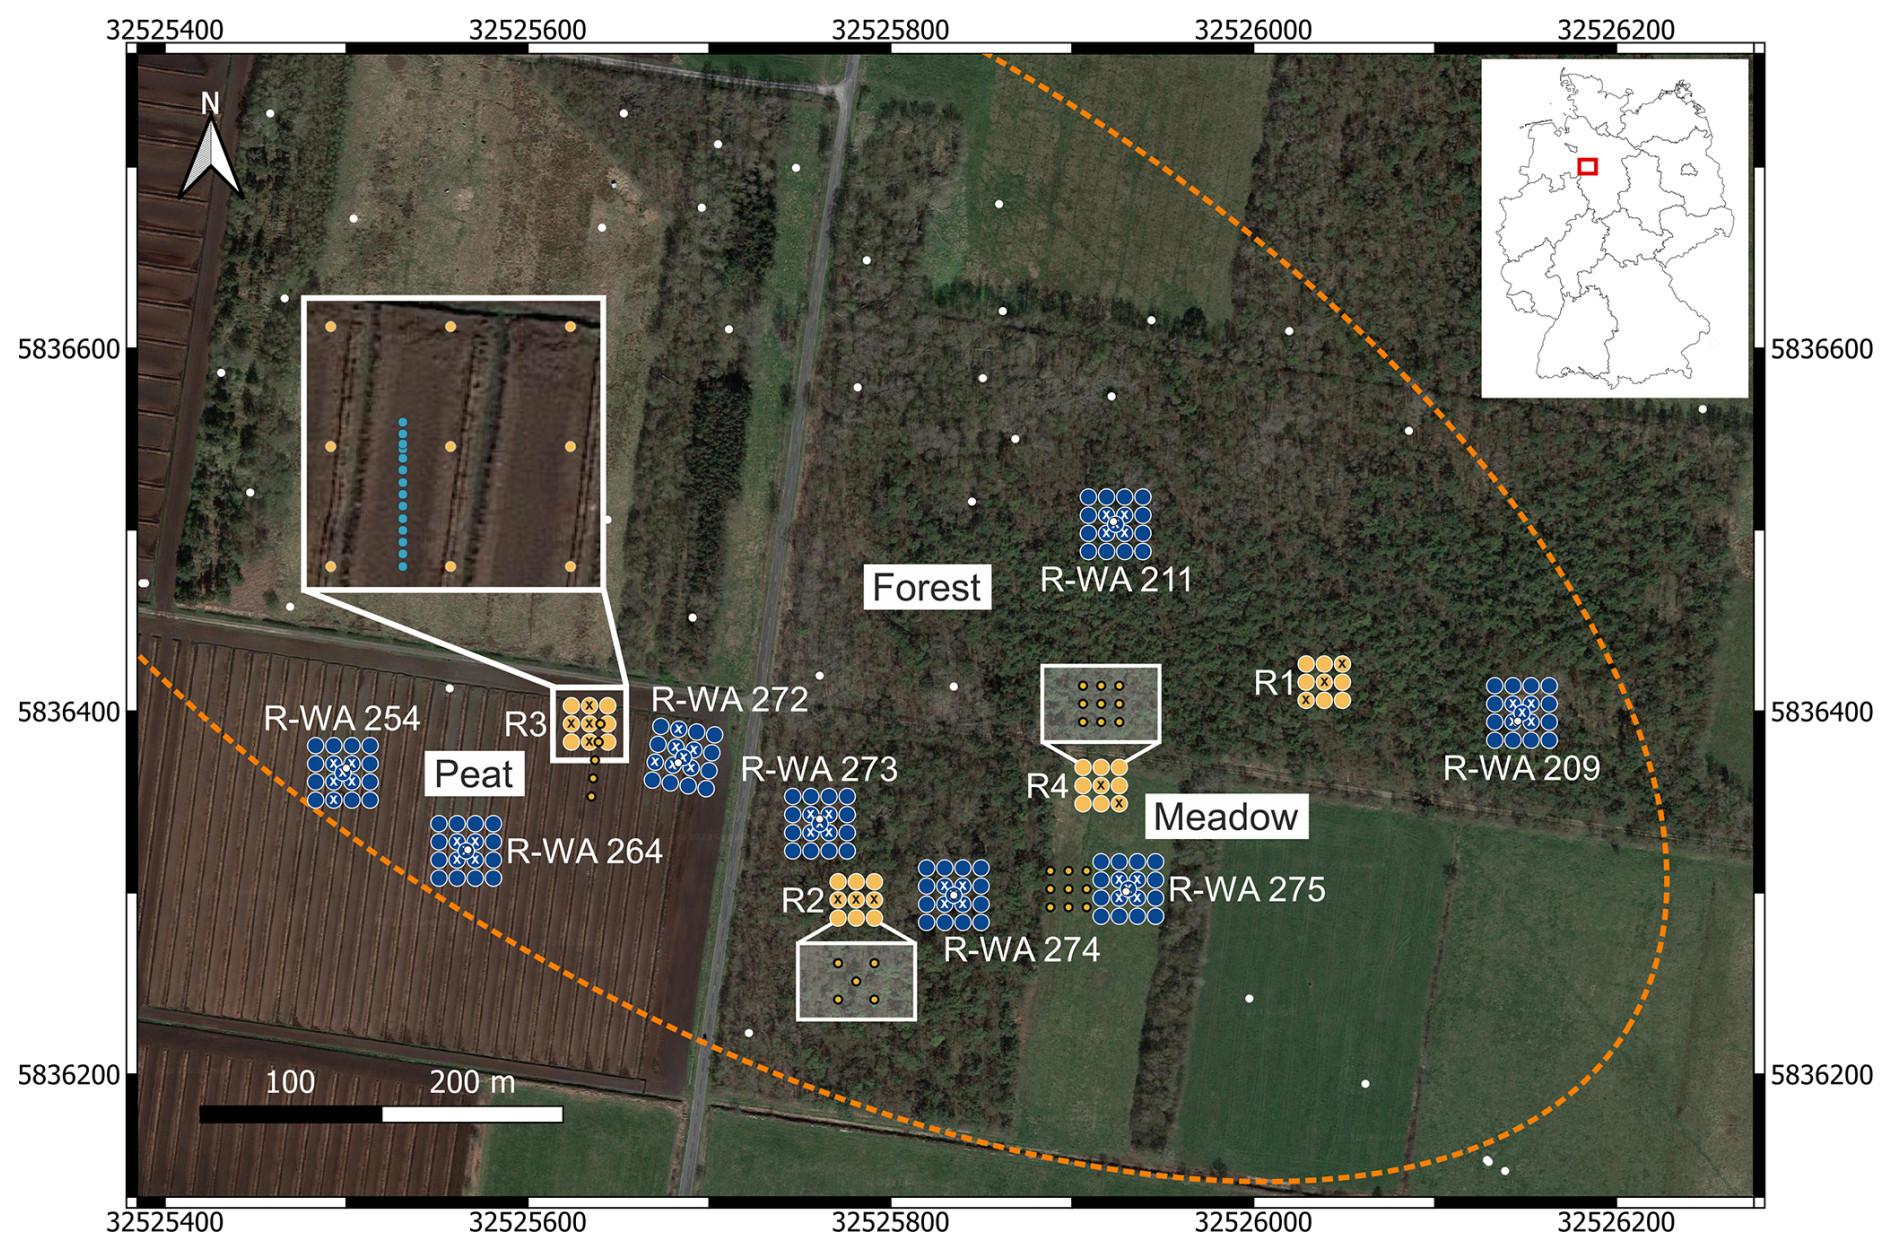
Figure 1Overview of the study site in Steimbke showing the well sites and the reference site measuring grids, each with 17 and 9 measuring points, respectively. Abandoned wells are depicted using white dots, and those studied here are labeled (e.g., R-WA 211). The dotted orange line denotes the rough dimensions of the Steimbke-Nord oil field. Coordinates are stated in UTM 32U (WGS84), with easting and northing planar coordinates in meters. Blue indicates the well site emission (CH4 and CO2) measuring grids, whereas orange indicates the reference site emission (CH4 and CO2) measuring grids; the positions for soil gas sampling are marked using white or black crosses, respectively. The left inset depicts a transect with an approximate 1 m distance between the measuring points to assess spatial variations in an area without a well. Additional soil gas sampling points are depicted using orange circles and are shown in part in a white box for better visibility. The areas compared in this study (Peat, Forest, and Meadow) are also marked. The map was created using QGIS (v.3.22.3) and © Google Earth satellite images from 2015 as the background.
Table 1Overview of surveyed well locations and selected metadata. All wells have been used for oil production in the past.
* Peat is present in all areas; however, the Peat area is an active peat extraction site.
2.2 Sampling method and grid
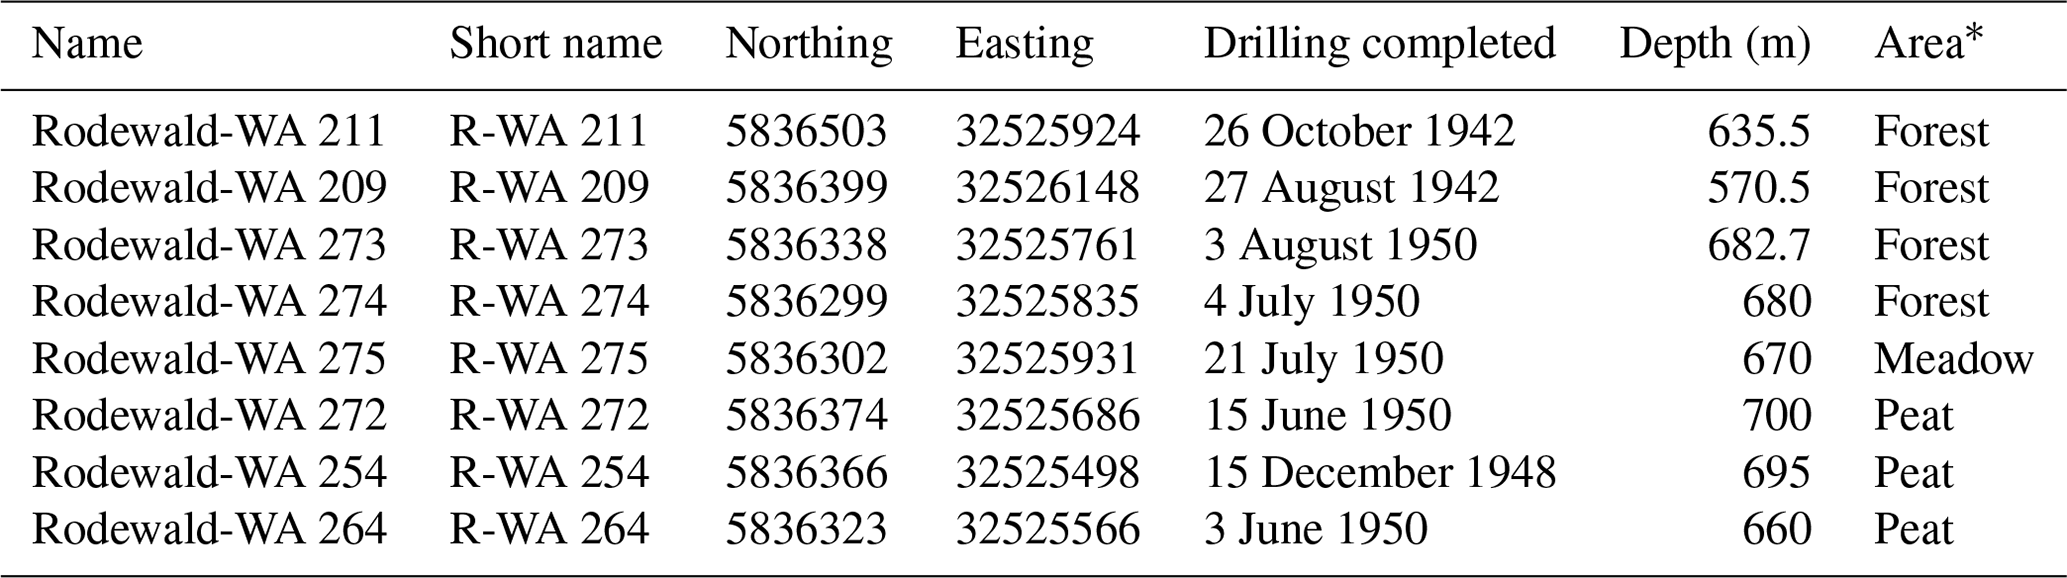
We studied well and reference sites with respect to methane (and CO2) emission (both positive and negative emission), soil gas composition, and microbial communities (Fig. 2c). The reference sites were placed at a distance of 15–150 m from any studied well on the same terrain. The positions of the wells were extracted from the NIBIS® MAP SERVER (NIBIS® Kartenserver, 2014b), and a handheld GPS device (etrex Vista Hcx, Garmin) was used to navigate in the field. Due to the burial of abandoned wells in the working area, our study relied on the coordinates of the wells. Discussion with the State Office of Mining, Energy, and Geology (Landesamt für Bergbau Energie und Geologie – LBEG); discussions with the local public; and indications (e.g., color changes or remnants of roads/pathways) from recent and historical Google Maps images supported the correctness of the well positions.
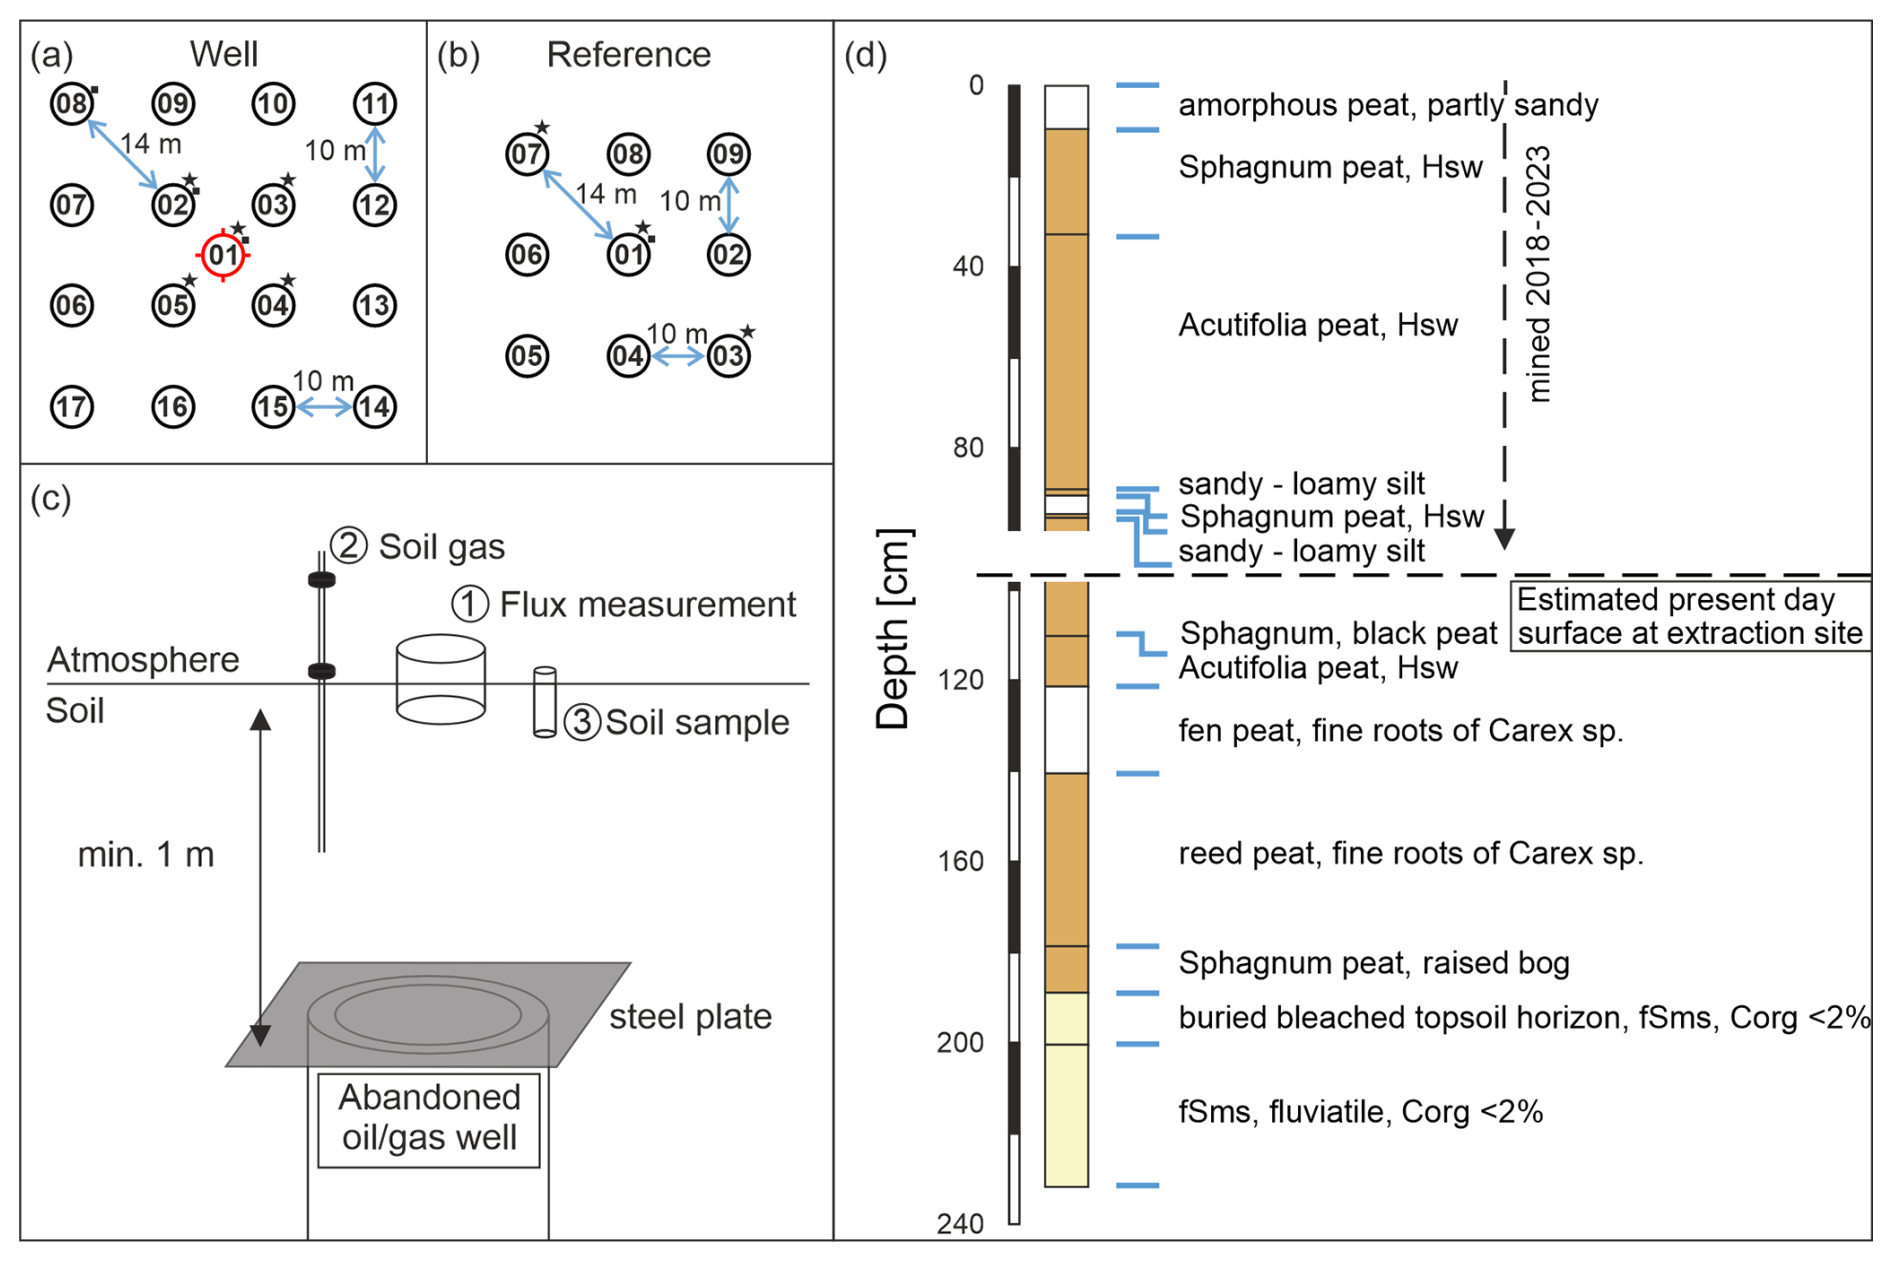
Figure 2Sampling scheme for emission measurements (CH4 and CO2) for well (a) and nearby reference (b) sites, both with likely similar biogeochemistry and vegetation, as well as a schematic display of a buried abandoned well (c, not to scale). Additional soil gas samples (stars) and soil samples for microbial analysis and methane oxidation rate determination (squares) were taken at the marked positions. The shift in the symbols toward the upper right was made for graphical reasons. Samples were taken directly at the numbered positions. The well position is marked in red. (d) A simplified profile of a pedological well (no. 54315, source LBEG) drilled in 1983 before peat extraction began. The well coordinates are east: 32525578, north: 5836405 (EPSG:4647), and it is located close (50 m west) to the reference grid at the peat extraction site. fSms denotes medium sandy fine sand, while Hsw denotes finely dispersed or enriched in nests with unconsolidated sesquioxides. The following is a link to the map and drilling profile shown in panel (d): https://nibis.lbeg.de/cardomap3/?permalink=2RfGItuF (last access: 30 January 2025).
The central measuring point was placed directly above the well. We positioned the other 16 measuring points around the well pointing north (with the help of two measuring tapes and a compass). The distance between these 16 points was 10 m from point to point, aiming at a broad coverage of potential methane emission areas above the buried wells. In total, the well site grid covered an area of 30 m × 30 m and 17 measuring points (Fig. 2a). Soil gas samples were taken in the central five positions of the well (as indicated in Fig. 2a). Soil samples for microbial analyses were usually taken at three positions starting in the center and moving toward one of the corners. In the case of high methane emissions, additional soil gas and microbial samples were taken at the respective spots.
For these eight wells, we established four different reference sites, labeled R1 to R4 (Fig. 1). The reference grids consisted of nine measuring points covering an area of 20 m × 20 m (Fig. 2b). Measuring reference grids is necessary to determine and account for potential natural background variations for each abandoned well. Reference grids were typically located at a distance of 15–150 m from the well site and comprised similar soil conditions and vegetation; moreover, these reference grids were investigated immediately after the well grid measurement. Reference site R4 for the abandoned well in the Meadow was measured once, the two reference sites for the wells in the Forest area (R1 and R2) were each measured twice on consecutive days (Table 2), and the single reference site for the three wells in the Peat area (R3) was surveyed three times within 1 week. Three soil gas samples were usually taken in a diagonal pattern, whereas the soil sample for microbial analysis was taken in the center of the grid (Fig. 2b). To estimate the general spatial variability in emissions in the area, we sampled a transect through a point with high emission at the Peat reference site. The measuring points along the 12 m transect were 1 m apart.
Table 2Summary of the sampled oil well and reference sites. The displayed natural fluxes are examples from the literature (Abdalla et al., 2016; Oertel et al., 2016) as well as the emissions from abandoned wells, which were compiled from Williams et al. (2021) and Cahill et al. (2023).
2.3 Methane and carbon dioxide emissions
Methane emissions from the soil surface into the atmosphere were measured with an optical feedback cavity-enhanced absorption spectroscopy trace gas analyzer (LI-7810, LI-COR) coupled to a portable hydraulic chamber (SMART CHAMBER, LI-COR) following the closed-chamber principal. The measurements were conducted as instructed by the manufacturer. First, defined plastic collars with a diameter of 20.3 cm and height of 12.4 cm (outside diameter of 8.4 in. and height of 4.5 in.) were positioned at each of the measuring points and were pushed few centimeters into the soil to guarantee complete closure of the smart chamber with the underlying soil profile. As the exact penetration depths of the collars were needed for the calculation of fluxes (dead volume of the ring), each insertion depth was measured individually. After both devices, the analyzer and chamber, reached operation mode, a start-up (triplicate) measurement was conducted to ensure stable instrument conditions.
Each grid position was sampled in triplicate at least 1 h after the placement of the respective collar. The chamber stayed closed for the time of one measurement (120 s) to continuously record (1 Hz) the change in the methane and carbon dioxide concentrations in the loop headspace, which was open to the soil surface. Gas fluxes were computed after a 2 min chamber closure. Following the closure, data from the first 40 s were ignored (deadband), after which a linear regression of the concentration data was applied for each singular measurement, and the triplicate measurements were subsequently averaged. Between measurements, the chamber stayed open for 60 s to enable equilibration with atmospheric CH4 and CO2 concentrations. Examples of such measurements and their r2 values are shown in the Supplement (Sect. S1), and the standard deviation of the triplicate measurements is also tabulated in the Supplement (Table S2 in the “Data supplement” file).
Additional measurements at each site included soil moisture (soil water content – SWC) and bulk conductivity measurements (electrical conductivity – EC) using a Stevens HydraProbe sensor with 6 cm long measuring rods. The sensor was not specifically calibrated for the organic-matter-rich (peat-rich) soils at the study site and used the default “sand” settings for data evaluation; thus, the reported SWC and EC data in Table S2 are only indicative data. As the short rods effectively measured the temperature directly below the soil surface, which can potentially be biased due to solar radiation, we applied an additional 25 cm long temperature probe (Type E, Omega) to better constrain soil temperatures. In addition, accompanying weather data (e.g., temperature, wind speed, and humidity), measured with a handheld device (Kestrel 4200 pocket airflow tracker, Cole-Parmer, USA), can be found in Table S8.
2.4 Soil gas sampling and compositional analysis
Gas samples were acquired using soil gas probes. The probes are made of stainless steel with an outer diameter of 6 mm, an inner diameter of 3 mm, and a total length of 1.5 m. To prevent the probes from becoming blocked while pushing them into the ground, a pin is attached to the front of the probe. This pin remains in the ground after the desired depth is reached and the probe is lifted by a few centimeters. The lances are usually driven into the ground with a moveable anvil; however, they could easily be pushed in to the maximum depth of 1 m at study sites with soft, unconsolidated soils. The locations sampled and the locations at which methane emissions were detected are indicated in Fig. 3. Due to the shallow groundwater table, the probes often had to be lifted close to the surface to be able to sample the gas phase of the vadose zone, thus giving an approximate indication of the actual water level (sampling depths are listed in Table S1). A septum port is attached to the end of the probe, which allows for sampling with a syringe. Before sampling, the dead volume of the soil gas probe was flushed twice with soil gas immediately after placement with a 20 mL syringe and then rested at least for 1 h to equilibrate. Afterward, 20 mL soil gas was extracted and stored in crimped vials prefilled with saturated NaCl as the sealing solution. Vials were stored upside down for a maximum of about 2 weeks before further gas analysis in the laboratory.
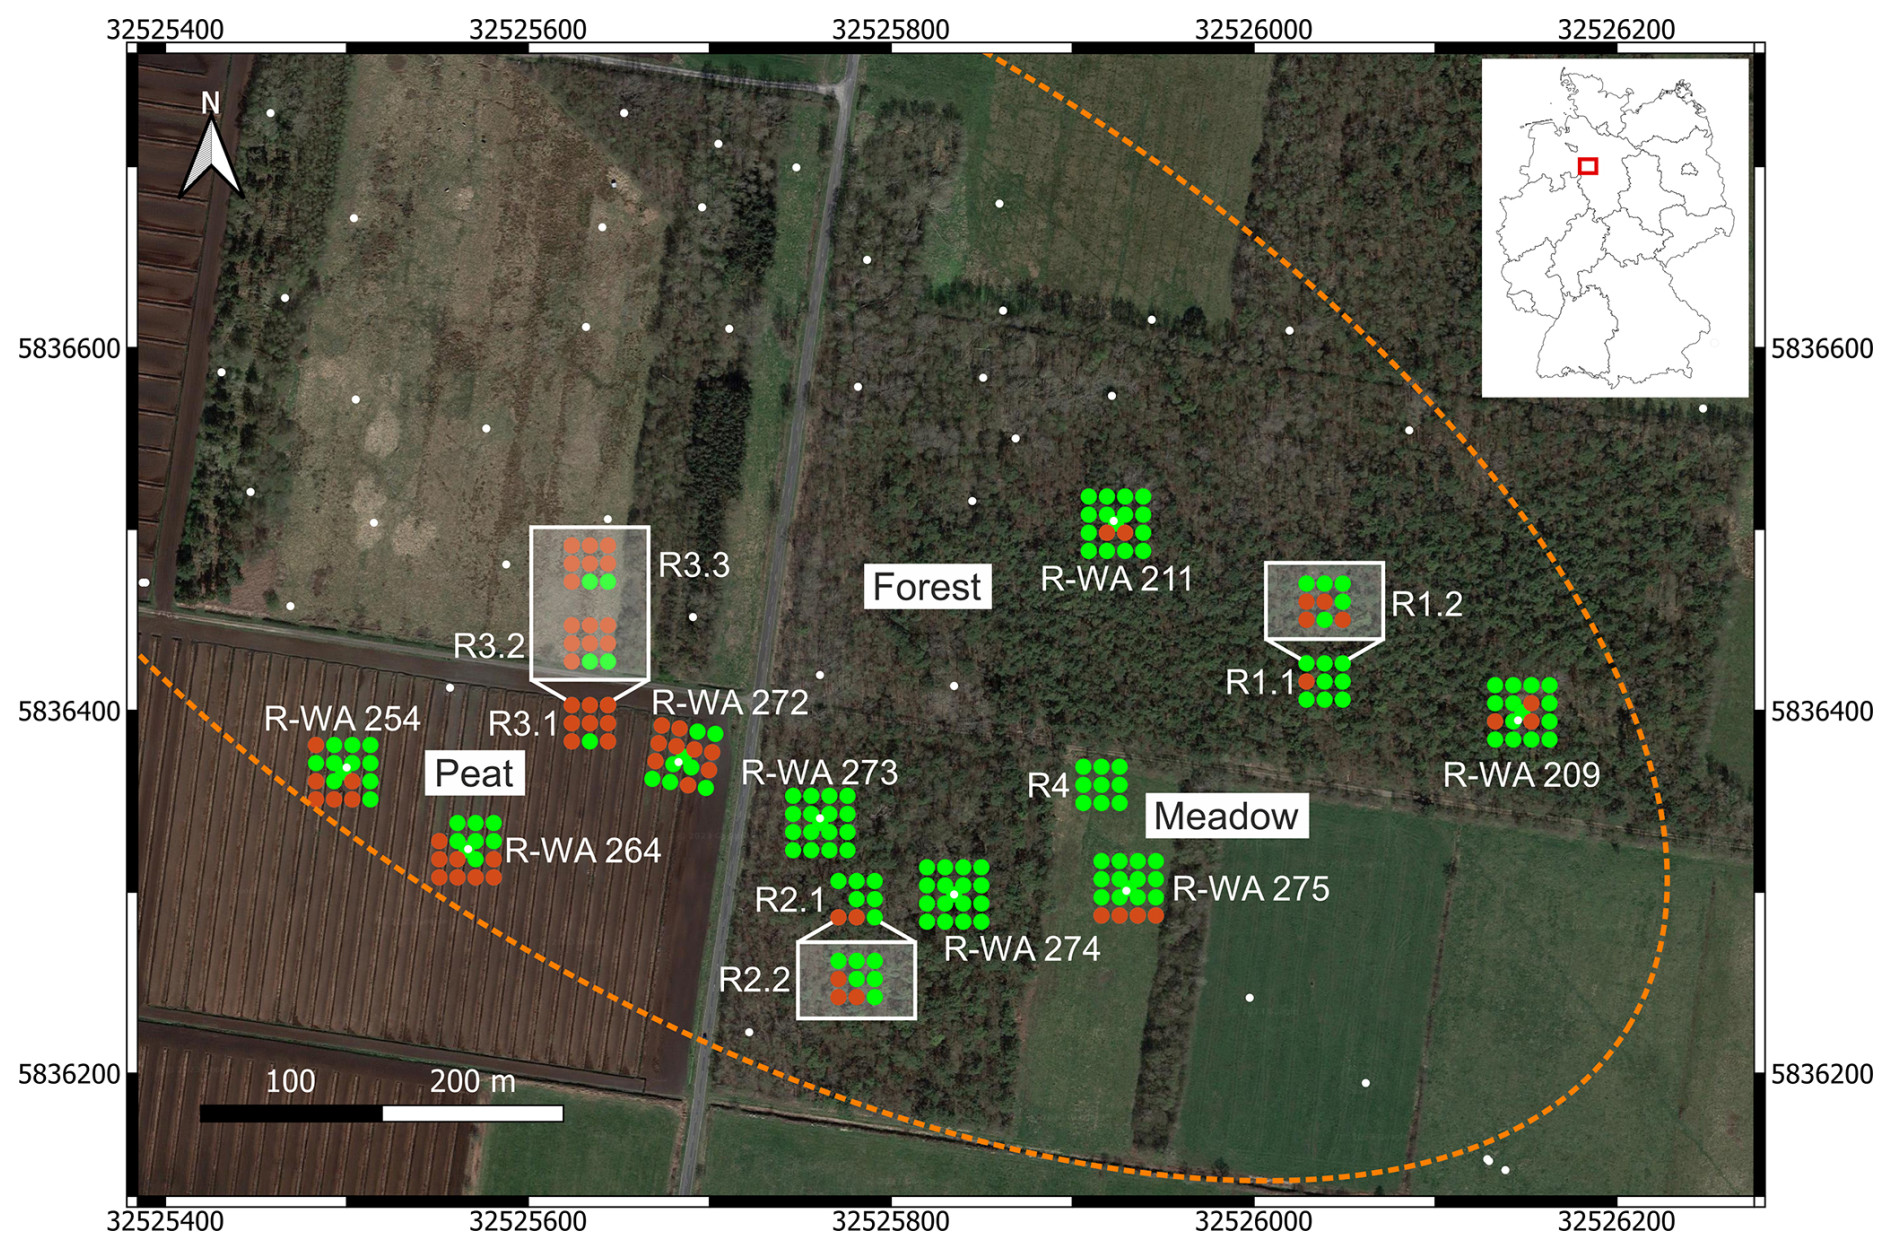
Figure 3Overview of the study site indicating methane emissions (red) and methane uptake (green) for well sites (17 measuring points) and reference sites (9 measuring points). Abandoned wells are depicted using white dots. The rough dimensions of the Steimbke-Nord oil field are outlined (dotted orange line). Coordinates are stated in UTM 32U (WGS84), with easting and northing planar coordinates in meters. The multiple measurements of reference sites are shown using a white box. The map was created using QGIS (v.3.22.3) and © Google Earth satellite images from 2015 as the background.
Stored gas samples were analyzed in the lab using a gas chromatograph (GC; TRACE 1310 GC, Thermo Fischer Scientific, USA) equipped with a heated valve system and column switching. A total of 1 mL of sample was then injected into the sample loops. The individual components were quantified in parallel on three channels. On channel 1, pre-separation of hydrocarbons (C1 through C6) from a 500 µL sample was performed on a nonpolar polysiloxane polymer column (15 m Restek MX-1; 0.28 mm internal diameter and film thickness of 3 µm). Molecular weight components > C7 were back-flushed. Full separation was performed on the main 50 m Al2O3 capillary column (0.32 mm internal diameter and film thickness of 5 µm). Both columns were operated non-isothermally starting at 30 °C and ending at 180 °C. All components were detected on a flame ionization detector (FID) with helium (He) as the carrier gas. On channel 2, the sample was injected via a 500 µL sample loop. CO2 was separated from other components by a pre-column (30 m HayeSep Q; 0.53 mm internal diameter and film thickness of 20 µm) and directly detected after bypassing the Molsieve column on the thermal conductivity detector (TCD). All other components (Ne, H2, Ar, O2, N2, CH4, and CO) were chromatographically separated on the main analytical Molsieve column (80 m 5 Å; 0.53 mm internal diameter and film thickness of 50 µm). The carrier gas on this channel was He. For better sensitivity for helium and hydrogen, these compounds were analyzed on channel 3 with argon as the carrier gas. The sample loop used had a volume of 125 µL. CO2 and higher-molecular-weight carbon components were retained and back-flushed on a packed pre-column (2 m HayeSep Q; mesh 100/120 and 1 mm internal diameter). Separation of He, Ne, H2, O2, and N2 components was performed on a 3 m 5 Å packed molecular sieve column (mesh 80/100 and 1 mm internal diameter) and subsequently detected on a TCD.
2.5 Isotopic analysis of methane and carbon dioxide
For samples with concentrations >200 ppm, carbon isotope signatures of CH4 (δ13C-CH4) and CO2 (δ13C-CO2) were determined after injection into a continuous-flow gas chromatography isotope-ratio mass spectrometry (GC-IRMS) system (Agilent GC coupled to a Thermo Fisher Scientific MAT 253 via a GC-combustion interface II/III). The different compounds were separated on a 25 m Porapak column, and methane was combusted to CO2 at a temperature of 960 °C. Low-concentration samples (2–200 ppm CH4) were measured by applying a liquid nitrogen cryo-focusing of methane on a 1 m, packed column installed in an Agilent 6890 GC likewise coupled to a Thermo Fisher Scientific MAT 253 via a GC-combustion interface II/III. Deuterium isotope signatures of methane (δ2H–CH4) were determined by a similar GC-IRMS system (TRACE GC and Isolink/ConFlow IV coupled to a MAT 253) if methane concentrations were above 2000 ppm. Methane was reduced to molecular H2 at a temperature of 1420 °C. The reproducibility for δ13C and δ2H–CH4 is ±0.3 ‰ and ± 3 ‰, respectively. The and ratios are presented in the standard δ notation vs. the respective Vienna Pee Dee Belemnite (VPDB) and Vienna Standard Mean Ocean Water (VSMOW) reference standards (Coplen, 2011).
2.6 Methane oxidation rates
In the field, shallow soil samples (down to 20 cm) were obtained using a stainless-steel push core with an inner Plexiglas liner. The exact coordinates and sampling depths are listed in the Supplement (Table S4). Deeper samples (40–100 cm) were retrieved with the help of an Edelman auger as a 20 cm composite sample. Samples were kept, transported, and stored at 4–7 °C until further processing. As a next step, samples were homogenized, and 5 g subsamples were collected and stored at −20 °C for DNA extraction. For determination of potential aerobic methane oxidation rates (MOx), each sample was divided into seven aerobic incubations (100 mL vials), with ∼ 10 g of homogenized soil sample in each. Three parallels were incubated with 1 % methane in the headspace, whereas four were incubated without methane, with one of the latter being autoclaved prior to incubation.
Headspace methane and carbon dioxide concentration were determined regularly with a 610C GC (SRI Instruments Europe GmbH, Bad Honnef, Germany) equipped with an FID. At the end of the incubations, bottles with active soil samples were subsampled for DNA extraction again (see Sect. 2.7), and the remaining sample was then dried at 80 °C to calculate the SWC. In the end, methane oxidation was calculated as the slope of the declining methane concentration in micromoles (µmol) per incubation over time in a linear section of the graph. Subsequently, the dry weight was then accounted for in the case of MOx dry, whereas the wet weight was considered for MOx wet. Finally, to compare it to methane emissions, MOx wet was multiplied by the respective soil density and a volume of 0.2 m3, as 20 cm was the maximal depth of a composite sample.
2.7 DNA extraction
DNA was extracted from soil samples (∼ 0.5 g) using the FastDNA SPIN kit for soil (MP Biomedicals, Illkirch, France). The extraction followed the manufacturer's instructions with modifications as previously described Webster et al. (2003): (1) the addition of 200 µg of poly(adenylic acid) (Roche Diagnostics International Ltd., Rotkreuz, Switzerland) prior to bead beating; (2) two bead-beating steps of 45 s at 6.5 m s−1 were performed on a FastPrep-24 system (MP Biomedicals); and (3) DNA was eluted in TE buffer and quantified with a QuantiFluor dsDNA chemistry system using a Quantus fluorometer (Promega GmbH, Walldorf, Germany).
2.8 Sequencing the bacterial and archaeal community via 16S rRNA genes
Following DNA extraction, samples were sequenced by Microsynth AG (Balgach, Switzerland) using MiSeq Illumina technology for microbial community analysis. Both bacteria and archaea were sequenced from the same DNA extractions and analyzed separately by targeting the 16S rRNA gene. For bacteria and archaea, the respective 515F–806R (GTG CCA GCM GCC GCG GTAA; GG ACT ACH VGG GTW TCT AAT; Caporaso et al., 2011) and 340F–ARCH806R (CCC TAY GGG GYG CAS CAG; GGA CTA CVS GGG TAT CTA AT; Takai and Horikoshi, 2000; Gantner et al., 2011) primer pairs were used. Sequences were deposited in the European Nucleotide Archive (ENA) under accession number PRJEB82958 (16S rRNA gene). Sequences were processed following a bioinformatics pipeline (USEARCH – Edgar, 2010; Cutadapt – Martin, 2011; mothur – Schloss et al., 2009) previously described by Dohrmann and Krüger (2023). Thereby, zero-radius operational taxonomic units (ZOTUs) are generated from operational taxonomic units using the UNOISE algorithm, which enables higher resolution, with the goal of reporting all correct biological sequences (Edgar, 2016). Potential methanotrophic ZOUTs were identified according to the pmoA database taxonomy (Yang et al., 2016) and known methanotrophic genera (Knief, 2015, 2019, and references therein). Relative abundances of a methanotrophic genera or families were calculated as the share of all methanotrophic genera or families in the respective sample pool.
2.9 Quantification of methane-oxidizing bacteria by pmoA-gene-targeted quantitative PCR
Using quantitative PCR (qPCR) assays to target both the general bacterial 16S rRNA gene and the pmoA gene encoding for the β subunit of the particulate methane monooxygenase expressed by methane-oxidizing bacteria (MOB), we were able to determine the methanotrophic abundances.
The qPCR targeting the 16S rRNA gene (primer pair 341F–805R; forward: 5′-GTGCCAGCMGCCGCGGTAA-3′; reverse: 5′-GGACTACHVGGGTWTCTAAT-3′) was performed as described previously (Hedrich et al., 2016). The pmoA-gene-targeting qPCR (primer pair 189F–mb661r; forward: 5′-GGNGACCGGGATTTCTGG-3′; reverse: 5′-CAGGMGCAACGTCYTTACC-3′; Costello and Lidstrom, 1999) was performed in a CFX Connect Real-Time PCR system (Bio-Rad, Hercules, CA) in a final volume of 10 µL, consisting of 5 µL 2× Luna Universal qPCR Master Mix (New England Biolabs GmbH, Frankfurt am Main, Germany), 0.7 µL of respective forward and reverse primers (10 µM), 0.5 µL of bovine serum albumin (1 %), 1.1 µL of nuclease-free water, and 2 µL of template DNA. The thermal profile consisted of an initial denaturation step at 95 °C for 5 min, 40 cycles of denaturation at 95 °C for 30 s, annealing at 62 °C for 30 s, elongation at 72 °C for 45 s, and an additional data acquisition step at 79 °C for 8 s, followed by final elongation at 72 °C for 5 min. The template DNA was used in 5× or 10× dilution and spiked with the standard to a concentration of 105 copies per microliter to correct for inhibition. Standards consisted of a dilution series (101–106 pmoA gene copies per microliter) of a PCR product flanking the pmoA gene of Methylomonas rhizoryzae GJ1 (Japan Collection of Microorganisms, JCM 33990) amplified with a designed primer pair (forward: 5′-GTACGCATACGCATGAACGC-3′; reverse: 5′-GTTTCCCGTGCGTTTGACTG-3′). The amplicon specificity was confirmed using a melt curve and agarose gel electrophoresis. Samples that did not show this specificity, i.e., Forest samples, were not considered to calculate pmoA abundances.
3.1 Methane emissions
In total, 64 of the 206 single measurement points from both the well and reference sites showed methane emissions to the atmosphere (Fig. 3, Table S2). However, only 32 fluxes were higher than 1 nmol CH4 m−2 s−1, and 31 of these were related to the Peat site. The highest absolute flux was 540 nmol CH4 m−2 s−1 at the Peat site (position 16, site R-WA 264), whereas the highest methane uptake was −4.4 nmol CH4 m−2 s−1 at the Forest site (position 14, site R-WA 273) (Table S2). Compared with the Meadow (∼ 14 %) and Forest (∼ 15 %) sites, the Peat site (∼ 58 %) also had the highest number of sample points with methane emission fluxes (Fig. 3).
The reference grid on the Peat site always (during three different measuring campaigns; Table S2) showed substantial methane emissions, ranging from 15 to 380 nmol CH4 m−2 s−1, but only along the northern and middle transect lines. The southern three points always represented a sink or the methane emissions were lower than 0.2 nmol CH4 m−2 s−1.
As a simple first approximation, we averaged all measuring points of the individual well and reference grids (mean and median; Table 2), with all of the sites in the Peat area showing net methane emissions. The Peat reference sites had the highest mean emissions (∼ 109 nmol m−2 s−1). However, this should not be directly compared to more sophisticated emission techniques, e.g., long-term eddy-covariance studies; rather, it should be used as a snapshot of our study site for internal comparison of wells/references and different grounds (Forest, Meadow, and Peat).
Mean and median values that are close to each other are typical of symmetrical distributions with minimal outliers. This holds for the data from the Forest and Meadow for both the well and reference sites (Table 2; Fig. 4a, d). The data from the Peat site show means that are much higher than medians, indicating positively skewed data, i.e., outliers on the high end (cf. histogram in Fig. 4g). However, as such outliers can control the methane emissions of an area, the mean is more suitable for an emission estimation. The difference between the median and mean indicate the huge variation in methane emissions at the Peat site, which is more visible in the box-and-whisker plots (Fig. 5). This is particularly evident at R-WA 264, with one grid point showing 560 nmol CH4 m−2 s−1 and only two additional points with 30 nmol CH4 m−2 s−1. The other 14 values are slightly positive but negligible or representing a sink. Thus, the median of this grid is negative, whereas the mean is positive (38 nmol CH4 m−2 s−1).
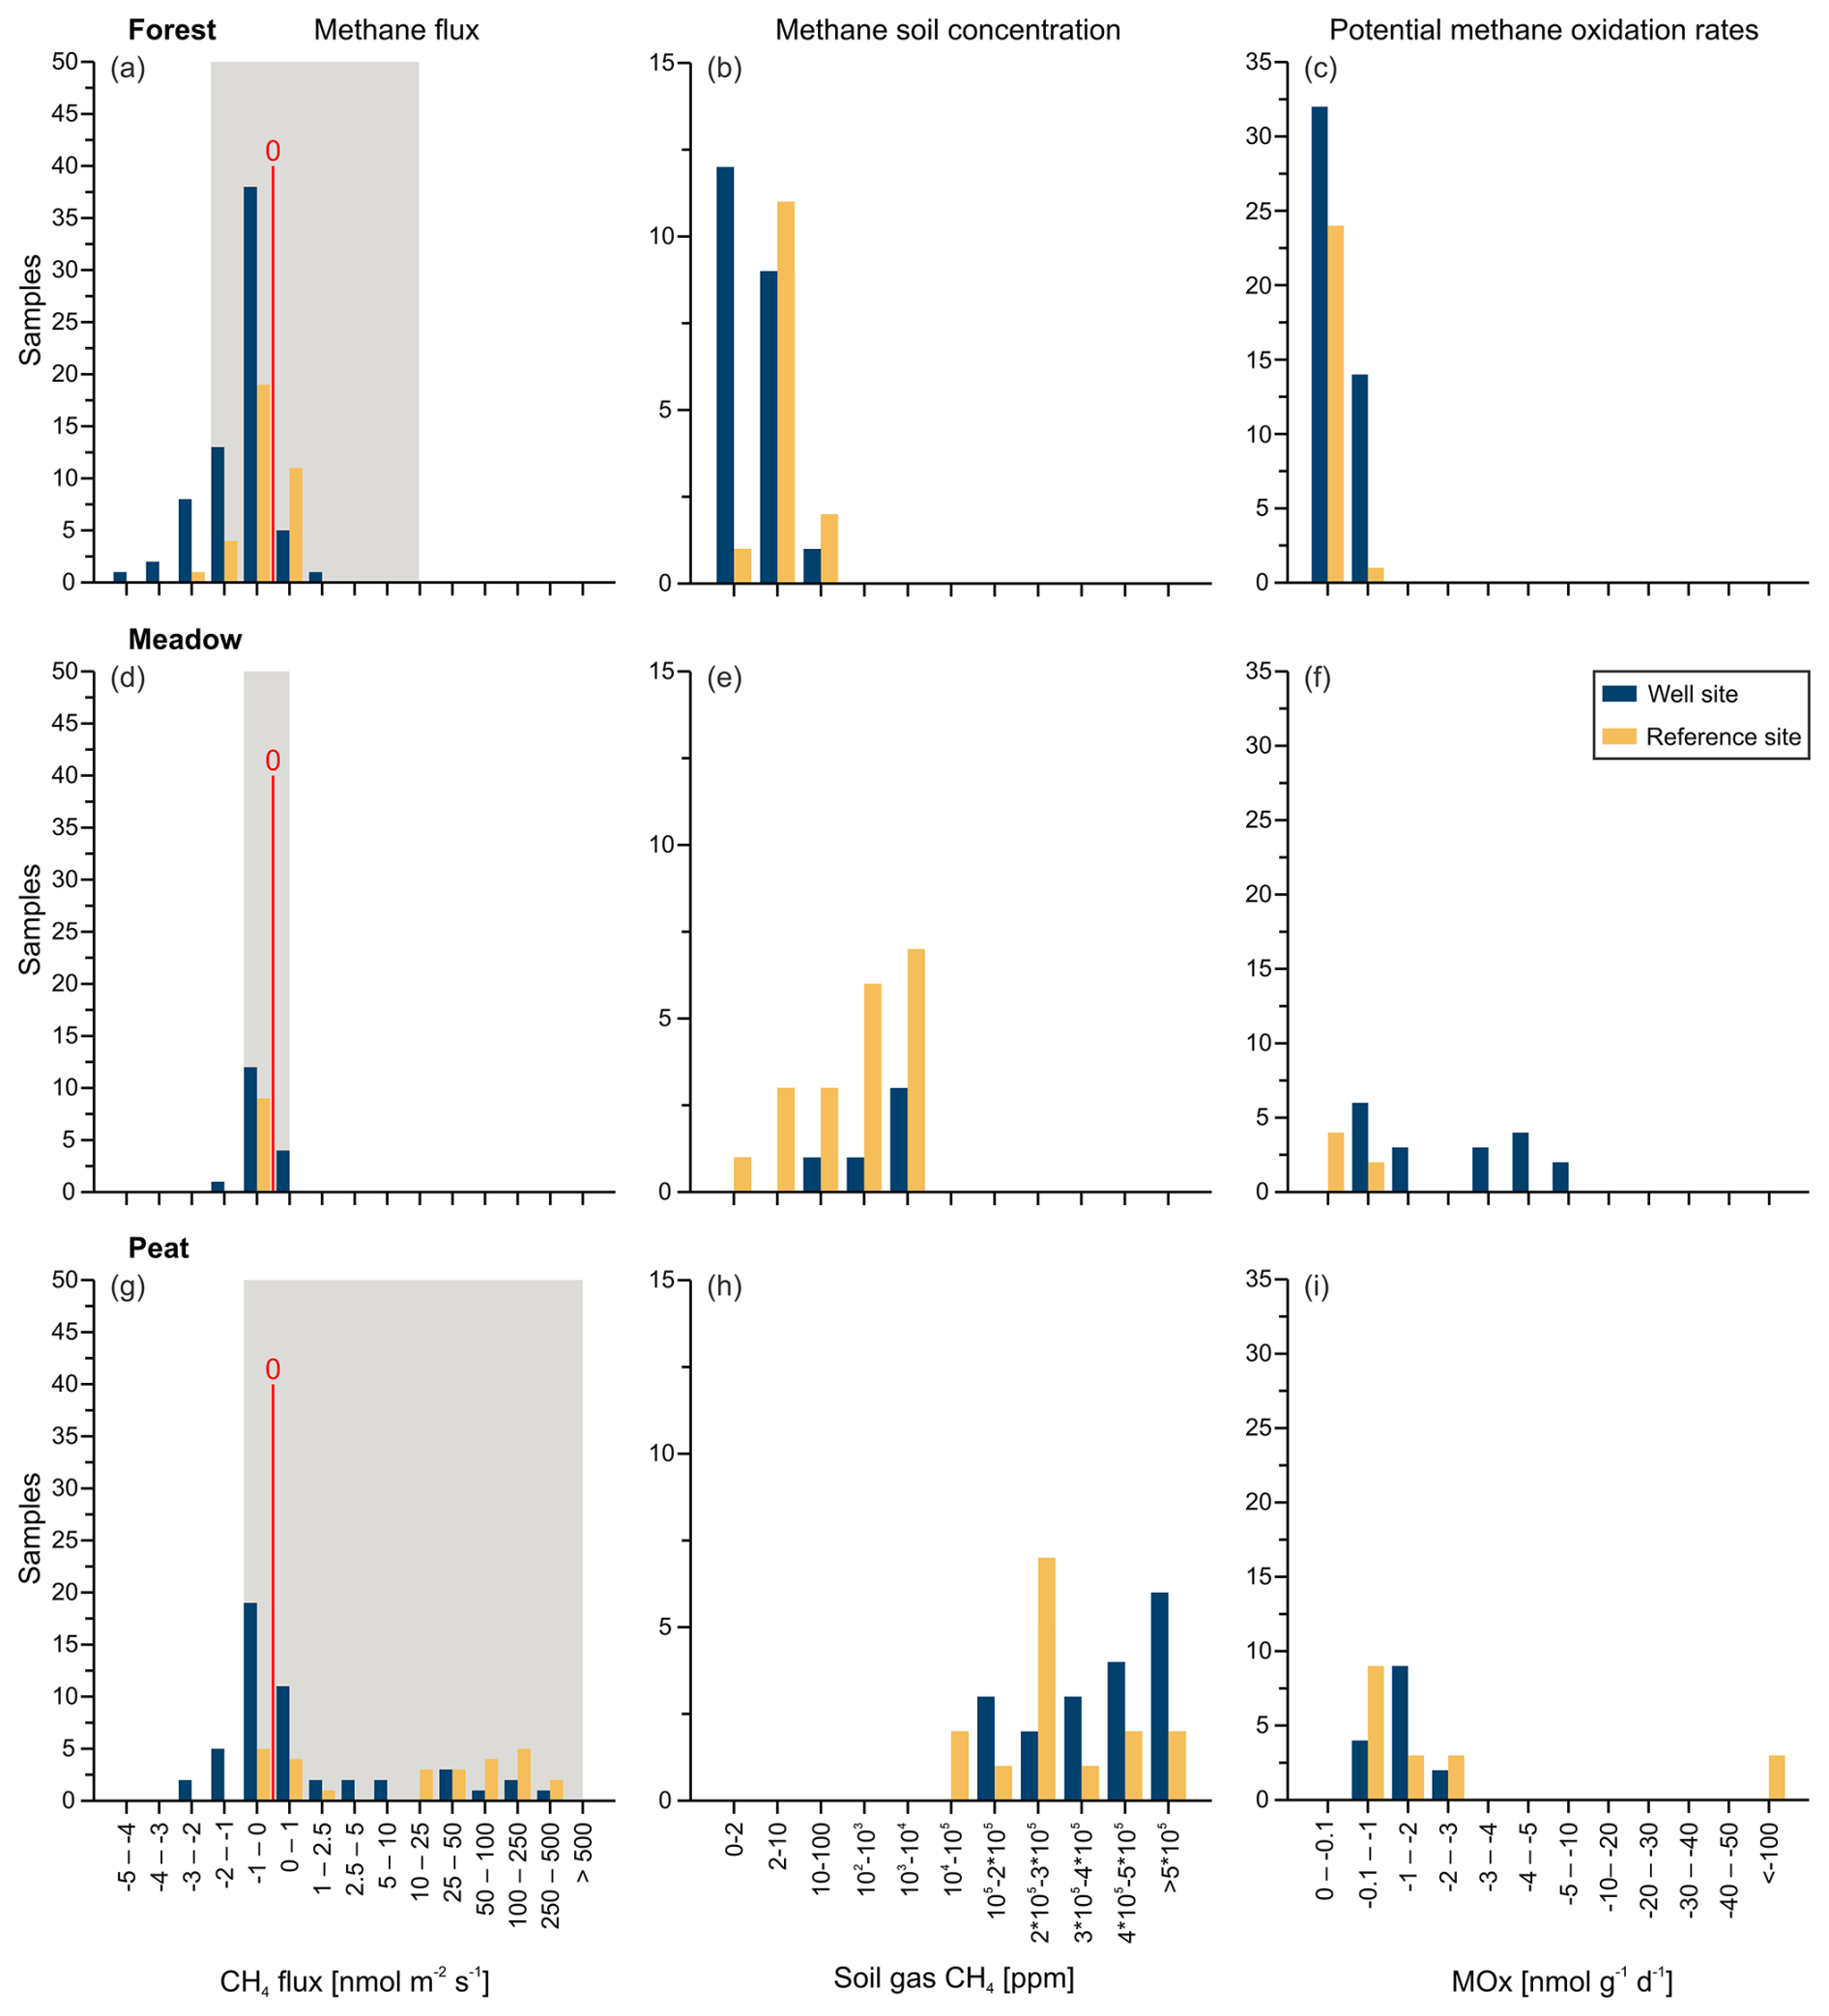
Figure 4Methane flux (a, d, g), soil gas methane concentration (b, e, h), and potential methane oxidation rates (MOx; c, f, i), depicted as histograms, for well (blue) and reference (orange) sites for the three study areas: the Forest site (a, b, c), the Meadow site (d, e, f), and the Peat extraction site (g, h, i). The red line in panels (a), (d), and (g) indicates zero flux; sites left of the line acted as net methane sinks, whereas those on the right of the line acted as net methane sources. The gray background represents natural ranges mentioned in the literature (Abdalla et al., 2016; Oertel et al., 2016).
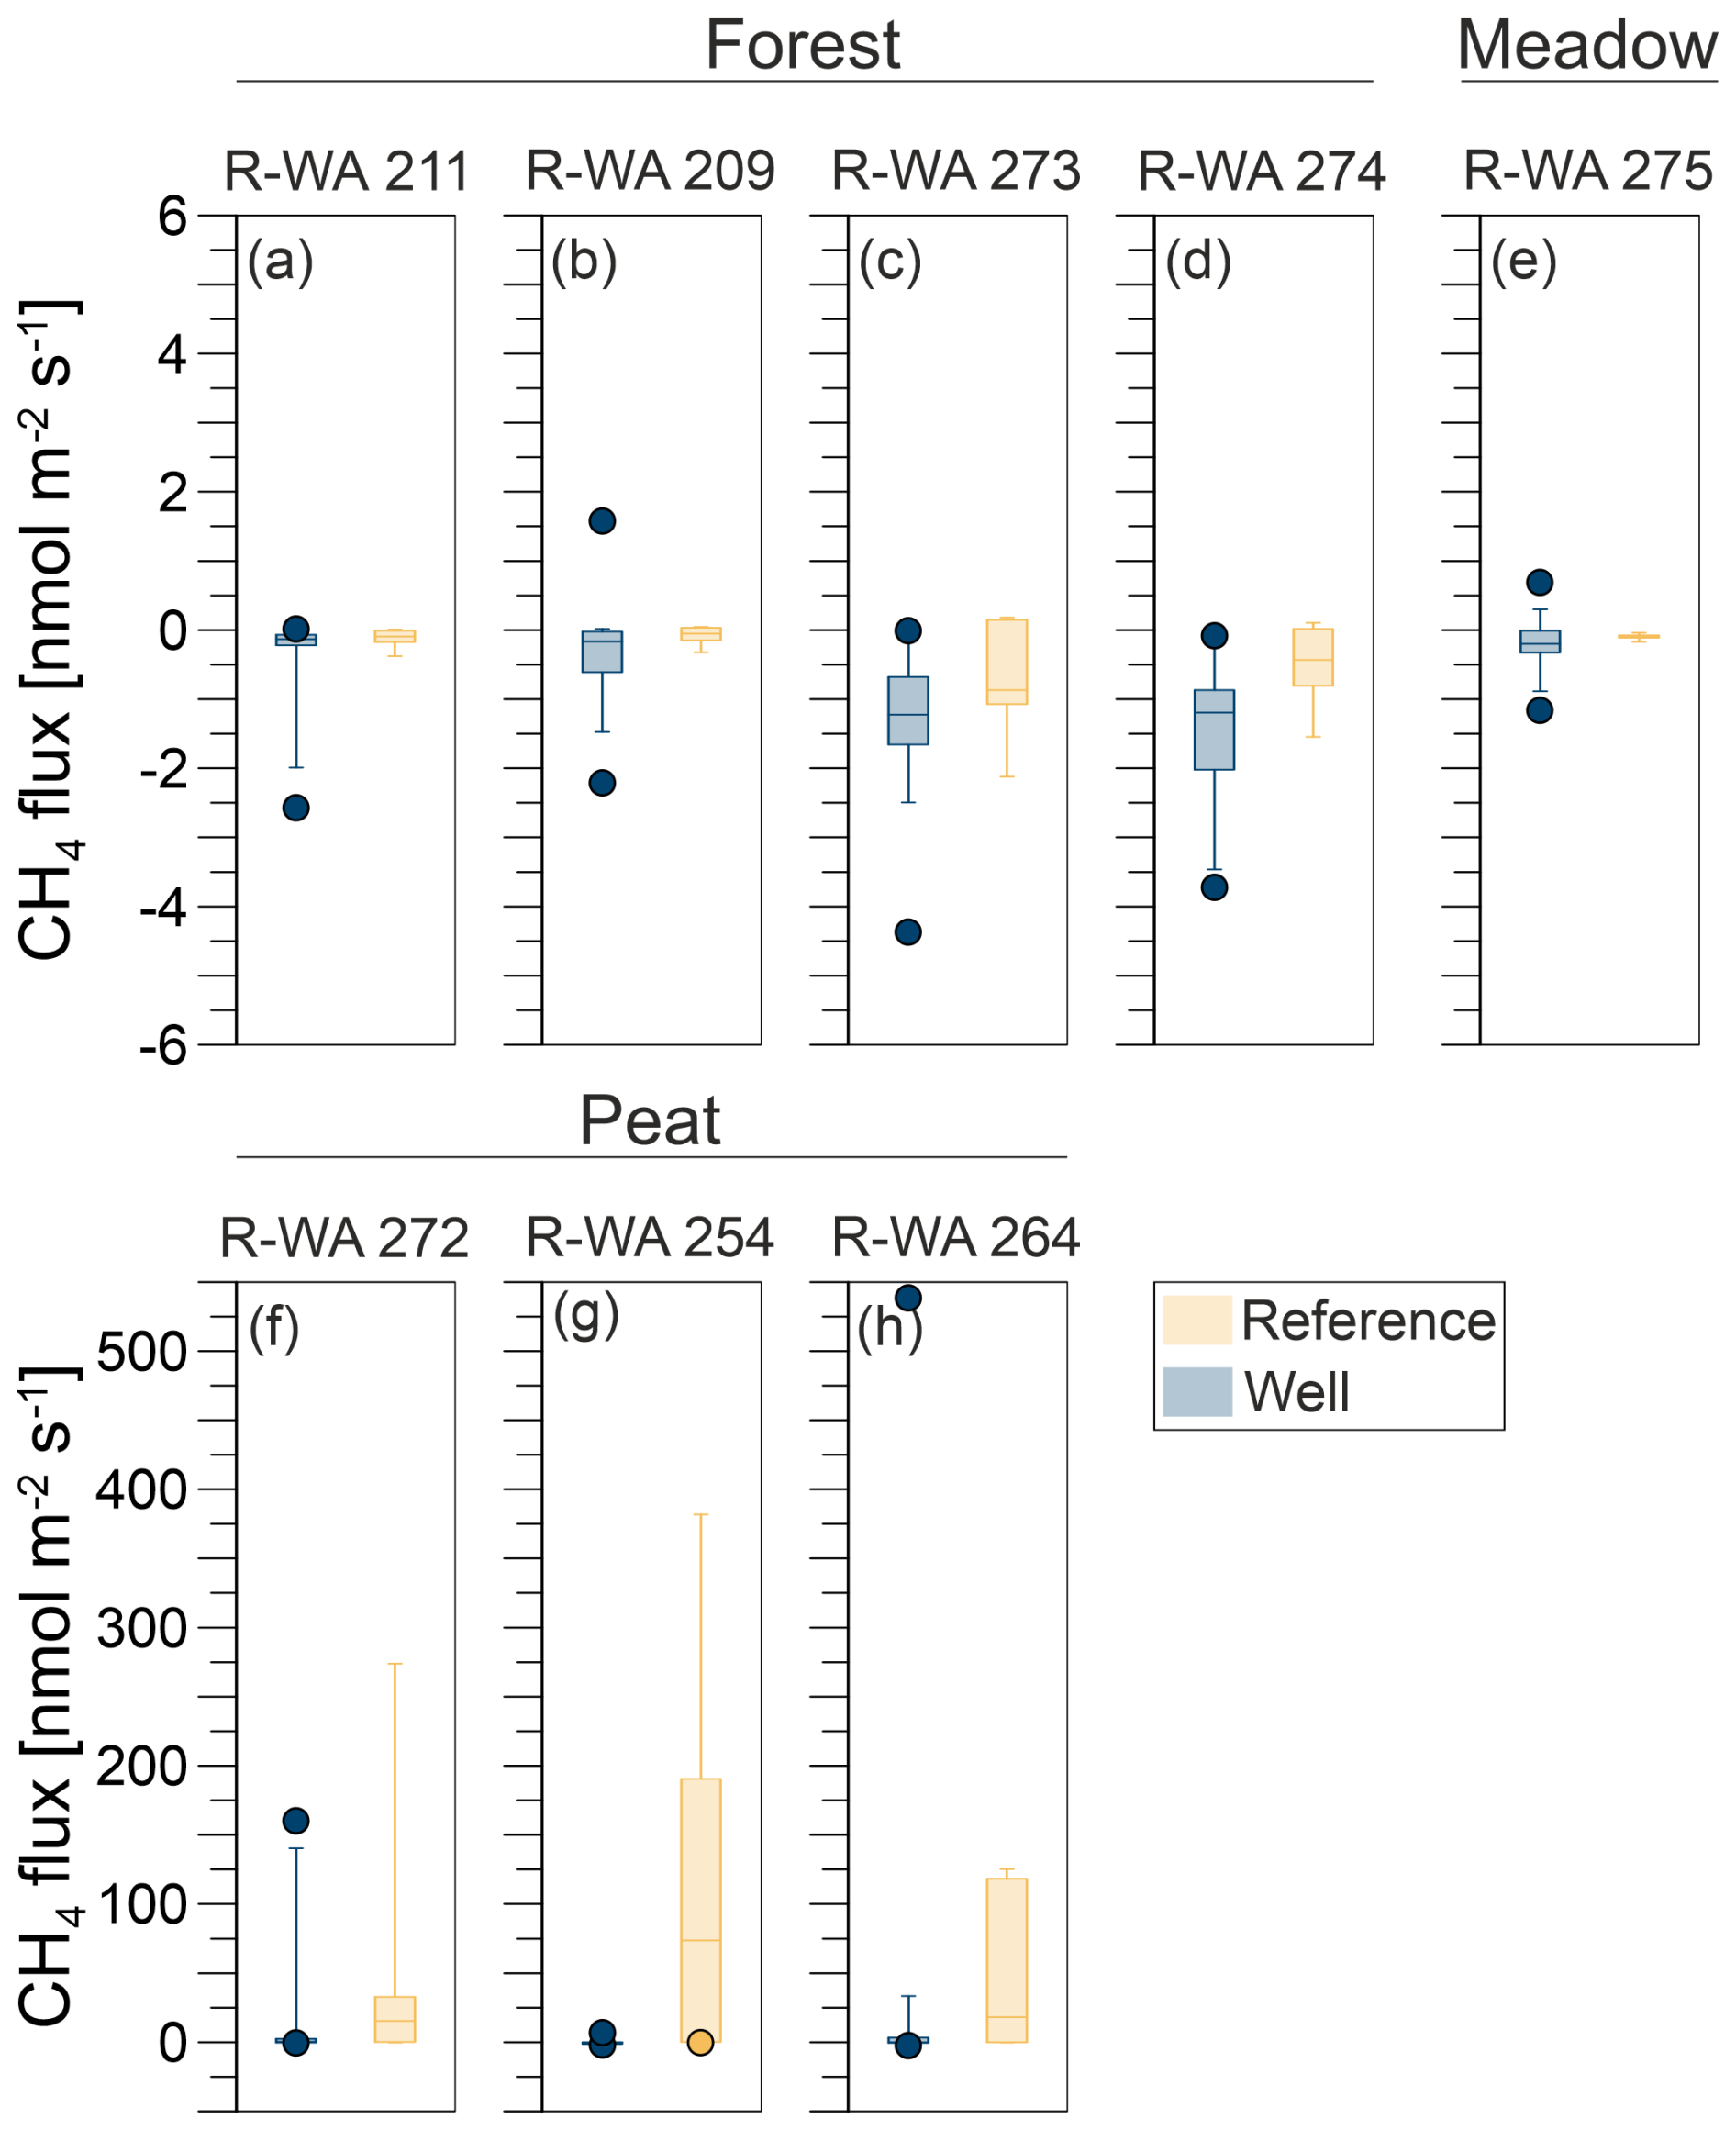
Figure 5Box-and-whisker plots (including outliers) of methane emissions from well (blue) and reference (orange) sites: Forest (a, b, c, d), Meadow (e), and Peat (f, g, h). The underlying statistical parameters are listed in Table S9.
As methane emissions did not show apparent differences between well and reference sites, we first used the Kruskal–Wallis test to test for a normal distribution, which the methane fluxes did not show. The Mann–Whitney U test was then used to compare well and reference site data. For R-WA 211, R-WA 209, R-WA 273, R-WA 264, R-WA 272, and R-WA 275, well and reference sites were similar with regard to methane fluxes using this test. R-WA 274 and R-WA 254 showed significant differences in fluxes between well and reference sites. The R-WA 254 reference site showed higher methane emissions than the well site. In the case of R-WA 274, both sites were net methane sinks; however, the methane uptake of the well site was higher. The box-and-whisker plots (Fig. 5, Table S9) depict this graphically. Specifically, the huge differences between the Peat site and the other sites is apparent.
In summary, all three well sampling grids, for which we observed overall methane emissions based on the mean values of 17 grid points covering an area of 900 m2 around the well, were located in the Peat area. At wells R-WA 254 and R-WA 264, highly localized methane emissions with high flux rates occurred. These singular grid points with high methane emissions are not spatially correlated with the well location. Moreover, averaged methane emissions (both mean and median) were even consistently higher at the Peat reference site compared with well sites in the Peat area (Table 2). All four Forest wells were a stronger sink than the corresponding reference sites on the day of measurement. The Forest site acted as a higher methane sink than the Meadow site.
In addition to these sampling grids, we sampled a transect through a point with high methane emissions (Fig. 6). The resulting methane fluxes varied more than 2 orders of magnitude over the distance of less than 1 m, whereas CO2 emissions showed fewer changes and varied only by a factor of ∼ 2 in total.
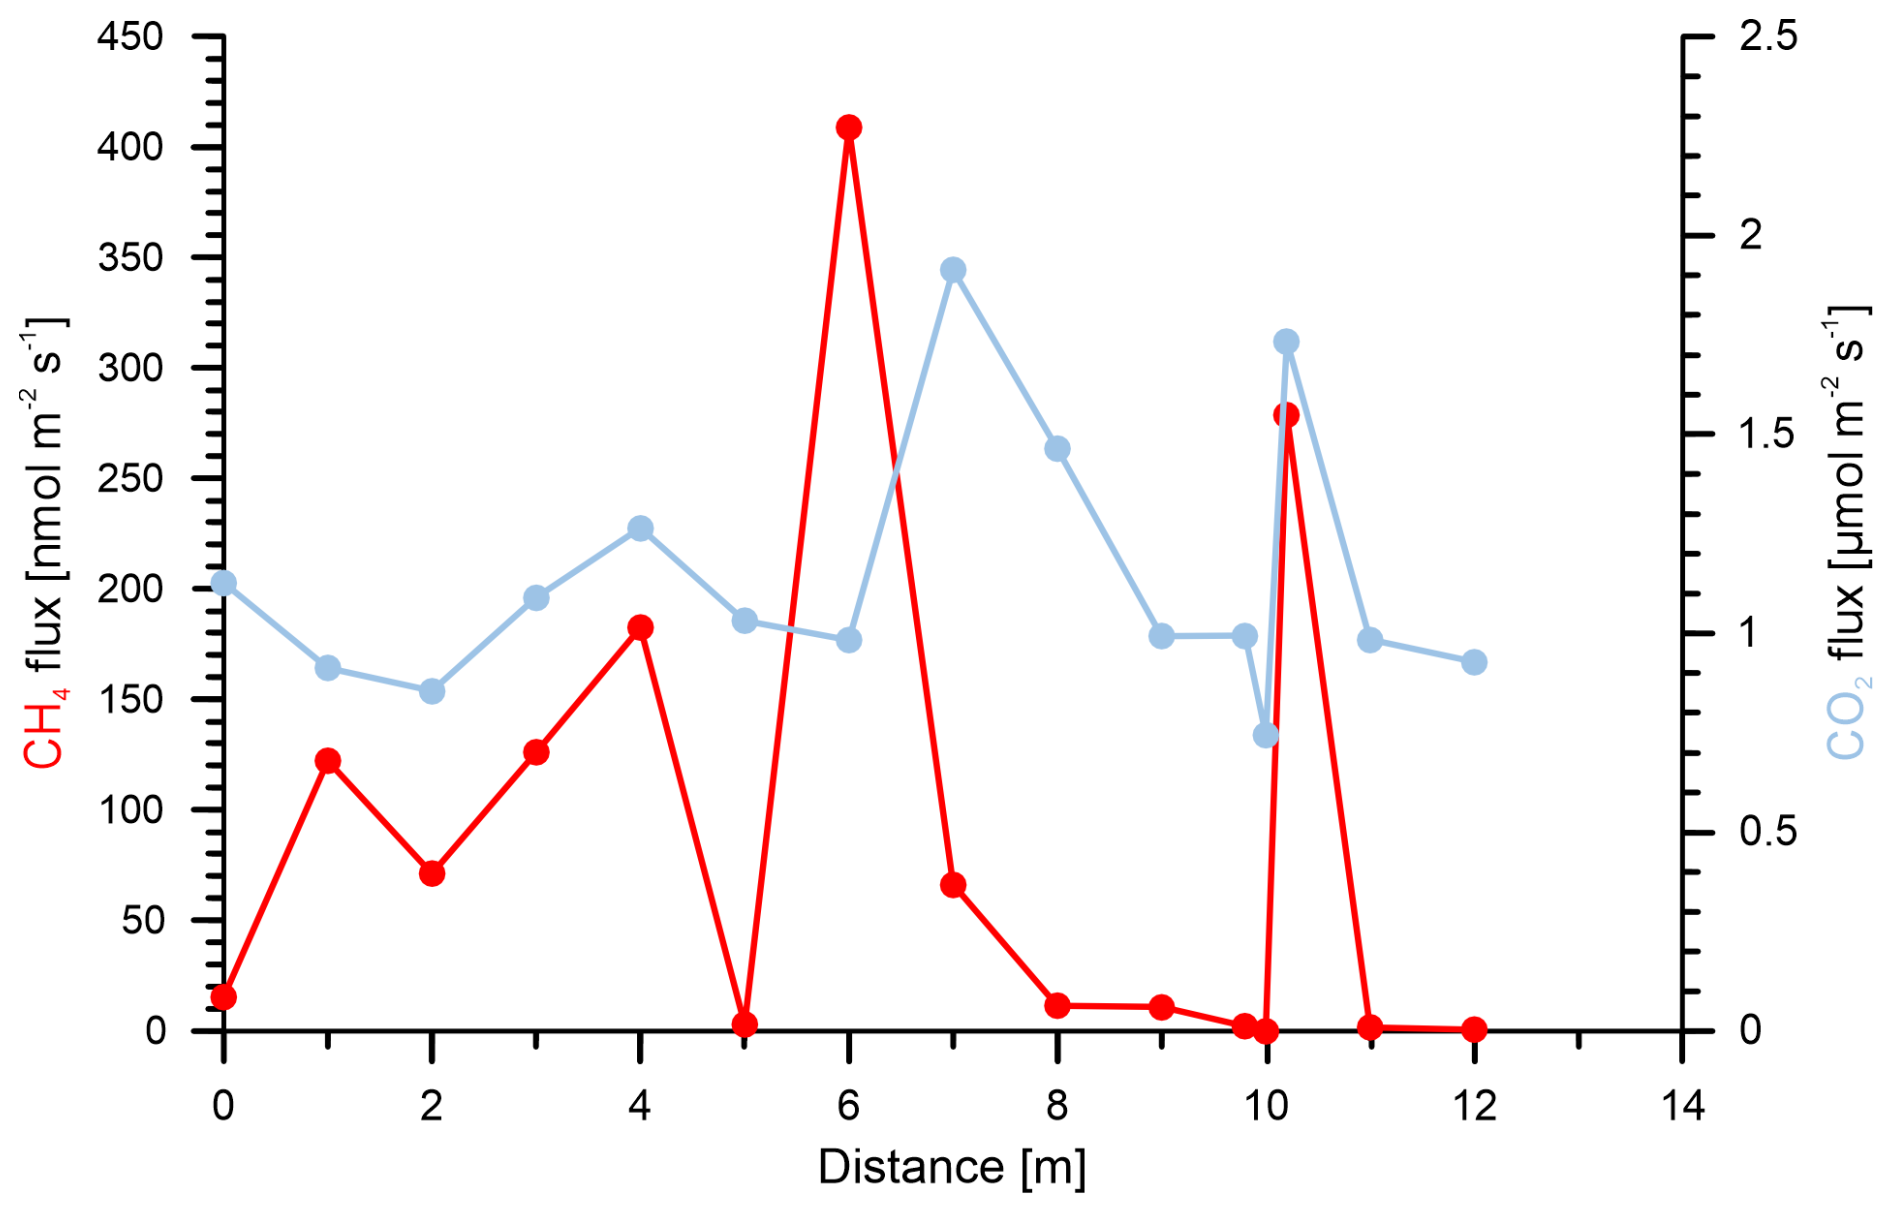
Figure 6Methane (red) and CO2 (blue) fluxes on a meter scale over a 12 m transect at the Peat reference site. The fluxes were measured over the course of 3 h. Data are listed in Table S3.
3.2 Soil gas geochemistry
Soil gas samples were taken from up to 95 cm depth and analyzed in the laboratory with respect to the gas composition, including gaseous hydrocarbons (C1–C6) and the carbon and hydrogen isotopic composition (if concentrations were sufficient). The depth of the soil gas sampling differed and was limited by the depth of the groundwater table at the time of sampling. Generally, the sampling depth was closely above the groundwater table and is, thus, an indirect measure of the deepest interval of the vadose zone at the time of sampling. The soil methane concentrations between the sampled areas were clearly distinct, with Forest soils showing the lowest methane concentrations compared with Meadow and Peat (extraction site) soil gases (Figs. 4b, e, h; 7b). The majority of methane concentrations at the Forest site were around or below atmospheric concentrations (Table S1); however, two respective samples had elevated methane concentrations of ∼ 93 and ∼ 64 ppm. These Forest site areas did not emit substantial amounts of methane (Table 2). The overall mean for samples from Forest soil was ∼ 7.5 ppm methane (Table S1), whereas the corresponding median was ∼ 2.1 ppm. Soil methane concentrations in samples from the nearby Meadow site started at ∼ 1.8 ppm and reached up to 9200 ppm. The corresponding mean methane concentration was ∼ 1960 ppm, while the median was ∼ 710 ppm. Soil gas samples from the Peat extraction site showed both the highest overall concentration – with nearly 65% methane (∼ 645 000 ppm) – and the highest mean and median concentrations – with values of ∼ 315 000 ppm (mean) and 282 000 ppm (median), respectively. The general differences in the soil gas composition between the three sampling areas also becomes clear from the plot of the O2, CH4, CO2, and N2 concentrations with depth (Fig. 7a–d).

Figure 7Depth profiles of O2 (a), CH4 (b), CO2 (c), and N2 (d) soil gas concentrations as well as δ13C-CH4 (e) and δ13C-CO2 (f) values for the Forest (brown diamonds), Meadow (light-green squares), and Peat (dark-gray circles) sites. Atmospheric values are depicted using blue lines. Note the logarithmic scales in panels (a), (b), and (c). The isotopic composition of methane (e) and carbon dioxide (f) is depicted relative to the Vienna Pee Dee Belemnite (VPDB) standard.
We also analyzed the δ13C-CO2, δ13C-CH4, and δ2H-CH4 for most soil gas samples (Table S1). However, methane concentrations in the Forest soil were too low to determine δ2H-CH4. As for δ13C-CO2, the isotopic compositions of the Forest and Meadow soil gases were similar, with both ranging between −21.7 ‰ and −24.9 ‰ (Fig. 7). Soil gases from the Peat site, on the contrary, were much more 13C-enriched, with δ13C values of up to −1.8 ‰ and a mean of ∼ −11.6 ‰. Thus, while δ13C-CO2 in the soil gas was relatively uniform for the Forest and Meadow area and typical of common soil gas, variations at the Peat extraction sites were high, which is indicative of different controls on soil CO2 in this latter area (Fig. 7f). The δ13C-CH4 signatures differed between all three areas, with the methane in the Meadow soil being most 13C-depleted, with a mean δ13C value of −86.6 ‰. The δ13C value in the Forest soil was −57.4 ‰, whereas the corresponding value in Peat soil was −63.8 ‰ (Fig. 7e). The mean hydrogen isotopic composition of methane differed strongly between the Meadow and Peat soil gases, with δ2H-CH4 values of −270 ‰ and −320 ‰, respectively (Table S1). All isotope data from the reference and well sites were not systematically different from each other.
3.3 Methane oxidation rates
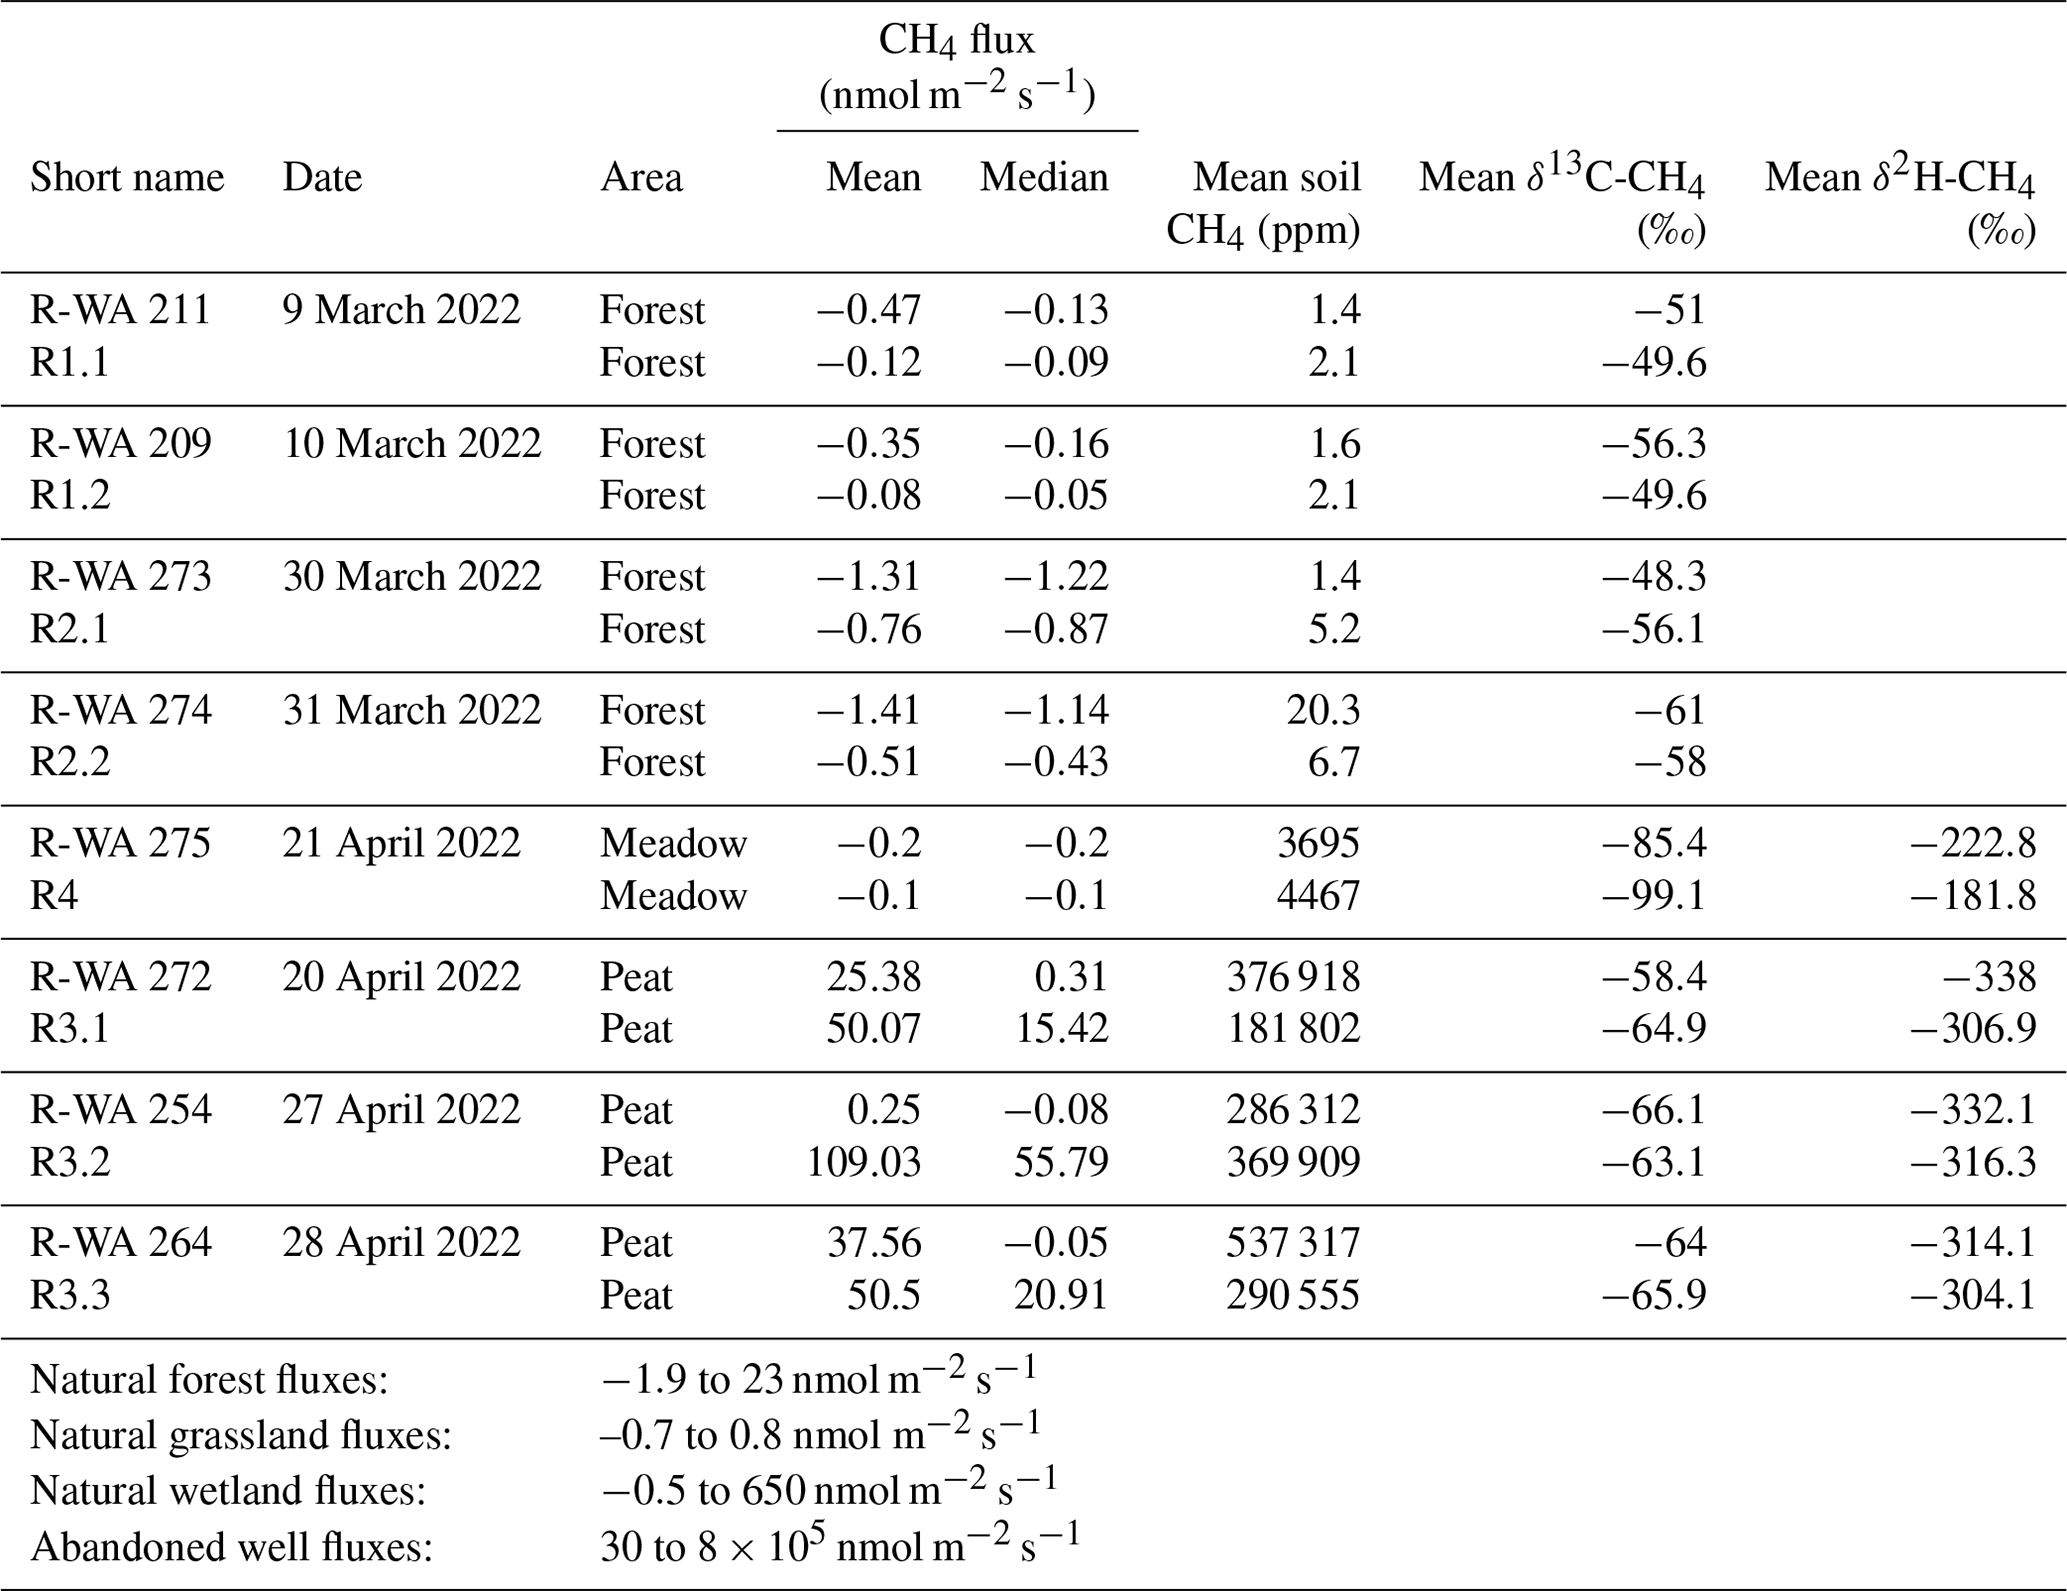
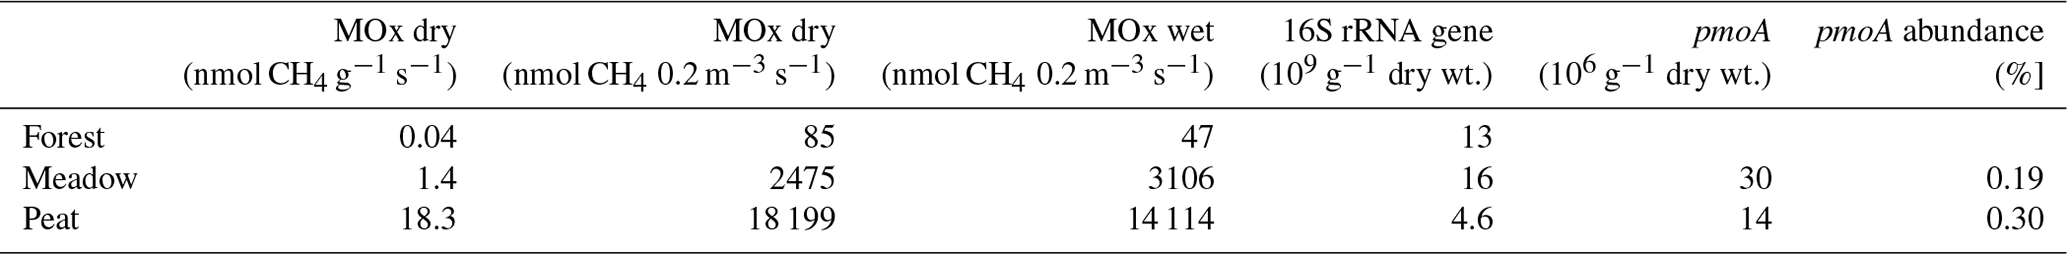
Methane oxidation rates were determined to investigate the soils' potential to mitigate methane emissions. In total, 27 positions were sampled at up to two depths, resulting in 46 methane oxidation rates. Mean methane oxidation rates per gram of dry soil (Table 3) were found to be lowest for Forest soils (∼ 0.04 nmol g−1 s−1), highest for soils from the Peat site (∼ 18.3 nmol g−1 s−1), and intermediate for Meadow soils. To get an estimate of actual oxidation rates in the soil column, we calculated the potential methane oxidation rates for a wet soil volume of 1 m × 1 m × 0.2 m (Tables 3, S4). These rates followed the same pattern as the dry methane oxidation rates and methane soil concentrations, and they were highest in the industrial Peat area.
Table 3Mean areal methane oxidation rates (MOx) for the Forest, Meadow, and Peat sites calculated per gram of dry soil and for dry and wet soil with a 1 m2 volume and 0.2 m height (0.2 m3) as well as mean 16S-RNA gene and pmoA abundance per gram of dry soil. pmoA abundance was calculated relative to 16S rRNA gene abundances.
For a selected experiment on the methane turnover in the Peat area, the carbon isotopic fractionation of methane during aerobic methane oxidation was determined in the laboratory (see Sect. S3). Using a calculation from Feisthauer et al. (2011), this resulted in an epsilon (ε) of −31.3 ‰ (Sect. S3).
3.4 MOB abundance and identification
We determined MOB abundances by targeting both the general 16S rRNA gene and the methanotrophic-bacteria-specific pmoA gene using qPCR (Table 3). The Peat site had (with ∼ 4.6 × 10⁹ copies per gram of dry weight) about 3 times fewer 16S RNA gene copies than the other two sites (with 1.3 × 10¹⁰ (Forest) and 1.6 × 10¹⁰ (Meadow) copies per gram of dry weight). The pmoA gene abundances were similar at the Meadow and Peat site, with 3.0 × 10⁷ and 1.4 × 10⁷ copies per gram of dry weight, respectively. The relative abundance of the pmoA gene was highest at the Peat site (∼ 0.30 %), reaching up to 0.89 %, followed by the Meadow site (0.19 %). However, there were huge differences between the samples in each area (Table S5).
We used DNA-based microbial analyses to identify changes in the bacterial community over depth and identify potential methanotrophic key players. Bacterial 16S rRNA gene sequencing revealed between ∼ 1.5 × 10⁴ and ∼ 1.35 × 10⁵ sequences per sample, with a median of ∼ 8.5 × 10⁴ sequences and a mean library coverage (C) of >98.5 % (data not shown). In total, ∼ 22 × 104 ZOTUs were determined. A comparison, at the genus level, with published taxa known to contain the pmo operon sequences resulted in up to 151 potential methanotrophic ZOTUs, which were grouped into 15 methanotrophic genera and 5 families (Table S6). The most abundant putative methanotrophic family in amplicon libraries was Methylacidiphilaceae, with 71 uncultured ZOTUs, followed by Beijerinckiaceae. The most abundant genera were Methylocystis and the uncultured cluster SH765B-TzT-35 from the Methylomirabilaceae family (hereafter referred to as SH765B-TzT-35). In the following, we group the ZOTUs belonging to the same genera together in order to simplify the dataset and make the changes between the areas more visible.
Most reads that were affiliated with reads of known methanotrophic taxa were found at the Peat site, whereas the Forest and Meadow sites had about half as many reads. In Forest samples, most such reads were found in the top layer. On the contrary, they increased in number with depth for the Meadow site until a depth of 8–13 cm, increased with depth for the Peat site until a depth of 15–20 cm, and decreased slightly in both of the aforementioned areas at deeper depths (Table S6). The top layer at Forest and Meadow sites was, with respect to methanotrophic taxa, dominated by an uncultured Methylacidiphilaceae genus, the relative contribution (with respect to all reads) of which decreased with depth (Fig. 8). However, a member of the genus Methylocystis dominated the Peat site. Its relative abundance first increased to a depth of 20 cm and then abruptly declined at a depth of more than 40 cm. In samples taken from 40 cm or below, SH765B-TzT-35 dominated the methanotrophic community (Fig. 8).
In addition to bacterial 16S RNA gene sequencing, we used archaeal primers to identify methanogenic key players. Sequencing resulted in ∼ 9.3 × 10³ and ∼ 1.2 × 10⁵ reads per sample with a coverage of > 99.9 % (data not shown). Overall, 798 ZOTUs were identified, and a comparison with known methanogenic genera revealed 132 potential methanogenic ZOTUs (Table S7). These could be grouped into 11 genera and 9 families (Fig. 8). The most abundant genus was Methanosarcina, followed by Methanoregula (which was almost exclusively present in Peat samples) and Methanosaeta. Together with Methanobacterium, they accounted for 96 % of the methanogenic reads over all samples.
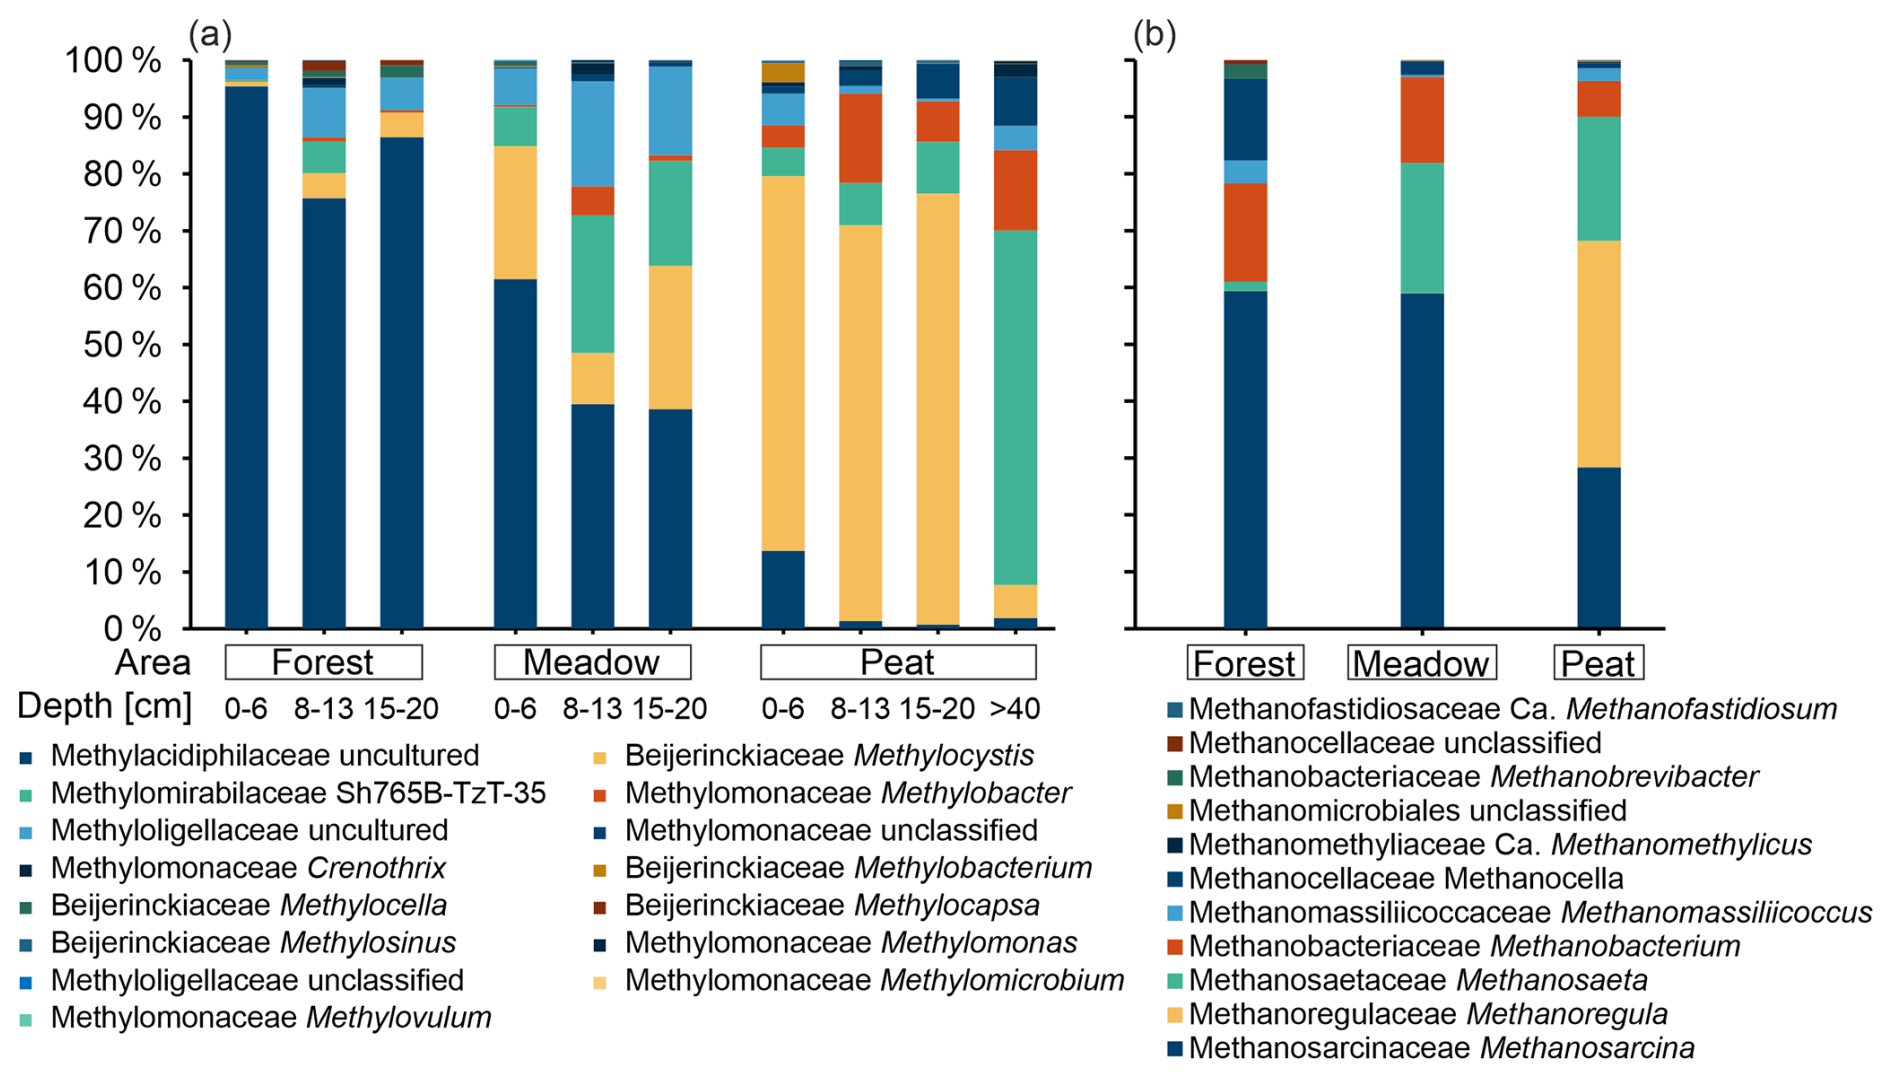
Figure 8(a) Relative abundance of potential methanotrophic genera estimated at three depth intervals at the Forest and Meadow sites and at four depth intervals at the Peat site. (b) Potential methanogenic genera detected at the three areas (Forest, Meadow, and Peat) depicted as the relative abundance. Reads are displayed in relation to the sum of all reads associated with methanotrophic (a) or methanogenic (b) taxa in the respective sample pool (well and reference sites combined).
4.1 Sources of methane in soil and emitted gases
We evaluated methane emissions in the described complex, organic-matter-rich setting by combining the methane fluxes and soil gas geochemistry. Although these emissions were detected at both the well and the reference sites, it was unclear whether they originated from a leaking well or from methanogenesis. Thus, we determined the isotopic composition of methane (δ13C-CH4 and δ2H-CH4) to distinguish between thermogenic (in our case, oil-associated) and biogenic sources of the methane emissions (Schoell, 1980; Whiticar, 1999; Milkov and Etiope, 2018). Thermogenic gases, which are produced during the maturation of organic material and occur in natural gases and oil-associated gases, are characterized by relatively high δ13C values (> −50 ‰). In combination with the δ2H values of the methane, thermogenic origins can be well recognized in δ13C–δ2H diagrams (Fig. 9a). Furthermore, we included measurements of the same parameters at reference sites to determine the natural methane-related biogeochemical background. This approach (see below) helps to get information on whether well integrity issues (the migration of biogenic methane along the well) are present (e.g., Vielstädte et al., 2015, 2017) or natural biogenic methane sources and processes in the upper soil are responsible for the methane fluxes.
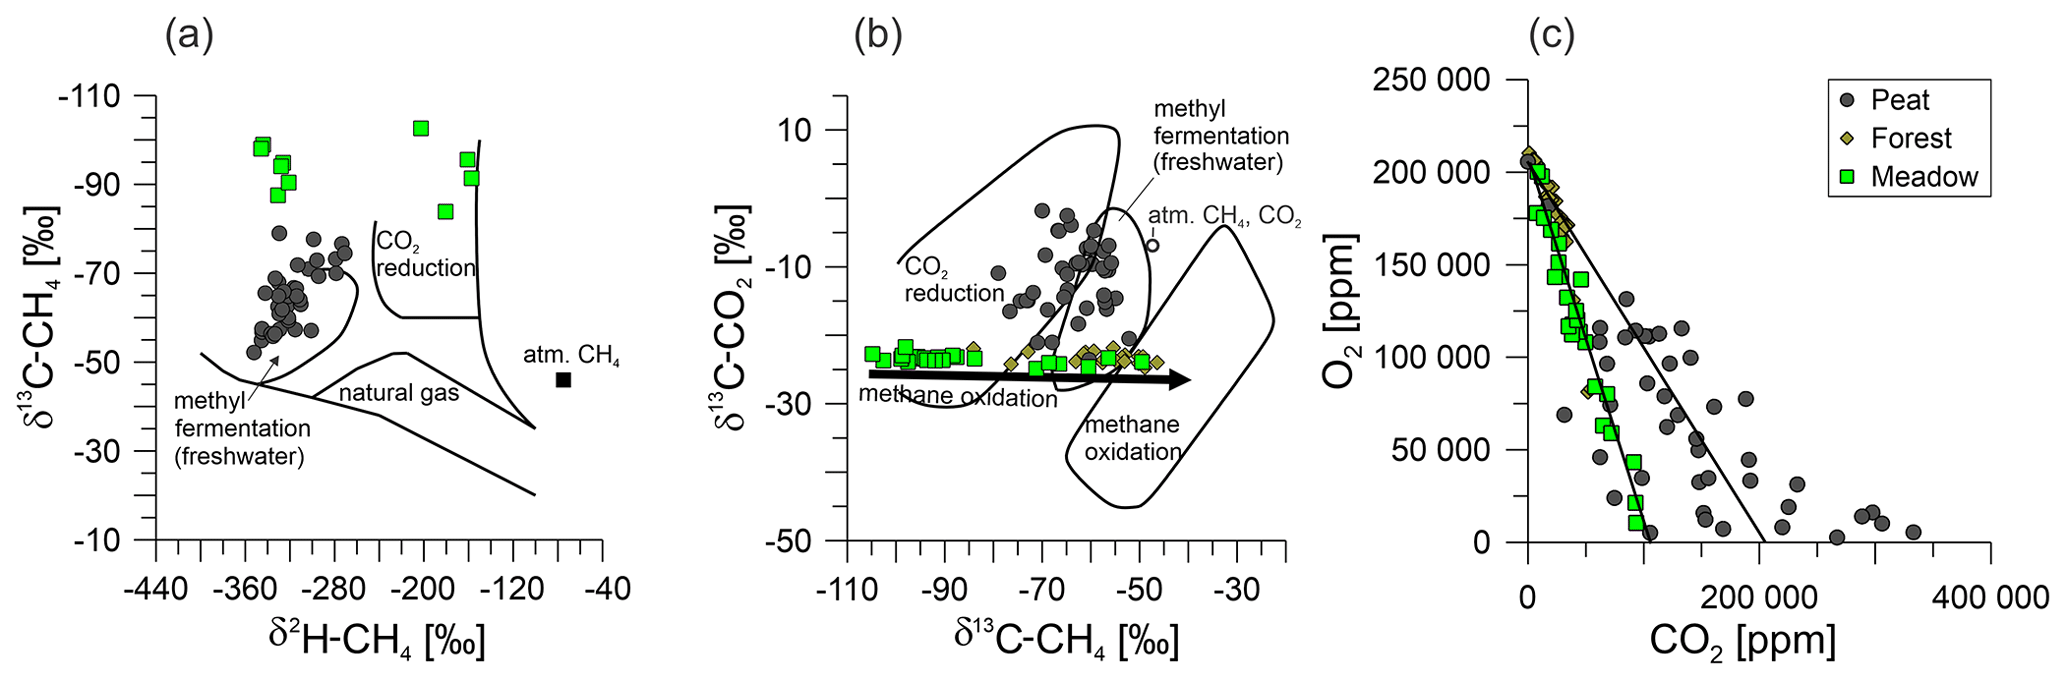
Figure 9Cross-plots of soil gases for the Peat (dark-gray circles), Forest (brown diamonds), and Meadow (light-green squares) sites, namely, the isotopic composition of (a) methane with regard to stable isotopes of carbon and hydrogen; (b) methane and carbon dioxide, to characterize the methane sources; and (c) oxygen and carbon dioxide. The lines in panel (c) represent the consumption of oxygen via methane oxidation (left) and that via normal soil respiration (right). The isotopic composition in panels (a) and (b) is after Whiticar (1999). Panel (c) presents a comparison of oxygen and carbon dioxide after Romanak et al. (2012).
Using our emission measurements, we could identify three well sites and their respective reference measurements with net methane emissions (Fig. 5, Table 2), all of which were located at the Peat site. The first indication that the methane emissions were not related to an oil well was that the single Peat reference site (measured on 3 different days) emitted more methane than the corresponding well sites (Table 2). Furthermore, all peat soil gases contained >5 % methane, with a median of ∼ 35 %, and there was no recognizable trend between sites (Table S1). However, none of the methane samples from Steimbke showed an isotopic signature typical of thermogenic methane. Together, this excludes the leakage of relevant amounts of natural gases from the oil reservoir to the atmosphere or upper soils in Steimbke. Finally, supporting this conclusion, oil-associated gases and natural gas contain substantial amounts of ethane and other higher hydrocarbons, which were only found in trace amounts in the analyzed gases (Table S1). Both gases (ethane and propane) can be produced in such trace amounts as byproduct during methanogenesis and are typically associated with high amounts of biogenic methane (Schloemer et al., 2018; Oremland et al., 1988). Methane concentrations were not sufficient for δ2H analyses in all gas samples; thus, the following does not necessarily hold for low-concentration samples. However, our δ13C–δ2H data indicate that the biogenic methane in Steimbke was formed through methanogenesis using acetate (methyl fermentation; acetoclastic fermentation) or CO2 reduction (Fig. 9b).
Another previously proposed test for well leakage focused on the soil gas composition (Romanak et al., 2017, 2014). Romanak et al. (2017, 2014) argue that the oxygen and carbon dioxide concentrations in soil gases, driven by normal microbial respiration, should sum to around 21 %. A CO2 excess would hint at an additional CO2 source (Romanak et al., 2012). Therefore, they suggest that methane from a leaking well (which is oxidized to CO2) or (in their investigated case) directly leaking CO2 from a carbon capture and storage site could be such a source. We observed such enhanced CO2 concentrations in the Peat soil gases (Fig. 9c). In contrast, Forest measurements and the majority of the Meadow followed an oxygen-to-CO2 conversion ratio of either 1 : 1 (respiration) or 2 : 1, with the latter corresponding to the stoichiometry of aerobic methane oxidation (Romanak et al., 2012, and references therein). The Peat soil gas compositions spread between both processes and conversions. However, about half of the samples were enriched in CO2 (up to 33 %). From our point of view, the drastically increased CO2 levels in Peat soil gases could be best explained by an extensive degradation of peat by hydrolysis and fermentation to acetate and fatty acids. Those compounds are hereby subsequently converted to methane and CO2 by acetoclastic methanogenesis, with the possible contributions of the methanogenic conversion of H2 and CO2 to methane (e.g., Conrad, 2020). This is supported by the Peat's high methane and CO2 concentrations (Fig. 9c). This methane is than oxidized by MOB to CO2, which further complicates the soil gas interpretation.
While our approach cannot exclude well integrity problems in general, our data argue against methane leakage into the upper soil and/or atmosphere from the reservoir for the eight wells studied in the Steimbke-Nord oil field. Furthermore, the high methane emissions at both well and reference sites argue against the migration of shallow biogenic methane along the wells (methane concentrations were not higher in the well grid than in the reference grid samples). A comparison with other reported fluxes underlines that the fluxes determined here (Fig. 4) are in the range of natural methane emissions (−2 to 600 nmol m−2 s−1; Abdalla et al., 2016) and at the lower end of emission rates from abandoned wells (∼ 30 nmol s−1 to 800 µmol s−1; Cahill et al., 2023; Williams et al., 2021). Overall, we join previous studies in a call for better surveillance of abandoned wells past abandonment (Cahill et al., 2023; Riddick et al., 2020), more standardization, and a comprehensive approach for assessing fugitive gas migration in the field (Samano et al., 2022). Moreover, we propose such an approach here. Furthermore, we used these data to look into the apparent differences in methane cycling between the three sites, which will be discussed in the following.
4.2 Natural methane cycling at the study sites
In the three surveyed peat-rich vegetation types in Steimbke, differences in soil gas methane concentrations were more pronounced than those in methane emissions. These emissions, however, showed high spatial variation and tended to change from source to sink between two measuring points (and, thus, over short distances) and eventually over time. Therefore, we conducted a second sampling campaign at the Peat extraction reference site with flux measurements only 1 m or less apart to better understand variations on a smaller scale than the one usually chosen in our study (10 m × 10 m). Using this new approach, we observed a high spatial heterogeneity in the methane emissions (Fig. 6), in agreement with other soil studies (Davidson et al., 2002; Savage et al., 2014; Ambus and Christensen, 1995; Le Mer and Roger, 2001).
Distinct controls for both spatial and longer-term temporal variability could not be resolved in our study, but they could be explained by changes in soil compaction (Flechard et al., 2007); differences in moisture content (Basiliko et al., 2007); fluctuating macropores (Schwen et al., 2015); and differing flora (Jentzsch et al., 2024), microforms (Welpelo et al., 2024), and fauna (Lubbers et al., 2013). Furthermore, precipitation and air pressure variations (i.e., barometric pumping; Forde et al., 2019b) between two consecutive measurements could also have affected emission patterns and rates (Blagodatsky and Smith, 2012). To address short-term temporal variation, we use the measurements from reference sites in the Peat area. These sites were visited three times (Fig. 3): first on 20 April 2022 and then 1 week later on 2 consecutive days (27 and 28 April 2022). The overall flux pattern at the reference site changed from one week to another (Fig. S5a, b, c), and fluxes at the same position sometimes differed greatly. The fluxes at one point on 2 consecutive days differed less (Table S2), and the overall pattern remained similar. In contrast, the soil methane concentration did not vary as much over time as the respective methane fluxes (Table S1). Compared with methane, CO2 fluxes at the same positions were much more stable and did not show time-dependent variation (Table S2). These temporal data and the whole dataset underline the importance of individual reference measurements and highlight that single measurement points are not sufficient to properly evaluate background emissions.
In natural environments, biogenic methane emissions are the result of the net balance between production and consumption, and the biotic regulation of emissions can occur on the methanogenic and methanotrophic sides. Regarding methane production, previous studies have discussed the following possible factors to control methanogenesis in peatlands: (1) availability of acetate due to acetate-producing bacteria outcompeting CO2-reducing methanogens (Kotsyurbenko, 2005); (2) phenolic compound concentrations, which might limit peat degradation (Freeman et al., 2001); and (3) temperature (Brauer et al., 2006). We assume that one or more of these controls are also responsible for the presumably different predominating methanogenic pathways indicated by the microbial community analyses and the isotopic compositions of methane in our studied Peat and Meadow areas. At all sites, both acetoclastic and hydrogenotrophic methanogens were present (Fig. 8). The genetic analyses suggest a higher methanogenic potential at the Peat site, as there were relatively more methanogenic reads and a higher diversity of methanogens found (Fig. 8, Table S7). The acetoclastic methanogenic genera were predominantly Methanosarcina and Methanosaeta, whereas the Methanoregula and Methanobacterium genera, which were also observed, are hydrogenotrophic methanogens (Conrad, 2020). Soil temperatures were similar at the point of sampling (∼ 10 °C), which supported the growth of both acetoclastic and hydrogenotrophic methanogens. Our isotopic data, shown in Fig. 9a and b, underline differences between the sites and suggest that methane was produced via different methanogenic pathways. The methane at the Peat site seems to be mostly derived from acetate; in contrast, CO2 reduction is likely the main methanogenic pathway at the Meadow site. This is underlined by the higher mean δ13C-CO2 in Peat soil gases (−12 ‰) compared with soil gases from the Meadow and Forest sites (−23.5 ‰). The higher mean δ13C-CO2 values in Peat soil gases indicate that substantial amounts of CO2 in these soil gases have resulted from fractionating acetoclastic methanogenesis, increasing the pool of relatively 13C-enriched CO2 (Corbett et al., 2012). Methane concentrations in the Forest soils were insufficient for δ2H-CH4 measurements. However, the δ13C-CO2 and δ13C-CH4 data suggest that CO2 reduction represents the primary methanogenic pathway, with a pronounced isotopic alteration observed in samples with low methane concentrations due to methane oxidation. One explanation for the site-dependent difference in the predominant methanogenic pathway could be the differences in peat degradation progression due to the removal of vegetation for peat extraction. The drainage of peatlands is known to lead to the decomposition of peat and results in substantial carbon loss (Couwenberg, 2011). This may, in part, also explain the higher methane emissions from the active peat extraction site (Peat site), as the drainage of the investigated area began decades ago. However, the peat extraction at this site only started recently (2017–2018). Thus, we expect that the decomposition of deeper peat layers and the remaining peat intensified after the start of the extraction. Furthermore, about 1 m of peat had already been mined from the area used for extraction. This extraction led to a lowering of the terrain surface (compared with the surroundings) and, consequently, to a relatively higher water table, which is one of the main factors for higher methane emissions (Abdalla et al., 2016), as it limits the penetration of oxygen into the deeper layers, which is necessary for methane-oxidizing bacteria (Basiliko et al., 2007). However, for our gas geochemical study and related sampling strategy, a respective in-depth understanding of the drivers of the individual methane-formation pathways was beyond the scope of our work. Thus, we will focus on the microbial methane filter in the following.
The observed relatively low potential methane oxidation rates at the Forest site could have resulted from high-affinity methanotrophs, which are specialized to low methane concentrations in well-aerated soils (Bengtson et al., 2009; Kolb, 2009). The very high rates at the Peat site, in contrast, are an indication of low-affinity methanotrophs, which require higher methane concentrations (>100 ppm; Whiticar, 2020, and references therein). In combination with these differences in potential methane oxidation rates, our phylogenic data suggest that members of the Methylacidiphilaceae family correspond to high-affinity methane oxidation, whereas Methylocystis, Methylobacter, and SH765B-TzT-35 predominate at higher methane concentrations. Kaupper et al. (2021), who compared pristine and restored peatlands, previously observed a similar shift from Methylacidiphilaceae to Methylocystis between pristine and restored settings. Thus, the microbial community at our studied Forest site (with peat underneath), which consisted mainly of Methylacidiphilaceae, was more similar to that of a pristine peatland than the communities in the other vegetation-type settings. In contrast, the community of the active peat extraction site, which was dominated by Methylocystis, showed higher similarity to the restored site in Kaupper et al. (2021). This indicates that the composition of the methanotrophic community changes starting with peat drainage, but it remains active throughout the peat extraction process. Our phylogeny analysis was supported by phospholipid-derived fatty-acid (PLFA) analyses of selected samples from the Peat site (Supplement, Sect. S2), which indicate that the species Methylocystis heyeri, a Type II α-Proteobacteria, was likely involved in methane oxidation at these sites (Fig. S2). We also found these PLFAs in incubation samples and observed a significant increase after methane addition.
It is especially interesting that we detected sequences of the genus SH765B-TzT-35, which belongs to the family Methylomirabilaceae, in deeper and probably anoxic peat layers. Other members of this family are known to oxidize methane under anaerobic conditions by internal oxygen production from nitrite reduction to dinitrogen (Ettwig et al., 2010; Versantvoort et al., 2018). Although this internal oxygen production has not yet been demonstrated for species of SH765B-TzT-35, a previous study showed their ability to anaerobically oxidize methane (Nakamura, 2019), which hints at the same or at least similar mechanisms for this genus in the studied Peat site.
The discussed methanotrophic community resulted in the highest methane oxidation rates in samples with elevated soil methane concentrations (>4000 ppm), which is in concordance with previous studies (Basiliko et al., 2007; Moore and Dalva, 1997). It was recently shown that, in addition to substrate availability (here, the methane concentration), the methanotrophic community can be influenced by physicochemical parameters and land use (Kaupper et al., 2022, and references therein). Kaupper et al. (2022) showed that the environmental parameters, the total C and N content, and the electrical conductivity (indicative of salinity) affected the active bacterial community. This suggests that the methanotrophic communities can adapt to different methane regimes and, as speculation, could mitigate an occurring potential methane leak from an underlying abandoned well over time. Converting our values for mean methane emissions to enable the comparison with data from the literature, we observed an emission rate of ∼ 23 g m−2 yr−1 for the Peat site. In our case, these numbers are without emissions from ditches, which Sundh et al. (2000) showed can be substantial. An in-depth study on the influence of vegetation on methane emissions, conducted by Welpelo et al. (2024) at a rewetted peat site about 3 km northwest of our study area, estimated yearly emissions of between 7.1 and 36.1 g m−2 yr−1. As our field campaign was conducted in April 2022, and we observed comparable methane emissions to their combination of measurement and modeling for the same season, our estimation seems plausible, although the Peat area's groundwater table was comparably lower. The emissions at the Peat extraction site (our study) were about 2-fold (Strack et al., 2016) to more than 100-fold (Wilson et al., 2016) higher than those from pristine peat sites and about 10-fold higher than those from a restored peatland (Strack et al., 2014). The carbon dioxide emissions (Table S2) from the Peat site were similar to another unrestored peat extraction site (Strack et al., 2014). In addition, it is possible that the progressed peat extraction provided a different type and quality of organic precursor substrate compared with the Forest and Meadow sites, as suggested from and observed at other peat sites (Alstad and Whiticar, 2011). Our data suggest that active peat extraction sites can be significant methane sources and that these areas do not necessarily emit less methane than rewetted ones, as stated in the literature (Welpelo et al., 2024; Bieniada and Strack, 2021; Rankin et al., 2018; Abdalla et al., 2016).
4.3 Extent of natural microbial mitigation of potential subsurface leakage
Our data suggest that relying solely on methane emission measurements to detect well leakage can be associated with the risk of missing integrity-compromised wells, which is in line with another study on buried abandoned wells in the Netherlands (Schout et al., 2019). In our case, at some measuring points, soil methane concentrations reached ∼ 45 % of biogenic methane at 20 cm depth, e.g., position 2 at site R-WA 264, but the soils still acted as a methane sink at the surface (−1.2 nmol m−2 s−1; Tables S1, S2). This is probably due to the high methane oxidation potential in these soils owing to the presence of a large population of methanotrophs (Fig. 8, Table S6), which has also be reported previously (Kolb and Horn, 2012; Ho et al., 2019; Guerrero-Cruz et al., 2021).
The extent to which natural microbial oxidation capacities for methane could degrade upward-migrating methane in the soil in the event of a broken gas or oil well remains unclear. This will most likely be less efficient at the beginning of a leak, but it might rapidly increase due to the adaptation of the respective microbial communities in the affected soil layers. However, such processes could be highly relevant for Germany, as roughly 15 % of abandoned wells in Germany are located in areas with highly organic-matter-rich soils such as peat (mostly in northern Germany). These areas most likely already contain a microbial community preadapted due to the naturally elevated methane concentrations. In a recent study, Schout et al. (2019) observed such a situation, as they were unable to detect any methane emissions into the atmosphere above a leaking borehole, but they could show high methane fluxes after removing the top 2 m of the soil and, thus, the microbial methane filter. This is also in line with a study by Cahill et al. (2023), who found that 5 out of 10 surveyed wells (9 unconventional) in Canada were leaking fugitive methane; however, only two wells showed direct methane emissions (up to 3×10³ nmol m−2 s−1), whereas the others were emitting elevated levels of CO2 (up to 15 µmol m−2 s−1). These CO2 fluxes were interpreted as resulting from enhanced bacterial methane oxidation mitigating the fugitive methane release from leaking abandoned wells by natural soils (here, with a lower organic carbon content) and lowering the total greenhouse gas emissions substantially. However, in addition to indirect indications such as δ13C-CO2 values (Cahill et al., 2023), our study demonstrated that it is advantageous to also determine methane oxidation rates. Here, we measured high methane oxidation capacities of (wet) peat samples in our lab of up to ∼ 14 000 nmol CH4 0.2 m−3 s−1 (0.8 g 0.2 m−3 h−1; Table 3). To put this into perspective, methane leakage rates from plugged wells in two regions in Canada ranged between 0.04 and 1 g CH4 per well per hour (Bowman et al., 2023), whereas those from unconventional plugged wells were up to ∼ 0.2 g per well per hour (Cahill et al., 2023). Further research is required to examine the activity and precise functioning of this microbial filter, with particular attention paid to the influence of seasonality (e.g., temperature).
While it is well known that abandoned oil and gas wells can have integrity issues, specific knowledge on the ∼ 25 000 cut and buried wells in Germany is lacking. Here, we provide (using our multi-methodological approach) the first data for Germany on potential methane fluxes from abandoned oil wells to the atmosphere. We combined (positive and negative) emission data from wells and reference areas with the gas geochemical characterization of soil gas samples to investigate eight wells in a peat-rich setting with three different land use types (Forest, Meadow, and Peat extraction).
The Peat extraction site was the only one that emitted substantial amounts of methane. However, in general, no differences were observed in the surface methane emission rates between the well and reference sites, independent of site characteristics (active peat mining or drained peat vegetated with birch trees or grassland). With respect to soil gases, the three areas showed highly variable but spatially correlated (i.e., area-specific) methane concentrations concurring with CO2 concentrations. The in-depth gas and isotope geochemical analysis revealed biogenic methane as source of the net emissions at the open Peat site (methyl fermentation) and the Meadow (CO2 reduction pathway with partial methane oxidation). These findings and the absence of higher hydrocarbons exclude thermogenic gas emissions from the plugged wells. Overall, we conclude that there is no connection between the methane emissions detected and the abandoned wells investigated. Furthermore, the factors discussed above suggest that the level of disturbance can be considered to be the major driving force for the methane emissions shown here. Thus, anthropogenic influences play a key role in methane formation and emission in such altered ecosystems.
Furthermore, the laboratory methane oxidation rates derived from our incubated peat samples demonstrated the capacity to counterbalance reported leakage rates for buried abandoned wells in other regions. The activity of such a microbial methane filter poses the risk of false-negative leakage classification. Overall, the observed methanotrophy could be highly relevant for Germany, as 15 % of the country's cut and buried wells are located in areas with very organic-matter-rich soils. However, for a comprehensive evaluation of the abandoned wells in Germany, further investigations are needed. Therefore, additional sampling at different sites (oil/gas wells with different ages and deconstruction histories) in northern Germany using the methodology introduced here are currently under way, and we will evaluate the natural mitigation potential for different soil types and land uses.
In conclusion, the exclusive use of emission-based approaches is not suited for integrity failure assessments of buried wells, as these techniques are susceptible to misinterpretation. We highly recommend a holistic approach for surveillance that includes the determination of methane emissions, the soil gas composition, and isotopic signatures at and in the vicinity of well sites against the background of a carefully selected reference site.
Measured and derived data supporting the findings of this study are available in the Supplement.
The supplement related to this article is available online at https://doi.org/10.5194/bg-22-809-2025-supplement.
MB, StS, SFAJ, and MK conceived and designed the experiments. SFAJ, StS, MB, and MK conducted the fieldwork and performed the experiments. SFAJ and TH performed the qPCR and processed the data. Main data interpretation was performed by SFAJ, in cooperation with all co-authors. SFAJ wrote the main manuscript text with input from MB, StS, MK, TH, and MAH. All authors read and approved the final version of the manuscript.
The contact author has declared that none of the authors has any competing interests.
Publisher's note: Copernicus Publications remains neutral with regard to jurisdictional claims made in the text, published maps, institutional affiliations, or any other geographical representation in this paper. While Copernicus Publications makes every effort to include appropriate place names, the final responsibility lies with the authors.
The authors wish to thank Daniela Zoch, Daniela Graskamp, Thilo Falkenberg, Laurin Rösler, Lukas Heine, Nicole Becker, Alana Zimmer, Georg Scheeder, Dietmar Laszinski, and Christian Seeger for their help in the field and laboratory. Furthermore, we are grateful to Christian Ostertag-Henning, for fruitful scientific discussions, and the local peat extraction company, for repeated access to the study site.
This research has been supported by BGR internal funding (project no. A-0202019.A) and the Deutsche Forschungsgemeinschaft (grant no. HO 6234/1-2).
This paper was edited by Frank Hagedorn and reviewed by Aaron Cahill and one anonymous referee.
Abdalla, M., Hastings, A., Truu, J., Espenberg, M., Mander, U., and Smith, P.: Emissions of methane from northern peatlands: a review of management impacts and implications for future management options, Ecol. Evol., 6, 7080–7102, https://doi.org/10.1002/ece3.2469, 2016.
Agerton, M., Narra, S., Snyder, B., and Upton, G. B.: Financial liabilities and environmental implications of unplugged wells for the Gulf of Mexico and coastal waters, Nat. Energ., 8, 536–547, https://doi.org/10.1038/s41560-023-01248-1, 2023.
Alstad, K. P. and Whiticar, M. J.: Carbon and hydrogen isotope ratio characterization of methane dynamics for Fluxnet Peatland Ecosystems, Org. Geochem., 42, 548–558, https://doi.org/10.1016/j.orggeochem.2011.03.004, 2011.
Ambus, P. and Christensen, S.: Spatial and Seasonal Nitrous Oxide and Methane Fluxes in Danish Forest-, Grassland-, and Agroecosystems, J. Environ. Qual., 24, 993–1001, https://doi.org/10.2134/jeq1995.00472425002400050031x, 1995.
Basiliko, N., Blodau, C., Roehm, C., Bengtson, P., and Moore, T. R.: Regulation of Decomposition and Methane Dynamics across Natural, Commercially Mined, and Restored Northern Peatlands, Ecosystems, 10, 1148–1165, https://doi.org/10.1007/s10021-007-9083-2, 2007.
Bengtson, P., Basiliko, N., Dumont, M. G., Hills, M., Murrell, J. C., Roy, R., and Grayston, S. J.: Links between methanotroph community composition and CH4 oxidation in a pine forest soil, FEMS Microbiol. Ecol., 70, 356–366, https://doi.org/10.1111/j.1574-6941.2009.00751.x, 2009.
Bieniada, A. and Strack, M.: Steady and ebullitive methane fluxes from active, restored and unrestored horticultural peatlands, Ecol. Eng., 169, https://doi.org/10.1016/j.ecoleng.2021.106324, 2021.
Blagodatsky, S. and Smith, P.: Soil physics meets soil biology: Towards better mechanistic prediction of greenhouse gas emissions from soil, Soil Biol. Biochem., 47, 78–92, https://doi.org/10.1016/j.soilbio.2011.12.015, 2012.
Boutot, J., Peltz, A. S., McVay, R., and Kang, M.: Documented Orphaned Oil and Gas Wells Across the United States, Environ. Sci. Technol., 56, 14228–14236, https://doi.org/10.1021/acs.est.2c03268, 2022.
Bowman, L. V., El Hachem, K., and Kang, M.: Methane Emissions from Abandoned Oil and Gas Wells in Alberta and Saskatchewan, Canada: The Role of Surface Casing Vent Flows, Environ. Sci. Technol., 57, 19594–19601, https://doi.org/10.1021/acs.est.3c06946, 2023.
Brauer, S. L., Cadillo-Quiroz, H., Yashiro, E., Yavitt, J. B., and Zinder, S. H.: Isolation of a novel acidiphilic methanogen from an acidic peat bog, Nature, 442, 192–194, https://doi.org/10.1038/nature04810, 2006.
Cahill, A. G. and Samano, P. S. G.: Prioritizing stewardship of decommissioned onshore oil and gas wells in the United Kingdom based on risk factors associated with potential long-term integrity, Int. J. Greenh. Gas Con., 114, 103560, https://doi.org/10.1016/j.ijggc.2021.103560, 2022.
Cahill, A. G., Joukar, M., Sefat, M., and van Geloven, C.: Evaluating Methane Emissions From Decommissioned Unconventional Petroleum Wells in British Columbia, Canada, Geophys. Res. Lett., 50, e2023GL106496, https://doi.org/10.1029/2023gl106496, 2023.
Caporaso, J. G., Lauber, C. L., Walters, W. A., Berg-Lyons, D., Lozupone, C. A., Turnbaugh, P. J., Fierer, N., and Knight, R.: Global patterns of 16S rRNA diversity at a depth of millions of sequences per sample, P. Natl. Acad. Sci. USA, 108, 4516–4522, https://doi.org/10.1073/pnas.1000080107, 2011.
Cleary, J., Roulet, N. T., and Moore, T. R.: Greenhouse gas emissions from Canadian peat extraction, 1990-2000: a life-cycle analysis, Ambio, 34, 456–461, https://doi.org/10.1579/0044-7447-34.6.456, 2005.
Conrad, R.: Importance of hydrogenotrophic, aceticlastic and methylotrophic methanogenesis for methane production in terrestrial, aquatic and other anoxic environments: A mini review, Pedosphere, 30, 25–39, https://doi.org/10.1016/s1002-0160(18)60052-9, 2020.
Coplen, T. B.: Guidelines and recommended terms for expression of stable-isotope-ratio and gas-ratio measurement results, Rapid. Commun. Mass Sp., 25, 2538–2560, https://doi.org/10.1002/rcm.5129, 2011.
Corbett, J. E., Tfaily, M. M., Burdige, D. J., Cooper, W. T., Glaser, P. H., and Chanton, J. P.: Partitioning pathways of CO2 production in peatlands with stable carbon isotopes, Biogeochemistry, 114, 327–340, https://doi.org/10.1007/s10533-012-9813-1, 2012.
Costello, A. M. and Lidstrom, M. E.: Molecular characterization of functional and phylogenetic genes from natural populations of methanotrophs in lake sediments, Appl. Environ. Microb., 65, 5066–5074, https://doi.org/10.1128/AEM.65.11.5066-5074.1999, 1999.
Couwenberg, J.: Greenhouse gas emissions from managed peat soils: is the IPCC reporting guidance realistic?, Mires Peat, 8, 1–10, 2011.
Davies, R. J., Almond, S., Ward, R. S., Jackson, R. B., Adams, C., Worrall, F., Herringshaw, L. G., Gluyas, J. G., and Whitehead, M. A.: Oil and gas wells and their integrity: Implications for shale and unconventional resource exploitation, Mar. Petrol. Geol., 56, 239–254, https://doi.org/10.1016/j.marpetgeo.2014.03.001, 2014.
Davidson, E. A., Savage, K., Verchot, L. V., and Navarro, R.: Minimizing artifacts and biases in chamber-based measurements of soil respiration, Agr. Forest Meteorol., 113, 21–37, https://doi.org/10.1016/s0168-1923(02)00100-4, 2002.
Dennis, L. E., Richardson, S. J., Miles, N., Woda, J., Brantley, S. L., and Davis, K. J.: Measurements of Atmospheric Methane Emissions from Stray Gas Migration: A Case Study from the Marcellus Shale, ACS Earth Space Chem., 6, 909–919, https://doi.org/10.1021/acsearthspacechem.1c00312, 2022.
Dohrmann, A. B. and Krüger, M.: Microbial H2 Consumption by a Formation Fluid from a Natural Gas Field at High-Pressure Conditions Relevant for Underground H2 Storage, Environ. Sci. Technol., 57, 1092–1102, https://doi.org/10.1021/acs.est.2c07303, 2023.
Drake, H. L., Horn, M. A., and Wust, P. K.: Intermediary ecosystem metabolism as a main driver of methanogenesis in acidic wetland soil, Environ. Microbiol. Rep., 1, 307–318, https://doi.org/10.1111/j.1758-2229.2009.00050.x, 2009.
Edgar, R. C.: Search and clustering orders of magnitude faster than BLAST, Bioinformatics, 26, 2460–2461, https://doi.org/10.1093/bioinformatics/btq461, 2010.
Edgar, R. C.: UNOISE2: improved error-correction for Illumina 16S and ITS amplicon sequencing, bioRxiv [preprint], https://doi.org/10.1101/081257, 2016.
Ettwig, K. F., Butler, M. K., Le Paslier, D., Pelletier, E., Mangenot, S., Kuypers, M. M., Schreiber, F., Dutilh, B. E., Zedelius, J., de Beer, D., Gloerich, J., Wessels, H. J., van Alen, T., Luesken, F., Wu, M. L., van de Pas-Schoonen, K. T., Op den Camp, H. J., Janssen-Megens, E. M., Francoijs, K. J., Stunnenberg, H., Weissenbach, J., Jetten, M. S., and Strous, M.: Nitrite-driven anaerobic methane oxidation by oxygenic bacteria, Nature, 464, 543–548, https://doi.org/10.1038/nature08883, 2010.
Feisthauer, S., Vogt, C., Modrzynski, J., Szlenkier, M., Krüger, M., Siegert, M., and Richnow, H.-H.: Different types of methane monooxygenases produce similar carbon and hydrogen isotope fractionation patterns during methane oxidation, Geochim. Cosmochim. Ac., 75, 1173–1184, https://doi.org/10.1016/j.gca.2010.12.006, 2011.
Flechard, C. R., Ambus, P., Skiba, U., Rees, R. M., Hensen, A., van Amstel, A., Dasselaar, A. v. d. P.-v., Soussana, J. F., Jones, M., Clifton-Brown, J., Raschi, A., Horvath, L., Neftel, A., Jocher, M., Ammann, C., Leifeld, J., Fuhrer, J., Calanca, P., Thalman, E., Pilegaard, K., Di Marco, C., Campbell, C., Nemitz, E., Hargreaves, K. J., Levy, P. E., Ball, B. C., Jones, S. K., van de Bulk, W. C. M., Groot, T., Blom, M., Domingues, R., Kasper, G., Allard, V., Ceschia, E., Cellier, P., Laville, P., Henault, C., Bizouard, F., Abdalla, M., Williams, M., Baronti, S., Berretti, F., and Grosz, B.: Effects of climate and management intensity on nitrous oxide emissions in grassland systems across Europe, Agr. Ecosyst. Environ., 121, 135–152, https://doi.org/10.1016/j.agee.2006.12.024, 2007.
Forde, O. N., Mayer, K. U., and Hunkeler, D.: Identification, spatial extent and distribution of fugitive gas migration on the well pad scale, Sci. Total Environ., 652, 356–366, https://doi.org/10.1016/j.scitotenv.2018.10.217, 2019a.
Forde, O. N., Cahill, A. G., Beckie, R. D., and Mayer, K. U.: Barometric-pumping controls fugitive gas emissions from a vadose zone natural gas release, Sci. Rep., 9, 14080, https://doi.org/10.1038/s41598-019-50426-3, 2019b.
Forde, O. N., Cahill, A. G., Mayer, B., Beckie, R. D., and Mayer, K. U.: Fugitive Gas Migration in the Vadose Zone at an Experimental Field Site in the Montney Shale Gas Region, Geophys. Res. Lett., 49, e2022GL098762, https://doi.org/10.1029/2022gl098762, 2022.
Freeman, C., Ostle, N., and Kang, H.: An enzymic “latch” on a global carbon store, Nature, 409, 149, https://doi.org/10.1038/35051650, 2001.
Frolking, S., Roulet, N., and Fuglestvedt, J.: How northern peatlands influence the Earth's radiative budget: Sustained methane emission versus sustained carbon sequestration, J. Geophys. Res.-Biogeo., 111, G01008, https://doi.org/10.1029/2005jg000091, 2006.
Gantner, S., Andersson, A. F., Alonso-Saez, L., and Bertilsson, S.: Novel primers for 16S rRNA-based archaeal community analyses in environmental samples, J. Microbiol. Meth., 84, 12–18, https://doi.org/10.1016/j.mimet.2010.10.001, 2011.
Guerrero-Cruz, S., Vaksmaa, A., Horn, M. A., Niemann, H., Pijuan, M., and Ho, A.: Methanotrophs: Discoveries, Environmental Relevance, and a Perspective on Current and Future Applications, Front Microbiol., 12, 678057, https://doi.org/10.3389/fmicb.2021.678057, 2021.
Hedrich, S., Guezennec, A. G., Charron, M., Schippers, A., and Joulian, C.: Quantitative Monitoring of Microbial Species during Bioleaching of a Copper Concentrate, Front Microbiol., 7, 2044, https://doi.org/10.3389/fmicb.2016.02044, 2016.
Ho, A., Kwon, M., Horn, M. A., and Yoon, S.: Environmental Applications of Methanotrophs, in: Methanotrophs, Micro Mono, edited by: Lee, E., Springer, Cham, 231–255, https://doi.org/10.1007/978-3-030-23261-0_8, 2019.
IEA: Global Methane Tracker 2024, IEA, Paris, https://www.iea.org/reports/global-methane-tracker-2024 (last access: 30 January 2025), 2024.
Jentzsch, K., Männistö, E., Marushchak, M. E., Korrensalo, A., van Delden, L., Tuittila, E.-S., Knoblauch, C., and Treat, C. C.: Shoulder season controls on methane emissions from a boreal peatland, Biogeosciences, 21, 3761–3788, https://doi.org/10.5194/bg-21-3761-2024, 2024.
Kang, M., Brandt, A. R., Zheng, Z., Boutot, J., Yung, C., Peltz, A. S., and Jackson, R. B.: Orphaned oil and gas well stimulus – Maximizing economic and environmental benefits, Elem. Sci. Anth., 9, 00161, https://doi.org/10.1525/elementa.2020.20.00161, 2021.
NIBIS® Kartenserver: Oil & Gas fields – Landesamt für Bergbau, Energie und Geologie (LBEG), Hannover [data set], https://nibis.lbeg.de/cardomap3/?permalink=1TQtbjct (last access: 30 January 2025) 2014a.
NIBIS® Kartenserver: Network Hydrocarbon-Geology (KW-Verbund) – Landesamt für Bergbau, Energie und Geologie (LBEG), Hannover [data set], https://nibis.lbeg.de/cardomap3/?permalink=28XjxRm3 (last access: 30 January 2025), 2014b.
Kaupper, T., Mendes, L. W., Harnisz, M., Krause, S. M. B., Horn, M. A., and Ho, A.: Recovery in methanotrophic activity does not reflect on the methane-driven interaction network after peat mining, Appl. Environ. Microb., 87, e02355-20, https://doi.org/10.1128/AEM.02355-20, 2021.
Kaupper, T., Mendes, L. W., Poehlein, A., Frohloff, D., Rohrbach, S., Horn, M. A., and Ho, A.: The methane-driven interaction network in terrestrial methane hotspots, Environ. Microbiome, 17, 15, https://doi.org/10.1186/s40793-022-00409-1, 2022.
Knief, C.: Diversity and Habitat Preferences of Cultivated and Uncultivated Aerobic Methanotrophic Bacteria Evaluated Based on pmoA as Molecular Marker, Front. Microbiol., 6, 1346, https://doi.org/10.3389/fmicb.2015.01346, 2015.
Knief, C.: Diversity of Methane Cycling Microorganisms in Soils and Their Relation to Oxygen, Curr. Issues Mol. Biol., 33, 23–56, https://doi.org/10.21775/cimb.033.023, 2019.
Kolb, S.: The quest for atmospheric methane oxidizers in forest soils, Env. Microbiol. Rep., 1, 336–346, https://doi.org/10.1111/j.1758-2229.2009.00047.x, 2009.
Kolb, S. and Horn, M. A.: Microbial CH4 and N2O Consumption in Acidic Wetlands, Front. Microbiol., 3, 78, https://doi.org/10.3389/fmicb.2012.00078, 2012.
Kotsyurbenko, O. R.: Trophic interactions in the methanogenic microbial community of low-temperature terrestrial ecosystems, FEMS Microbiol. Ecol., 53, 3–13, https://doi.org/10.1016/j.femsec.2004.12.009, 2005.
Lai, D. Y. F.: Methane Dynamics in Northern Peatlands: A Review, Pedosphere, 19, 409–421, https://doi.org/10.1016/s1002-0160(09)00003-4, 2009.
Laine, J., Minkkinen, K., and Trettin, C.: Direct Human Impacts on the Peatland Carbon Sink, in: Carbon Cycling in Northern Peatlands, Geoph. Monog. Series, 184, 71–78, https://doi.org/10.1029/2008gm000808, 2013.
Landesamt für Bergbau, Energie und Geologie (LBEG): RV: 4.25 Richtlinien über das Verfüllen auflässiger Bohrungen, https://bergpass.lbeg.de/media/204 (last access: 30 January 2025), 1998.
Le Mer, J. and Roger, P.: Production, oxidation, emission and consumption of methane by soils: A review, Eur. J. Soil Biol., 37, 25–50, https://doi.org/10.1016/s1164-5563(01)01067-6, 2001.
Lebel, E. D., Lu, H. S., Vielstadte, L., Kang, M., Banner, P., Fischer, M. L., and Jackson, R. B.: Methane Emissions from Abandoned Oil and Gas Wells in California, Environ. Sci. Technol., 54, 14617–14626, https://doi.org/10.1021/acs.est.0c05279, 2020.
Liu, Y. and Whitman, W. B.: Metabolic, phylogenetic, and ecological diversity of the methanogenic archaea, Ann. N.Y. Acad. Sci., 1125, 171–189, https://doi.org/10.1196/annals.1419.019, 2008.
Lubbers, I. M., van Groenigen, K. J., Fonte, S. J., Six, J., Brussaard, L., and van Groenigen, J. W.: Greenhouse-gas emissions from soils increased by earthworms, Nat. Clim. Change, 3, 187–194, https://doi.org/10.1038/nclimate1692, 2013.
Martin, M.: Cutadapt removes adapter sequences from high-throughput sequencing reads, EMBnet J., 17, 10–12, https://doi.org/10.14806/ej.17.1.200, 2011.
Milkov, A. V. and Etiope, G.: Revised genetic diagrams for natural gases based on a global dataset of > 20 000 samples, Org. Geochem., 125, 109–120, https://doi.org/10.1016/j.orggeochem.2018.09.002, 2018.
Moore, T. R. and Dalva, M.: Methane and carbon dioxide exchange potentials of peat soils in aerobic and anaerobic laboratory incubations, Soil Biol. Biochem., 29, 1157–1164, https://doi.org/10.1016/s0038-0717(97)00037-0, 1997.
Nakamura, F. M.: Microcosms and the role of active microbiota on methane cycle in soils under Forest and Pasture of Eastern Amazon, Centro de Energia Nuclear na Agricultura, Universidade de São Paulo, Piracicaba, 117 pp., https://doi.org/10.11606/T.64.2019.tde-14072021-141002, 2019.
Oertel, C., Matschullat, J., Zurba, K., Zimmermann, F., Erasmi, S., Greenhouse gas emissions from soils – A review, Geochemistry, 76, 327–352, https://doi.org/10.1016/j.chemer.2016.04.002, 2016.
Oremland, R. S., Whiticar, M. J., Strohmaier, F. E., and Kiene, R. P.: Bacterial ethane formation from reduced, ethylated sulfur compounds in anoxic sediments, Geochim. Cosmochim. Ac., 52, 1895–1904, https://doi.org/10.1016/0016-7037(88)90013-0, 1988.
Pekney, N. J., Diehl, J. R., Ruehl, D., Sams, J., Veloski, G., Patel, A., Schmidt, C., and Card, T.: Measurement of methane emissions from abandoned oil and gas wells in Hillman State Park, Pennsylvania, Carbon Manage., 9, 165–175, https://doi.org/10.1080/17583004.2018.1443642, 2018.
Pfadenhauer, J. and Klötzli, F.: Restoration experiments in middle European wet terrestrial ecosystems: an overview, Vegetatio, 126, 101–115, https://doi.org/10.1007/bf00047765, 1996.
Raimi, D., Krupnick, A. J., Shah, J. S., and Thompson, A.: Decommissioning Orphaned and Abandoned Oil and Gas Wells: New Estimates and Cost Drivers, Environ. Sci. Technol., 55, 10224–10230, https://doi.org/10.1021/acs.est.1c02234, 2021.
Rankin, T., Strachan, I. B., and Strack, M.: Carbon dioxide and methane exchange at a post-extraction, unrestored peatland, Ecol. Eng., 122, 241–251, https://doi.org/10.1016/j.ecoleng.2018.06.021, 2018.
Riddick, S. N., Mauzerall, D. L., Celia, M. A., Kang, M., and Bandilla, K.: Variability observed over time in methane emissions from abandoned oil and gas wells, Int. J. Greenh. Gas Con., 100, 103116, https://doi.org/10.1016/j.ijggc.2020.103116, 2020.
Romanak, K., Yang, C., and Darvari, R.: Towards a Method for Leakage Quantification and Remediation Monitoring in the Near-surface at Terrestrial CO2 Geologic Storage Sites, Enrgy. Proced., 114, 3855–3862, https://doi.org/10.1016/j.egypro.2017.03.1517, 2017.
Romanak, K. D., Bennett, P. C., Yang, C., and Hovorka, S. D.: Process-based approach to CO2 leakage detection by vadose zone gas monitoring at geologic CO2 storage sites, Geophys. Res. Lett., 39, L15405, https://doi.org/10.1029/2012gl052426, 2012.
Romanak, K. D., Wolaver, B., Yang, C., Sherk, G. W., Dale, J., Dobeck, L. M., and Spangler, L. H.: Process-based soil gas leakage assessment at the Kerr Farm: Comparison of results to leakage proxies at ZERT and Mt. Etna, Int. J. Greenh. Gas Con., 30, 42–57, https://doi.org/10.1016/j.ijggc.2014.08.008, 2014.
Samano, P. S. G., Cahill, A. G., Timmis, R., and Busch, A.: Constraining well integrity and propensity for fugitive gas migration in surficial soils at onshore decommissioned oil and gas well sites in England, Int. J. Greenh. Gas Con., 119, 103712, https://doi.org/10.1016/j.ijggc.2022.103712, 2022.
Saunois, M., Stavert, A. R., Poulter, B., Bousquet, P., Canadell, J. G., Jackson, R. B., Raymond, P. A., Dlugokencky, E. J., Houweling, S., Patra, P. K., Ciais, P., Arora, V. K., Bastviken, D., Bergamaschi, P., Blake, D. R., Brailsford, G., Bruhwiler, L., Carlson, K. M., Carrol, M., Castaldi, S., Chandra, N., Crevoisier, C., Crill, P. M., Covey, K., Curry, C. L., Etiope, G., Frankenberg, C., Gedney, N., Hegglin, M. I., Höglund-Isaksson, L., Hugelius, G., Ishizawa, M., Ito, A., Janssens-Maenhout, G., Jensen, K. M., Joos, F., Kleinen, T., Krummel, P. B., Langenfelds, R. L., Laruelle, G. G., Liu, L., Machida, T., Maksyutov, S., McDonald, K. C., McNorton, J., Miller, P. A., Melton, J. R., Morino, I., Müller, J., Murguia-Flores, F., Naik, V., Niwa, Y., Noce, S., O'Doherty, S., Parker, R. J., Peng, C., Peng, S., Peters, G. P., Prigent, C., Prinn, R., Ramonet, M., Regnier, P., Riley, W. J., Rosentreter, J. A., Segers, A., Simpson, I. J., Shi, H., Smith, S. J., Steele, L. P., Thornton, B. F., Tian, H., Tohjima, Y., Tubiello, F. N., Tsuruta, A., Viovy, N., Voulgarakis, A., Weber, T. S., van Weele, M., van der Werf, G. R., Weiss, R. F., Worthy, D., Wunch, D., Yin, Y., Yoshida, Y., Zhang, W., Zhang, Z., Zhao, Y., Zheng, B., Zhu, Q., Zhu, Q., and Zhuang, Q.: The Global Methane Budget 2000–2017, Earth Syst. Sci. Data, 12, 1561–1623, https://doi.org/10.5194/essd-12-1561-2020, 2020.
Savage, K., Phillips, R., and Davidson, E.: High temporal frequency measurements of greenhouse gas emissions from soils, Biogeosciences, 11, 2709–2720, https://doi.org/10.5194/bg-11-2709-2014, 2014.
Schloemer, S., Oest, J., Illing, C. J., Elbracht, J., and Blumenberg, M.: Spatial distribution and temporal variation of methane, ethane and propane background levels in shallow aquifers – A case study from Lower Saxony (Germany), J. Hydrol. Reg. Stud., 19, 57–79, https://doi.org/10.1016/j.ejrh.2018.07.002, 2018.
Schloss, P. D., Westcott, S. L., Ryabin, T., Hall, J. R., Hartmann, M., Hollister, E. B., Lesniewski, R. A., Oakley, B. B., Parks, D. H., Robinson, C. J., Sahl, J. W., Stres, B., Thallinger, G. G., Van Horn, D. J., and Weber, C. F.: Introducing mothur: open-source, platform-independent, community-supported software for describing and comparing microbial communities, Appl. Environ. Microb., 75, 7537–7541, https://doi.org/10.1128/AEM.01541-09, 2009.
Schoell, M.: The hydrogen and carbon isotopic composition of methane from natural gases of various origins, Geochim. Cosmochim. Ac., 44, 649–661, https://doi.org/10.1016/0016-7037(80)90155-6, 1980.
Schout, G., Griffioen, J., Hassanizadeh, S. M., Cardon de Lichtbuer, G., and Hartog, N.: Occurrence and fate of methane leakage from cut and buried abandoned gas wells in the Netherlands, Sci. Total Environ., 659, 773–782, https://doi.org/10.1016/j.scitotenv.2018.12.339, 2019.
Schwen, A., Jeitler, E., and Böttcher, J.: Spatial and temporal variability of soil gas diffusivity, its scaling and relevance for soil respiration under different tillage, Geoderma, 259–260, 323–336, https://doi.org/10.1016/j.geoderma.2015.04.020, 2015.
Strack, M., Keith, A. M., and Xu, B.: Growing season carbon dioxide and methane exchange at a restored peatland on the Western Boreal Plain, Ecol. Eng., 64, 231–239, https://doi.org/10.1016/j.ecoleng.2013.12.013, 2014.
Strack, M., Cagampan, J., Fard, G. H., Keith, A. M., Nugent, K., Rankin, T., Robinson, C., Strachan, I. B., Waddington, J. M., and Xu, B.: Controls on plot-scale growing season CO2 and CH4 fluxes in restored peatlands: Do they differ from unrestored and natural sites?, Mires Peat, 17, 1–18, https://doi.org/10.19189/MaP.2015.OMB.216, 2016.
Sundh, I., Nilsson, M., Granberg, G., and Svensson, B. H.: Depth distribution of microbial production and oxidation of methane in northern boreal peatlands, Microb. Ecol., 27, 253–265, https://doi.org/10.1007/BF00182409, 1994.
Sundh, I., Nilsson, M., Mikkelä, C., Granberg, G., and Svensson, B. H.: Fluxes of Methane and Carbon Dioxide on peat-mining Areas in Sweden, AMBIO, 29, 499–503, https://doi.org/10.1579/0044-7447-29.8.499, 2000.
Takai, K. and Horikoshi, K.: Rapid detection and quantification of members of the archaeal community by quantitative PCR using fluorogenic probes, Appl. Environ. Microb., 66, 5066–5072, https://doi.org/10.1128/AEM.66.11.5066-5072.2000, 2000.
Turetsky, M. R., Kotowska, A., Bubier, J., Dise, N. B., Crill, P., Hornibrook, E. R., Minkkinen, K., Moore, T. R., Myers-Smith, I. H., Nykanen, H., Olefeldt, D., Rinne, J., Saarnio, S., Shurpali, N., Tuittila, E. S., Waddington, J. M., White, J. R., Wickland, K. P., and Wilmking, M.: A synthesis of methane emissions from 71 northern, temperate, and subtropical wetlands, Glob. Change Biol., 20, 2183–2197, https://doi.org/10.1111/gcb.12580, 2014.
Versantvoort, W., Guerrero-Cruz, S., Speth, D. R., Frank, J., Gambelli, L., Cremers, G., van Alen, T., Jetten, M. S. M., Kartal, B., Op den Camp, H. J. M., and Reimann, J.: Comparative Genomics of Candidatus Methylomirabilis Species and Description of Ca. Methylomirabilis Lanthanidiphila, Front. Microbiol., 9, 1672, https://doi.org/10.3389/fmicb.2018.01672, 2018.
Vielstädte, L., Karstens, J., Haeckel, M., Schmidt, M., Linke, P., Reimann, S., Liebetrau, V., McGinnis, D. F., and Wallmann, K.: Quantification of methane emissions at abandoned gas wells in the Central North Sea, Mar. Petrol. Geol., 68, 848–860, https://doi.org/10.1016/j.marpetgeo.2015.07.030, 2015.
Vielstädte, L., Haeckel, M., Karstens, J., Linke, P., Schmidt, M., Steinle, L., and Wallmann, K.: Shallow Gas Migration along Hydrocarbon Wells-An Unconsidered, Anthropogenic Source of Biogenic Methane in the North Sea, Environ. Sci. Technol., 51, 10262–10268, https://doi.org/10.1021/acs.est.7b02732, 2017.
von Goerne, G., Weinlich, F. H., and May, F.: Anforderungen und Vorschläge zur Erstellung von Leitfäden und Richtlinien für eine dauerhafte und sichere Speicherung von CO2, Bundesanstalt für Geowissenschaften und Rohstoffe, https://www.bgr.bund.de/DE/Themen/Nutzung_tieferer_Untergrund_CO2Speicherung/Downloads/stability-abschlussbericht.pdf?__blob=publicationFile&v=4 (last access: 30 January 2025), 2010.
Webster, G., Newberry, C. J., Fry, J. C., and Weightman, A. J.: Assessment of bacterial community structure in the deep sub-seafloor biosphere by 16S rDNA-based techniques: a cautionary tale, J. Microbiol. Meth., 55, 155–164, https://doi.org/10.1016/s0167-7012(03)00140-4, 2003.
Welpelo, C., Dubbert, M., Tiemeyer, B., Voigt, C., and Piayda, A.: Effects of birch encroachment, water table and vegetation on methane emissions from peatland microforms in a rewetted bog, Sci. Rep., 14, 2533, https://doi.org/10.1038/s41598-024-52349-0, 2024.
Whiticar, M. J.: Carbon and hydrogen isotope systematics of bacterial formation and oxidation of methane, Chem. Geol., 161, 291–314, https://doi.org/10.1016/s0009-2541(99)00092-3, 1999.
Whiticar, M. J.: The Biogeochemical Methane Cycle, in: Hydrocarbons, Oils and Lipids: Diversity, Origin, Chemistry and Fate, edited by: Wilkes, H., Springer, Cham, 1–78, https://doi.org/10.1007/978-3-319-54529-5_5-1, 2020.
Williams, J. P., Regehr, A., and Kang, M.: Methane Emissions from Abandoned Oil and Gas Wells in Canada and the United States, Environ. Sci. Technol., 55, 563–570, https://doi.org/10.1021/acs.est.0c04265, 2021.
Wilson, D., Farrell, C. A., Fallon, D., Moser, G., Muller, C., and Renou-Wilson, F.: Multiyear greenhouse gas balances at a rewetted temperate peatland, Glob. Change Biol., 22, 4080–4095, https://doi.org/10.1111/gcb.13325, 2016.
Wittnebel, M., Frank, S., and Tiemeyer, B.: Aktualisierte Kulisse organischer Böden in Deutschland, Open Agrar [data set], https://doi.org/10.3220/DATA20230510130443-0, 2023.
Yang, S., Wen, X., and Liebner, S.: pmoA gene reference database (fasta-formatted sequences and taxonomy), GFZ Data Services [data set], https://doi.org/10.5880/GFZ.5.3.2016.001, 2016.