the Creative Commons Attribution 4.0 License.
the Creative Commons Attribution 4.0 License.
 | 20 Feb 2018
Inorganic carbon fluxes on the Mackenzie Shelf of the Beaufort Sea
Jacoba Mol
Helmuth Thomas
Paul G. Myers
Xianmin Hu
Alfonso Mucci
The Mackenzie Shelf in the southeastern Beaufort Sea is a region that has experienced large changes in the past several decades as warming, sea-ice loss, and increased river discharge have altered carbon cycling. Upwelling and downwelling events are common on the shelf, caused by strong, fluctuating along-shore winds, resulting in cross-shelf Ekman transport, and an alternating estuarine and anti-estuarine circulation. Downwelling carries dissolved inorganic carbon (DIC) and other remineralization products off the shelf and into the deep basin for possible long-term storage in the world's oceans. Upwelling carries DIC and nutrient-rich waters from the Pacific-origin upper halocline layer (UHL) onto the shelf. Profiles of DIC and total alkalinity (TA) taken in August and September of 2014 are used to investigate the cycling of carbon on the Mackenzie Shelf. The along-shore transport of water and the cross-shelf transport of DIC are quantified using velocity field output from a simulation of the Arctic and Northern Hemisphere Atlantic (ANHA4) configuration of the Nucleus of European Modelling of the Ocean (NEMO) framework. A strong upwelling event prior to sampling on the Mackenzie Shelf took place, bringing CO2-rich (elevated pCO2) water from the UHL onto the shelf bottom. The maximum on-shelf DIC flux was estimated at 16.9×10³ mol C d−1 m−2 during the event. The maximum on-shelf transport of DIC through the upwelling event was found to be Tg C d−1. TA and the oxygen isotope ratio of water (δ18O-H2O) are used to examine water-mass distributions in the study area and to investigate the influence of Pacific Water, Mackenzie River freshwater, and sea-ice melt on carbon dynamics and air–sea fluxes of carbon dioxide (CO2) in the surface mixed layer. Understanding carbon transfer in this seasonally dynamic environment is key to quantify the importance of Arctic shelf regions to the global carbon cycle and provide a basis for understanding how it will respond to the aforementioned climate-induced changes.
- Article
(6943 KB) - Full-text XML
- BibTeX
- EndNote


Coastal and shelf seas are dynamic areas where the oceanic, terrestrial, and atmospheric carbon reservoirs interact. These areas are influenced by the input of nutrients and carbon from riverine and atmospheric sources as well as by upwelling and physical mixing. Although the total area of continental shelves is small compared to that of the global ocean, elevated levels of primary production and carbon cycling take place, making them globally important for the exchange and storage of carbon dioxide (CO2; Gattuso et al., 1998). Shelf seas can act as strong sources or sinks of CO2. The role and contribution of coastal seas to the global ocean carbon sink is not well constrained and differs strongly between regions (Borges, 2005). The source or sink status of shelf seas in the Arctic varies geographically and throughout the year. In some cases, they have been shown to be a net sink of CO2 (e.g., Bates, 2006; Mucci et al., 2010; Shadwick et al., 2011a; Else et al., 2013; Anderson and Macdonald, 2015), while at other times are shown to be areas of increased upwelling activity and sources of CO2 to the atmosphere (e.g., Williams et al., 2008; Mathis et al., 2012; Pickart et al., 2013b). Quantification of these sources or sinks and understanding the effects on the biogeochemistry of shelf regions is important to gain a better understanding of how and where carbon is stored and moved in these high-latitude areas. Changes in the Arctic are greatly affecting carbon inputs and cycling on the shelves of the Arctic Ocean, and quantifying these changes will lead to a greater understanding of the contribution to the carbon cycle on a global scale. Arctic shelves are expected to be more sensitive to climate change than temperate regions due to faster warming of the shallow water column, the presence (locally) of fewer trophic links (Carmack and Wassmann, 2006), a relatively low alkalinity, and a weak carbonate buffering capacity (Shadwick et al., 2013).
The Mackenzie Shelf is an estuarine environment strongly affected by the Mackenzie River freshwater discharge. The Mackenzie River is the fourth largest source of freshwater and the single largest source of sediment to the Arctic Ocean (Doxaran et al., 2015). Depending on atmospheric and ice forcing, the river plume may be directed northward into the Canada Basin or steered eastward along the coast towards the Canadian Arctic Archipelago (McLaughlin et al., 2011). The delivery of nitrogen (N) with the Mackenzie River discharge has a small to moderate effect on primary production, alleviating N limitation in Beaufort Sea surface waters (Tremblay et al., 2014). This impact is complemented by the upwelling of Pacific Water that provides nutrients to the lower euphotic zone. The Beaufort shelves are subjected to strong seasonal changes, being ice-free in the summer and mostly ice-covered through the winter. A cold, low-density surface layer on the Mackenzie Shelf results from the mixing of river runoff, sea-ice melt, and low salinity Pacific Water, spawning a highly stratified upper water column (Rudels et al., 1996). The anticyclonic Beaufort Gyre exports ice to the south where ice melt contributes to the freshwater reservoir, enhancing surface stratification (McLaughlin et al., 2011).
Along the shelf-break, a narrow (15–20 km wide), Pacific-borne, nutrient-rich current flows from the Bering Strait east towards the Canadian Arctic Archipelago (Pickart, 2004). Strong Ekman convergence produces downwelling in the Canada Basin and upwelling along the boundary of the Beaufort Sea, contributing to freshwater export to the Beaufort Gyre and upwelling of water from the Arctic upper halocline layer (UHL) onto the shelf (Yang et al., 2006). Wind and ice movements are the dominant controls of circulation on the shelves. Storms can alter the flow of the shelf-break jet and cause upwelling or downwelling on the Beaufort shelves. Arctic storms with westerly winds can accelerate the shelf-break jet and cause downwelling, whereas Pacific storms or a strong Beaufort high pressure cell generate easterly winds that can reverse the jet and create upwelling favourable conditions (Pickart et al., 2013b). Shelf–basin exchanges are promoted by upwelling and downwelling induced by surface stress generated by wind and ice motion (Williams et al., 2006), as well as density-driven plumes through canyons, polynya-forced spreading, and the instability of boundary currents generating eddies (Mathis et al., 2007). Topographic features such as the Barrow Canyon, the Mackenzie Trough, and the Kugmallit Valley, that interrupt the shelf, are areas of enhanced shelf–basin exchanges (Williams et al., 2006, 2008).
Upwelling has been documented on the shelf in the fall when storms are common (e.g., Mathis et al., 2012; Williams and Carmack, 2015; Pickart et al., 2013a) and impacts the shelf region in various ways. Upwelling events provide nutrient and CO2-rich (elevated pCO2) water to the euphotic zone, increasing primary production (Williams and Carmack, 2015) and altering the magnitude and direction of the CO2 flux across the air–sea interface on the shelves of the Beaufort Sea (Mucci et al., 2010; Mathis et al., 2012). Saline water brought onto the shelf in the fall preconditions it for greater salt export through brine drainage in the subsequent winter (Melling, 1993). Upwelling, induced by wind, occurs throughout the year such that the location of the ice edge is important. If the ice edge is beyond the shelf-break, upwelling can bring water from deeper than the shelf-break (80–100 m) up onto the shelf (Carmack and Chapman, 2003) and possibly to the surface where CO2 outgassing can occur. If the ice cover extends over the shelf, upwelling can still occur, but the high pCO2 water remains isolated from the atmosphere and nutrient uptake for biological production is light limited. Upwelling and offshore Ekman transport on the shelf also causes downwelling beyond the shelf-break in the Beaufort Gyre, increasing freshwater content, deepening the nutricline, and decreasing productivity in this area (McLaughlin et al., 2011).
Sustained periods of westerly winds intensify the eastward flowing shelf-break jet and create conditions conducive to the movement of water and materials to the deep basin. Downwelling carries particulate matter and remineralization products off the shelf into the deep basin (Forest et al., 2007), supplying water to the UHL (centred at 100 m depth). The westward flowing arm of the Beaufort Gyre is pushed north further away from the shelf-break by these westerly winds, allowing water from the shelf to flow out beyond this point. Under this scenario, carbon that was sequestered by primary production and sank beneath the surface mixed layer can be transported off the shelf and below the upper halocline in the deep basin. Downwelling events are less frequent than upwelling, acting to offset on-shelf fluxes, but do not reverse mixing due to upwelling (Pickart et al., 2013b).
Given changes in sea-ice cover, freshwater input, and wind forcing, carbon cycling on the Beaufort Sea shelves is becoming more important to monitor and understand, as the magnitude of shelf–basin fluxes and the source or sink status of the shelf for CO2 is altered by these changing parameters. In this study, we use measured concentrations of carbonate system parameters and modelled velocity fields to look at the impact of upwelling and downwelling on carbon cycling on the Mackenzie Shelf during August and September of 2014. The cross-shelf transport of dissolved inorganic carbon (DIC) is investigated to better constrain carbon transfer on the shelf and its contribution to ocean acidification and CO2 air–sea exchange.

Figure 1Map of stations (red dots) sampled in the Beaufort Sea during August and September of 2014. The black rectangle signifies the stations that make up the Mackenzie Shelf transect with numbers indicating station names. The blue rectangle signifies stations that make up the Mackenzie Trough transect. The black star in the Mackenzie Shelf transect indicates the location of wind data collection. The cross-shelf and along-shore directions are indicated by the black arrows.
2.1 Collection and analysis of carbonate parameters
Water samples were collected during an expedition in August and September of 2014 onboard the Canadian Coast Guard Ship (CCGS) Amundsen. Samples were taken at the stations shown in Fig. 1 in the Beaufort Sea over the entire water column using a rosette system (24 12-L PVC Niskin bottles) equipped with a conductivity-temperature-depth sensor (CTD, Seabird® SBE 911plus). Water samples for the analysis of DIC and total alkalinity (TA) were drawn directly from the Niskin bottles into 300 mL borosilicate glass bottles into which 20 µL of a supersaturated mercuric chloride (HgCl2) solution was injected to halt biological activity before being sealed with ground-glass stoppers and Apiezon® Type-M high-vacuum grease. Samples were stored at 4 ∘C in the dark until analysis using a VINDTA 3C (versatile instrument for the determination of titration alkalinity, by Marianda) at Dalhousie University following the methods described in Dickson et al. (2007). The instrument was calibrated against certified reference materials provided by A. G. Dickson (Scripps Institute of Oceanography) and the reproducibility of the DIC and TA measurements was, respectively, better than 2 and 3 µmol kg−1. Water samples for measurements of the carbon isotope ratio of DIC (δ13C-DIC) and the oxygen isotope ratio of water (δ18O-H2O) were collected in tandem with DIC and TA samples. δ13C-DIC samples were analyzed at the Yale Analytical and Stable Isotope Center (Yale University) using a GasBench II system connected to a Thermo Delta Plus XP isotope ratio mass spectrometer (IRMS). δ18O-H2O samples were analyzed on a triple collector IRMS in dual inlet mode at the GEOTOP Stable Isotope Laboratory (Université du Québec à Montréal). The pCO2, pH (on the total scale), and aragonite saturation state (ΩAr) were computed using DIC and TA as input parameters with the standard set of carbonate system equations, excluding nutrients, using the CO2SYS program of Lewis and Wallace (1998) and the carbonic acid dissociation constants of Mehrbach et al. (1973) refit by Dickson and Millero (1987).
2.2 Water mass definitions
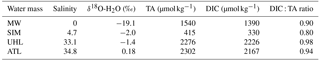
The distribution and vertical structure of water masses in the Arctic Ocean are well known and documented (e.g., Jones and Anderson, 1986; Aagaard, 1989; Swift et al., 1997; Jones et al., 1998). The variable inputs of freshwater from rivers and sea-ice melt have a strong impact on the local stratification and circulation (e.g., Aagaard and Carmack, 1989; Rabe et al., 2011; McClelland et al., 2012). In this study, the vertical water column is divided into three major water masses. At the surface is the polar mixed layer (PML), a mixture of meteoric/river water (MW), sea-ice melt (SIM), and upper halocline Pacific-origin water. The UHL originates in the Pacific Ocean and lies below the PML. It covers a depth range of approximately 25 to 200 m, a salinity range of 31.6 to 34.6 (with a core salinity of 33.1), and is characterized by a temperature minimum. Below the UHL is the Atlantic layer (ATL), covering the depths below 150 m to approximately 1000 m, with a salinity range of 34.6 to 34.9. Waters with a mixture of UHL and ATL properties, or without at least 80 % of the total fraction of one of these water masses, are defined as UHL-ATL waters. This described layering of water masses is applicable over the deep basin in the study area and disappears somewhat over the shelf as mixing and upwelling and/or downwelling dynamics occur.
Using a three endmember mixing scheme allowing for negative values, assuming conservative mixing, and knowing the TA and δ18O-H2O of each water mass, the relative fraction of each water mass in a sample of known TA and δ18O can be calculated. This technique has been applied successfully in multiple independent studies in the same geographic area (e.g., Yamamoto-Kawai et al., 2009; Shadwick et al., 2011b). The upper 150 m of the water column is assumed to be a mixture of MW, SIM, and UHL, and the following system of linear equations is solved to estimate the relative fraction of each water mass:
where fx represents the relative fraction of each water mass. Below 150 m, the water is assumed to be a mixture of net SIM, UHL, and ATL, and the following system of equations is used:
The endmember values used for each water mass are shown in Table 1. The TA value for MW is a flow-weighted value of the Mackenzie River water taken from Cooper et al. (2008). The δ18O value for MW is a flux-weighted value for the Mackenzie River taken from Yi et al. (2012). These endmembers give a balanced value for the river water endmember throughout the year. Although Alaskan and Eurasian rivers may have some influence on the upper water column in this area and contribute water with different properties, the dominant input of MW to the study area is the Mackenzie River and so these values are used. The DIC value for MW is taken from Shadwick et al. (2011b). The δ18O value for SIM is taken from Yamamoto-Kawai et al. (2009) and the TA, DIC, and salinity values for SIM are taken from Lansard et al. (2012). The δ18O, TA, and DIC values for the UHL are the average values of all water samples at a salinity of 33.1, considered to be the core of the UHL water mass. Likewise, ATL values are averages of all values at the deep temperature maximum and a salinity of 34.8.
Table 1Endmember water mass properties used in the three-component mass balance equations.
2.3 Arctic and Northern Hemisphere Atlantic simulation
The velocity fields used in this study are taken from the 0.25∘ Arctic and Northern Hemisphere Atlantic (ANHA4) configuration. This is a regional configuration of a coupled ocean–sea ice model, based on the Nucleus for European Modelling of the Ocean (NEMO, version 3.4) framework (Madec, 2008). The sea-ice model used is the Louvain-La-Neuve Sea-Ice Model version 2 (LIM2) with an elastic-viscous-plastic rheology, including both thermodynamic and dynamic modules (Fichefet and Maqueda, 1997). The horizontal mesh is a subdomain of the global ORCA025 tripolar grid with two open boundaries, one close to the Bering Strait in the Pacific Ocean and the other at 20∘ S in the Atlantic Ocean. In the vertical, there are 50 unequally spaced geopotential levels with higher resolution (∼1 m) in the top 10 m.
This simulation is integrated from January 2002 to December 2014. The initial conditions (3-D temperature, salinity, horizontal velocities, sea surface height, and sea ice) are extracted from the Global Ocean Reanalysis and Simulations (GLORYS2v3) produced by Mercator Ocean (Masina et al., 2015). Hourly 33 km horizontal resolution atmospheric forcing data (10 m wind, 2 m air temperature and humidity, downwelling and longwave radiation fluxes, and total precipitation) from the Canadian Meteorological Centre (CMC) global deterministic prediction system (GDPS) reforecasts (CGRF) dataset (Smith et al., 2014) are used to drive the model. The GLORYS2 dataset is also used to provide the open boundaries (temperature, salinity and, ocean velocities). Monthly interannual runoff from Dai et al. (2009) as well as Greenland meltwater provided by Bamber et al. (2012) are also carefully remapped onto the model grid to give a more realistic freshwater input from the land to the ocean.
Model output is 5-day averages of the velocity fields in the study area for August and September 2014. To look at along-shore and cross-shelf transports on the Mackenzie Shelf, the velocity was gridded along the shelf-to-basin sampled transect (Fig. 1) every 5 km, starting from 20 km closer to shore than the first sampled station and ending ∼ 20 km into the basin beyond the last sampled station. The along-shore direction runs parallel to the shelf-break, at a bearing of 52∘ to the east of true north (52 or 232∘ T, where T indicates relative to true north). The cross-shelf direction is then 38∘ to the west of true north (142 or 322∘ T) (directions indicated in Fig. 1). The ocean current vectors (u and v components) from the ANHA4 simulation were tilted to correspond to these along-shore and cross-shelf bearings, resulting in the u component of the velocity representing along-shore flow and the v component representing cross-shelf flow. In all cases, positive (negative) values indicate along-shore flow to the east (west) and cross-shelf flow in the off-shelf (on-shelf) direction.
2.4 Flux calculation uncertainty
Uncertainty was estimated using Monte Carlo simulations for the calculation of cross-shelf mass transports. The inputs for the simulations were randomly generated from normal distributions, and 1000 points were chosen randomly for each of the variables. Standard deviation for salinity (±0.0003) and temperature (±0.001 ∘C) were taken from error calculations with the Seabird 911plus CTD sensor, and the standard deviation for DIC measurements (±2 µmol kg−1) was taken from repeat measurements of sample and standard seawater using the VINDTA 3C. The error of the modelled velocity was estimated by taking the standard deviation of the velocity at each station and depth layer from the ANHA4 model over the 2-month study period.
3.1 Carbonate system
High variability in the carbonate system properties of surface waters is observed throughout the study region with marked differences between the basin and distinct shelf regions (Fig. 2). Temperature varies from less than −1 ∘C in the central basin and beyond the shelf-break to greater than 6 ∘C on the Mackenzie Shelf and in the the Amundsen Gulf. Salinity ranges from less than 26 to greater than 30, with the lowest values in areas close to the Mackenzie River and in the central basin. Higher salinity values in the Amundsen Gulf and on the Mackenzie Shelf suggest upwelling of high-salinity deep water. DIC is lowest in the low-salinity and low-temperature surface waters of the central basin and higher in shelf seas, possibly a result of upwelling. TA follows a pattern similar to that of salinity with low values beyond the shelf-break and in the central basin, and higher values over the shelf. High pCO2 values are found in waters with higher temperature and DIC content, primarily over the shelf and in the Amundsen Gulf. Lower δ13C-DIC values are observed over the shelf in areas near the Mackenzie River outflow, as river-water values are presumably depleted due to accumulation of metabolic CO2 from the microbial respiration of terrigenous or riverine organic matter, while high δ13C-DIC values are found in the northern Amundsen Gulf.
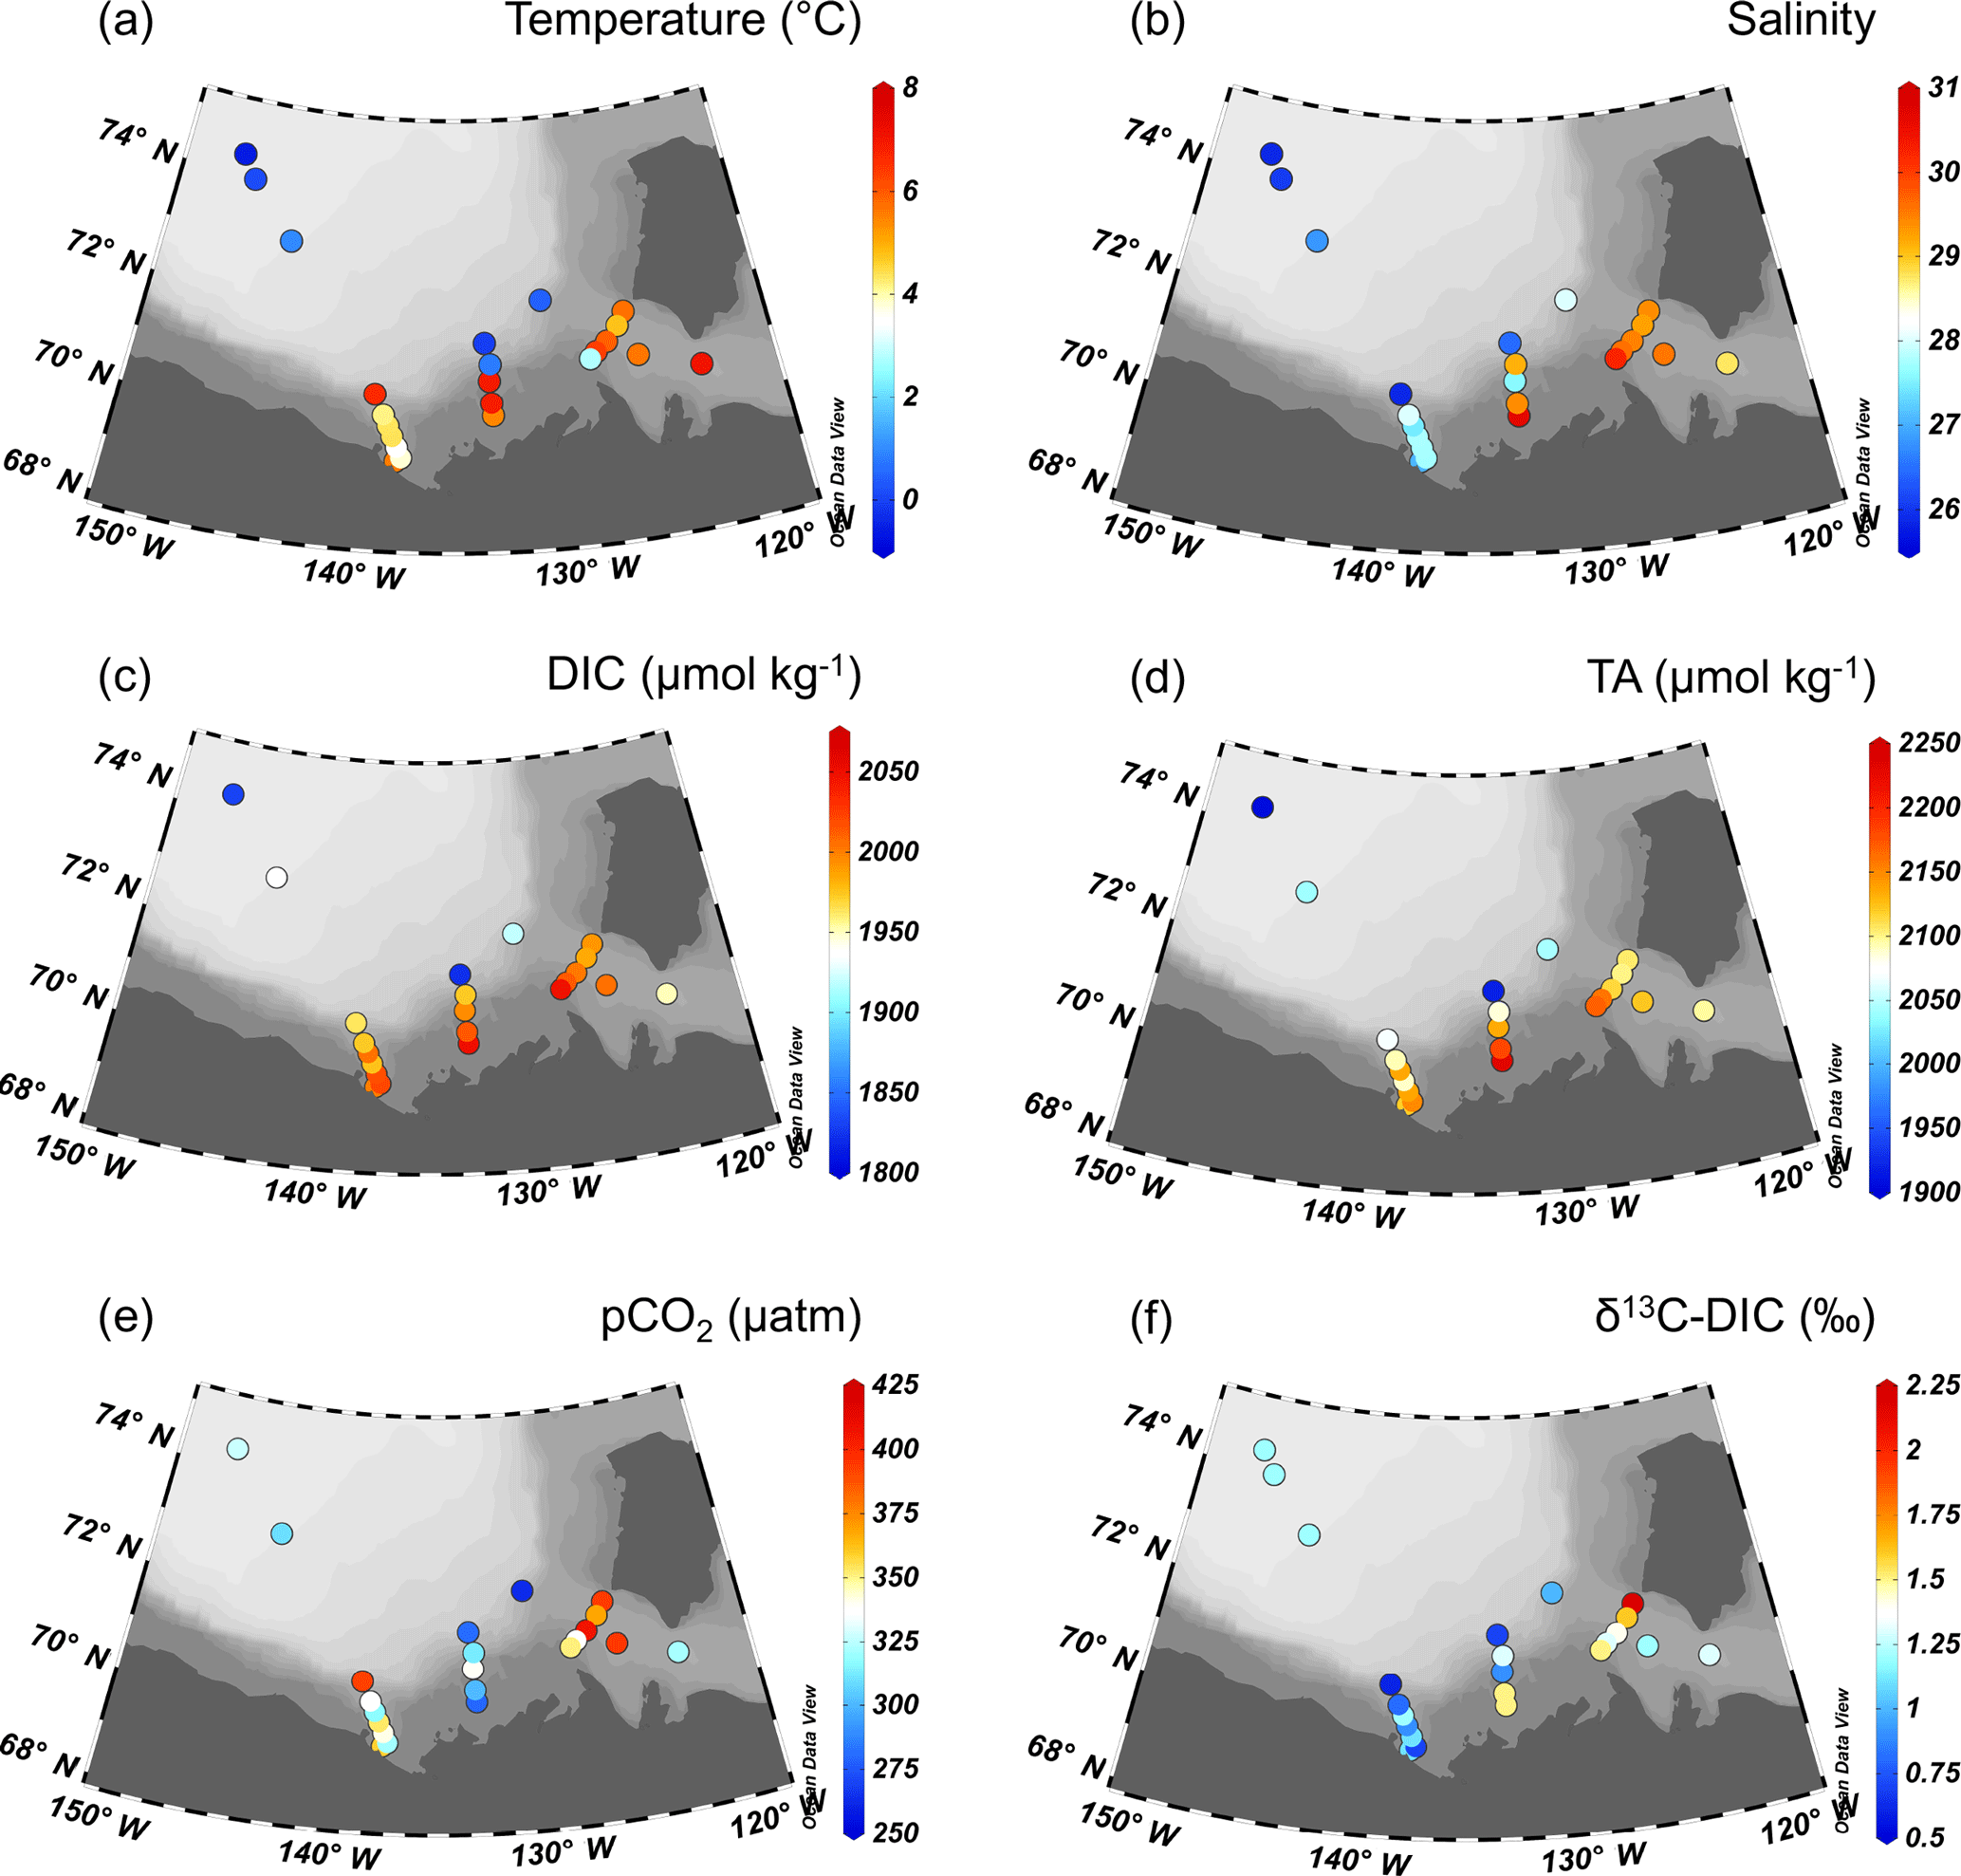
Figure 2(a) Temperature, (b) salinity, (c) DIC, (d) TA, (e) pCO2, and (f) δ13C-DIC of surface samples in the study region measured at each station.
These surface plots (Fig. 2) are constructed from surface samples taken over more than a month-long period, from 17 August to 21 September. The stations along each of the three transects (the Amundsen Gulf, Mackenzie Shelf, and Mackenzie Trough) were all sampled within a 3-day span, except for the furthest off-shore station on the Mackenzie Trough transect. Temporal variability between the three transects and the stations in the deep basin must be considered when looking at the spatial variability between these areas. Changes in wind and circulation that occurred during the sampling period may alter the surface conditions due to upwelling or downwelling (where the Mackenzie River discharge is directed) and concentrations of sea ice in different areas.
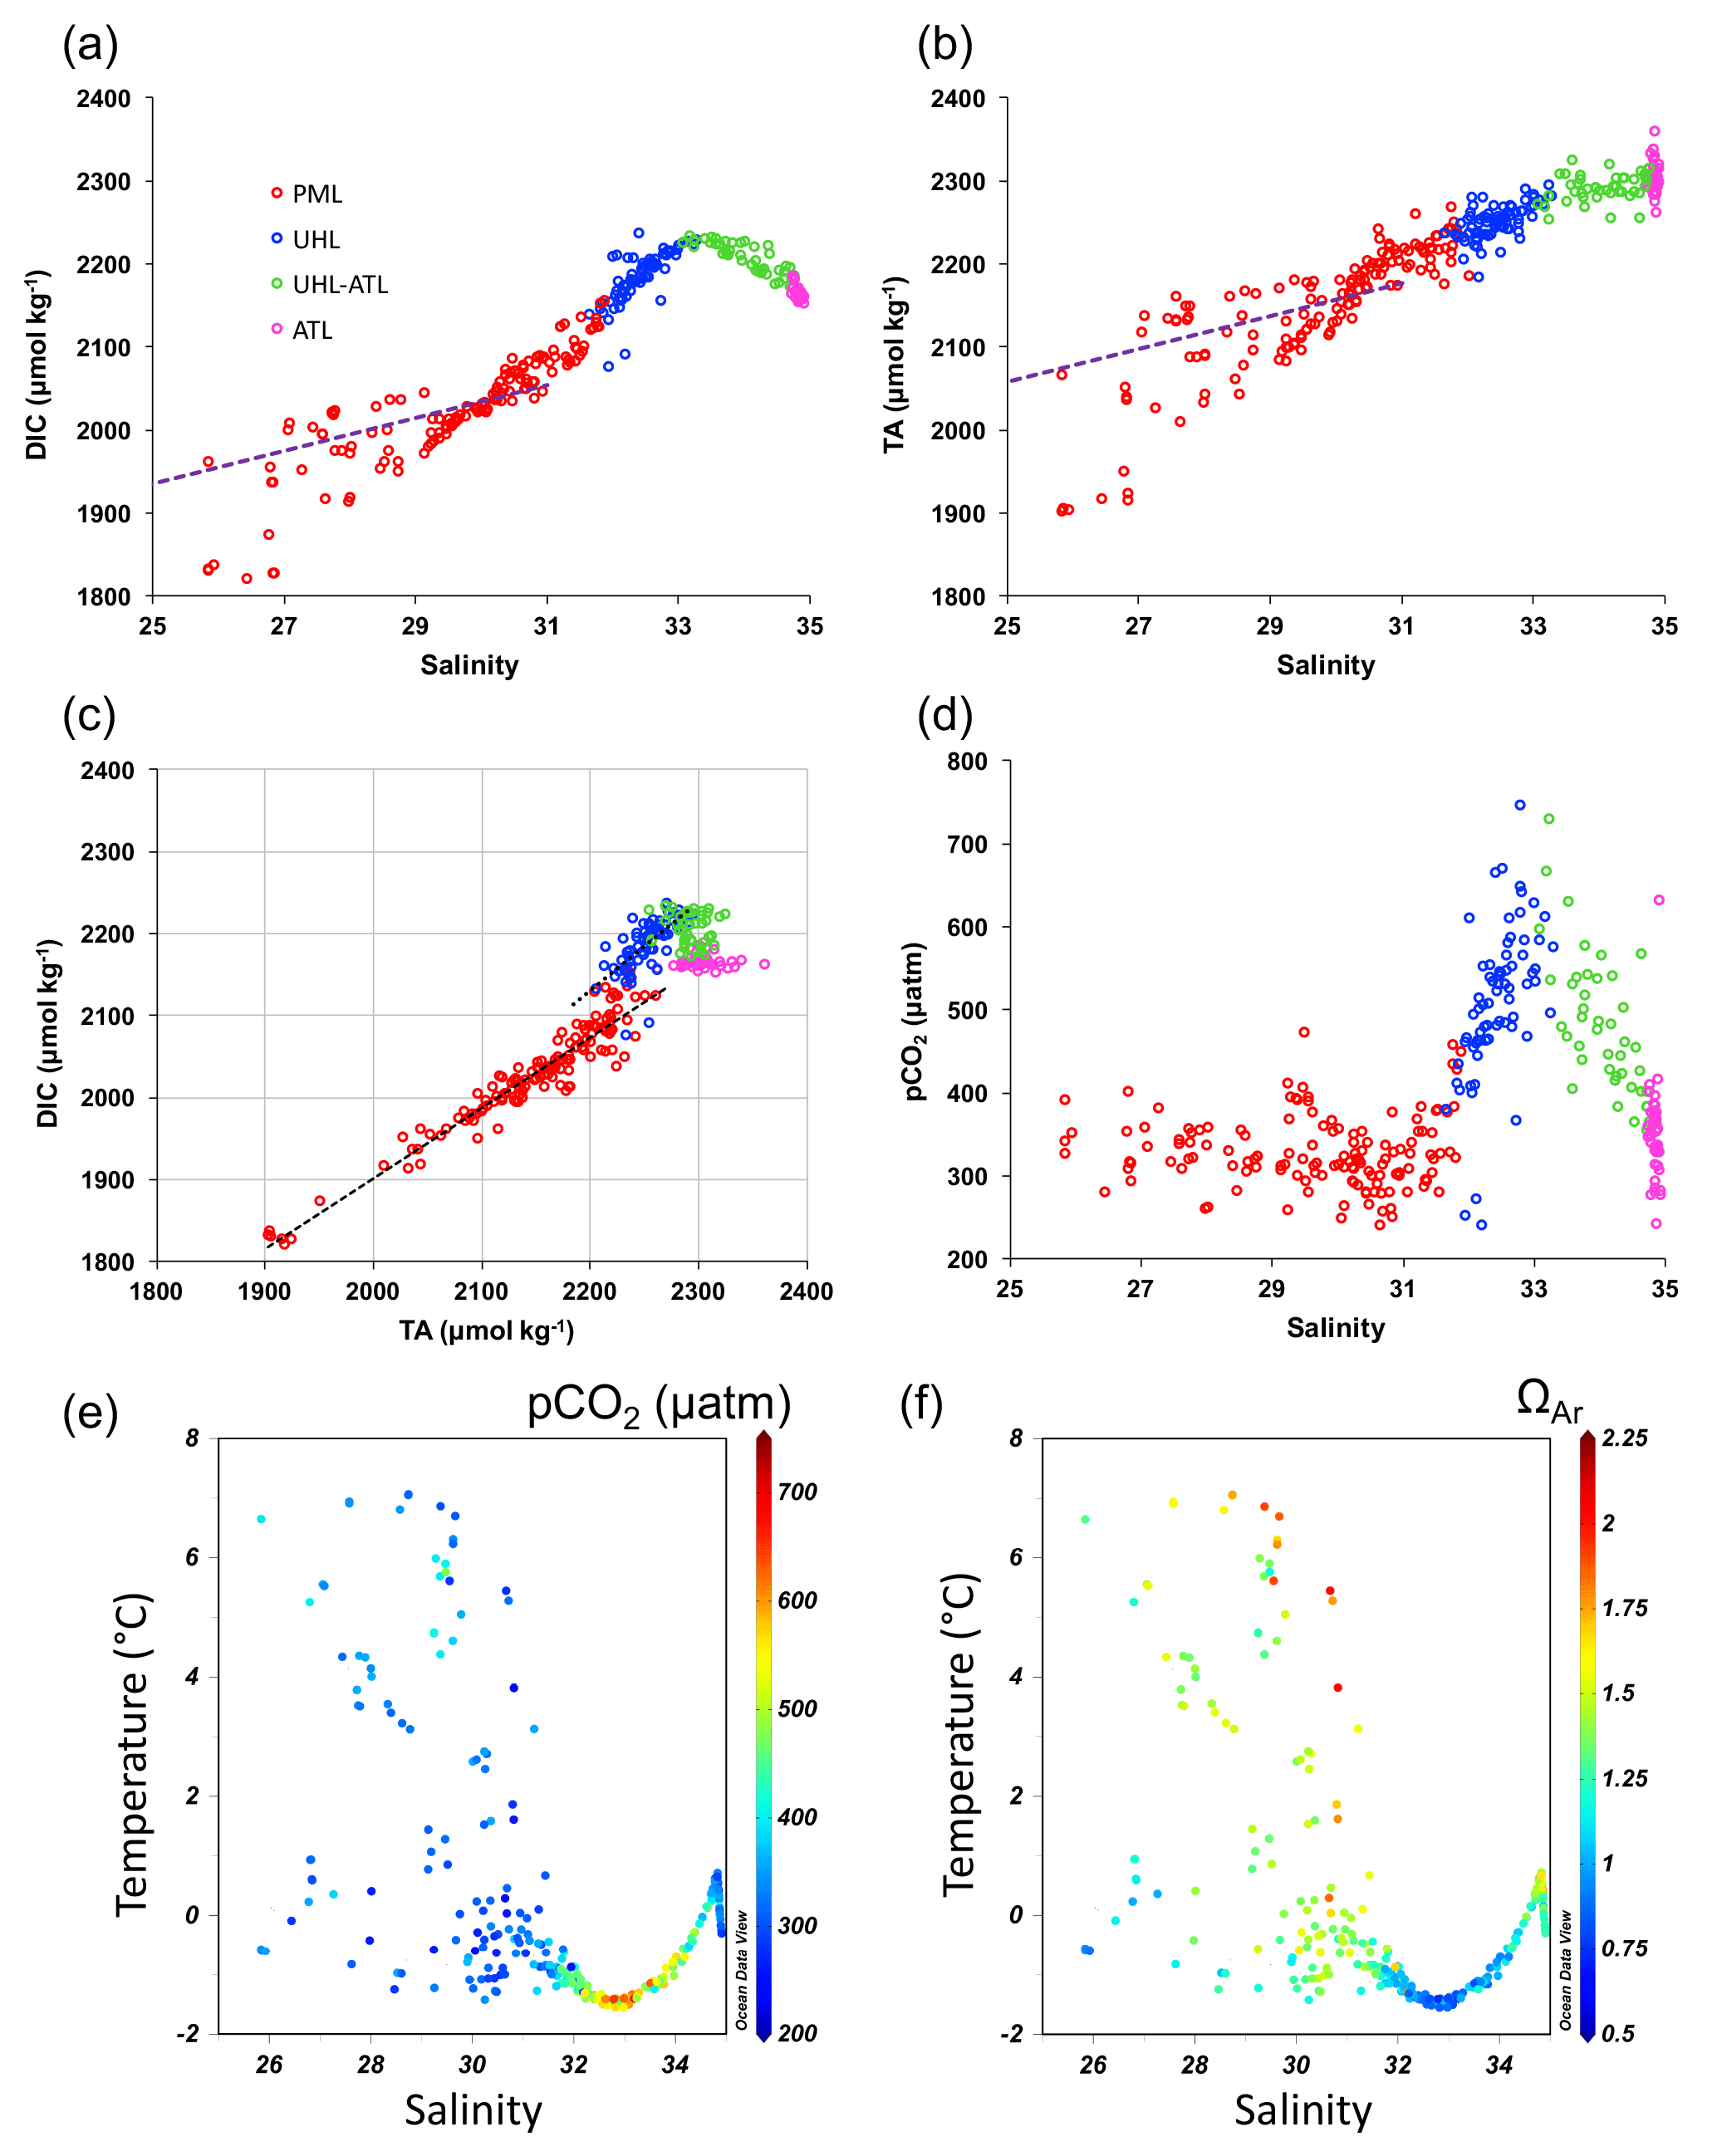
Figure 3(a) DIC versus salinity, (b) TA versus salinity, (c) DIC versus TA, (d) pCO2 versus salinity, (e) temperature versus salinity with pCO2, and (f) temperature versus salinity with ΩAr for all samples at the stations shown in Fig. 1. Four water masses are identified by colour in figures (a)–(d): PML (red), UHL (blue), UHL-ATL (green) and ATL (pink). Dashed lines in (a) and (b) indicate linear regressions to a salinity of zero to find the Mackenzie River endmember of DIC and TA. Dashed lines in (c) show the change in the relationship between DIC and TA in samples from the PML (red) and the UHL (blue). Slopes of these DIC : TA lines are 0.86 and 1.01, respectively.
Relationships between DIC, TA, salinity, temperature, pCO2, and ΩAr for all samples on the Mackenzie Shelf, in the Amundsen Gulf, and in the Canada Basin are shown in Fig. 3. DIC and TA are both quite variable in the low-salinity PML with freshwater from sea-ice melt and river outflow contributing waters of different chemical properties (Fig. 3a and b). DIC ranges widely from 1822 to 2156 µmol kg−1 in the PML and TA ranges from 1892 to 2269 µmol kg−1 over this same wide salinity range of 25.8 to 32.0. The DIC reaches a maximum of ∼ 2225 µmol kg−1 in samples characterized by the highest relative contributions of UHL, a common feature in this study area. For example, Shadwick et al. (2011b) found a DIC maximum of 2240 µmol kg−1 at the UHL maximum, Brown et al. (2016) found a DIC maximum of 2225±8 µmol kg−1, and Lansard et al. (2012) found a DIC maximum of 2228±8 µmol kg−1 in this same water mass. TA shows a maximum of ∼ 2360 µmol kg−1 in waters with the greatest ATL contribution and a salinity maximum of ∼ 34.9. These parameters follow the trends seen in previous years in the same sampling areas (e.g., Shadwick et al., 2011b). A linear regression was performed to extrapolate to the values of DIC and TA at a salinity of zero, representative of the Mackenzie River water endmember (regression lines shown in Fig. 3a and b). Only samples with greater than 10 % fMW and less than 5 % fSIM were used for the regression. The resulting endmember values of DIC and TA for the Mackenzie River are 1441 and 1564 µmol kg−1, respectively. These values are close to the Mackenzie River properties published in Shadwick et al. (2011b) and Cooper et al. (2008) and used for the water mass deconvolution in this study (Table 1).
The relationship between DIC and TA is shown in Fig. 3c. For samples in the PML, the slope is < 1, with TA increasing at a faster rate than DIC. TA is nearly conservative while DIC is more responsive to biological processes, including photosynthesis and respiration in the PML. The slope of this relationship increases in the UHL to > 1, as DIC builds up in the mid-depth layer to its maximum value due to the accumulation of remineralization products. A greater DIC : TA ratio indicates that there is a greater amount of DIC in the water relative to TA, altering the chemistry and leading to an increase in pCO2. Values of the DIC : TA ratio for the core or average values of each of the water masses defined here are shown in Table 1. The value of pCO2 is variable in the PML, ranging from ∼ 200 to 500 µatm, but mostly staying at values below 400 µatm (Fig. 3d). Temperatures range from −2 to 7 ∘C in the PML, with resulting variability in pCO2 and ΩAr (Fig. 3e and f). The UHL is where pCO2 reaches its maximum, with values greater than 700 µatm in water associated with the DIC maximum. The UHL is also the layer where the temperature minimum is found (Fig. 3e and f). The high values of pCO2 and low ΩAr found in the UHL are restricted to a small temperature range. Waters return to the 200 to 500 µatm range in the ATL layer, with a few samples showing higher values.
Figure 4Cross sections of (a) temperature, (b) salinity, (c) DIC, (d) TA, (e) pCO2, (f) δ13C-DIC, (g) ΩAr, and (h) pH measured in, or computed for, the top 300 m of the Mackenzie Shelf transect. Measurements are indicated by black dots.
Five stations were sampled along an onshore-offshore transect across the Mackenzie Shelf and beyond the shelf-break from 22 to 24 August (identified in Fig. 1). Water properties and carbonate system parameters in the top 300 m are shown in Fig. 4. Water temperature is warmest at the surface over the shelf, reaching values of > 6.5 ∘C. Surface waters over the deep basin are cooler, with a maximum temperature of < 1 ∘C. Salinity, DIC, and TA all show similar patterns in the top 300 m over the shelf and beyond the shelf-break. The lowest values (< 26.5, 1830 µmol kg−1, and 1920 µmol kg−1 for salinity, DIC, and TA, respectively) are seen in the surface water beyond the shelf-break. Salinity and TA increase down to 300 m, reaching maximum values of ∼ 34.8 and ∼ 2300 µmol kg−1, respectively. DIC has a mid-depth maximum at around 125 m depth of ∼ 2225 µmol kg−1, then decreases slightly with depth down to 300 m. All three of these parameters show isoclines sloping up onto the shelf, with the same values at shallower depths over the shelf as well as elevated surface values over the shelf.
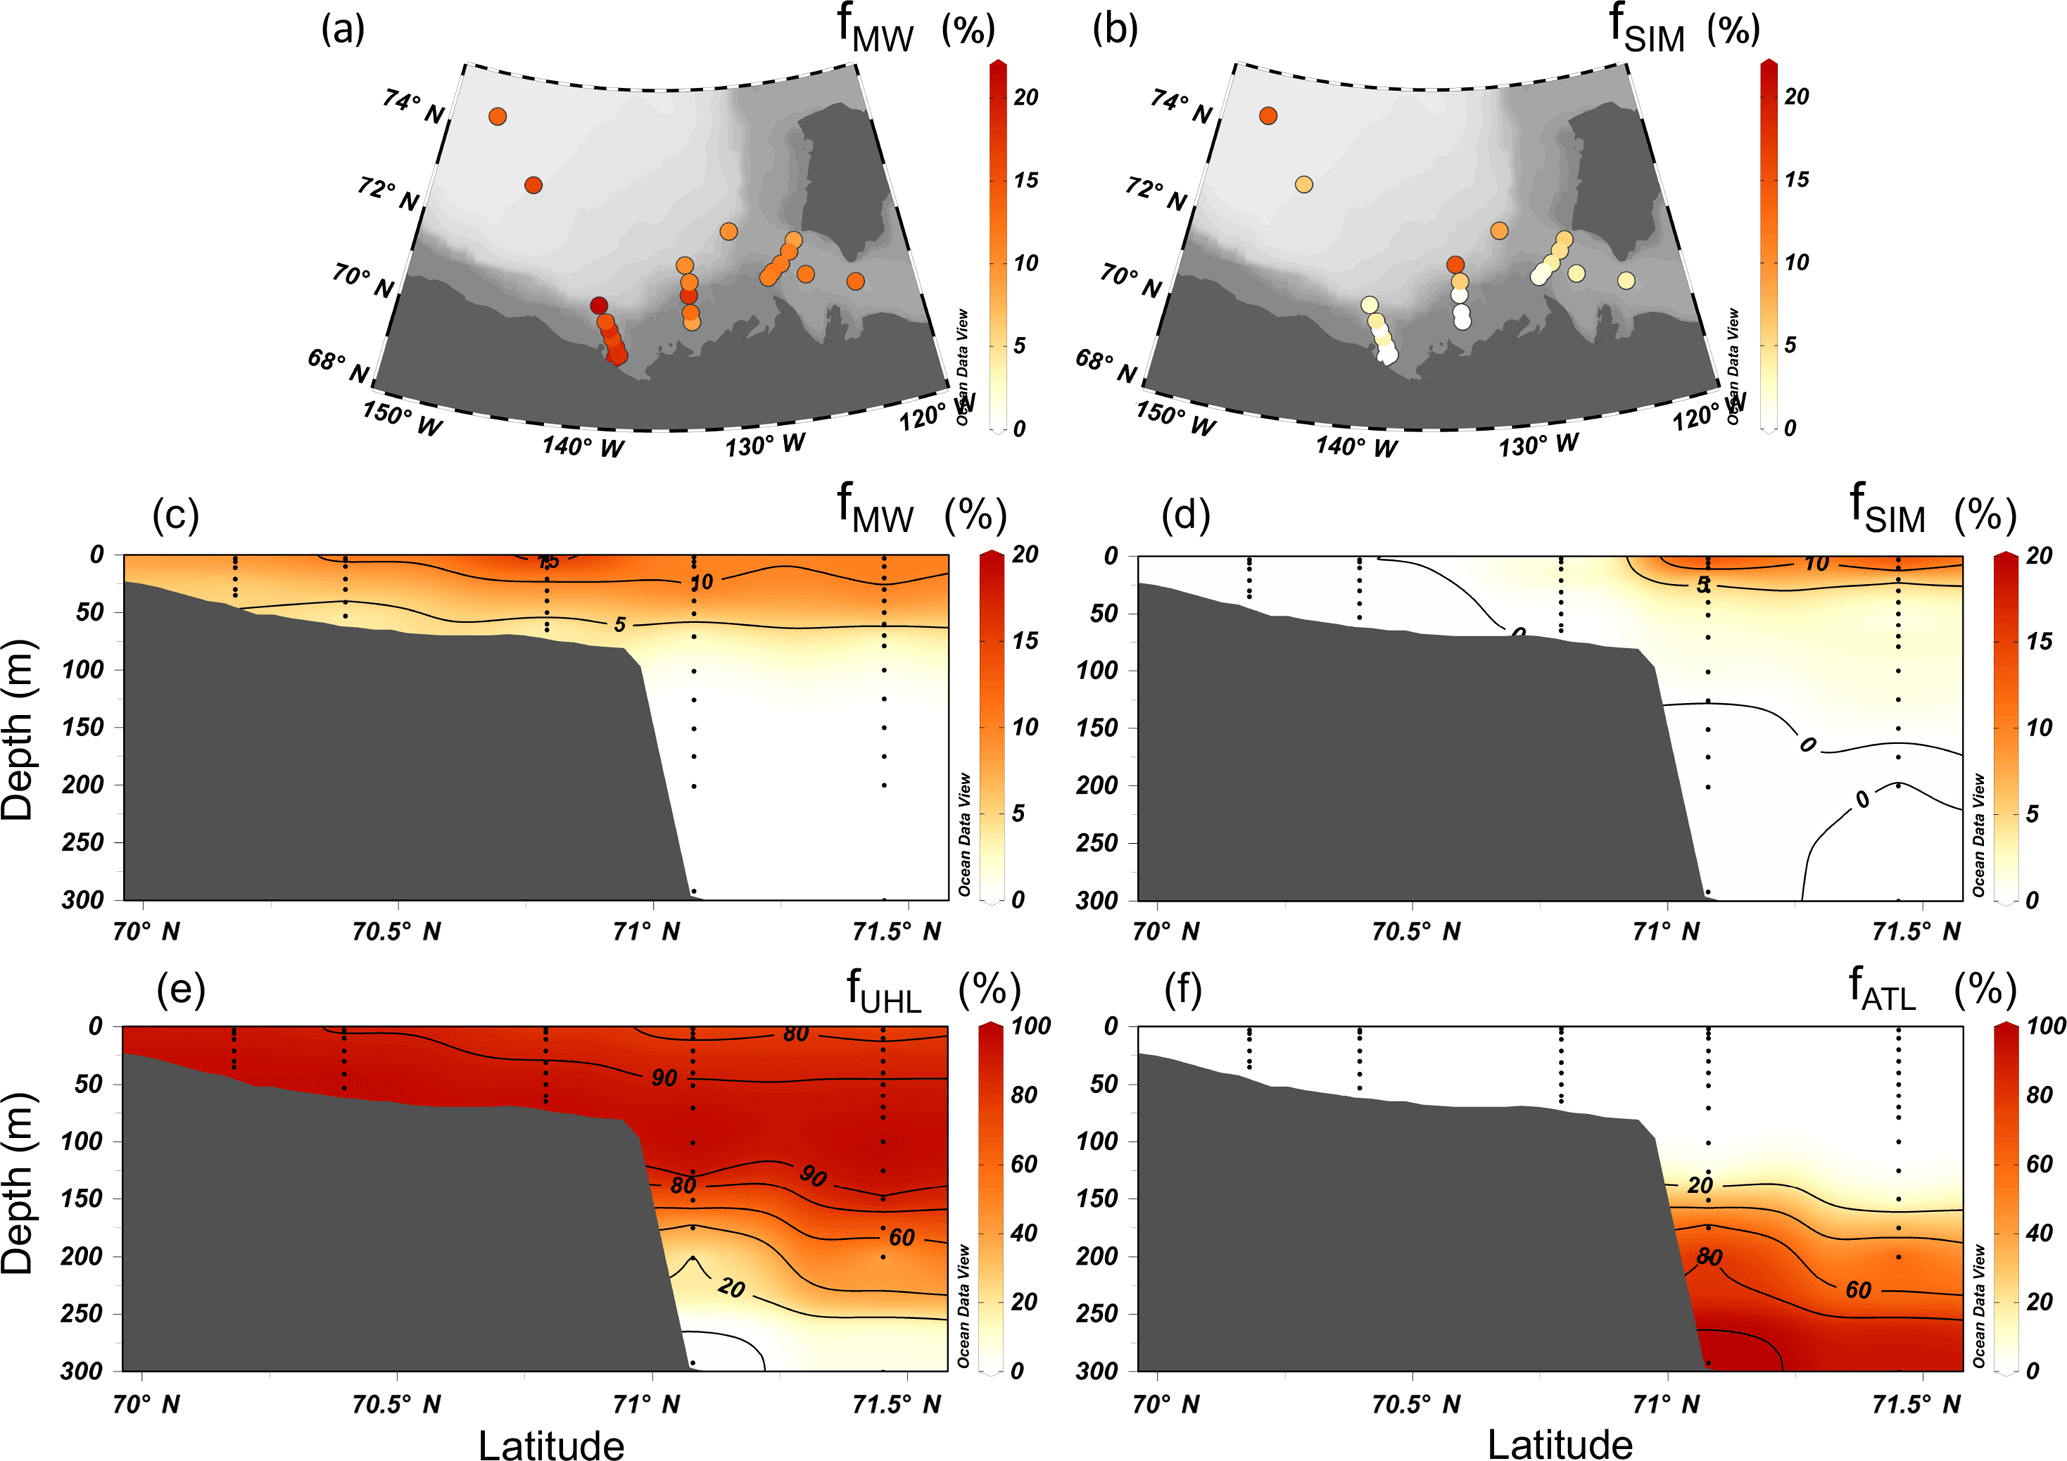
Figure 5Surface values of the fraction of (a) meteoric water (fMW) and (b) sea-ice melt (fSIM) at all stations in the study area. The fraction of (c) meteoric water (fMW), (d) sea-ice melt (fSIM), (e) upper halocline layer (fUHL), and (f) Atlantic water (fATL) in the top 300 m of the Mackenzie Shelf transect. Measurements are indicated by black dots.
Low pCO2 values are observed in the surface layer along the transect, ranging from 278 to 339 µatm. Beyond the shelf-break, pCO2 increases with depth to a maximum value of 749 µatm at around 125 m depth in the UHL (Fig. 4e). Below this depth, the pCO2 decreases gradually. Maximum values on the shelf of up to 665 µatm are found in the bottom layer (53 m depth). Measurements of δ13C-DIC show the expected pattern, with highest values of up to 1.50 ‰ in the surface or subsurface, due to photosynthesis and the preferential uptake of the lighter carbon isotope, and a decrease to minimum values of −0.5 ‰ in the DIC maximum layer in the deep basin and on the shelf bottom due to respiration of 13C-depleted organic matter. Maximum values of pCO2 and minimum values of δ13C-DIC are coincident on the shelf bottom and at depths of around 125 m beyond the shelf-break. The temperature effect on pCO2 is not overly important at these depths, as large variations in temperatures are most prominent in the top 30 m (Fig. 4a). Variations in pCO2 at these greater depths can be attributed to changes in DIC content (metabolic CO2 addition), as indicated by the depleted δ13C-DIC values at the same locations. The saturation state of the waters with respect to aragonite (ΩAr) and pH are also closely related to the DIC concentration and pCO2 levels, with the lowest values being observed along the shelf bottom and in the DIC maximum beyond the shelf-break (Fig. 4g and h). These parameters and the consequences for ocean acidification are discussed further in Sect. 4.4.
3.2 Water mass composition
Surface water composition varies greatly over the study region with large freshwater input from the Mackenzie River as well as significant sea-ice melt in the central Canada Basin (Fig. 5a and b). The strong impact of the Mackenzie River is seen easily, with fractions of meteoric water greater than 20 % observed over the shelf. The river plume is detectable (> 10 %) in the surface waters to the east into the Amundsen Gulf and far into the central Canada Basin. Sea-ice melt has the strongest influence in the central basin with fractions of ∼ 15 %, and substantial fractions of up to 10 % also seen near the shelf-break.
The fraction of water-mass types along the sampled transect on the Mackenzie Shelf are shown in Fig. 5c–f. High meteoric water content is seen over the shallow shelf region, as well as in the surface layer out into the deep basin. There is a notable intrusion of sea-ice melt water from the deep basin onto the shelf-break on the Mackenzie Shelf. This sea ice may be transported south on the eastern arm of the Beaufort Gyre and pushed onto the shelf. The UHL dominates at mid-depth, around 100 m, off the shelf, with large fractions (> 95 %) pushed up to shallower depths along the bottom of the shelf. Atlantic water is restricted to the deep layer beyond the shelf-break and did not intrude up onto the shallow shelf during our sampling period.
3.3 Wind forcing
Wind data were taken from the gridded reforecast data of the Canadian Meteorological Centre (Smith et al., 2014). The location selected is on the Mackenzie Shelf, near the middle of the transect located at 70.3125∘ N, 133.5937∘ W (Fig. 1). Figure 6 shows the wind direction and magnitude averaged every 6 hours during August and September of 2014. Oscillations between strong northerly and southerly winds are a prevalent feature. From 6 to 16 August, the wind field was dominated by northeasterly winds with magnitudes of > 20 m s−1. Between 26 August and 10 September, periods of strong southerly winds were interrupted by short periods of strong northerly winds with maximum velocities of > 50 m s−1 in both directions. The 14 to 16 and the 26 to 30 September were periods of sustained southeasterly winds reaching speeds of up to 40 m s−1. Sampling of the Mackenzie Shelf transect took place from 22 to 24 August, indicated by the red lines in Fig. 6. During that time, the wind direction was variable and wind speeds were comparably low. This sampling period followed both northeasterly and southeasterly winds throughout the beginning of the month.

Figure 6The 6 h averaged winds for August and September of 2014 on the Mackenzie Shelf (location 70.31∘ N, 133.59∘ W) from gridded reforecast data from the Canadian Meteorological Centre. Red lines indicate the period of 22 to 24 August in which sampling of the Mackenzie Shelf transect took place. Black dotted lines indicate the periods from 16 to 20 August when the greatest upwelling activity took place, and from 5 to 9 September when the greatest downwelling event occurred.
3.4 Mackenzie Shelf circulation
The modelled velocity, averaged in the top 10 m of the water column, on the Mackenzie Shelf is shown in Fig. 7a and b for two time periods displaying the two opposite modes of circulation observed during the study period in the fall of 2014. During the period from 16 to 20 August, surface water flows to the west along the Mackenzie Shelf. From 5 to 9 September, mean surface flow is towards the east. In the middle of the shelf, cross-shelf transport of surface water is evident at both times, with off-shelf flow from 16 to 20 August and on-shelf flow from 5 to 9 September. In both cases, the Cape Bathurst topography induces intensified surface currents in the mean direction of flow. Surface flow is also altered at the Mackenzie Trough, as topography becomes complex and the influence of the Mackenzie River is greatest. The modelled velocity at the 56 m depth horizon shows the strong influence of the shelf-break jet from both 16 to 20 August (Fig. 7c) going to the west and from 5 to 9 September (Fig. 7d) to the east. The water flow closely follows the topography of the shelf in both cases, shown clearly at the Mackenzie Trough, but also evident with cross-shelf movement through the middle of the sampled transect, most likely due to bathymetric changes at the Kugmallit Valley, a previously documented location of enhanced cross-shelf transport (Williams et al., 2008). Cross-shelf movement is also seen at several other locations along the shelf-break. From 16 to 20 August, the modelled velocity at the 92 m depth horizon shows an accelerated shelf-break jet (Fig. 7e). The velocity from 5 to 9 September at the 92 m depth horizon (Fig. 7f) shows the eastward flowing shelf-break jet of similar velocity as at 56 m depth.

Figure 7Modelled velocity in the top 10 m of the water column (a, b), at 56 m depth (c, d), and at 92 m depth (e, f) on the Mackenzie Shelf during two time periods, from 16 to 20 August (a, c, e) and from 5 to 9 September (b, d, f) in the fall of 2014. Red circles indicate the stations sampled as part of the Mackenzie Shelf transect.
Two opposite modes of circulation are shown to occur on the Mackenzie Shelf during the study period. From 16 to 20 August, the shelf-break jet flows to the west, whereas from 5 to 9 September it flows to the east. In the former case, it generates conditions conducive to upwelling along the shelf and produces an estuarine circulation, with relatively fresher water in the surface layer pushed off-shelf towards the basin and water at depth being brought onto the shelf. In the latter case, downwelling could take place, producing an anti-estuarine circulation, with water at the surface moving shoreward and denser water at depth moving out past the shelf-break. These two periods are investigated further to look at the upwelling and downwelling circulation in the fall of 2014.
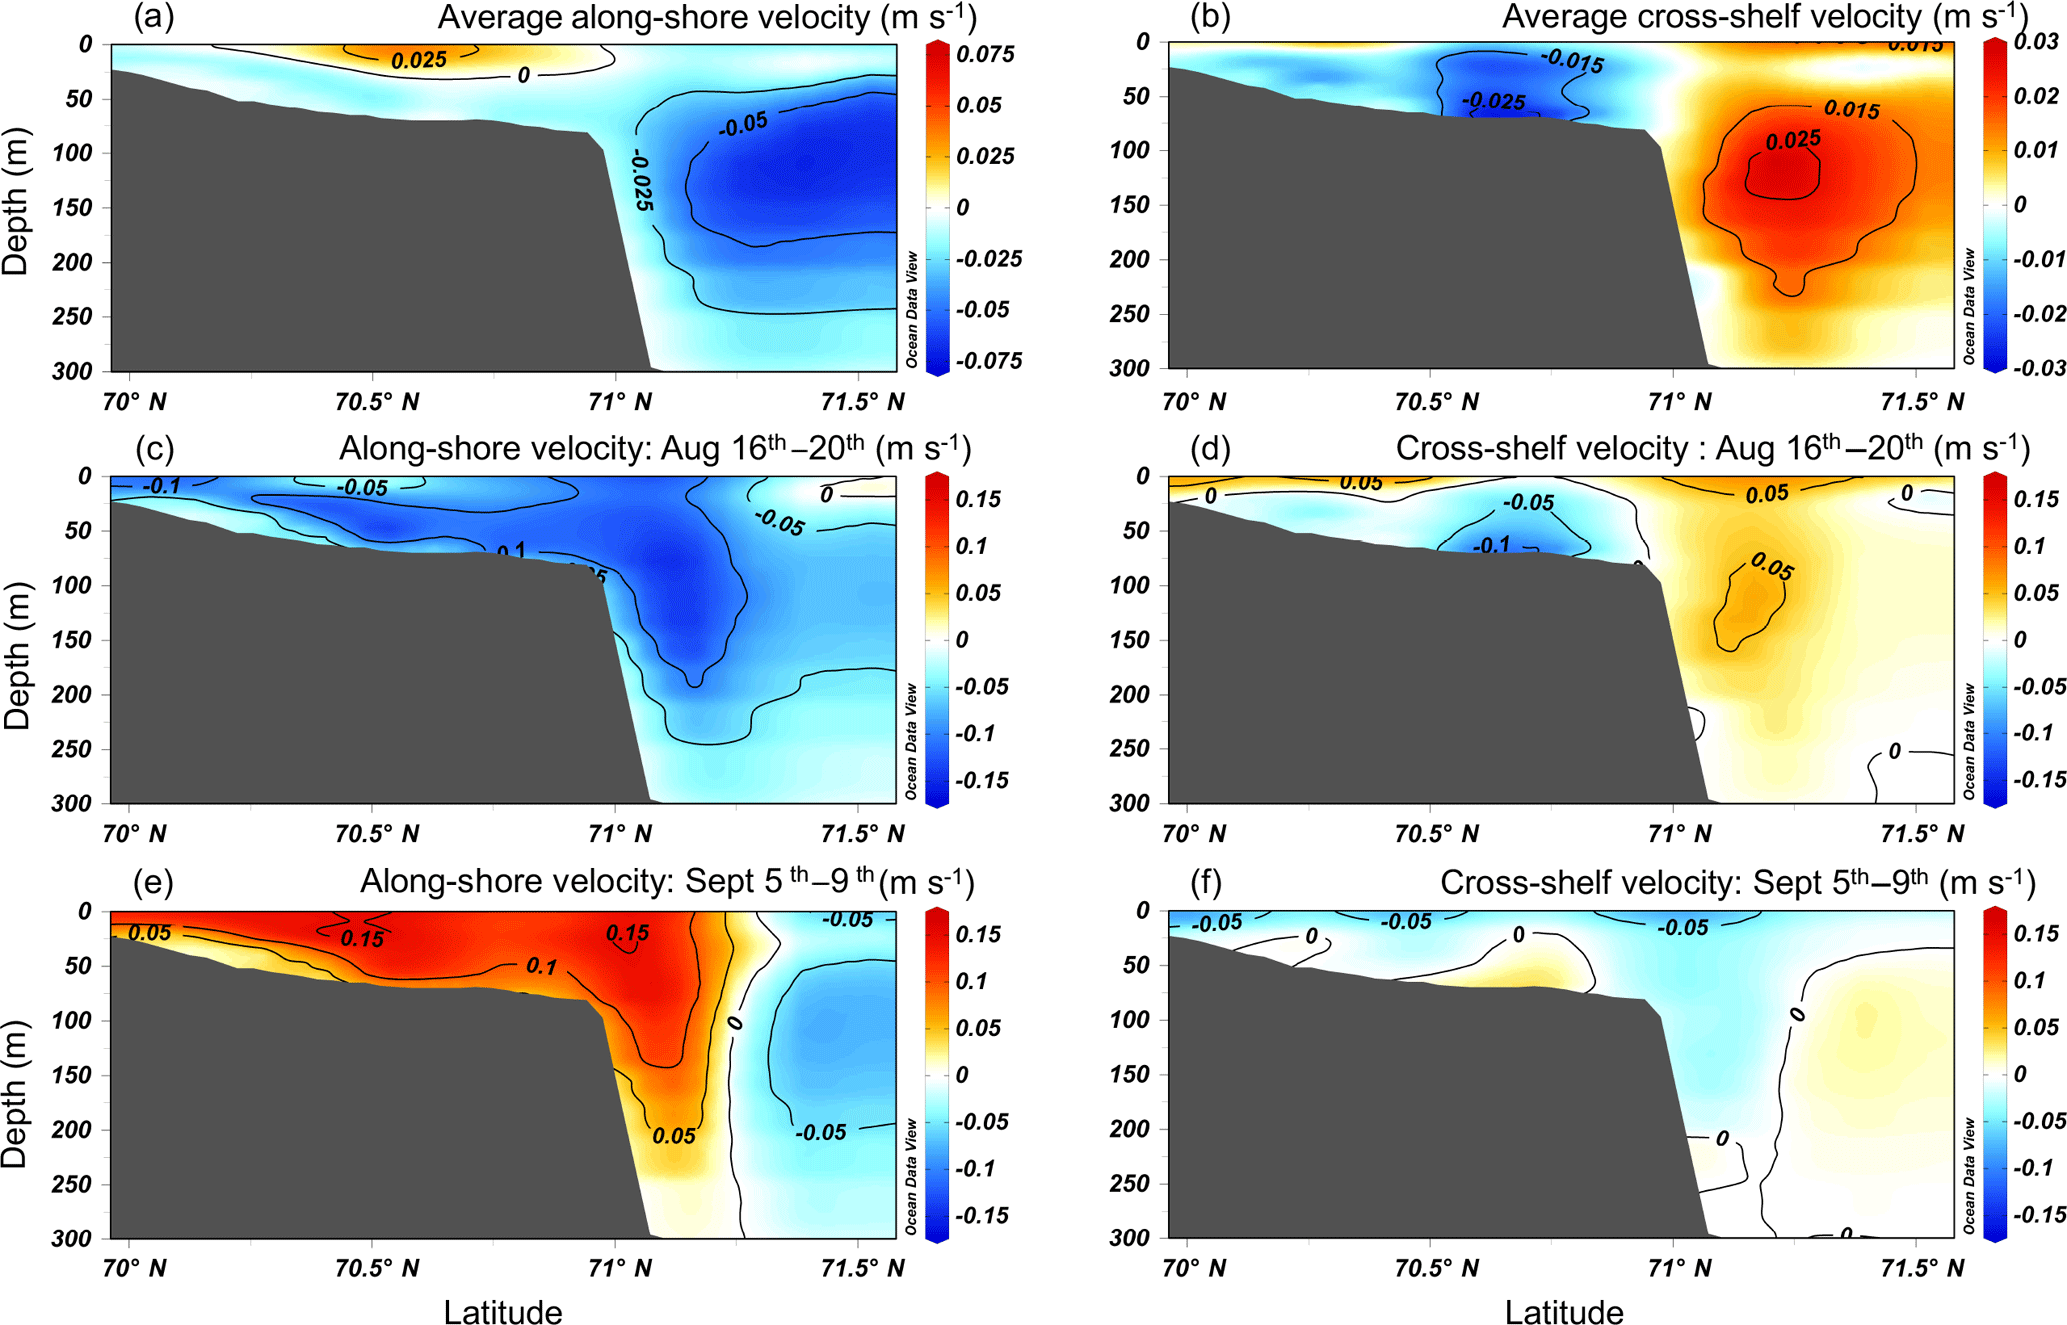
Figure 8The average (a) along-shore and (b) cross-shelf velocity on the Mackenzie Shelf transect during August and September of 2014, the (c) along-shore and (d) cross-shelf velocity from 16 to 20 August 2014, and the (e) along-shore and (f) cross-shelf velocity from 5 to 9 September. Positive values (red) indicate eastward along-shore flow (out of the plane) and off-shelf cross-shelf flow (to the right). Negative values (blue) indicate westward along-shore flow (into the plane) and on-shelf cross-shelf flow (to the left).
3.5 Velocity fields
The 2-month average, modelled velocities of the along-shore and cross-shelf flow for the Mackenzie Shelf transect are shown in Fig. 8a and b. The surface flow over the shelf is dominated by eastward along-shore flow. The westward flow of the Beaufort Gyre beyond the shelf-break is evident. The cross-shelf flow is primarily in the on-shelf direction over the shallow shelf and off-shelf beyond the shelf-break. Due to Ekman transport, westward flow towards the Alaskan Shelf is associated with upwelling onto the shelf. This situation is seen from 16 to 20 August with strong westward along-shore transport and velocities on the shelf and in the core of the shelf-break of > 0.15 m s−1 (Fig. 8c). This westward transport throughout the water column coincides with water velocities in the cross-shelf direction indicative of upwelling (Fig. 8d). Surface water over the shelf reaches velocities of > 0.08 m s−1 in the off-shelf direction in the top 5 m and flow remains in an off-shelf direction for much of the top 15 m of the water column. Below this surface layer, water flow over the shelf is in an on-shelf direction, reaching velocities of > 0.10 m s−1 at mid-depth (∼ 50 m). This upwelling flow is readily noted, with water at depth being moved onto the shelf and water at the surface moving out toward the shelf-break. Flow from the west towards the Amundsen Gulf is associated with downwelling transport off the shelf, a situation seen from 5 to 9 September (Fig. 8e and f). Along-shore velocity over the shelf and shelf-break is high, dominated by flow in the eastward direction over the entire shelf area, reaching values of > 0.16 m s−1 at the surface and decreasing with depth. The westward flow in the deep basin decreases and is pushed further beyond the shelf-break relative to the average along-shore pattern. The strong eastward flow over the shelf and shelf-break is associated with a small on-shelf transport at the surface (> 0.09 m s−1) and an off-shelf transport along the shelf bottom reaching velocities of > 0.03 m s−1. This cross-shelf velocity pattern shows a downwelling loop, with water at the surface pushed shoreward and water at depth moving out towards the shelf-break.
These modelled velocities are representative of 5-day averages for the region and thus do not show the peak velocities reached during the study period. The shelf-break jet or boundary current has been measured throughout the year at various locations along the Alaskan and Canadian Beaufort shelves. For example, Pickart et al. (2009) reported a bottom-intensified shelf-break jet flowing at ∼ 0.15 m s−1 to the east over a year-long mean across the shelf at 152∘ W, as similarly reported by Nikolopoulos et al. (2009). This value is the same as the maximum modelled velocities found in the core of the shelf-break jet through the sampled transect. Reversals of the shelf-break jet due to variations in wind forcing have been reported in numerous studies along the western and eastern Beaufort Shelf (e.g., Nikolopoulos et al., 2009; Pickart et al., 2013b; Dmitrenko et al., 2016). Measurements of velocity from moorings anchored in the same region across the Mackenzie Shelf slope, such as those analyzed in Forest et al. (2015) from September 2009 to August 2012, show current surges of 0.20 to 0.80 m s−1 with frequent oscillations in current direction. The mean velocities during this period at these moorings were 0.08 to 0.14 m s−1. These mean velocities are comparable in magnitude to velocities produced by the model for 5-day averages. It is likely that similarly strong surges in current velocity took place throughout the study period of August and September 2014 on the Mackenzie Shelf.
4.1 Along-shore volume transport
Along-shore water transport across the Mackenzie Shelf transect throughout the study period was estimated in the top 200 m of the water column through the 120 km (in the cross-shelf direction) section identified in Fig. 1 (Fig. 9a). Transport was calculated by taking the product of the depth-averaged modelled velocity and the depth and cross-shelf area between stations. Positive values indicate eastward flow, whereas negative values indicate westward flow. Maximum westward transport of 0.74 Sv through the Mackenzie Shelf transect took place from 16 to 20 August; maximum eastward transport of 0.89 Sv through the transect occurred from 5 to 9 September. In comparison, the transport of northward flowing water through the Bering Strait is approximately 1.1 Sv (Woodgate et al., 2012). The along-shelf transport through these two transects and the changes in transport direction are substantial.

Figure 9The along-shore transport through the Mackenzie Shelf transect for the study period of August and September 2014. (a) Shows the total integrated volume transport for 120 km in the cross-shelf direction, avoiding the permanent westward transport of the Beaufort Gyre. Transport at each station, with a 1 km cross-shelf distance, is shown in (b). Transports are calculated from 5-day averages of modelled velocity.
In August and September of 2014, the circulation along-shore changed from a strong flow to the west to a strong flow to the east and back again (Fig. 9). Correlation between along-shore wind in the northeasterly (southwesterly) direction and upwelling (downwelling) on the Mackenzie Shelf has been shown in numerous studies and models (e.g., Carmack and Kulikov, 1998; Yang et al., 2006; Mathis et al., 2012). In our study, the two largest upwelling episodes on the Mackenzie Shelf, 11 to 20 August and 15 to 24 September, were preceded by periods of strong (> 20 m s−1) and sustained northeasterly winds (Fig. 6). The largest downwelling episodes, from 31 August to 9 September, appear to be triggered by strong southwesterly winds (> 40 m s−1) and strong wind reversals throughout.
The oscillating along-shore water transport is dominated by changes over the slope, as evidenced by the transport calculated at the specific sampled station locations. Along-shore transport at the stations on the transect are calculated through the water column, to a maximum depth of 200 m, by taking the sum of the products of the along-shore modelled velocity and a cross-shelf distance of 1 km (Fig. 9b). Bottom depth was taken from the shipboard depth sounder when sampling took place. All three stations on the shelf (434, 432, and 428) as well as station 435 on the slope show the same oscillating change in along-shore transport. Station 421, located beyond the slope in the deep Canada Basin shows a negative total along-shore transport throughout the study period. This station is under the influence of the Beaufort Gyre, which is consistently flowing in a westward direction at this location. During the 2-month study period there is an oscillation between two dominant flow patterns represented by positive and negative total transport in the along-shore direction.
4.2 Cross-shelf carbon transport
Cross-shelf flux calculations were carried out for the Mackenzie Shelf transect to investigate the exchange of DIC and TA between the shelf and the deep basin. Fluxes were calculated by taking the product of linearly gridded DIC or TA measurements and cross-shelf velocity values from the ANHA4 simulation through the water column with an along-shore distance of 10 km. The DIC flux (mol C d−1 m−2) at the shelf stations for the period of the largest on-shelf flux are shown in Fig. 10. From 16 to 20 August, during the period of greatest westward along-shore transport, the cross-shelf DIC flux is off-shore at all stations in the top 10 to 25 m of the water column, reaching values of 16.7×10³ mol C d−1 m−2 (TA flux: 18.1×10³ mol TA d−1 m−2) at station 432. The DIC flux is on-shelf below the surface layer, with stations 434 and 432 having maximum on-shelf fluxes at mid-depth. At station 428, the on-shelf flux reaches values of 16.9×10³ mol C d−1 m−2 (TA flux: 17.4×10³ mol TA d−1 m−2) near the bottom of the water column. This on-shelf flux near the ocean floor transports water sourced from the UHL, bringing metabolite-rich water and DIC onto the shelf.
The excess DIC brought onto the shelf and its impact on the pCO2 and pH depends on the amount and composition of the source-water. The DIC : TA ratio in the water being moved along the bottom of the shelf is a parameter that provides insight into the carbonate system properties of the water mass. At stations 434, 432, and 428 on the shelf, the DIC : TA ratio changes significantly with depth. Water being upwelled (Fig. 10; negative DIC flux) has DIC : TA ratios greater than 0.975 at all three stations. In other words, excess DIC is being upwelled, contributing to increased pCO2 and decreased pH and ΩAr levels of the shelf bottom waters. The DIC : TA ratio in the latter is higher than the ratio in the surface waters (0.92 to 0.93) being moved out towards the Canada Basin. During the time of measurement, surface pCO2 levels along the Mackenzie Shelf transect remained low, ranging from 278 to 339 µatm, allowing for the uptake of CO2 by the surface ocean.
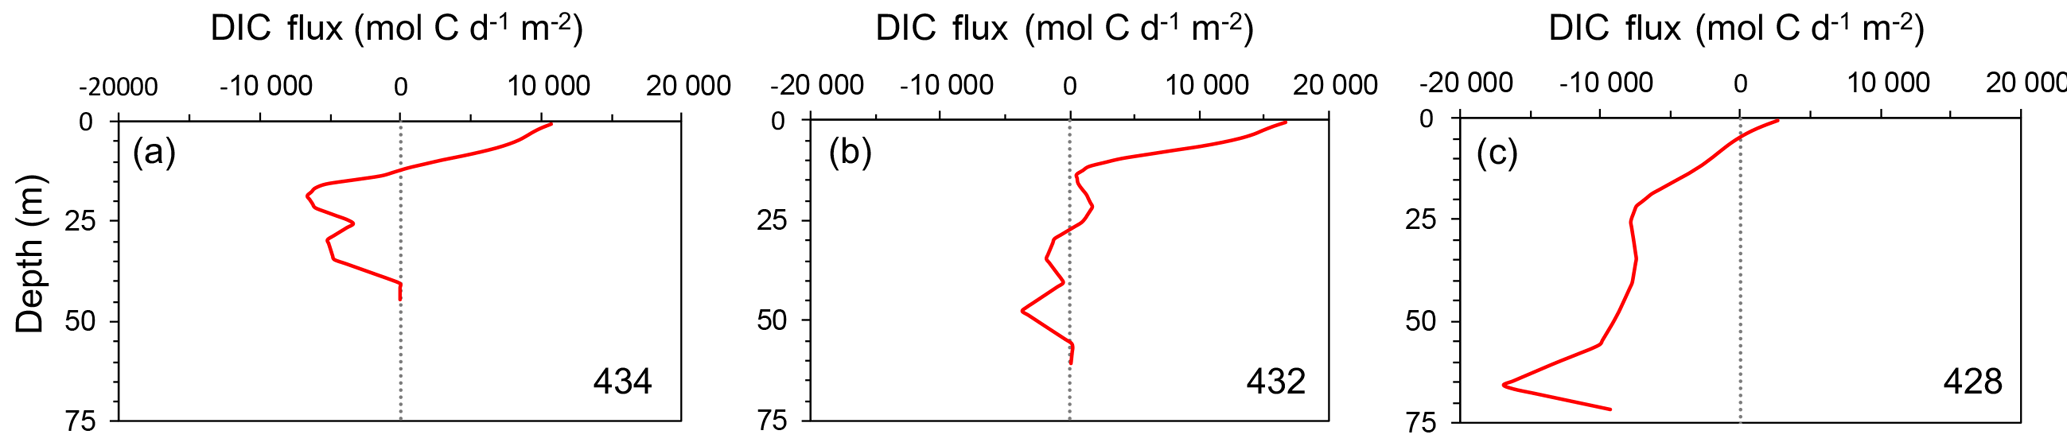
Figure 10Cross-shelf fluxes of DIC (mol C d−1 m−2) at stations (a) 434, (b) 432, and (c) 428 on the Mackenzie Shelf. Positive values indicate off-shelf fluxes and negative values indicate on-shelf fluxes.
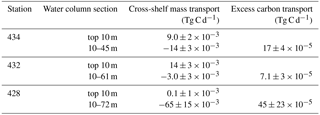
Cross-shelf mass transport of carbon was calculated for the three shelf stations (434, 432, and 428) from 16 to 20 August (Table 2). These transports are integrated through a 10 km along-shore distance to include the area of the shelf influenced by similar water movement. From 16 to 20 August, when the along-shore flow was westward, the cross-shelf transport should have led to an upwelling flow over the shelf. As expected by the cross-shelf velocity in Fig. 8d, transport in the top 10 m at all three stations is off-shelf, reaching a maximum of Tg C d−1. Below the surface layer, the cross-shelf transport is on-shelf, with maximum transport at station 428 of Tg C d−1.
Table 2Cross-shelf mass transports (Tg C d−1) and excess carbon transport (relative to a pCO2 of 400 µatm) calculated from measurements of DIC on the Mackenzie Shelf transect for the three shelf stations. The integrated mass transport is shown for both the top 10 m at each station and the full water column below the top 10 m with an along-shore distance of 10 km. Positive values indicate off-shelf transport; negative values indicate on-shelf transport.
From 6 to 16 August, strong northeasterly winds were present over the shelf region, but had shifted to an easterly direction by the time sampling took place and through 22 August. Although no results from a coupled physical-biogeochemical model were available, it seems probable from the wind and physical sampling data that upwelling on the Mackenzie Shelf began around 6 August and continued through to the 22 August. From the analysis of the hydrodynamic model, there are two periods, lasting longer than 10 days in August and September of 2014 (approximately 10 to 28 August and 14 to 29 September), during which the cross-shelf transport brings water from beyond the shelf-break onto the Mackenzie Shelf. During these episodes, water from the DIC-rich UHL is brought onto the Mackenzie Shelf. The period of off-shelf transport lasts for ∼ 15 days in the region, offsetting the on-shelf flux of these waters and carrying remineralization products (metabolites) back to the deep basin. Nevertheless, the average transport through the 2 months carries water onto the shelf. This long-term upwelling activity acidifies the shelf bottom waters and may impact the air–sea exchange of CO2 due to the large air–sea pCO2 difference, including altering the sink or source status of the shelf. Surface waters with high meteoric water content are delivered beyond the shelf-break into the Beaufort Gyre as upwelling takes place.

Figure 11Distributions of (a) DIC, (b) TA, and (c) δ13C-DIC on the Mackenzie Shelf transect. Black boxes indicate depth of 50 m at stations 432, 428, and 435. Measurements are indicated by black dots. Chemical gradients at the 50 m depth horizon along the transect are shown in (d) and (e).
4.3 Impacts of upwelling on carbonate chemistry
The result of upwelling on the shelf is reflected by gradients of DIC, TA, and δ13C-DIC across the shelf (Fig. 11a–d). The on-shore transport of deeper water is evident when comparing the values at the 50 m depth horizon across the three identified stations. The onshore gradients for DIC and TA are −1.98 and −0.87 µmol kg−1 m−1, respectively. The DIC : TA ratio of these gradients is 2.28, meaning that more DIC, relative to TA, is brought onto the shelf. This is important because a higher DIC : TA ratio translates into an increased pCO2 of the water as well as a decrease in the pH and the saturation state of the water with respect to carbonate minerals. If these waters are brought to the surface by upwelling or vertical mixing, the net flux of CO2 over the shelf region may be altered. Outgassing may occur, releasing CO2 to the atmosphere, or the uptake of CO2 by the surface ocean may be suppressed. Although surface pCO2 was undersaturated with respect to the atmosphere when sampling took place, outgassing or a bloom may have occurred before sampling at the height of this upwelling period. The gradient of δ13C-DIC across the shelf is positive (Fig. 11c and d), opposite to that of DIC and TA. The δ13C-DIC values reach minima along the shelf bottom, reflecting the signature of UHL source water and remineralization products on the shelf.
To investigate the delivery of DIC to the shallow shelf, the effects on the source or sink status of the shelf, the pH conditions, the excess DIC (DICex), and excess protons (H at 50 m depth were calculated relative to those of a parcel of water of identical TA, temperature, and salinity in equilibrium with the atmosphere at a pCO2 of 400 µatm (following the methods of Burt et al., 2013):
The gradient in DICex is −1.19 µmol kg−1 km−1 and the gradient in H is −0.09 nmol kg−1 km−1 (Fig. 11e). Both quantities display negative gradients with positive values closer to shore along the shelf bottom at station 432, where DICex reaches a value of 51.4 µmol kg−1 and H reaches a value of 4.57 nmol kg−1. If this shelf water is upwelled, the surface water pCO2 and pH conditions will be altered, lowering the pH and raising the pCO2 at the surface leading to outgassing. At station 432 there is excess DIC in the water column and an on-shore water movement from 35 to 55 m depth. The total on-shore cross-shelf mass transport of DICex (relative to a pCO2 of 400 µatm) during the upwelling event from 16 to 20 August at the three shelf stations is shown in the last column of Table 2.
4.4 Ocean acidification
Distinguishing the ocean acidification signal in the Arctic is complicated because of the interplay of several changing environmental conditions including warming, sea-ice loss, surface freshening, and changes in primary production (Carmack et al., 2016). During sampling, a layer of high pCO2 and low pH water resided at depth on the shelf (Fig. 4e and h), having been upwelled from beyond the shelf-break onto the shelf. This bottom layer is sourced from the UHL where a DIC maximum consistently resides beyond the shelf-break (Anderson et al., 2010; Yamamoto-Kawai et al., 2013). The UHL source-water is of Pacific origin, and is preconditioned before entering the Arctic to have low ΩAr values (Yamamoto-Kawai et al., 2013). This water is seen in Fig. 3e and f, centred at a salinity of 33.1 and a temperature minimum, as having pCO2 values over 600 µatm and ΩAr as low as 0.83. This water can be corrosive to the mineral skeletons and shells of CaCO3-secreting organisms such as bivalves, mollusks, and echinoderms, with varying impacts on different organisms (Ries et al., 2011). These conditions can also have negative impacts on community structure and recruitment that may carry through to higher trophic levels (Fabry et al., 2008). In our study area, the undersaturated water mass is not at the surface over the shelf, but sustained periods of upwelling could bring this high pCO2 water to the surface and outgas CO2 to the atmosphere (e.g., Mucci et al., 2010; Mathis et al., 2012). An outgassing event following wind-induced upwelling on the Alaskan Beaufort Shelf was documented by Mathis et al. (2012). This was a 10-day event that brought water of ΩAr<1.0 to the surface over the Beaufort Shelf. Likewise, upwelling of elevated pCO2 (522±37 µatm) UHL water at Cape Bathurst was captured by Mucci et al. (2010). In the present study, sampling took place just after a suspected strong upwelling event. Aragonite undersaturated waters with high pCO2 were restricted to depths of greater than 20 m over the shelf at the time of sampling. A strong upwelling wind event could easily have brought this water to the surface and created events like those described by Mucci et al. (2010) and Mathis et al. (2012).
Carbonate system parameters were measured in the Beaufort Sea during August and September of 2014. The cross-shelf transport of DIC during an upwelling event was estimated using the velocity fields from output of the ANHA4 simulation. The upwelling period from 16 to 20 August displayed an off-shelf transport in the surface layer of Tg C d−1 and a corresponding on-shelf transport in the subsurface of Tg C d−1, bringing water from the UHL onto the shelf. The upwelled UHL water alters the carbonate chemistry of bottom waters and, given its high DIC : TA ratio (> 0.975), poses a potential threat to calcifying organisms. Upwelling of this CO2-enriched (pCO2>600 µatm) water to the surface could change the net flux of CO2 across the air–sea interface over the shelf, with possible outgassing of CO2 or a suppression of the uptake of CO2. The mean circulation through the 2 study months showed upwelling to be the dominant process, but changes in circulation seem to be common in this region, with both estuarine and anti-estuarine dynamics taking place.
It is important to look at how these 2 months are representative of other years, and of other times of the year as well. Future monitoring should be carried out at a higher frequency (or continuously) to catch the system in its different modes of upwelling or downwelling. This would provide a more accurate picture of where nutrients, DIC, and metabolites are cycled with these strong current reversals. Models like the ANHA4 simulation used in this study can be used to forecast upwelling on the shelf and help determine how carbon cycling will be altered by these events. Combining our results with datasets obtained from moorings and in situ measurement platforms could improve estimates of carbon budgets in these traditionally hard to reach areas.
Chemical and metadata used in this paper from discrete bottle samples, including dissolved inorganic carbon, total alkalinity, δ18O-H2O, δ13C-DIC, temperature, and salinity, can be found at https://doi.pangaea.de/10.1594/PANGAEA.886238 (Thomas and Mol, 2018). For further details on the ANHA4 model or for model output please contact Paul G. Myers at the University of Alberta.
The authors declare that they have no conflict of interest.
We thank the captain and crew of the CCGS Amundsen for their support
and cooperation during field work. We are grateful to Pascal Guillot for the
collection and processing of CTD data. We thank William Burt and Jonathan
Lemay for help with sample analysis. This work was supported by the National
Science and Engineering Research Council of Canada, ArcticNet, and
GEOTRACES.
Edited by: Minhan
Dai
Reviewed by: three anonymous referees
Aagaard, K.: A synthesis of the Arctic Ocean circulation, Rapp. P.-v. Reun. Cons. int. Explor. Mer., 188, 11–22, 1989.
Aagaard K. and Carmack, E. C.: The role of sea ice and other fresh water in the Arctic circulation, J. Geophys. Res.-Oceans, 94, 14485–14498, https://doi.org/10.1029/JC094iC10p14485, 1989.
Anderson, L. G. and Macdonald, R. W.: Observing the Arctic Ocean carbon cycle in a changing environment, Polar Res., 34, 26891, https://doi.org/10.3402/polar.v34.26891, 2015.
Anderson, L. G., Tanhua, T., Björk, G., Hjalmarsson, S., Jones, E. P., Jutterström, S., Rudels, B., Swift, J. H., and Wåhlstöm, I.: Arctic ocean shelf-basin interaction: An active continental shelf CO2 pump and its impact on the degree of calcium carbonate solubility, Deep-Sea Res. Pt. I, 57, 869–879, https://doi.org/10.1016/j.dsr.2010.03.012, 2010.
Bamber, J., van den Broeke, M., Ettema, J., Lenaerts, J., and Rignot, E.: Recent large increases in freshwater fluxes from Greenland into the North Atlantic, Geophys. Res. Lett., 39, L19501, https://doi.org/10.1029/2012GL052552, 2012.
Bates, N. R.: Air-sea CO2 fluxes and the continental shelf pump of carbon in the Chukchi Sea adjacent to the Arctic Ocean, J. Geophys. Res.-Oceans, 111, C10013, https://doi.org/10.1029/2005JC003083, 2006.
Borges, A. V.: Do we have enough pieces of the jigsaw to integrate CO2 fluxes in the coastal ocean?, Estuaries, 28, 3–27, 2005.
Brown, K. A., McLaughlin, F., Tortell, P. D., Yamamoto-Kawai, M., and Francois, R.: Sources of dissolved inorganic carbon to the Canada Basin halocline: A multitracer study, J. Geophys. Res.-Oceans, 121, 2918–2936, https://doi.org/10.1002/2015JC011535, 2016.
Burt, W. J., Thomas, H., and Auclair, J.-P.: Short-lived radium isotopes on the Scotian Shelf: Unique distribution and tracers of cross-shelf CO2 and nutrient transport, Mar. Chem., 156, 120–129, https://doi.org/10.1016/j.marchem.2013.05.007, 2013.
Carmack, E. and Chapman, D. C.: Wind-driven shelf/basin exchange on an Arctic shelf: The joint roles of ice cover extent and shelf-break bathymetry, Geophys. Res. Lett., 30, 1778, https://doi.org/10.1029/2003GL017526, 2003.
Carmack, E. and Wassmann, P.: Food webs and physical-biological coupling on pan-Arctic shelves: Unifying concepts and comprehensive perspectives, Prog. Oceanogr., 71, 446–477, https://doi.org/10.1016/j.pocean.2006.10.004, 2006.
Carmack, E. C. and Kulikov, E. A.: Wind-forced upwelling and internal Kelvin wave generation in Mackenzie Canyon, Beaufort Sea, J. Geophys. Res.-Oceans, 103, 18447–18458, https://doi.org/10.1029/98JC00113, 1998.
Carmack, E. C., Yamamoto-Kawai, M., Haine, T. W. N., Bacon, S., Bluhm, B. A., Lique, C., Melling, H., Polyakov, I. V., Straneo, F., Timmermans, M.-L., and Williams, W. J.: Freshwater and its role in the Arctic Marine System: Sources, disposition, storage, export, and physical and biogeochemical consequences in the Arctic and global oceans, J. Geophys. Res.-Biogeo., 121, 675–717, https://doi.org/10.1002/2015JG003140, 2016.
Cooper, L. W., McClelland, J. W., Holmes, R. M., Raymond, P. A., Gibson, J. J., Guay, C. K., and Peterson, B. J.: Flow-weighted values of runoff tracers (δ18O, DOC, Ba, alkalinity) from the six largest Arctic rivers, Geophys. Res. Lett., 35, L18606, https://doi.org/10.1029/2008GL035007, 2008.
Dai, A., Qian, T., Trenberth, K. E., and Milliman, J. D.: Changes in continental freshwater discharge from 1948 to 2004, J. Climate, 22, 2773–2792, https://doi.org/10.1175/2008JCLI2592.1, 2009.
Dickson, A. G. and Millero, F. J.: A comparison of the equilibrium constants for the dissociation of carbonic acid in seawater media, Deep-Sea Res. Pt. I, 34, 1733–1743, https://doi.org/10.1016/0198-0149(87)90021-5, 1987.
Dickson, A. G., Sabine, C. L., and Christian, J. R.: Guide to best practices for ocean CO2 measurements, Tech. rep., PICES Special Publication 3, 2007.
Dmitrenko, I. A., Kirillov, S. A., Forest, A., Gratton, Y., Volkov, D. L., Williams, W. J., Lukovich, J. V., Belanger, C., and Barber, D. G.: Shelfbreak current over the Canadian Beaufort Sea continental slope: Wind-driven events in January 2005, J. Geophys. Res.-Oceans, 121, 2447–2468, https://doi.org/10.1002/2015JC011514, 2016.
Doxaran, D., Devred, E., and Babin, M.: A 50 % increase in the mass of terrestrial particles delivered by the Mackenzie River into the Beaufort Sea (Canadian Arctic Ocean) over the last 10 years, Biogeosciences, 12, 3551–3565, https://doi.org/10.5194/bg-12-3551-2015, 2015.
Else, B. G. T., Papakyriakou, T. N., Asplin, M. G., Barber, D. G., Galley, R. J., Miller, L. A., and Mucci, A.: Annual cycle of air-sea CO2 exchange in an Arctic Polynya Region, Global Biogeochem. Cy., 27, 388–398, https://doi.org/10.1002/gbc.20016, 2013.
Fabry, V. J., Seibel, B. A., Feely, R. A., and Orr, J. C.: Impacts of ocean acidification on marine fauna and ecosystem processes, ICES J. Mar. Sci., 65, 414–432, https://doi.org/10.1093/icesjms/fsn048, 2008.
Fichefet, T. and Maqueda, M.: Sensitivity of a global sea ice model to the treatment of ice thermodynamics and dynamics, J. Geophys. Res.-Oceans, 102, 12609–12646, https://doi.org/10.1029/97JC00480, 1997.
Forest, A., Sampei, M., Hattori, H., Makabe, R., Sasaki, H., Fukuchi, M., Wassmann, P., and Fortier, L.: Particulate organic carbon fluxes on the slope of the Mackenzie Shelf (Beaufort Sea): Physical and biological forcing of shelf-basin exchanges, J. Marine Syst., 68, 39–54, https://doi.org/10.1016/j.jmarsys.2006.10.008, 2007.
Forest, A., Osborne, P. D., Fortier, L., Sampei, M., and Lowings, M. G.: Physical forcings and intense shelf-slope fluxes of particulate matter in the halocline waters of the Canadian Beaufort Sea during winter, Cont. Shelf Res., 101, 1–21, https://doi.org/10.1016/j.csr.2015.03.009, 2015.
Gattuso, J.-P., Frankignoulle, M., and Wollast, R.: Carbon and carbonate metabolism in coastal aquatic systems, Annu. Rev. Ecol. Syst., 29, 405–434, https://doi.org/10.1146/annurev.ecolsys.29.1.405, 1998.
Jones, E. P. and Anderson, L. G.: On the origin of the chemical properties of the Arctic Ocean halocline, J. Geophys. Res.-Oceans, 91, 10759–10767, https://doi.org/10.1029/JC091iC09p10759, 1986.
Jones, E. P., Anderson, L. G., and Swift, J. H.: Distribution of Atlantic and Pacific waters in the upper Arctic Ocean: Implications for circulation, Geophys. Res. Lett., 25, 765–768, https://doi.org/10.1029/98GL00464, 1998.
Lansard, B., Mucci, A., Miller, L. A., Macdonald, R. W., and Gratton, Y.: Seasonal variability of water mass distribution in the southeastern Beaufort Sea determined by total alkalinity and δ18O, J. Geophys. Res.-Oceans, 117, C03003, https://doi.org/10.1029/2011JC007299, 2012.
Lewis, E. and Wallace, D. W. R.: Program developed for CO2 systems calculations, ORNL/CDIAC 105, Carbon Dioxide Information Analysis Center, Oak Ridge National Laboratory US Department of Energy, Oak Ridge, Tennessee, 1998.
Madec, G.: NEMO ocean engine. Note du Pôle de modélisation, Institut Pierre-Simon Laplace (IPSL), France, No 27, ISSN 1288-1619, 2008.
Masina, S., Storto, A., Ferry, N., Valdivieso, M., Haines, K., Balmaseda, M., Zuo, H., Drevillon, M., and Parent, L.: An ensemble of eddy-permitting global ocean reanalyses from the MyOcean project, Clim. Dynam., 49, 813–841, https://doi.org/10.1007/s00382-015-2728-5, 2015.
Mathis, J. T., Pickart, R. S., Hansell, D. A., Kadko, D., and Bates, N. R.: Eddy transport of organic carbon and nutrients from the Chukchi Shelf: Impact on the upper halocline of the western Arctic Ocean, J. Geophys. Res.-Oceans, 112, C05011, https://doi.org/10.1029/2006JC003899, 2007.
Mathis, J. T., Pickart, R. S., Byrne, R. H., McNeil, C. L., Moore, G. W. K., Juranek, L. W., Liu, X., Ma, J., Easley, R. A., Elliot, M. M., Cross, J. N., Reisdorph, S. C., Bahr, F., Morison, J., Lichendorf, T., and Feely, R. A.: Storm-induced upwelling of high pCO2 waters onto the continental shelf of the western Arctic Ocean and implications for carbonate mineral saturation states, Geophys. Res. Lett., 39, L07606, https://doi.org/10.1029/2012GL051574, 2012.
McClelland, J. W., Holmes, R. M., Dunton, K. H., and Macdonald, R. W.: The Arctic Ocean Estuary, Estuaries Coasts, 35, 353–368, https://doi.org/10.1007/s12237-010-9357-3, 2012.
McLaughlin, F., Carmack, E., Proshutinsky, A., Krishfield, R. A., Guay, C., Yamamoto-Kawai, M., Jackson, J. M., and Williams, B.: The rapid response of the Canada Basin to climate forcing: From bellwether to alarm bells, Oceanography, 24, 146–159, https://doi.org/10.5670/oceanog.2011.66, 2011.
Mehrbach, C., Culberson, C. H., Hawley, J. E., and Pytkowicz, R. M.: Measurement of the apparent dissociation constants of carbonic acid in seawater at atmospheric pressure, Limnol. Oceanogr., 18, 897–907, https://doi.org/10.4319/lo.1973.18.6.0897, 1973.
Melling, H.: The formation of a haline shelf front in wintertime in an ice-covered arctic sea, Cont. Shelf Res., 13, 1123–1147, https://doi.org/10.1016/0278-4343(93)90045-Y, 1993.
Mucci, A., Lansard, B., Miller, L. A., and Papakyriakou, T. N.: CO2 fluxes across the air-sea interface in the southeastern Beaufort Sea: Ice-free period, J. Geophys. Res., 115, C04003, https://doi.org/10.1029/2009JC005330, 2010.
Nikolopoulos, A., Pickart, R. S., Fratantoni, P. S., Shimada, K., Torres, D. J., and Jones, E. P.: The western Arctic boundary current at 152∘ W: Structure, variability, and transport, Deep-Sea Res. Pt. II, 56, 1164–1181, https://doi.org/10.1016/j.dsr2.2008.10.014, 2009.
Pickart, R. S.: Shelfbreak circulation in the Alaskan Beaufort Sea: Mean structure and variability, J. Geophys. Res.-Oceans, 109, C04024, https://doi.org/10.1029/2003JC001912, 2004.
Pickart, R. S., Moore, G. W. K., Torres, D. J., Fratantoni, P. S., Goldsmith, R. A., and Yang, J.: Upwelling on the continental slope of the Alaskan Beaufort Sea: Storms, ice, and oceanographic response, J. Geophys. Res.-Oceans, 114, C00A13, https://doi.org/10.1029/2008JC005009, 2009.
Pickart, R. S., Schulze, L. M., Moore, G. W. K., Charette, M. A., Arrigo, K. R., van Dijken, G., and Danielson, S. L.: Long-term trends of upwelling and impacts on primary productivity in the Alaskan Beaufort Sea, Deep-Sea Res. Pt. I, 79, 106–121, https://doi.org/10.1016/j.dsr.2013.05.003, 2013a.
Pickart, R. S., Spall, M. A., and Mathis, J. T.: Dynamics of upwelling in the Alaskan Beaufort Sea and associated shelf-basin fluxes, Deep-Sea Res. Pt. I, 76, 35–51, https://doi.org/10.1016/j.dsr.2013.01.007, 2013b.
Rabe, B., Karcher, M., Schauer, U., Toole, J. M., Krishfield, R. A., Pisarev, S., Kauker, F., Gerdes, R., and Kikuchi, T.: An assessment of Arctic Ocean freshwater content changes from the 1990s to the 2006–2008 period, Deep-Sea Res. Pt. I, 58, 173-185, https://doi.org/10.1016/j.dsr.2010.12.002, 2011.
Ries, J. B.: Skeletal mineralogy in a high-CO2 world, J. Exp. Mar. Biol. Ecol., 403, 54–64, https://doi.org/10.1016/j.jembe.2011.04.006, 2011.
Rudels, B., Anderson, L. G., and Jones, E. P.: Formation and evolution of the surface mixed layer and halocline of the Arctic Ocean, J. Geophys. Res.-Oceans, 101, 8807–8821, https://doi.org/10.1029/96JC00143, 1996.
Shadwick, E. H., Thomas, H., Chierici, M., Else, B., Fransson, A., Michel, C., Miller, L. A., Mucci, A., Niemi, A., Papakyriakou, T. N., and Tremblay, J.-E.: Seasonal variability of the inorganic carbon system in the Amundsen Gulf region of the southeastern Beaufort Sea, Limnol. Oceanogr., 56, 303–322, https://doi.org/10.4319/lo.2011.56.1.0303, 2011a.
Shadwick, E. H., Thomas, H., Gratton, Y., Leong, D., Moore, S. A., Papakyriakou, T., and Prowe, A. E. F.: Export of Pacific carbon through the Arctic Archipelago to the North Atlantic, Cont. Shelf Res., 31, 806–816, https://doi.org/10.1016/j.csr.2011.01.014, 2011b.
Shadwick, E. H., Trull, T. W., Thomas, H., and Gibson, J. A. E.: Vulnerability of polar oceans to anthropogenic acidification: Comparison of Arctic and Antarctic seasonal cycles, Sci. Rep., 3, 2339, https://doi.org/10.1038/srep02339, 2013.
Smith, G. C., Roy, F., Mann, P., Dupont, F., Brasnett, B., Lemieux, J.-F., Laroche, S., and Bélair, S.: A new atmospheric dataset for forcing ice-ocean models: Evaluation of reforecasts using the Canadian global deterministic prediction system, Q. J. Roy. Meteor. Soc., 140, 881–894, https://doi.org/10.1002/qj.2194, 2014.
Swift, J. H., Jones, E. P., Aagaard, K., Carmack, E. C., Hingston, M., Macdonald, R. W., McLaughlin, F. A., and Perkin, R. G.: Waters of the Makarov and Canada basins, Deep-Sea Res. Pt. II, 44, 1503–1529, https://doi.org/10.1016/S0967-0645(97)00055-6, 1997.
Thomas, H. and Mol, J.: Dissolved inorganic carbon, total alkalinity, δ18O-H2O, δ13C-DIC, temperature, and salinity collected from discrete bottle samples from CCGS Amundsen in the Beaufort Sea during August and September 2014, PANGAEA, https://doi.pangaea.de/10.1594/PANGAEA.886238, 2018.
Tremblay, J.-É., Raimbault, P., Garcia, N., Lansard, B., Babin, M., and Gagnon, J.: Impact of river discharge, upwelling and vertical mixing on the nutrient loading and productivity of the Canadian Beaufort Shelf, Biogeosciences, 11, 4853–4868, https://doi.org/10.5194/bg-11-4853-2014, 2014.
Williams, J. W. and Carmack, E. C.: The “interior” shelves of the Arctic Ocean: Physical oceanographic setting, climatology and effects of sea-ice retreat on cross-shelf exchange, Prog. Oceanogr., 139, 24–41, https://doi.org/10.1016/j.pocean.2015.07.008, 2015.
Williams, W. J., Carmack, E. C., Shimada, K., Melling, H., Aagaard, K., Macdonald, R. W., and Ingram, R. G.: Joint effects of wind and ice motion in forcing upwelling in Mackenzie Trough, Beaufort Sea, Cont. Shelf Res., 26, 2353–2366, https://doi.org/10.1016/j.csr.2006.06.012, 2006.
Williams, W. J., Melling, H., Carmack, E. C., and Ingram, R. G.: Kugmallit Valley as a conduit for cross-shelf exchange on the Mackenzie Shelf in the Beaufort Sea, J. Geophys. Res.-Oceans, 113, C02007, https://doi.org/10.1029/2006JC003591, 2008.
Woodgate, R. A., Weingartner, T. J., and Lindsay, R.: Observed increases in Bering Strait oceanic fluxes from the Pacific to the Arctic from 2001 to 2011 and their impacts on the Arctic Ocean water column, Geophys. Res. Lett., 39, L24603, https://doi.org/10.1029/2012GL054092, 2012.
Yamamoto-Kawai, M., McLaughlin, F. A., Carmack, E. C., Nishino, S., Shimada, K., and Kurita, N.: Surface freshening of the Canada Basin, 2003–2007: River runoff versus sea ice meltwater, J. Geophys. Res.-Oceans, 114, C00A05, https://doi.org/10.1029/2008JC005000, 2009.
Yamamoto-Kawai, M., McLaughlin, F., and Carmack, E.: Ocean acidification in the three oceans surrounding northern North America, J. Geophys. Res.-Oceans, 118, 6274–6284, https://doi.org/10.1002/2013JC009157, 2013.
Yang, J.: The seasonal variability of the Arctic Ocean Ekman transport and its role in the mixed layer heat and salt fluxes, J. Climate, 19, 5366–5387, https://doi.org/10.1175/JCLI3892.1, 2006.
Yi, Y., Gibson, J. J., Cooper, L. W., Hélie, J.-F., Birks, S. J., McClelland, J. W., Holmes, R. M., and Peterson, B. J.: Isotopic signals (18O, 2H, 3H) of six major rivers draining the pan-Arctic watershed, Global Biogeochem. Cy., 26, GB1027, https://doi.org/10.1029/2011GB004159, 2012.