the Creative Commons Attribution 4.0 License.
the Creative Commons Attribution 4.0 License.
 | 05 Mar 2018
The pyrogeography of eastern boreal Canada from 1901 to 2012 simulated with the LPJ-LMfire model
Martin P. Girardin
Jed O. Kaplan
Jeanne Portier
Yves Bergeron
Christelle Hély
Wildland fires are the main natural disturbance shaping forest structure and composition in eastern boreal Canada. On average, more than 700 000 ha of forest burns annually and causes as much as CAD 2.9 million worth of damage. Although we know that occurrence of fires depends upon the coincidence of favourable conditions for fire ignition, propagation, and fuel availability, the interplay between these three drivers in shaping spatiotemporal patterns of fires in eastern Canada remains to be evaluated. The goal of this study was to reconstruct the spatiotemporal patterns of fire activity during the last century in eastern Canada's boreal forest as a function of changes in lightning ignition, climate, and vegetation. We addressed this objective using the dynamic global vegetation model LPJ-LMfire, which we parametrized for four plant functional types (PFTs) that correspond to the prevalent tree genera in eastern boreal Canada (Picea, Abies, Pinus, Populus). LPJ-LMfire was run with a monthly time step from 1901 to 2012 on a 10 km2 resolution grid covering the boreal forest from Manitoba to Newfoundland. Outputs of LPJ-LMfire were analyzed in terms of fire frequency, net primary productivity (NPP), and aboveground biomass. The predictive skills of LPJ-LMfire were examined by comparing our simulations of annual burn rates and biomass with independent data sets. The simulation adequately reproduced the latitudinal gradient in fire frequency in Manitoba and the longitudinal gradient from Manitoba towards southern Ontario, as well as the temporal patterns present in independent fire histories. However, the simulation led to the underestimation and overestimation of fire frequency at both the northern and southern limits of the boreal forest in Québec. The general pattern of simulated total tree biomass also agreed well with observations, with the notable exception of overestimated biomass at the northern treeline, mainly for PFT Picea. In these northern areas, the predictive ability of LPJ-LMfire is likely being affected by the low density of weather stations, which leads to underestimation of the strength of fire–weather interactions and, therefore, vegetation consumption during extreme fire years. Agreement between the spatiotemporal patterns of fire frequency and the observed data across a vast portion of the study area confirmed that fire therein is strongly ignition limited. A drier climate coupled with an increase in lightning frequency during the second half of the 20th century notably led to an increase in fire activity. Finally, our simulations highlighted the importance of both climate and fire in vegetation: despite an overarching CO2-induced enhancement of NPP in LPJ-LMfire, forest biomass was relatively stable because of the compensatory effects of increasing fire activity.
- Article
(11561 KB) - Full-text XML
-
Supplement
(3510 KB) - BibTeX
- EndNote


Wildland fires are the main natural disturbance shaping forest structure and composition in eastern boreal Canada (Bergeron et al., 1998, 2014). On average, more than 0.7 Mha burns annually across Manitoba, Ontario, Québec, and the Maritime Provinces, which causes as much as CAD 2.9 million worth of damage and property losses (Canadian Council of Forest Ministers, 2017). About 97 % of these burned areas are generated by a small proportion (3 %) of large fires (fires > 200 ha in area; Stocks et al., 2003). For example, a fire burned 583 000 ha within a few days in 2013 near the aboriginal community of Eastmain (province of Québec), which is the equivalent of 31 % of the total area burned during that year in Québec (Erni et al., 2017). Studies of the spatial distribution of wildland fires in the past have highlighted that the frequency and size of fires in Canada have continuously increased over the last 50 years or so in response to the on-going global warming (e.g., Kasischke and Turetsky, 2006; Hessl, 2011; Girardin and Terrier, 2015). Concerns are now being raised about the increasing frequency and severity of extreme climatic events with further warming, which could lead to an increasing concentration of numerous large fires in time and space (Wang et al., 2015). Given these observations and projections, there is growing concern about the capacity of the boreal forest to recover from disturbances (Bond et al., 2004; IPCC, 2013; Kurz et al., 2013; Rogers et al., 2013).
Wildland fire regimes are described by several attributes including the frequency, size, intensity, seasonality, type, and severity of fires (Keeley, 2009). The spatiotemporal variability in a fire regime depends upon the coincidence of favourable conditions for fire ignition, fire propagation, and fuel availability, which are controlled by ignition agents, weather and climate, and vegetation (Flannigan et al., 2009; Moritz et al., 2010). Almost half of the fires that occur in eastern boreal Canada are ignited by lightning and represent 81 % of the total area burned (Canadian Forest Service, 2016), while the remaining fires originate from human activities. The capacity of a fire to grow into a large fire is determined by many factors, which include weather and fuel. High temperature, low precipitation, high wind velocity, and low atmospheric humidity can increase the growth of these fires (Flannigan et al., 2000). The intensity, severity, and size of fires are further influenced by species composition within the landscape, with needleleaf species being more fire prone than broadleaf species owing to their high flammability (Hély et al., 2001). Physical variables such as slope, surficial deposits, and soil moisture can also have significant effects on the rate at which fires spread by influencing fuel moisture or creating natural fire breaks (Hély et al., 2001; Mansuy et al., 2011; Hantson et al., 2016). Climate change scenarios for Canada indicate an increase in both temperature and precipitation in the coming decades. However, the increase in precipitation should not compensate for the increase in temperature (IPCC, 2013), and a greater moisture deficit is expected compared to the current state. Warmer springs and winters that lead to an earlier start of the fire season are anticipated, together with an increase in the frequency of extreme drought years due to more frequent and persistent high-pressure blocking systems (Girardin and Mudelsee, 2008). These phenomena are expected to lead to an increase in the frequency and size of fires in eastern boreal Canada in response to the on-going global warming (Ali et al., 2012). Effects of these changes in seasonal onset and dryness are such that the average size of spring wildfires could be multiplied by a factor of 3 for each additional 1 ∘C of warming (Ali et al., 2012; Girardin et al., 2013a; Price et al., 2013). An increase in area burned would affect both forest management plans and fire suppression strategies. It could also have subsequent feedback on the global carbon cycle, given that the substantial quantities of carbon currently being stored in these landscapes could be re-emitted back into the atmosphere (Pan et al., 2011).
A number of uncertainties persist concerning future fire projections, and biases still exist regarding our current understanding of the natural variability in fire regimes. Climate has been rapidly changing in recent decades with the expansion of human activities. All of these changes have altered interactions between fire regimes and their various forms of control (Bergeron et al., 2004b). Most fire history studies are based upon observations collected over relatively short time intervals (< 100 years), and reliable observations are often unavailable for many boreal regions prior to the late 1960s (Podur et al., 2002). Moreover, forest management and active fire suppression since the 1970s have contributed to modifying fire patterns and vegetation attributes in Canada (Gauthier et al., 2014). Therefore, it is difficult to determine the contribution of climate alone to fire activity in studies using observations collected since the second half of the 20th century. Furthermore, fire history studies rarely consider the feedback of fire on vegetation, mostly because historical data about vegetation composition are lacking (Danneyrolles et al., 2016). This is particularly true in the case of studies dealing with reconstructions of fire activity using dendrochronological evidence (e.g., Girardin et al., 2006) or adjusted empirical data sets (Van Wagner et al., 1987). This problem may be circumvented by investigating past fire regimes over long periods of time through the analysis of charcoal and pollen in soil layers or lacustrine deposits (Payette et al., 2008; Ali et al., 2009). However, these paleoecological methods are costly and time-consuming and do not make it possible to capture the overall spatial variability in fire regimes at annual – to decadal – scale resolutions. Faced with these gaps, increasing our knowledge of the spatiotemporal patterns of past fires is necessary to perform better predictions in the future.
Simulations using dynamic global vegetation models (DGVMs) make it possible to estimate the spatiotemporal distribution of fires relative to climate and vegetation (Yue et al., 2016; Hantson et al., 2016). Indeed, these models simulate shifts in potential vegetation composition and related fire activity in response to changes in climate or environmental constraints (Smith et al., 2001). Experiments can be conducted on fine to broad spatial scales and validated on relatively short to medium timescales. Validation can be performed in regions where human activities are sufficiently low to allow comparisons with natural potential vegetation, by comparing simulation results with high-resolution satellite products, such as MODIS, on global scales (Tang et al., 2010). DGVM simulations may also be validated on decadal to millennial timescales by comparing them with historical records of vegetation or fire activity that have been reconstructed using indicators derived from pollen and charcoal, amongst others, which are deposited in lacustrine sediments (Molinari et al., 2013). One of these models, the Lund-Potsdam-Jena (LPJ) model, has been the subject of numerous refinements over time, especially concerning simulations of fire patterns (Thonicke et al., 2010; Pfeiffer et al., 2013), and it has been validated in many regions worldwide, excluding eastern boreal Canada (e.g., Prentice et al., 2011; Pfeiffer et al., 2013; Yue et al., 2016; Knorr et al., 2016).
Here, we used the LPJ-LMfire model that was developed by Pfeiffer et al. (2013) to perform a simulation experiment that targeted the boreal forest of eastern Canada and covered the last century, with customized parameterization to capture prevalent tree genera in eastern boreal Canada. The DGVM explicitly simulates fire ignition from lightning; hence, it is particularly adapted to the largely ignition-limited fire regimes in our study region. The objectives of this study were (1) to calibrate the LPJ-LMfire model for boreal forests in eastern Canada; (2) to assess the predictive skills of the model with independent data sets from eastern Canada's boreal forests; (3) to reconstruct fire activity, net primary productivity (NPP), and aboveground biomass during the last century; and (4) to determine how the spatiotemporal pattern of these three components has evolved in relation to changes in climate variables.
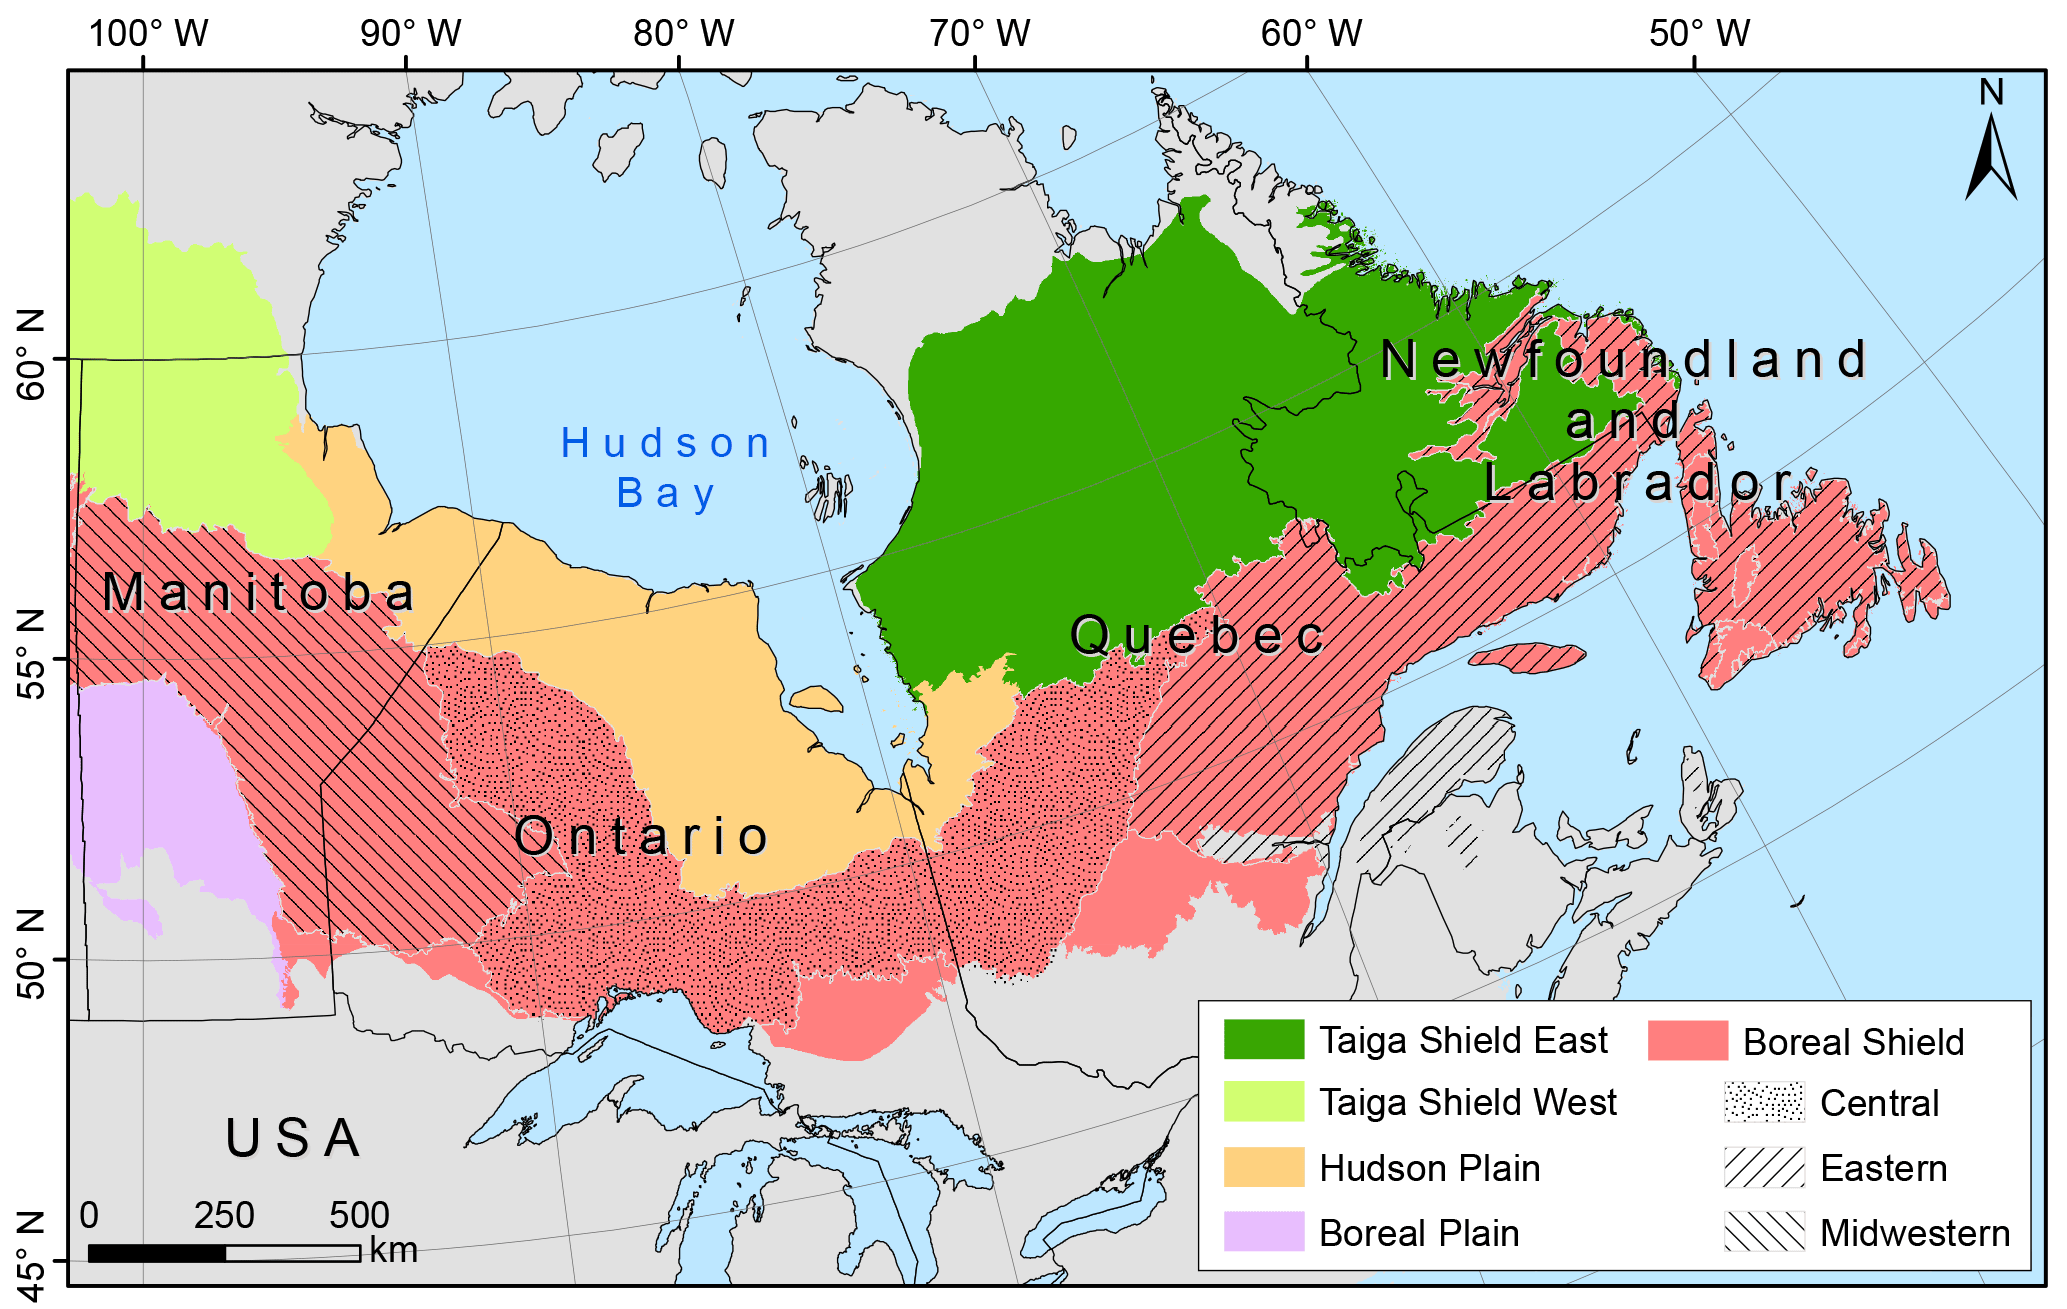
Figure 1Map of eastern Canada's boreal forest from Manitoba to Newfoundland showing ecozones in colour. The Boreal Shield ecozone is divided into three ecoregions: Eastern Canadian forests, Central Canadian Boreal Shield forests, and Midwestern Canadian Shield forests.
2.1 Study area
The study area encompasses eastern Canada's boreal forest (Brandt, 2009) from Manitoba to Newfoundland, which ranges from 102.86 to 52.64∘ W and from 46.61 to 64.71∘ N (Fig. 1). The most common needleleaf tree species present in this region are black spruce (Picea mariana (Mill.) B.S.P.), white spruce (Picea glauca (Moench) Voss), balsam fir (Abies balsamea (L.) Mill.), jack pine (Pinus banksiana Lamb.), white pine (Pinus strobus L.), red pine (Pinus resinosa Ait.), eastern larch (Larix laricina (Du Roi) K. Koch), and eastern white cedar (Thuja occidentalis L.). The main broadleaf tree species are trembling aspen (Populus tremuloides Michx.) and white or paper birch (Betula papyrifera Marsh.) (Ecological Stratification Working Group, 1996; Brandt, 2009; Shorohova et al., 2011). The study area is divided from south to north into four ecozones (Fig. 1; Ecological Stratification Working Group, 1996). (1) The Boreal Shield (BS) ecozone is characterized by rocky and rugged landscapes influenced by a continental climate (long and cold winters; short and warm summers) and by the cold air masses flowing out from Hudson Bay. Landscapes are dominated by needleleaf tree species in the westernmost areas, and co-dominated by needleleaf and deciduous tree species in temperate eastern areas. (2) The Boreal Plain (BP) ecozone corresponds to drier areas that are characterized by glacial deposits of variable thickness on flat or slightly rolling terrain. Forests are dominated by mixed boreal species, mainly represented by black spruce, trembling aspen, and jack pine. (3) The Hudson Plain (HP) ecozone is characterized by a sparser vegetation, which is dominated by Sphagnum and shrubs. Poor drainage conditions constrain southern trees to establish at drier, higher elevations. (4) The Taiga Shield (TS) ecozone, which is split into Eastern (TSE) and Western (TSW) parts, is characterized by colder climate conditions. The landscape becomes more open along a latitudinal gradient from south to north. In all regions, the dominant tree species are black spruce and jack pine. Within the study area, high-intensity crown fires are the most common type of fire events (Flannigan et al., 2016). Fire regimes are heterogeneous, but generally follow a declining trend along a southwest–northeast gradient (Boulanger et al., 2012). During the period of 1961–1990, the highest burn rates occurred in the western part of the BS ecozone (> 1 % yr−1), while they were the lowest in the TSE ecozone (< 0.2 % yr−1) (Boulanger et al., 2014). Annual burn rates in the BP ecozone and in the eastern part of the BS ecozone varied from 0.2 to 0.5 % yr−1, whereas they varied from 0.5 to 1.0 % yr−1 in the HP ecozone (Boulanger et al., 2014).
2.2 LPJ-LMfire model
Simulations of the terrestrial ecosystem were carried out using the dynamic global vegetation model LPJ-LMfire, which includes updates of both LPJ and the SPread and InTensity of FIRE (SPITFIRE) wildfire module (Thonicke et al., 2010). The model has been extensively evaluated for boreal forests (Pfeiffer et al., 2013). LPJ-LMfire is designed to simulate regional ecosystem dynamics, structure, and composition, with vegetation and fire events as responses to changes in climate and carbon dioxide (CO2) concentration (Sitch et al., 2003). LPJ-LMfire describes the state of an ecosystem in terms of annual carbon stocks (living biomass, litter, and soil), NPP, net biome productivity, evapotranspiration, heterotrophic respiration, soil moisture fraction, and forest structure and vertical profile (cover fraction, individual density, crown area, leaf area index). In the present study, changes in the vegetation state are described in terms of NPP and total carbon stocks in living aboveground biomass. In LPJ-LMfire, vegetation is defined by up to nine plant functional types (PFTs). Each PFT represents one or several species sharing the same physiology and dynamics, governed by a short list of vital attributes, and constrained by bioclimatic limits (Sitch et al., 2003). Vegetation dynamics are updated annually based on the simulation of daily and annual processes. Daily processes are defined in terms of photosynthesis, stomatal regulation, soil hydrology, autotrophic respiration, leaf and root phenology, and decomposition. Annual processes are defined in terms of several sources of mortality, seedling establishment, reproduction, allocation, and tissue turnover (Smith et al., 2001; Sitch et al., 2003). The computational core of SPITFIRE is based upon Rothermel-type surface fire behaviour models (Rothermel, 1972; Andrews et al., 2008) and is designed to simulate processes of natural fires and their impacts on vegetation mortality and fire emissions (Thonicke et al., 2010). The LMfire module simulates lightning ignitions based upon a daily time step and uses fuel bulk density and fuel moisture to calculate the fire's rate of spread, intensity, and fire-related mortality. It allows fires to burn over multiple days and simulates fire extinction from changes in weather and fuel (Pfeiffer et al., 2013). As in the original version of SPITFIRE and nearly all other large-scale fire models, LMfire does not simulate the cell-to-cell spread of fire (Hantson et al., 2016; Pfeiffer et al., 2013; Rabin et al., 2017).
2.3 Simulation protocol
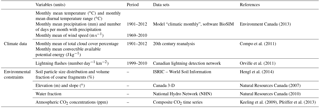
LPJ-LMfire was run monthly from 1901 to 2012 on 10 × 10 km equal-area grids covering eastern boreal Canada from Manitoba to Newfoundland. Driver data sets were prepared in netCDF format and are described in Table 1. Climate data were compiled at a monthly time step, while atmospheric CO2 concentrations were compiled at an annual time step (see Sect. 2.4). A 1120-year spin-up period was prescribed to equilibrate vegetation and carbon pools with climate at the beginning of the study period (Smith et al., 2001) and to ensure that forest biomass and fire disturbances were in stable condition (Tang et al., 2010). This spin-up run was made using linearly detrended 1901–2012 climate data and repeated 10 times.
2.4 Environmental input data sets
2.4.1 Climate
Monthly means of temperature, diurnal temperature range, precipitation, number of days with precipitation, and wind speed were extracted for the 1901–2012 period from Environment Canada's historical climate database (Environment Canada, 2013) using BioSIM software (v.10.3.2; .Régnière et al., 2014). Gridded climate data were prepared in BioSIM by interpolating weather data from the four weather stations that were closest to each 10 × 10 km grid, adjusted for elevation and location differentials with regional gradients, and averaged using inverse distance weighting (1∕d2, where d is distance). Missing wind speed values between 1901 and 1968 and those for 2010–2012 were set to the monthly 1969–2010 averages.
Monthly means of total cloud cover percentage for the entire atmosphere and convective available potential energy (CAPE) were interpolated on our grid from the NOAA-CIRES 20th Century Reanalysis v2 data set at a ∼ 2.0∘ latitude and 1.75∘ longitude resolution (Compo et al., 2011). For a given grid cell, the annual monthly CAPE anomaly was calculated as the difference between the annual value and the monthly normal for CAPE, which was computed between 1961 and 1990.
2.4.2 Lightning
The Canadian Lightning Detection Network (CLDN) data set, covering the 1999–2010 period (Orville et al., 2011), was used to reconstruct the monthly cloud-to-ground lightning strike density (number day−1 km−2) between 1901 and 2012. Given the strong correlation between lightning strikes and the product of CAPE and precipitation (e.g., Peterson et al., 2010; Romps et al., 2014), we computed daily lightning strike density using CAPE data and distributed the lightning strikes over the daily fraction of monthly rainy days (Pfeiffer et al., 2013). Across Canada and within our study area, July was the month with the maximum number of lightning strikes between 1999 and 2010 (Fig. S1a) and, in turn, interannual lightning strike variability (hereafter, referred to as min-to-mean and max-to-mean ratios) ranged from 0.1 to 7.5 times the July mean (Fig. S1b). This interannual variability in lightning strikes was preserved in our reconstruction by applying these two ratios to the normalized CAPE anomalies (values ranging between −1 and +1), which were then added to the 1999–2010 flash climatology (Pfeiffer et al., 2013; see Supplement S1 for further details).
2.4.3 Soils
The volume fraction of coarse fragments together with the 0–100 cm deep soil texture fractions of sand and clay were interpolated on the 10 × 10 km grids from the 1 km resolution ISRIC – World Soil Information data set (Hengl et al., 2014). For topography, we interpolated the 30 arcsec gridded digital elevation model (DEM) of Canada (Natural Resources Canada, 2007). We calculated slopes in degrees at 30 arcsec with the DEM map using ArcGIS 10.4.1 and interpolated the data to our 10 × 10 km grids. To calculate the percentage of land (i.e., removing lakes and water course areas) in each grid cell, we rasterized the water fraction of the National Hydro Network (NHN) data set at 100 m resolution (Natural Resources Canada, 2010). We calculated the water fraction at a 10 km resolution from 100 m resolution grid cells that had a percentage of water fraction > 50 %. The land fraction was defined as the inverse of the water fraction. Roads, power lines, dams, mines, and other human-made structures, and areas of bare rock, were not considered in this study.
2.4.4 Atmospheric CO2 concentration
Monthly mean atmospheric CO2 concentrations covering the periods from 1901 to 1980 and from 1981 to 2012 were obtained from Pfeiffer et al. (2013) and the Mauna Loa data set (Keeling et al., 2009), respectively. Annual mean atmospheric CO2 concentration varied from 296.23 ppm in 1901 to 392.48 ppm in 2012, which corresponds to an increase of 32.5 %.
2.5 PFT definitions and LPJ-LMfire model modifications
LPJ-LMfire was calibrated for four PFTs that corresponded to the predominant tree genera currently present in the boreal forest of Canada: Picea, Abies, Pinus, and Populus. PFT-related parameters, e.g., fraction of roots in the upper soil layer or minimum and maximum temperatures of the coldest month for establishment, were assigned values from the published literature or global databases (see Table S1 in Supplement S2 for further details).
2.5.1 Edaphic limits to establishment
Establishment and growth of boreal tree species are influenced by a wide range of soil properties that are related to soil nutrient availability, which include pH, parent material, soil particle size, and water content, among others (Girardin et al., 2001; Beauregard and de Blois, 2014; Gewehr et al., 2014). Not all ecosystem processes linking these properties to tree establishment are simulated in the current version of LPJ-LMfire. Notably, the model does not simulate the development of peatlands or the process of paludification, and it does not include a complete module of biogeochemical cycling in soils that would emulate processes leading to acidification, for instance. As proposed by Beauregard and de Blois (2014), however, some edaphic variables may be indicative of certain soil processes at the stand level. In this study, correlations between the abundance of specific tree genera and soil clay content led to the implementation of a simple scheme to limit tree establishment in LPJ-LMfire (Fig. S2a). Edaphic limits to establishment were defined here in the same way that bioclimatic limits are used in LPJ. The correlations between the genus-specific tree cover fraction from Beaudoin et al. (2014) and clay volume fraction from Hengl et al. (2014) were analyzed at a 10 km resolution. For each PFT, the percentage of clay corresponding to the upper limit of the 90 % confidence interval (CI) of its distribution, for grid cells with at least 10 % of PFT cover, was used in the model as a threshold above which the given PFT could not establish. The upper limit of the 90 % CI of the clay percentage distribution was 20, 13 18, and 23 % for Picea, Abies, Pinus, and Populus, respectively (Fig. S2a and b). The 20 % threshold essentially results in the exclusion of the Picea and Populus PFTs in the HP ecozone (Fig. S2c), while the threshold of 13 % leads to the additional exclusion of other PFTs, especially Pinus, in the Midwestern Canadian Shield forest ecoregion (Figs. 1 and S2c) and in the BP ecozone (Fig. S2c).
2.5.2 Post-fire recruitment
Recruitment of Pinus banksiana requires the heat of fires to release seeds from serotinous cones (Gauthier et al., 1996). This condition was implemented in the current LPJ-LMfire version specifically for the Pinus PFT by inhibiting seedling establishment during years without fire. Such fire effects on seed dispersal are also observed for Picea mariana, which has semi-serotinous cones. Given that black spruce cones can open gradually over time in the absence of fire (Messaoud et al., 2007), Picea PFT establishment was not constrained by fire occurrence, neither was that of the Abies and Populus PFTs. No other modifications were made to the Pfeiffer et al. (2013) version of LPJ-LMfire.
2.6 Model evaluation
We assessed the performance of our customized LPJ-LMfire by comparing simulation results with previously published data sets on fire and maps of genus-specific aboveground biomass for Canada's forests.
2.6.1 Fire activity
The simulated burned area fraction was evaluated against three fire data products. First, annual burn rates for 1980–2012 were compiled from the Natural Resources Canada fire database (M. A. Parisien, personal communication, 2016) using Canada's national fire polygons with the hexagonal cells approach from Héon et al. (2014), but extended to our study area. We used 365 hexagonal cells to cover our study area and to compute the 1980–2012 simulated mean annual burn rates with 95 % CI for each hexagonal cell. The second fire data product originated from stand-replacing fire history studies. Here, historical annual proportions of burned areas were obtained for 26 locations (Fig. S3) using post-fire stand initiation reconstructions based upon field and archival data that were digitized and included in GIS databases (Girardin et al., 2013b; Héon et al., 2014; Portier et al., 2016). Using a 100 km radius around each location centroid, we calculated the simulated mean annual burn rates between 1911 and 2012, together with the 95 % CI. Differences between our simulated 95 % CI estimates and these two fire data products were considered qualitatively as “not different” if the observed annual burn rate fell within the 95 % CI of the simulated mean burn rate. Note that as the period covered by the historical fire data often extended further back in time into the 19th or 18th centuries for southern locations (Table S2), some important differences could be expected in the comparison process. Finally, a third validation of fire simulations was made by comparing time series of total simulated annual burned areas in boreal forests of Manitoba, Ontario, and Québec with provincial fire statistics (point data) from the Canadian National Fire Database (CNFDB; Canadian Forest Service, 2016) covering the 1959–2012 period. Human-caused fires were excluded from these analyses. Spearman's rank correlation (rs) was used to quantify the agreement between observed and simulated data. The agreement between simulation and observation was further evaluated in terms of fire seasonality by comparing their respective distributions of mean monthly areas that burned from 1959 to 2012.
2.6.2 Aboveground biomass
Published maps of total aboveground biomass at the genus level (Beaudoin et al., 2014) were used to evaluate model simulations. Maps that were created by Beaudoin et al. (2014) were constructed at a 250 m spatial resolution using remote sensing MODIS data sets, combined with photo-plot observations of Canada's National Forest Inventory (NFI), mainly in the southern areas (see non-hatched area in Fig. 4). We aggregated the 250 m data to a 10 km resolution and applied a correction for the vegetated treed fraction of the landscape, as defined by Beaudoin et al. (2014). The vegetated treed fraction corresponds to the fraction of the grid cells that are covered by tree species of any size on at least 10 % of the grid cell.
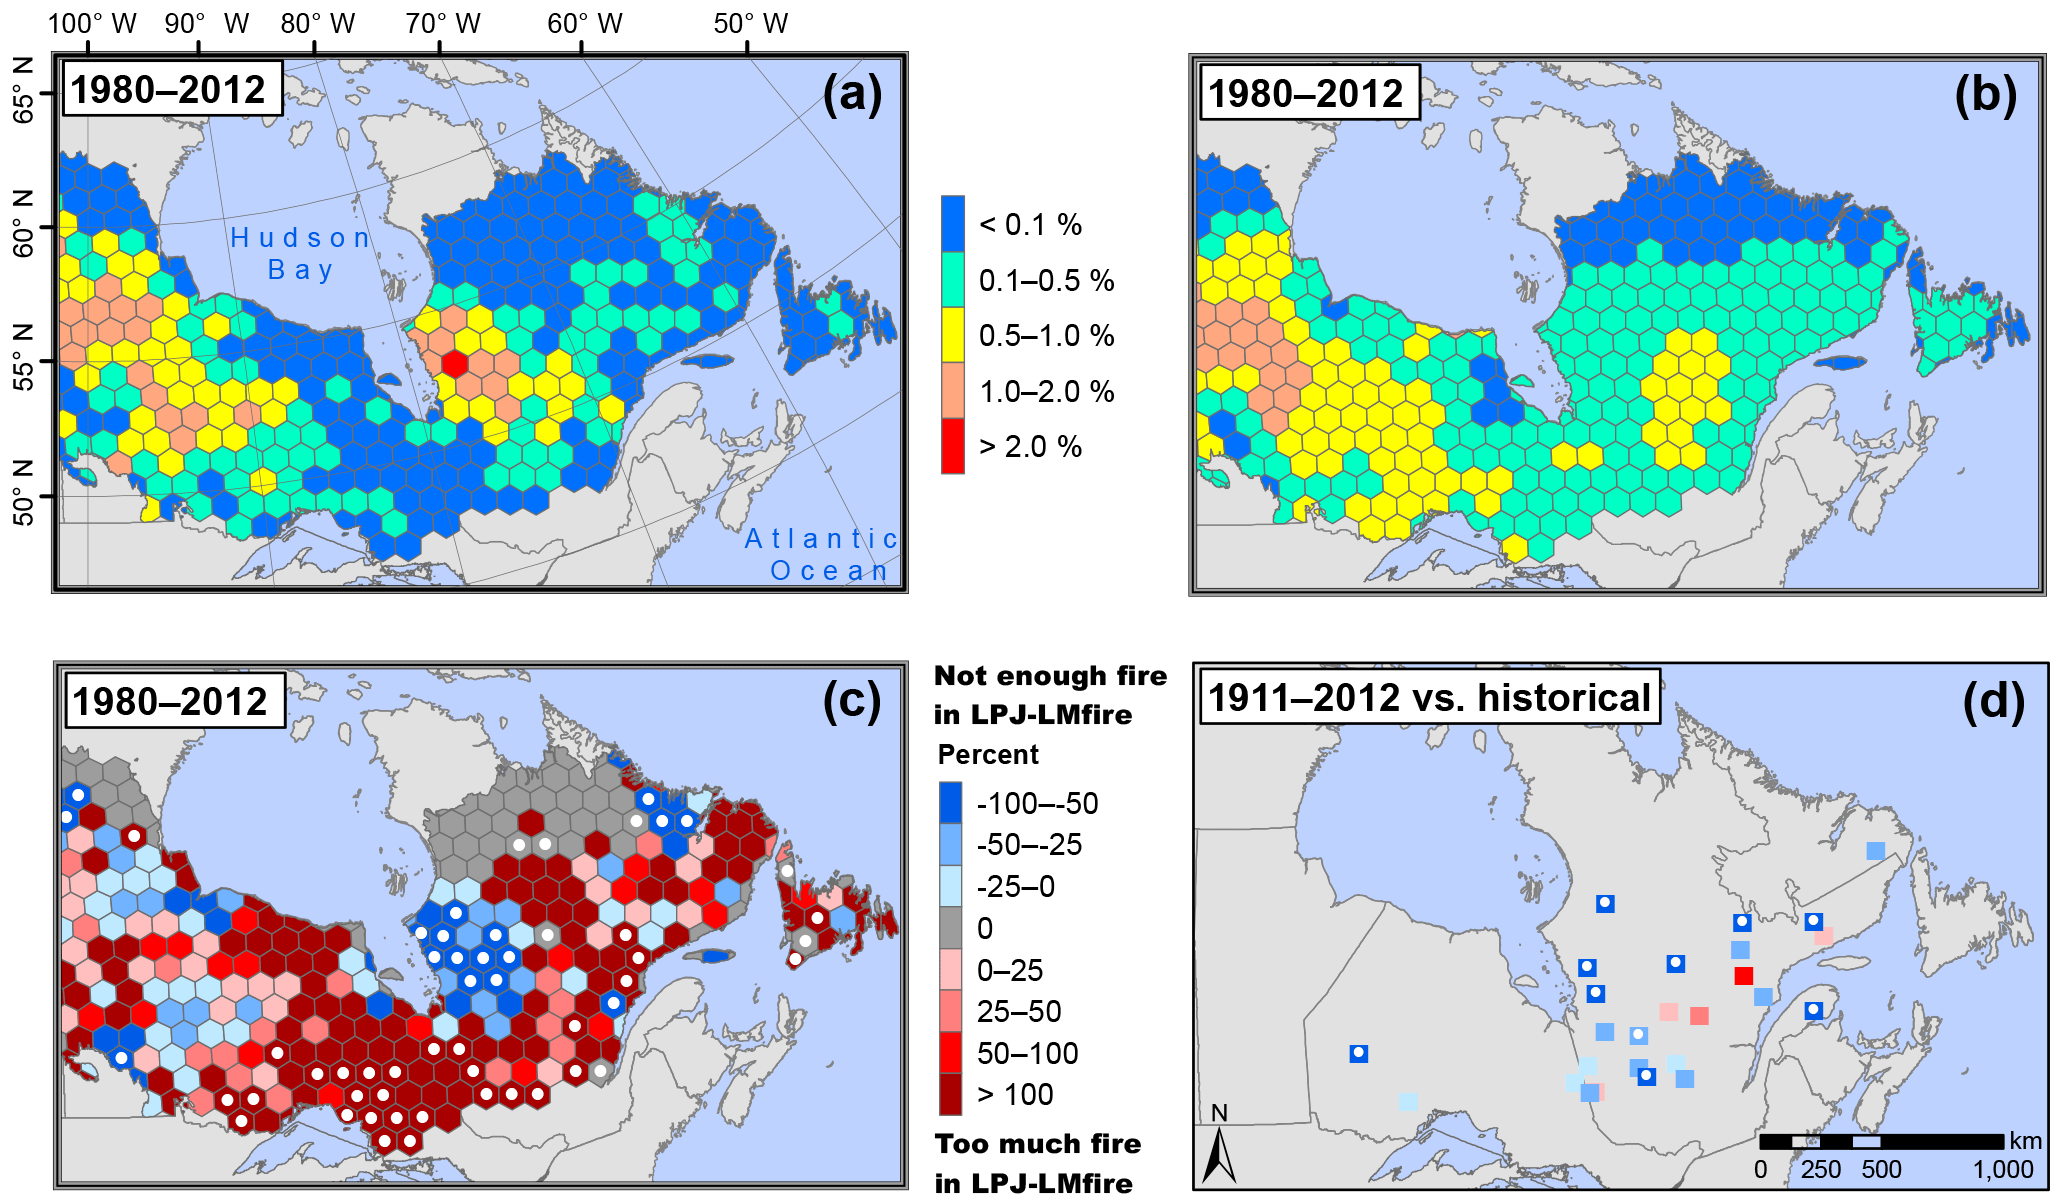
Figure 2Observed versus LPJ-LMfire-simulated annual burn rates across eastern boreal Canada. (a) Observed annual burn rates computed for 365 hexagonal cells between 1980 and 2012 (data from Natural Resources Canada, 2017). (b) LPJ-LMfire simulated annual burn rates computed over the same period and hexagonal cells. (c) Percent age of difference between observed and simulated annual burn rates. (d) Percent age of difference between historical annual burn rates reconstructed from stand-replacing fire history studies (data from Girardin et al., 2013b; Héon et al., 2014; Portier et al., 2016) and LPJ-LMfire-simulated annual burn rates between 1911 and 2012 (see Supplement S4 for further details). White points indicate where the observed (and historical) annual burn rate lies outside the 95 % confidence interval (95 % CI) of the averaged annual burn rates in hexagonal cells simulated by LPJ-LMfire.
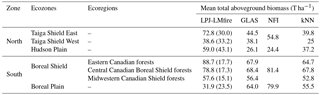
Total aboveground biomass, estimated using two other methods reported by Margolis et al. (2015), was used for a second evaluation of model simulations for the five ecozones under study. The BS ecozone was divided into three ecoregions for comparison purposes (Fig. 1); ecoregions correspond to the classification of ecological regions on a finer scale than ecozones. The first method of biomass estimation is based upon the Geoscience Lidar Altimetry System (GLAS) method, which estimates total aboveground biomass from the waveforms recorded over vegetated land using lidar instruments. The second method is based upon NFI photo-plot estimates of total aboveground biomass using allometric equations.
2.7 History of the eastern boreal forest of Canada described by LPJ-LMfire
The outputs of LPJ-LMfire for the eastern boreal forest of Canada were analyzed in terms of annual burn rates, NPP, and total aboveground biomass. Significant changes in each temporal series were highlighted by a regime shift calculation developed by Rodionov (2004, 2006). A sequential application of Student's t test on 1000 randomly chosen grid cells was used (Rodionov, 2004, 2006). To be statistically significant at P=0.10, the difference (diff) between mean values of two subsequent periods that was determined according to Student's t test should satisfy the condition
where t is the value from the t distribution with 2l−2 degrees of freedom at the given probability level P, l is the cut-off length of the growth phase to be determined (hereafter set to periods of 20 years), and is the average variance for running l-year intervals. The sample proportion, representing the fraction of k cells (integer ≥0) of a given population N (integer > 0), which was identified positively as recording a growth decline (or release), a biomass reduction (or biomass increase), and an increase in fire activity (or decrease), was computed for each sampled year from 1920 to 2007.
Table 2LPJ-LMfire vs. Margolis et al. (2015) mean total aboveground biomass estimates (with standard deviations) between 2000 and 2006 across five ecozones in eastern boreal Canada. The Boreal Shield ecozone was divided into three ecoregions (ecozone subdivisions) for comparison.
2.8 Sensitivity analysis to CO2 fertilization
In terrestrial ecosystem models, changes in atmospheric CO2 concentration in the recent past and future often have a more important influence on vegetation than does climate change (Girardin et al., 2011). Therefore, their inclusion has a very important effect on simulated changes in productivity. Here, the effect of CO2 fertilization was explored using two experiments. In the first experiment, “Climate + CO2”, we ran the model with increases in CO2 concentration as presented in Sect. 2.4.4. This experiment was used throughout our evaluation of LPJ-LMfire simulations. In the second experiment, “Climate-only”, we ran the model with a constant CO2 concentration from 1901 to 2012, which was fixed at 296.23 ppm (year 1901 value). In this case, there was no response of vegetation gross primary production (GPP) or fire to changes in CO2 concentration. The effect of CO2 fertilization on vegetation was determined by the difference between simulations “Climate + CO2” and “Climate-only”. Due to the post-fire recruitment rules established in LPJ-LMfire (see Sect. 2.5.2), the effect of CO2 fertilization on fire was only determined by comparing the spatial pattern of annual burn rates simulated with the “Climate + CO2” and “Climate-only” experiments.
We report on the evaluation of process-based model performance in adequately simulated spatial patterns of fire frequency and fuel conditions (as indicated by the aboveground biomass of the four PFTs and total NPP) in eastern boreal Canada. We also report on changes in fire activity during the last century as simulated by LPJ-LMfire, with associated changes in vegetation features.
3.1 Predictive skills of the LPJ-LMfire model
3.1.1 Fire activity
For the recent 1980–2012 period, mean and maximum simulated annual burn rates were 0.36 and 1.49 % yr−1, respectively (Fig. 2b), while mean and maximum observed annual burn rates were 0.28 and 2.03 % yr−1 (Fig. 2a). Observed and simulated burn rates were not significantly different in more than 80 % of the studied hexagonal cells (295 out of 365; Fig. 2c). Therefore, LPJ-LMfire was able to capture the amplitude of interregional variation. Decreases in fire activity observed along both the latitudinal gradient in Manitoba and the longitudinal gradient from Manitoba to southern Ontario were well reproduced by the simulation (Fig. 2a and b). Furthermore, more than half of the observed historical annual burn rates fell within the 95 % CI of their corresponding simulated annual burn rates (for further details, see Table S2). LPJ-LMfire overestimated annual burn rates from south of the Hudson Bay in Ontario to southwestern Québec (Fig. 2c), while it underestimated annual burn rates in the western area of the central boreal forest in Québec (Fig. 2c). Spearman's correlation coefficients (rs) of time series of observed versus simulated area burned are 0.41 for Québec and 0.50 for Ontario and Manitoba (Fig. 3a). As revealed by these coefficients, LPJ-LMfire was also able to emulate year-to-year variability in annual areas that were burned in Manitoba and Ontario, but less so in Québec. High fire activity years over the temporal series were also captured in the simulations, including 1961, 1968, 2003, and 2005, mostly in Manitoba and Ontario (Fig. 3a). However, three extreme fire years were not reproduced: 1983, 1989, and 2002 (Fig. 3a). Based upon the comparison of monthly percentage of total areas that were burned between 1959 and 2012 in eastern boreal Canada, the simulated fire season generally started 1 month earlier than what was observed (Fig. 3b).
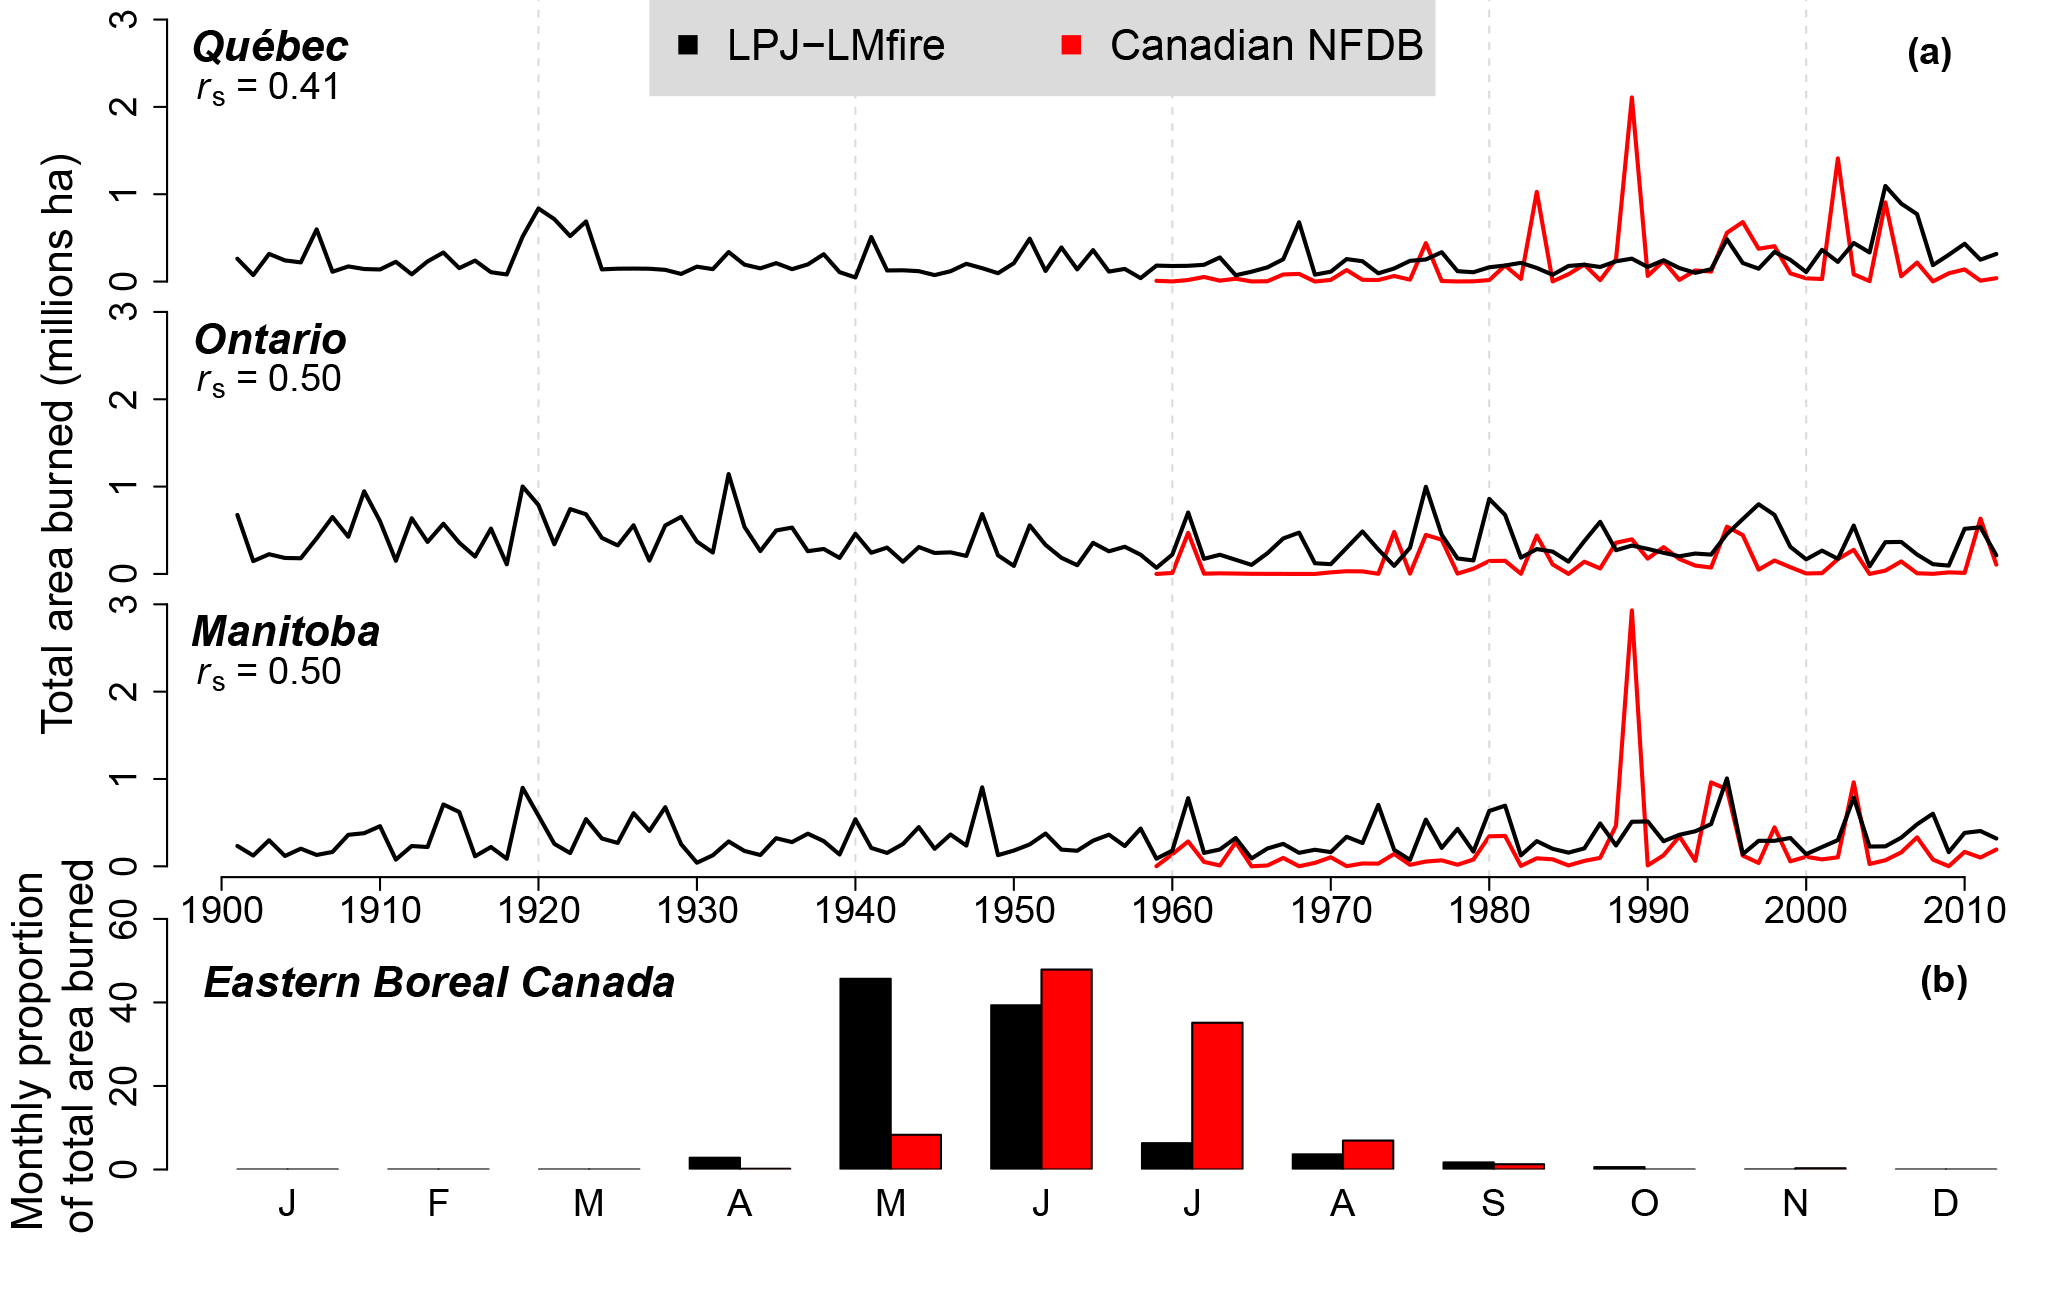
Figure 3(a) Observed versus simulated total annual areas burned in three provinces of eastern Canada. Observed data (1959 to 2012) are from the Canadian National Fire Database (CNFDB). Spearman's rank correlation between data is shown (correlations are significant at P < 0.05 for Québec and P < 0.001 for the other provinces). (b) Monthly percentage of total areas burned between 1959 and 2012 in eastern boreal Canada.
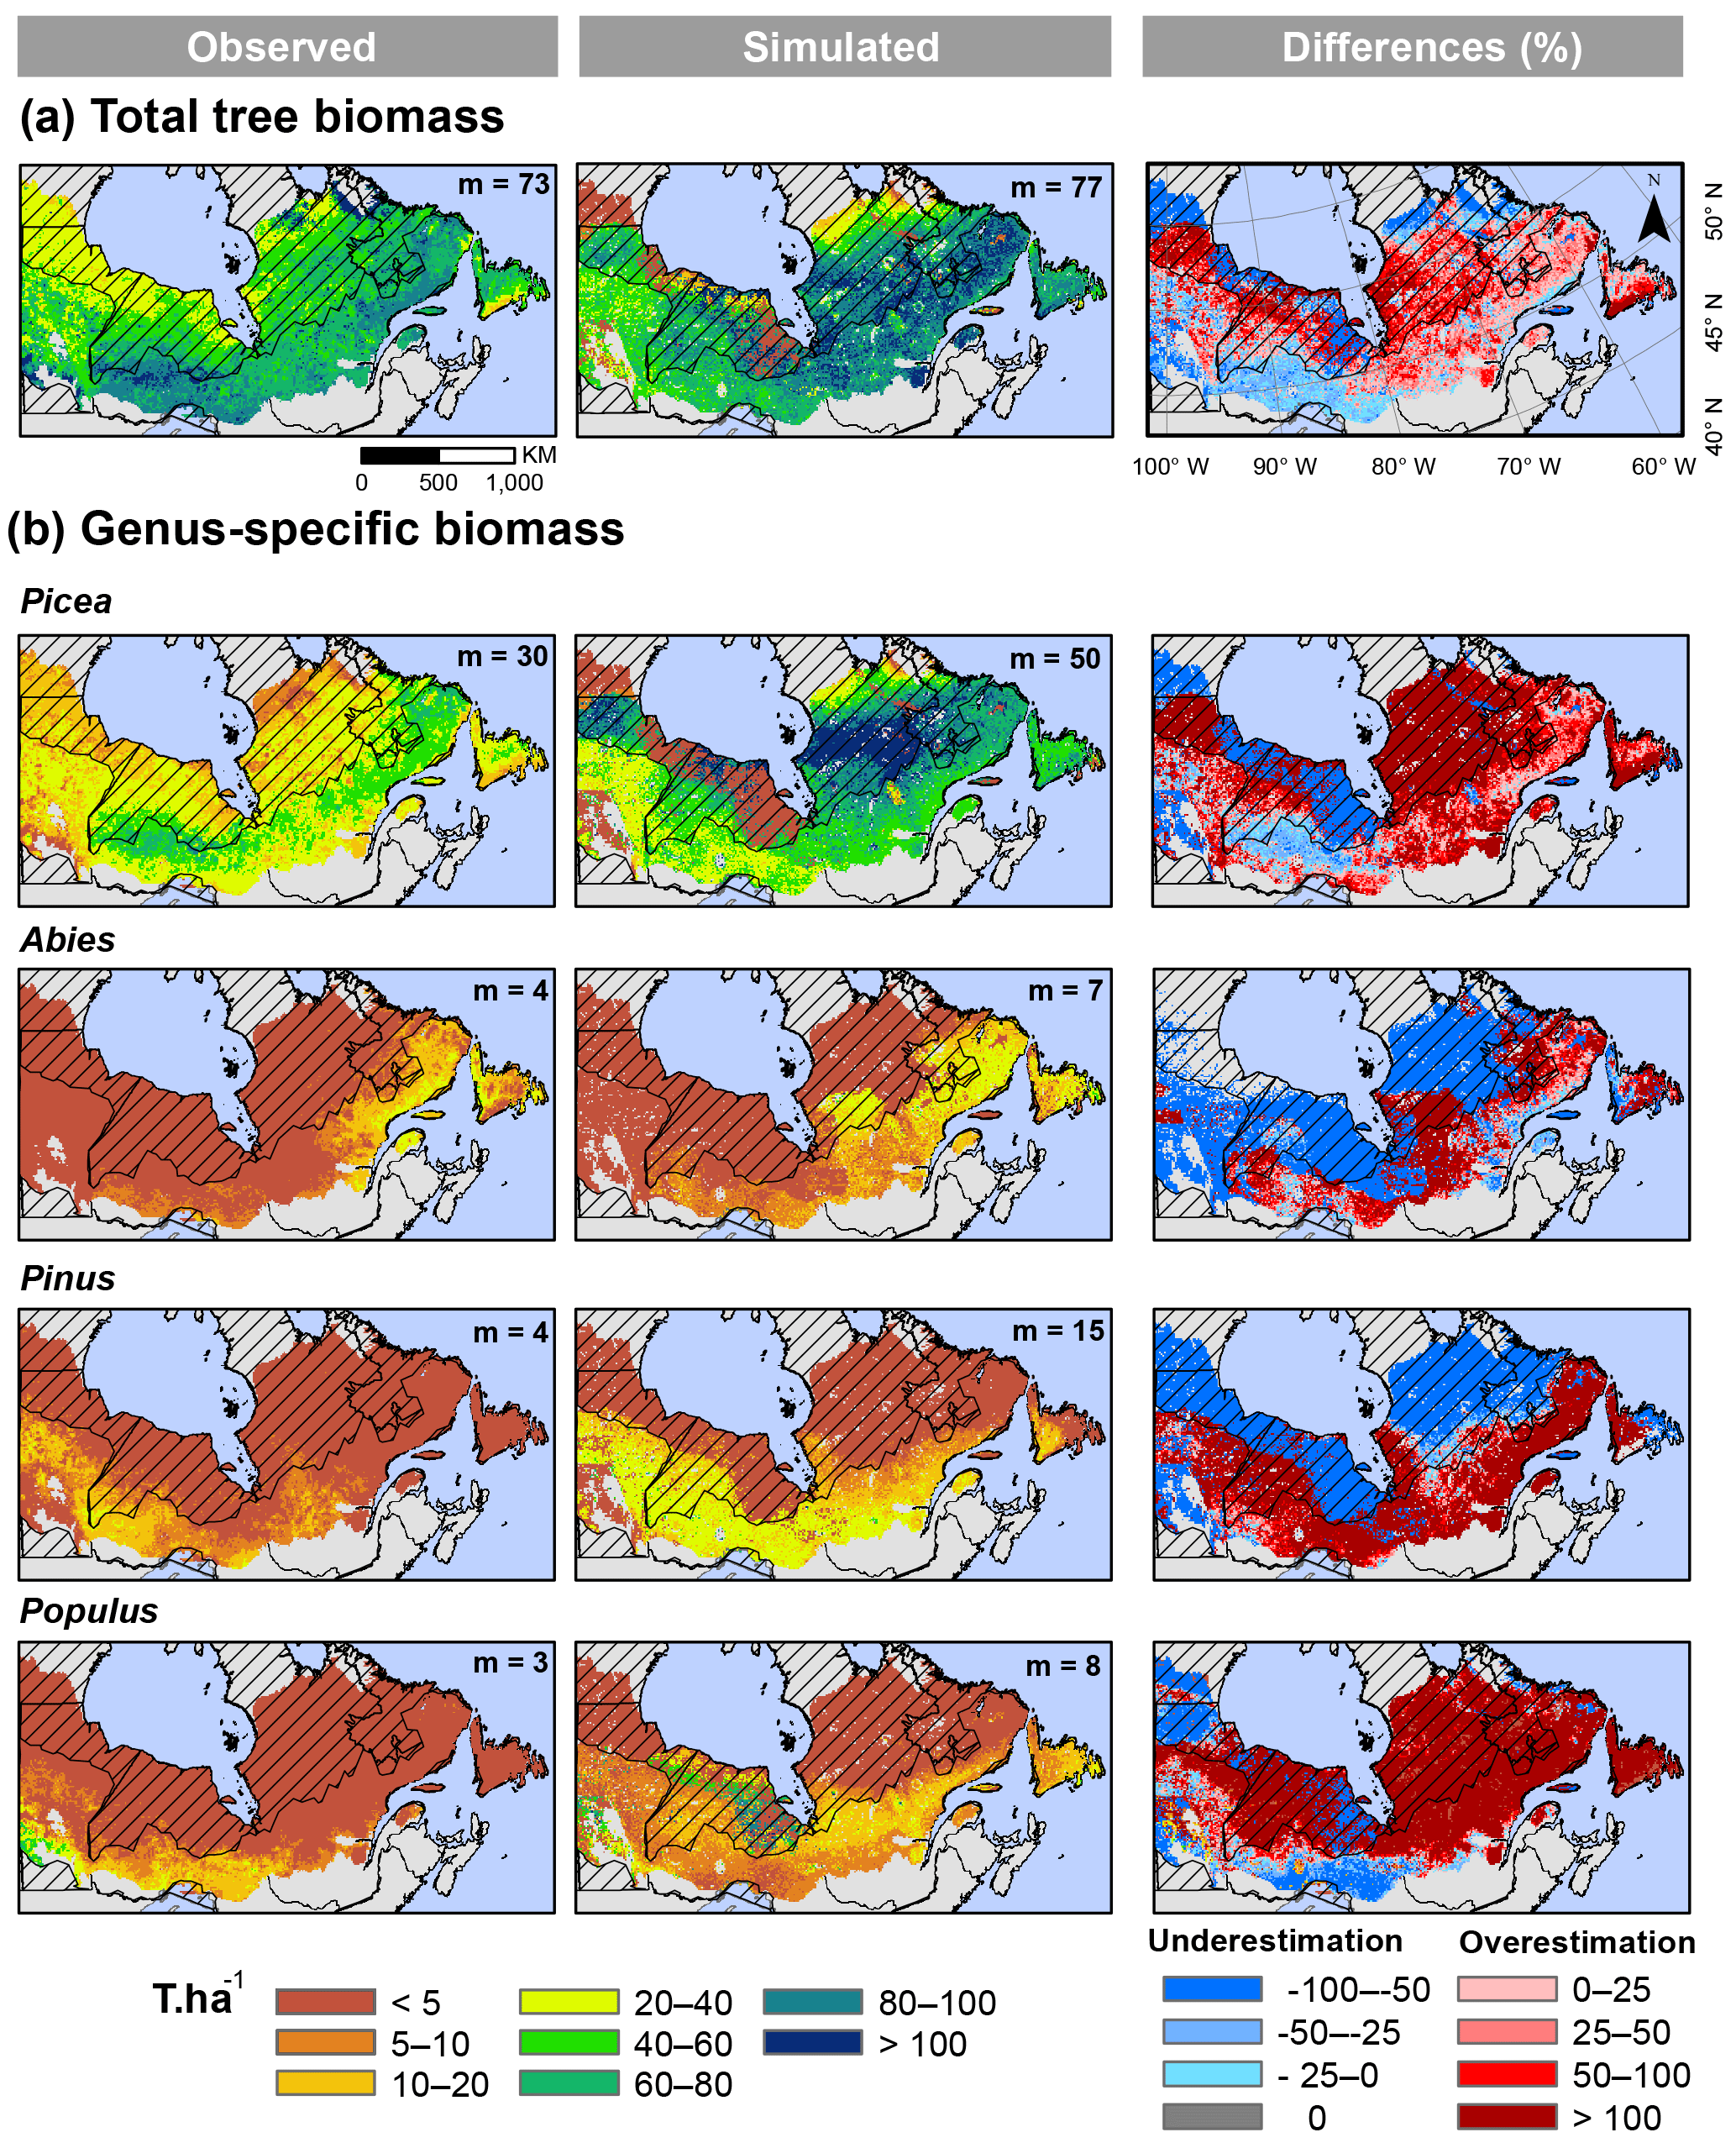
Figure 4(a) Observed, LPJ-LMfire simulated, and differences (%) in mean total aboveground biomass (T ha−1) between 2000 and 2006 across eastern boreal Canada. (b) Genus-specific aboveground biomass. The observed aboveground biomass maps across Canada were predicted and validated with photo-plot information in the southern areas (non-hatched areas) and data published by Beaudoin et al. (2014). Median (m) tree aboveground biomass values are also indicated for each map; these were calculated for the non-hatched areas at a 10 km resolution.
3.1.2 Fuels
Overall, the general latitudinal pattern of simulated total tree biomass agreed with the pattern of observed total tree biomass (Fig. 4a). Median simulated total tree biomass (with 90 % CI) in the southern areas (non-hatched) was 77 T ha−1 (33–108 T ha−1), while median observed total tree biomass in the same areas was 73 T ha−1 (36–100 T ha−1). In the BS ecozone, percentage differences between mean total tree biomass that was simulated and that which was estimated using NFI-based and GLAS-based methods were 31 and −7.8 %, respectively, and decreased along a westward gradient from Québec to Manitoba (Table 2). We greatly overestimated mean total tree biomass in the BP ecozone because these differences were −60 and −50 %. For the TS ecozone in Québec and Manitoba, which corresponds to less intensively sampled northern regions (hatched areas), total tree biomass was largely overestimated, mostly in Québec, due to the high genus-specific biomass of the Picea PFT (Fig. 4b). In this ecozone, relative differences with GLAS-based estimates ranged from 1.3 % in the west to 63.6 % in the east, whereas it was only 1.6 % in comparison with NFI-based estimates (Table 2). Greater relative differences were observed in the HP ecozone (Table 2), where we overestimated total tree biomass for grid cells in which edaphic limits were not too restrictive and where vegetation could establish (Fig. 4a). This overestimation was mainly due to the high biomass of the Picea and Populus PFTs (Fig. 4b). Despite local-scale overestimates, the range of genus-specific biomass variability in the Abies and Populus PFTs was well captured.

Figure 5LPJ-LMfire-simulated (a) annual burn rates (%), (b) net primary productivity (T ha−1 yr−1), and (c) total aboveground biomass (T ha−1) across eastern boreal Canada for five periods between 1911 and 2012.
3.2 Fire history simulated by LPJ-LMfire
3.2.1 Fire activity
Simulated burn rates displayed multi-decadal variation over the 20th century, mostly in Manitoba and Ontario (Fig. 5a). The high fire activity that was reported for the 1910–1930 period was followed by a decrease in fire activity until the 1970s, and then increased to levels similar to those of the early 20th century (Fig. 5a). Since the 1970s, annual burn rates have increased in central Manitoba and western Ontario and in the south-central area of Québec (Fig. 5a). Episodes of successive years of intense fire activity have occurred in 1908–1910, 1919–1923, 1995–1998, and 2002–2007 (Fig. S5a). A similar temporal pattern of annual burn rates between 1901 and 2012 was reported in the “Climate-only” experiment, but with lower annual burn rates (Fig. S7).
The simulated fire season was not stationary: a fire seasonality index (FSI) was computed as the percentage of difference between spring and summer total burned areas (Fig. S5b) and varied between 0.17 and 83 %. The period extending from the end of the 1960s to end of the 1990s corresponds to a period during which several years of high FSI were observed compared with the entire time series. A FSI greater than 50 % was calculated for 1968, 1977, 1980, and 1993 (Fig. S5b). May and June were consistently the spring months with the largest burned areas, while summer months recorded fewer and fewer burned areas over the course of the 20th century.

Figure 6(a) Annual and (b) decadal (smoothed over 10-year sums) proportions of cells showing a significant decline or release in NPP with 90 % confidence intervals (error bars) computed using Bayes' method. (c) Annual and (d) decadal (smoothed over 10-year sums) proportions of cells showing a significant reduction or increase in biomass total aboveground with 90 % confidence intervals (error bars) computed using the same method.
3.2.2 Fuels
For the “Climate + CO2” experiment, the simulated annual NPP averaged over the entire study region and the whole period was 5.4 T ha−1, with a minimum of 4.2 T ha−1 in 1907 and a maximum of 7.1 T ha−1 in 2003 (Fig. 5b). Both sequential t-test analysis and temporal time series showed that NPP has increased since the 1970s (Fig. 6a and b), mostly in southern areas of Québec and in eastern Ontario (Fig. 5b). This constant increase in NPP since the 1970s was not observed in Manitoba and western Ontario, where a significant increase in annual burn rates was observed (Fig. 5a). Some regions in south-central Ontario showed a decline in NPP during the early 20th century, and the same trend has been observed in south-central Québec since the 1980s. The proportion of cells recording a decline in NPP was particularly noteworthy in 2004 and 2006 (Fig. 6a and b). Differences in NPP between the simulated “Climate + CO2” and “Climate-only” experiments highlighted that annual simulated NPP, averaged over the whole area, was positively correlated with annual atmospheric CO2 concentration (r2=0.767, P < 0.001). Mean percentage of increase in NPP that was incurred by rising CO2 concentration for our five time periods was 2.7, 5.5, 8.9, 16.7, and 27.6 % (Fig. S6), while it was 18 % for the entire period. An even larger effect of CO2 fertilization was simulated in the extreme southern and northern parts of the study region (Fig. S6c).
Mean total aboveground biomass averaged 66.4 T ha−1 in eastern boreal Canada over the 1901–2012 period. Mean total aboveground biomass decreased slightly from the beginning of the 20th century until the 1930s and then increased until 1995, after which it reached a stable level (Fig. 5c). Periods of total aboveground biomass loss that were recorded at the beginning of the 20th century correspond to high fire activity, as previously mentioned (Fig. 5a). Sequential t-test analysis of total aboveground biomass time series showed that biomass increase and reduction followed the same trends that were observed for growth releases and declines, respectively, until the year 2000 (Fig. 6c and d). Genus-specific aboveground biomass of the Picea, Pinus, and Populus PFTs showed the same increasing trends over the past century, whereas Abies PFT aboveground biomass decreased until the year 1960, before regaining the value it had at the beginning of the 20th century (Fig. S8a). The strongest variation in total aboveground biomass occurred for the Picea PFT; it varied from a minimum of 27.8 T ha−1 in 1910 to a maximum of 36.7 T ha−1 in 2003 (Fig. S8a). Conversely, genus-specific aboveground biomass of Abies, Pinus, and Populus PFTs varied by less than 1, 2, and 3 T ha−1, respectively, over the same period (Fig. S8a). The ratio of mean genus-specific aboveground biomass in the recent 1991–2012 period, when compared with the past period of 1911–1930, was 1.23, 1.04, 1.13, and 1.31 for the Picea, Abies, Pinus, and Populus PFTs, respectively. The highest ratios for each PFT were found in the northern areas (Fig. S8b).
4.1 Agreements and disagreements in fire activity and forest growth
We used LPJ-LMfire, which was driven by gridded climatology, atmospheric CO2 concentration, and an estimate of lightning strike density to study the pyrogeography of eastern Canada's boreal forest. Compared with the previous modelling efforts that had been conducted by Pfeiffer et al. (2013) using the original LPJ-LMfire model, the results that are reported here show substantial improvement in the capacity of the DGVM to simulate fire ignition in the Canadian boreal forest. The use of a high-quality lightning strike data set instead of the low-resolution LIS/OTD global data set that was used by Pfeiffer et al. (2013) allowed us to capture the spatial gradient of fire activity in a substantially better manner (Baker et al., 2016). The results confirmed that fire in the study area is strongly ignition limited, while most fire models have simply assumed that fire would always occur under appropriate weather and fuel conditions, e.g., SIMFIRE (Hantson et al., 2016). LPJ-LMfire simulations confirmed the necessity of simulating fire in a model as the product of the probabilities that are associated with fuel, moisture and ignition.
Interannual variation in lightning strike density was more faithfully reproduced when weighting the mean flash climatology with the CAPE variable to predict lightning-induced fire ignitions and their variability (Peterson et al., 2010). However, this variation is still constrained by the short temporal depth of the years of record in the CLDN lightning strike data set (Orville et al., 2002; Kochtubajda and Burrows, 2010). Synchronicity in major fire activity years across provinces (e.g., 1961, 2005, 2007) was consistent with several studies on fire history, suggesting that changes in forest fire activity have been observed jointly over vast areas since the 1900s (e.g., Bergeron et al., 2004b; Macias Fauria and Johnson, 2008).
Annual burn rates (recent and historical) were underestimated in many areas of northern Québec. It appears that the simulation could not capture the expression of a climate type that is encountered in the Clay Belt of northwestern Québec, where periodic drought is known to occur. This may likely reflect some limitation that is imposed by the low density of weather stations north of 49∘ N. The lack of station replication can create excessively smoothed climate records, thereby reducing the possibility of correctly emulating the relationship between climate and forest fire activity during extreme drought and fire years (Girardin et al., 2006b, 2009; Xiao and Zhuang, 2007). For example, 1989 is known as a drought year, which was induced by changes in atmospheric circulation that were at the origin of numerous large fires (> 50 000 ha) in Manitoba and Québec (Fig. S4; Goetz et al., 2006; Xiao and Zhuang, 2007). Other large fires exceeding 50 000 ha were observed in northern Québec in 1983 and 2002 (Fig. S4). However, these extreme weather conditions were not reproduced in our input data set and, consequently, the model could not simulate these very large fires. These underestimates may also result, in part, from the lack of lightning strike records in these northernmost regions, which prevents fire ignition from being simulated there. Polarity or energy of lightning was not taken into account in our simulations. Positive lightning strikes (transfers of positive charges to the ground) mainly occur in the north and correspond to 10 % of all lightning strikes (Morissette and Gauthier, 2008), with the remaining lightning strikes being negative. Positive lightning strikes correspond to an exchange of energy between the highest part of the clouds and the soil, while negative lightning strikes are triggered in a lower part of the clouds. For this reason, positive lightning strikes are more likely to start fires because they carry higher energy owing to the greater travelling distance between the clouds and the soil (Flannigan and Wotton, 1991). As previously mentioned, the number of lightning sensors in northern regions (hatched areas in Fig. 4) is also limited (Orville et al., 2011), leading to a decrease in detection efficiency at these latitudes (Morissette and Gauthier, 2008). Thus, 10 % of positive lightning strikes are not appropriately captured and, consequently, the probability of fire ignition is also likely to be underestimated in these areas. Underestimation of fire activity in northern areas had consequences for the simulation results. Amongst other things, simulated tree mortality was underestimated and, hence, biomass proliferated (as can be noted in Fig. 4 with the Picea PFT).
4.2 History of fire in the eastern boreal forest of Canada described by LPJ-LMfire
Based upon the above preliminary agreement and despite some disagreements, the temporal patterns of annual burn rates that were simulated by LPJ-LMfire were strongly consistent with the forest fire histories that have been reconstructed in many studies (e.g., Stocks et al., 2003; Bergeron et al., 2004a; Girardin et al., 2006a). Multidecadal temporal changes in annual burn rates reflect the underlying influence of climate variability and extreme fire weather (Macias Fauria and Johnson, 2008; Girardin et al., 2009); these multidecadal temporal changes were well represented in the input climate data sets. An increase in temperatures and stability in precipitation between 1916 and 1924 (Fig. S9) could be at the origin of a high frequency of fire occurrence during those years, marking a pause in the decline of fire activity that had been observed since the 1850s (Bergeron et al., 2004a). Advection of humid air masses over eastern Canada between 1940 and 1970 contributed to the creation of moister conditions, which can lessen the capacity of a fire to spread after a lightning-induced fire ignition (Macias Fauria and Johnson, 2008). Both interannual variation and unsynchronized trends in climatic variables may have brought about changes in fire activity and could have affected the fire season, as it is proposed to have occurred over millennial timescales during the Holocene (Ali et al., 2012). For example, during the years 1977 and 1980, an increase in spring temperatures was observed, whereas spring precipitation decreased, which resulted in the total areas that were burned in spring being 50 % greater than in summer (Fig. S9).
Correlations between simulated and observed provincial annual burn rates were slightly higher than what has typically been encountered in past studies of fire–climate relationships over the region (e.g., Girardin et al., 2004, 2006a, 2009). For example, Girardin et al. (2009) reported that about 35 % of the variance in the annual areas that were burned in the provinces of Ontario and Québec was explained by summer moisture availability. In our modelling experiment, we obtained values between 41 and 50 % for these same provinces, without empirical adjustments (e.g., through regression analysis). The improvements that were made here reinforce the idea that aside from “top-down” climate control on fire activity, other factors such as lightning, fuel availability, and composition can influence fire statistics (Podur et al., 2002). This highlights the necessity of reconstructing fire history in a complex system that is related to climate and vegetation by taking into account several feedbacks (Hantson et al., 2016).
LPJ-LMfire simulations provide evidence for the combined influence of fuel conditions and ignition sources on fire within our study area. Indeed, an increase in precipitation around the 1930s constrained fire activity, despite a very high lightning strike density (Fig. S9). Conversely, at the end of the century, an increase in lightning strike density and a drier climate (Fig. S9) resulted in an increase in annual burn rates. The seasons during which precipitation events and lightning ignitions occur were also found to be important. Notably, LPJ-LMfire did not simulate the core of the fire season between June and August when the highest density of lightning strikes takes place (Morissette and Gauthier, 2008). This phenomenon finds an explanation in that heavy and intense rain events occurring later during the summer decrease the probability of starting fires; weather becomes less conducive to fire due to higher amounts of precipitation between July and September in comparison with April and June. That being said, our simulation was biased with regard to the onset of fire seasonality. LPJ-LMfire simulated the core of the fire season earlier than what is actually observed. LMfire excludes fire ignition when snow cover is present (Pfeiffer et al., 2013). However, detailed investigations at the grid-cell level in our study area revealed that the fire danger index, which was calculated by the LMfire module, was high as soon as all snow had melted in May and June. This index estimates the probability that an ignition event will start a fire, depending upon both fuel moisture and fire weather conditions (Thonicke et al., 2010). As suggested by Pfeiffer et al. (2013), LPJ-LMfire simulates a very quick drying-out of soils in spring when the snow cover has disappeared or snowmelt has occurred prematurely. This phenomenon may be the reason why it simulated fire season onset earlier than what is observed in Canada's eastern boreal forest.
CO2-induced enhancement of NPP (Norby et al., 2005; Huang et al., 2007) was clearly emulated in LPJ-LMfire. Our simulated 18 % growth enhancement, with a 32.5 % increase in CO2 concentration between 1901 and 2012, was higher than the 15 and 14 % growth increases that have been proposed by Hickler et al. (2008) and Girardin et al. (2011), respectively. LPJ-LMfire is highly sensitive to atmospheric CO2 concentration and interpreting its impacts must be carried out with caution (Girardin et al., 2011). That being said, our results suggest that CO2-induced enhancement of forest productivity can be offset by fires and climate, which is consistent with the results of Hayes et al. (2011) and Kelly et al. (2016). Despite strong CO2-induced enhancement of forest productivity in LPJ-LMfire, the total amount of aboveground biomass and forest composition did not change significantly during the course of the simulation period. The CO2-induced enhancement of NPP had a positive influence on annual burn rates by increasing the availability of fuel. Under very dry conditions, such as in 1971–1990 and 1991–2012, an increase in fire activity led to a decrease in growth and biomass. Drier conditions during the past few decades provided indications for an increase in growth decline events and in biomass reduction related to an increase in fire activity. A similar trend in such conditions was observed around the 1920s, but the range of these negative events during the past decades exceeds the historical range of variability recorded by the simulated forest. Fires had a non-negligible influence on the state of the boreal forest in eastern Canada, especially during the last few decades, but our results also confirm the relative influence of climate alone on the forest in northern regions. Indeed, in northern areas in Québec and Manitoba, biomass has not significantly increased, despite a very strong effect of CO2-induced enhancement (Fig. S6). We hypothesize that with ongoing global warming, growth decline events could increase substantially, given that the positive effect of CO2 concentration on the growth of forests may not be strong enough to compensate for the loss of biomass to fires and climate change (Kurz et al., 2008), which could lead to the opening up of landscapes.
4.3 Uncertainties and future perspectives
The present study demonstrated that LPJ-LMfire is generally able to capture fire history and forest growth trends in the eastern boreal forest of Canada. However, several uncertainties persist. First, forest establishment and the start of growth during the spin-up phase was simulated using a detrended version of modern climate, as is usually performed in DGVM runs (Prentice et al., 2011; Pfeiffer et al., 2013; Yue et al., 2016; Knorr et al., 2016). This initial condition assumes that past relationships between climate, fire, and vegetation have been stationary through time and that variability in modern climate is representative of all variability that has been recorded over the past 1200 years (time of spin-up phase + 112 years of simulation). However, it has been increasingly recognized that such an assumption is invalid and that modern observations are not a good analogue for prehistoric variability (Kelly et al., 2016; Hudiburg et al., 2017). For example, fire activity over much of the Holocene was higher in terms of frequency and fire size than the current levels across broad areas of eastern Canada (Girardin et al., 2013a; Remy et al., 2017). It is likely that not accounting for such variability may introduce biases in forest productivity dynamics and levels, more specifically on soil carbon dynamics (Hudiburg et al., 2017). This may be less problematic when studying fire and forest dynamics over the last century because the mean age of the major part of eastern boreal forest is less than 100 years (Bergeron et al., 2002).
The non-negligible influence of forest composition on fire regimes (Hély et al., 2001) is limited in the model to the representation of three needleleaf PFTs and one broadleaf PFT. Improving LPJ-LMfire's representation of biodiversity with further broadleaf PFT genera could counterbalance or offset overestimates of fire activity in southern areas since these species are less flammable than needleleaf species. Similarly, improving LPJ-LMfire parametrization to account for mosses could reduce overestimation of the quantity of fuel available in northern areas. In the Clay Belt, the poor drainage conditions induced by the presence of an impermeable clay substrate, flat topography, and a cold climate facilitate the accumulation of thick layers of organic soil, an edaphic process that is referred to as paludification (Fenton et al., 2006). Once Sphagnum species increase on the forest floor, the depth of burn varies only slightly in response to changes in weather conditions, owing to very low fluctuations in the degree of water saturation of the organic layer (Fenton et al., 2006).
In the present study, simulations are limited by the relatively low accuracy of soil attributes in databases for Canada's boreal forest (Hengl et al., 2014). The input data set of soil attributes that was used in our simulations tended to underestimate clay and sand percentages in our study area when compared to point observations (Fig. S10). These effects add up to other weaknesses in physiological constraints, such as cold climate not being sufficiently restrictive and allowing Picea to become overly abundant in the simulation runs. While a previous study showed that the abundance of Picea decreases with latitude in the tundra region and is coupled with the occurrence of dwarf shrubs in the Ericaceae and herbs (Gajewski et al., 1993), such species were not parametrized in the current version of LPJ-LMfire due to a lack of information on their physiological and biogeographical preferences. Future research could incorporate recently developed parameterizations for boreal shrubs and non-vascular plants into LPJ-LMfire (Druel, 2017; Druel et al., 2017).
Forest stand structure and successional dynamics (age classes), together with processes leading to the formation of peatlands, are not included in the present version of LPJ-LMfire. However, all of these aspects are important determinants of fire ignition and propagation under a given climate (Hély et al., 2001) and can also influence the distinction between crown and surface fires, which affect tree mortality differently (Hély et al., 2003; Yue et al., 2016). Moreover, LPJ-LMfire, like most DGVMs, does not consider constraints on species migrations, phenotypic plasticity, and local adaptation of species (Morin and Thuiller, 2009). The simulation results may be overly optimistic in terms of the capacity of southern species to colonize newly available areas in northern regions as the climate warms. As previously mentioned by Morin and Thuiller (2009), species colonization in northern regions could be limited by forest attributes, such as fragmented landscapes or high competition levels from existing species, or through migrational lag (Epstein et al., 2007).
Wildland fires are the most important natural disturbances in Canada's eastern boreal forest, but non-fire and human disturbances also have considerable effects (Price et al., 2013) and may influence fire activity trajectories indirectly. Integrating a range of forest disturbances into a DGVM could improve the accuracy of forecasting and modelling climate change effects on Canada's eastern boreal forest. For instance, insect damage (MacLean, 2016) and outbreaks of eastern spruce budworm (Choristoneura fumiferana) in particular (Zhang et al., 2014; James et al., 2017) represent significant forest disturbances by the way they temporarily alter forest structure by affecting specific tree growth, tree survival, regeneration, and succession. These disturbances can also have an important impact on fire activity by modifying fuel distribution and connectivity (James et al., 2017). Additionally, successive fires that take place over a short period before the trees have attained maturity can lead to complete regeneration failure (Girard et al., 2008). Such events in young, unproductive stands can also lead to modified forest composition (Girard et al., 2008) and could exert a strong feedback on ecosystem structure by generating changes in temporal fire patterns over long timescales. Finally, the effects of human activities, such as forest management and active fire suppression efforts, on the composition and distribution of forest fuels were not implemented in the present LPJ-LMfire simulations. Nonetheless, the strong correlation between our simulated annual burn rates and observed data suggests that active fire suppression efforts and forest management since about the 1950s (Le Goff et al., 2008; Lefort et al., 2003) have not contributed much to shifting fire behaviour trajectories in our study region, which admittedly has very low densities of both population and infrastructure in comparison with other populated areas such as in the United States (e.g., Syphard et al., 2017).
In this study, we used LPJ-LMfire to simulate fire activity from 1901 to 2012 in Canada's eastern boreal forest, at a 10 km resolution. LPJ-LMfire was parametrized for the predominant forest tree genera that are present in our study region, i.e, Picea, Abies, Pinus, and Populus. The predictive skill of the model to simulate fire activity was determined by comparing our model simulations with published data. LPJ-LMfire was able to simulate interannual- to decadal-scale fire variability from the beginning of the 20th century. However, the low density of weather stations in northern areas likely limited the model's ability to capture some extreme fire years. Our study highlights the importance of changes in climate variables on multi-decadal and annual timescales in strongly controlling spatiotemporal patterns of fire that were simulated by LPJ-LMfire. Spatiotemporal patterns were well captured, based upon our climate data inputs. Despite an overarching CO2-induced enhancement of NPP in LPJ-LMfire, aboveground biomass was relatively stable because of the compensatory effects of increasing fire activity. This study helps reduce uncertainties in our knowledge regarding fire patterns in the recent past and confirms that fires have been a dominant driver of boreal forest in eastern Canada during the last century. We further provide a new tool to refine predictions of future fire risks and effects of ongoing climate change in these forests to better inform management and improve risk mitigation strategies.
The source code of LPJ-LMfire is available at https://github.com/ARVE-Research/LPJ-LMfire/tree/v1.3 (Kaplan et al., 2018).
The supplement related to this article is available online at: https://doi.org/10.5194/bg-15-1273-2018-supplement.
EC, MG, YB, and CH conceived and designed the study. EC performed the simulations and prepared input data sets with the help of JK. JP performed statistical calculations of annual burn rates for our simulation period according to the protocol described by Portier et al. (2016). EC, MG, JK, YB, and CH interpreted the results. EC prepared the paper with contributions from all co-authors.
The authors declare that they have no conflict of interest.
This study was made possible thanks to the financial support provided by
the European IRSES NEWFOREST project, the Forest Complexity Modelling (FCM)
program, and the NSERC Strategic and Discovery programs. Jed Kaplan was
supported by the European Research Council (COEVOLVE 313797). This research
was conducted as part of the International Associated Laboratory MONTABOR
(LIA France–Canada) and the International Research Group on Cold Forests. We
thank Melanie Desrochers and Xiao Jing Guo for their help with mapping and
computation for this project. We also thank Daniel Stubbs from Calcul Québec
and Compute Canada for help with the Fortran language and server space
facilities for running LPJ-LMfire. We also thank William F. J. Parsons and Isabelle Lamarre for English language editing of a previous version of the paper and the two anonymous
reviewers for comments on an earlier version.
Edited by: Paul Stoy
Reviewed by: two anonymous referees
Ali, A. A., Carcaillet, C., and Bergeron, Y.: Long-term fire frequency variability in the eastern Canadian boreal forest: the influences of climate vs. local factors, Glob. Change Biol., 15, 1230–1241, https://doi.org/10.1111/j.1365-2486.2009.01842.x, 2009.
Ali, A. A., Blarquez, O., Girardin, M. P., Hely, C., Tinquaut, F., El Guellab, A., Valsecchi, V., Terrier, A., Bremond, L., Genries, A., Gauthier, S., and Bergeron, Y.: Control of the multimillennial wildfire size in boreal North America by spring climatic conditions, P. Natl. Acad. Sci. USA, 109, 20966–20970, https://doi.org/10.1073/pnas.1203467109, 2012.
Andrews, P. L., Bevins, C. D., and Seli, R. C.: BehavePlus fire modeling system, version 4.0: User's Guide, available from: https://www.fs.fed.us/rm/pubs/rmrs_gtr106.pdf (last access: 24 July 2017), 2008.
Baker, D. J., Hartley, A. J., Butchart, S. H. M., and Willis, S. G.: Choice of baseline climate data impacts projected species' responses to climate change, Glob. Change Biol., 22, 2392–2404, https://doi.org/10.1111/gcb.13273, 2016.
Beaudoin, A., Bernier, P. Y., Guindon, L., Villemaire, P., Guo, X. J., Stinson, G., Bergeron, T., Magnussen, S., and Hall, R. J.: Mapping attributes of Canada's forests at moderate resolution through kNN and MODIS imagery, Can. J. Forest Res., 44, 521–532, https://doi.org/10.1139/cjfr-2013-0401, 2014.
Beauregard, F. and de Blois, S.: Beyond a climate-centric view of plant distribution: edaphic variables add value to distribution models, PLoS One, 9, e92642, https://doi.org/10.1371/journal.pone.0092642, 2014.
Bergeron, Y., Richard, P. J., Carcaillet, C., Gauthier, S., Flannigan, M., and Prairie, Y.: Variability in fire frequency and forest composition in Canada's southeastern boreal forest: a challenge for sustainable forest management, Conserv. Ecol., 2, 1–10, 1998.
Bergeron, Y., Leduc, A., Harvey, B. D., and Gauthier, S.: Natural fire regime: A guide for sustainable management of the Canadian boreal forest, Silva Fenn., 36, 81–95, 2002.
Bergeron, Y., Gauthier, S., Flannigan, M., and Kafka, V.: Fire regimes at the transition between mixedwood and coniferous boreal forest in northwestern Quebec, Ecology, 85, 1916–1932, https://doi.org/10.1890/02-0716, 2004a.
Bergeron, Y., Flannigan, M., Gauthier, S., Leduc, A., and Lefort, P.: Past, current and future fire frequency in the Canadian boreal forest: implications for sustainable forest management, Ambio, 33, 356–360, https://doi.org/10.1579/0044-7447-33.6.356, 2004b.
Bergeron, Y., Chen, H. Y., Kenkel, N. C., Leduc, A. L., and Macdonald, S. E.: Boreal mixedwood stand dynamics: ecological processes underlying multiple pathways, Forest. Chron., 90, 202–213, https://doi.org/10.5558/tfc2014-039, 2014.
Bond, T. C., Streets, D. G., Yarber, K. F., Nelson, S. M., Woo, J.-H., and Klimont, Z.: A technology-based global inventory of black and organic carbon emissions from combustion, J. Geophys. Res.-Atmos., 109, D14203, https://doi.org/10.1029/2003JD003697, 2004.
Boulanger, Y., Gauthier, S., Burton, P. J., and Vaillancourt, M.-A.: An alternative fire regime zonation for Canada, Int. J. Wildland Fire, 21, 1052–1064, 2012.
Boulanger, Y., Gauthier, S., and Burton, P. J.: A refinement of models projecting future Canadian fire regimes using homogeneous fire regime zones, Can. J. Forest Res., 44, 365–376, https://doi.org/10.1139/cjfr-2013-0372, 2014.
Brandt, J. P.: The extent of the North American boreal zone, Environ. Rev., 17, 101–161, https://doi.org/10.1139/A09-004, 2009.
Canadian Council of Forest Ministers: National Forestry Database. Forest Fire Statistics by Province/Territory/Agency, 1990–2016, available from: http://nfdp.ccfm.org/data/compendium/html/comp_31e.html, last access: 8 June 2017.
Canadian Forest Service: National Fire Database – Agency Fire Data, Natural Resources Canada, Canadian Forest Service, Northern Forestry Centre, Edmonton, Alberta, available from: http://cwfis.cfs.nrcan.gc.ca/ah/nfdb (last access: 6 March 2017), 2016.
Compo, G. P., Whitaker, J. S., Sardeshmukh, P. D., Matsui, N., Allan, R. J., Yin, X., Gleason, B. E., Vose, R. S., Rutledge, G., Bessemoulin, P., Brönnimann, S., Brunet, M., Crouthamel, R. I., Grant, A. N., Groisman, P. Y., Jones, P. D., Kruk, M. C., Kruger, A. C., Marshall, G. J., Maugeri, M., Mok, H. Y., Nordli, Ø., Ross, T. F., Trigo, R. M., Wang, X. L., Woodruff, S. D., and Worley, S. J.: The Twentieth Century Reanalysis Project, Q. J. R. Meteorol. Soc., 137, 1–28, https://doi.org/10.1002/qj.776, 2011.
Danneyrolles, V., Arseneault, D., and Bergeron, Y.: Pre-industrial landscape composition patterns and post-industrial changes at the temperate–boreal forest interface in western Quebec, Canada, J. Veg. Sci., 27, 470–481, https://doi.org/10.1111/jvs.12373, 2016.
Druel, A.: Modélisation de la végétation boréale et de sa dynamique dans le modèle de surface continentale ORCHIDEE, Université Grenoble Alpes, Grenoble, 2017.
Druel, A., Peylin, P., Krinner, G., Ciais, P., Viovy, N., Peregon, A., Bastrikov, V., Kosykh, N., and Mironycheva-Tokareva, N.: Towards a more detailed representation of high-latitude vegetation in the global land surface model ORCHIDEE (ORC-HL-VEGv1.0), Geosci. Model Dev., 10, 4693–4722, https://doi.org/10.5194/gmd-10-4693-2017, 2017.
Ecological Stratification Working Group: A national ecological framework for Canada, available from: http://sis.agr.gc.ca/cansis/references/1996ew_a.html (last access: 7 February 2017), 1996.
Environment Canada: National Climate Data and Information Archive. Available at climate.weatheroffice.gc.ca/, available from: http://climate.weatheroffice.gc.ca/ (last access: 27 February 2017), 2013.
Epstein, H. E., Yu, Q., Kaplan, J. O., and Lischke, H.: Simulating future changes in arctic and subarctic vegetation, Comput. Sci. Eng., 9, 12–23, https://doi.org/10.1109/MCSE.2007.84, 2007.
Erni, S., Arseneault, D., Parisien, M.-A., and Bégin, Y.: Spatial and temporal dimensions of fire activity in the fire-prone eastern Canadian taiga, Glob. Change Biol., 23, 1152–1166, https://doi.org/10.1111/gcb.13461, 2017.
Fenton, N., Légaré, S., Bergeron, Y., Paré, D., and others: Soil oxygen within boreal forests across an age gradient, Can. J. Soil Sci., 86, 1–10, https://doi.org/10.4141/S05-004, 2006.
Flannigan, M., Stocks, B., Turetsky, M., and Wotton, M.: Impacts of climate change on fire activity and fire management in the circumboreal forest, Glob. Change Biol., 15, 549–560, https://doi.org/10.1111/j.1365-2486.2008.01660.x, 2009.
Flannigan, M. D. and Wotton, B. M.: Lightning-ignited forest fires in northwestern Ontario, Can. J. Forest Res., 21, 277–287, 1991.
Flannigan, M. D., Stocks, B. J., and Wotton, B. M.: Climate change and forest fires, Sci. Total Environ., 262, 221–229, 2000.
Flannigan, M. D., Wotton, B. M., Marshall, G. A., Groot, W. J. de, Johnston, J., Jurko, N., and Cantin, A. S.: Fuel moisture sensitivity to temperature and precipitation: climate change implications, Climatic Change, 134, 59–71, https://doi.org/10.1007/s10584-015-1521-0, 2016.
Gajewski, K., Payette, S., and Ritchie, J. C.: Holocene vegetation history at the boreal-forest–shrub-tundra transition in North-Western Quebec, J. Ecol., 81, 433–443, 1993.
Gauthier, S., Bergeron, Y., and Simon, J.-P.: Effects of fire regime on the serotiny level of jack pine, J. Ecol., 84, 539–548, https://doi.org/10.2307/2261476, 1996.
Gauthier, S., Bernier, P., Burton, P. J., Edwards, J., Isaac, K., Isabel, N., Jayen, K., Le Goff, H., and Nelson, E. A.: Climate change vulnerability and adaptation in the managed Canadian boreal forest, Environ. Rev., 22, 256–285, https://doi.org/10.1139/er-2013-0064, 2014.
Gewehr, S., Drobyshev, I., Berninger, F., and Bergeron, Y.: Soil characteristics mediate the distribution and response of boreal trees to climatic variability, Can. J. Forest Res., 44, 487–498, https://doi.org/10.1139/cjfr-2013-0481, 2014.
Girard, F., Payette, S., and Gagnon, R.: Rapid expansion of lichen woodlands within the closed-crown boreal forest zone over the last 50 years caused by stand disturbances in eastern Canada, J. Biogeogr., 35, 529–537, https://doi.org/10.1111/j.1365-2699.2007.01816.x, 2008.
Girardin, M. P. and Mudelsee, M.: Past and future changes in Canadian boreal wildfire activity, Ecol. Appl., 18, 391–406, https://doi.org/10.1890/07-0747.1, 2008.
Girardin, M. P. and Terrier, A.: Mitigating risks of future wildfires by management of the forest composition: an analysis of the offsetting potential through boreal Canada, Climatic Change, 130, 587–601, https://doi.org/10.1007/s10584-015-1373-7, 2015.
Girardin, M. P., Bergeron, Y., Tardif, J. C., Gauthier, S., Flannigan, M. D., and Mudelsee, M.: A 229-year dendroclimatic-inferred record of forest fire activity for the Boreal Shield of Canada, Int. J. Wildland Fire, 15, 375–388, https://doi.org/10.1071/WF05065, 2006a.
Girardin, M. P., Tardif, J. C., Flannigan, M. D.. and Bergeron, Y.: Forest fire-conducive drought variability in the southern Canadian boreal forest and associated climatology inferred from tree rings, Can. Water Resour. J., 31, 275–296, https://doi.org/10.4296/cwrj3104275, 2006b.
Girardin, M. P., Ali, A. A., Carcaillet, C., Mudelsee, M., Drobyshev, I., Hély, C., and Bergeron, Y.: Heterogeneous response of circumboreal wildfire risk to climate change since the early 1900s, Glob. Change Biol., 15, 2751–2769, https://doi.org/10.1111/j.1365-2486.2009.01869.x, 2009.
Girardin, M. P., Bernier, P. Y., Raulier, F., Tardif, J. C., Conciatori, F. and Guo, X. J.: Testing for a CO2 fertilization effect on growth of Canadian boreal forests, J. Geophys. Res.-Biogeo., 116, G01012, https://doi.org/10.1029/2010JG001287, 2011.
Girardin, M. P., Ali, A. A., Carcaillet, C., Gauthier, S., Hély, C., Le Goff, H., Terrier, A., and Bergeron, Y.: Fire in managed forests of eastern Canada: Risks and options, Forest Ecol. Manag., 294, 238–249, https://doi.org/10.1016/j.foreco.2012.07.005, 2013a.
Girardin, M. P., Ali, A. A., Carcaillet, C., Blarquez, O., Hély, C., Terrier, A., Genries, A., and Bergeron, Y.: Vegetation limits the impact of a warm climate on boreal wildfires, New Phytol., 199, 1001–1011, https://doi.org/10.1111/nph.12322, 2013b.
Girardin, M.-P., Tardif, J., and Bergeron, Y.: Gradient analysis of Larix laricina dominated wetlands in Canada's southeastern boreal forest, Can. J. Bot., 79, 444–456, https://doi.org/10.1139/b01-023, 2001.
Girardin, M.-P., Tardif, J., Flannigan, M. D., Wotton, B. M., and Bergeron, Y.: Trends and periodicities in the Canadian Drought Code and their relationships with atmospheric circulation for the southern Canadian boreal forest, Can. J. Forest Res., 34, 103–119, https://doi.org/10.1139/x03-195, 2004.
Goetz, S. J., Fiske, G. J., and Bunn, A. G.: Using satellite time-series data sets to analyze fire disturbance and forest recovery across Canada, Remote Sens. Environ., 101, 352–365, https://doi.org/10.1016/j.rse.2006.01.011, 2006.
Hantson, S., Arneth, A., Harrison, S. P., Kelley, D. I., Prentice, I. C., Rabin, S. S., Archibald, S., Mouillot, F., Arnold, S. R., Artaxo, P., Bachelet, D., Ciais, P., Forrest, M., Friedlingstein, P., Hickler, T., Kaplan, J. O., Kloster, S., Knorr, W., Lasslop, G., Li, F., Mangeon, S., Melton, J. R., Meyn, A., Sitch, S., Spessa, A., van der Werf, G. R., Voulgarakis, A., and Yue, C.: The status and challenge of global fire modelling, Biogeosciences, 13, 3359–3375, https://doi.org/10.5194/bg-13-3359-2016, 2016.
Hayes, D. J., McGuire, A. D., Kicklighter, D. W., Gurney, K. R., Burnside, T. J., and Melillo, J. M.: Is the northern high-latitude land-based CO2 sink weakening?, Global Biogeochem. Cy., 25, GB3018, https://doi.org/10.1029/2010GB003813, 2011.
Hély, C., Flannigan, M., Bergeron, Y., and McRae, D.: Role of vegetation and weather on fire behavior in the Canadian mixedwood boreal forest using two fire behavior prediction systems, Can. J. Forest Res., 31, 430–441, https://doi.org/10.1139/cjfr-31-3-430, 2001.
Hély, C., Flannigan, M., and Bergeron, Y.: Modeling tree mortality following wildfire in the southeastern Canadian mixed-wood boreal forest, Forest Sci., 49, 566–576, 2003.
Hengl, T., de Jesus, J. M., MacMillan, R. A., Batjes, N. H., Heuvelink, G. B. M., Ribeiro, E., Samuel-Rosa, A., Kempen, B., Leenaars, J. G. B., Walsh, M. G., and Gonzalez, M. R.: SoilGrids1km – Global soil information based on automated mapping, PLoS One, 9, e105992, https://doi.org/10.1371/journal.pone.0105992, 2014.
Héon, J., Arseneault, D., and Parisien, M.-A.: Resistance of the boreal forest to high burn rates, P. Natl. Acad. Sci. USA, 111, 13888–13893, https://doi.org/10.1073/pnas.1409316111, 2014.
Hessl, A. E.: Pathways for climate change effects on fire: Models, data, and uncertainties, Prog. Phys. Geogr., 35, 393–407, https://doi.org/10.1177/0309133311407654, 2011.
Hickler, T., Smith, B., Prentice, I. C., Mjöfors, K., Miller, P., Arneth, A., and Sykes, M. T.: CO2 fertilization in temperate FACE experiments not representative of boreal and tropical forests, Glob. Change Biol., 14, 1531–1542, https://doi.org/10.1111/j.1365-2486.2008.01598.x, 2008.
Huang, J.-G., Bergeron, Y., Denneler, B., Berninger, F., and Tardif, J.: Response of forest trees to increased atmospheric CO2, Crit. Rev. Plant Sci., 26, 265–283, https://doi.org/10.1080/07352680701626978, 2007.
Hudiburg, T. W., Higuera, P. E., and Hicke, J. A.: Fire-regime variability impacts forest carbon dynamics for centuries to millennia, Biogeosciences, 14, 3873–3882, https://doi.org/10.5194/bg-14-3873-2017, 2017.
IPCC: Climate Change 2013 – The Physical Science Basis: Working Group I Contribution to the Fifth Assessment Report of the Intergovernmental Panel on Climate Change, Cambridge University Press, Cambridge, 2013.
James, P. M. A., Robert, L.-E., Wotton, B. M., Martell, D. L., and Fleming, R. A.: Lagged cumulative spruce budworm defoliation affects the risk of fire ignition in Ontario, Canada, Ecol. Appl., 27, 532–544, https://doi.org/10.1002/eap.1463, 2017.
Kaplan, J. O., Pfeiffer, M., and Chaste, E.: ARVE-Research/LPJ-LMfire: LPJ-LMfire (Version v1.3), Zenodo, https://doi.org/10.5281/zenodo.1184589, last access: 26 February 2018.
Kasischke, E. S. and Turetsky, M. R.: Recent changes in the fire regime across the North American boreal region – Spatial and temporal patterns of burning across Canada and Alaska, Geophys. Res. Lett., 33, L09703, https://doi.org/10.1029/2006GL025677, 2006.
Keeley, J. E.: Fire intensity, fire severity and burn severity: a brief review and suggested usage, Int. J. Wildland Fire, 18, 116–126, https://doi.org/10.1071/WF07049, 2009.
Keeling, R. F., Piper, S. C., Bollenbacher, A. F., and Walker, J. S.: Atmospheric CO2 records from sites in the SIO air sampling network, in: Trends: A Compendium of Data on Global Change, Carbon Dioxide Information Analysis Center, Oak Ridge National Laboratory, US Department of Energy, Oak Ridge, TN, USA, https://doi.org/10.3334/CDIAC/atg.035, 2009.
Kelly, R., Genet, H., McGuire, A. D., and Hu, F. S.: Palaeodata-informed modelling of large carbon losses from recent burning of boreal forests, Nature Climate Change, 6, 79–82, https://doi.org/10.1038/nclimate2832, 2016.
Knorr, W., Arneth, A., and Jiang, L.: Demographic controls of future global fire risk, Nature Climate Change, 6, 781–785, https://doi.org/10.1038/nclimate2999, 2016.
Kochtubajda, B. and Burrows, W.: Cloud-to-Ground Lightning in Canada: 1999–2008, vol. 12, p. 1280, available from: http://adsabs.harvard.edu/abs/2010EGUGA12.1280K (last access: 31 July 2017), 2010.
Kurz, W. A., Stinson, G., and Rampley, G.: Could increased boreal forest ecosystem productivity offset carbon losses from increased disturbances?, Philos. T. R. Soc. Lon. B, 363, 2259–2268, https://doi.org/10.1098/rstb.2007.2198, 2008.
Kurz, W. A., Shaw, C. H., Boisvenue, C., Stinson, G., Metsaranta, J., Leckie, D., Dyk, A., Smyth, C., and Neilson, E. T.: Carbon in Canada's boreal forest – A synthesis, Environ. Rev., 21, 260–292, https://doi.org/10.1139/er-2013-0041, 2013.
Lefort, P., Gauthier, S., and Bergeron, Y.: The influence of fire weather and land use on the fire activity of the Lake Abitibi area, eastern Canada, Forest Sci., 49, 509–521, 2003.
Le Goff, H., Girardin, M. P., Flannigan, M. D., and Bergeron, Y.: Dendroclimatic inference of wildfire activity in Quebec over the 20th century and implications for natural disturbance-based forest management at the northern limit of the commercial forest, Int. J. Wildland Fire, 17, 348–362, https://doi.org/10.1071/WF07080, 2008.
Macias Fauria, M. and Johnson, E. A.: Climate and wildfires in the North American boreal forest, Philos. T. Roy. Soc. B, 363, 2315–2327, https://doi.org/10.1098/rstb.2007.2202, 2008.
MacLean, D. A.: Impacts of insect outbreaks on tree mortality, productivity, and stand development, Can. Entomol., 148, S138–S159, https://doi.org/10.4039/tce.2015.24, 2016.
Mansuy, N., Gauthier, S., Robitaille, A., and Bergeron, Y.: The effects of surficial deposit–drainage combinations on spatial variations of fire cycles in the boreal forest of eastern Canada, Int. J. Wildland Fire, 19, 1083–1098, https://doi.org/10.1071/WF09144, 2011.
Margolis, H. A., Nelson, R. F., Montesano, P. M., Beaudoin, A., Sun, G., Andersen, H.-E., and Wulder, M. A.: Combining satellite lidar, airborne lidar, and ground plots to estimate the amount and distribution of aboveground biomass in the boreal forest of North America 1, Can. J. Forest Res., 45, 838–855, https://doi.org/10.1139/cjfr-2015-0006, 2015.
Messaoud, Y., Bergeron, Y., and Asselin, H.: Reproductive potential of balsam fir (Abies balsamea), white spruce (Picea glauca), and black spruce (P. mariana) at the ecotone between mixedwood and coniferous forests in the boreal zone of western Quebec, Am. J. Bot., 94, 746–754, https://doi.org/10.3732/ajb.94.5.746, 2007.
Molinari, C., Lehsten, V., Bradshaw, R. H. W., Power, M. J., Harmand, P., Arneth, A., Kaplan, J. O., Vannière, B., and Sykes, M. T.: Exploring potential drivers of European biomass burning over the Holocene: a data-model analysis, Global Ecol. Biogeogr., 22, 1248–1260, https://doi.org/10.1111/geb.12090, 2013.
Morin, X. and Thuiller, W.: Comparing niche- and process-based models to reduce prediction uncertainty in species range shifts under climate change, Ecology, 90, 1301–1313, https://doi.org/10.1890/08-0134.1, 2009.
Morissette, J. and Gauthier, S.: Study of cloud-to-ground lightning in Quebec: 1996–2005, Atmos. Ocean, 46, 443–454, https://doi.org/10.3137/AO919.2008, 2008.
Moritz, M. A., Krawchuk, M. A., and Parisien, M.-A.: Pyrogeography: Understanding the ecological niche of fire, PAGES News, 18, 83–85, 2010.
Natural Resources Canada: Geobase – Canadian digital elevation data, Geogratis, available from: http://ftp.geogratis.gc.ca/pub/nrcan_rncan/elevation/canada3d/ (last access: 8 September 2013), 2007.
Natural Resources Canada: Geobase – National hydro network, Geogratis, available from: http://ftp.geogratis.gc.ca/pub/nrcan_rncan/vector/geobase_nhn_rhn/ (last access: 24 November 2014), 2010.
Norby, R. J., DeLucia, E. H., Gielen, B., Calfapietra, C., Giardina, C. P., King, J. S., Ledford, J., McCarthy, H. R., Moore, D. J. P., Ceulemans, R., De Angelis, P., Finzi, A. C., Karnosky, D. F., Kubiske, M. E., Lukac, M., Pregitzer, K. S., Scarascia-Mugnozza, G. E., Schlesinger, W. H., and Oren, R.: Forest response to elevated CO2 is conserved across a broad range of productivity, P. Natl. Acad. Sci. USA, 102, 18052–18056, https://doi.org/10.1073/pnas.0509478102, 2005.
Orville, R. E., Huffines, G. R., Burrows, W. R., Holle, R. L., and Cummins, K. L.: The North American lightning detection network (NALDN) – First results: 1998–2000, Mon. Weather Rev., 130, 2098–2109, https://doi.org/10.1175/1520-0493(2002)130<2098:TNALDN>2.0.CO;2, 2002.
Orville, R. E., Huffines, G. R., Burrows, W. R., and Cummins, K. L.: The North American Lightning Detection Network (NALDN) – Analysis of flash data: 2001–09, Mon. Weather Rev., 139, 1305–1322, https://doi.org/10.1175/2010MWR3452.1, 2011.
Pan, Y., Birdsey, R. A., Fang, J., Houghton, R., Kauppi, P. E., Kurz, W. A., Phillips, O. L., Shvidenko, A., Lewis, S. L., Canadell, J. G., Ciais, P., Jackson, R. B., Pacala, S. W., McGuire, A. D., Piao, S., Rautiainen, A., Sitch, S., and Hayes, D.: A large and persistent carbon sink in the world's forests, Science, 333, 988–993, https://doi.org/10.1126/science.1201609, 2011.
Payette, S., Filion, L., and Delwaide, A.: Spatially explicit fire-climate history of the boreal forest-tundra (Eastern Canada) over the last 2000 years, Philos. T. R. Soc. Lon. B, 363, 2299–2314, https://doi.org/10.1098/rstb.2007.2201, 2008.
Peterson, D., Wang, J., Ichoku, C., and Remer, L. A.: Effects of lightning and other meteorological factors on fire activity in the North American boreal forest: implications for fire weather forecasting, Atmospheric Chem. Phys., 10, 6873–6888, https://doi.org/10.5194/acp-10-6873-2010, 2010.
Pfeiffer, M., Spessa, A., and Kaplan, J. O.: A model for global biomass burning in preindustrial time: LPJ-LMfire (v1. 0), Geosci. Model Dev., 6, 643–685, https://doi.org/10.5194/gmd-6-643-2013, 2013.
Podur, J., Martell, D. L., and Knight, K.: Statistical quality control analysis of forest fire activity in Canada, Can. J. Forest Res., 32, 195–205, https://doi.org/10.1139/X01-183, 2002.
Portier, J., Gauthier, S., Leduc, A., Arseneault, D., and Bergeron, Y.: Fire regime along latitudinal gradients of continuous to discontinuous coniferous boreal forests in eastern Canada, Forests, 211, 1–23, https://doi.org/10.3390/f7100211, 2016.
Prentice, I. C., Kelley, D. I., Foster, P. N., Friedlingstein, P., Harrison, S. P., and Bartlein, P. J.: Modeling fire and the terrestrial carbon balance, Global Biogeochem. Cy., 25, GB3005, https://doi.org/10.1029/2010GB003906, 2011.
Price, D. T., Alfaro, R. I., Brown, K. J., Flannigan, M. D., Fleming, R. A., Hogg, E. H., Girardin, M.-P., Lakusta, T., Johnston, M. H., McKenney, D. W., Pedlar, J. H., Stratton, T., Sturrock, R. N., Thompson, I. D., Trofymow, J. A., and Venier, L. A.: Anticipating the consequences of climate change for Canada's boreal forest ecosystems, Environ. Rev., 21, 322–365, https://doi.org/10.1139/er-2013-0042, 2013.
Rabin, S. S., Melton, J. R., Lasslop, G., Bachelet, D., Forrest, M., Hantson, S., Kaplan, J. O., Li, F., Mangeon, S., Ward, D. S., Yue, C., Arora, V. K., Hickler, T., Kloster, S., Knorr, W., Nieradzik, L., Spessa, A., Folberth, G. A., Sheehan, T., Voulgarakis, A., Kelley, D. I., Prentice, I. C., Sitch, S., Harrison, S., and Arneth, A.: The Fire Modeling Intercomparison Project (FireMIP), phase 1: experimental and analytical protocols with detailed model descriptions, Geosci. Model Dev., 10, 1175–1197, https://doi.org/10.5194/gmd-10-1175-2017, 2017.
Régnière, J., Saint-Amant, R., and Béchard, A.: BioSIM 10 – Guide de l'utilisateur, Ressour. Nat. Can., Serv. can. for., Cent. for. Laurentides, Québec (Québec), available from: http://www.cfs.nrcan.gc.ca/publications/?id=34817 (last access: 31 July 2017), 2014.
Remy, C. C., Hély, C., Blarquez, O., Magnan, G., Bergeron, Y., Lavoie, M., and Ali, A. A.: Different regional climatic drivers of Holocene large wildfires in boreal forests of northeastern America, Environ. Res. Lett., 12, 035005, https://doi.org/10.1088/1748-9326/aa5aff, 2017.
Rodionov, S. N.: A sequential algorithm for testing climate regime shifts, Geophys. Res. Lett., 31, L09204, https://doi.org/10.1029/2004GL019448, 2004.
Rodionov, S. N.: Use of prewhitening in climate regime shift detection, Geophys. Res. Lett., 33, L12707, https://doi.org/10.1029/2006GL025904, 2006.
Rogers, B. M., Randerson, J. T., and Bonan, G. B.: High-latitude cooling associated with landscape changes from North American boreal forest fires, Biogeosciences, 10, 699–718, https://doi.org/10.5194/bg-10-699-2013, 2013.
Romps, D. M., Seeley, J. T., Vollaro, D., and Molinari, J.: Projected increase in lightning strikes in the United States due to global warming, Science, 346, 851–854, https://doi.org/10.1126/science.1259100, 2014.
Rothermel, R. C.: A Mathematical Model for Predicting Fire Spread in Wildland Fuels, Intermountain Forest and Range Experiment Station, Forest Service, US Department of Agriculture, Ogden, Utah, 1972.
Shorohova, E., Kneeshaw, D., Kuuluvainen, T., and Gauthier, S.: Variability and dynamics of old-growth forests in the circumboreal zone: implications for conservation, restoration and management, Silva Fenn., 45, 785–806, 2011.
Sitch, S., Smith, B., Prentice, I. C., Arneth, A., Bondeau, A., Cramer, W., Kaplan, J. O., Levis, S., Lucht, W., Sykes, M. T., Thonicke, K., and Venevsky, S.: Evaluation of ecosystem dynamics, plant geography and terrestrial carbon cycling in the LPJ dynamic global vegetation model, Glob. Change Biol., 9, 161–185, https://doi.org/10.1046/j.1365-2486.2003.00569.x, 2003.
Smith, B., Prentice, I. C., and Sykes, M. T.: Representation of vegetation dynamics in the modelling of terrestrial ecosystems: comparing two contrasting approaches within European climate space, Glob. Ecol. Biogeogr., 10, 621–637, https://doi.org/10.1046/j.1466-822X.2001.t01-1-00256.x, 2001.
Stocks, B. J., Mason, J. A., Todd, J. B., Bosch, E. M., Wotton, B. M., Amiro, B. D., Flannigan, M. D., Hirsch, K. G., Logan, K. A., Martell, D. L., and Skinner, W. R.: Large forest fires in Canada, 1959–1997, J. Geophys. Res.-Atmos., 107, 8149, https://doi.org/10.1029/2001JD000484, 2003.
Syphard, A. D., Keeley, J. E., Pfaff, A. H., and Ferschweiler, K.: Human presence diminishes the importance of climate in driving fire activity across the United States, P. Natl. Acad. Sci. USA, 114, 13750–13755, https://doi.org/10.1073/pnas.1713885114, 2017.
Tang, G., Beckage, B., Smith, B., and Miller, P. A.: Estimating potential forest NPP, biomass and their climatic sensitivity in New England using a dynamic ecosystem model, Ecosphere, 1, 1–20, https://doi.org/10.1890/ES10-00087.1, 2010.
Thonicke, K., Spessa, A., Prentice, I. C., Harrison, S. P., Dong, L., and Carmona-Moreno, C.: The influence of vegetation, fire spread and fire behaviour on biomass burning and trace gas emissions: results from a process-based model, Biogeosciences, 7, 1991–2011, https://doi.org/10.5194/bg-7-1991-2010, 2010.
Van Wagner, C. E.: Development and structure of the Canadian Forest Fire Weather Index System, available from: https://cfs.nrcan.gc.ca/publications?id=19927 (last access: 26 April 2017), 1987.
Wang, X., Thompson, D. K., Marshall, G. A., Tymstra, C., Carr, R., and Flannigan, M. D.: Increasing frequency of extreme fire weather in Canada with climate change, Climatic Change, 130, 573–586, https://doi.org/10.1007/s10584-015-1375-5, 2015.
Xiao, J. and Zhuang, Q.: Drought effects on large fire activity in Canadian and Alaskan forests, Environ. Res. Lett., 2, 044003, https://doi.org/10.1088/1748-9326/2/4/044003, 2007.
Yue, C., Ciais, P., Zhu, D., Wang, T., Peng, S. S., and Piao, S. L.: How have past fire disturbances contributed to the current carbon balance of boreal ecosystems?, Biogeosciences, 13, 675–690, https://doi.org/10.5194/bg-13-675-2016, 2016.
Zhang, X., Lei, Y., Ma, Z., Kneeshaw, D., and Peng, C.: Insect-induced tree mortality of boreal forests in eastern Canada under a changing climate, Ecol. Evol., 4, 2384–2394, https://doi.org/10.1002/ece3.988, 2014.