the Creative Commons Attribution 3.0 License.
the Creative Commons Attribution 3.0 License.
Organic matter dynamics along a salinity gradient in Siberian steppe soils
Norbert Bischoff
Robert Mikutta
Olga Shibistova
Reiner Dohrmann
Daniel Herdtle
Lukas Gerhard
Franziska Fritzsche
Alexander Puzanov
Marina Silanteva
Anna Grebennikova
Georg Guggenberger
Salt-affected soils will become more frequent in the next decades as arid and semiarid ecosystems are predicted to expand as a result of climate change. Nevertheless, little is known about organic matter (OM) dynamics in these soils, though OM is crucial for soil fertility and represents an important carbon sink. We aimed at investigating OM dynamics along a salinity and sodicity gradient in the soils of the southwestern Siberian Kulunda steppe (Kastanozem, non-sodic Solonchak, Sodic Solonchak) by assessing the organic carbon (OC) stocks, the quantity and quality of particulate and mineral-associated OM in terms of non-cellulosic neutral sugar contents and carbon isotopes (δ13C, 14C activity), and the microbial community composition based on phospholipid fatty acid (PLFA) patterns. Aboveground biomass was measured as a proxy for plant growth and soil OC inputs. Our hypotheses were that (i) soil OC stocks decrease along the salinity gradient, (ii) the proportion and stability of particulate OM is larger in salt-affected Solonchaks compared to non-salt-affected Kastanozems, (iii) sodicity reduces the proportion and stability of mineral-associated OM, and (iv) the fungi : bacteria ratio is negatively correlated with salinity. Against our first hypothesis, OC stocks increased along the salinity gradient with the most pronounced differences between topsoils. In contrast to our second hypothesis, the proportion of particulate OM was unaffected by salinity, thereby accounting for only < 10 % in all three soil types, while mineral-associated OM contributed > 90 %. Isotopic data (δ13C, 14C activity) and neutral sugars in the OM fractions indicated a comparable degree of OM transformation along the salinity gradient and that particulate OM was not more persistent under saline conditions. Our third hypothesis was also rejected, as Sodic Solonchaks contained more than twice as much mineral-bound OC than the Kastanozems, which we ascribe to the flocculation of OM and mineral components under higher ionic strength conditions. Contrary to the fourth hypothesis, the fungi : bacteria ratio in the topsoils remained fairly constant along the salinity gradient. A possible explanation for why our hypotheses were not affirmed is that soil moisture covaried with salinity along the transect, i.e., the Solonchaks were generally wetter than the Kastanozems. This might cause comparable water stress conditions for plants and microorganisms, either due to a low osmotic or a low matric potential and resulting in (i) similar plant growth and hence soil OC inputs along the transect, (ii) a comparable persistence of particulate OM, and (iii) unaffected fungi : bacteria ratios. We conclude that salt-affected soils contribute significantly to the OC storage in the semiarid soils of the Kulunda steppe, while most of the OC is associated with minerals and is therefore effectively sequestered in the long term.
- Article
(2817 KB) - Full-text XML
-
Supplement
(940 KB) - BibTeX
- EndNote


Salt-affected soils occur predominantly in arid and semiarid environments where rainfall is insufficient to leach salts from the soil (Mavi et al., 2012). They form either anthropogenically as a result of agricultural mismanagement or naturally due to the accumulation of salts from mineral weathering, dust deposition, precipitation, or a capillary rise of shallow groundwater tables (Essington, 2004). According to the FAO (2001), salt-affected soils possess high salinity, high sodicity, or both features at the same time. Salinity refers to high loads of water-soluble salts within the soil, which is typical for Solonchaks, while sodicity is understood to mean high levels of Na+ on the exchange sites. Sodicity usually results in a pH > 8.5 and the dispersion of soil particles, which in turn causes a poor soil structure with low aggregate stability (Qadir and Schubert, 2002; Sumner, 1993). Generally, salt-affected soils are harsh environments for plants as high salt contents reduce the osmotic potential and subsequently limit plant water uptake (Läuchli and Grattan, 2007). Nutrient uptake is impeded due to ion competition and the high pH, while the poor soil structure caused by high sodicity has adverse effects on the soil water balance and plant development (Qadir and Schubert, 2002). As a result, plant residue inputs into the soil are reduced and thus lead to small soil organic matter (OM) contents (Wong et al., 2010). However, OM is a key component of soils as a reservoir for nutrients and determining a soil's agricultural productivity, while at the same time it is an important carbon (C) repository and plays a pivotal role in the course of climate change (Lal, 2004).
According to their salinity and sodicity, respectively, salt-affected soils can be classified with respect to their electrical conductivity (EC; in dS m−1) and the sodium adsorption ratio (SAR) of the saturated paste extract into saline (EC > 4 and SAR < 13), sodic (EC < 4 and SAR > 13), and saline–sodic (EC > 4 and SAR > 13; US Salinity Laboratory Staff, 1954). Both parameters exert a decisive impact on the dispersion of clay and OM. Numerous studies showed that the desorption of OM from clay particles increases with SAR, while a rise in EC or the proportion of divalent cations counterbalances the dispersing effect of Na+ by inducing flocculation (Mavi et al., 2012; Nelson and Oades, 1998; Setia et al., 2014). High soil pH is likewise assumed to increase losses of organic C (OC) through solubilization of OM (Pathak and Rao, 1998). Peinemann et al. (2005) concluded that in salt-affected soils, mineral-associated OM can be rapidly lost through dispersion and subsequent leaching as dissolved OM, while particulate OM represents a relatively stable fraction as its decomposition is reduced due to inhibited microbial activity. In line with this, previous work revealed in incubation and field studies that the microbial decomposition of soil OM is reduced at elevated salinity (Rath and Rousk, 2015; Rietz and Haynes, 2003), while little is known about the composition of soil microbial communities. Baumann and Marschner (2011) and Pankhurst et al. (2001) observed decreased fungi : bacteria ratios at enhanced salinity, while Barin et al. (2015) found the opposite, indicating that more research is required to reach firm conclusions.
Though based on results from sorption–desorption experiments, previous studies noted the sensitivity of mineral–organic associations in salt-affected soils (Mavi et al., 2012; Setia et al., 2013, 2014), no study to date has quantified the amount and properties of mineral-associated and particulate OM in these soils. This is surprising, as the occurrence of salt-affected soils is predicted to increase as a result of climate change due to enhanced aridity (Amini et al., 2016). Currently, these soils cover a global area of 831 Mio. ha (Martinez-Beltran and Manzur, 2005) of which Solonchaks constitute about 260 Mio. ha (IUSS Working Group WRB, 2014). Thus, our objectives were to elucidate the effect of salinity and sodicity on (i) soil OC stocks, (ii) the quantities and properties of functionally different soil OM fractions (particulate vs. mineral-associated OM), and (iii) the microbial community composition. We approached this by comparing soil OC stocks, the amount and properties of density-separated OM fractions (contents of hydrolyzable non-cellulosic neutral sugars; δ13C and 14C activity), and the PLFA-based microbial community composition along a transect of increasing salinity and sodicity in the southwestern Siberian Kulunda steppe. Non-cellulosic sugars were chosen as an OM quality parameter, as they enter the soil in large amounts with litter, root residues, plant rhizodeposits, and as by-products of microbial and faunal metabolism; moreover, they represent a major energy source for heterotrophic soil microbial communities (Cheshire, 1979; Gunina and Kuzyakov, 2015). Additionally, soil aggregate stability was determined to assess the effect of sodicity on the structural stability of the soils. We hypothesized that (i) soil OC stocks decrease with increasing salinity because high salinity decreases plant growth and subsequently lowers soil OC inputs, (ii) the proportion and stability of particulate OM is larger in salt-affected soils compared to non-salt-affected soils since microbial decomposition and the transformation of OM is reduced under high salinity levels, (iii) sodicity reduces the proportion and stability of mineral-associated OM, and (iv) the fungi : bacteria ratio is negatively correlated with salinity.
2.1 Study site and soil sampling
The studied transect is located in the southwestern Siberian Kulunda steppe, which is part of the Altay Kray (Russian Federation). Due to the semiarid to semihumid climate in the Kulunda steppe, the proportion of the soils subject to salinization is 19.4 % (Paramonov, 2016). The transect belongs to the dry steppe type with a mean annual temperature of 2.6 ∘C and a mean annual precipitation of 285 mm (climate data from the WorldClim database; Hijmans et al., 2005). It ranged from a lake over a terraced hillslope to about 5 m above the lake ( N, E; Fig. 1). The groundwater table increased from ca. 140 cm next to the lake to > 300 cm at the highest point of the transect. Soil moisture and salinity covaried with the groundwater table and increased with decreasing distance to the lake, which is a natural phenomenon in steppe environments. Three different soil types developed along the transect primarily as a function of the groundwater table. At shallow groundwater depth close to the lake, Sodic Solonchaks dominated, while Mollic Solonchaks (non-sodic) prevailed backslope with slightly higher groundwater at about 170–180 cm. Upslope the groundwater table reached > 300 cm and the capillary rise did not reach the soil surface; thus, Haplic Kastanozems and Calcic Kastanozems occurred, which were generally grouped as Kastanozems. A detailed soil classification according to IUSS Working Group WRB (2014) of the analyzed profiles is given in Table S1 in the Supplement. We sampled the soils at plane areas along the terraced slope to avoid the influence of erosion on the soil profiles. Three plots, each with a soil profile down to the groundwater table and locations for plant analyses, were established per soil type; only in the Kastanozems was the groundwater too deep to be reached. Four plots were analyzed on the footslope next to the lake where site heterogeneity was larger, but one of the four soils was not classified as Sodic Solonchak but as Haplic Solonchak. This soil profile was grouped together with the Mollic Solonchaks since these soils corresponded to a lower level of sodicity and they were referred to as non-sodic Solonchaks. Therefore, Kastanozems and Sodic Solonchaks were represented by three soil profiles, while non-sodic Solonchaks were characterized by four soil profiles. Composite soil samples were taken according to generic horizons in the profiles. Plant samples (shoots and roots) were taken within the plots at 5 m of distance from each profile for the determination of OC, total nitrogen (TN), δ13C, and non-cellulosic neutral sugars. The aboveground biomass was determined in triplicate around each profile by cutting off plants in a 40 cm × 40 cm square and subsequent drying (70 ∘C) and weighing of plant material. The major plant species are listed in Table 1.
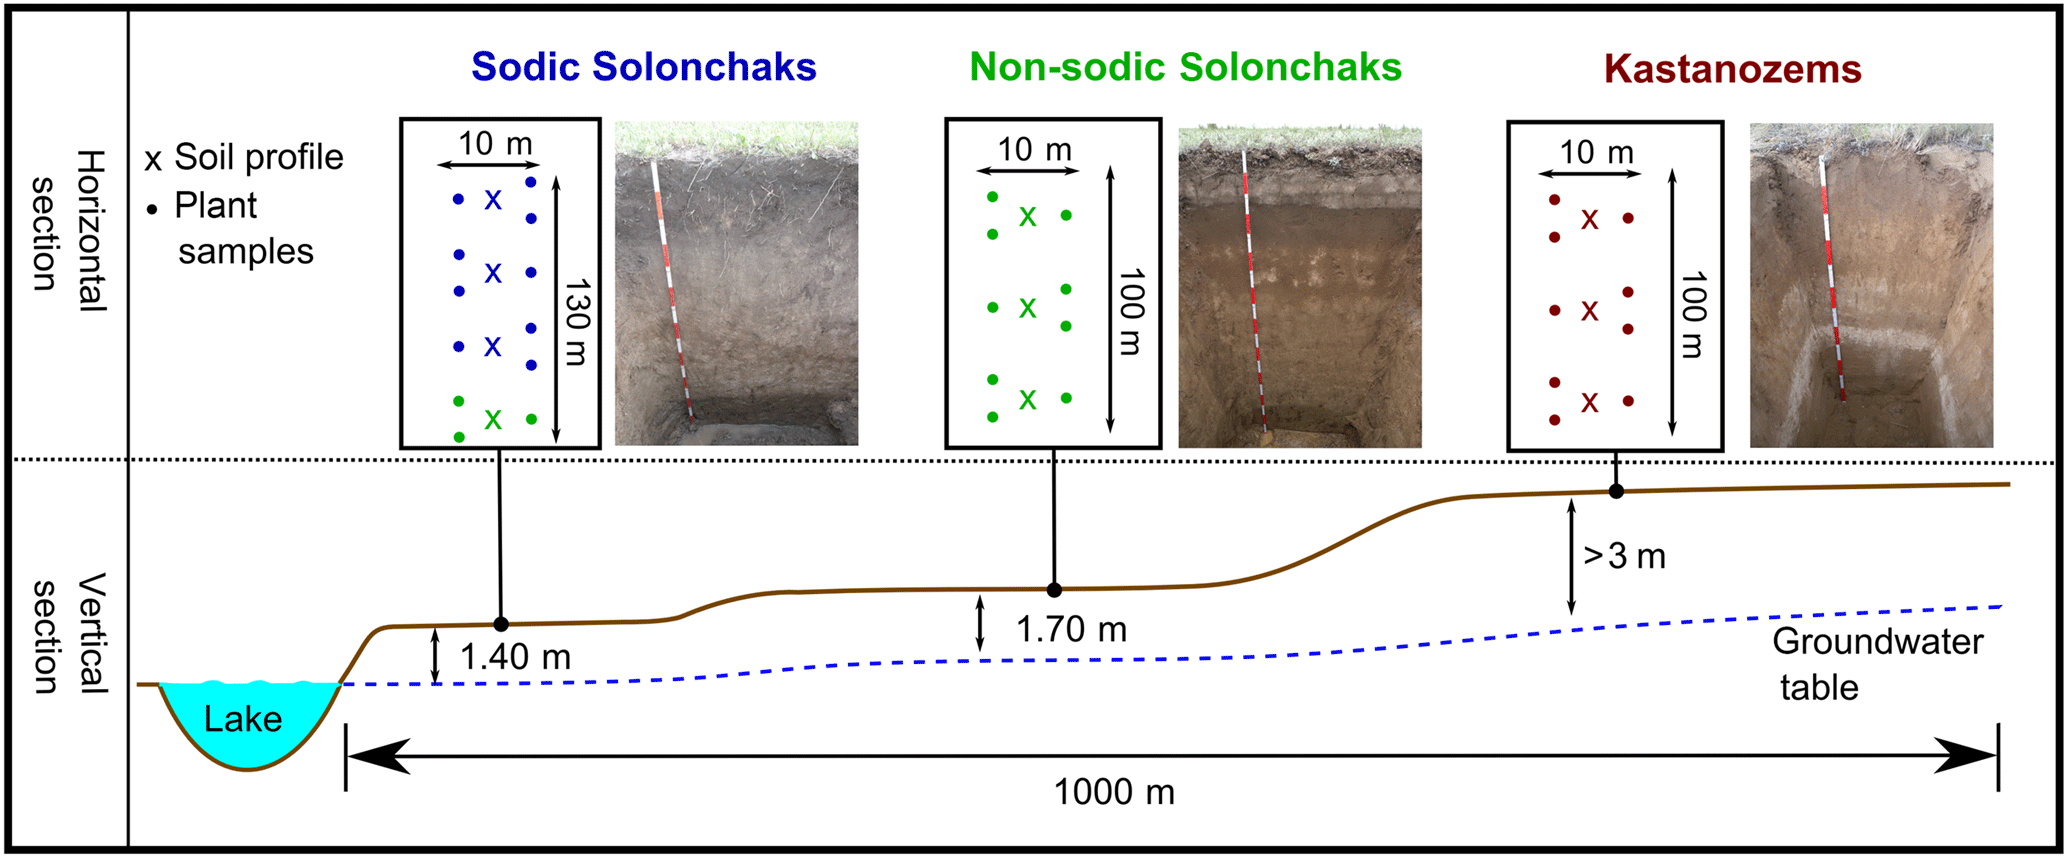
Figure 1Schematic representation of study sites and the experimental design. The same colors of the soil profiles and plant samples mark the same soils. A detailed soil type classification of the grouped soils is given in Table S1.
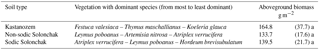
Table 1Vegetation (dominant species) and aboveground biomass on each soil type. Given are the arithmetic means and the standard error of the mean in parentheses. Significant differences (p < 0.05) were not present and are denoted as lowercase letters.
2.2 Sample preparation and basic soil analyses
Samples from generic horizons of the profiles were air-dried and sieved to < 2 mm. Visible plant materials were removed and big clods were gently broken to pass the sieve. An aliquot of the fine-earth fraction was dried at 105 ∘C to determine the residual soil water content. Soil bulk density was determined gravimetrically in triplicate for generic horizons by using a soil sample ring. Soil pH was measured in a 1 : 2.5 (w : v) soil-to-water suspension after equilibration for 1 day. Carbonate content was analyzed by using the Scheibler volumetric method (Schlichting et al., 1995). The texture of the soils was determined according to the standard sieve-pipette method (DIN ISO 11277, 2002) and the content of oxalate- and dithionite-extractable Fe was analyzed as described in McKeague and Day (1966). Soil aggregate stability was measured based on a method modified from Hartge and Horn (1989) and explained in detail in Bischoff et al. (2016). It was calculated as the difference between the mean weight diameter (MWD) of aggregates of a dry- and a wet-sieving method, expressed as ΔMWD, with a high ΔMWD corresponding to low aggregate stability and a low ΔMWD relating to high aggregate stability. The soil mineralogical composition was analyzed to characterize the soils with respect to their composition of water-soluble salts and the amount of expandable clay minerals. Clay mineralogy significantly affects the physical properties of sodic soils (Essington, 2004). The quantity of expandable clay minerals was similar in all three soil types and cannot explain differences in the OM dynamics between the soils. All data on soil mineralogical composition are provided in the Supplements (S1).
2.3 Soil salinity parameters
The content and composition of water-soluble salts was determined by shaking the soil in a 1 : 5 (w : v) soil-to-water suspension at 15 rpm for 1 h and leaving the sample for 1 day to reach equilibrium. After measuring the EC the extract was centrifuged at 3000 g for 15 min and filtered through 0.45 µm syringe filters (Cellulose acetate). An aliquot of the extract was measured for Na+, K+, Ca2+, and Mg2+ with an inductively coupled plasma optical emission spectrometer (Varian 725-ES; Agilent Technologies, Santa Clara, USA), while another aliquot was analyzed for Cl−, NO, and SO with an ion chromatograph (ICS-90; Dionex Corp., Sunnyvale, USA). The concentrations of Na+, Ca2+, and Mg2+ (mmol L−1) in the extract were used to calculate the SAR according to Eq. (1).
2.4 Determination of organic carbon, δ13C, and total nitrogen
Ball-milled < 2 mm fractions were measured for OC, TN, δ13C via dry combustion in an Elementar vario MICRO cube C/N Analyzer (Elementar Analysensysteme GmbH, Hanau, Germany) coupled to an IsoPrime IRMS (IsoPrime Ltd, Cheadle Hulme, UK) after removing inorganic C through fumigation with HCl and subsequent neutralization over NaOH pellets (modified from Walthert et al., 2010). The measured δ13C values were corrected by calculating response factors from standard compounds (CaCO3, cellulose, caffeine) and expressed in the delta notation related to the Vienna Pee Dee Belemnite Standard (0 ‰). The complete removal of inorganic C from all samples was confirmed by δ13C values, which are in the typical range of soil OM (−22.5 to −28.1 ‰).
2.5 Density fractionation and 14C analysis
Density fractionation (modified after Golchin et al., 1994) separated the soil into a light fraction (LF), containing mostly particulate OM, and a heavy fraction (HF), consisting of mineral-associated OM and mineral components free of OM. As particulate OM contents are mostly very low in the subsoil, we fractionated the soil only until the first C horizon of each profile. In brief, 25 g of soil was weighted in duplicate into beakers and 125 mL sodium polytungstate (ρ=1.6 g cm−3) was added and gently stirred with a glass rod. Ultra sonification was applied with an energy input of 60 J mL−1 for 8 min to break down aggregates. After centrifugation at 3000 g for 20 min the LF was separated from the HF by decanting the floating LF on polyethersulfone filters and repeating the procedure if the separation between the two fractions was insufficient. LF remaining on the filter was washed with deionized water to remove residual sodium polytungstate until the washing solution had an EC < 60 µS cm−1. The HF remaining in the beaker was washed with deionized water until the EC of the washing solution was < 100 µS cm−1 for a maximum of four times in the salt-affected soils, as no residual sodium polytungstate was detected afterwards by ESEM–EDX analysis, which was carried out with a Quanta 200 FEG environmental scanning electron microscope (FEI Company, Hillsboro, USA) coupled to an XL–30 EDX detector (Ametek Inc, Berwyn, USA). The washing solutions of both LF and HF were collected, filtered through 0.45 µm syringe filters (PVDF), and measured for non-purgeable OC with a LiquiTOC (Elementar Analysensysteme GmbH, Hanau, Germany) to account for the loss of OC during washing of the samples (mobilized OC, MobC; Gentsch et al., 2015). The LF and HF were freeze-dried, weighted, homogenized in a mortar, and subsequently measured for OC and TN as well as δ13C, as described in Sect. 2.4, after the removal of inorganic C. The mobilized OC was added to the OC content of the LF or HF.
Three representative soil profiles were selected, one per soil type, for analysis of the 14C activities of OM fractions at the Max Planck Institute for Biogeochemistry Jena (Germany). As the low quantity of LF material in the subsoil did not allow for an accurate 14C measurement at deeper depth, we only analyzed 14C activities until the topmost C horizon of the respective soil profile. Inorganic C was removed by using 2M HCl until pH remained < 3.5 and samples were subsequently neutralized with 2M NaOH to pH 6. After freeze-drying, 14C analysis was performed with a 3MV Tandetron™ AMS 14C system (Steinhof et al., 2011) and 14C isotope activities were converted to percent modern carbon (pMC) according to Steinhof (2013). The pMC was defined according to Stuiver and Polach (1977):
where ASN is the normalized sample activity and Aabs corresponds to the activity of the absolute international standard; both activities were background corrected and δ13C normalized. OxCal 4.2 software (University of Oxford) was used to calculate conventional 14C ages by selecting the IntCal13 calibration curve (Reimer et al., 2013) if pMC was < 100 % and the calibration curve from Hua et al. (2013) if pMC was > 100 %.
2.6 Biomarker analyses
2.6.1 Non-cellulosic neutral sugars
Non-cellulosic neutral sugars were analyzed in the LF and HF from the generic horizons of each soil profile. In the LF, neutral sugars were only analyzed in some of the topmost horizons, as its content was too low in most samples to provide sufficient material. Additionally, neutral sugars were determined in plant material (shoots and roots). Neutral sugars were analyzed with slight modifications according to Rumpel and Dignac (2006), including the EDTA purification step from Eder et al. (2010). In brief, 600 mg of HF and 50 mg of LF or plant material was hydrolyzed in 4M trifluoroacetic acid (TFA) at 105 ∘C for 4 h after 1.5 mL of myo-inositol was added as an internal standard. After cooling to room temperature, the extract was filtered through glass fiber filters (Whatman™ GF6) and TFA was removed in a rotary evaporator. The samples were redissolved in ultrapure water and the pH was adjusted to 4–5 by adding NH3. Ferric Fe was complexed by adding 4 mL of EDTA and incubating the samples in the dark for 10 min. Darkened glassware was used thereafter to prevent photolysis of Fe(III) ligand complexes. After freeze-drying and adding two drops of NH3, the reduction of aldoses to their corresponding alditols (derivatization) was performed at 40 ∘C for 1.5 h with NaBH4 dissolved in dimethyl sulfoxide. Acetylation was carried out by adding 2 mL of acetic anhydride and 0.2 mL of glacial acetic acid, thereby using methylimidazole as a catalyst. Ice-cold deionized water was added after 10 min to stop the reaction. Sugar monomers were extracted through liquid–liquid extraction with dichloromethane and subsequently measured by gas chromatography on a 7890A GC system (Agilent Technologies, Santa Clara, USA) equipped with an SGE forte GC capillary column (0.25 mm diameter and 0.25 µm film thickness; SGE Analytical Science, Melbourne, Australia) and a flame ionization detector using He as a carrier gas. External standards were used to detect eight different sugars: arabinose, xylose and ribose (pentoses), galactose, glucose and mannose (hexoses), and fucose and rhamnose (desoxysugars).
2.6.2 Phospholipid fatty acids
Directly after sampling, sieving to < 2 mm, and removing visible plant materials, 1.0–1.5 g of field-moist soil was weighted into cryovials and 3 mL of RNAlater® was added to prevent sample degradation (Schnecker et al., 2012). An aliquot was dried at 105 ∘C to determine the soil water content. The cryovials were kept cool until they were frozen to −20 ∘C within 72 h. For PLFA analysis we used a modified method from Gunina et al. (2014). Briefly, samples were transferred from cryovials into test tubes and washed with ultrapure water to remove residual RNAlater®. Lipids were extracted twice with a chloroform–methanol–citrate buffer ( ) and separated into glycolipids, neutral lipids, and phospholipids through solid-phase extraction with activated silica gel (Sigma Aldrich; pore size 60Å, 70–230 mesh). Phospholipids were derivatized into fatty acid methyl esters (FAMEs) with 0.5M NaOH dissolved in methanol and with BF3 as a catalyst. FAMEs were analyzed with a 7890A GC system (Agilent Technologies, Santa Clara, USA) equipped with a 60 m Zebron ZB-5MSi capillary GC column (0.25 mm diameter and 0.25 µm film thickness; Phenomenex, Torrance, USA) and a flame ionization detector using He as a carrier gas. As an internal standard we used nonadecanoic acid (FA 19:0) and 17 fatty acids were used as external standards. Peak identification of the internal standard was problematic in the salt-affected topsoils. Therefore we could not reliably quantify individual PLFAs but only their relative proportion in the sample. As a result the sum of all PLFAs was not used as a proxy for the microbial biomass contents, but PLFAs were used to characterize the composition of functional microbial groups. We applied a principal component analysis (PCA) to the relative distribution of all 17 PLFAs to identify clusters of correlated PLFAs, which presumably derive from identical microbial functional groups. The assignment of individual PLFAs to certain microbial groups based on the PCA was in agreement with the literature (Frostegård et al., 2011; Olsson, 1999; Ruess and Chamberlain, 2010; Zelles, 1999). Thus, the following PLFAs were used to distinguish functional microbial groups: 18 : 2ω6,9 and 18 : 1ω9c as markers for saprotrophic fungi (SapFungi), 16 : 1ω5c to identify arbuscular mycorrhizal fungi (AMF), i15 : 0, a15 : 0, i16 : 0, i17 : 0, and a17 : 0 were related to gram-positive bacteria, 10Me16 : 0 characterized actinomycetes (Actino), 16 : 1ω7c and 18 : 1ω7c identified gram-negative bacteria, and 14 : 0, 15 : 0, 17 : 0, and 18 : 0 related to nonspecific bacteria (NonspBact). The PLFAs Cy19 : 0 and 20 : 4ω6c were not used as markers for microbial groups as they hardly reached the detection limit and were sometimes difficult to distinguish from other unspecific peaks in the gas chromatogram.
2.7 Calculation of organic carbon stocks
Organic C stocks (Mg ha−1) were calculated according to Poeplau and Don (2013) for all horizons and the entire soil profile as well as until 1 m of depth using Eq. (3):
where n is the number of horizons, FSM is the fine-earth soil mass (g), V is the volume (cm3), C is the OC content (% of soil mass), and D is the length of the horizon (cm).
2.8 Statistical analyses
Data analysis was performed in R version 3.2.5 (R Core Team, 2016). From replicated measurements we calculated arithmetic means and standard errors. To test for the effect of soil type on aboveground plant biomass, a linear mixed effects model was fitted (package lme4; Bates et al., 2012). We accounted for the nested structure of sampling; i.e., the soil type was used as a fixed effect, while the soil profiles (of each soil type) were included as random effects. Residuals and random effect estimates of the fitted model were visually assessed by Q–Q normal plots, but no deviations from normality were observed. The difference of the response variable between the soil types was tested based on the linear mixed effects model fit, including corrections for multiple comparisons (analogous to the Tukey test) with Satterthwaite degrees of freedom on the basis of the R packages lsmeans (Lenth and Herve, 2015), lmerTest (Kuznetsova et al., 2015), and multcomp (Hothorn et al., 2008). Soil-sample-related parameters were analyzed descriptively, as their sample size was only 3–4 per soil type, which was insufficient for statistical hypothesis testing. Data on PLFA and neutral sugars were analyzed by using PCA in order to consider multiple response variables. Confidence regions (68 %) for the group centroids of the independent factor variables were added to the biplots. Figure 1 was drawn in Inkscape, while the other graphs were generated using ggplot2 (Wickham, 2009).
3.1 Basic soil and site properties
The soil moisture during sampling (% of dry weight) was very low in the Kastanozems (3.6–4.5 %) and higher in the salt-affected soils with a shallow groundwater table (non-sodic Solonchaks: 14.9–20.5 %, Sodic Solonchaks: 16.4–30.6 %; Table 2). Thus, soil moisture covaried with salinity along the transect. The pH in the Kastanozems increased from about 7 in the topsoil to 9 in the subsoil, while the Solonchaks revealed a nearly constant pH throughout the soil profile between 8.5 and 9. While Kastanozems had no carbonates in the topsoil, the carbonate content peaked in the Ck horizon with 51 ± 12 mg g−1 (Table 2). The salt-affected soils exhibited higher carbonate contents between 53 ± 16 and 152 ± 34 mg g−1 in the non-sodic Solonchaks and 115 ± 49 and 264 ± 22 mg g−1 in the Sodic Solonchaks. The aggregate stability was higher in Kastanozems and Sodic Solonchaks (ΔMWD: 0.41 ± 0.06 and 0.33 ± 0.03 mm, respectively) than in non-sodic Solonchaks (1.02 ± 0.29 mm; Table 2). The Kastanozems consisted mostly of sandy loam, while the Solonchaks were more loamy with higher clay and silt contents. Oxalate- and dithionite-extractable Fe was consistently low in all three soil types (< 0.4 mg g−1 Feo, < 5 mg g−1 Fed; Table 2).
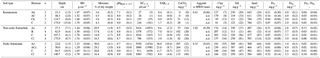
Table 2Basic soil parameters as a function of soil type and horizon. Given are the arithmetic means and the standard error of the mean in parentheses. Abbreviations: n is the sample size, BD is bulk density, EC is electrical conductivity, SAR is sodium adsorption ratio, Aggstab is aggregate stability, MWD is mean weight diameter, Feo is oxalate-extractable Fe, Fed is dithionite-extractable Fe, n.d. is not determined.
3.2 Soil salinity parameters
The EC1 : 5 was low (< 250 µS cm−1) in the Kastanozems with a slight increase from topsoil to subsoil, while the highest EC1 : 5 in the Solonchaks was found in the topsoil (Table 2). In the non-sodic Solonchaks the EC1 : 5 decreased from 3416 ± 1053 µS cm−1 in the topsoil to 796 ± 333 µS cm−1 in the subsoil, while the Sodic Solonchaks had the highest EC1 : 5 with 5350 ± 1476 µS cm−1 in the topsoil and the lowest EC1 : 5 with 1093 ± 702 µS cm−1 in the subsoil. The SAR1 : 5 revealed a similar pattern, with low SAR1 : 5 (< 2) in the Kastanozems and higher values in the Solonchaks (Table 2). In the non-sodic Solonchaks the SAR1 : 5 dropped from 9.6 ± 2.2 in the topsoil to 3.9 ± 1.0 in the subsoil, while Sodic Solonchaks had the highest SAR1 : 5 with 36.0 ± 10.4 in the topsoil and 8.0 ± 4.6 in the subsoil. The composition of water-soluble anions and cations was different in the two salt-affected soils (Fig. S1 in the Supplement). While the non-sodic Solonchaks had an approximately balanced concentration of SO, Cl−, Na+, Ca2+, and Mg2+, the Sodic Solonchaks were dominated by SOand Na+ with smaller quantities of Cl−.
3.3 Soil organic carbon stocks

Figure 2Soil OC stocks (Mg ha−1) for three soil types (a) as a function of horizon and (b) for a depth of 100 cm and the entire soil profile (light and dark gray). The mean depths of the profiles were 157 ± 20 cm (KS), 175 ± 9 cm (nSC), and 141 ± 5 cm (sSC). Given are the arithmetic means ± standard error of the mean, and the dots show individual measurements (in plot b for the entire soil profile). Abbreviations: KS is Kastanozem, nSC is non-sodic Solonchak, sSC is Sodic Solonchak.
Soil OC stocks increased with salinity and sodicity from Kastanozems over non-sodic Solonchaks to Sodic Solonchaks (Fig. 2). Differences were most pronounced in the topsoils, while subsoil OC stocks were similar between the soil types. Down to a depth of 100 cm Kastanozems had 70.9 ± 2.8 Mg OC ha−1, non-sodic Solonchaks 94.2 ± 6.9 Mg OC ha−1, and Sodic Solonchaks 129.5 ± 25.6 Mg OC ha−1. Thus, OC stocks in non-sodic Solonchaks were 32.8 ± 9.7 % larger than in Kastanozems, and OC stocks of Sodic Solonchaks exceeded those of Kastanozems by 82.6 ± 36.1 %. The C : N ratios were comparable along the salinity gradient and ranged from about 10 in the topsoil to 5–8 in the subsoil (Table S2).
3.4 Soil organic matter fractions
3.4.1 Organic carbon contents and isotopic composition
Table 3Parameters of OM fractions as a function of soil type and horizon. Given are the arithmetic means and the standard error of the mean in parentheses. Where n differs for a certain parameter from those indicated in the third column, it is indicated by a separate n in brackets. For LF material, neutral sugars were only determined in A horizons since the sample quantity was too low in the underlying horizons. Abbreviations: OC is organic carbon, MobC is mobilized organic carbon, n.d. is not determined.
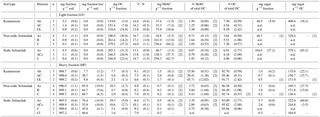
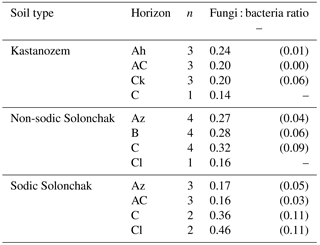
Table 4Fungi : bacteria ratio as a function of soil type and horizon. Given are the arithmetic means and the standard error of the mean in parentheses.
All three soil types were dominated by HF–OC with > 90 % of bulk OC, while LF–OC accounted for < 10 % (Table 3). The proportion of HF–OC revealed no clear depth gradient within the soil profiles. The OC content of the HF increased in A horizons with salinity and sodicity from Kastanozems (7.7 ± 0.3 mg g−1) to non-sodic Solonchaks (18.3 ± 2.7 mg g−1) to Sodic Solonchaks (19.3 ± 5.0 mg g−1), while OC contents were similar in the subsoil (Table 3). OC contents in the LF were lower in the Kastanozems (120–219 mg g−1) than in non-sodic Solonchaks (197–279 mg g−1) and Sodic Solonchaks (247–265 mg g−1; Table 3). Kastanozems and non-sodic Solonchaks had the highest LF-OC contents in the subsoil but LF-OC contents were equal over depth in the Sodic Solonchaks. HF material was enriched in δ13C compared to LF material (Fig. 3). Remarkably, the δ13C ratios in the LF decreased from topsoil to subsoil in the Solonchaks, while the Kastanozems revealed a typical increase in δ13C ratios from topsoil to subsoil. The δ13C ratios of the LF were similar to the root signals of the plants, while no relation to the shoot signals was apparent. Ratios of δ13C in the HF were comparable between the three soil types. As residual sodium polytungstate had to be removed during density fractionation for subsequent determination of OC parameters, all samples were washed with deionized water (see Sect. 2.5). This resulted in a loss of HF material. About 8–29 mg HF g−1 of soil was lost in Kastanozems, while the loss was higher in salt-affected soils due to the high solubility of salts and accounted for 61–86 mg HF g−1 of soil in non-sodic Solonchaks and 46–76 mg HF g−1 of soil in Sodic Solonchaks, with higher losses in samples with high EC (Table 3). Despite the larger HF losses observed in Solonchaks, the percentage of MobC related to bulk OC was small in these soils (maximally 9.4 ± 1.6 %), while Kastanozems had larger proportions of MobC (15.6 ± 0.5 to 45.7 ± 12.0 %). The quantities of MobC from the LF were larger in salt-affected soils and accounted for up to 258 mg OC g−1 LF, but at maximum 3.4 % of bulk OC in all three soil types (Table 3). The proportion of MobC increased with depth in both LF and HF. The 14C activities in the LF were similar in the Kastanozem and the Sodic Solonchak and amounted mostly to > 100 pMC (Fig. 4), corresponding to recent C with 14C ages of a maximum of 60 years BP. In the non-sodic Solonchak the 14C activity was > 100 pMC in the topmost horizon (Az1) but lower in the underlying horizons, i.e., 91.67 pMC (ca. 730 years BP) in the Az2 horizon and 93.86 pMC (ca. 580 years BP) in the Bkz horizon. This untypically high age of LF material indicated a possible contamination with HF material. The 14C activities in the HF were smaller than in the LF, corresponding to higher 14C ages, and no trend related to the three soil types was apparent. Remarkably, 14C activities increased from ca. 30 cm of depth to 50–60 cm of depth after a typical decrease from the topsoil. The 14C activities in the HF corresponded to 14C ages of 150–950 years BP in the topsoil horizons and 1200–2900 years BP in the underlying horizons, while the highest 14C age occurred in the comparatively deep Cz horizon (ca. 90 cm) of the non-sodic Solonchak with 4600 years BP.
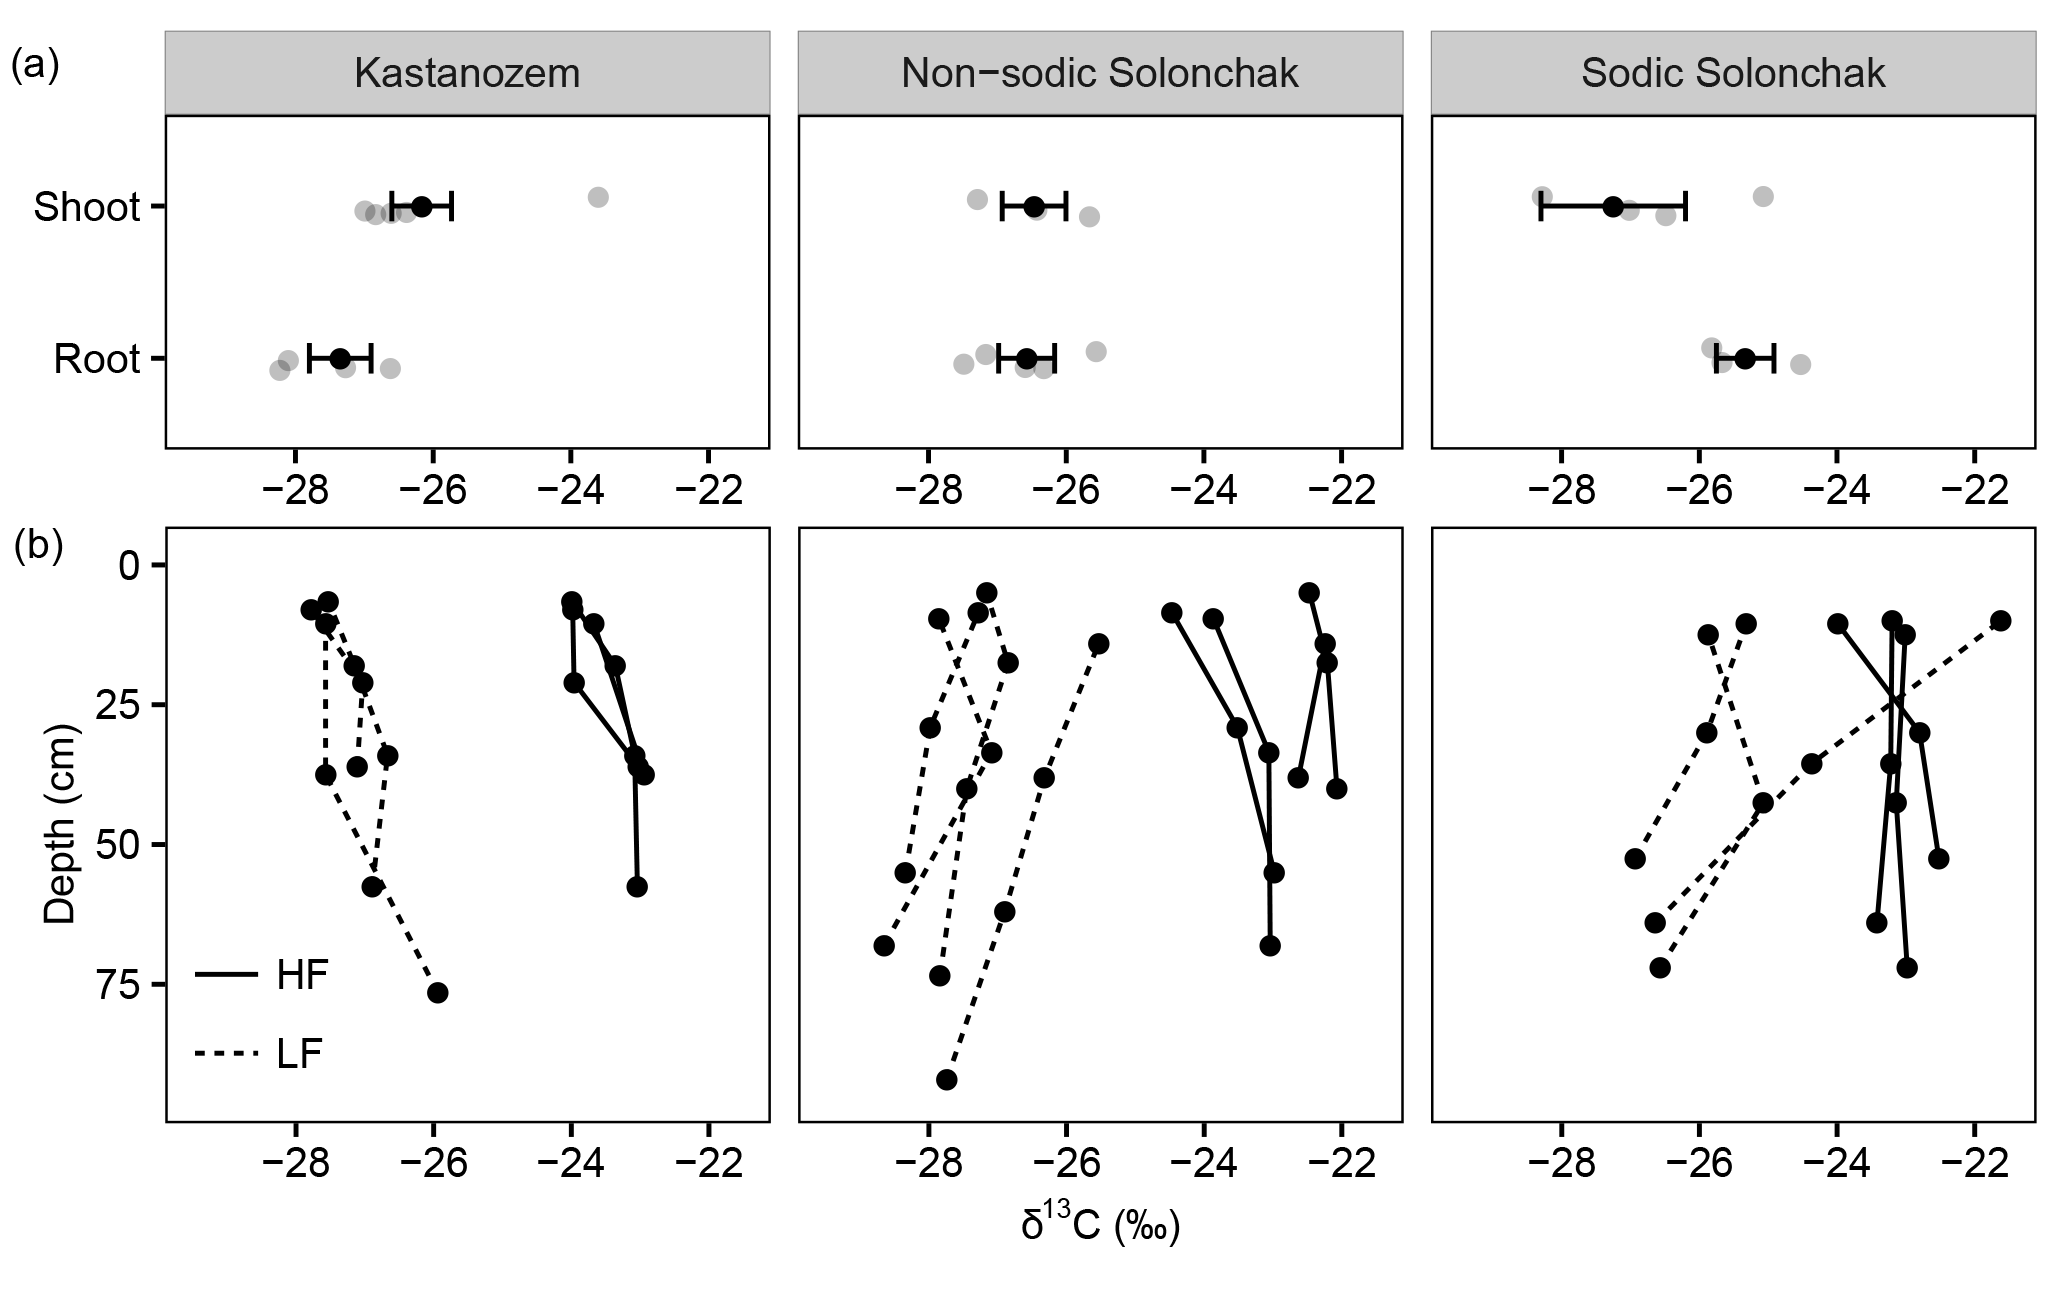
Figure 3The δ13C ratios of (a) plant components and of (b) OM present in the light fraction (LF) and the heavy fraction (HF) as a function of soil depth (b) for three soil types. Gray dots in the upper three panels show individual measurements, while the black dots show the arithmetic means ± standard error of the mean. In (b), the three and four replicates per soil type are shown.
3.4.2 Non-cellulosic neutral sugars
The neutral sugar content of the LF from the topmost horizons was similar in the Kastanozems and the non-sodic Solonchaks with 47 ± 5 and 46 mg g−1, respectively, while Sodic Solonchaks contained more neutral sugars (105 ± 27 mg g−1; Table 3). Related to the OC content, sugar contents were comparable between all soil types and ranged from 328 to 410 mg g−1 OC. The HF contained less sugars than the LF, and sugar contents decreased from top- to subsoil according to the decrease in OC contents (Table 3). In topsoils, the sugar contents of the HF increased from Kastanozems (1.0 ± 0.2 mg g−1) over non-sodic Solonchaks (3.1 ± 0.6 mg g−1) to Sodic Solonchaks (5.7 ± 0.8 mg g−1), while sugar contents were similar in the subsoil. Based on the OC content, sugar contents were similar in the Kastanozems and non-sodic Solonchaks and ranged between 136 and 172 mg g−1 OC with no clear depth gradient. Sodic Solonchaks contained more sugar per g OC than the other two soil types, with 322 ± 61 mg g−1 OC in the topsoil and lower sugar contents in the subsoil (165 mg sugar g−1 OC). The averaged proportion of each sugar in the total sugars was the following: xylose (27 ± 8 %), glucose (20 ± 2 %), arabinose (19 ± 2 %), galactose (18 ± 3 %), mannose (7 ± 3 %), rhamnose (5 ± 1 %), fucose (3 ± 1 %), and ribose (1 ± 1 %; data not shown).
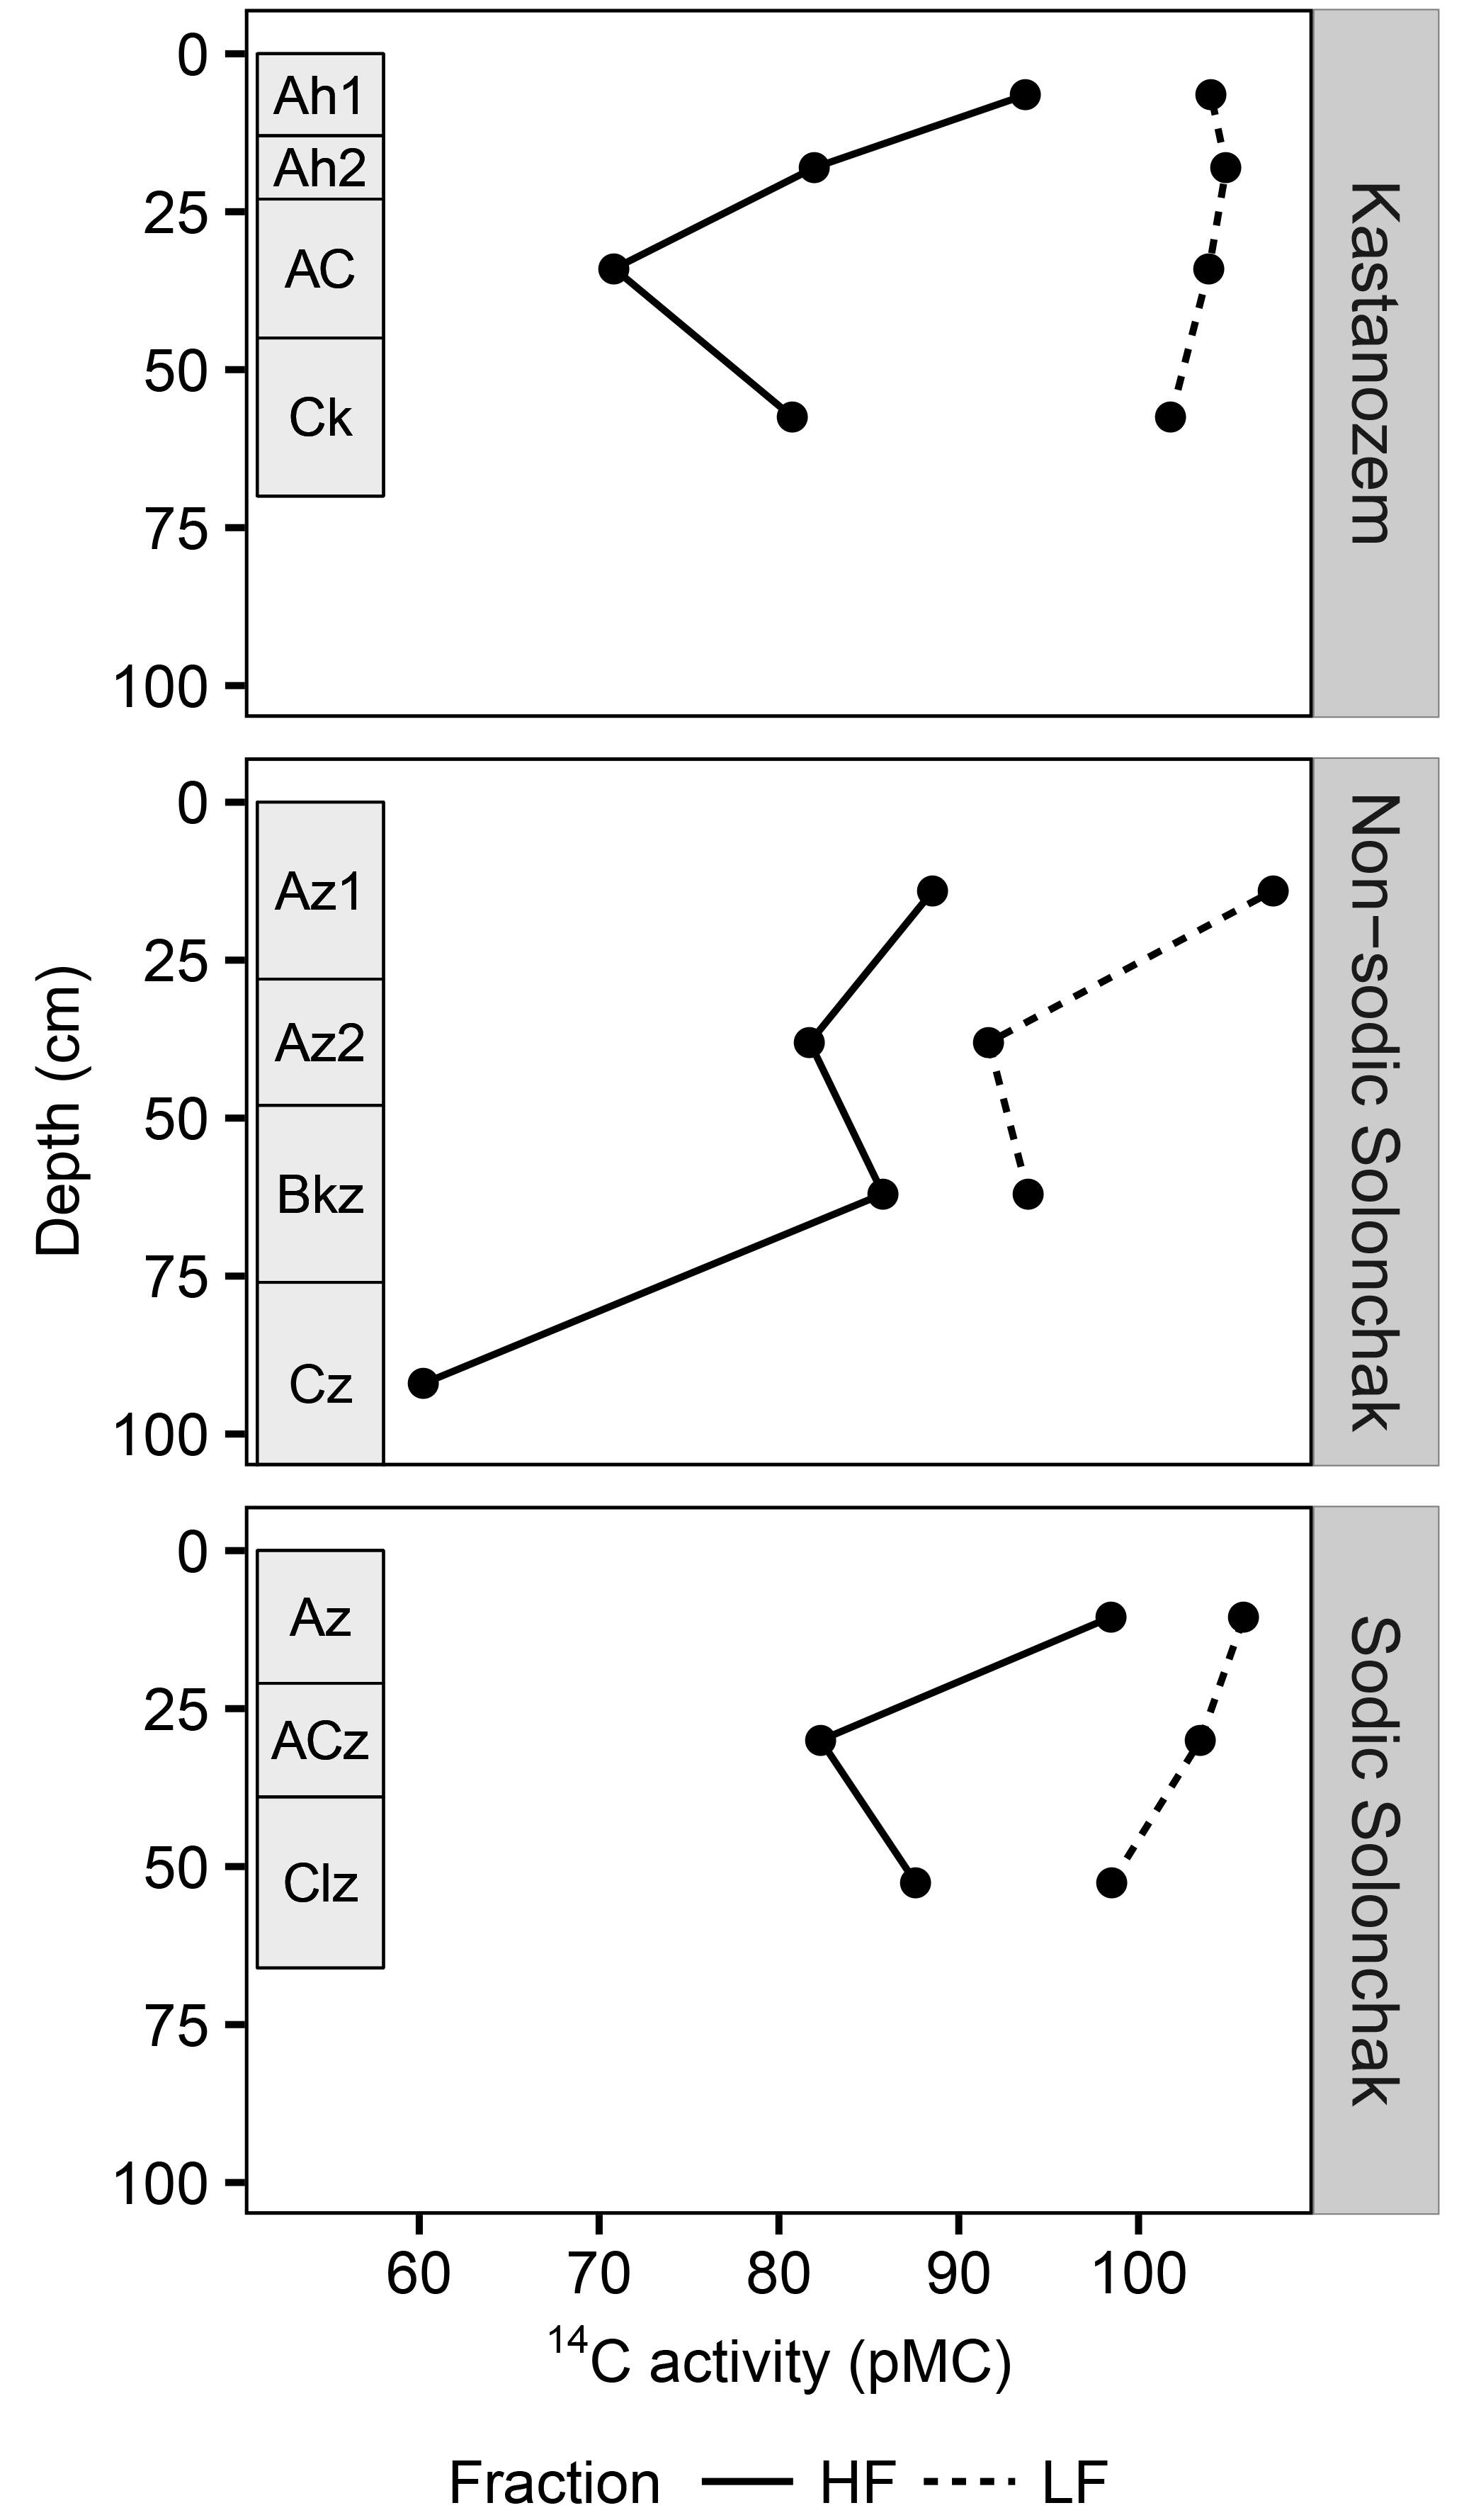
Figure 4The 14C activity (pMC) for three soil types and two OM fractions as a function of soil depth. Rectangles on the left of each panel indicate diagnostic horizons. Due to low quantity of LF material in the subsoil, 14C activities were only analyzed until the topmost C horizon. Abbreviations: LF is light fraction, HF is heavy fraction.
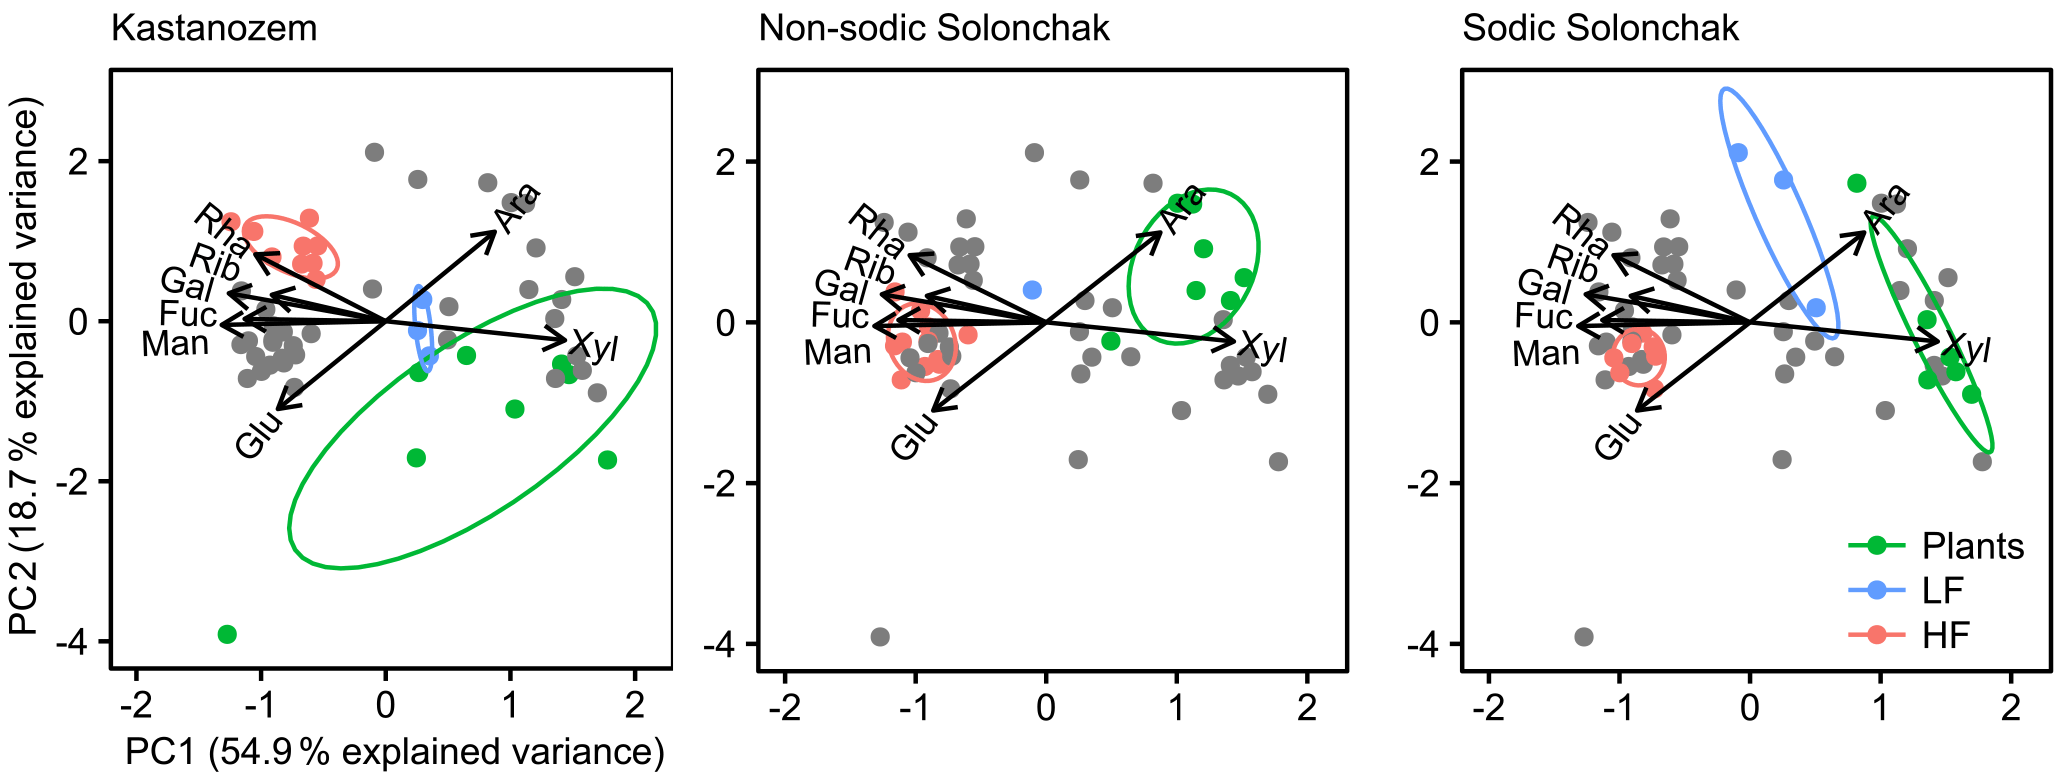
Figure 5Biplots derived from a principal component analysis of non-cellulosic neutral sugars from plants, the light fraction (LF), and the heavy fraction (HF) plotted for each soil type separately. The gray dots correspond to those samples not considered for the particular soil type. Abbreviations: Man is mannose, Ara is arabinose, Rha is rhamnose, Rib is ribose, Glu is glucose, Fuc is fucose, Xyl is xylose, Gal is galactose.
The PCA of neutral sugars from plants and LF and HF material revealed two significant components (eigenvalue > 1), the first (PC1) with 54.9 % explained variance and the second (PC2) with 18.7 % explained variance (Fig. 5). The composition of neutral sugars was different between plants, LF material, and HF material, while differences between the three soil types were smaller. Plants of all soil types were enriched in xylose and those of salt-affected soils also in arabinose, while the HF material of all soils was augmented with mannose, galactose, fucose, ribose, and rhamnose. Differences between soil types were apparent with respect to arabinose and glucose. In the Kastanozems, OM in the LF and HF became enriched in arabinose during decomposition of plant material, while the opposite was observed in the salt-affected soils (see also Fig. S2). The relative proportion of glucose remained similar in the Kastanozems but increased in the salt-affected soils in the course of decomposition (see also Fig. S3). However, on the whole, neutral sugars in LF and HF material were similarly altered in all three soil types with respect to their initial composition in the plant tissue, as indicated by a comparable shift in the three fractions in all soil types along the first axis in the biplot (Fig. 5), suggesting a comparable degree of soil OM alteration between the soil types.
3.4.3 Phospholipid fatty acids

Figure 6Biplots derived from a principal component analysis of functional microbial groups as identified from PLFA analysis. Colors and 68 % confidence regions are grouped by (a) soil type and (b) horizon. Abbreviations: KS is Kastanozem, nSC is non-sodic Solonchak, sSC is Sodic Solonchak, Gram+ is gram-positive bacteria, Gram– is gram-negative bacteria, Actino is actinomycetes, SapFungi is saprotrophic fungi, NonspBact is nonspecific bacteria, AMF is arbuscular mycorrhizal fungi.
The fungi : bacteria ratio was similar in the topsoils of the three soil types and amounted in A horizons to 0.24 ± 0.01 in Kastanozems, 0.27 ± 0.04 in non-sodic Solonchaks, and 0.17 ± 0.05 in Sodic Solonchaks (Table 4). In the subsoil the salt-affected soils had slightly higher fungi : bacteria ratios than the non-salt-affected Kastanozems. The relative proportion of grouped PLFAs in total PLFAs was as follows: PLFA of nonspecific bacteria (36.7 ± 2.2 %), gram-positive bacteria (25.6 ± 0.7 %), gram-negative bacteria (11.9 ± 1.3 %), saprotrophic fungi (11.3 ± 0.9 %), AMF (8.4 ± 1.8 %), and actinomycetes (6.1 ± 0.6 %). The PCA of the PLFA-based microbial groups extracted two significant components (eigenvalue > 1) and showed a clear differentiation between bacterial and fungal PLFA (Fig. 6), the former stretching along the first component (PC1) and the latter correlating with the second component (PC2). Accordingly, bacterial PLFA explained 57.8 % of the variability in total PLFA, while fungal PLFA corresponded to 22.0 % of the total variability. The PLFAs of gram-positive bacteria, gram-negative bacteria, and actinomycetes were positively correlated with each other, but had a negative correlation to the group of nonspecific bacterial PLFA. Among the fungal PLFAs, those of AMF correlated negatively to those of saprotrophic fungi. Differences in the microbial community composition existed between soil horizons and were largely explained by the variability of bacterial PLFA, with a higher abundance of gram-positive bacteria, gram-negative bacteria, and actinomycetes in topsoil horizons and a higher abundance of nonspecific bacterial PLFA in the subsoil (Fig. 6). Changes in the microbial community composition between the three soil types were small and mostly due to a higher relative abundance of AMF in the salt-affected soils than in the non-salt-affected Kastanozems, whereas the composition of bacterial PLFA was similar between all soils.
4.1 Soil OC stocks along the salinity gradient
Salt-affected soils, such as Solonchaks, are normally characterized by poor plant growth resulting in small soil OC inputs and subsequently low soil OC stocks (Wong et al., 2010). Muñoz-Rojas et al. (2012), for example, reported soil OC stocks in the Solonchaks of southern Spain in 0–75 cm depth as 53.6 Mg ha−1 (coefficient of variation (CV): 60 %) under shrub and/or herbaceous vegetation. Batjes (1996) calculated in the framework of a global meta-analysis an average soil OC stock in Solonchaks of 42 Mg ha−1 (CV: 67 %) in 0–100 cm of depth, while he noted that Mollic Solonchaks had particularly larger soil OC stocks of 101 Mg ha−1 (CV: 44 %). Kastanozems, on the other hand, contained on average 96 Mg ha−1 (CV: 50 %) in the first meter, at which Haplic Kastanozems had soil OC stocks above that average of 138 Mg ha−1 (CV: 44 %; Batjes, 1996). Based on data from Bischoff et al. (2016), we calculated soil OC stocks in Kastanozems of the dry steppe type in the Kulunda steppe down to 60 cm, which amounted to 110 ± 6 Mg ha−1. All of the previously published data confirm that salt-affected soils like Solonchaks normally have smaller OC stocks than the non-salt-affected Kastanozems. In contrast in our study, salt-affected soils had larger OC stocks compared to the nearby Kastanozems. With average OC stocks of 70.9 ± 2.8 Mg ha−1 in 0–100 cm of depth for the Kastanozems, the values were clearly below those observed by Batjes (1996) and calculated from Bischoff et al. (2016). On the other hand, average OC stocks of 94.2 ± 6.9 and 129.5 ± 25.6 Mg ha−1 in 0–100 cm of the non-sodic Solonchaks and Sodic Solonchaks, respectively, were clearly above the values reported by Batjes (1996) and Muñoz-Rojas et al. (2012). Larger OC stocks in salt-affected soils than in Kastanozems are also in contrast to earlier work, which found a negative effect of salinity on soil OC stocks (reviewed by Wong et al., 2010). Possible reasons for the observed differences are climatic variations between the studies (strong aridity in the Spanish Solonchaks from Muñoz-Rojas et al., 2012) or alterations in soil texture (finer textured Kastanozems in the study from Bischoff et al., 2016), which may change the soil water balance and thus plant growth and soil OC inputs. However, it appears that the covarying moisture gradient along the salinity transect is a better explanation for the observed differences. During sampling we observed very dry conditions in the Kastanozems (only 4.0 ± 0.3 % soil water related to dry soil mass), while the Solonchaks were generally wetter due to their shallow groundwater table (15–30 % soil water; Table 2). Overall, the water stress in the three soil types could have been similar either as a result of osmotic or matric stress, leading to comparable moisture conditions for plant growth. Accordingly, plant growth (as measured by aboveground biomass) was not reduced under high salinity along the transect (Table 1) which is in contrast to previous work (Läuchli and Grattan, 2007; Wong et al., 2010). As this is expected to reduce OC stocks at elevated salinity (Wong et al., 2010), we consider it as the most likely reason why we did not find a negative relation between OC quantity and salinity. Since the δ13C ratios suggested that soil OM was mostly root derived in the studied soils (Fig. 3), one might argue that aboveground biomass is a poor proxy for soil OC input. However, under the assumption that root residue inputs are correlated with the aboveground biomass (evidence is given by Titlyanova et al., 1999, who observed significant correlations (p < 0.01, R > 0.5) between the aboveground and belowground biomass of typical plants in Siberian grasslands), one can conclude that both aboveground and belowground soil OC inputs were comparable between all three soil types.
Wong et al. (2010) argued that small OC stocks in salt-affected soils can also be the result of erosion-induced OC losses, as sodic soils are particularly prone to erosion. Since we paid particular attention to the fact that all soils were not affected by erosion, we can rule out erosion as a factor that modified OC stocks in our study.
In summary, our first hypothesis has to be rejected since soil OC stocks did not decrease with increasing salinity, which is in contrast to previous observations from comparable soils. What is decisive for our observations is probably the fact that the salinity gradient covaried with a moisture gradient. This presumably led to similar water stress either due to a low osmotic or a low matric potential along the entire transect. Hence, against our expectation, biomass production and soil OC inputs were not reduced under high salinity, which was initially assumed to decrease OC stocks in salt-affected soils.
4.2 Partitioning and composition of soil OM in functionally different OM fractions
Considering processes of soil OC stabilization, semiarid soils should have large proportions of particulate OC, as the formation of stable mineral–organic associations is attenuated due to low water availability and a high soil pH (Kleber et al., 2015). However, in the semiarid soils of the studied transect, particulate OC contributed < 10 % of bulk OC, while mineral-bound OC accounted for > 90 % (Table 3). This contrasts with observations from the steppe soils (mostly Chernozems) of European Russia (Breulmann et al., 2014; Kalinina et al., 2011), Canada (Plante et al., 2010), and China (Steffens et al., 2010) in which particulate OC represented > 20 % of bulk OC. Nevertheless, our results are in line with Bischoff et al. (2016), who reported that a maximum of 10 % OC was present as particulate OC in the Chernozems and Kastanozems of the Kulunda steppe. Thus, we support previous observations from this region and conclude that mineral-bound OM is the dominant OM fraction in both salt- and non-salt-affected soils of the studied region.
In our second hypothesis we expect the proportion and stability of particulate OM to be larger in the salt-affected than in the non-salt-affected soils. Against this hypothesis, Sodic and non-sodic Solonchaks contained similar proportions of particulate OC as the non-salt-affected Kastanozems, with 4–8 % particulate OC in all three soil types (Table 3). Comparable 14C activities in the LF of the three soil types (small 14C activities in the non-sodic Solonchak were probably due to contamination with HF material) indicated a similar turnover of particulate OM, thus contradicting our hypothesis of increased stabilization of particulate OM under high salinity levels. Based on OC determinations in particle-size separates and analyses of lignin components along a salinity gradient in the Argentinian Pampa, Peinemann et al. (2005) suggested that particulate OM is a relatively stable fraction in salt-affected soils due to a reduced microbial transformation of the plant-derived residue inputs. This is not corroborated by our results. The isotopic C composition (14C activity, δ13C) and the composition of neutral sugars indicate a comparable alteration of OM (i.e., degree of OM decomposition) between the three soil types (Figs. 3–5). As for the first hypothesis, a possible explanation for our observations is that soil moisture covaried with salinity along the transect. Given that the water stress is similar in all three soil types either due to a low osmotic or matric potential, OM decomposition can likewise be reduced in both the salt-affected and non-salt-affected soils. This results in a similar proportion and stability of particulate OM and a comparable alteration of soil OM along the transect, as indicated by the similar composition of C isotopes and neutral sugars in the studied soils. Hence, soil moisture can be considered a master variable in the OM dynamics of salt-affected soils, as it controls OM input and decomposition and can thus interfere with the effect of salinity on the quantity and quality of soil OM.
With respect to mineral-associated OM, Peinemann et al. (2005) concluded that mineral-bound OM is relatively susceptible to losses in salt-affected soils due to weak chemical bonding and subsequently weak OM stabilization. Our third hypothesis was built upon this conclusion, but in contrast the OC content of the HF of the salt-affected soils was more than twice as large as of the non-salt-affected Kastanozems (Table 3). Moreover, during washing of the density separates (sodium polytungstate removal) relatively less OC was mobilized from the HF of the salt-affected soils (3–10 % MobC) than from the HF of the Kastanozems (16–46 % MobC; Table 3), suggesting a lower chemical stabilization of mineral-bound OM in the non-salt-affected soils. We explain the large contents of mineral-associated OC under high salinity levels by considering basic chemical principles. According to Sumner (1993), the dispersion of clay minerals is only possible below their critical flocculation concentration (CFC). This concept relates the dispersive effect of Na+ on the soil structure to the corresponding salt concentration of the soil solution (Rengasamy et al., 1984; Sumner et al., 1998). The authors classified soils into flocculated, potentially dispersive, and dispersive depending on the EC and SAR of the soil water extract. Sumner et al. (1998) classified soils with large proportions of non-expandable illitic clays, while Rengasamy et al. (1984) considered soils with expandable 2 : 1 clays similar to the smectite-rich soils of the studied transect. According to their classification, all of the salt-affected soils in our study fall into the category flocculated; even the A horizons of the Sodic Solonchaks with an average SAR of 36 ± 10 remain flocculated, presumably due to the high electrolyte concentration as indicated by a high EC of 5350 ± 1476 µS cm−1 (Table 2). This is underpinned by the high aggregate stability of the Sodic Solonchaks (Table 2) and the lack of clay lessivation or OM translocation, which are processes that require the dispersion of clay and OM. In laboratory experiments, Setia et al. (2013, 2014) confirmed that the dispersive effect of Na+ on OM and mineral components is only evident at low electrolyte concentrations, particularly at low concentrations of divalent cations like Ca2+. These studies suggest that the content of water-soluble salts in the soils of the studied transect is large enough to provoke the flocculation of OM and mineral components and the formation of stable mineral–organic associations. Moreover, Nelson and Oades (1998) showed that the solubility of Na+-coated OM is larger than that of OM coated with Ca2+. Thus, particularly in the non-sodic Solonchaks where Ca2+ is a dominant cation in the soil solution (Fig. S1), the solubility of OM can be reduced. Furthermore, the Solonchaks had higher clay and silt contents than the Kastanozems (Table 2). This may also account for the higher HF–OC contents in the Solonchaks, as OM has an increased affinity to sorb on minerals in the clay- and silt-sized fraction (Kleber et al., 2015).
Interestingly, during the sodium polytungstate removal in the density fractionation procedure, we found larger losses of HF material in the salt-affected soils compared to the non-salt-affected Kastanozems, which we ascribe to the leaching of water-soluble salts (Table 3). However, the loss of MobC was much lower in the salt-affected soils. This indicates that the water-soluble salts were mostly not associated with OC, presumably because these salt minerals have a fast turnover (frequent formation and dissolution as a function of the actual soil water content) and a small number of reactive surfaces.
To sum up, in salt-affected soils particulate OM can be more labile than previously assumed, as evidenced by its small quantity in the Sodic and non-sodic Solonchaks together with its low 14C ages. Salinity did not alter the proportion and stability of particulate OM, possibly due to the covarying moisture gradient. This suggests that soil moisture is a master variable that has to be considered when analyzing the effect of salinity on soil OM dynamics. Mineral-bound OM, on the other hand, is stabilized in the studied salt-affected soils as the high electrolyte concentration in the soil solution promotes the flocculation of OM and mineral components.
4.3 Microbial community composition along the salinity gradient
Microbial communities are sensitive to environmental changes and react to differences in the osmotic and matric potential (Rath and Rousk, 2015; Schimel et al., 2007). Fungi and gram-positive bacteria are thought to be particularly more resistant against drought than gram-negative bacteria due to their ability to produce higher amounts of osmolytes (Schimel et al., 2007). Moreover, the cell walls of fungi and gram-positive bacteria offer better protection against water loss, and fungal hyphae are less dependent on water-filled pore space (Lennon et al., 2012). However, previous work on differences in the microbial community composition along salinity gradients could not support the view that fungi are superior to bacteria under water stress caused by high salinity levels, as several studies even observed a negative relationship between fungal abundance and salinity (Baumann and Marschner, 2011; Chowdhury et al., 2011; Pankhurst et al., 2001). This suggests that in salt-affected soils it is not only drought that dictates the abundance of certain microbial groups, but also that toxic effects of certain ions or impeded nutrient uptake may exist. In our study, the fungi : bacteria ratio was not related to the salinity gradient and was similar in the topsoils of the three soil types (Table 4). Hence, our fourth hypothesis has to be rejected. As with hypotheses 1 and 2, a possible explanation is the covarying moisture gradient along the salinity transect, which could have led to comparable water potentials (either due to low matric or osmotic potential) along the salinity gradient. Chowdhury et al. (2011) analyzed the effect of an alternating matric and osmotic potential on the PLFA-based microbial community composition. They detected a decreasing fungi : bacteria ratio with decreasing osmotic potential, while the opposite effect was evident with declining matric potential. Thus, with respect to our transect, both effects (decreasing matric vs. osmotic potential) could have canceled each other out, which resulted in similar fungi : bacteria ratios in the topsoils along the salinity gradient. Differences were only evident in the subsoils where salt-affected soils showed higher fungi : bacteria ratios than the non-salt-affected Kastanozems (Table 4). In the Sodic Solonchak, fungi : bacteria ratios even increased from topsoil to subsoil (less pronounced also in the non-sodic Solonchak), which is contrary to what was found in previous studies of temperate soils (Ekelund et al., 2001; Fierer et al., 2003; Taylor et al., 2002). This could indicate larger C availability in the subsoil of the salt-affected soils (Fierer et al., 2003), which is also suggested by the δ13C ratios of the LF, which decrease from topsoil to subsoil in the Solonchaks (Fig. 3).
With respect to the PLFA-based microbial community composition, PCA revealed a higher abundance of AMF in the salt-affected soils than in the Kastanozems (Fig. 6). Evelin et al. (2009) reviewed the role of AMF in alleviating salt stress for plants. They concluded that AMF increased nutrient uptake, photosynthetic rate, water-use efficiency, and improved osmoregulation in the host plant. Thus, salt stress in plants caused by high salinity levels, such as a hampered nutrient uptake due to ion competition or exposure to osmotic stress, can be alleviated by symbiosis with AMF. This could explain the higher relative abundance of AMF in the Solonchaks of the studied transect.
The findings of this study suggest that soil moisture is a master variable shaping the soil OM dynamics along a salinity gradient of semiarid steppe soils. The covarying moisture gradient along the salinity gradient serves as an explanatory factor for (i) the increasing soil OC stocks with increasing salinity, (ii) the constant proportion and stability of particulate OM along the transect, and (iii) a similar fungi : bacteria ratio in the topsoils along the studied gradient. As a new emerging hypothesis, we suppose that the higher soil moisture in the salt-affected soils compensates for the negative effects of high salinity on plant growth and the microbial community. By measuring the water potential as the sum of matric and osmotic potential, one could test whether water stress occurs in both salt-affected and non-salt-affected soils. Since the covariation of salinity and moisture is a natural phenomenon in the groundwater-affected Solonchaks of semiarid steppes, this aspect deserves more attention in future studies.
Our data also showed that high salinity can cancel out the effect of sodicity on the dispersion of OM and mineral components. This we ascribe to the high ionic strength of the soil solution fostering the flocculation of soil constituents and increasing the formation and stability of mineral–organic associations. Given similar OC inputs into the soils along the transect, this could be the reason for the larger OC stocks in the salt-affected soils.
All data are available as an *.xlsx file and attached in the Supplement.
The supplement related to this article is available online at: https://doi.org/10.5194/bg-15-13-2018-supplement.
The authors declare that they have no conflict of interest.
This study was funded by the Federal Ministry of Education and Research
(Germany) in the framework of the Kulunda project (01LL0905). Olga Shibistova
and Georg Guggenberger appreciate funding from the Russian Ministry of
Education and Science (no. 14.B25.31.0031). Thanks to the entire Kulunda team
for good collaboration and great team spirit. Silke
Bokeloh, Elke Eichmann-Prusch, Ulrieke Pieper, Fabian Kalks, and Michael
Klatt are acknowledged for their reliable assistance in the laboratory. Special thanks
to Leopold Sauheitl for his excellent guidance in the lab. We
thank the associate editor and two anonymous reviewers for valuable
suggestions on the paper and appreciate the fruitful comments of the
scientific community in the Biogeosciences discussion forum.
The publication of this article was funded by the open-access
fund of Leibniz Universität Hannover.
Edited by: Jens-Arne Subke
Reviewed by: two anonymous referees
Amini, S., Ghadiri, H., Chen, C., and Marschner, P.: Salt-affected soils, reclamation, carbon dynamics, and biochar: a review, J. Soils Sediments, 16, 939–953, https://doi.org/10.1007/s11368-015-1293-1, 2016.
Barin, M., Aliasgharzad, N., Olsson, P. A., and Rasouli-Sadaghiani, M.: Salinity-induced differences in soil microbial communities around the hypersaline Lake Urmia, Soil Res., 53, 494–504, https://doi.org/10.1071/SR14090, 2015.
Bates, D., Mächler, M., and Bolker, B.: Fitting linear mixed-effects models using lme4, J. Stat. Softw., 1–51, available at: http://arxiv.org/abs/1406.5823\%5Cnhttp://listengine.tuxfamily.org/lists.tuxfamily.org/eigen/2011/06/pdfKU_S0z6LjT.pdf (last access: 1 August 2016), 2012.
Batjes, N. H.: Total carbon and nitrogen in the soils of the world, Eur. J. Soil Sci., 47, 151–163, https://doi.org/10.1111/j.1365-2389.1996.tb01386.x, 1996.
Baumann, K. and Marschner, P.: Effects of salinity on microbial tolerance to drying and rewetting, Biogeochemistry, 112, 71–80, https://doi.org/10.1007/s10533-011-9672-1, 2011.
Bischoff, N., Mikutta, R., Shibistova, O., Puzanov, A., Reichert, E., Silanteva, M., Grebennikova, A., Schaarschmidt, F., Heinicke, S., and Guggenberger, G.: Land-use change under different climatic conditions: Consequences for organic matter and microbial communities in Siberian steppe soils, Agr. Ecosyst. Environ., 235, 253–264, https://doi.org/10.1016/j.agee.2016.10.022, 2016.
Breulmann, M., Masyutenko, N. P., Kogut, B. M., Schroll, R., Dörfler, U., Buscot, F., and Schulz, E.: Short-term bioavailability of carbon in soil organic matter fractions of different particle sizes and densities in grassland ecosystems, Sci. Total Environ., 497–498, 29–37, https://doi.org/10.1016/j.scitotenv.2014.07.080, 2014.
Cheshire, M. V.: Nature and origin of carbohydrates in soils, Academic Press, London, 1979.
Chowdhury, N., Marschner, P., and Burns, R.: Response of microbial activity and community structure to decreasing soil osmotic and matric potential, Plant Soil, 344, 241–254, https://doi.org/10.1007/s11104-011-0743-9, 2011.
DIN ISO, 11277: Soil quality – determination of particle size distribution in mineral soil material – method by sieving and sedimentation, 2002.
Eder, E., Spielvogel, S., Kölbl, A., Albert, G., and Kögel-Knabner, I.: Analysis of hydrolysable neutral sugars in mineral soils: Improvement of alditol acetylation for gas chromatographic separation and measurement, Org. Geochem., 41, 580–585, https://doi.org/10.1016/j.orggeochem.2010.02.009, 2010.
Ekelund, F., Rønn, R., and Christensen, S.: Distribution with depth of protozoa, bacteria and fungi in soil profiles from three Danish forest sites, Soil Biol. Biochem., 33, 475–481, https://doi.org/10.1016/S0038-0717(00)00188-7, 2001.
Essington, M. E.: Soil and water chemistry – An integrative approach, CRC Press, Boca Raton, USA, 2004.
Evelin, H., Kapoor, R., and Giri, B.: Arbuscular mycorrhizal fungi in alleviation of salt stress: A review, Ann. Bot., 104, 1263–1280, https://doi.org/10.1093/aob/mcp251, 2009.
FAO: Lecture notes on the major soils of the world, edited by: Driessen, P., Deckers, J., Spaargaren, O., and Nachtergaele, F., World soil Resour. reports, 94, p. 336, https://doi.org/10.1136/gut.27.11.1400-b, 2001.
Fierer, N., Schimel, J. P., and Holden, P. A.: Variations in microbial community composition through two soil depth profiles, Soil Biol. Biochem., 35, 167–176, https://doi.org/10.1016/S0038-0717(02)00251-1, 2003.
Frostegård, Å., Tunlid, A., and Bååth, E.: Use and misuse of PLFA measurements in soils, Soil Biol. Biochem., 43, 1621–1625, https://doi.org/10.1016/j.soilbio.2010.11.021, 2011.
Gentsch, N., Mikutta, R., Alves, R. J. E., Barta, J., Capek, P., Gittel, A., Hugelius, G., Kuhry, P., Lashchinskiy, N., Palmtag, J., Richter, A., Šantrucková, H., Schnecker, J., Shibistova, O., Urich, T., Wild, B., and Guggenberger, G.: Storage and transformation of organic matter fractions in cryoturbated permafrost soils across the Siberian Arctic, Biogeosciences, 12, 4525–4542, https://doi.org/10.5194/bg-12-4525-2015, 2015.
Golchin, A., Oades, J. M., Skjemstad, J. O., and Clarke, P.: Study of free and occluded particulate organic matter in soils by solid state 13C CP/MAS NMR spectroscopy and scanning electron microscopy, Aust. J. Soil Res., 32, 285–309, https://doi.org/10.1071/SR9940285, 1994.
Gunina, A. and Kuzyakov, Y.: Sugars in soil and sweets for microorganisms: Review of origin, content, composition and fate, Soil Biol. Biochem., 90, 87–100, https://doi.org/10.1016/j.soilbio.2015.07.021, 2015.
Gunina, A., Dippold, M. A., Glaser, B., and Kuzyakov, Y.: Fate of low molecular weight organic substances in an arable soil: From microbial uptake to utilisation and stabilisation, Soil Biol. Biochem., 77, 304–313, https://doi.org/10.1016/j.soilbio.2014.06.029, 2014.
Hartge, K. H. and Horn, R.: Die physikalische Untersuchung von Böden, 2nd Edn., F. Enke Verlag, Stuttgart, 1989.
Hijmans, R. J., Cameron, S. E., Parra, J. L., Jones, P. G., and Jarvis, A.: Very high resolution interpolated climate surfaces for global land areas, Int. J. Climatol., 25, 1965–1978, https://doi.org/10.1002/joc.1276, 2005.
Hothorn, T., Bretz, F., and Westfall, P.: Simultaneous inference in general parametric models, Biometrical J., 50, 346–363, https://doi.org/10.1002/bimj.200810425, 2008.
Hua, Q., Barbetti, M., and Rakowski, A. Z.: Atmospheric radiocarbon for the period 1950–2010, Radiocarbon, 55, 2059–2072, https://doi.org/10.2458/azu_js_rc.v55i2.16177, 2013.
IUSS Working Group WRB: World reference base for soil resources 2014, International soil classification system for naming soils and creating legends for soil maps, World Soil Resour. Reports No. 106, p. 191, https://doi.org/10.1017/S0014479706394902, 2014.
Kalinina, O., Krause, S.-E., Goryachkin, S. V., Karavaeva, N. A., Lyuri, D. I., and Giani, L.: Self-restoration of post-agrogenic chernozems of Russia: Soil development, carbon stocks, and dynamics of carbon pools, Geoderma, 162, 196–206, https://doi.org/10.1016/j.geoderma.2011.02.005, 2011.
Kleber, M., Eusterhues, K., Keiluweit, M., Mikutta, C., Mikutta, R., and Nico, P. S.: Mineral-organic associations: formation, properties, and relevance in soil environments, Adv. Agron., 130, 140, https://doi.org/10.1016/bs.agron.2014.10.005, 2015.
Kuznetsova, A., Brockhott, P. B., and Christensen, R. H. B.: lmerTest: Tests in linear mixed effects models. R package version 2.0-25, available at: http://cran.r-project.org/package=lmerTest (last access: 1 August 2016), 2015.
Lal, R.: Soil carbon sequestration impacts on global climate change and food security, Science, 304, 1623–1627, https://doi.org/10.1126/science.1097396, 2004.
Läuchli, A. and Grattan, S. R.: Plant growth and development under salinity stress, in: Advances in molecular breeding toward drought and salt tolerant crops, edited by: Jenks, M. A., Hasegawa, P. M., and Mohan Jain, S., Springer, Dordrecht, Netherlands, 1–32, 2007.
Lennon, J. T., Aanderud, Z. T., Lehmkuhl, B. K., and Schoolmaster, D. R.: Mapping the niche space of soil microorganisms using taxonomy and traits, Ecology, 93, 1867–1879, https://doi.org/10.1890/11-1745.1, 2012.
Lenth, R. V. and Herve, M.: lsmeans: Least-squares means, R package version 2.17, available at: http://cran.r-project.org/package=lsmeans (last access: 1 August 2016), 2015.
Martinez-Beltran, J. and Manzur, C. L.: Overview of salinity problems in the world and FAO strategies to address the problem, in: Proceedings of the international salinity forum, Riverside, USA, 311–313, 2005.
Mavi, M. S., Sanderman, J., Chittleborough, D. J., Cox, J. W., and Marschner, P.: Sorption of dissolved organic matter in salt-affected soils: effect of salinity, sodicity and texture, Sci. Total Environ., 435–436, 337–44, https://doi.org/10.1016/j.scitotenv.2012.07.009, 2012.
McKeague, J. A. and Day, J. H.: Dithionite- and oxalate-extractable Fe and Al as aids in differentiating various classes of soils, Can. J. Soil Sci., 46, 13–22, https://doi.org/10.4141/cjss66-003, 1966.
Muñoz-Rojas, M., Jordán, A., Zavala, L. M., De la Rosa, D., Abd-Elmabod, S. K., and Anaya-Romero, M.: Organic carbon stocks in Mediterranean soil types under different land uses (Southern Spain), Solid Earth, 3, 375–386, https://doi.org/10.5194/se-3-375-2012, 2012.
Nelson, P. N. and Oades, J. M.: Organic matter, sodicity, and soil structure, in: Sodic soils: Distribution, properties, management, and environmental consequences, edited by: Sumner, M. E. and Naidu, R., Oxford University Press Inc, New York, 51–75, 1998.
Olsson, P. A.: Signature fatty acids provide tools for determination of the distribution and interactions of mycorrhizal fungi in soil, FEMS Microbiol. Ecol., 29, 303–310, https://doi.org/10.1111/j.1574-6941.1999.tb00621.x, 1999.
Pankhurst, C. E., Yu, S., Hawke, B. G., and Harch, B. D.: Capacity of fatty acid profiles and substrate utilization patterns to describe differences in soil microbial communities associated with increased salinity or alkalinity at three locations in South Australia, Biol. Fert. Soils, 33, 204–217, https://doi.org/10.1007/s003740000309, 2001.
Paramonov, E. G.: The creation of forest as agrarian landscapes for ensuring sustainable management in Kulunda steppe, Bulletin AB RGS [Izvestiya AO RGO], 40, 57–63, 2016 (in Russian with English abstract).
Pathak, H. and Rao, D. L. N.: Carbon and nitrogen mineralization from added organic matter in saline and alkali soils, Soil Biol. Biochem., 30, 695–702, https://doi.org/10.1016/S0038-0717(97)00208-3, 1998.
Peinemann, N., Guggenberger, G., and Zech, W.: Soil organic matter and its lignin component in surface horizons of salt-affected soils of the Argentinian Pampa, Catena, 60, 113–128, https://doi.org/10.1016/j.catena.2004.11.008, 2005.
Plante, A. F., Virto, I., and Malhi, S. S.: Pedogenic, mineralogical and land-use controls on organic carbon stabilization in two contrasting soils, Can. J. Soil Sci., 90, 15–26, https://doi.org/10.4141/CJSS09052, 2010.
Poeplau, C. and Don, A.: Sensitivity of soil organic carbon stocks and fractions to different land-use changes across Europe, Geoderma, 192, 189–201, https://doi.org/10.1016/j.geoderma.2012.08.003, 2013.
Qadir, M. and Schubert, S.: Degradation processes and nutrient constraints in sodic soils, Land Degrad. Dev., 13, 275–294, https://doi.org/10.1002/ldr.504, 2002.
Rath, K. M. and Rousk, J.: Salt effects on the soil microbial decomposer community and their role in organic carbon cycling: A review, Soil Biol. Biochem., 81, 108–123, https://doi.org/10.1016/j.soilbio.2014.11.001, 2015.
R Core Team: R: A language and environment for statistical computing, available at: http://www.r-project.org/ (last access: 1 August 2016), 2016.
Reimer, P. J., Bard, E., Bayliss, A., Beck, J. W., Blackwell, P. G., and Ramsey, C. B.: IntCal13 and Marine13 radiocarbon age calibration curves 0–50,000 years cal BP, Radiocarbon, 55, 1869–1887, https://doi.org/10.2458/azu_js_rc.55.16947, 2013.
Rengasamy, P., Greene, R. S. B., Ford, G. W., and Mehanni, A. H.: Identification of dispersive behaviour and the management of red-brown earths, Soil Res., 22, 413–431, https://doi.org/10.1071/Sr9840413, 1984.
Rietz, D. N. and Haynes, R. J.: Effects of irrigation-induced salinity and sodicity on soil microbial activity, Soil Biol. Biochem., 35, 845–854, https://doi.org/10.1016/S0038-0717(03)00125-1, 2003.
Ruess, L. and Chamberlain, P. M.: The fat that matters: Soil food web analysis using fatty acids and their carbon stable isotope signature, Soil Biol. Biochem., 42, 1898–1910, https://doi.org/10.1016/j.soilbio.2010.07.020, 2010.
Rumpel, C. and Dignac, M.-F.: Gas chromatographic analysis of monosaccharides in a forest soil profile: Analysis by gas chromatography after trifluoroacetic acid hydrolysis and reduction–acetylation, Soil Biol. Biochem., 38, 1478–1481, https://doi.org/10.1016/j.soilbio.2005.09.017, 2006.
Schimel, J., Balser, T. C., and Wallenstein, M.: Microbial stress-response physiology and its implications for ecosystem function, Ecology, 88, 1386–1394, https://doi.org/10.1890/06-0219, 2007.
Schlichting, E., Blume, H.-P., and Stahr, K.: Bodenkundliches Praktikum – Eine Einführung in pedologisches Arbeiten für Ökologen, insbesondere Land- und Forstwirte, und für Geowissenschaftler, 2nd Edn., Blackwell Wissenschafts-Verlag Berlin, Wien, Austria, 1995.
Schnecker, J., Wild, B., Fuchslueger, L., and Richter, A.: A field method to store samples from temperate mountain grassland soils for analysis of phospholipid fatty acids, Soil Biol. Biochem., 51, 81–83, https://doi.org/10.1016/j.soilbio.2012.03.029, 2012.
Setia, R., Rengasamy, P. and Marschner, P.: Effect of exchangeable cation concentration on sorption and desorption of dissolved organic carbon in saline soils, Sci. Total Environ., 465, 226–232, https://doi.org/10.1016/j.scitotenv.2013.01.010, 2013.
Setia, R., Rengasamy, P., and Marschner, P.: Effect of mono- and divalent cations on sorption of water-extractable organic carbon and microbial activity, Biol. Fert. Soils, 50, 727–734, https://doi.org/10.1007/s00374-013-0888-1, 2014.
Steffens, M., Kölbl, A., Schörk, E., Gschrey, B., and Kögel-Knabner, I.: Distribution of soil organic matter between fractions and aggregate size classes in grazed semiarid steppe soil profiles, Plant Soil, 338, 63–81, https://doi.org/10.1007/s11104-010-0594-9, 2010.
Steinhof, A.: Data analysis at the Jena 14C laboratory, Radiocarbon, 55, 282–293, https://doi.org/10.2458/azu_js_rc.55.16350, 2013.
Steinhof, A., Baatzsch, A., Hejja, I., and Wagner, T.: Ion source improvements at the Jena 14C-AMS facility, Nucl. Instrum. Meth. B, 269, 3196–3198, https://doi.org/10.1016/j.nimb.2011.04.018, 2011.
Stuiver, M. and Polach, H. A.: Reporting of 14C data, Radiocarbon, 19, 355–363, https://doi.org/10.1016/j.forsciint.2010.11.013, 1977.
Sumner, M. E.: Sodic soils: New perspectives, Aust. J. Soil Res., 31, 683–750, https://doi.org/10.1071/SR9930683, 1993.
Sumner, M. E., Rengasamy, P., and Naidu, R.: Sodic soils: a reappraisal, in: Sodic soils: Distribution, properties, management, and environmental consequences, edited by: Sumner, M. E. and Naidu, R., Oxford University Press Inc, New York, 3–17, 1998.
Taylor, J. P., Wilson, B., Mills, M. S., and Burns, R. G.: Comparison of microbial numbers and enzymatic activities in surface soils and subsoils using various techniques, Soil Biol. Biochem., 34, 387–401, https://doi.org/10.1016/S0038-0717(01)00199-7, 2002.
Titlyanova, A. A., Romanova, I. P., Kosykh, N. P., and Mironycheva-Tokareva, N. P.: Pattern and process in above-ground and below-ground components of grassland ecosystems, J. Veg. Sci., 10, 307–320, https://doi.org/10.2307/3237060, 1999.
U.S. Salinity Laboratory Staff: Diagnosis and improvement of saline and alkaline soils, edited by: Richards, L. A., Government Printing Office, Washington DC, 1954.
Walthert, L., Graf, U., Kammer, A., Luster, J., Pezzotta, D., Zimmermann, S., and Hagedorn, F.: Determination of organic and inorganic carbon, δ13 C, and nitrogen in soils containing carbonates after acid fumigation with HCl, J. Plant Nutr. Soil Sc., 173, 207–216, https://doi.org/10.1002/jpln.200900158, 2010.
Wickham, H.: ggplot2: Elegant graphics for data analysis, Springer-Verlag New York, ISBN 978-0-387-98140-6, https://doi.org/10.1007/978-0-387-98141-3, 211 pp., 2009.
Wong, V. N. L., Greene, R. S. B., Dalal, R. C., and Murphy, B. W.: Soil carbon dynamics in saline and sodic soils: A review, Soil Use Manage., 26, 2–11, https://doi.org/10.1111/j.1475-2743.2009.00251.x, 2010.
Zelles, L.: Fatty acid patterns of phospholipids and lipopolysaccharides in the characterisation of microbial communities in soil: a review, Biol. Fert. Soils, 29, 111–129, https://doi.org/10.1007/s003740050533, 1999.