the Creative Commons Attribution 4.0 License.
the Creative Commons Attribution 4.0 License.
 | 05 Mar 2018
Towards an assessment of riverine dissolved organic carbon in surface waters of the western Arctic Ocean based on remote sensing and biogeochemical modeling
Vincent Le Fouest
Atsushi Matsuoka
Manfredi Manizza
Mona Shernetsky
Bruno Tremblay
Marcel Babin
Future climate warming of the Arctic could potentially enhance the load of terrigenous dissolved organic carbon (tDOC) of Arctic rivers due to increased carbon mobilization within watersheds. A greater flux of tDOC might impact the biogeochemical processes of the coastal Arctic Ocean (AO) and ultimately its capacity to absorb atmospheric CO2. In this study, we show that sea-surface tDOC concentrations simulated by a physical–biogeochemical coupled model in the Canadian Beaufort Sea for 2003–2011 compare favorably with estimates retrieved by satellite imagery. Our results suggest that, over spring–summer, tDOC of riverine origin contributes to 35 % of primary production and that an equivalent of ∼ 10 % of tDOC is exported westwards with the potential of fueling the biological production of the eastern Alaskan nearshore waters. The combination of model and satellite data provides promising results to extend this work to the entire AO so as to quantify, in conjunction with in situ data, the expected changes in tDOC fluxes and their potential impact on the AO biogeochemistry at basin scale.
- Article
(1213 KB) - Full-text XML
-
Supplement
(242 KB) - BibTeX
- EndNote


The Arctic Ocean (AO) receives ∼10 % of the global freshwater discharge (Opsahl et al., 1999 and references therein), of which the larger part (∼54–64 %) originates from six main pan-Arctic rivers (Haine et al., 2015; Holmes et al., 2012; Aagaard and Carmack, 1989). Over the past 30 years, the Arctic freshwater cycle intensified as reflected by changes in snow cover (Bring et al., 2016), evapotranspiration from terrestrial vegetation (Bring et al., 2016), and precipitation (Vihma et al., 2016). It resulted in an increase of the freshwater discharge from North American and Eurasian rivers by ∼2.6 and ∼3.1 % per decade, respectively (Holmes et al., 2015). More than half the soil organic carbon stock on Earth is contained in the permafrost of the Arctic watersheds (Tarnocai et al., 2009). With the warming of the lower atmosphere, the permafrost undergoes a substantial thawing (Romanovsky et al., 2010) likely to alter the organic carbon content and quality of inland waters. In the past decades, the flux of dissolved organic carbon (DOC) decreased in the Yukon River (40 %; Striegl et al., 2005) while it increased at the Mackenzie River mouth (∼39 %; Tank et al., 2016). These contrasting responses to climate change suggest that the direction of future trends of DOC concentrations and fluxes to the AO are very uncertain (Abbott et al., 2016).
The coastal AO influenced by large river plumes is hence exposed to changing conditions. Coastal waters are supplied in riverine organic carbon all year round with a maximal flux in spring–early summer when the freshwater discharge reaches a seasonal maximum. In river waters, DOC is present in higher concentrations than the particulate form (Le Fouest et al., 2013; Dittmar et al., 2003). It accounts for more ∼82 % of the flux of total riverine organic carbon (McGuire et al., 2009). The pan-Arctic flux of riverine DOC to the AO is estimated to be 33–37.7 Tg C yr−1 (Holmes et al., 2012; Manizza et al., 2009; McGuire et al., 2009; Raymond et al., 2007). As the organic carbon formed by phytoplankton, terrigenous dissolved organic carbon (tDOC) can be considered as new carbon annually fueling the upper AO. In that respect, and regardless of its distinct nature and fate, the flux of riverine DOC is equivalent to 10–19 % of AO primary production (Stein and Macdonald, 2004; Bélanger et al., 2013). In the oligotrophic Beaufort Sea, this proportion reaches ∼34 % (S. Bélanger, personal communication, 2017). Riverine DOC is hence a significant pool in the Arctic carbon cycle that can markedly modify the biological production and biogeochemistry of the AO waters. Within the pelagic food web, riverine DOC can be assimilated and transformed, promoting both phytoplankton and bacterioplankton production (Le Fouest et al., 2015; Tank et al., 2012). Riverine DOC can also modulate the air–sea fluxes of CO2. In present climatic conditions, Manizza et al. (2011) suggest that the mineralization of riverine DOC into dissolved inorganic carbon would induce a 10 % decrease of the net oceanic CO2 uptake at the pan-Arctic scale. On East Siberian shelves, the degradation of terrestrial organic carbon would be partly responsible for sea-surface acidification (Semiletov et al., 2016).
In recent studies, riverine DOC flux data were used in a 3-D ocean–biogeochemical coupled model to investigate the fate of riverine DOC within Arctic surface waters (Le Fouest et al., 2015; Manizza et al., 2009, 2011, 2013). However, simulated spatial and temporal changes in riverine DOC concentrations have not yet been compared with remote sensing data to assess the model predictive ability. Such a model–satellite comparison allows for validating the model and then using it with confidence to resolve the annual cycle of riverine DOC, a prerequisite for a robust assessment of the riverine DOC contribution to the Arctic carbon cycle. To this end, riverine DOC concentrations at the sea surface obtained from a previous model run described in Le Fouest et al. (2015) and tDOC concentrations derived from remote sensing data were analyzed for the Canadian Beaufort Sea. As riverine DOC accounts for more than 99 % of the total tDOC exported to the AO (McGuire et al., 2009), we will use the term tDOC for both the model and remotely sensed data. Our goals are to compare tDOC data derived from the model and from remote sensing using skill metrics, in order to assess the model capacity to reproduce the observed seasonal and spatial variability in tDOC, and to provide bulk estimates of the seasonal tDOC stock and lateral fluxes within the surface coastal waters using a combination of these two approaches.
The paper is organized as follows. First, we describe the two different approaches used to quantify tDOC within the AO, i.e., a semi-analytical method based on remote sensing and a regional ocean–biogeochemical coupled model that includes explicit fluxes of riverine DOC to the AO. Second, we compare the distribution and export flux of tDOC within surface waters of the Beaufort Sea estimated by the model and remote sensing. Finally, we discuss future developments of biogeochemical models necessary to successfully simulate the carbon budget of Arctic coastal waters in a warming world.
2.1 Remote sensing data
Level 1A scene images acquired from the MODerate-resolution Imaging Spectroradiometer (MODIS) aboard the Aqua satellite were downloaded from the NASA ocean color website (https://oceandata.sci.gsfc.nasa.gov/MODIS-Aqua/L1/). After geometric correction, remote sensing reflectance (Rrs(λ)) data at 412, 443, 488, 531, 555, and 667 nm were obtained by applying the atmospheric correction proposed by Wang and Shi (2007) with modifications adapted to Arctic environments (Doxaran et al., 2015; Matsuoka et al., 2016). tDOC concentrations were estimated from the aCDOM (443) data using an empirical relationship between DOC and aCDOM (443) established in the southern Beaufort Sea (Matsuoka et al., 2013). Since DOC concentrations estimated using ocean color data are based on a highly significant DOC vs. aCDOM (443) relationship (R2=0.97; Matsuoka et al., 2012), the DOC is considered to be of terrestrial origin. Errors of intercept, slope, and aCDOM (443) were propagated into the in situ (empirical) DOC vs. aCDOM (443) relationship. This resulted in a mean uncertainty of the tDOC concentration estimates of 28 % (see Appendix A2 of Matsuoka et al., 2017). Scene images of tDOC concentrations were used to make monthly composite images at 1 km horizontal resolution of the Mackenzie Shelf in the Canadian Beaufort Sea (Fig. 1).
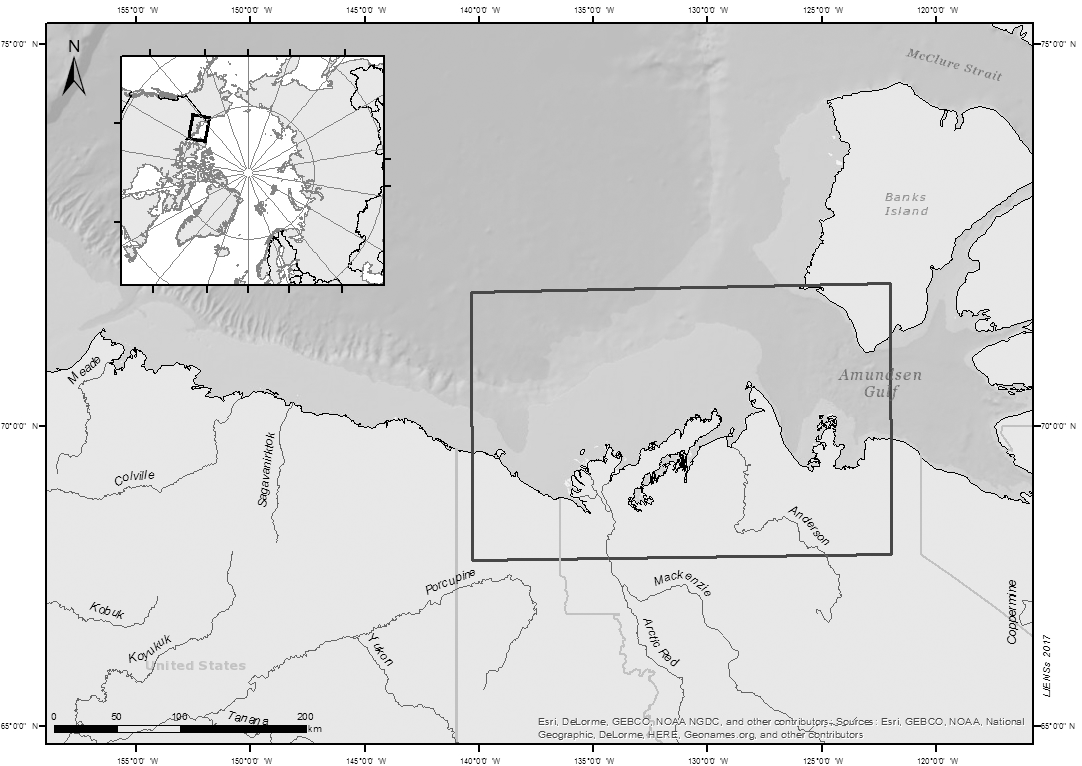
Figure 1Map of the Canadian Beaufort Sea. The location of the study area is outlined with a rectangle.
2.2 3-D physical–biogeochemical model data
We used sea-surface tDOC concentrations and ocean currents simulated over 2003–2011 by a previous pan-Arctic model run (“RIV run”) whose setup is fully detailed in Le Fouest et al. (2015). The pan-Arctic model data were extracted on the remote sensing geographical domain focused on the southern Beaufort Sea. We provide here a brief description of the physical–biogeochemical coupled model used to generate the “RIV run”. The MITgcm (MIT general circulation model) ocean–sea ice model (Nguyen et al., 2009, 2011; Losch et al., 2010; Condron et al., 2009) has a variable horizontal resolution of ∼18 km and covers the Arctic domain with open boundaries at 55∘ N on the Atlantic Ocean and Pacific Ocean sides. The open ocean boundaries are constrained by potential temperature, salinity, flow, and sea-surface elevation derived from integrations of a global configuration of the MITgcm model (Menemenlis et al., 2005). Atmospheric forcings (10 m winds, 2 m air temperature and humidity, and downward long- and shortwave radiation) are taken from the 6-hourly data sets of the Japanese 25-year ReAnalysis (JRA-25; Onogi et al., 2007). In addition to precipitation, the hydrologic forcing includes a monthly climatology of freshwater discharge from 10 pan-Arctic watersheds (Manizza et al., 2009). Monthly mean estuarine fluxes of freshwater are based on the Arctic Runoff Data Base (Lammers et al., 2001; Shiklomanov et al., 2000). For each watershed, the river discharge forcing is associated with a monthly climatology of riverine DOC concentration (Manizza et al., 2009). The total annual load of tDOC in the model is 37.7 Tg C yr−1. This is consistent with previous values reported in Raymond et al. (2007; 36 Tg C yr−1) and Holmes et al. (2012; 34 Tg C yr−1) and obtained by using load estimation models linking riverine DOC concentrations to river discharge data. The physical model is coupled with a 10-compartment biogeochemical model (Lee et al., 2016; Le Fouest et al., 2015). The biogeochemical model explicitly accounts for dissolved inorganic nutrients (nitrate and ammonium), small and large phytoplankton, protozooplankton, mesozooplankton, bacterioplankton, detrital particulate and dissolved organic nitrogen, and tDOC (Lee et al., 2016; Le Fouest et al., 2015). The tDOC compartment couples the marine and terrestrial cycling of organic matter though tDOC recycling into inorganic nutrients by bacterioplankton. We set the percentage of tDOC entering the model as usable by the bacterioplankton compartment to 15 %. This value was estimated based on the mean yearly percentages of the total load of riverine DOC considered as biodegradable DOC for six major Arctic rivers given in Wickland et al. (2012).
2.3 Analysis
Remotely sensed and simulated tDOC data were binned for the months of June, July, August, and September over the 9-year period (2003–2011) to get the best areal coverage in the satellite composites. The remotely sensed tDOC concentrations were regridded on the model horizontal grid. Skill metrics were used to compare the remotely sensed estimates of tDOC with their simulated counterparts (satn and modn, respectively). The metrics included the correlation coefficient (r), the unbiased root mean square error (RMSE), the Nash–Sutcliffe model efficiency index (MEF), the geometric bias, and the geometric RMSE (see Stow et al., 2009; Doney et al., 2009; Nash and Sutcliffe, 1970). The metrics are computed as follows:
where N is the number of tDOC data, and and are the remotely sensed and the simulated tDOC averages, respectively. Monthly fluxes of tDOC were calculated and summed along two cross-shelf transects (see upper-middle panel in Fig. 2). At each grid cell, the model flux estimate was computed as the product of the simulated sea-surface current velocity with the simulated tDOC concentration. The remote sensing flux estimate was computed as the product of the simulated sea-surface current velocity with the remotely sensed tDOC concentration.
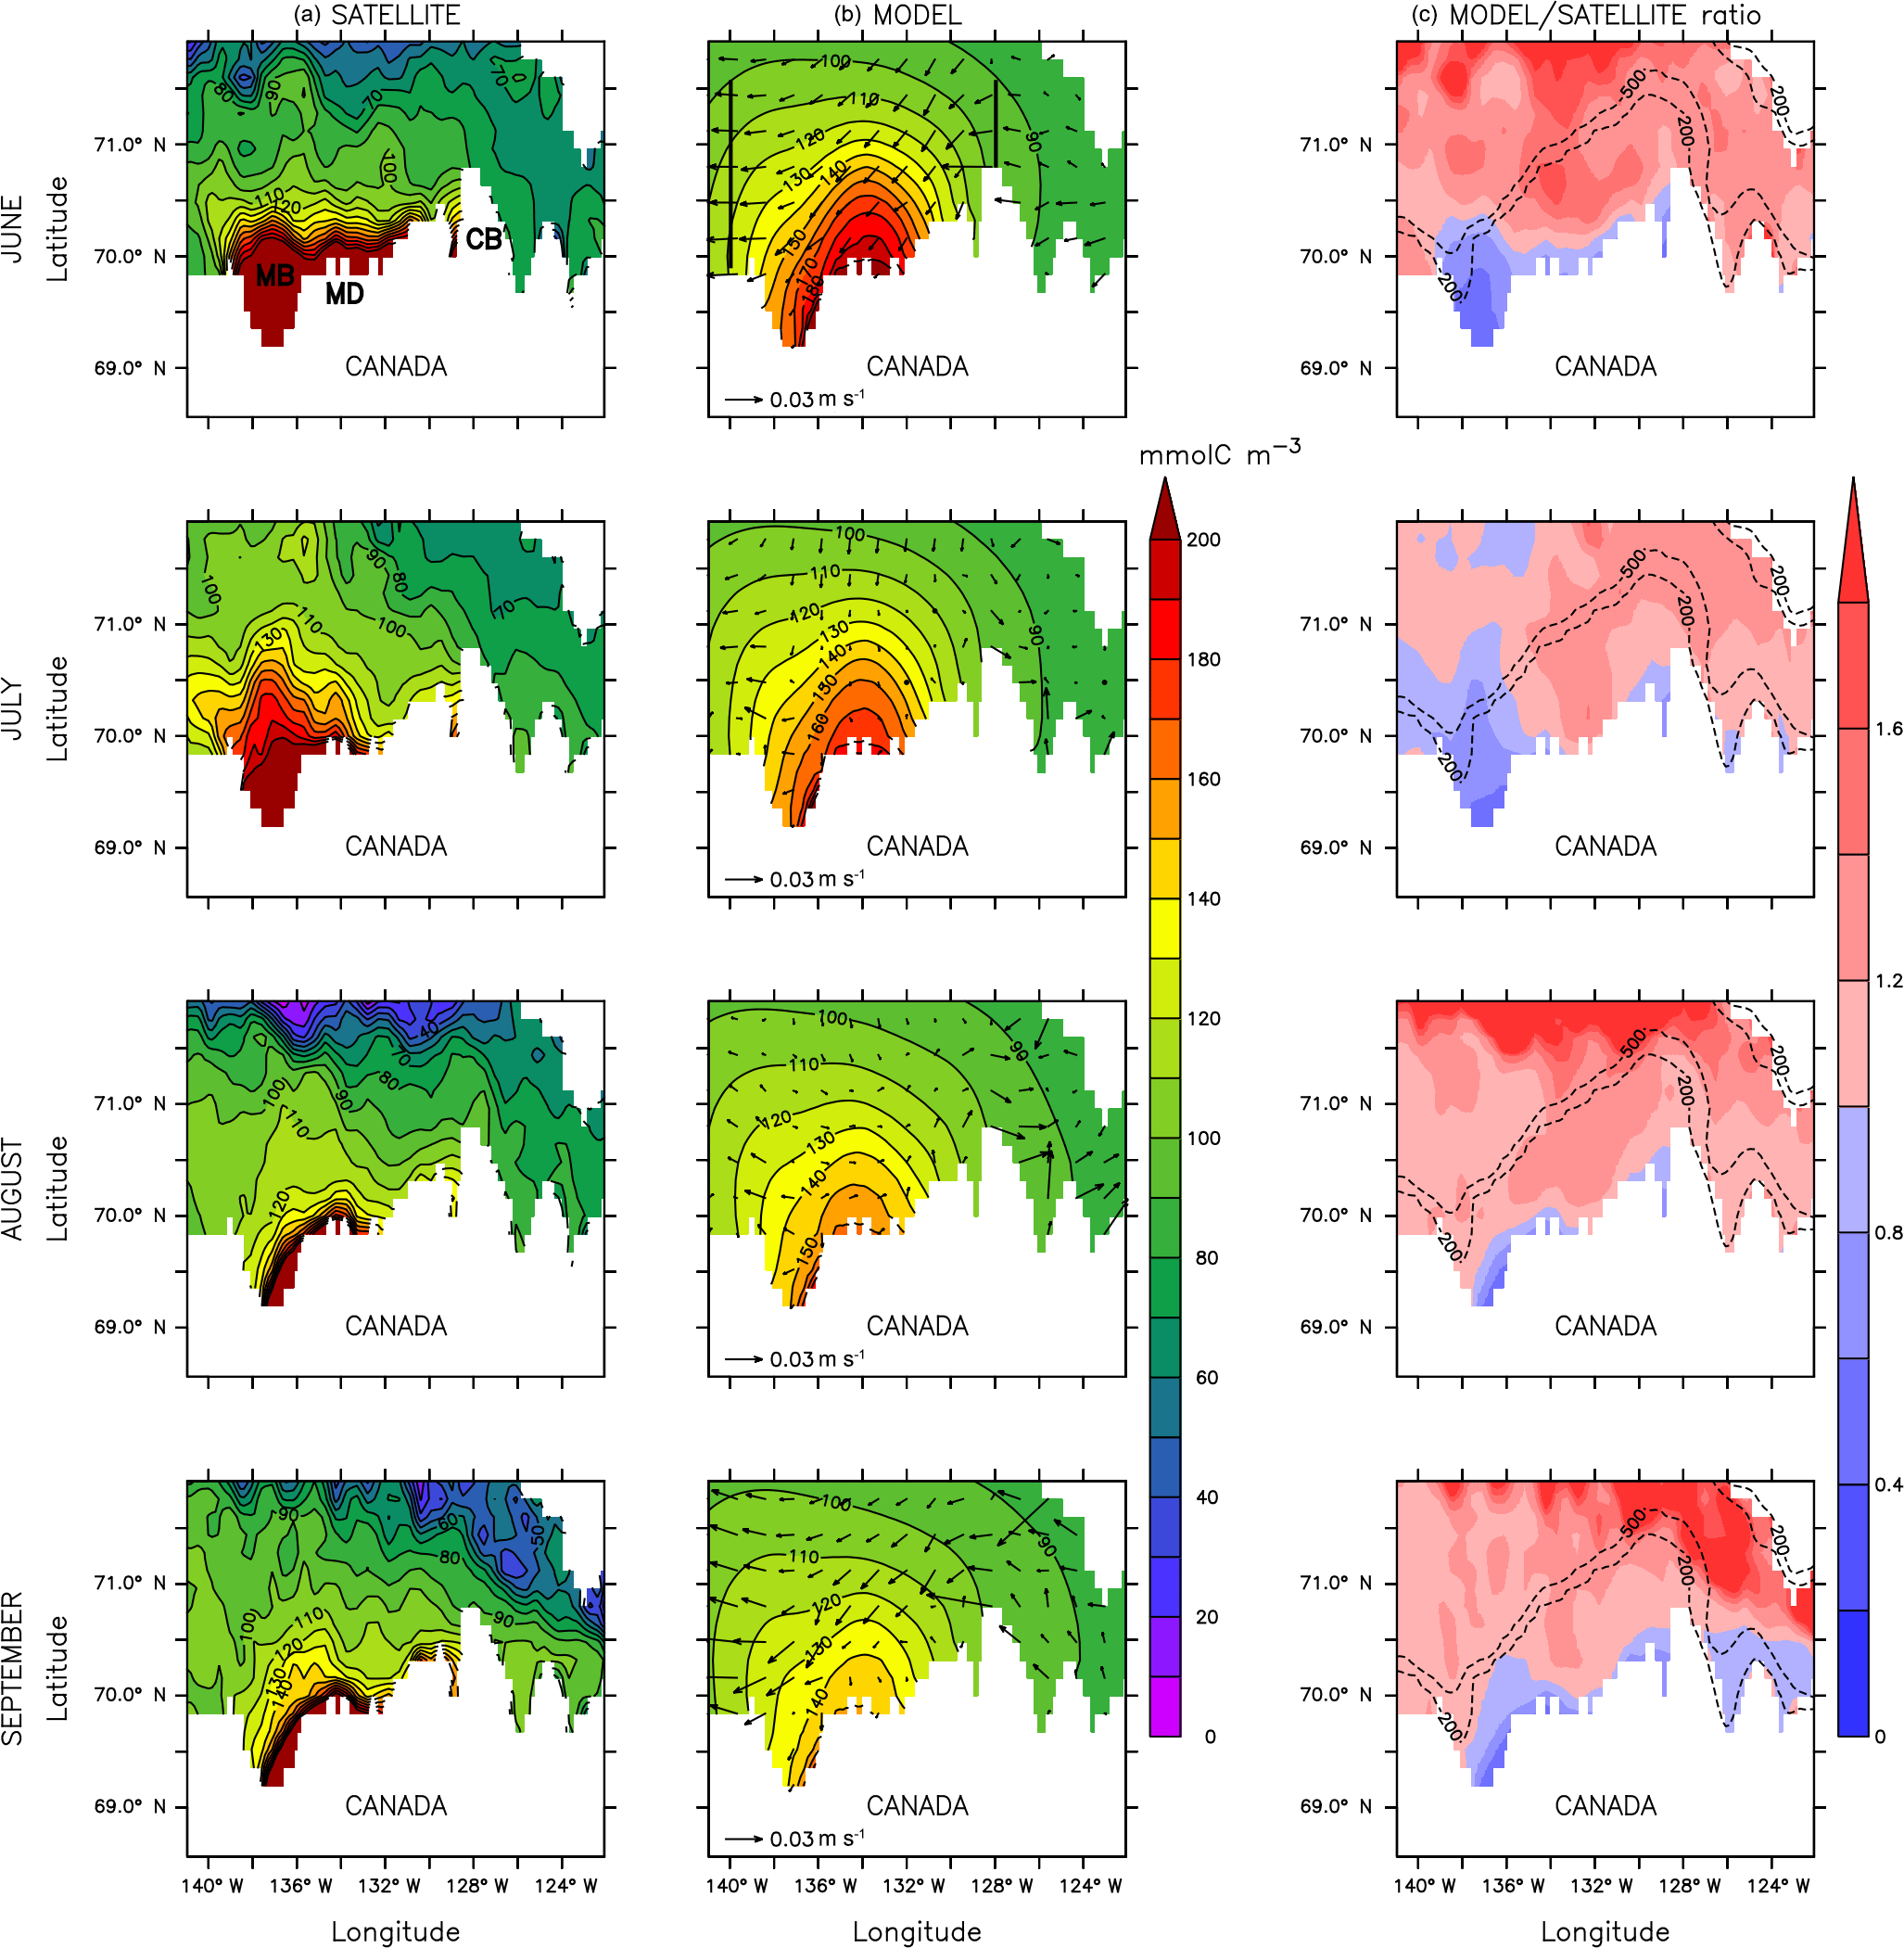
Figure 2Monthly climatology (2003–2011) of surface tDOC concentration (mmol C m−3) in the Beaufort Sea estimated from remotely sensed ocean color data (a) and by the biogeochemical model (b) for June, July, August, and September. Mackenzie Bay (MB), Mackenzie Delta (MD), and Cape Bathurst (CB) cited in the text are shown in the upper left panel. The isolines of tDOC concentration are overlaid (black full lines). In (b), simulated surface currents (m s−1) are overlaid. The two straight lines in the upper-middle panel refer to transects along which surface tDOC fluxes were computed. Panel (c) shows the model over satellite tDOC data ratio with the 200 and 500 m isobaths overlaid.
3.1 tDOC concentrations and distribution
Over the Mackenzie Shelf, the plume of high-tDOC (>120 mmol C m−3) had a maximal areal extent in June for both the model and the satellite data (Fig. 2). This coincided with the seasonal peak of river discharge in June as parameterized in the model and generally depicted by in situ time series (Yang et al., 2015). From July to September, the high-tDOC areal extent progressively decreased following the seasonal pattern of riverine freshwater discharge (see Yang et al., 2015; Manizza et al., 2009). This seasonal pattern was observed both in the model and satellite data. The simulated tDOC concentrations were lower than in the satellite record in Mackenzie Bay and east of the Mackenzie Bay, especially in June (by 44 % on average) and July (by 27 % on average). In the Beaufort and Chukchi seas, first-year sea ice represents a carbon flux to the ocean of Tg C yr−1 (Rachold et al., 2004). This flux is 4 orders of magnitude lower than the tDOC supply from the Mackenzie River specified as boundary conditions in the model (2.54 Tg C yr−1). Similarly, tDOC eroded from permafrost stored in the North American shores accounts for only ∼0.5– Tg C yr−1 (Tanski et al., 2016; Ping et al., 2011, using a DOC : particulate organic carbon, POC, ratio of 1:900 as in Tanski et al., 2016) to Tg C yr−1 (McGuire et al., 2009). With regard to these flux values, tDOC originating from both melted sea ice and eroded permafrost, not taken into account in the model, are hence not believed to explain the model–satellite discrepancies (Fig. 2). Other factors might contribute to these model–satellite differences observed nearshore. First, the model does not distinguish between the two main pathways of the Mackenzie River discharge entering the shallow delta zone. In June, the Mackenzie Bay receives most of the fresh and turbid river water (∼66 %), while the remaining ∼33 % spreads east of the delta in Kugmallit Bay (Davies, 1975). This pattern was particularly well captured by the remotely sensed data in June–July (Fig. 2). Second, the inner Mackenzie Shelf (<20 m depth) is bounded during winter by a thick-ridged ice barrier grounded on the sea floor called stamukha (Macdonald et al., 1995). The stamukha retains the turbid river water within the inner shelf in winter. When sea ice breaks up and the freshet reaches its seasonal maximum in spring, the retained turbid waters spread farther along the coastal zone. Contrary to the model, the remote sensing data could resolve this particular feature explaining the higher tDOC concentrations observed nearshore in June (see Fig. 2). Such a pattern observed for tDOC is also reported for terrigenous particulate organic matter (Doxaran et al., 2015). Further offshore on the Mackenzie Shelf, as delimited by the 300 m isobaths, both remotely sensed and simulated concentrations of tDOC were within the range of values measured in spring (∼110–230 mmol C m−3; Osburn et al., 2009) and summer (∼60–100 mmol C m−3; Para et al., 2013). The simulated values of tDOC were higher than those remotely sensed on the outer and off the shelf. Overall, the model and the satellite data captured the seasonal cycle and spatial distribution of tDOC concentrations in the study area.
Table 1Skill metrics of comparison computed based on the 2003–2011 monthly climatologies of tDOC.
Table 2Areal stock (Tg C) of sea-surface tDOC computed over the Mackenzie Shelf (delimited by the 300 m isobaths) from the model and satellite data. The bias (%) refers to the model data relative to the satellite data. The seasonal areal stock refers to the 4-month average ± SD.
Skill metrics were computed over the whole study area (see Fig. 2) to provide a quantitative comparison of tDOC simulated with the model and satellite data (Table 1). For all months, the correlation coefficient was relatively high (), within the range of values obtained for sea-surface dissolved inorganic nutrients simulated by global models (r>0.75; Doney et al., 2009). Regardless of amplitude, the r values showed that the simulated and remotely sensed tDOC concentrations presented similar patterns of variation. The size of the model–satellite discrepancies was given by the unbiased RMSE. Overall, the unbiased RMSE decreased from June (41.4 mmol C m−3) to September (29.3 mmol C m−3). This result suggested that the model accuracy increased from spring to summer. The model capability for predicting tDOC relative to the average of the remote sensing counterparts was estimated by the model efficiency index (; Nash and Sutcliffe, 1970). The MEF is a normalized statistic that relates the residual variance between the simulated and remotely sensed tDOC concentrations to the variance within the remotely sensed tDOC data (see Eq. 3). A MEF value near 0 means that the residual variance compares to the remotely sensed variance, i.e., that the model predictions are as accurate as the mean of the satellite data. As the MEF increases towards a value of 1, the residual variance becomes increasingly smaller than the observed variance. For all months, the MEF was positive (0.26–0.60) suggesting that tDOC concentrations simulated by the model were an acceptable predictor relative to tDOC concentrations derived from remote sensing, especially in June–July. In order to give a more even weight to all of the data and to limit the skewness towards the higher tDOC concentrations, metrics based on log-transformed tDOC data were also computed. For all months, the geometric RMSE was close to 1 and ranged between 1.02 and 1.12. It suggested that the model–satellite data dispersion was relatively small when the positive skewness was reduced. In June, the relatively high unbiased RMSE could be partly due to high-tDOC concentrations as suggested by the relatively low geometric RMSE (1.07). Finally, the computed geometric bias informs with respect to the direction of the model–satellite discrepancies. For all months, the geometric bias (1.07–1.32) was higher than 1, meaning that the model tended, on average, to overestimate the observations over the whole domain. The highest geometric bias was reported in August (1.32), when the river discharge was low, suggesting that tDOC removal was likely underestimated in the model in late summer. A Taylor diagram (Taylor, 2001) was produced to provide a synthetic and complementary overview of how the simulated and remotely sensed tDOC concentrations compared seasonally in terms of correlation, amplitude of variations (given by the SDs), and normalized model–satellite discrepancies (Fig. 3). All months differed by their normalized RMSE and amplitude of variations while the correlation coefficient was close to ∼0.8 (see Table 1). The model best simulated tDOC in July, just after the seasonal peak of river discharge, followed by the months of June and August. June and August showed similar values of correlation, RMSE, and normalized SD despite distinct seasonal patterns of river discharge (high and low, respectively). In contrast, September showed the highest model–satellite data dispersion. With respect to satellite estimates, the skill metrics overall suggested that the model could reliably simulate tDOC concentrations in surface waters over a wide range of river discharge and tDOC load.
Figure 3Taylor diagram displaying a statistical comparison between the simulated and remotely sensed tDOC concentrations. The x axis and y axis show the model SD relative to the satellite SD. The open circle on the x axis represents the reference point. The model–satellite correlation is represented in polar coordinates (angle from the x axis). The light grey full lines indicate the RMSE relative to the satellite SD.
Figure 4Monthly flux of surface tDOC (Tg C month−1) computed along transects located west of the Mackenzie Trough (139∘ W, 69.5–71∘ N) (a) and at Cape Bathurst (128∘ W, 69.5–71∘ N) (b). Transects are shown in Fig. 2 in the upper-middle panel. Negative values indicate a westward flux. Percentages refer to the model data relative to the satellite data. The seasonal flux refers to the 4-month net flux.
3.2 tDOC stock and lateral export fluxes
The overall agreement between the model and the satellite tDOC concentrations allowed for the assessment of the mean areal stock and lateral fluxes of tDOC using the mean surface ocean circulation simulated by the MITgcm (Table 2). The monthly averaged (June to September) areal stock of tDOC over the Mackenzie Shelf as delimited by the 300 m isobaths was estimated to be 1.37 Tg C (Table 2). The bias between the model and the satellite data was the highest in August but did not exceed +8.2 % (0.1 Tg C). This result is consistent with the highest geometric bias reported in August (Table 1). In the model, the removal of tDOC through photo-oxidation (Bélanger et al., 2006) was not taken into account. Assuming an annual mean mineralization rate of tDOC of ∼0.02 Tg C (Bélanger et al., 2006), this process would explain <2 % of the reported tDOC difference in August. In addition, the 15 % value used to set the bioavailable tDOC fraction in the model was at the low end of values reported in other studies (up to 50 %; Mann et al., 2012; Wickland et al., 2012; Letscher et al., 2011; Alling et al., 2010; Holmes et al., 2008). This underestimation of the bioavailable fraction of tDOC upon delivery to the AO could be a major reason why the simulated values of tDOC were consistently overestimated when compared to satellite estimates for the outer shelf and offshore locations (Fig. 2, Table 1). In the model, bacterioplankton consumed tDOC to produce ammonium usable in turn by phytoplankton. In the Beaufort Sea, this pathway contributed to primary production by 35 % on average over 2003–2011. However, the simulated rates of bacterioplankton production (<30 ) still remained in the lower range of those measured in the Beaufort Sea (25–68 ; Ortega-Retertua et al., 2012; Vallières et al., 2008). The likely underestimation of the tDOC removal by bacterioplankton in the model during summer months might largely contribute to the reported bias between the model and the satellite data. Nevertheless, the bias remained moderate with respect to values reported for June, July, and September (−1.5 to −2.8 %; Table 2).
Combining the modeling and remote sensing approaches allowed for the reconstruction of the dominant surface pattern in lateral tDOC fluxes in the Canadian Beaufort Sea from June to September (Fig. 4). Two north–south transects were defined: east (Cape Bathurst) and west (Mackenzie Trough) of the Mackenzie Shelf (see upper-middle panel in Fig. 2). The net seasonal flux was westward along the two transects following the anticyclonic circulation pattern of the Beaufort gyre (Mulligan et al., 2010) and was maximum in June and September. The flux was at least 3 times higher along the western transect near the Mackenzie Through than east at Cape Bathurst. This suggests a net export of tDOC towards the Alaskan part of the Beaufort Sea. In contrast, whilst the flux in July and August remained oriented westward near the Mackenzie Trough, it was reversed at Cape Bathurst. In July, the tDOC flux was still 1.3 to 1.7 times higher along the western transect. In August, however, there was more tDOC (∼1.4 fold) exported eastward at Cape Bathurst than exported westward near the Mackenzie Through.
Along the two transects, the simulated fluxes were higher than those derived from remotely sensed tDOC concentrations (Fig. 4). The monthly bias between the model and the satellite flux estimates varied between 0 and +18.2 %. The bias on the seasonal net flux was moderate (+8.3 %) near the Mackenzie Trough but reached +25 % at Cape Bathurst. The seasonal mean flux however was 1 order of magnitude lower than near the Mackenzie Trough. The flux estimates suggested that, despite discrepancies in tDOC concentrations, the modeling and remote sensing approaches provided robust estimates of the lateral transport of tDOC in surface waters in late spring–summer. Because of sea ice and cloud cover, the satellite retrieval was limited to a temporal window covering a third of a year only, i.e., from June to September. The yearly mean lateral flux of tDOC was computed from the simulated data along the Mackenzie Trough transect and it reached 0.31 Tg C. The flux of tDOC cumulated over June to September along this transect (0.12–0.13 Tg C) represented ∼42 % of this annual flux (0.31 Tg C), which is consistent with the fraction of the annual discharge of freshwater by the Mackenzie that occurs during spring–summer (∼50 %; McClelland et al., 2012). Using stable isotope techniques on pelagic particulate organic matter, Bell et al. (2016) showed that OC originating from the Mackenzie outflow in summer was incorporated within benthopelagic food webs as far as the eastern Alaskan Shelf. In nearshore waters of this part of the Beaufort Sea, the study of Dunton et al. (2006) using stable isotopes also suggested that tDOC from the Mackenzie River could add to the local terrigenous carbon inputs mediated by coastal erosion and smaller rivers to fuel the biological production in summer. Using the model and satellite data, we report that an equivalent of ∼10 % (0.12–0.13 Tg C) of the cumulated flux of tDOC delivered by the Mackenzie River over spring–summer (1.32 Tg C) was exported westward in the Alaskan Beaufort Sea along the Mackenzie Trough transect.
The results of our study suggest that the model is in fair agreement with the surface tDOC fields remotely sensed in spring–summer when most of the riverine flux occurs. The comparison allows for evaluation of the model and justifies its use in resolving the annual cycle of tDOC. Because satellite imagery provides data only during spring–summer, further uncertainties still remain in the model in fall–winter in terms of tDOC concentrations and spatial distribution. In addition, the model involves some limitations mostly due to the biogeochemical processing of tDOC. The tDOC transformation is complex and thus difficult to translate into robust mechanistic equations as it is highly dependent on the availability of in situ data in Arctic waters. For instance, the riverine tDOC compartment is split in the model into a labile and a non-labile fraction (see Le Fouest et al., 2015). This parameterization strongly constrains the removal of tDOC by bacterioplankton and therefore the tDOC concentrations simulated within surface waters. In natural waters, however, tDOC is made of a complex mixture of compounds that differ by their chemical composition and age (Mann et al., 2016) and so along the seasons (Wickland et al., 2012; Mann et al., 2012). The chemical nature of tDOC impacts its bioavailability, which is estimated to average 6 to 46 % of the total tDOC pool with marked disparities amongst the seasons and the rivers (Mann et al., 2012). Nevertheless, the general trend for the six major Arctic rivers (Kolyma, Yukon, Mackenzie, Ob, Yenisei and Lena) is of a more labile tDOC pool in winter than in spring and summer (Wickland et al., 2012). In the Kolyma River, Mann et al. (2012) report a higher labile fraction in spring (∼20 %) than in summer (<10 %) as the exported tDOC is younger during the freshet. Such a pattern is, however, not clearly present in the Mackenzie River (e.g., Wickland et al., 2012). We suggest that a more realistic representation in the model of the nature of the organic matter entering the coastal waters might improve the tDOC concentrations simulated in surface AO waters. It could include, for instance, the riverine flux of both dissolved organic carbon and nitrogen along with an improved C : N stoichiometry for bacterioplankton uptake (see Le Fouest et al., 2015).
In the model, the seasonal forcing of tDOC was based on DOC measurements gathered hundreds of kilometers upstream the rivers' mouths. This precludes any DOC enrichment of the Mackenzie River water as it flows through the delta (see Emmerton et al., 2008) with, as a consequence, a likely underestimation of tDOC concentrations simulated in nearshore waters. Therefore, the quantification of the tDOC flux from the watersheds to the coastal AO poses another key issue to addressing the role of tDOC in the biogeochemistry of shelf waters. Recently, watershed models were developed to assess this tDOC flux (Tank et al., 2016; Kicklighter et al., 2013; Holmes et al., 2012). Such models provide realistic estimates but still require improvements as watersheds properties and mechanistic processes underlying the tDOC mobilization and riverine transport are complex to set up (see Kicklighter et al., 2013). The remote sensing of high-resolution ocean color data is increasingly used to assess tDOC concentrations in large pan-Arctic rivers during the open water season (Herrault et al., 2016; Griffin et al., 2011). Ocean color techniques could then prove useful in the future to improve the tDOC time series set at models boundaries by accounting for instance for year-to-year variations of tDOC concentrations during the freshet period.
In our study, the remotely sensed tDOC concentrations retrieved in shelf waters provide the advantage of already integrating the effect of the watersheds processes such as mobilization, transformation, and transport at the seasonal and synoptic timescales. However, we acknowledge that the temporal coverage of the remote sensing data is restricted to spring and summer. Because of clouds and sea ice, we miss the winter season when tDOC is the most labile (e.g., Wickland et al., 2012) and likely subject to remineralization. In the Mackenzie River, about 25 % of the annual load of labile tDOC occurs during winter (Wickland et al., 2012). Despite this limitation, and in regard to the model–satellite data comparison, the assimilation of remotely sensed tDOC data into Arctic models could still offer an interesting perspective as it might result in more realistic simulated fields of tDOC in spring and summer when the river discharge and tDOC export are highest. Physical and biological data have already been assimilated into Arctic predictive models to make the simulated sea-surface temperature, salinity, sea ice extent and thickness, and chlorophyll more reliable (Simon et al., 2015; Massonnet et al., 2015). We may hence expect the assimilation of remotely sensed tDOC concentrations to mitigate, at least partly, the issues linked to setting up realistic tDOC forcings within predictive models. For instance, the assimilation of remotely sensed tDOC data in open waters might help accounting for the interannual variations of tDOC delivered by rivers, which are not resolved by the coupled model that is constrained by a monthly climatology of tDOC load (see Manizza et al., 2009).
Improving the capability of Arctic models to resolve the fate and pathways of tDOC in the AO will require certain limitations to be unlocked. For this purpose, future model development must rely on the always increasing observational effort realized by the combination of field campaigns and new remote sensing techniques. Observations must be used to improve the riverine forcings in order to better encompass the seasonal to interannual variability of the terrigenous dissolved organic matter exported to the coastal AO. Bacterioplankton dynamics also must be better represented in biogeochemical models. In particular, the processes related to the competition for resources such as dissolved organic carbon and nitrogen of both allochthonous and autochthonous origin are likely to play an important role in mediating bacterioplankton growth and tDOC remineralization in Arctic coastal waters impacted by river plumes. Realistic fields of tDOC simulated by Arctic ocean–biogeochemical coupled models would be helpful for a more accurate assessment of CO2 fluxes at the ocean–atmosphere interface. Arctic models that combine realistic terrestrial fluxes of organic matter along with a robust representation of the pathways and processes responsible for its transformation in the AO would add an interesting perspective for addressing the effect on the Arctic carbon cycle of ongoing and future changes in the land–ocean continuum. The increase in seawater temperature of the AO due to global warming (Timmermans, 2016) might, in the future, enhance the metabolism and respiration rates of marine bacterioplankton (Vaquer-Sunyer et al., 2010; Kritzberg et al., 2010). This enhanced microbial activity could then liberate extra nutrients provided by the remineralization of terrigenous organic matter that will then be available for primary production. This process might not only have an impact on the seasonal cycle of PP in the AO; it may also have implications for the higher levels of the marine food webs of the AO, both benthic and pelagic.
The supplement related to this article is available online at: https://doi.org/10.5194/bg-15-1335-2018-supplement.
Data used in this study are available in the Supplement.
The authors declare that they have no conflict of interest.
This research was funded by the Centre national d'études spatiales (CNES) grant no. 131425-BC T23 to VLF and the Japan Aerospace
Exploration Agency (JAXA) GCOM-C project through grant no. 16RSTK-007867 to Atsushi Matsuoka. We are thankful for the joint contribution of the research
programs of UMI Takuvik (CNRS & Université Laval), ArcticNet (Network Centres of Excellence of Canada), and the Canada
Excellence Research Chair in Remote Sensing of Canada's New Arctic Frontier (MB). We thank Dimitris Menemenlis and the Estimation of
Circulation and Climate of the Ocean (ECCO) group from MIT for providing the physical model we used in this study. We also thank
Cécilia Pignon-Mussaud (LIENSs) for her help in processing Fig. 1.
Edited by: Carol Robinson
Reviewed by: three anonymous referees
Aagaard, K. and Carmack, E. C.: The role of sea ice and other fresh water in the Arctic circulation, J. Geophys. Res.-Oceans, 94, 14485–14498, https://doi.org/10.1029/JC094iC10p14485, 1989.
Abbott, B. W. , Jones, J. B., Schuur, E. A. G., Chapin III, F. S., Bowden, W. B., Bret-Harte, M. S., Epstein, H. E., Flannigan, M. D., Harms, T. K., Hollingsworth, T. N., Mack, M. C., McGuire, A. D., Natali, S. M., Rocha, A. V., Tank, S. E., Turetsky, M. R., Vonk, J. E., Wickland, K. P., Aiken, G. R., Alexander, H. D., Amon, R. M. W., Benscoter, B. W., Bergeron, Y., Bishop, K., Blarquez, O., Bond-Lamberty, B., Breen, A. L., Buffam, I., Cai, Y., Carcaillet, C., Carey, S. K., Chen, J. M., Chen, H. Y. H., Christensen, T. R., Cooper, L. W., Cornelissen, J. H. C., de Groot, W. J., DeLuca, T. H., Dorrepaal, E., Fetcher, N., Finlay, J. C., Forbes, B. C., French, N. H. F., Gauthier, S., Girardin, M. P., Goetz, S. J., Goldammer, J. G., Gough, L., Grogan, P., Guo, L., Higuera, P. E., Hinzman, L., Hu, F. S., Hugelius, G., Jafarov, E. E., Jandt, R., Johnstone, J. F., Karlsson, J., Kasischke, E. S., Kattner, G., Kelly, R., Keuper, F., Kling, G. W., Kortelainen, P., Kouki, J., Kuhry, P., Laudon, H., Laurion, I., Macdonald, R. W., Mann, P. J., Martikainen, P. J., McClelland, J. W., Molau, U., Oberbauer, S. F., Olefeldt, D., Paré, D., Parisien, M. A., Payette, S., Peng, C., Pokrovsky, O. S., Rastetter, E. B., Raymond, P. A., Raynolds, M. K., Rein, G., Reynolds, J. F., Robards, M., Rogers, B. M., Schädel, C., Schaefer, K., Schmidt, I. K., Shvidenko, A., Sky, J., Spencer, R. G. M., Starr, G., Striegl, R. G., Teisserenc, R., Tranvik, L. J., Virtanen, T., Welker, J. M., and Zimov, S.: Biomass offsets little or none of permafrost carbon release from soils, streams, and wildfire: an expert assessment, Environ. Res. Lett., 11, 034014, https://doi.org/10.1088/1748-9326/11/3/034014, 2016.
Alling, V., Sanchez-Garcia, L., Porcelli, D., Pugach, S., Vonk, J. E., van Dongen, B., Mörth, C.-M., Anderson, L. G., Sokolov, A., Andersson, P., Humborg, C., Semiletov, I., and Gustafsson, Ö.: Nonconservative behavior of dissolved organic carbon across the Laptev and East Siberian seas, Global Biogeochem. Cy., 24, GB4033, https://doi.org/10.1029/2010GB003834, 2010.
Bélanger, S., Xie, H., Krotkov, N., Larouche, P., Vincent, W. F., and Babin, M.: Photomineralization of terrigenous dissolved organic matter in Arctic coastal waters from 1979 to 2003: interannual variability and implications of climate change, Global Biogeochem. Cy., 20, GB4005, https://doi.org/10.1029/2006GB002708, 2006.
Bélanger, S., Babin, M., and Tremblay, J.-É.: Increasing cloudiness in Arctic damps the increase in phytoplankton primary production due to sea ice receding, Biogeosciences, 10, 4087–4101, https://doi.org/10.5194/bg-10-4087-2013, 2013.
Bell, L. E., Bluhm, B. A., and Iken, K.: Influence of terrestrial organic matter in marine food webs of the Beaufort Sea shelf and slope, Mar. Ecol.-Prog. Ser., 550, 1–24, https://doi.org/10.3354/meps11725, 2016.
Bring, A., Fedorova, I., Dibike, Y., Hinzman, L., Mård, J., Mernild, S. H., Prowse, T., Semenova, O., Stuefer, S. L., and Woo, M.-K.: Arctic terrestrial hydrology: a synthesis of processes, regional effects, and research challenges, J. Geophys. Res.-Biogeo., 121, 621–649, https://doi.org/10.1002/2015JG003131, 2016.
Condron, A., Winsor, P., Hill, C. N., and Menemenlis, D.: Response of Arctic freshwater budget to extreme NAO forcing, J. Climate, 22, 2422–2437, 2009.
Davies, K. F.: Mackenzie River input to the Beaufort Sea, Beaufort Sea Project, Technical Report 15, Institute of Ocean Sciences, Sidney, British, Columbia, p. 72, 1975.
Dittmar, T. and Kattner, G.: The biogeochemistry of the river and shelf ecosystem of the Arctic Ocean: a review, Mar. Chem., 83, 103–120, https://doi.org/10.1016/S0304-4203(03)00105-1, 2003.
Doney, S. C., Lima, I., Moore, J. K., and Takahashi, T.: Skill metrics for confronting global upper ocean ecosytem-biogeochemistry models against field and remote sensing data, J. Mar. Syst., 76, 95–112, https://doi.org/10.1016/j.jmarsys.2008.05.015, 2009.
Doxaran, D., Devred, E., and Babin, M.: A 50 % increase in the mass of terrestrial particles delivered by the Mackenzie River into the Beaufort Sea (Canadian Arctic Ocean) over the last 10 years, Biogeosciences, 12, 3551–3565, https://doi.org/10.5194/bg-12-3551-2015, 2015.
Dunton, K. H., Weingartner, T., and Carmack, E. C.: The nearshore western Beaufort Sea ecosystem: circulation and importance of terrestrial carbon in arctic coastal food webs, Prog. Oceanogr., 71, 362–378, https://doi.org/10.1016/j.pocean.2006.09.011, 2006.
Emmerton, C. A., Lesack, L. F. W., and Vincent, W. F.: Nutrient and organic matter patterns across the Mackenzie River, estuary and shelf during the seasonal recession of sea-ice, J. Mar. Syst., 74, 741–755, https://doi.org/10.1016/j.jmarsys.2007.10.001, 2008.
Griffin, C. G., Frey, K. E., Rogan, J., and Holmes, R. M.: Spatial and interannual variability of dissolved organic matter in the Kolyma River, East Siberia, observed using satellite imagery, J. Geophys. Res., 116, G03018, https://doi.org/10.1029/2010JG001634, 2011.
Haine, T. W. N., Curry, B., Gerdes, R., Hansen, E., Karcher, M., Lee, C., Rudels, B., Spreen, G., de Steur, L., Stewart, K. D., and Woodgate, R.: Arctic freshwater export: status, mechanisms, and prospects, Global Planet. Change, 125, 13–35, https://doi.org/10.1016/j.gloplacha.2014.11.013, 2015.
Herrault, P.-A., Gandois, L., Gascoin, S., Tananaev, N., Le Dantec, T., and Teisserenc, R.: Using high spatio-temporal optical remote sensing to monitor dissolved organic carbon in the Arctic river Yenisei, Remote Sens., 8, 803, https://doi.org/10.3390/rs8100803, 2016.
Holmes, R. M., McClelland, J. W., Raymond, P. A., Frazer, B. B., Peterson, B. J., and Stieglitz, M.: Lability of DOC transported by Alaskan rivers to the Arctic Ocean, Geophys. Res. Lett., 35, L03402, https://doi.org/10.1029/2007GL032837, 2008.
Holmes, R. M., McClelland, J. W., Peterson, B. J., Tank, S. E., Bulygina, E., Eglinton, T. I., Gordeev, V. V., Gurtovaya, T. Y., Raymond, P. A., Repeta, D. J., Staples, R., Striegl, R. G., Zhulidov, A. V., and Zimov, S. A.: Seasonal and annual fluxes of nutrients and organic matter from large rivers to the Arctic Ocean and surrounding seas, Estuar. Coast., 35, 369–382, https://doi.org/10.1007/s12237-011-9386-6, 2012.
Holmes, R. M., Shiklomanov, A. I., Tank, S. E., McClelland, J. W., and Tretiakov, M.: River discharge, Arctic Report Card: Update for 2015, available at: http://www.arctic.noaa.gov/Report-Card/Report-Card-2015/ArtMID/5037/ArticleID/227/River-Discharge (last access: 27 February 2018), 2015.
Kicklighter, D. W., Hayes, D. J., MacClelland, J. W., Peterson, B. J., McGuire, A. D., and Melillo, J. M.: Insights and issues with simulating terrestrial DOC loading of Arctic river networks, Ecol. Appl., 23, 1817–1836, https://doi.org/10.1890/11-1050.1, 2013.
Kritzberg, E., Duarte, C. M., and Wassmann, P.: Changes in Arctic marine bacterial carbon metabolism in response to increasing temperature, Polar Biol., 33, 1673–1682, https://doi.org/10.1007/s00300-010-0799-7, 2010.
Lammers, R. B., Shiklomanov, A. I., Vörösmarty, C. J., Fekete, B. M., and Peterson, B. J.: Assessment of contemporary Arctic river runoff based on observational discharge records, J. Geophys. Res.-Atmos., 106, 3321–3334, https://doi.org/10.1029/2000JD900444, 2001.
Lee, Y. J., Matrai, P. A., Friedrichs, M. A. M., Saba, V. S., Aumont, O., Babin, M., Buitenhuis, E. T., Chevallier, M., de Mora, L., Dessert, M., Dunne, J. P., Ellingsen, I., Feldman, D., Frouin, R., Gehlen, M., Gorgues, T., Ilyina, T., Jin, M., John, J. G., Lawrence, J., Manizza, M., Menkes, C. E., Perruche, C., Le Fouest, V., Popova, E., Romanou, A., Samuelsen, A., Schwinger, J., Séférian, R., Stock, C. A., Tjiputra, J., Tremblay, B. L., Ueyoshi, K., Vichi, M., Yool, A., and Zhang, J.: Net primary productivity estimates and environmental variables in the Arctic Ocean: an assessment of coupled physical-biogeochemical models, J. Geophys. Res.-Oceans, 121, 8635–8669, https://doi.org/10.1002/2016JC011993, 2016.
Le Fouest, V., Babin, M., and Tremblay, J.-É.: The fate of riverine nutrients on Arctic shelves, Biogeosciences, 10, 3661–3677, https://doi.org/10.5194/bg-10-3661-2013, 2013.
Le Fouest, V., Manizza, M., Tremblay, B., and Babin, M.: Modelling the impact of riverine DON removal by marine bacterioplankton on primary production in the Arctic Ocean, Biogeosciences, 12, 3385–3402, https://doi.org/10.5194/bg-12-3385-2015, 2015.
Letscher, R. T., Hansell, D. A., and Kadko, D.: Rapid removal of terrigenous dissolved organic carbon over the Eurasian shelves of the Arctic Ocean, Mar. Chem., 123, 78–87, https://doi.org/10.1016/j.marchem.2010.10.002, 2011.
Losch, M., Menemenlis, D., Campin, J.-M., Heimbach, P., and Hill, C.: On the formulation of sea-ice models. Part 1: Effects of different solver implementations and parameterizations, Ocean Model., 33, 129–144, https://doi.org/10.1016/j.ocemod.2009.12.008, 2010.
Macdonald, R. W., Paton, D. W., Carmack, E. C., and Omstedt, A.: The freshwater budget and under-ice spreading of Mackenzie River water in the Canadian Beaufort Sea based on salinity and 18O/16O measurements in water and ice, J. Geophys. Res., 100, 895–919, 1995.
Manizza, M., Follows, M. J., Dutkiewicz, S., McClelland, J. W., Menemenlis, D., Hill, C. N., Townsend-Small, A., and Peterson, B. J.: Modeling transport and fate of riverine dissolved organic carbon in the Arctic Ocean, Global Biogeochem. Cy., 23, GB4006, https://doi.org/10.1029/2008GB003396, 2009.
Manizza, M., Follows, M., Dutkiewicz, S., Menemenlis, D., McClelland, J. W., Hill, C. N., Peterson, B. J., and Key, R. M.: A model of the Arctic Ocean carbon cycle, J. Geophys. Res.-Oceans, 116, C12020, https://doi.org/10.1029/2011JC006998, 2011.
Manizza, M., Follows, M. J., Dutkiewicz, S., Menemenlis, D., Hill, C. N., and Key, R. M.: Changes in the Arctic Ocean CO2 sink (1996–2007): a regional model analysis, Global Biogeochem. Cy., 27, 1108–1118, https://doi.org/10.1002/2012GB004491, 2013.
Mann, P. J., Davydova, A., Zimov, N., Spencer, R. G. M., Davydov, S., Bulygina, E., Zimov, S., and Holmes, R. M.: DOM composition and lability during the Arctic spring freshet on the River Kolyma, Northeast Siberia, J. Geophys. Res.-Biogeo., 117, G01028, https://doi.org/10.1029/2011JG001798, 2012.
Mann, P. J., Spencer, R. G. M., Hernes, P. J., Six, J., Aiken, G. R., Tank, S. E., McClelland, J. W., Butler, K. D., Dyda, R. Y., and Holmes, R. M.: Pan-arctic trends in terrestrial dissolved organic matter from optical measurements, Front. Earth Sci., 4, 25, https://doi.org/10.3389/feart.2016.00025, 2016.
Massonnet, F., Fichefet, T., and Goosse, H.: Prospects for improved seasonal Arctic sea ice predictions from multivariate data assimilation, Ocean Model., 88, 16–25, https://doi.org/10.1016/j.ocemod.2014.12.013, 2015.
Matsuoka, A., Hill, V., Huot, Y., Babin, M., and Bricaud, A.: Seasonal variability in the light absorption properties of Western Arctic waters: parameterization of the individual components of absorption for ocean color applications, J. Geophys. Res.-Oceans, 116, C02007, https://doi.org/10.1029/2009JC005594, 2011.
Matsuoka, A., Bricaud, A., Benner, R., Para, J., Sempéré, R., Prieur, L., Bélanger, S., and Babin, M.: Tracing the transport of colored dissolved organic matter in water masses of the Southern Beaufort Sea: relationship with hydrographic characteristics, Biogeosciences, 9, 925–940, https://doi.org/10.5194/bg-9-925-2012, 2012.
Matsuoka, A., Hooker, S. B., Bricaud, A., Gentili, B., and Babin, M.: Estimating absorption coefficients of colored dissolved organic matter (CDOM) using a semi-analytical algorithm for southern Beaufort Sea waters: application to deriving concentrations of dissolved organic carbon from space, Biogeosciences, 10, 917–927, https://doi.org/10.5194/bg-10-917-2013, 2013.
Matsuoka, A., Babin, M., and Devred, E. C.: A new algorithm for discriminating water sources from space: a case study for the southern Beaufort Sea using MODIS ocean color and SMOS salinity data, Remote Sens. Environ., 184, 124–138, https://doi.org/10.1016/j.rse.2016.05.006, 2016.
Matsuoka, A., Boss, E., Babin, M., Karp-Boss, L., Hafez, M., Chekalyuk, A., Proctor, C. W., Werdell, P. J., and Bricaud, A.: Pan-Arctic optical characteristics of colored dissolved organic matter: tracing dissolved organic carbon in changing Arctic waters using satellite ocean color data, Remote Sens. Environ., 200, 89–101, https://doi.org/10.1016/j.rse.2017.08.009, 2017.
McClelland, J. W., Holmes, R. M., Dunton, K. H., and Macdonald, R. W.: The Arctic Ocean estuary, Estuar. Coast., 35, 353–368, https://doi.org/10.1007/s12237-010-9357-3, 2012.
McGuire, A. D., Anderson, L. G., Christensen, T. R., Dallimore, S., Guo, L., Hayes, D. J., Heimann, M., Lorenson, T. D., Macdonald, R. W., and Roulet, N.: Sensitivity of the carbon cycle in the Arctic to climate change, Ecol. Monogr., 79, 523–555, https://doi.org/10.1890/08-2025.1, 2009.
Menemenlis, D., Hill, C., Adcroft, A., Campin, J.-M., Cheng, B., Ciotti, B., Fukumori, I., Heimbach, P., Henze, C., Kohl, A., Lee, T., Stammer, D., Taft, J., and Zhang, J.: NASA supercomputer improves prospects for ocean climate research, Eos Trans. AGU, 86, 89–96, 2005.
Mulligan, R. P., Perrie, W., and Solomon, S.: Dynamics of the Mackenzie River plume on the inner Beaufort shelf during an open water period in summer, Estuar. Coast Shelf S., 89, 214–220, https://doi.org/10.1016/j.ecss.2010.06.010, 2010.
Nash, J. and Sutcliffe, J.: River flow forecasting through conceptual models, part 1 – a discussion of principles, J. Hydrol., 10, 282–290, 1970.
Nguyen, A. T., Menemenlis, D., and Kwok, R.: Improved modeling of the Arctic halocline with a subgrid-scale brine rejection parameterization, J. Geophys. Res.-Oceans, 114, C11014, https://doi.org/10.1029/2008JC005121, 2009.
Nguyen, A. T., Menemenlis, D., and Kwok, R.: Arctic ice–ocean simulation with optimized model parameters: approach and assessment, J. Geophys. Res.-Oceans, 116, C04025, https://doi.org/10.1029/2010JC006573, 2011.
Onogi, K., Tsutsui, J., Koide, H., Sakamoto, M., Kobayashi, S., Hatsushika, H., Matsumoto, T., Yamazaki, N., Kamahori, H., Takahashi, K., Kadokura, S., Wada, K., Kato, K., Oyama, R., Ose, T., Mannoji, N., and Taira, R.: The JRA-25 Reanalysis, J. Meteorol. Soc. Jpn., 85, 369–432, https://doi.org/10.2151/jmsj.85.369, 2007.
Opsahl, S., Benner, R., and Amon, R. M.: Major flux of terrigenous dissolved organic matter through the Arctic Ocean, Limnol. Oceanogr., 44, 2017–2023, https://doi.org/10.4319/lo.1999.44.8.2017, 1999.
Ortega-Retuerta, E., Jeffrey, W. H., Babin, M., Bélanger, S., Benner, R., Marie, D., Matsuoka, A., Raimbault, P., and Joux, F.: Carbon fluxes in the Canadian Arctic: patterns and drivers of bacterial abundance, production and respiration on the Beaufort Sea margin, Biogeosciences, 9, 3679–3692, https://doi.org/10.5194/bg-9-3679-2012, 2012.
Osburn, C. L., Retamal, L., and Vincent, W. F.: Photoreactivity of chromophoric dissolved organic matter transported by the Mackenzie River to the Beaufort Sea, Mar. Chem., 115, 10–20, https://doi.org/10.1016/j.marchem.2009.05.003, 2009.
Para, J., Charrière, B., Matsuoka, A., Miller, W. L., Rontani, J. F., and Sempéré, R.: UV/PAR radiation and DOM properties in surface coastal waters of the Canadian shelf of the Beaufort Sea during summer 2009, Biogeosciences, 10, 2761–2774, https://doi.org/10.5194/bg-10-2761-2013, 2013.
Ping, C.-L., Michaelson, G. J., Guo, L., Torre Jorgenson, M., Kanevskiy, M., Shur, Y., Dou, F., and Liang, J.: Soil carbon and material fluxes across the eroding Alaska Beaufort Sea coastline, J. Geophys. Res.-Biogeo., 116, G02004, https://doi.org/10.1029/2010JG001588, 2011.
Rachold, V., Eiken, H., Gordeev, V. V., Grigoriev, M. N., Hubberten, H.-W., Lisitzin, A. P., Shevchenko, V. P., and Schirmeister, L.: Modern terrigenous organic carbon input to the Arctic Ocean, in: The Organic Carbon Cycle in the Arctic Ocean, edited by: Stein, R. S. and Macdonald, R. W., Springer, New York, 33–55, 2004.
Raymond, P. A., McClelland, J. W., Holmes, R. M., Zhulidov, A. V., Mull, K., Peterson, B. J., Striegl, R. G., Aiken, G. R., and Gurtovaya, T. Y.: Flux and age of dissolved organic carbon exported to the Arctic Ocean: a carbon isotopic study of the five largest arctic rivers, Global Biogeochem. Cy., 21, GB4011, https://doi.org/10.1029/2007GB002934, 2007.
Romanovsky, V. E., Drozdov, D. S., Oberman, N. G., Malkova, G. V., Kholodov, A. L., Marchenko, S. S., Moskalenko, N. G., Sergeev, D. O., Ukraintseva, N. G., Abramov, A. A., Gilichinsky, D. A., and Vasiliev, A. A.: Thermal state of permafrost in Russia, Permafrost Periglac., 21, 136–155, https://doi.org/10.1002/ppp.683, 2010.
Semiletov, I., Pipko, I., Gustafsson, Ö., Anderson, L. G., Sergienko, V., Pugach, S., Dudarev, O., Charkin, A., Gukov, A., Bröder, L., Andersson, A., Spivak, E., and Shakhova, N.: Acidification of East Siberian Arctic Shelf waters through addition of freshwater and terrestrial carbon, Nat. Geosci., 9, 361–365, https://doi.org/10.1038/ngeo2695, 2016.
Shiklomanov, I., Shiklomanov, A., Lammers, R., Peterson, B., and Vorosmarty, C.: The dynamics of river water inflow to the Arctic Ocean, in: The Freshwater Budget of the Arctic Ocean, edited by: Lewis, E., Kluwer Academics, Boston, MA, 281–296, 2000.
Simon, E., Samuelsen, A., Bertino, L., and Mouysset, S.: Experiences in multiyear combined state-parameter estimation with an ecosystem model of the North Atlantic and Arctic Oceans using the Ensemble Kalman Filter, J. Mar. Syst., 152, 1–17, https://doi.org/10.1016/j.jmarsys.2015.07.004, 2015.
Stein, R. and Macdonald, R. W.: The Organic Carbon Cycle in the Arctic Ocean, Springer, Heidelberg, Germany, 2004.
Stow, A. C., Jolliff, J., McGillicuddy Jr., D. J., Doney, S. C., Allen, J. I., Friedrichs, M. A. M., Rose, K. A., and Wallhead, P.: Skill Assessment for coupled biological/physical models of marine systems, J. Mar. Syst., 76, 4–15, https://doi.org/10.1016/j.jmarsys.2008.03.011, 2009.
Striegl, R. G., Aiken, G. R., Dornblaser, M. M., Raymond, P. A., and Wickland, K. P.: A decrease in discharge-normalized DOC export by the Yukon River during summer through autumn, Geophys. Res. Lett., 32, L21413, https://doi.org/10.1029/2005GL024413, 2005.
Tank, S. E., Manizza, M., Holmes, R. M., McClelland, J. W., and Peterson, B. J.: The processing and impact of dissolved riverine nitrogen in the Arctic Ocean, Estuar. Coast., 35, 401–415, https://doi.org/10.1007/s12237-011-9417-3, 2012.
Tank, S. E., Striegl, R. G., McClelland, J. W., and Kokelj, S. V.: Multi-decadal increases in dissolved organic carbon and alkalinity flux from the Mackenzie drainage basin to the Arctic Ocean, Environ. Res. Lett., 11, 054015, https://doi.org/10.1088/1748-9326/11/5/054015, 2016.
Tanski, G., Couture, N., Lantuit, H., Eulenburg, A., and Fritz, M.: Eroding permafrost coasts release low amount of dissolved organic carbon from ground ice into the nearshore zone of the Arctic Ocean, Global Biogeochem. Cy., 30, 1054–1068, https://doi.org/10.1002/2015GB005337, 2016.
Tarnocai, C., Canadell, J. G., Schuur, E. A. G., Kuhry, P., Mazhitova, G., and Zimov, S.: Soil organic carbon pools in the northern circumpolar permafrost region, Global Biogeochem. Cy., 23, GB2023, https://doi.org/10.1029/2008gb003327, 2009.
Taylor, K. E.: Summarizing multiple aspects of model performance in a single diagram, J. Geophys. Res.-Atmos., 106, 7183–7192, 2001.
Timmermans, M.-L.: Sea Surface Temperature, Arctic Report Card: Update for 2016, available at: http://www.arctic.noaa.gov/Report-Card/Report-Card-2016/ArtMID/5022/ArticleID/285/Sea-Surface-Temperature (last access: 27 February 2018), 2016.
Vallières, C., Retamal, L., Osburn, C., and Vincent, W. F.: Bacterial production and microbial food web structure in a large Arctic river and the coastal Arctic Ocean, J. Mar. Syst., 74, 756–773, https://doi.org/10.1016/j.jmarsys.2007.12.002, 2008.
Vaquer-Sunyer, R., Duarte, C. M., Santiago, E., Wassmann, P., and Reigstad, M.: Experimental evaluation of planktonic respiration response to warming in the European Arctic sector, Polar Biol., 33, 1661–1671, https://doi.org/10.1007/s00300-010-0788-x, 2010.
Vihma, T., Screen, J., Tjernström, M., Newton, B., Zhang, X., Popova, V., Deser, C., Holland, M., and Prowse, T.: The atmospheric role in the Arctic water cycle: a review on processes, past and future changes, and their impacts, J. Geophys. Res.-Biogeo., 121, 586–620, https://doi.org/10.1002/2015JG003132, 2016.
Wang, M. and Shi, W.: The NIR-SWIR combined atmospheric correction approach for MODIS ocean color data processing, Opt. Express, 15, 15722–15722, 2007.
Wickland, K. P., Aiken, G. R., Butler, K., Dornblaser, M. M., Spencer, R. G. M., and Striegl, R. G.: Biodegradability of dissolved organic carbon in the Yukon River and its tributaries: seasonality and importance of inorganic nitrogen, Global Biogeochem. Cy., 26, GB0E03, https://doi.org/10.1029/2012GB004342, 2012.
Yang, D., Shi, X., and Marsh, P.: Variability and extreme of Mackenzie River daily discharge during 1973–2011, Quatern. Int., 380–381, 159–168, https://doi.org/10.1016/j.quaint.2014.09.023, 2015.