the Creative Commons Attribution 4.0 License.
the Creative Commons Attribution 4.0 License.
 | 13 Mar 2018
Increasing coastal slump activity impacts the release of sediment and organic carbon into the Arctic Ocean
Anna M. Irrgang
Anne Morgenstern
Hugues Lantuit
Retrogressive thaw slumps (RTSs) are among the most active thermokarst landforms in the Arctic and deliver a large amount of material to the Arctic Ocean. However, their contribution to the organic carbon (OC) budget is unknown. We provide the first estimate of the contribution of RTSs to the nearshore OC budget of the Yukon Coast, Canada, and describe the evolution of coastal RTSs between 1952 and 2011 in this area. We (1) describe the evolution of RTSs between 1952 and 2011; (2) calculate the volume of eroded material and stocks of OC mobilized through slumping, including soil organic carbon (SOC) and dissolved organic carbon (DOC); and (3) estimate the OC fluxes mobilized through slumping between 1972 and 2011. We identified RTSs using high-resolution satellite imagery from 2011 and geocoded aerial photographs from 1952 and 1972. To estimate the volume of eroded material, we applied spline interpolation on an airborne lidar dataset acquired in July 2013. We inferred the stocks of mobilized SOC and DOC from existing related literature. Our results show a 73 % increase in the number of RTSs and 14 % areal expansion between 1952 and 2011. In the study area, RTSs displaced at least 16.6×10⁶ m3 of material, 53 % of which was ice, and mobilized 145.9×10⁶ kg of OC. Between 1972 and 2011, 49 RTSs displaced 8.6×10³ m3 yr−1 of material, adding 0.6 % to the OC flux released by coastal retreat along the Yukon Coast. Our results show that the contribution of RTSs to the nearshore OC budget is non-negligible and should be included when estimating the quantity of OC released from the Arctic coast to the ocean.
- Article
(6889 KB) - Full-text XML
-
Supplement
(221 KB) - BibTeX
- EndNote


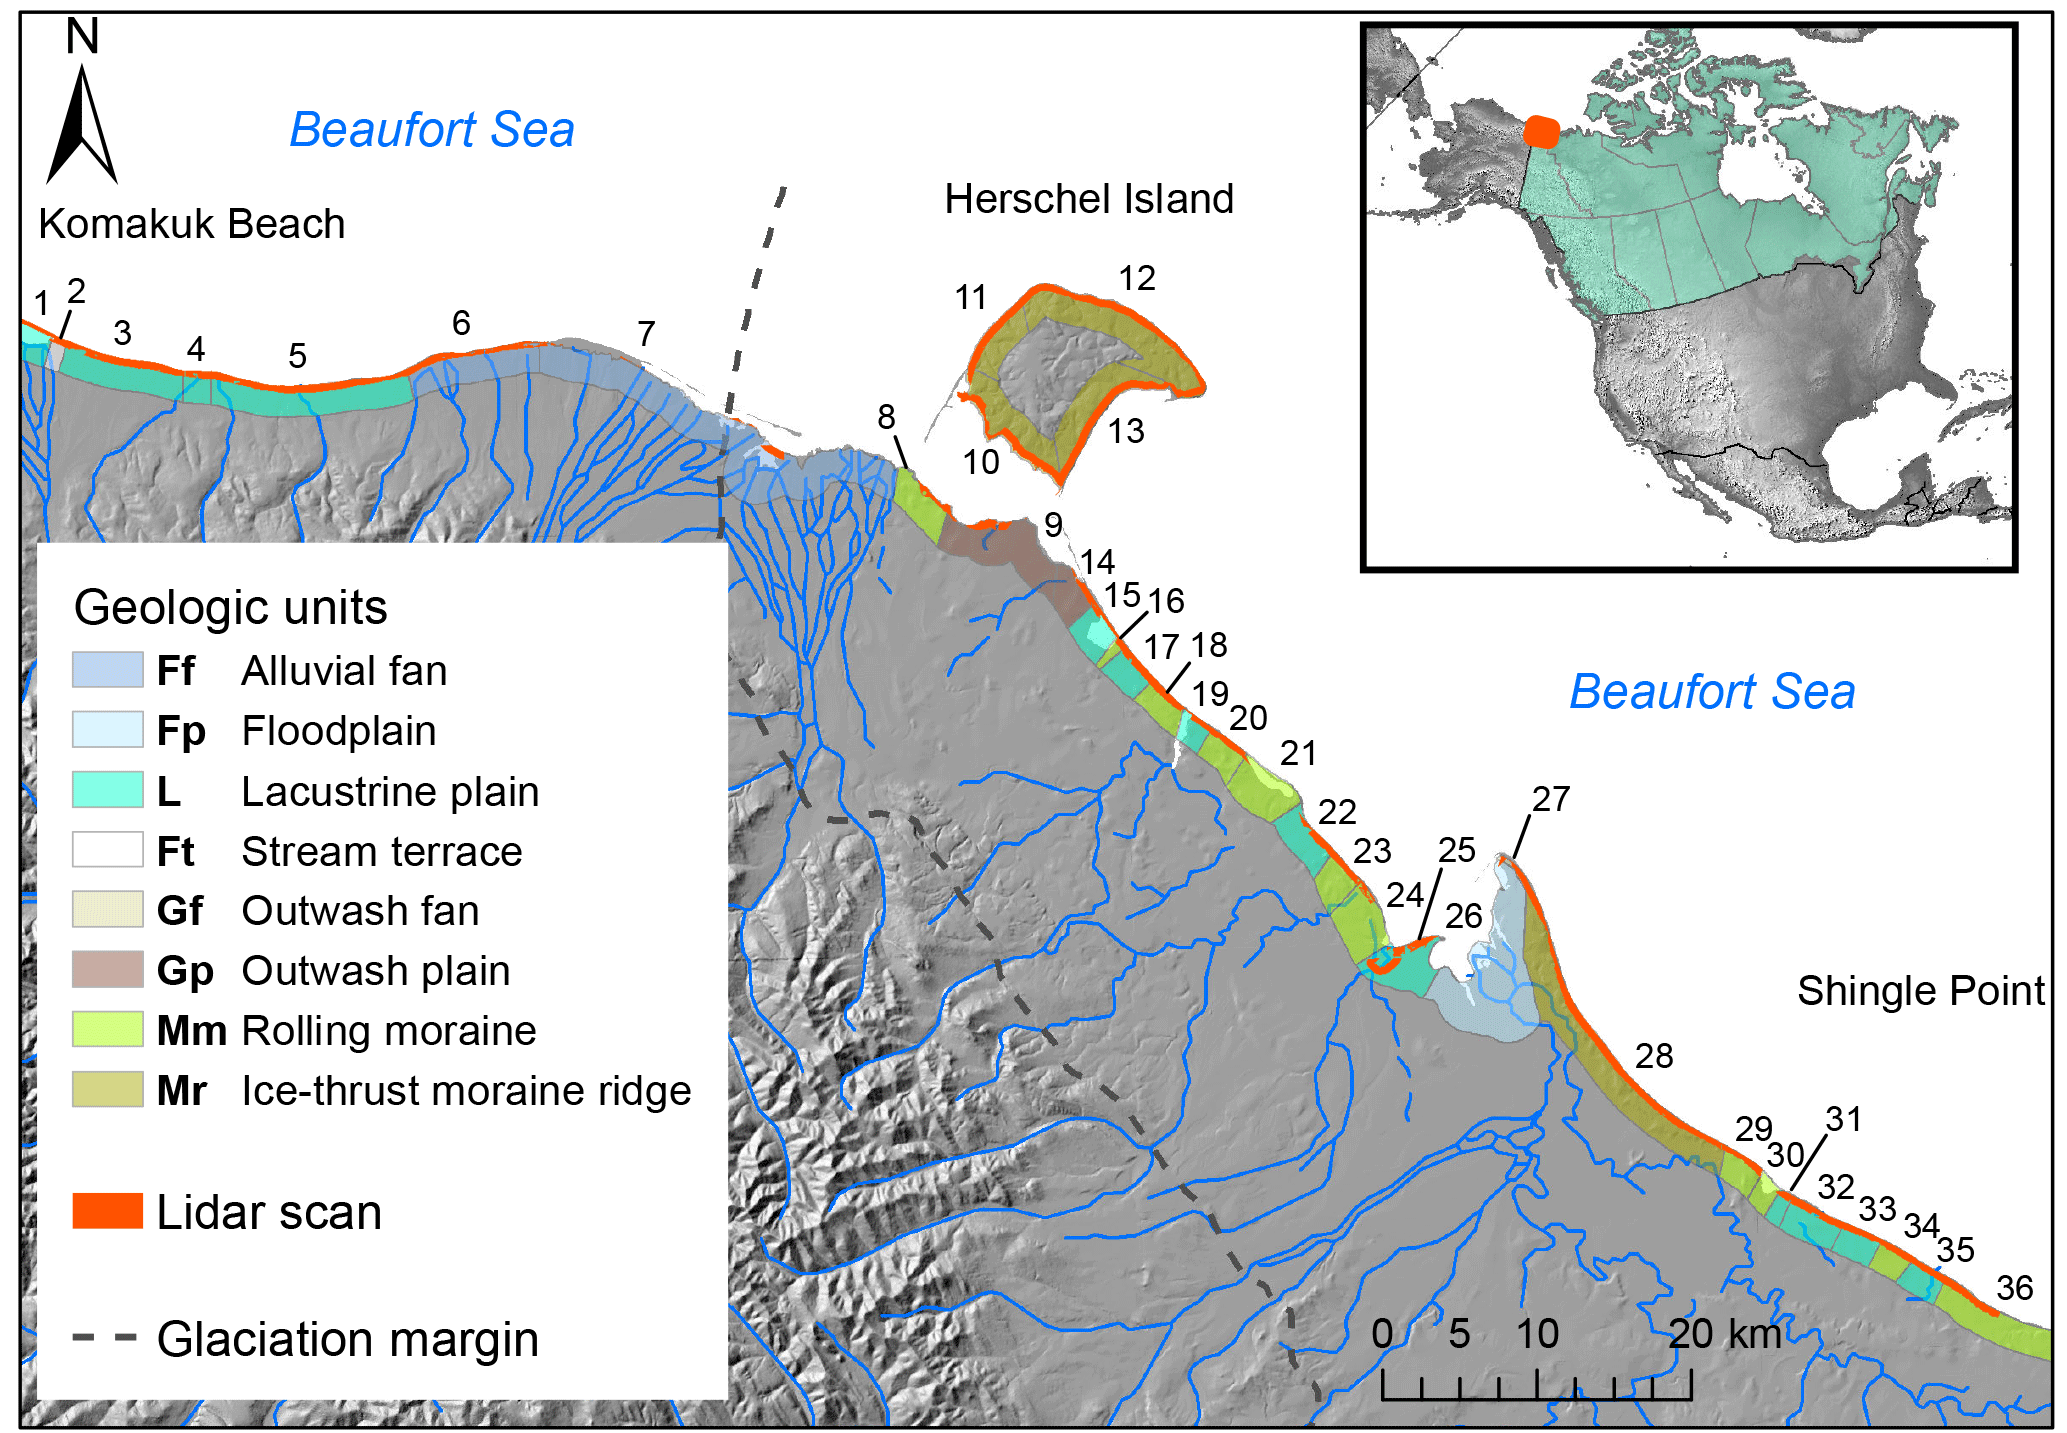
Figure 1Study area. The coastal subset defined as the lidar scan is represented in red. The limit of the glaciation was reproduced after Dyke and Prest (1987) and the surficial sediments after Rampton (1982). The numbers stand for the coastal segments stretching along the coast from west to east (the names of the coastal segments are available in the Supplement, Table S1).
Soil organic carbon (SOC) stocks in the top 3 m of soils, in deltas and the Yedoma regions across the northern circumpolar permafrost region are estimated to 1307 Pg; 76.4 % (999 Pg) of them are stored in perennially frozen soils (Hugelius et al., 2014). These stocks resulted from the slow decomposition of soil organic matter in permanently frozen soils, caused by low soil temperatures and impeded drainage. Surface air temperature in the Arctic increased by 0.755 ∘C per decade during 1998–2012 (Huang et al., 2017). As the active layer, the upper part of the permafrost that thaws during summer and refreezes in winter, thickens due to warmer air, increased microbial activity in the soil mobilizes more organic carbon (OC) that is eventually released to the atmosphere (Mackelprang et al., 2011; Schuur et al., 2008). Organic carbon and nutrients are also released to streams, rivers, and to the Arctic Ocean by thermokarst and thermo-erosional processes (Schuur et al., 2015; Abbott and Jones, 2015; Kokelj et al., 2013; Vonk et al., 2012; Ping et al., 2011; Lamoureux and Lafrenière, 2009). Permafrost carbon stocks were only recently included in calibrating global carbon models, highlighting a relevant contribution of thawing permafrost to the overall climate and economic response to human greenhouse gas emissions (Kessler, 2017; Koven et al., 2015; MacDougall et al., 2012; Burke et al., 2012; Schneider von Deimling et al., 2012). Schaefer et al. (2014) predicted 120±85 Gt carbon emissions from thawing permafrost by 2100, which represents 5.7±4.0 % of the total anthropogenic emissions. Nevertheless, these carbon models underestimate the potential impact of the permafrost feedback on the global climate because they do not account for the spatial heterogeneity of permafrost terrains and omit the contribution of coastal erosion and abrupt thaw processes, such as thermokarst and thermo-erosion (Hugelius et al., 2014; MacDougall et al., 2012; Vonk et al., 2012). Both expert assessments (Abbott et al., 2016) and model evaluations (McGuire et al., 2016) identified permafrost degradation as one of the most important sources of uncertainty in predicting the timing and magnitude of the permafrost carbon feedback.
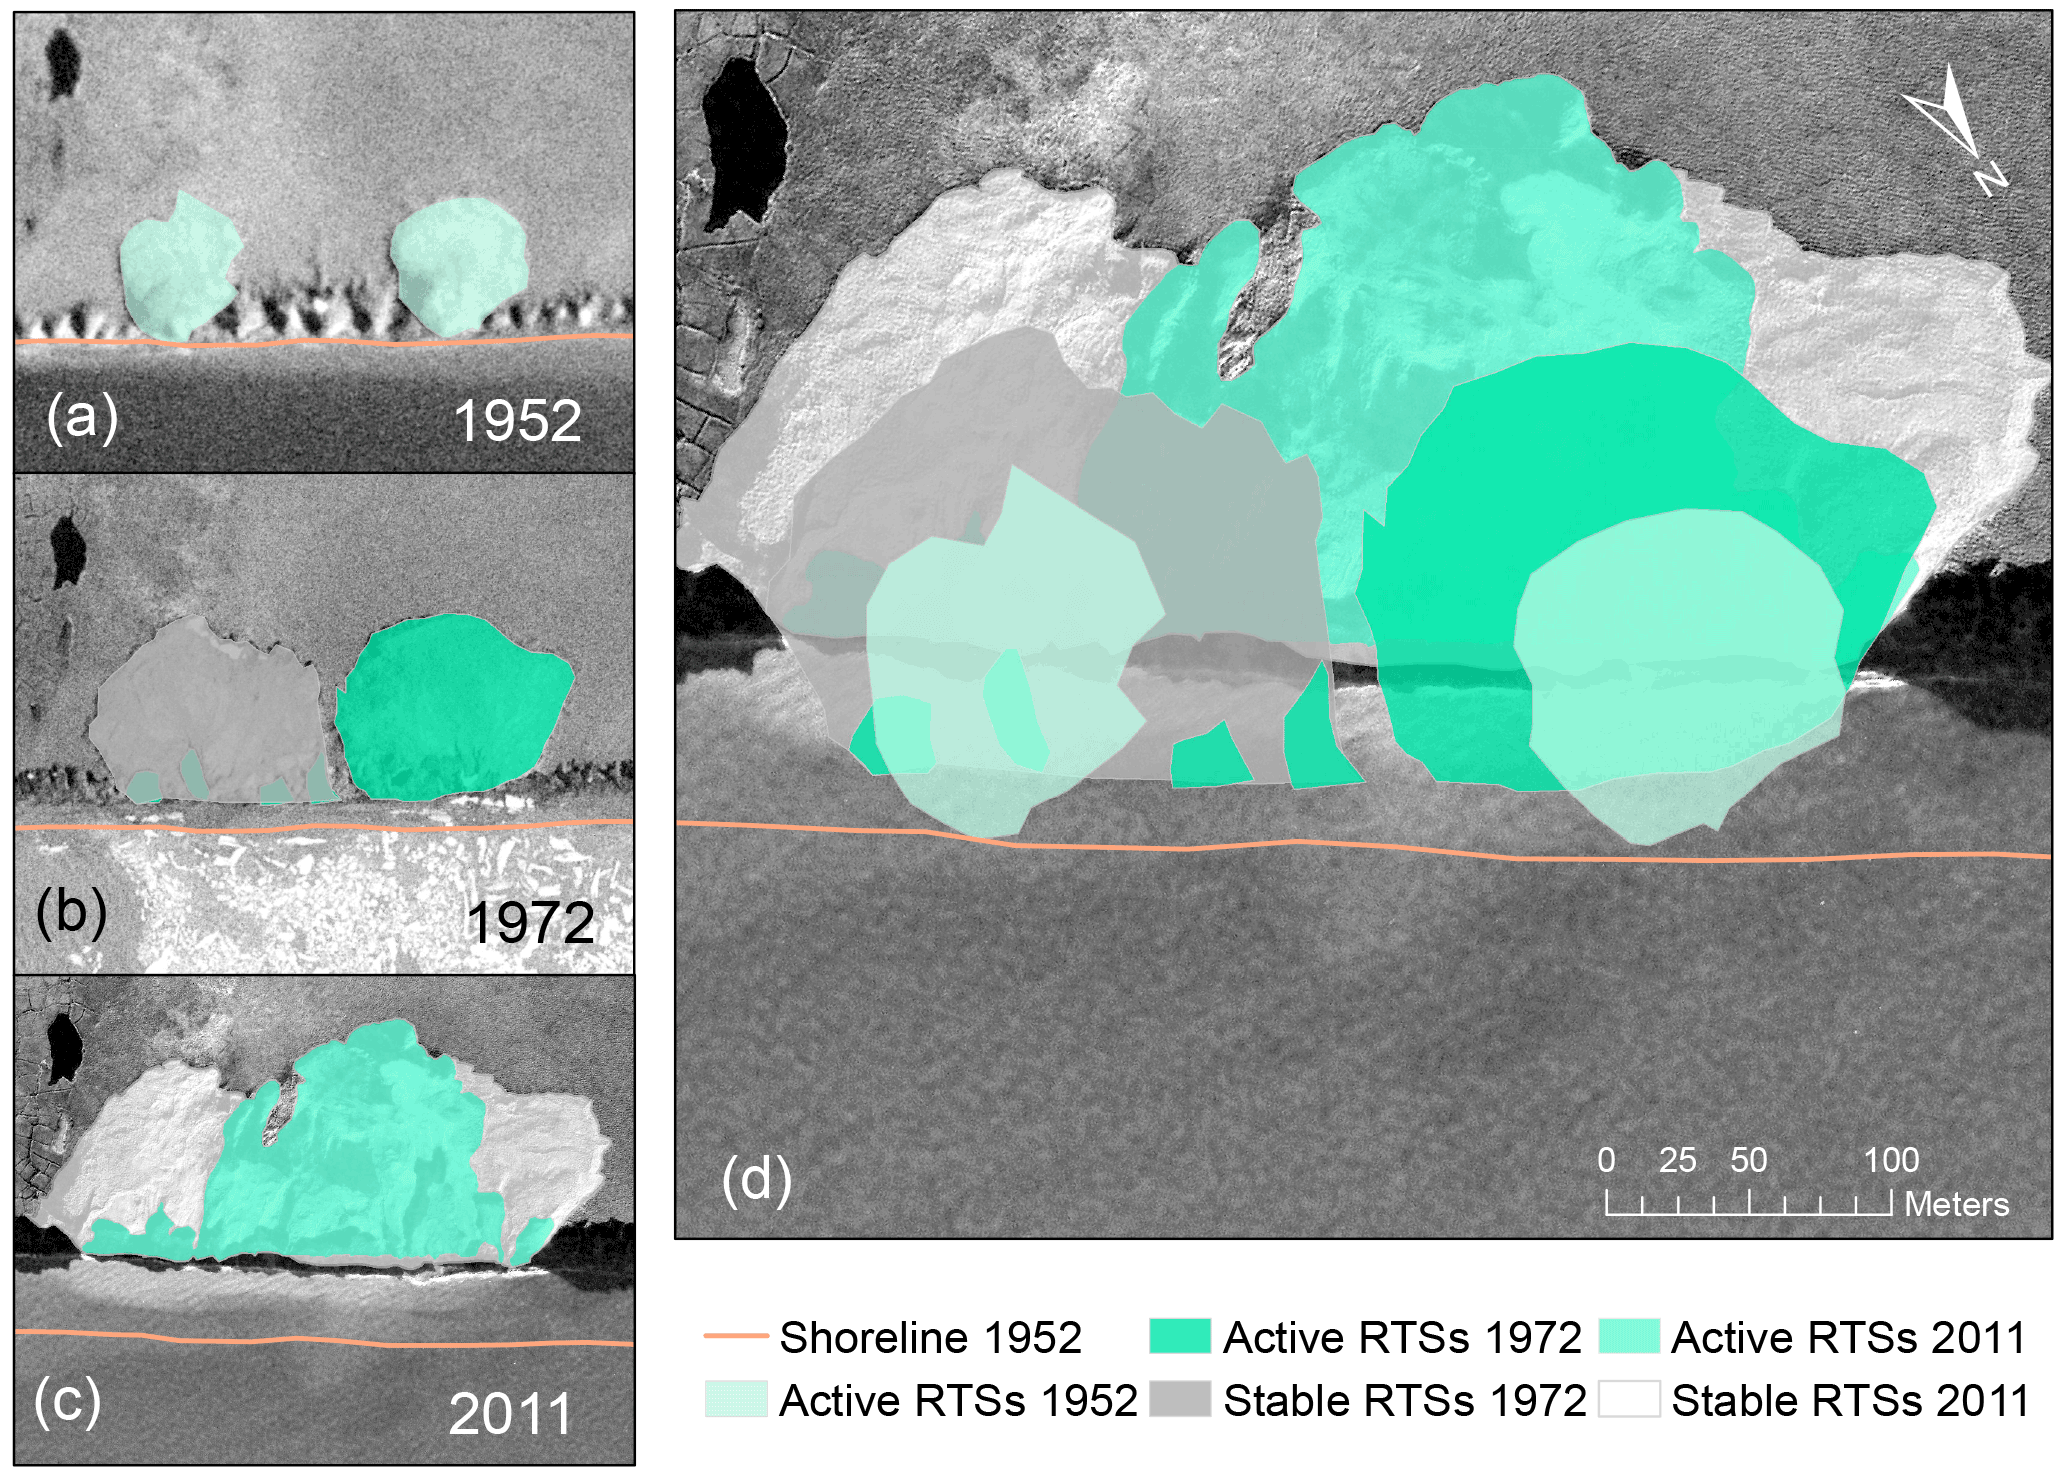
Figure 2Geomorphological map of retrogressive thaw slumps (RTSs) illustrating the complexity of RTS evolution along the Yukon Coast. (d) RTSs identified in 1952 (a) and in 1972 (b) overlap the 2011 RTSs (c). The underlying imagery is a GeoEye-1 satellite image from 2011 (18 July). RTS areas from 1952 and 1972 closer to the shore have eroded due to coastal retreat. The remaining parts have either extended and merged with other RTSs or stabilized in 2011. (a) Two active RTSs in 1952 (aerial photo from 1952, National Air Photo Library, Canada). (b) RTSs in 1972 (aerial photo from 1972, National Air Photo Library, Canada). RTSs expanded and one had stabilized. New active RTSs developed within the stabilized RTS. (c) RTSs in 2011 (GeoEye-1, 18 July 2011). Former RTSs had partly stabilized and newer RTSs developed within the boundaries of the stabilized RTSs.
Thermokarst and thermo-erosional processes occur by the thawing of ice-rich permafrost and the melting of massive ice. Thermokarst landscapes cover up to 20 % of the northern circumpolar permafrost region and store half of the SOC from this region (Olefeldt et al., 2016). Retrogressive thaw slumps (RTSs), a type of slope failure caused by permafrost thaw, are among the most active landforms in the Arctic and have increased both in number and size over the past decades (Ramage et al., 2017; Segal et al., 2016; Brooker et al., 2014; Lacelle et al., 2010). RTSs rework sediments and mobilize carbon, nitrogen, and nutrients; as a result, RTSs affect terrestrial (Cassidy et al., 2016; Tanski et al., 2016; Cray and Pollard, 2015; Cannone et al., 2010) and aquatic ecosystems (Malone et al., 2013; Kokelj et al., 2009a, 2013). Along the coasts of the Arctic, RTSs directly contribute to the transport of terrestrial OC to the nearshore zone (Obu et al., 2016), which has the potential to affect the nearshore marine ecosystem (Fritz et al., 2017). However, there are currently no estimates on the volume of sediments and thus on the OC displaced by RTSs from the land to the nearshore zone in the Arctic. To provide better estimates of the contribution of abrupt thaw processes on the OC budget along Arctic coasts, our study quantifies the impact of RTSs on the OC budget in a coastal permafrost environment along the Yukon Coast, Canada. We (1) describe the evolution of RTSs in the area between 1952 and 2011; (2) calculate the volume of material eroded and stocks of organic carbon (OC) mobilized through slumping – including soil organic carbon (SOC) and dissolved organic carbon (DOC) – and (3) estimate the OC fluxes mobilized through slumping between 1972 and 2011.
The study area is located in the Canadian Arctic, along the westernmost coast of the Yukon Territory (Fig. 1). The study area comprises a 238 km portion of the Yukon Coastal Plain, including Herschel Island (Fig. 1). The area is in the continuous permafrost zone (Rampton, 1982) and tundra vegetation zone dominated by mosses, graminoids, and shrubs (CAVM Team, 2003). The area is characterized by a subarctic climate with a mean summer air temperature of 6 ∘C on the eastern boundary of the study area and 8.7 ∘C on the western boundary; the mean summer precipitation (June, July, and August, 1971–2000) is 79.8 mm at the east end and 112.9 mm at the west end (Environment Canada, 2017). The Mackenzie River, which enters the Beaufort Sea east of the study area, influences seawater temperature and sea ice extent and is the main control on the local precipitation patterns (Burn and Zhang, 2009). The western margin of the Laurentide ice sheet, which reached its maximum ice extent around Herschel Island at ca. 16 200 years BP (Fritz et al., 2012), shaped the topography of the Yukon Coastal Plain. Long and high moraine ridges characterize most of the previously glaciated area. Herschel Island is a moraine thrust at the margin of the formerly glaciated area and is one of the largest moraine deposits in the region (Mackay, 1959). Stream valleys, fluvial deltas, alluvial fans, and thermokarst basins characterize the unglaciated area. Due to widespread moraine deposits, 35 % of the Yukon Coast is composed of ice-rich cliffs (Harper, 1990). Volumetric ground ice contents (massive ice, pore ice, and wedge ice) vary along the coast and range from 0 to 74 % (Couture and Pollard, 2017). Previous studies divided the study area into 36 coastal segments (Fig. 1), based on ground ice contents, surficial geology, and geomorphology (Lantuit et al., 2012b; Couture, 2010; Lantuit and Pollard, 2005). Most segments fall into one of three surficial geologic units: ice-thrust moraines (30 %), lacustrine plains (23 %), and rolling moraines (16 %). Alluvial fans, stream terraces, floodplains, and outwash plains underlay the remaining segments (Rampton, 1982). The coast is rapidly eroding (Harper, 1990): during the period 1952–2011, the average rate of shoreline change was −0.7 m yr−1 and was characterized by decreasing erosion rates from west to east (Irrgang et al., 2018). RTSs are common along the coast and mostly develop on segments with massive ground ice thicker than 1.5 m and coastal slope greater than 3.9∘ (Ramage et al., 2017).
3.1 Evolution of RTSs
We used two data inputs to measure the evolution of RTSs between 1952 and 2011: a dataset with RTSs present in 1972 and 2011 (dataset A) and a dataset with RTSs present in 1952 (dataset B). All RTSs were mapped using ArcMap 10.3 (ESRI) on a scale of 1:2000 and classified as active or stable. Active RTSs are characterized by steep headwalls exposing ice-rich permafrost, slump floors with thawed sediments, and incised gullies. Stable RTSs comprise gently sloping and vegetated headwalls, vegetated slump floors, and no visible active gully systems (Ramage et al., 2017; Lantuit and Pollard, 2008; Wolfe et al., 2001).
Ramage et al. (2016) provided dataset A. RTSs present in 2011 were mapped based on multispectral GeoEye-1 and WorldView-2 satellite images acquired in July, August, and September 2011. RTSs present in 1972 were mapped using a series of geocoded aerial photographs from the 1970s obtained from the National Air Photo Library in Canada (Irrgang et al., 2018). The mapping methodology is explained in detail in Ramage et al. (2017).
Dataset B comprises RTSs present in 1952 that we mapped using a series of geocoded aerial photographs from the 1950s, obtained from the National Air Photo Library in Canada (Irrgang et al., 2018).
We compared the number and size of RTSs present in 1952, in 1972, and in 2011. RTSs are polycyclic and can occur on surfaces previously affected by RTSs. As a result, several active RTSs can be located within the boundary of a stable RTS (Fig. 2). In this case, stable polycyclic RTSs include the areal surfaces of active RTSs located within their boundaries.
3.2 Volume estimations
3.2.1 Lidar dataset
For each RTS identified in 2011 we extracted morphological information – size and mean surface elevation – from an airborne lidar dataset acquired in July 2013 (Kohnert et al., 2014). The lidar dataset has a scan width of 500 m; the lidar point data were interpolated with inverse distance weighting to obtain digital elevation models with a horizontal resolution of 1 m (Obu et al., 2016). The lidar dataset has a final georeferenced point cloud data vertical accuracy of 0.15±0.1 m and covers 80 % of the coastline in our study area.
We selected a subset of the 2011 RTS dataset comprising RTSs that occurred within the boundary of the lidar dataset to measure the volume of eroded material from RTSs (Fig. 1). We discarded the 125 RTSs outside of the lidar scan from the volume and flux analyses.
In addition to the RTSs present in 2011 within the lidar area, we defined a subgroup with RTSs present in 2011 on surfaces not affected by slumping before 1972; we defined this subgroup as RTSs initiated after 1972.
3.2.2 Interpolation method
We applied a regularized spline interpolation technique to model pre-slump topographies used for calculating the volume of material eroded through slumping. The spline method allows us to estimate elevation points outside the range of input sample points and to minimize the total curvature of the surface. We therefore selected spline among other interpolation methods. We based our interpolation on the extensive point elevation data available for the study area from the lidar dataset (Fig. 3).
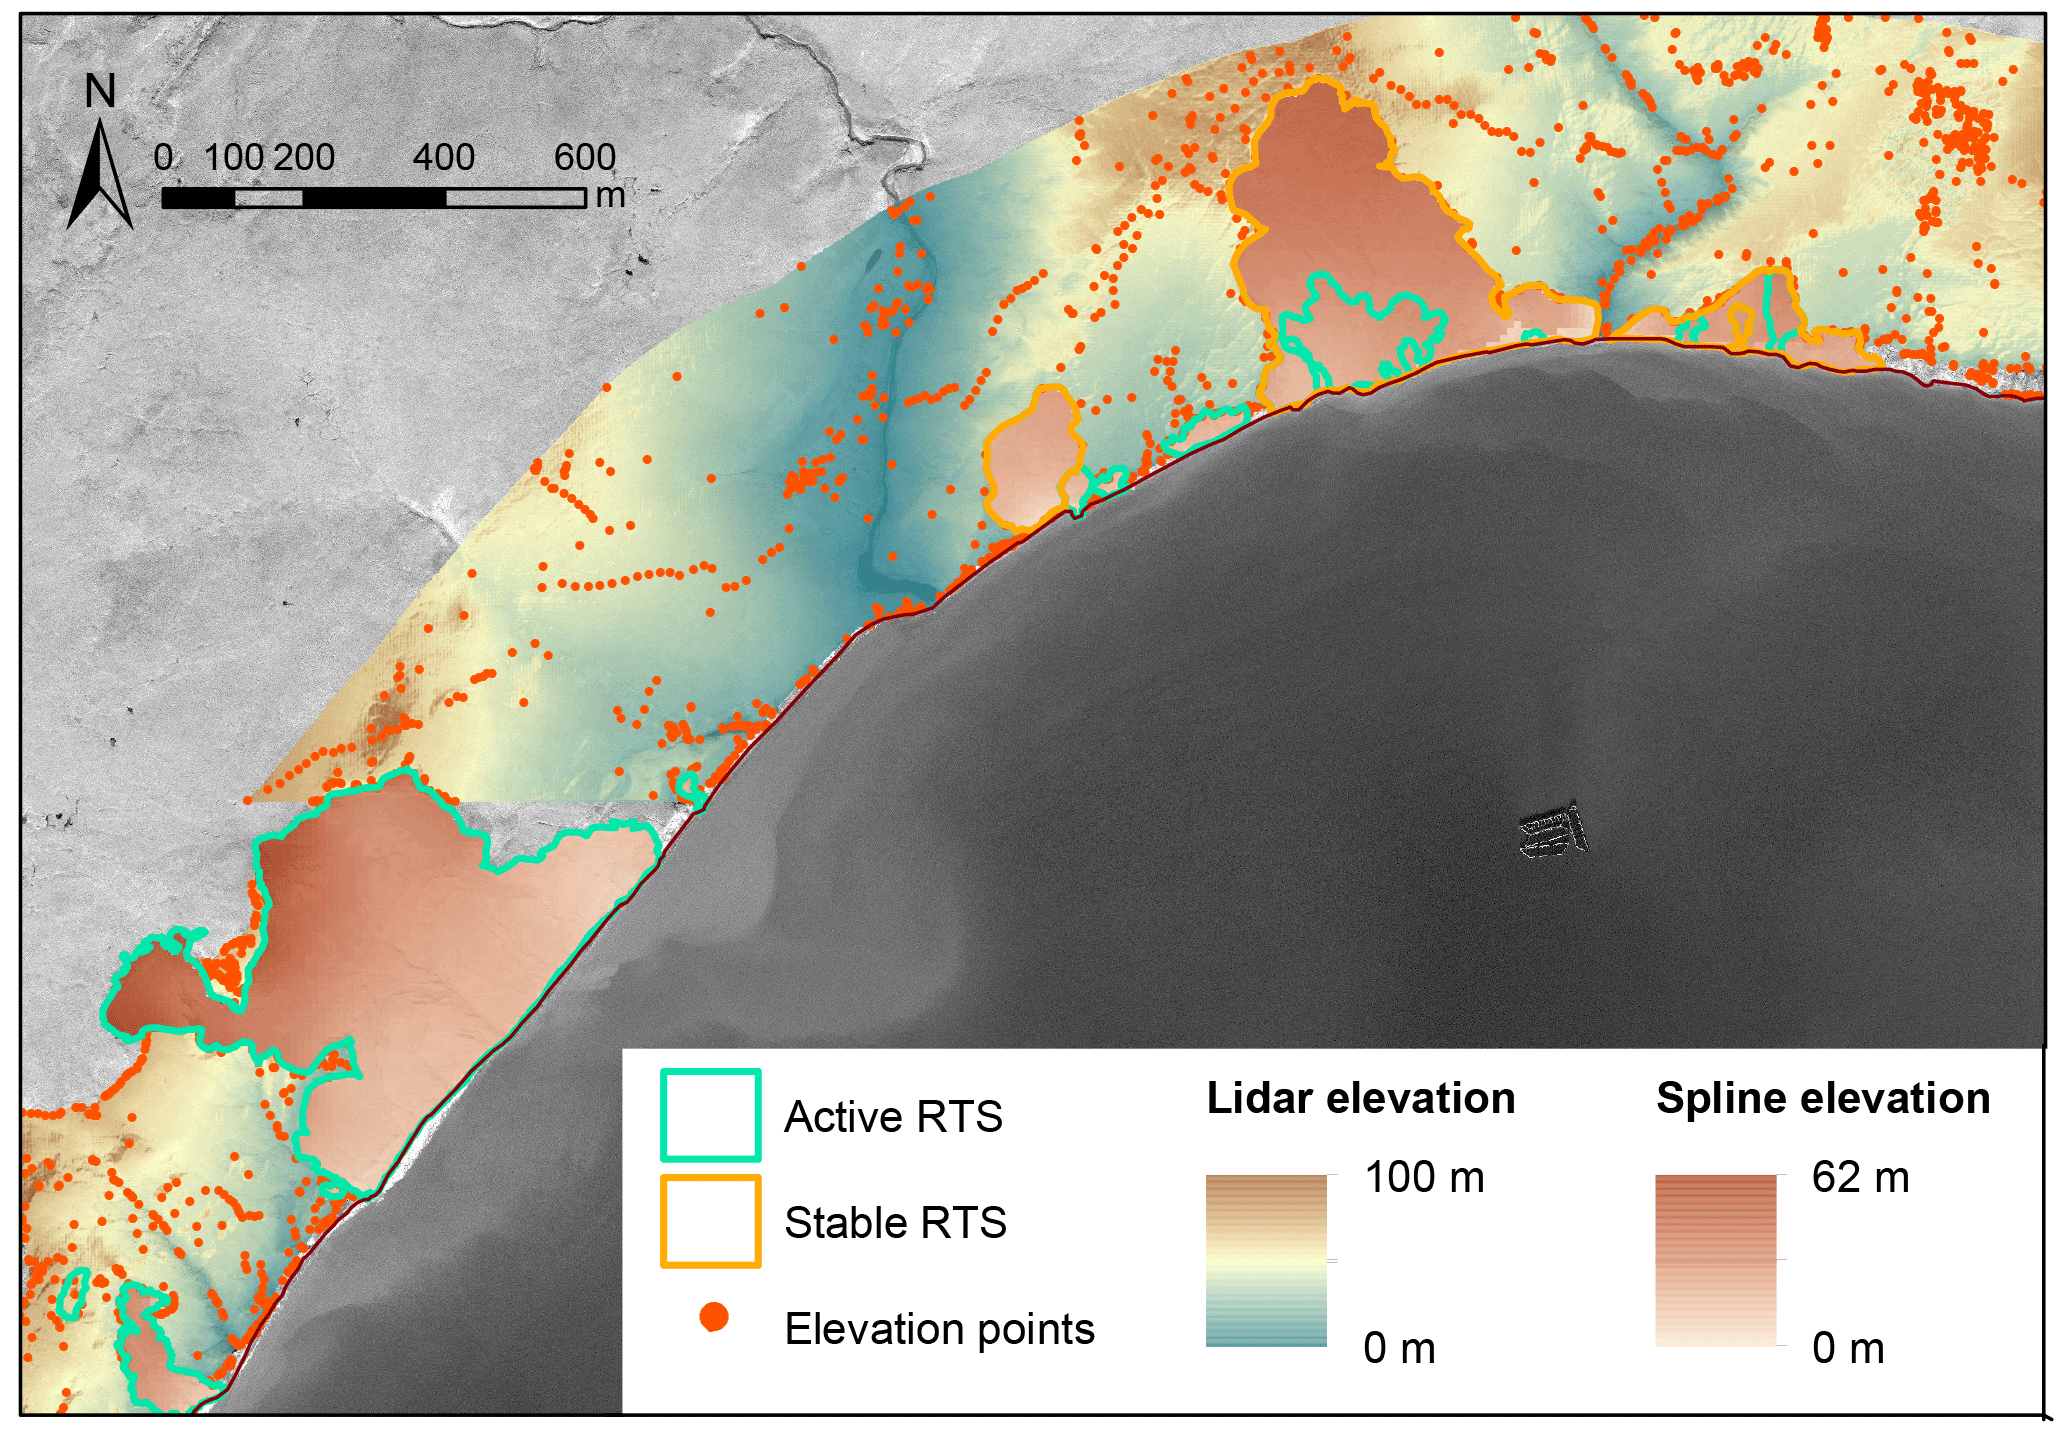
Figure 3Map illustrating the different datasets used to model pre-slump topographies. Retrogressive thaw slumps (RTSs) are outlined in green for the active RTSs and orange for the stable RTSs. The background satellite imagery is a GeoEye-1 image taken on 18 July 2011. The background elevation and the random elevation points outside the RTS areas are derived from the lidar dataset. Elevation surface within the RTS borders represents the elevation before RTS occurred and is interpolated using a spline interpolation.
3.2.3 Volume of eroded material
To calculate the volume of eroded material from the retrograding headwall of the RTSs identified in 2011, we subtracted the mean surface elevation values obtained from the lidar dataset from the mean interpolated surface elevation values (Fig. 3). However, these volumes do not account for the material eroded from the RTS headwalls that settles within the RTS floors and for the material eroded and transported alongshore by coastal processes (Fig. 4). Due to ground ice melting, ca. 5.5 % of the reworked sediments subside and remain compacted in the RTS floor, i.e. do not get transported out of the RTS (Obu et al., 2016). We therefore adjusted the material volumes to take into account the 5.5 % of the material that subside in the RTS floors (Fig. 4c). In addition, we calculated the volumes of material eroded and transported by coastal erosion using the rate of shoreline change between 1952 and 2011 from Irrgang et al. (2018). Using this rate, we calculated the volumes of eroded material between 1952 and 2011 for each RTS. For the RTSs that initiated after 1972, we calculated the volumes of eroded material between 1972 and 2011 (Fig. 4d).
To differentiate between the volumes of ice and sediments eroded, we used the volumetric ice content provided for each coastal segment in Couture and Pollard (2017). The model interpolates the data collected on 19 coastal segments to the whole Yukon Coast based on similarities between surficial geology and permafrost conditions. Ice contents were determined from shallow cores collected from upper soil layers and from bluff exposures.
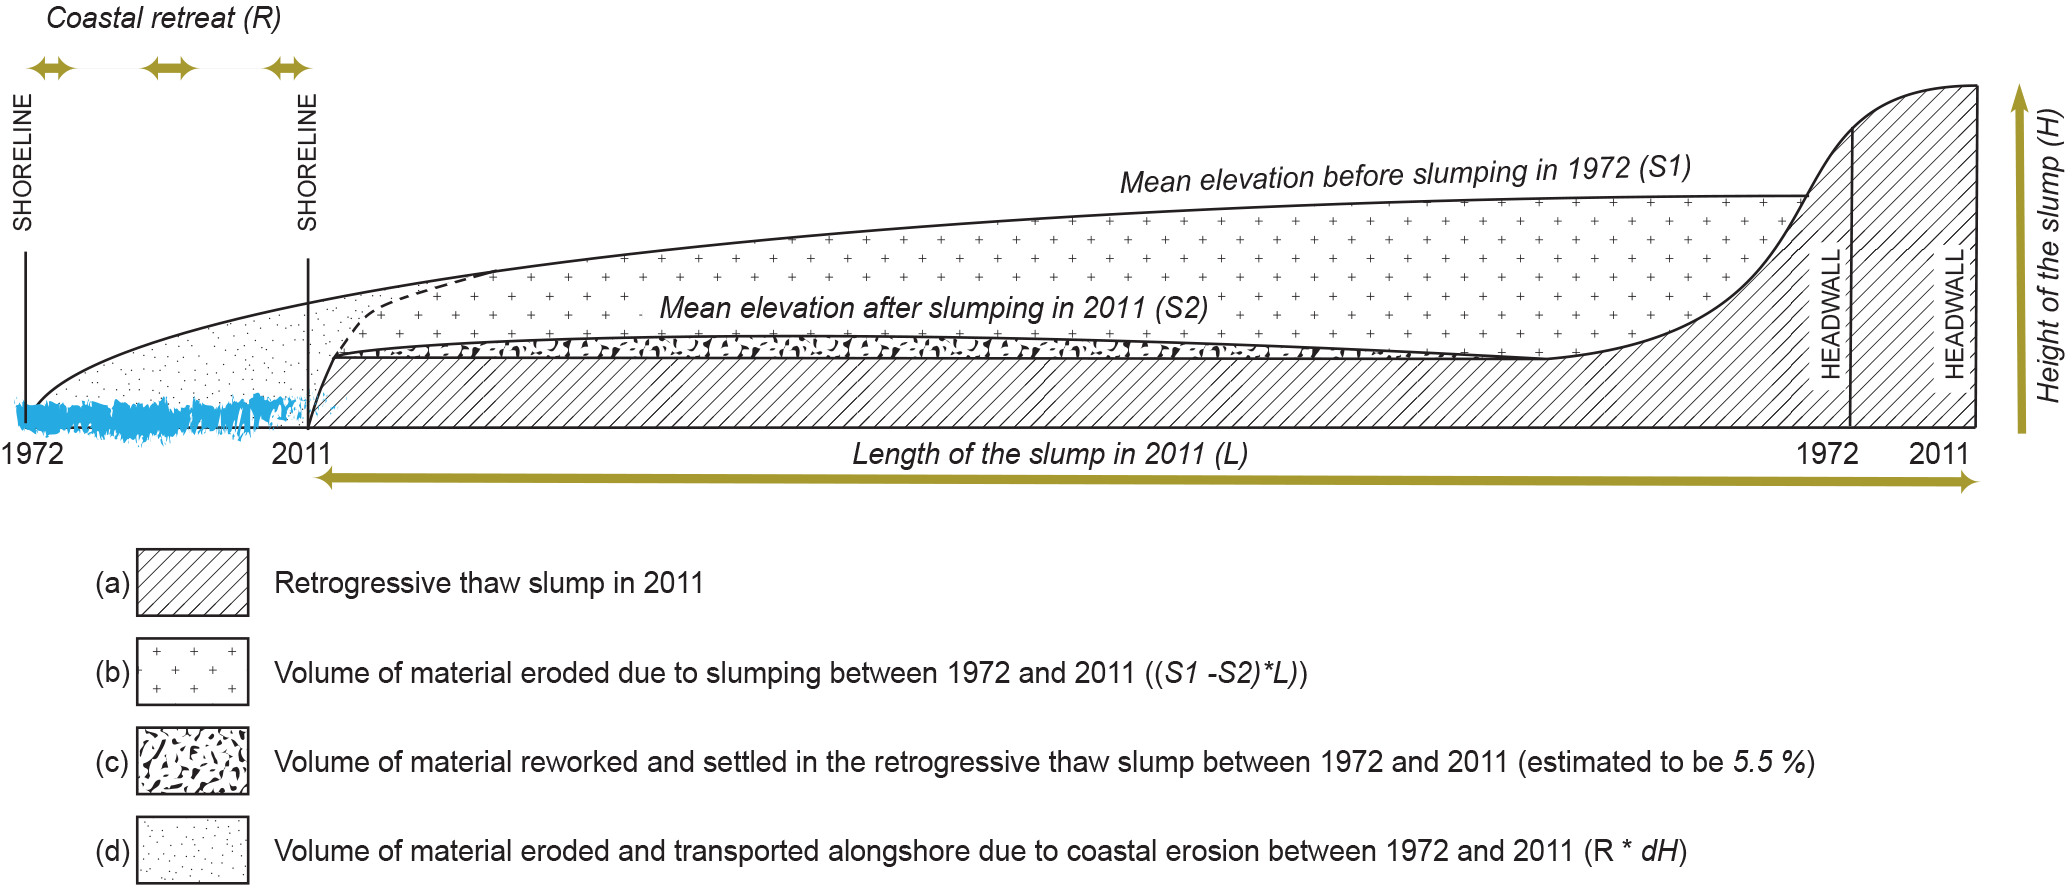
Figure 4Cross section of a retrogressive thaw slump (RTS) (a) illustrating the calculated volumes of sediments eroded through slumping between 1972 and 2011. The calculation estimates the amount of material released to the nearshore zone through slumping (b) and takes into account the material eroded from the RTS headwalls that remains within the RTS floors where it settles (c) and (d) the material eroded and transported alongshore by coastal erosion. The volume of material that remains within the RTS floors was estimated from Obu et al. (2016).
3.3 Estimates of soil and dissolved organic carbon values
We inferred mobilized SOC and DOC stocks and fluxes from RTSs from the mass of SOC and DOC per meter column in each coastal segment provided in Couture (2010) and Tanski et al. (2016) in relation to the estimated volume of material displaced by each RTS. The OC values were derived from in situ measurements collected at 31 locations and were interpolated to each coastal segment following the same approach as for the determination of ground ice (Couture, 2010). The SOC was measured for different soil unit layers along the bluffs and averaged for the upper first meter and lower meter of the soil columns (Couture, 2010). It therefore takes into account the heterogeneity of SOC contents at depth. DOC values account for the differences in DOC concentrations between wedge ice, massive ice, and non-massive ice (Tanski et al., 2016), based on the ice volumes summarized in Couture and Pollard (2017). The OC values are therefore coarse but consistent for the whole Yukon Coast. The dataset is provided in Supplement (Table S1).
3.3.1 SOC and DOC stocks
We used Eq. (1) to calculate the stocks of SOC eroded from RTSs:
where RTSSSOC is the stock of SOC eroded from RTSs (expressed in kg), MCTj is the mass of SOC in the upper 1 m (expressed in kg) per coastal segment j out of m total, Ai is the total surface area of an RTS i out of n total (expressed in m2), MCBj is the mass of SOC in the lower soil column (expressed in kg) per coastal segment j, and VSi is the volume of sediment eroded by per RTS (expressed in m3). MCTj and MCBj take into account differences in dry bulk density per coastal segment j (Couture, 2010). We used Eq. (2) to calculate the stocks of DOC eroded from RTSs:
where RTSSDOC is the total stock of DOC eroded from RTSs (expressed in kg), Dj is the stock of DOC per coastal segment j (expressed in kg m−3), and VIi is the volume of ice eroded from a RTS (expressed in m3). Dj is given per coastal segment j (Tanski et al., 2016).
3.3.2 SOC and DOC fluxes
We calculated the flux of material – including ice and sediments – as well as SOC and DOC fluxes for the RTSs initiated after 1972. To calculate the SOC flux we used Eq. (3):
where RTSFSOC is the annual flux of SOC mobilized from RTSs (expressed in kg yr−1), RTSSSOC is the quantity of SOC eroded from an RTS (expressed in kg) (Eq. 1), and 39 is the number of years during the time period 1972–2011. Similarly, we used Eq. (4) to calculate the DOC flux:
where RTSFDOC is the annual flux of DOC eroded from RTSs (expressed in kg yr−1), RTSSDOC is the quantity of DOC eroded from an RTS (expressed in kg) (Eq. 2), and 39 is the number of years during the time period 1972–2011.
4.1 Evolution of RTSs between 1952 and 2011
The number of RTSs increased by 73 % between 1952 and 2011. The increase was more pronounced throughout the time period 1952–1972 (Fig. 5). Between 1952 and 2011, active RTSs were more abundant and their number increased faster than stable RTSs. While the number of active RTSs progressed steadily throughout the period, the number of stable RTSs decreased between 1972 and 2011: stable RTSs had either been reactivated or been washed away due to coastal retreat. Between 1952 and 2011, the number of RTSs increased by 40 % on lacustrine plains and by 100 % on rolling moraines (Fig. 5). On ice-thrust moraines, the number of RTSs increased by 69 % between 1952 and 2011 (1.2 RTS yr−1). On both moraine units, the rise was greater between 1952 and 1972.
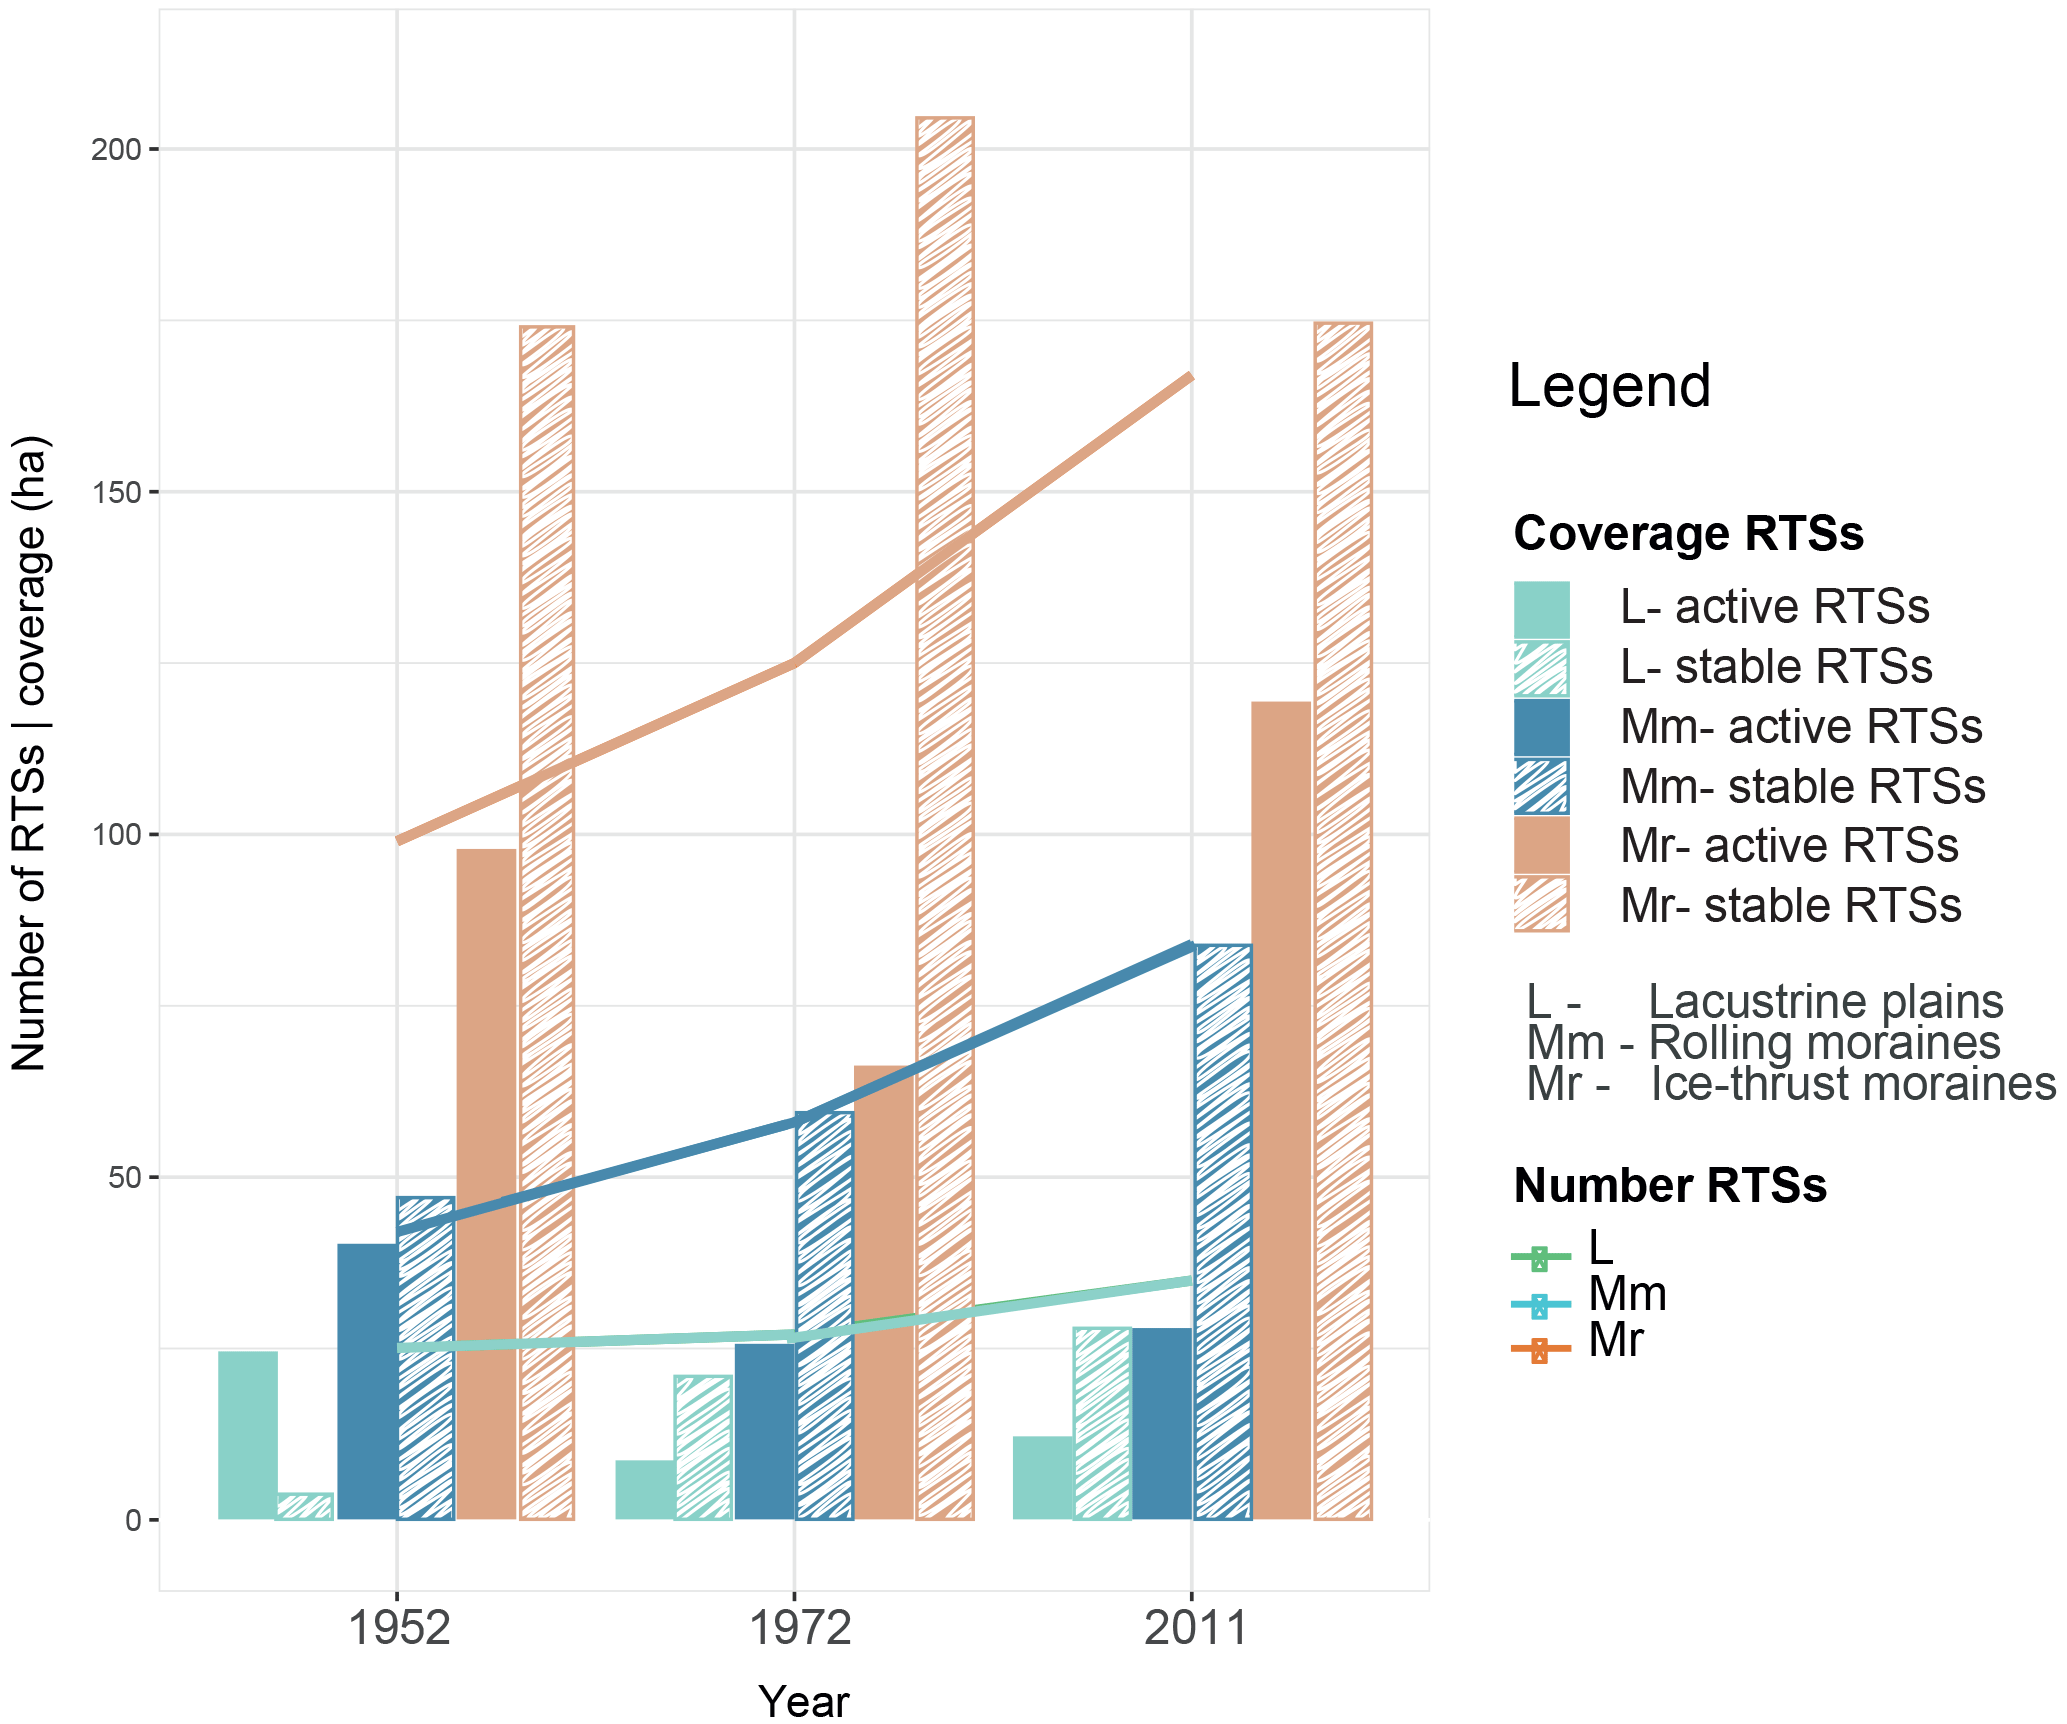
Figure 5Graph showing the evolution in the number and areal coverage of retrogressive thaw slumps (RTSs) between 1952 and 2011 for each geologic units (L, lacustrine plains; Mm, rolling moraines; Mr, ice-thrust moraines). The y axis shows both variations in the number of RTSs and variations in the areal coverage of RTSs (ha), which differentiate between active and stable RTSs.
The total areal coverage (sum of the total RTS sizes) expanded by 14 % between 1952 and 2011 and was observed in all geologic units (Fig. 5). This expansion was driven by an increase in the areal coverage of stable RTSs (25 %); the areal coverage of active RTSs decreased by 2 % (Fig. 5). The expansion in areal coverage was caused by an increase in the number of RTSs rather than by a growth in the size of single RTSs alone: RTSs became smaller; their median size decreased by 67 % throughout the period.
Among RTSs present in 2011, 119 initiated after 1972 on previously undisturbed surfaces: in 2011, 72 were still active and 47 had stabilized (Table S1). RTSs initiated after 1972 were on average smaller than other RTSs and occupied 98.6 ha of the whole study area or 22 % of the total area affected by RTSs in 2011. Most of the RTSs initiated after 1972 (74 %) developed on ice-thrust moraines.
4.2 Eroded material and estimated amount of mobilized SOC and DOC
In the following sections, volumes are given for the RTSs that occurred within the lidar area. This comprises 56 % of the total number of RTSs present in the investigated coastal area (n=162) and 41 % of the number of RTSs initiated after 1972 (n=49).
4.2.1 Eroded material and OC stocks mobilized from RTSs
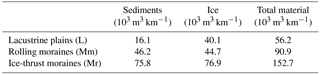
The total volume of material displaced by the 162 RTSs was 16.6×10⁶ m3, 54 % of which was ice (Table S1). It corresponds to a volume of material of 0.1×10⁶ m3 km−1 along the Yukon Coast. On average each RTS eroded 102.2×10³ m3 of material. The volume of eroded material was positively correlated to the size of the RTSs (r2=0.5, p<0.05). On average, 52 % of the material was displaced due to the retreat of the RTS headwalls and 45 % was transported alongshore due to coastal processes. The remaining 3 % of material settled in the RTS floors. Overall, 65 % of the material eroded by RTSs originated from ice-thrust moraines, 19 % from lacustrine plains and 16 % from rolling moraines (Table 1). However, RTSs located on lacustrine plains eroded more material per RTS (135.5×10³ m3 RTS−1) than RTSs located on ice-thrust moraines (103.9×10³ m3 RTS−1) and on rolling moraines (75.1×10³ m3 RTS−1).
Table 1Volume of material, including ice and sediments, eroded by RTSs along the Yukon Coast per geologic unit. The values are normalized to the shoreline length of the geologic units (km).
The largest volumes of eroded material came from RTSs occurring at the glaciation limit (Fig. 6). The 24 RTSs located on Herschel Island east (segment 13) eroded 22 % of the total volume of material displaced by the 162 RTSs. The RTSs located on Herschel Island west (segment 11) had the highest volume of material eroded per RTS, on average 4 % of the total volume of material displaced by RTSs (Fig. 6). Ice-thrust moraine deposits underlie both coastal segments 11 and 13.
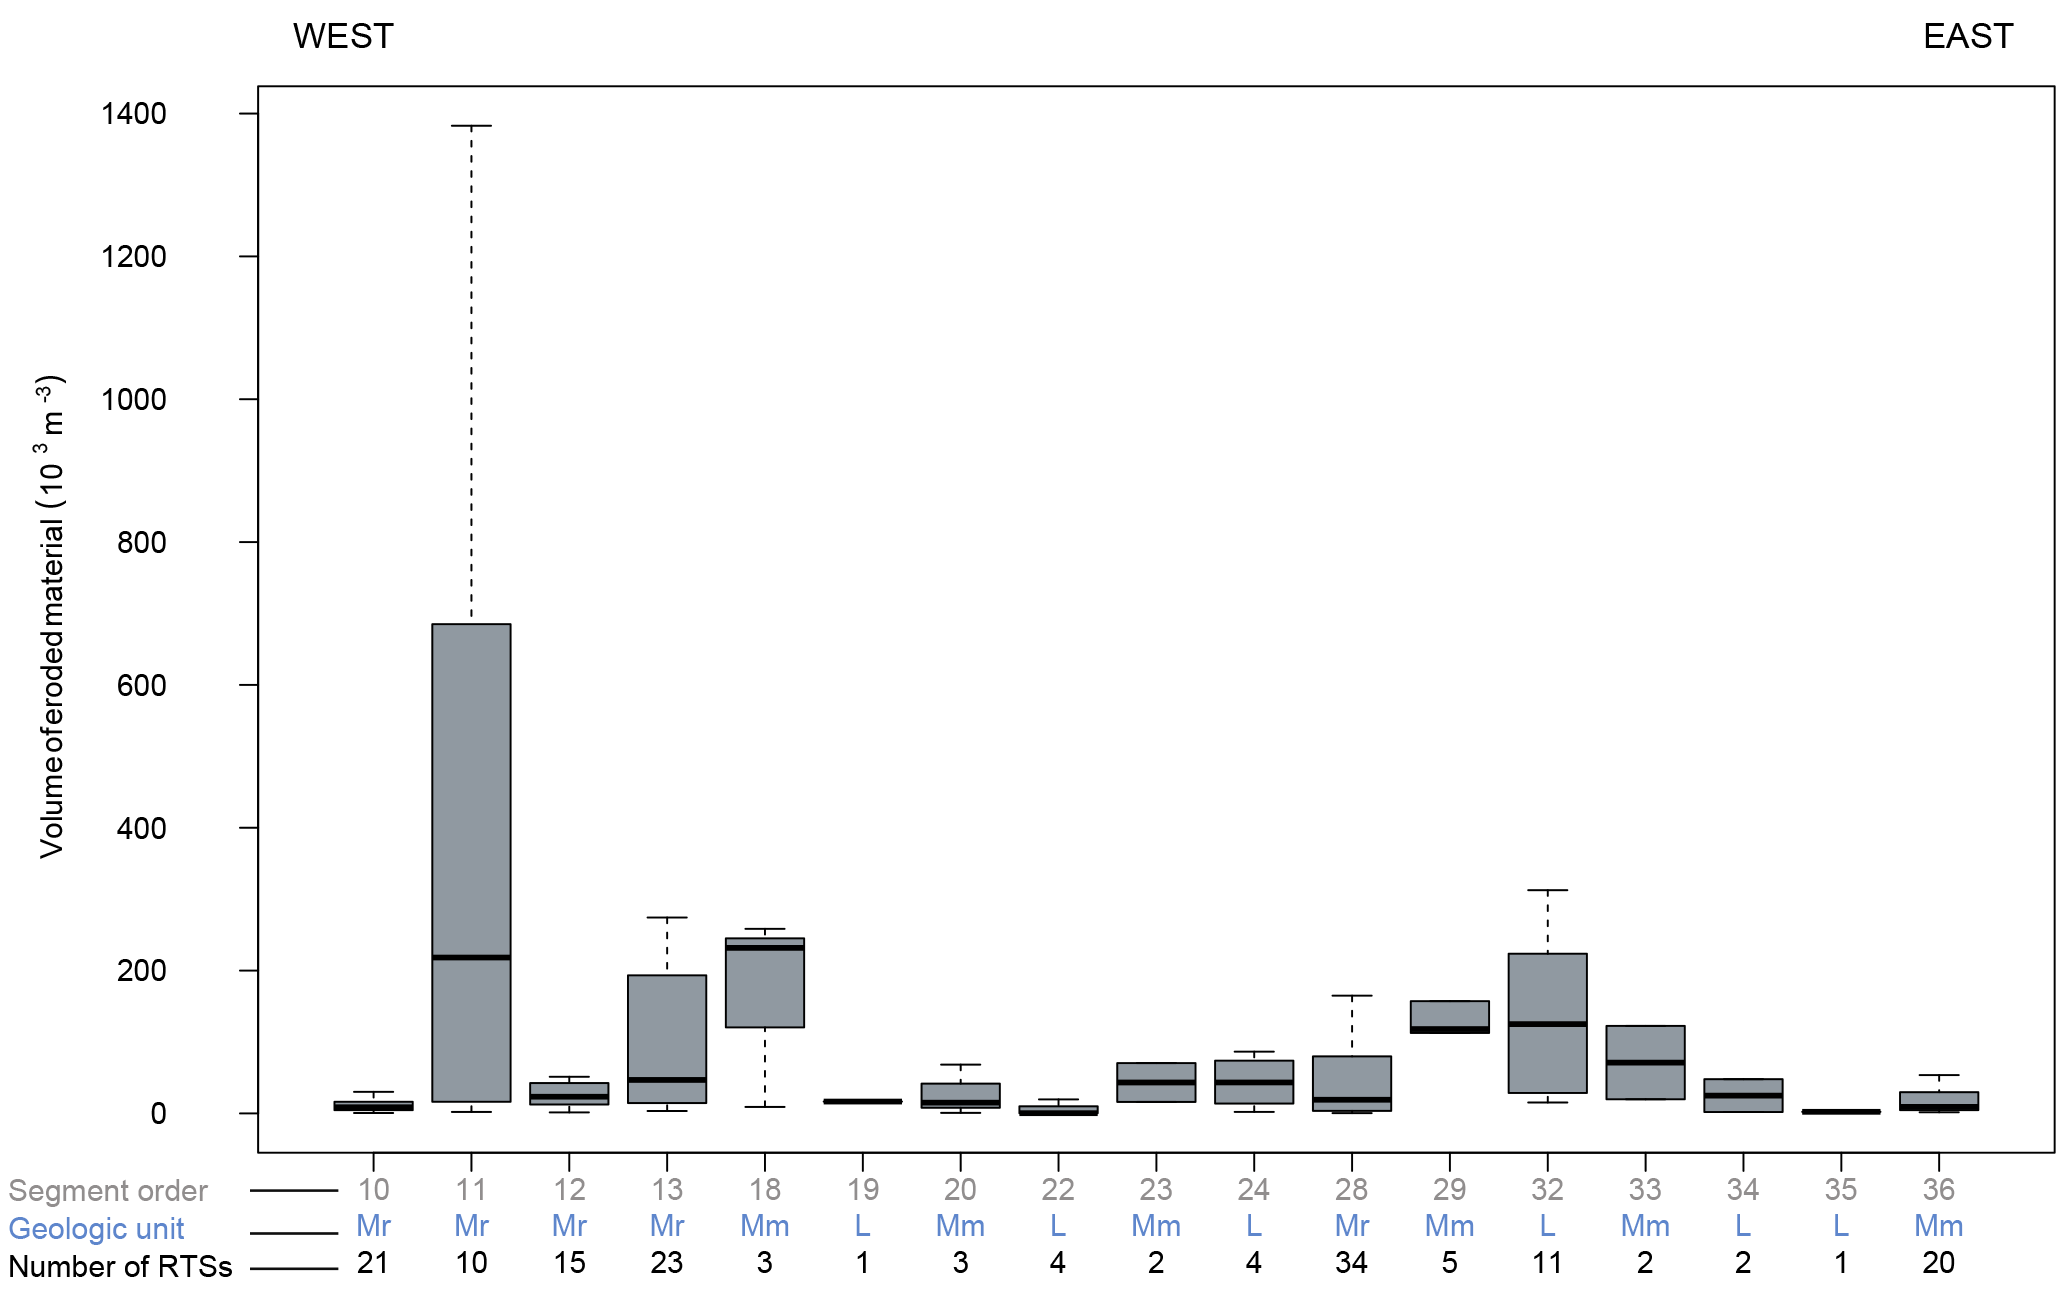
Figure 6Box plot of volumes of eroded material (sediments and ice) per retrogressive thaw slump (RTS) for the coastal segments where RTSs occurred in 2011. Each bar corresponds to a coastal segment, following a geographic order from west on the left to east on the right. The number of the respective coastal segment is indicated in the first line on the x axis. The geologic units are indicated below the bars and referred to as L (lacustrine plains), Mm (rolling moraines), and Mr (ice-thrust moraines). The values on the lowest line of the x axis indicate the total number of RTSs per coastal segment.
Between 1952 and 2011, a total of 162 RTSs displaced 7.6×10⁶ m3 of sediments (Table S1), comprising a mass of mineral sediment of 6.8×10⁹ kg. On ice-thrust moraines RTSs eroded 72 % of the mass of mineral sediments and 19 % on rolling moraines. The total stock of SOC mobilized by RTSs was 145.7×10⁶ kg, with the upper 1 m of soil contributing 49 %. RTSs on ice-thrust moraines contributed to 72 % of the total SOC stock. Out of this, RTSs on Herschel Island west and east (segments 11 and 13) mobilized 47 % of the total SOC stock. The total stock of DOC mobilized by RTSs was 164.5×10³ kg. RTSs on ice-thrust moraines mobilized 63 % of the total DOC, which corresponds to 103.8×10³ kg (Table S1).
4.2.2 Eroded material and OC fluxes from RTSs initiated after 1972
The 49 RTSs initiated after 1972 eroded a volume of material of 1.1×10⁶ m3, 50 % of which was ice (Table S1). It corresponds to 27.2×10³ m3 yr−1 (0.6×10³ m3 RTS−1 yr−1) between 1972 and 2011. This represents 6 % of the total volume of material eroded by the 162 RTSs. Most of the material was eroded and transported alongshore due to coastal erosion (67 %). Retreat of the RTS headwalls contributed to 31 % of the reworked material from RTSs, and 2 % of material remained in the RTS floors where it settled.
Table 2Volume of material, including ice and sediments, eroded by RTSs initiated after 1972 along the Yukon Coast per geologic unit. The values are normalized to the shoreline length of the geologic units (km).
In total, 94 % of the reworked material from RTSs initiated after 1972 came from those located on ice-thrust moraines (Table 2), where the largest volumes of material per RTS initiated after 1972 was 23.6×10³ m3 RTS−1. The RTSs initiated after 1972 on Herschel Island north (segment 12) reworked the largest volume of material: 42.4×10³ m3 RTS−1 (Fig. 7).

Figure 7Box plot of volumes of eroded material (sediments and ice) per RTS for the coastal segments where RTSs initiated after 1972 occurred in 2011. Each bar corresponds to a coastal segment, following a geographic order from west on the left to east on the right. The number of the respective coastal segment is indicated in the first line on the x axis. The geologic units are indicated below the bars and referred to as L (lacustrine plains), Mm (rolling moraines), and Mr (ice-thrust moraines). The values on the lowest line of the x axis indicate the number of RTSs on the coastal segments.
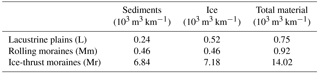
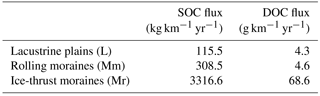
The 49 RTSs initiated after 1972 eroded a mass of mineral sediments of 454.1×10⁶ kg, which represents a flux of 11.6×10⁶ kg yr−1. Since 1972, these RTSs mobilized an SOC flux of 250.1×10³ kg yr−1 (Table 3), representing an average of 0.5 kg m−3 yr−1. Most of the SOC fluxes originated from the RTSs initiated after 1972 on Herschel Island north (segment 12, 123.4×10³ kg yr−1) and on Kay Point southeast (segment 28, 36.8×10³ kg yr−1) (Table S1). On ice-thrust moraines, RTSs initiated after 1972 mobilized 94 % of the total SOC flux (Table 3). The total DOC flux from RTSs initiated after 1972 was 5.1 kg yr−1, with high variability between the geologic units: 0.1 kg yr−1 were mobilized from rolling moraines and from lacustrine plains and 4.9 kg yr−1 from ice-thrust moraines (Table S1). The highest DOC fluxes came from ice-thrust moraines from Herschel Island north (segment 12), where 12 RTSs initiated after 1972 mobilized a total flux of 3.1 kg yr−1 of DOC (Table 3).
Table 3Total SOC and DOC flux mobilized between 1972 and 2011 by RTSs initiated after 1972, per year and kilometer for each geologic unit.
5.1 Increase in slump activity
With a total of 287 RTSs in 2011, the Yukon Coast is one of the Arctic areas most affected by retrogressive thaw slumping (Ramage et al., 2017). The number of RTSs along the Yukon Coast increased by 73 % between 1952 and 2011, with on average two RTSs initiated per year (Fig. 5). The rise was more pronounced between 1952 and 1972 but the number of RTSs continued to increase steadily between 1972 and 2011. The evolution of RTSs along the Yukon Coast is consistent with the observations made in other parts of the Canadian Arctic, where RTS activity has been accelerating since the 1950s (Segal et al., 2016; Lacelle et al., 2010; Lantz and Kokelj, 2008; Lantuit and Pollard, 2008). Lantuit and Pollard (2008) showed that the number of RTSs on Herschel Island increased by 61 % between 1952 and 2000. RTSs develop following changes that affect geomorphic settings (Ramage et al., 2017; Kokelj et al., 2017) and are induced by climatic conditions – such as increased air temperature (Lacelle et al., 2010), precipitation events (Kokelj et al., 2015; Lacelle et al., 2010), and storm events (Lantuit et al., 2012a; Lantuit and Pollard, 2008; Dallimore et al., 1996). Many RTSs that were stable or stabilized between 1952 and 1972 were reactivated between 1972 and 2011. Our results confirm the pattern of RTS reactivation previously observed on Herschel Island (Lantuit and Pollard, 2008) and between Kay Point and Shingle Point (Wolfe et al., 2011), referred to as polycyclicity. Reactivation of RTSs is associated with the incomplete melting of massive ice bodies during the first period of RTS activity (Burn, 2000) and depends on the capacity of the slump headwall to remain exposed until ice is exhausted. In coastal settings, storm events can reactivate RTSs (Lantuit et al., 2012a). The period of RTS activity partly depends on the equilibrium between thermo-denudation and coastal erosion rates: the RTS remains active if the RTS headwall erodes at a rate exceeding shoreline retreat (Lantuit et al., 2012a; Are, 1999). This equilibrium is strongly linked to the dynamics of environmental conditions that enhance coastal erosion, such as the occurrence of storm events and the elongation of the open-water period (Overeem et al., 2011; Are et al., 2008; Solomon, 2005). Climate data recorded at Komakuk Beach (segment 2) and Shingle Point (segment 36) show that the average summer air temperature decreased between the periods 1957–1971 (Komakuk, 7.4 ∘C; Shingle Point, 10.8 ∘C) and 1971–2000 (Komakuk, 4.9 ∘C; Shingle Point, 7.4 ∘C). However, the annual average precipitation increased at both stations by 30 and 41 %, respectively, during the same periods (Environment Canada, http://climate.weather.gc.ca/historical_data/search_historic_data_e.html, 2017). Similar patterns were observed for the summer months (July to September). As suggested by Kokelj et al. (2015) in other Arctic areas, higher rainfall might intensify RTS activity. However, a series of environmental factors seems to be jointly responsible for the intensification of RTS activity along the Yukon Coast (Ramage et al., 2017).
Along the Yukon Coast, RTSs developed mainly on ice-thrust moraines, where their number increased by 1.1 RTS yr−1 throughout the whole period 1952–2011. Differences in ice content and coastal geomorphology explain the disparities in the evolution of RTSs observed among geologic units (Ramage et al., 2017; Lewkowicz, 1987). Our results confirm the results of Kokelj et al. (2017), who showed evidence of a spatial link between RTS occurrence in North America and the maximum extent of the Laurentide Ice Sheet. Similar to our observations along the Yukon Coast, most of the RTSs in North America are found along the marginal moraines of the Laurentide Ice Sheet.
Along with the increase in the number of RTSs, the total areal coverage of RTSs along the Yukon Coast increased by 14 % between 1952 and 2011 (Fig. 5). However, RTSs along the Yukon Coast were on average smaller in 2011 compared to 1952 and 1972. This differs from RTSs observed in other parts of the Canadian Arctic (Segal et al., 2016; Kokelj et al., 2017). Our results support those reported by Ramage et al. (2017); coastal RTSs are on average smaller compared to inland RTSs, and coastal RTSs along the Yukon Coast are smaller than the ones found in other coastal areas of the Arctic. The large number of RTSs initiated after 1972 along the Yukon Coast partly explains this: RTSs initiated after 1972 represented 17 % of the total number of RTSs in 2011; these RTSs were still developing in 2011 and thus had not reached their maximal expansion size.
5.2 Eroded material from RTSs and OC fluxes
The expansion of RTSs along the coast causes the displacement of large volumes of material from the land to the sea. We show that the 56 % of the RTSs identified in 2011 for which we could calculate volumes (162 RTSs out of 287 that occur in the coastal area investigated) have reworked at least 16.6×10⁶ m3 of material along the Yukon Coast, which is 102.5×10³ m3 RTS−1 of material eroded per RTS (Fig. 6). Among these RTSs, 49 RTSs initiated after 1972 reworked 27.2×10³ m3 yr−1 of material, which is 0.6×10³ m3 RTS−1 yr−1 (Fig. 7). These estimates are low compared to material removal from other RTSs in the Arctic. Lantuit and Pollard (2005) calculated a sediment volume loss of 105×103 m−3 between 1970 and 2004 for a single RTS located on Herschel Island; Kokelj et al. (2015) and Jensen et al. (2014) measured material displacements up to 106 m3 per RTS located in NW Canada and Alaska; the Batagay mega-slump located in Siberia eroded more than 24×106 m−3 of ice-rich permafrost in 2014 (Günther et al., 2015). The size of the observed RTSs is one reason behind such differences: most of the RTSs examined in the abovementioned studies are classified as mega-slumps (> 0.5 ha). The RTS studied in Lantuit and Pollard (2005) was the largest (24 ha) RTS identified along the entire Yukon Coast in 2011. However, most of the RTSs along the Yukon Coast are small, with an average size of 0.2 ha (Ramage et al., 2017). This has implications for studies that attempt to model the impact of RTSs on the eroded material budgets in the Arctic.
Couture (2010) estimated the annual flux of mineral sediment eroded by shoreline retreat along the Yukon Coast to 7.3×10⁶ kg km−1 yr−1. We show that along a 190 km portion of the Yukon Coast, 17 % of the RTSs identified along the coast in 2011 (49 RTSs) contributed to 1 % of the annual flux of material eroded along the Yukon Coast (61×103 kg km−1 yr−1). These RTSs initiated after 1972 incised 1 % (2 km) of the shoreline in 2011 and were on average smaller than the average RTSs. Increasing the number and areal coverage of coastal RTSs therefore has significant consequences on the flux of eroded material along the Arctic coasts.
We estimated the annual OC fluxes (SOC and DOC) from these 49 RTSs to be 1.3×10³ kg km−1 yr−1, including 0.02 kg km−1 yr−1 DOC. The average OC flux from coastal retreat along the entire Yukon Coast is 157×103 kg km−1 yr−1 (Couture, 2010) with an average DOC flux of 0.2×10³ kg km−1 yr−1 (Tanski et al., 2016). We show that the annual OC flux released by the 49 RTSs initiated after 1972 was 0.6 % of the annual OC flux from coastal retreat. Most of these fluxes originated from ice-thrust moraines, where the number of RTSs initiated after 1972 was highest. RTSs develop mainly on ice-thrust moraines because of the presence of large volumes of massive ground ice (Ramage et al., 2017). As a result, only half of the material eroding from the RTS headwall is sediment and most of the OC is released as DOC.
The volumes and stocks of material and OC mobilized by RTSs along the Yukon Coast account for 56 % of the RTSs identified on the 2011 imagery. We did not calculate the volumes for all RTSs present along the Yukon Coast due to the restricted area covered by the lidar dataset. Therefore, the fluxes of sediment and OC mobilized by 49 RTSs initiated after 1972 underestimate the annual contribution from RTSs to the nearshore sediment and OC budgets along the Yukon Coast. These fluxes account for 41 % of the flux from RTSs initiated after 1972 and 17 % of the total number of RTSs identified in 2011 along the Yukon Coast.
5.3 Impact of RTSs on the coastal ecosystem
RTSs erode surfaces and scar the landscape, impacting the coastal fringe ecosystems. RTSs alter the vegetation composition: after they stabilize, their effects on the vegetation persist over centuries (Cray and Pollard, 2015; Lantz et al., 2009). Inland, RTSs modify stream sediment transport by raising the stream turbidity and the concentration of total suspended sediments (Kokelj et al., 2013). Moreover, RTSs alter coastal retreat (Obu et al., 2016; Lantuit and Pollard, 2008; Leibman et al., 2008) and strongly influence sediment transport along the coast. Segments with intense slumping show the highest volume of eroded and accumulated material (Obu et al., 2016).
Most of the material and OC mobilized through slumping are transported to the nearshore zone (Vonk et al., 2012). However, a fraction of this material and OC remains in the slump floor for several years (Tanski et al., 2017; Obu et al., 2016) where it degrades and is mineralized by microorganisms. Hence, OC is mobilized in RTSs prior to its release to the ocean, which modifies the amount of OC available to the coastal ecosystem (Tanski et al., 2017; Cassidy et al., 2016; Pizano et al., 2014). Tanski et al. (2017) show that SOC and DOC decrease by 77 and 55 %, respectively, before reaching the nearshore zone. Abbott and Jones (2015) describe similar processes for RTSs in upland areas: after RTSs develop, 51 % of organic-layer SOC and 21 kg m−2 of mineral-layer SOC is removed. Following headwall erosion, water transports melted ground ice and most sediments to the nearshore zone. Without enough viscous flow, the remaining part of the sediments accumulates and settles on the RTS floor, as indicated by higher bulk densities in samples from RTS floors (Tanski et al., 2017; Lantuit et al., 2012a). The OC in the sediments is released to the atmosphere as CO2 (Cassidy et al., 2016), buried in the RTS floor, or transported to the nearshore zone (Tanski et al., 2017).
RTSs are transient phenomena in coastal settings; coastal retreat eventually erodes and transports 45 % of the material reworked by RTSs alongshore. However, as explained above, RTSs affect the OC release process and alter the OC budget of the nearshore zone.
The number of RTSs along the Yukon Coast increased by 73 % between 1952 and 2011, and the total areal coverage of RTSs increased by 14 %. We observed disparities between geomorphic units: the largest increase was on ice-thrust moraines, where the number of RTSs increased at an annual rate of 1.2 RTSs yr−1. Many RTSs are polycyclic and were reactivated between 1972 and 2011. RTSs reworked at least 16.6×10⁶ m3 of material within a 190 km portion of the coastal fringe. The majority of the material came from erosion of the headwall (53 %), and 3 % remained in the RTS floors. A large amount of the material from RTSs was eroded and transported alongshore due to coastal processes (45 %). The OC flux from 17 % of the RTSs identified in 2011 was 1.3×10³ kg km−1 yr−1 and represented 0.6 % of the annual OC fluxes from coastal retreat in the study area. Not all the OC mobilized by RTSs is immediately transported to the nearshore zone; an important part is mobilized in the RTS floors. Therefore, RTSs alter the amount of OC that enters he nearshore zone by affecting the OC release process. Our results show that the contribution of RTSs to the nearshore OC budget is non-negligible and should be included when estimating the quantity of OC released from the Arctic coasts to the ocean.
The data in this article are available at https://doi.org/10.1594/PANGAEA.869573 (Ramage et al., 2016).
The supplement related to this article is available online at: https://doi.org/10.5194/bg-15-1483-2018-supplement.
JLR and HL designed the study. AMI geocoded the historical photographs used for mapping. JLR created the spline interpolation and calculated the eroded volumes of material from retrogressive thaw slumps. JLR prepared the manuscript with contributions from all coauthors.
The authors declare that they have no conflict of interest.
This article is part of the special issue “Changing Permafrost in the Arctic and its Global Effects in the 21st Century (PAGE21) (BG/ESSD/GMD/TC inter-journal SI)”. It is not associated with a conference.
This study was supported by the Helmholtz Association through the COPER
Young Investigators Group (VH-NG-801) and by the Alfred Wegener Institute in
Potsdam. Justine L. Ramage was financially supported by a PhD stipend by the
University of Potsdam. Anna M. Irrgang was financially supported by a PhD
stipend from the German Federal Environmental Foundation. We thank Jaroslav Obu
and Gustaf Hugelius who provided insight and expertise at an early stage of the
study.
The article processing charges for this open-access
publication
were covered by a Research
Centre of the Helmholtz Association.
Edited by: Bo Elberling
Reviewed by: two anonymous referees
Abbott, B. W. and Jones, J. B.: Permafrost collapse alters soil carbon stocks, respiration, CH4, and N2O in upland tundra, Glob. Change Biol., 21, 4570–4587, 2015.
Abbott, B. W., Jones, J. B., Schuur, E. A. G., Chapin III, F. S., Bowden, W. B., Bret-Harte, M. S., et al.: Biomass offsets little or none of permafrost carbon release from soils, streams, and wildfire: an expert assessment, Environ. Res. Lett., 11, 034014, https://doi.org/10.1088/1748-9326/11/3/034014, 2016.
Are, F. E.: The role of coastal retreat for sedimentation in the Laptev Sea, in: Land-Ocean Systems in the Siberian Arctic, 288–295, Springer Berlin Heidelberg, 1999.
Are, F. E., Reimnitz, E., Grigoriev, M., Hubberten, H.-W., and Rachold, V.: The Influence of Cryogenic Processes on the Erosional Arctic Shoreface, J. Coast. Res., 241, 110–121, https://doi.org/10.2112/05-0573.1, 2008.
Brooker, A., Fraser, R. H., Olthof, I., Kokelj, S. V., and Lacelle, D.: Mapping the activity and evolution of retrogressive thaw slumps by tasselled cap trend analysis of a Landsat satellite image stack, Permafrost Periglac., 25, 243–256, 2014.
Burke, E. J., Hartley, I. P., and Jones, C. D.: Uncertainties in the global temperature change caused by carbon release from permafrost thawing, The Cryosphere, 6, 1063–1076, https://doi.org/10.5194/tc-6-1063-2012, 2012.
Burn, C. R.: The thermal regime of a retrogressive thaw slump near Mayo, Yukon Territory, Can. J. Earth Sci., 37, 967–981, 2000.
Burn, C. R. and Zhang, Y.: Permafrost and climate change at Herschel Island (Qikiqtaruq), Yukon Territory, Canada, J. Geophys. Res.-Earth Surf., 114, F02001, https://doi.org/10.1029/2008JF001087, 2009.
Cannone, N., Lewkowicz, A. G., and Guglielmin, M.: Vegetation colonization of permafrost-related landslides, Ellesmere Island, Canadian High Arctic, J. Geophys. Res.-Biogeo., 115, G04020, https://doi.org/10.1029/2010JG001384, 2010.
Cassidy, A. E., Christen, A., and Henry, G. H. R.: The effect of a permafrost disturbance on growing-season carbon-dioxide fluxes in a high Arctic tundra ecosystem, Biogeosciences, 13, 2291–2303, https://doi.org/10.5194/bg-13-2291-2016, 2016.
CAVM Team: Circumpolar Arctic Vegetation Map. (1:7,500,000 scale), Conservation of Arctic Flora and Fauna (CAFF), Map No. 1. U.S. Fish and Wildlife Service, Anchorage, Alaska, ISBN: 0-9767525-0-6, ISBN-13: 978-0-9767525-0-9, 2003.
Couture, N.: Fluxes of Soil Organic Carbon from Eroding Permafrost Coasts, Canadian Beaufort Sea, 155 pp., McGill University, Montreal, Canada, 2010.
Couture, N. J. and Pollard, W. H.: A Model for Quantifying Ground-Ice Volume, Yukon Coast, Western Arctic Canada, Permafrost Periglac., 28, 534–542, https://doi.org/10.1002/ppp.1952, 2017.
Couture, N., Irrgang, A. M., Pollard, W., Lantuit, H., and Fritz, M.: Coastal erosion of permafrost soils along the Yukon Coastal Plain and fluxes of organic carbon to the Canadian Beaufort Sea, J. Geophys. Res.-Biogeo., 123, https://doi.org/10.1002/2017JG004166, 2018.
Cray, H. A. and Pollard, W. H.: Vegetation recovery patterns following permafrost disturbance in a Low Arctic setting: case study of Herschel Island, Yukon, Canada, Arct. Antarc. Alp. Res., 47, 99–113, 2015.
Dallimore, S. R., Wolfe, S. A., and Solomon, S. M.: Influence of ground ice and permafrost on coastal evolution, Richards Island, Beaufort Sea coast, NWT, Can. J. Earth Sci., 33, 664–675, 1996.
Dyke, A. and Prest, V.: Late Wisconsinan and Holocene history of the Laurentide ice sheet, Geogr. Phys. Quatern., 41, 237–263, 1987.
Environment Canada: Canadian Climate Normals 1971–2000 Station Data, available at: http://climate.weather.gc.ca/climate_normals (last access: 18 January 2018), 2017.
Fritz, M., Wetterich, S., Schirrmeister, L., Meyer, H., Lantuit, H., Preusser, F., and Pollard, W. H.: Eastern Beringia and beyond: late Wisconsinan and Holocene landscape dynamics along the Yukon Coastal Plain, Canada, Palaeogeogr. Palaeocl., 319, 28–45, 2012.
Fritz, M., Vonk, J. E., and Lantuit, H.: Collapsing Arctic coastlines, Nat. Clim. Change, 7, 6–7, https://doi.org/10.1038/nclimate3188, 2017.
Günther, F., Grosse, G., Wetterich, S., Jones, B. M., Kunitsky, V. V., Kienast, F., and Schirrmeister, L.: The Batagay mega thaw slump, Yana Uplands, Yakutia, Russia: permafrost thaw dynamics on decadal time scale, TERRA NOSTRA-Schriften der GeoUnion Alfred-Wegener-Stiftung, 2015.
Hansen, J., Ruedy, R., Sato, M. and Lo, K.: Global surface temperature change, Rev. Geophys., 48, RG4004, https://doi.org/10.1029/2010RG000345, 2010.
Harper, J. R.: Morphology of the Canadian Beaufort Sea coast, Mar. Geol., 91, 75–91, 1990.
Huang, J., Zhang, X., Zhang, Q., Lin, Y., Hao, M., Luo, Y., and Nie, S.: Recently amplified arctic warming has contributed to a continual global warming trend, Nat. Clim. Change, 7, 875, https://doi.org/10.1038/s41558-017-0009-5, 2017.
Hugelius, G., Strauss, J., Zubrzycki, S., Harden, J. W., Schuur, E. A. G., Ping, C.-L., Schirrmeister, L., Grosse, G., Michaelson, G. J., Koven, C. D., O'Donnell, J. A., Elberling, B., Mishra, U., Camill, P., Yu, Z., Palmtag, J., and Kuhry, P.: Estimated stocks of circumpolar permafrost carbon with quantified uncertainty ranges and identified data gaps, Biogeosciences, 11, 6573–6593, https://doi.org/10.5194/bg-11-6573-2014, 2014.
Irrgang, A. M., Lantuit, H., Manson, G. K., Günther, F., and Grosse, G., Overduin, P. P.: Variability in rates of coastal change along the Yukon coast, 1951–2015, J. Geophys. Res.-Earth, under review, 2018.
Jensen, A. E., Lohse, K. A., Crosby, B. T., and Mora, C. I.: Variations in soil carbon dioxide efflux across a thaw slump chronosequence in northwestern Alaska, Environ. Res. Lett., 9, 025001, https://doi.org/10.1088/1748-9326/9/2/025001, 2014.
Kessler, L.: Estimating the economic impact of the permafrost carbon feedback, Clim. Change Econ., 08, 1750008, https://doi.org/10.1088/1748-9326/9/2/025001, 2017.
Kohnert, K., Serafimovich, A., Hartmann, J., and, Sachs T.: Airborne measurements of methane fluxes in Alaskan and Canadian tundra with the research aircraft Polar 5, Berichte zur Polar-und Meeresforschung = Reports on polar and marine research, 673, available at: http://hdl.handle.net/10013/epic.43357, 2014.
Kokelj, S. V., Zajdlik, B., and Thompson, M. S.: The impacts of thawing permafrost on the chemistry of lakes across the subarctic boreal-tundra transition, Mackenzie Delta region, Canada, Permafrost Periglac., 20, 185–199, 2009a.
Kokelj, S. V., Lantz, T. C., Kanigan, J., Smith, S. L., and Coutts, R.: Origin and polycyclic behaviour of tundra thaw slumps, Mackenzie Delta region, Northwest Territories, Canada, Permafrost Periglac., 20, 173–184, 2009b.
Kokelj, S. V., Lacelle, D., Lantz, T. C., Tunnicliffe, J., Malone, L., Clark, I. D., and Chin, K. S.: Thawing of massive ground ice in mega slumps drives increases in stream sediment and solute flux across a range of watershed scales, J. Geophys. Res.-Earth, 118, 681–692, 2013.
Kokelj, S. V., Tunnicliffe, J., Lacelle, D., Lantz, T. C., Chin, K. S., and Fraser, R.: Increased precipitation drives mega slump development and destabilization of ice-rich permafrost terrain, northwestern Canada, Global Planet. Change, 129, 56–68, 2015.
Kokelj, S. V., Lantz, T. C., Tunnicliffe, J., Segal, R., and Lacelle, D.: Climate-driven thaw of permafrost preserved glacial landscapes, northwestern Canada, Geology, 45, 371–374, 2017.
Koven, C. D., Schuur, E. A. G., Schädel, C., Bohn, T. J., Burke, E. J., Chen, G., X. Chen, Ciais, P., Grosse, G., Harden, J. W., Hayes, D. J., Hugelius, G., Jafarov, E. E., Krinner, G., Kuhry, P., Lawrence, D. M., MacDougall, A. H., Marchenko, S. S., McGuire, A. D., Natali, S. M., Nicolsky, D. J., Olefeldt, D., Peng, S., Romanovsky, V. E., Schaefer, K. M., Strauss, J., Treat, C. C., and Turetsky, M.: A simplified, data-constrained approach to estimate the permafrost carbon – climate feedback, Phil. Trans. R. Soc. A, 373, 20140423, https://doi.org/10.1098/rsta.2014.0423, 2015.
Kuhry, P., Dorrepaal, E., Hugelius, G., Schuur, E. A. G., and Tarnocai, C.: Potential remobilization of belowground permafrost carbon under future global warming, Permafrost Periglac., 21, 208–214, https://doi.org/10.1002/ppp.684, 2010.
Lacelle, D., Bjornson, J., and Lauriol, B.: Climatic and geomorphic factors affecting contemporary (1950–2004) activity of retrogressive thaw slumps on the Aklavik Plateau, Richardson Mountains, NWT, Canada, Permafrost Periglac., 21, 1–15, 2010.
Lamoureux, S. F. and Lafrenière, M. J.: Fluvial impact of extensive active layer detachments, Cape Bounty, Melville Island, Canada, Arct. Antarct. Alp. Res., 41, 59–68, 2009.
Lantuit, H. and Pollard, W. H.: Temporal stereophotogrammetric analysis of retrogressive thaw slumps on Herschel Island, Yukon Territory, Nat. Hazards Earth Syst. Sci., 5, 413–423, https://doi.org/10.5194/nhess-5-413-2005, 2005.
Lantuit, H. and Pollard, W. H.: Fifty years of coastal erosion and retrogressive thaw slump activity on Herschel Island, southern Beaufort Sea, Yukon Territory, Canada, Geomorphology, 95, 84–102, 2008.
Lantuit, H., Pollard, W. H., Couture, N., Fritz, M., Schirrmeister, L., Meyer, H., and Hubberten, H. W.: Modern and late Holocene retrogressive thaw slump activity on the Yukon coastal plain and Herschel Island, Yukon Territory, Canada, Permafrost Periglac., 23, 39–51, 2012a.
Lantuit, H., Overduin, P. P., Couture, N., Wetterich, S., Aré, F., Atkinson, D., Brown, J., Cherkashov, G., Drozdov, D., Forbes, D. L., and Graves-Gaylord, A.: The Arctic coastal dynamics database: a new classification scheme and statistics on Arctic permafrost coastlines, Estuar. Coast., 35, 383–400, 2012b.
Lantz, T. C. and Kokelj, S. V.: Increasing rates of retrogressive thaw slump activity in the Mackenzie Delta region, NWT, Canada, Geophys. Res. Lett., 35, L06502, https://doi.org/10.1029/2007GL032433, 2008.
Lantz, T. C., Kokelj, S. V., Gergel, S. E., and Henry, G. H.: Relative impacts of disturbance and temperature: persistent changes in microenvironment and vegetation in retrogressive thaw slumps, Global Change Biol., 15, 1664–1675, 2009.
Leibman, M., Gubarkov, A., Khomutov, A., Kizyaakov, A., and Vanshtein, B.: Coastal Processes at the Tabular-Ground-Ice-Bearing Area, Yugorsky Peninsula, Russia, Proceedings of the 9th International Conference on Permafrost, Fairbanks, Alaska, 1037–1042, 2008.
Lewkowicz, A. G.: Headwall retreat of ground-ice slumps, Banks Island, Northwest Territories, Can. J. Earth Sci., 24, 1077–1085, 1987.
MacDougall, A. H., Avis, C. A., and Weaver, A. J.: Significant contribution to climate warming from the permafrost carbon feedback, Nat. Geosci., 5, 719–721, 2012.
Mackay, J. R.: Glacier ice thrust features of the Yukon coast, Geographical Bulletin, 13, 5–21, 1959.
Mackelprang, R., Waldrop, M. P., DeAngelis, K. M., David, M. M., Chavarria, K. L., Blazewicz, S. J., and Jansson, J. K.: Metagenomic analysis of a permafrost microbial community reveals a rapid response to thaw, Nature, 480, 368–371, https://doi.org/10.1038/nature10576, 2011.
Malone, L., Lacelle, D., Kokelj, S., and Clark, I. D.: Impacts of hillslope thaw slumps on the geochemistry of permafrost catchments (Stony Creek watershed, NWT, Canada), Chemical Geol., 356, 38–49, 2013.
McGuire, A. D., Koven, C., Lawrence, D. M., Clein, J. S., Xia, J., Beer, C., et al.: Variability in the sensitivity among model simulations of permafrost and carbon dynam- ics in the permafrost region between 1960 and 2009, Global Biogeochem. Cy., 30, 1015–1037, https://doi.org/10.1002/2016GB005405, 2016.
Obu, J., Lantuit, H., Grosse, G., Günther, F., Sachs, T., Helm, V., and Fritz, M.: Coastal erosion and mass wasting along the Canadian Beaufort Sea based on annual airborne LiDAR elevation data, Geomorphology, 293, Part B, 331–346, https://doi.org/10.1016/j.geomorph.2016.02.014, 2016.
Olefeldt, D., Goswami, S., Grosse, G., Hayes, D., Hugelius, G., Kuhry, P., and Turetsky, M. R.: Circumpolar distribution and carbon storage of thermokarst landscapes, Nat. Commun., 7, 13043, 2016.
Overeem, I., Anderson, R. S., Wobus, C. W., Clow, G. D., Urban, F. E., and Matell, N.: Sea ice loss enhances wave action at the Arctic coast, Geophys. Res. Lett., 38, L17503, https://doi.org/10.1029/2011GL048681, 2011.
Ping, C.-L., Michaelson, G. J., Guo, L., Jorgenson, M. T., Kanevskiy, M., Shur, Y., Dou, F., and Liang, J.: Soil carbon and material fluxes across the eroding Alaska Beaufort Sea coastline, J. Geophys. Res., 116, G02004, https://doi.org/10.1029/2010JG001588, 2011.
Pizano, C., Barón, A. F., Schuur, E. A., Crummer, K. G., and Mack, M. C.: Effects of thermo-erosional disturbance on surface soil carbon and nitrogen dynamics in upland arctic tundra, Environ. Res. Lett., 9, 075006, https://doi.org/10.1088/1748-9326/9/7/075006, 2014.
Ramage, J. L., Konopczak, A. M., Herzschuh, U., Morgenstern, A., Couture, N., and Lantuit, H.: Coastal retrogressive thaw slumps along the Yukon Coast (Canada), link to shapefile, PANGAEA, https://doi.org/10.1594/PANGAEA.869573, 2016.
Ramage, J. L., Irrgang, A. M., Herzschuh, U., Morgenstern, A., Couture, N., and Lantuit, H.: Terrain Controls on the Occurrence of Coastal Retrogressive Thaw Slumps along the Yukon Coast, Canada, J. Geophys. Res.-Earth, 122, 1619–1634, https://doi.org/10.1002/2017JF004231, 2017.
Rampton, V. N.: Quaternary Geology of the Yukon Coastal Plain, Geological Survey of Canada, Canada, 1982.
Schaefer, K., Lantuit, H., Romanovsky, V. E., Schuur, E. A., and Witt, R.: The impact of the permafrost carbon feedback on global climate, Environ. Res. Lett., 9, 085003, https://doi.org/10.1088/1748-9326/9/8/085003, 2014.
Schneider von Deimling, T., Meinshausen, M., Levermann, A., Huber, V., Frieler, K., Lawrence, D. M., and Brovkin, V.: Estimating the near-surface permafrost-carbon feedback on global warming, Biogeosciences, 9, 649–665, https://doi.org/10.5194/bg-9-649-2012, 2012.
Schuur, E. A., Bockheim, J., Canadell, J. G., Euskirchen, E., Field, C. B., Goryachkin, S. V., Hagemann, S., Kuhry, P., Lafleur, P. M., Lee, H., and Mazhitova, G.: Vulnerability of permafrost carbon to climate change: Implications for the global carbon cycle, AIBS Bulletin, 58, 701–714, 2008.
Schuur, E. A. G., McGuire, A. D., Schädel, C., Grosse, G., Harden, J. W., Hayes, D. J., Hugelius, G., Koven, C. D., Kuhry, P., Lawrence, D. M., and Natali, S. M.: Climate change and the permafrost carbon feedback, Nature, 520, 171–179, 2015.
Segal, R. A., Lantz, T. C., and Kokelj, S. V.: Acceleration of thaw slump activity in glaciated landscapes of the Western Canadian Arctic, Environ. Res. Lett., 11, 034025, https://doi.org/10.1088/1748-9326/11/3/034025, 2016.
Solomon, S. M.: Spatial and temporal variability of shoreline change in the Beaufort-Mackenzie region, northwest territories, Canada, Geo-Mar. Lett., 25, 127–137, https://doi.org/10.1007/s00367-004-0194-x, 2005.
Tanski, G., Couture, N., Lantuit, H., Eulenburg, A., and Fritz, M.: Eroding permafrost coasts release low amounts of dissolved organic carbon (DOC) from ground ice into the nearshore zone of the Arctic Ocean, Global Biogeochem. Cy., 30, 1054–1068, 2016.
Tanski, G., Lantuit, H., Ruttor, S., Knoblauch, C., Radosavljevic, B., Strauss, J., Wolter, J., Irrgang, A. M., Ramage, J., and Fritz, M.: Transformation of terrestrial organic matter along thermokarst-affected permafrost coasts in the Arctic, Sci. Total Environ., 581, 434–447, 2017.
Vonk, J. E., Sánchez-García, L., Van Dongen, B. E., Alling, V., Kosmach, D., Charkin, A., Semiletov, I. P., Dudarev, O. V., Shakhova, N., Roos, P., and Eglinton, T. I.: Activation of old carbon by erosion of coastal and subsea permafrost in Arctic Siberia, Nature, 489, 137–140, 2012.
Wolfe, S., Kotler, E., and Dallimore, S.: Surficial characteristics and the distribution of thaw landforms (1970–1999), Shingle Point to Kay Point, Yukon Territory, Rep., Geological Survey of Canada, 2011.