the Creative Commons Attribution 4.0 License.
the Creative Commons Attribution 4.0 License.
 | 26 Mar 2018
Small spatial variability in methane emission measured from a wet patterned boreal bog
Aino Korrensalo
Elisa Männistö
Pavel Alekseychik
Ivan Mammarella
Janne Rinne
Timo Vesala
Eeva-Stiina Tuittila
We measured methane fluxes of a patterned bog situated in Siikaneva in southern Finland from six different plant community types in three growing seasons (2012–2014) using the static chamber method with chamber exposure of 35 min. A mixed-effects model was applied to quantify the effect of the controlling factors on the methane flux.
The plant community types differed from each other in their water level, species composition, total leaf area (LAITOT) and leaf area of aerenchymatous plant species (LAIAER). Methane emissions ranged from −309 to 1254 mg m−2 d−1. Although methane fluxes increased with increasing peat temperature, LAITOT and LAIAER, they had no correlation with water table or with plant community type. The only exception was higher fluxes from hummocks and high lawns than from high hummocks and bare peat surfaces in 2013 and from bare peat surfaces than from high hummocks in 2014. Chamber fluxes upscaled to ecosystem level for the peak season were of the same magnitude as the fluxes measured with the eddy covariance (EC) technique. In 2012 and in August 2014 there was a good agreement between the two methods; in 2013 and in July 2014, the chamber fluxes were higher than the EC fluxes.
Net fluxes to soil, indicating higher methane oxidation than production, were detected every year and in all community types. Our results underline the importance of both LAIAER and LAITOT in controlling methane fluxes and indicate the need for automatized chambers to reliably capture localized events to support the more robust EC method.
- Article
(1576 KB) - Full-text XML
- BibTeX
- EndNote


Mires or undrained peatlands are wetland ecosystems in which partly undecomposed organic material is stored as peat in anoxic conditions under the water table (WT). Therefore, on the one hand, these ecosystems act as important sinks for carbon dioxide (CO2), but on the other hand, they are also the largest natural source of methane (CH4), which is a potent climate warming greenhouse gas (IPCC, 2014). Methane flux rate of a peatland ecosystem depends on the balance between microbial methane production and consumption. In peatlands, methane is produced in wet and anoxic conditions below the WT by anaerobic microbes, methanogens (Archaea) (Hanson and Hanson, 1996). It is released from peat to the atmosphere via three transport routes: by diffusion in the peat matrix, through aerenchymatous vascular plants, and by ebullition from water and bare peat surfaces (LeMer and Roger, 2001; Raghoebarsing et al., 2005). The consumption of methane is partly regulated by the proportions of these three routes. If the surface of peatland is not water saturated, a part of the diffusing methane is oxidized in the upper aerobic peat layer or within Sphagnum mosses by methanotrophic bacteria (Hanson and Hanson, 1996; LeMer and Roger, 2001; Larmola et al., 2010), while the methane transported by plants (Bhullar et al., 2013) or bubbles is emitted directly to the atmosphere. Although a large part of methane can also be oxidized in plants, such as rice (Bosse and Frenzel, 1997), so far significant methane oxidation has not been detected in bog plants, such as Eriophorum angustifolium and E. vaginatum (Frenzel and Rudolph, 1998). The processes of methane production, consumption and transport are affected by several environmental and ecological factors, such as WT (Dise et al., 1993), temperature (Dunfield et al., 1993), pH (Dunfield et al., 1993; Dedysh, 2002), quality and quantity of available substrate (Ström et al., 2003), and vegetation type and productivity (Bubier, 1995; Waddington et al., 1996; Joabsson et al., 1999). Current models of global methane budget are still uncertain due to limited knowledge of the relative contribution of different environmental factors controlling methane fluxes (Riley et al., 2011). The largest source of uncertainty is the quantity of methane emissions from natural wetlands, such as peatlands (Riley et al., 2011; Melton et al., 2013).
Peatland ecology is strongly controlled by typically high water level and its spatial variation (Rydin and Jeglum, 2013). Importantly, WT determines the thickness of anaerobic and aerobic layers in peat, which may vary spatially within a peatland, leading to different surface types along the WT position gradient. Bogs are peatland ecosystems receiving nutrients only through atmospheric deposition and are typically characterized by strong spatial variation in WT. This results from pronounced microtopography varying from open pools and wet bare peat surfaces and hollows to intermediate lawns and drier and higher hummocks. Just as the thickness of aerobic peat layer differs between the surface types, the species composition of plant community types varies (Kotiaho et al., 2013). Sedges with aerenchymatous tissue in their stems and roots, which allows transportation of oxygen to their roots, grow on the water-saturated surface types. Shrubs that lack aerenchymatous tissue grow on higher surfaces with a thicker aerobic layer. Together with plant community composition and environmental conditions, methane dynamics vary along the WT gradient as the amount of methane-transporting vegetation and the thickness of the methane-consuming aerobic layer change. It is generally considered that the wetter the surface, the higher the methane emission (e.g., Bubier et al., 2005). However, recent studies based on spatial (Turetsky et al., 2014) and temporal variation (Rinne et al., 2018) indicate maximum fluxes at intermediate WT positions. Vegetation has recently been included in the process models as a controlling factor of methane fluxes from peatlands (Li et al., 2016; Raivonen et al., 2017). However, these models do not yet take into account the impact of its spatial heterogeneity on methane fluxes.
Although there is a wealth of studies that quantify methane emissions from different peatlands (reviewed by Turetsky et al., 2014; Wilson et al., 2016), most studies have been focused on fens that receive additional nutrients from the surrounding mineral soil and support a higher amount of aerenchymatous vegetation compared to bogs (Turetsky et al., 2014). Studies on the spatial variation in methane emissions in bogs with varying plant community types are scarce (see, however, Waddington and Roulet, 1996; Frenzel and Karofeld, 2000; Laine et al., 2007). Climate change is expected to alter WT and consequently the abundance of different plant community types in peatlands, leading to changes in ecosystem functions. During the last decade, atmospheric methane concentration has shown an increasingly strong rise, and although the underlying reasons remain poorly understood (Kirschke et al., 2013) this increase has been associated with the microbially produced methane (Nisbet et al., 2016). As atmospheric methane accelerates global warming, it is crucial to be able to understand and model the carbon dynamics of peatlands, which are the largest natural source of methane and contain approximately one-third of global soil carbon stock (Turunen et al., 2002; Yu, 2011). Better understanding of the microtopographical variation in the methane fluxes and their controlling factors enables better prediction of the effects of climate change on methane emissions from peatlands in the future.
In this study, we aimed to quantify spatial variation in methane fluxes and their controlling factors in a patterned boreal bog. We measured methane emissions in six different plant community types during three subsequent growing seasons. We compared methane flux, WT, peat temperature and leaf area of all vegetation (total leaf area index, LAI) and aerenchymatous vegetation (aerenchymatous LAI) between the plant community types for three growing seasons. A mixed-effects model was used for quantifying the effect of the controlling factors on the methane flux. Fluxes measured with chambers were compared with methane flux measured with the eddy covariance (EC) technique. We hypothesized that the plant community types differ in terms of environmental controls and, consequently, in their methane emissions. We expected wetter plant community types with aerenchymatous plant species to release more methane than drier plant community types.
2.1 Study site
The study was conducted at the bog site of the oligotrophic peatland complex Siikaneva situated in southern Finland (61∘50′ N, 24∘12′ E), 160 m a.s.l., within the southern boreal vegetation zone (Ahti et al., 1968). The Siikaneva bog site is located 1.3 km northwest from the Siikaneva fen site, studied before by Aurela et al. (2007), Rinne et al. (2007) and Riutta et al. (2007), for example. According to the 30-year averages from the Juupajoki-Hyytiälä weather station that is located 6.3 km east from the bog site, annual rainfall of the area is 707 mm, the annual temperature sum (base temperature of 5 ∘C) is 1318 degree days, the average annual temperature is 4.2 ∘C and the average temperatures in January and July are −7.2 and 17.1 ∘C. The bog site has a well-pronounced microtopography represented by open-water pools, bare peat surfaces, hollows, and higher and drier lawns and hummocks. The vegetation is dominated by Sphagnum mosses, except in the ponds and bare peat surfaces. Sphagnum fuscum and S. rubellum grow on hummocks, where vascular plant vegetation is dominated by dwarf shrubs, such as Andromeda polifolia, Calluna vulgaris and Empetrum nigrum. E. vaginatum is also found on hummocks and it is common on lawns, where the moss layer is dominated by Sphagnum magellanicum and S. rubellum. Sphagnum cuspidatum and S. majus, in turn, dominate wet hollows together with Carex limosa, Rhynchospora alba and Scheuchzeria palustris. R. alba is often the only plant growing in the bare peat surfaces.
2.2 Sampling
To cover the spatial variation in vegetation and environmental conditions, sample plots were established to represent six different plant community types or bog microforms characteristic to the site: high hummock (HHU), hummock (HU), high lawn (HL), lawn (L), hollow (HO) and bare peat surfaces (BP). They were placed within the study site in three clusters of six plots each (18 sample plots in total).
The static chamber method (Alm et al., 2007) was used to measure the methane fluxes from the sample plots. Stainless steel collars 60 × 60 cm in size (surface area 3600 cm2) were installed around each plot for the measurements. The depth of the collars varied from 10 to 30 cm; the deepest ones were in the sample plots with the deepest WT. In order to minimize the peat disturbance during the measurements, boardwalks supported by stilts driven to mineral soil underneath the peat were built next to the sample plots. During each measurement, an opaque aluminum chamber was placed in the groove on top of the collar, and water was poured into the groove to make it airtight during the measurement. The chamber was then sealed with a rubber plug with a 1 mm diameter plastic tube with a three-way stopcock attached to it. A fan inside the chamber was used to mix the air in the chamber headspace. Four air samples of 20 mL were taken with a syringe from the headspace of the chamber at 5, 15, 25 and 35 min after the chamber was closed. The samples were placed in glass vials and kept cold and dark until their methane concentration was analyzed with an Agilent Technologies 7890A gas chromatograph and Gilson GX-271 liquid handler. Air temperature inside the chamber as well as peat temperatures at the moss surface and at the depths of 5, 15 and 30 cm were measured during each methane measurement. Water level of the sample plot was measured relative to moss surface from a plastic tube installed in peat next to each sample plot. Each tube had holes on its sides enabling water to settle inside it.
The chamber measurements were conducted seven times in 2012 (from 26 June to 16 October), nine times in 2013 (from 21 May to 9 September) and 16 times in 2014 (from 7 April to 24 September) over the growing season.
Methane flux during each measurement was calculated as the linear change in methane concentration in relation to time and taking into account the volume of and temperature in the chamber. Nonlinear changes in methane concentration were considered to result from ebullition or leak in the chamber and were excluded. In total, 10.4 % of the measurements were excluded as outliers. The resulting dataset consisted of 516 measurements in total.
2.3 Leaf area index
Leaf area of each sample plot was measured over the growing season following Wilson et al. (2007). An estimate for an average number of leaves per square meter of area for each vascular plant species was taken from leaf count conducted every third week from five subsample plots (8 × 8 cm) within each sample plot. For leaf size, samples of corresponding species were taken around the study site on each leaf area measurement day and the leaf area of each species was measured with a scanner. LAI of all the vascular plant species (LAITOT) was then calculated by multiplying average leaf size with leaf number. LAI of aerenchymatous plants (LAIAER) for each sample plot was calculated based on the leaf area of the five aerenchymatous species growing on the site, Carex limosa, Eriophorum vaginatum, Rhynchospora alba, Scheuchzeria palustris and Trichophorum cespitosum.
2.4 Eddy covariance measurements
EC measurements were conducted at the site in 2012–2014, providing an independent ecosystem-scale estimate of methane fluxes. The EC setup included an ultrasonic anemometer (USA-1, Metek GmbH, Germany) and an open-path methane concentration analyzer (LI-7700, LI-COR Biosciences, USA). The measurement height was 2.4 m above the peat surface. EddyUH software was used to process the raw data and produce the 30 min average fluxes of latent heat, sensible heat and methane (Mammarella et al., 2016). Standard EC data quality control (e.g., Aubinet et al., 2012) was performed using the software or manually; the EC flux data during calm periods (friction velocity u∗ < 0.1 m s−1) were excluded from the analysis.
The EC flux series missed a large fraction of data (65 %) due to technical problems, flux quality filtering or periods with insufficient turbulence. Therefore, gap-filling was necessary, which was carried out in the following way. First, a function was fit to all 3 years of data:
where is the flux model (µmol m−2 s−1), a and b the empirical parameters, and Tp20 (∘C) is the peat temperature at 20 cm of depth. Tp20 was gap-filled with the equivalent data from the nearby fen station or using linear interpolation and spline-smoothed to eliminate diurnal-scale variability. From that general fit, we established that b=0.167 (95 % CI [0.163, 0.170]). Next, a was determined for each year individually by fitting Eq. (1), now with b fixed at 0.167. This yielded a = [0.0049, 0.0056, 0.0062] for 2012, 2013 and 2014, respectively. The methane flux model was then calculated using Eq. (1) and used to fill the gaps in the observed EC methane flux.
2.5 Analyses
To address spatial variability, we used linear mixed-effects models to test whether the measured environmental variables (WT, LAITOT, LAIAER and peat temperature) differed between plant community types or years. These models were constructed with the whole dataset, and each environmental variable was explained by potential fixed predictors of year and surface type as well as their interaction and by the random effects of measurement plot and plot cluster. To test whether the seasonal pattern of the environmental variables differed among the plant community types, the models were then constructed separately for each year with potential fixed predictors of measurement day, plant community type and their interaction and with the random effect of measurement plot cluster. Variation in methane flux was analyzed by adding potential fixed predictors plant community type, year and their interaction, peat temperature at different depths, air temperature, LAITOT, LAIAER, and WT to the model one by one. The AIC value (Akaike information criterion) and conditional F test were used to evaluate whether an addition of a fixed predictor resulted in a significantly better model than the simpler one. Peat temperature can be expected to have a nonlinear effect on methane flux, and therefore we mimicked the often-used exponential relation of methane flux to temperature by first assuming peat temperature effect to be constant until 10 ∘C and then following the second-degree polynomial. The 10 ∘C threshold was selected based on visual inspection. According to AIC value this response shape explained the variation in the data better than a liner form. We also tested which of the three peat temperature variables with the selected response form explained the variation in methane fluxes better. The measurement plot and plot cluster were included as random effects in all of the models. The data were analyzed with the function lme of the package nlme of R software (version 3.3.2). The residuals were normally distributed around a mean of zero in all of the models. The fixed part of the model is reported in Appendix A.
3.1 Variation in environmental variables
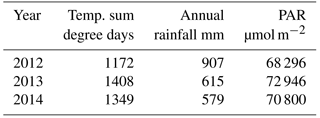
The year 2012 was the coolest, wettest and cloudiest of the three years studied, whereas year 2013 was the warmest. The year 2014 was intermediate in temperature and irradiation, but it was the driest of the three years (Table 1).
Table 1Effective temperature sum of the growing season, annual rainfall and the amount of photosynthetically active radiation (PAR) in the three studied years 2012–2014.
Reflecting our sampling strategy, there was a clear WT position gradient among the six plant community types that were divided into three statistically different groups based on WT (degrees of freedom (DF) = 5, 10; p<0.0001) (Fig. 1). (1) High hummocks had the lowest WT, with the mean at −25 cm, followed by (2) hummocks and high lawns, with the mean WT of −12 cm. (3) Lawns, hollows and bare peat surfaces had the highest WT with means close to the soil surface (Fig. 1). The WT gradient was similar during all three years, but the overall WT differed between the years. The year 2012 with the highest precipitation had a significantly higher WT than 2013 or 2014 (Fig. 1). The warmest year 2013 with intermediate precipitation and the lowest WT did not differ significantly from the year 2014 with the lowest precipitation and intermediate WT. There were no differences between the plant community types in the rhythm of the WT over the growing seasons.
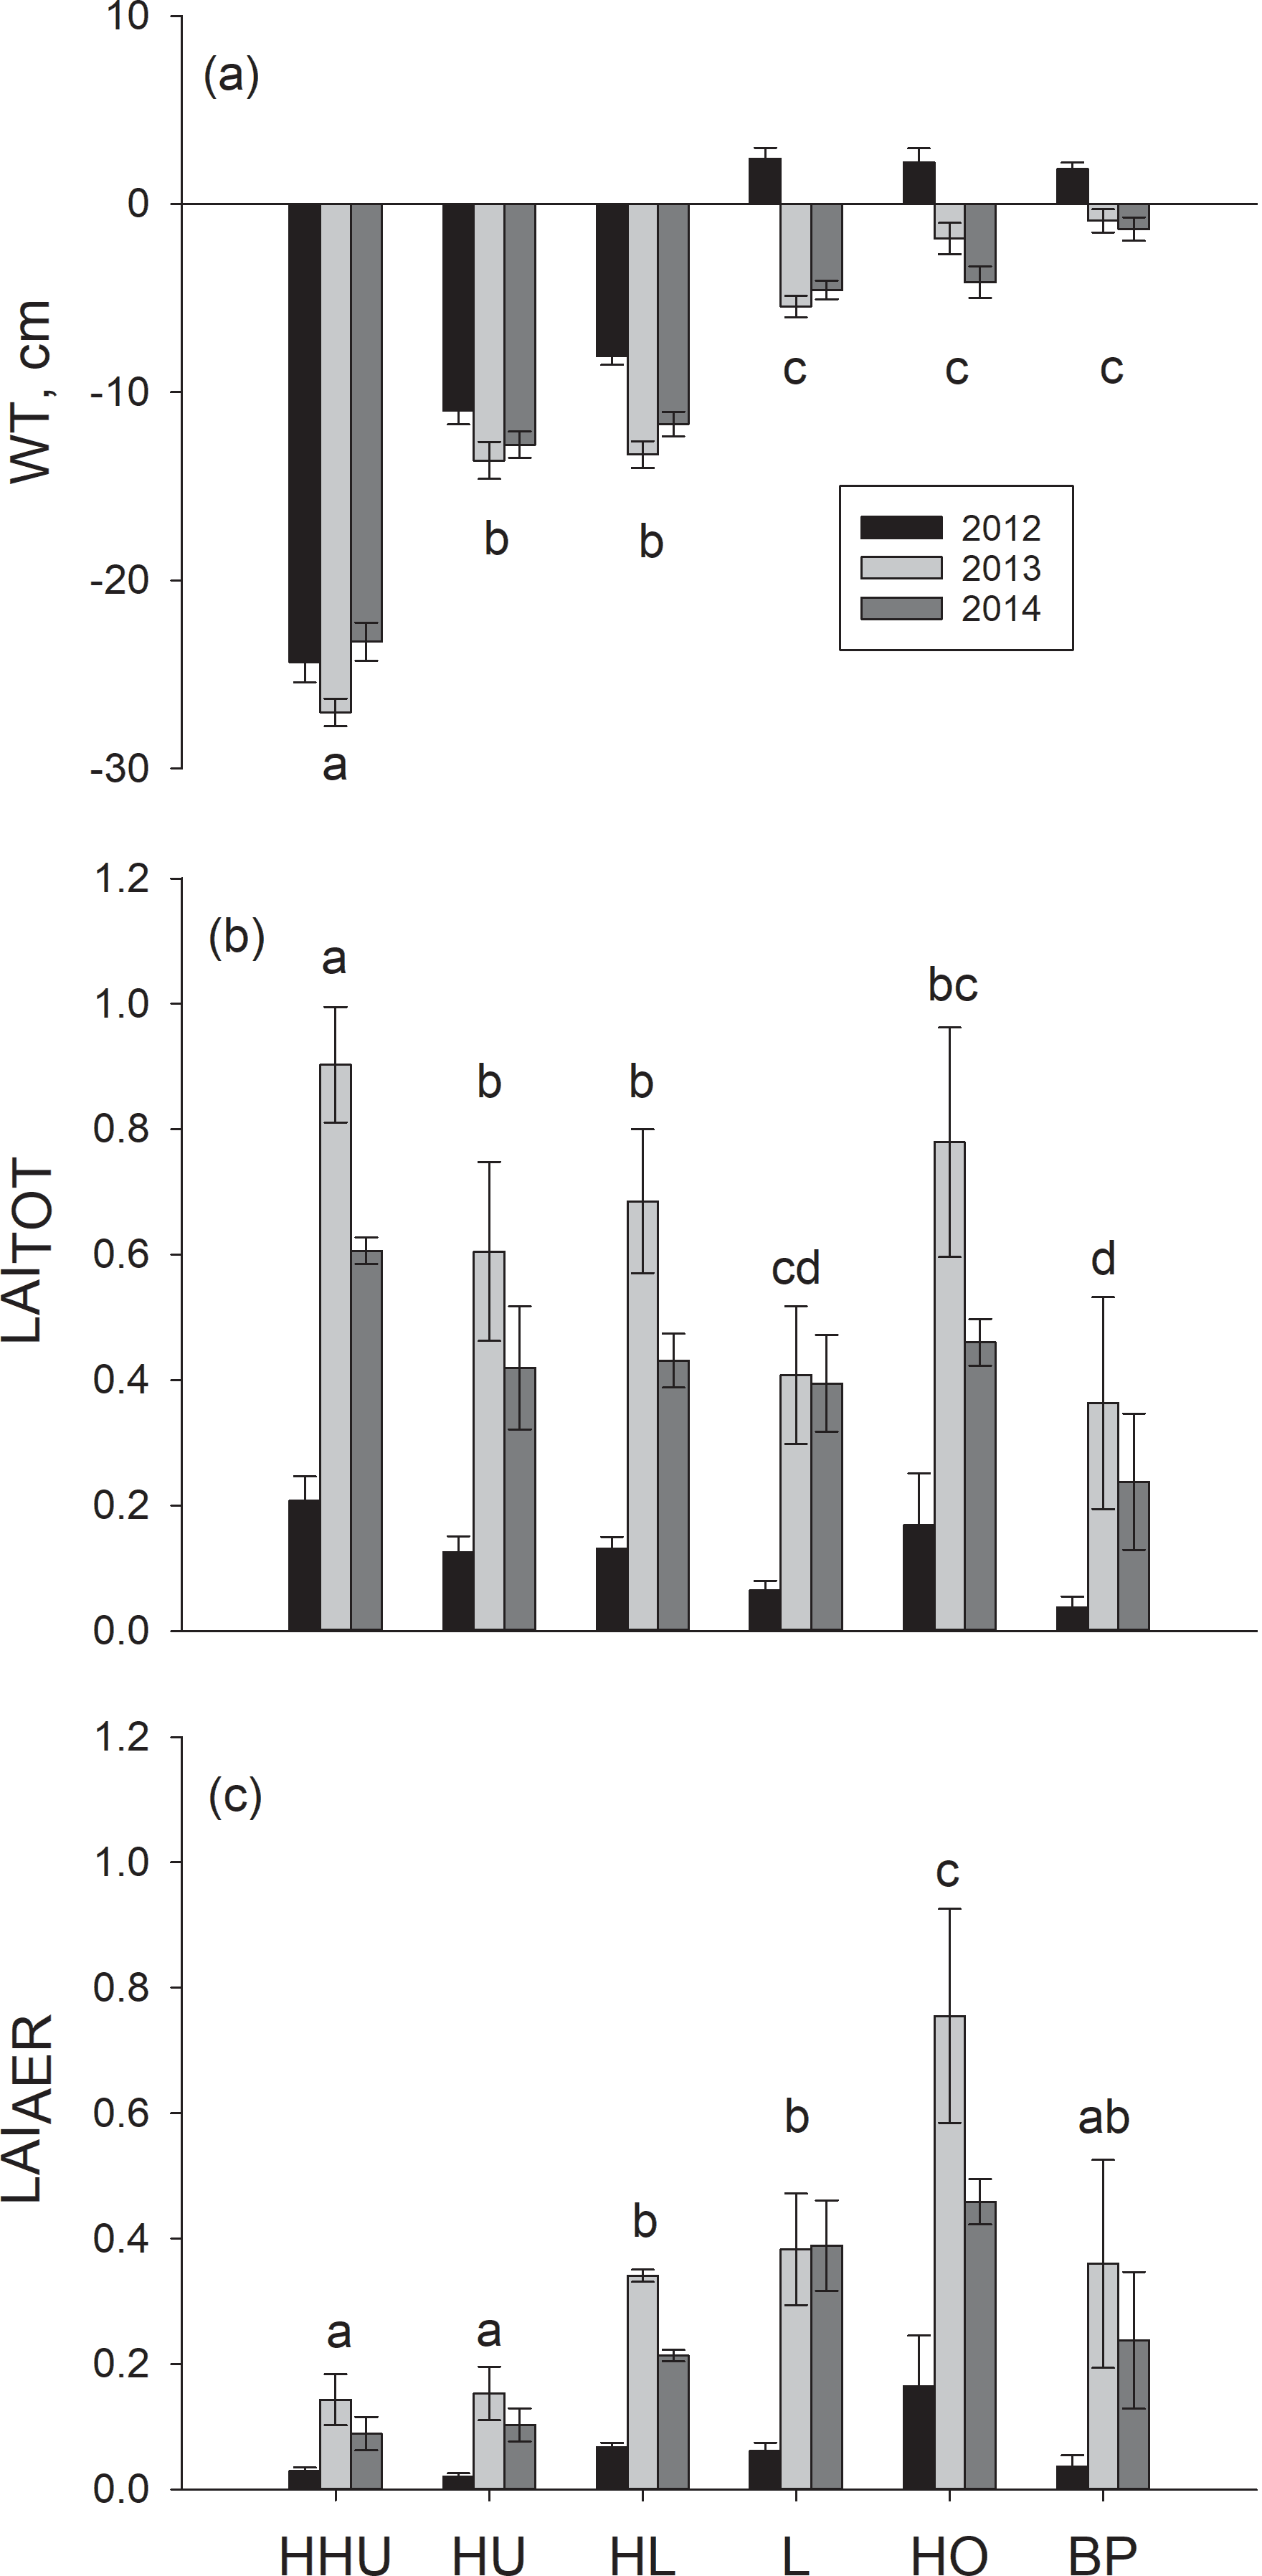
Figure 1(a) Mean water table and the mean of summer maximum of (b) total leaf area (LAITOT) and (c) leaf area of aerenchymatous plant species (LAIAER) in six plant community types: high hummock (HHU), hummock (HU), high lawn (HL), lawn (L), hollow (HO) and bare peat surface (BP) in three subsequent years. The error bars show the standard error of the mean. The different letters (a–d) denote significant differences between the plant community types. The same letter above bars indicates that those plant community types do not differ statistically from each other. Note: statistical analyses for LAI have been conducted with mean LAITOT and LAIAER instead of summer maximum.
LAITOT varied among the six plant community types (DF = 5, 10; p < 0.0001) (Fig. 1) forming four groups. LAITOT was (1) highest on high hummocks, followed by (2) hummocks and high lawns, (3) hollows and, (4) lawns and bare peat surfaces. The differences among the plant community types stayed similar over the three years. The summer maximum of LAITOT was lowest in the coolest and wettest year 2012 and highest in the warmest year 2013 (Fig. 1).
LAIAER also varied among the six plant community types (DF = 5, 10; p=0.0060) forming four groups (Fig. 1). In contrast to LAITOT, (1) hollows had the highest LAIAER. (2) High lawns and lawns had a slightly higher LAIAER than (3) bare peat surfaces, while (4) high hummocks and hummocks had the lowest LAIAER. LAIAER differed significantly among years (DF = 2, 402; p<0.0001) (Fig. 1). All six plant community types had the highest LAIAER in the warmest year 2013 and the lowest LAIAER in the coolest and wettest year 2012. Similar to LAITOT, the differences among the plant community types were similar in each year.
Peat temperature did not differ among the plant community types in the warmest year 2013. In the coolest and wettest year 2012, hollows and bare peat surfaces were significantly warmer than the other types (HO: 1.38 ± 0.33, DF = 98, p=0.0001 and BP: 0.85 ± 0.32, DF = 98, p=0.009). In the driest year 2014, bare peat surfaces were significantly warmer than hummocks (0.61 ± 0.31, DF = 235, p=0.0485) and high lawns (0.77 ± 0.31, DF = 235, p=0.0154). Similar to air temperature, the three years had significantly different peat temperatures (DF = 2, 483; p<0.0001) with the means of 14.1, 16.5 and 12.6 ∘C in 2012, 2013 and 2014, respectively.
3.2 Variation in methane fluxes
Methane fluxes measured with chambers ranged from −90 to 387 mg m−2 d−1, from −87 to 1254 mg m−2 d−1 and from −309 to 910 mg m−2 d−1 in 2012, 2013 and 2014, respectively (Fig. 2). Each year methane fluxes were generally higher in the middle of the growing season than in spring or in autumn (Fig. 3).
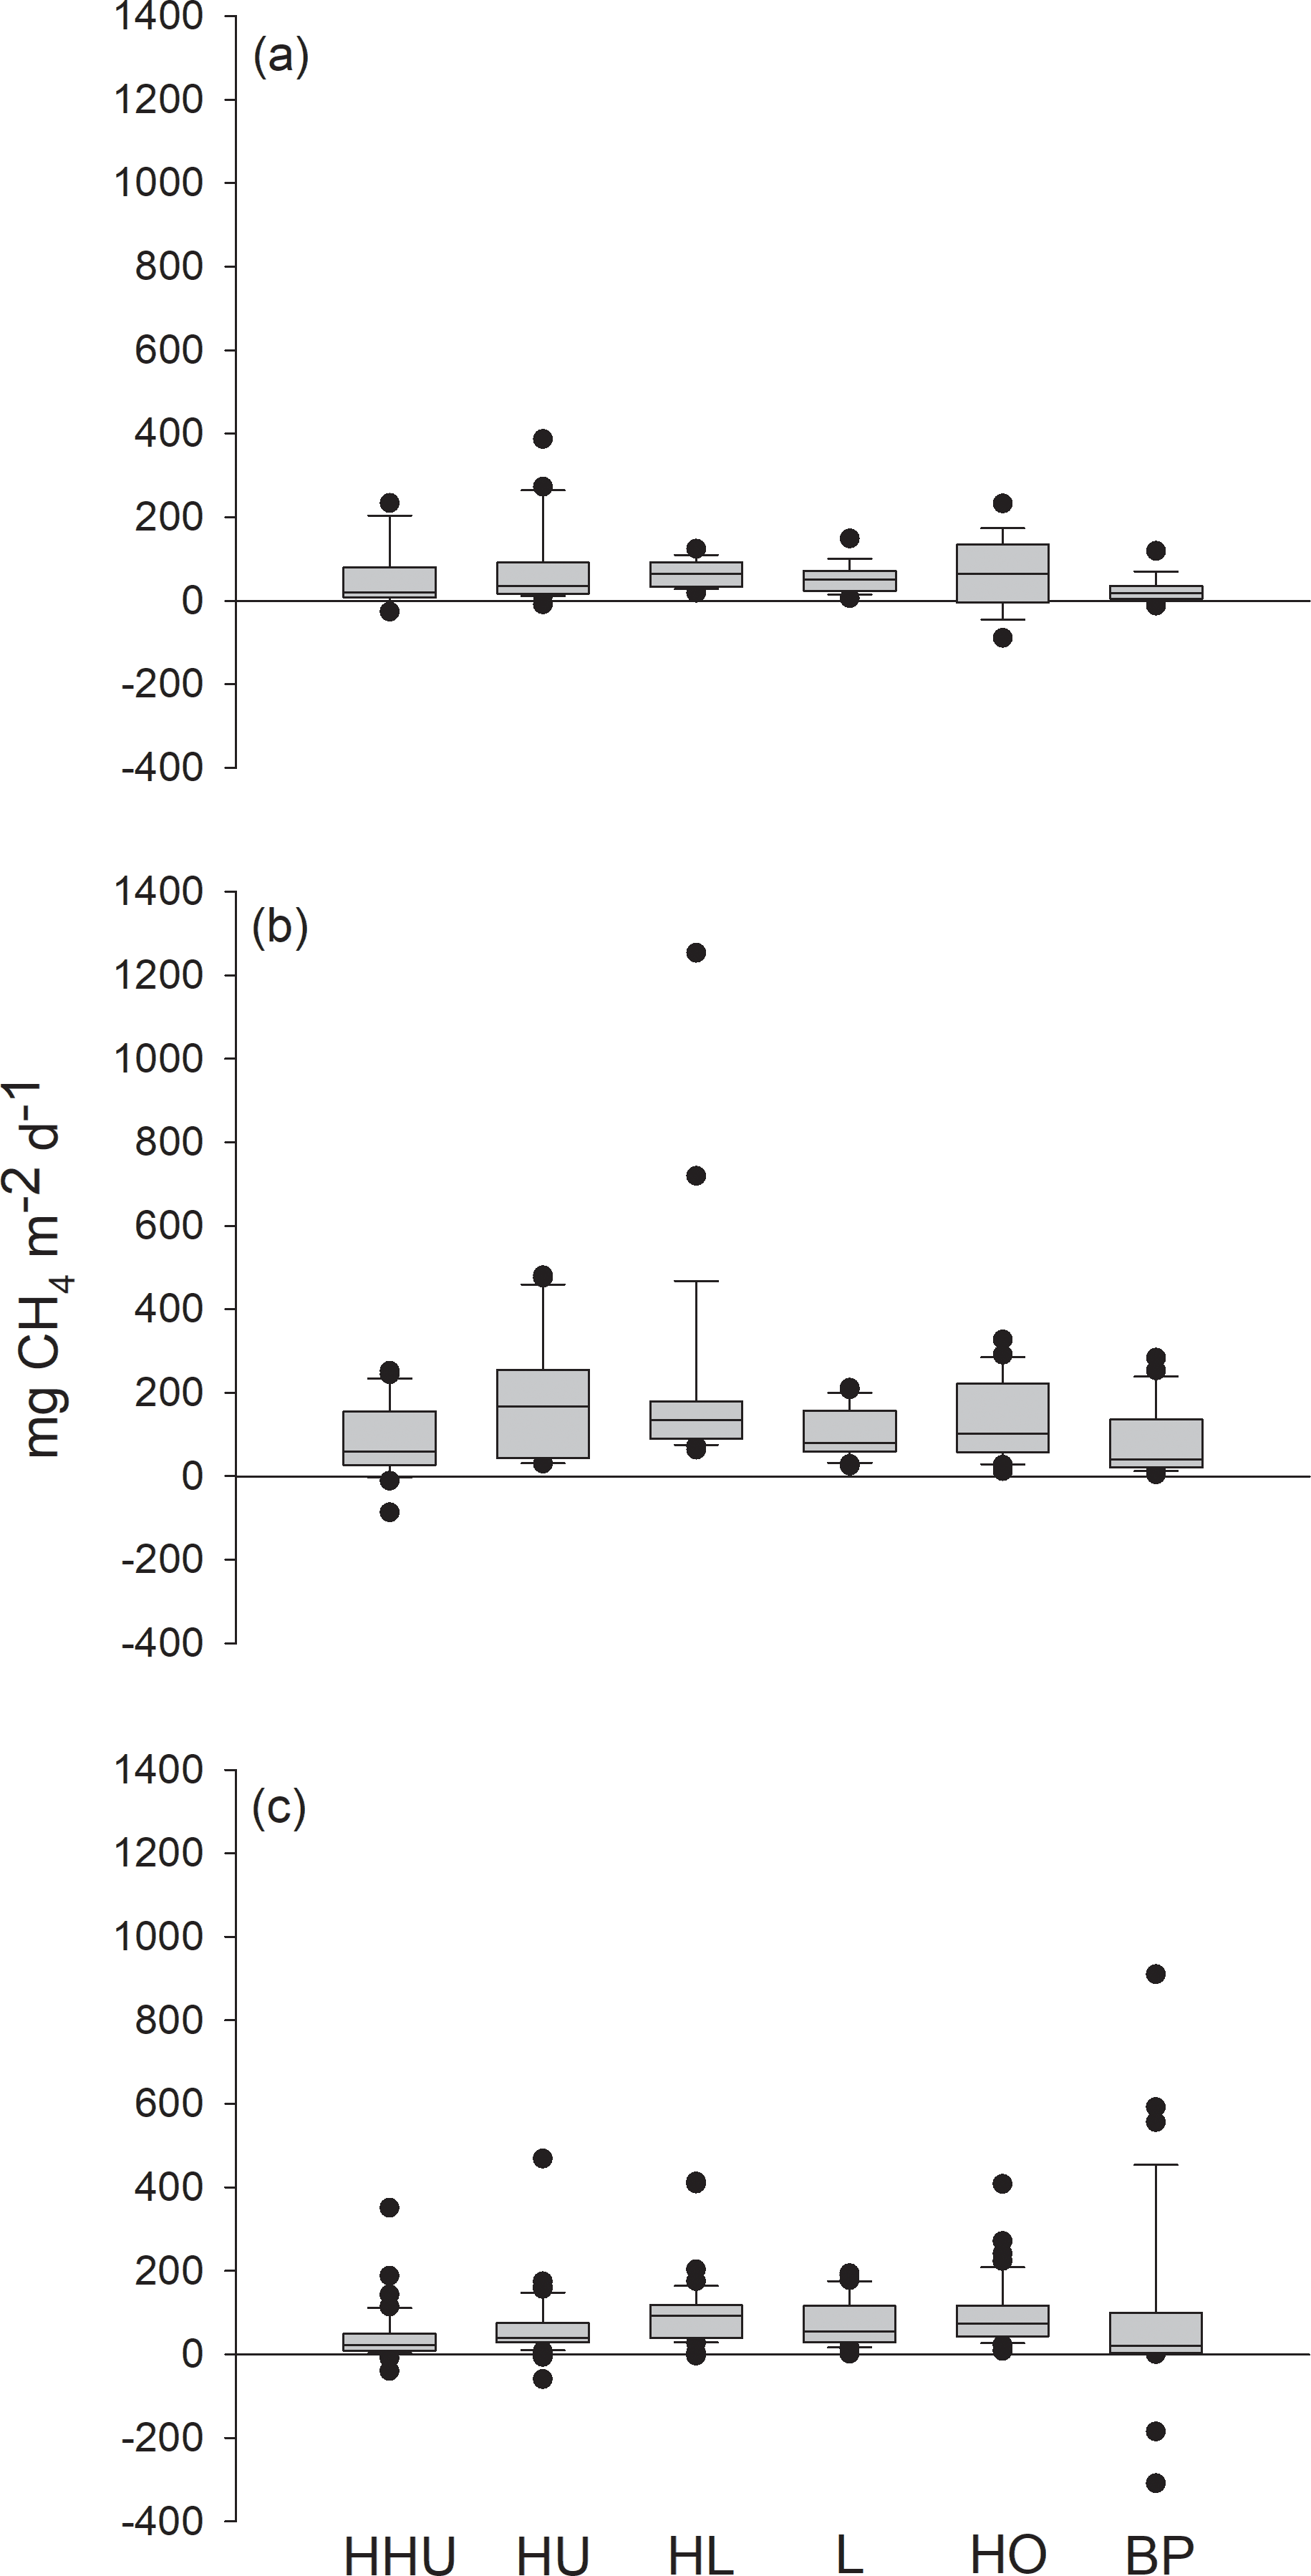
Figure 2Methane fluxes in the Siikaneva bog in the three subsequent years (a) 2012, (b) 2013 and (c) 2014 from six different plant community types: high hummock (HHU), hummock (HU), high lawn (HL), lawn (L), hollow (HO) and bare peat surfaces (BP).
The variation in the methane fluxes did not show any clear pattern among the plant community types (Fig. 2) and the classification did not explain the variation in the methane fluxes when plant community type was first used in the model as the only explanatory variable. The model in which plant community type, year and their interaction were used as explanatory variables indicated a significant difference among the years, but contrary to expectations, no spatial variation related to plant community types common for the three growing seasons was found. However, a significant interaction term between the plant community type and year was detected (DF = 10, 483; p=0.0004), as there were higher methane fluxes from hummocks and high lawns than from high hummocks and bare peat surfaces in 2013, as well as higher fluxes from bare peat surfaces than from high hummocks in 2014. This result in 2013 was surprising, but the differences among the plant community types were small.

Methane emission increased with increasing peat temperature. The peat temperature at the depth of 5 cm explained the variation in methane fluxes better than temperature at the depths of 15 and 30 cm. After the peat temperature at the depth of 5 cm was included in the model, the two other peat temperature variables and the chamber temperature had no effect on prediction. Methane flux was found to increase linearly with aerenchymatous LAI but also with the total LAI, even after the aerenchymatous LAI was included in the model (Fig. 4). WT did not explain variation in methane fluxes, as was found in residual inspection and from the finding that WT was not able to improve the model. Therefore, WT was not included as a fixed predictor in the final model (Table 1). Standard deviation of the constant for the random effect “plot” was 0.05. For the random effect “plot cluster”, standard deviation of the constant was 36.44 and standard deviation of residuals was 95.63, showing that the variation between clusters was smaller than the variation within clusters.
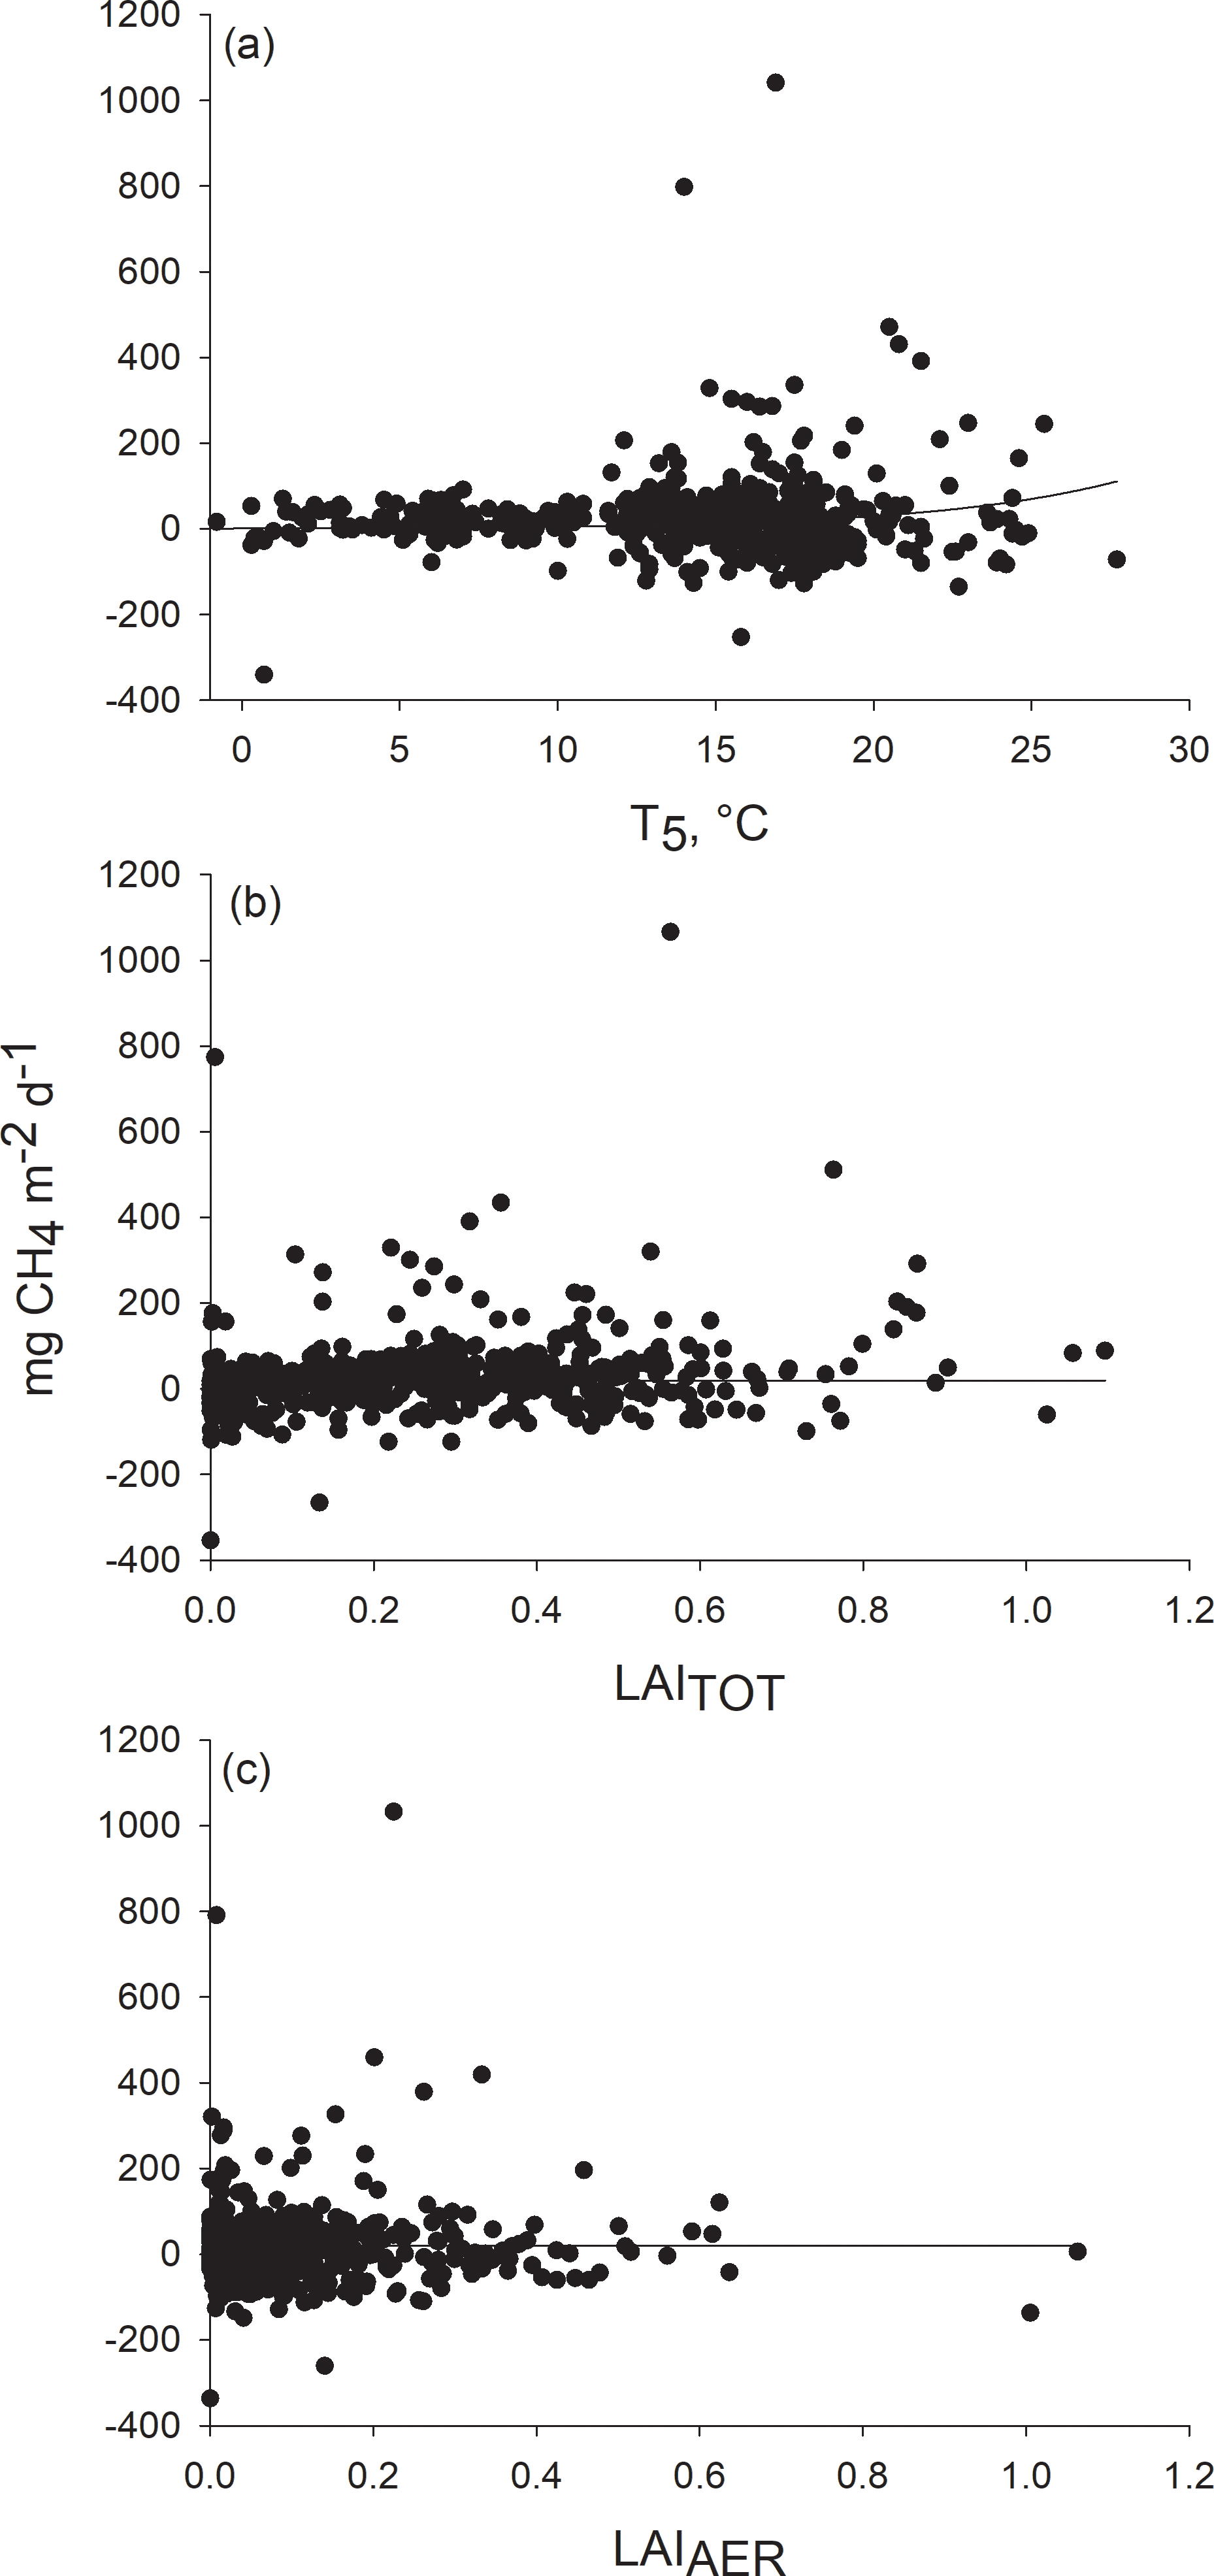
Figure 4Response of methane flux to (a) peat temperature at the depth of 5 cm, (b) total leaf area (LAITOT) and (c) leaf area of aerenchymatous plant species (LAIAER). Methane fluxes measured in 2012–2014 were adjusted to (a) mean LAITOT (0.2661) and LAIAER (0.1016), (b) mean peat temperature at the depth of 5 cm (14 ∘C) and mean LAIAER (0.1016), and (c) mean peat temperature at the depth of 5 cm (14 ∘C) and mean LAITOT (0.2661).
Although the Siikaneva bog is a wet site with a high WT (see, e.g., Moore et al., 2011) (Fig. 1), negative flux values were detected every year across the WT gradient. In 2013, negative fluxes were measured only on high hummocks, whereas in the other years those occurred on all the plant community types, except on lawns (Fig. 2). Fluxes from the atmosphere to the soil ranged from ca. 4 to 309 mg m−2 d−1 (Fig. 2). The highest net methane fluxes towards the soil were measured on bare peat surfaces in 2014 (185 and 309 mg m−2 d−1).
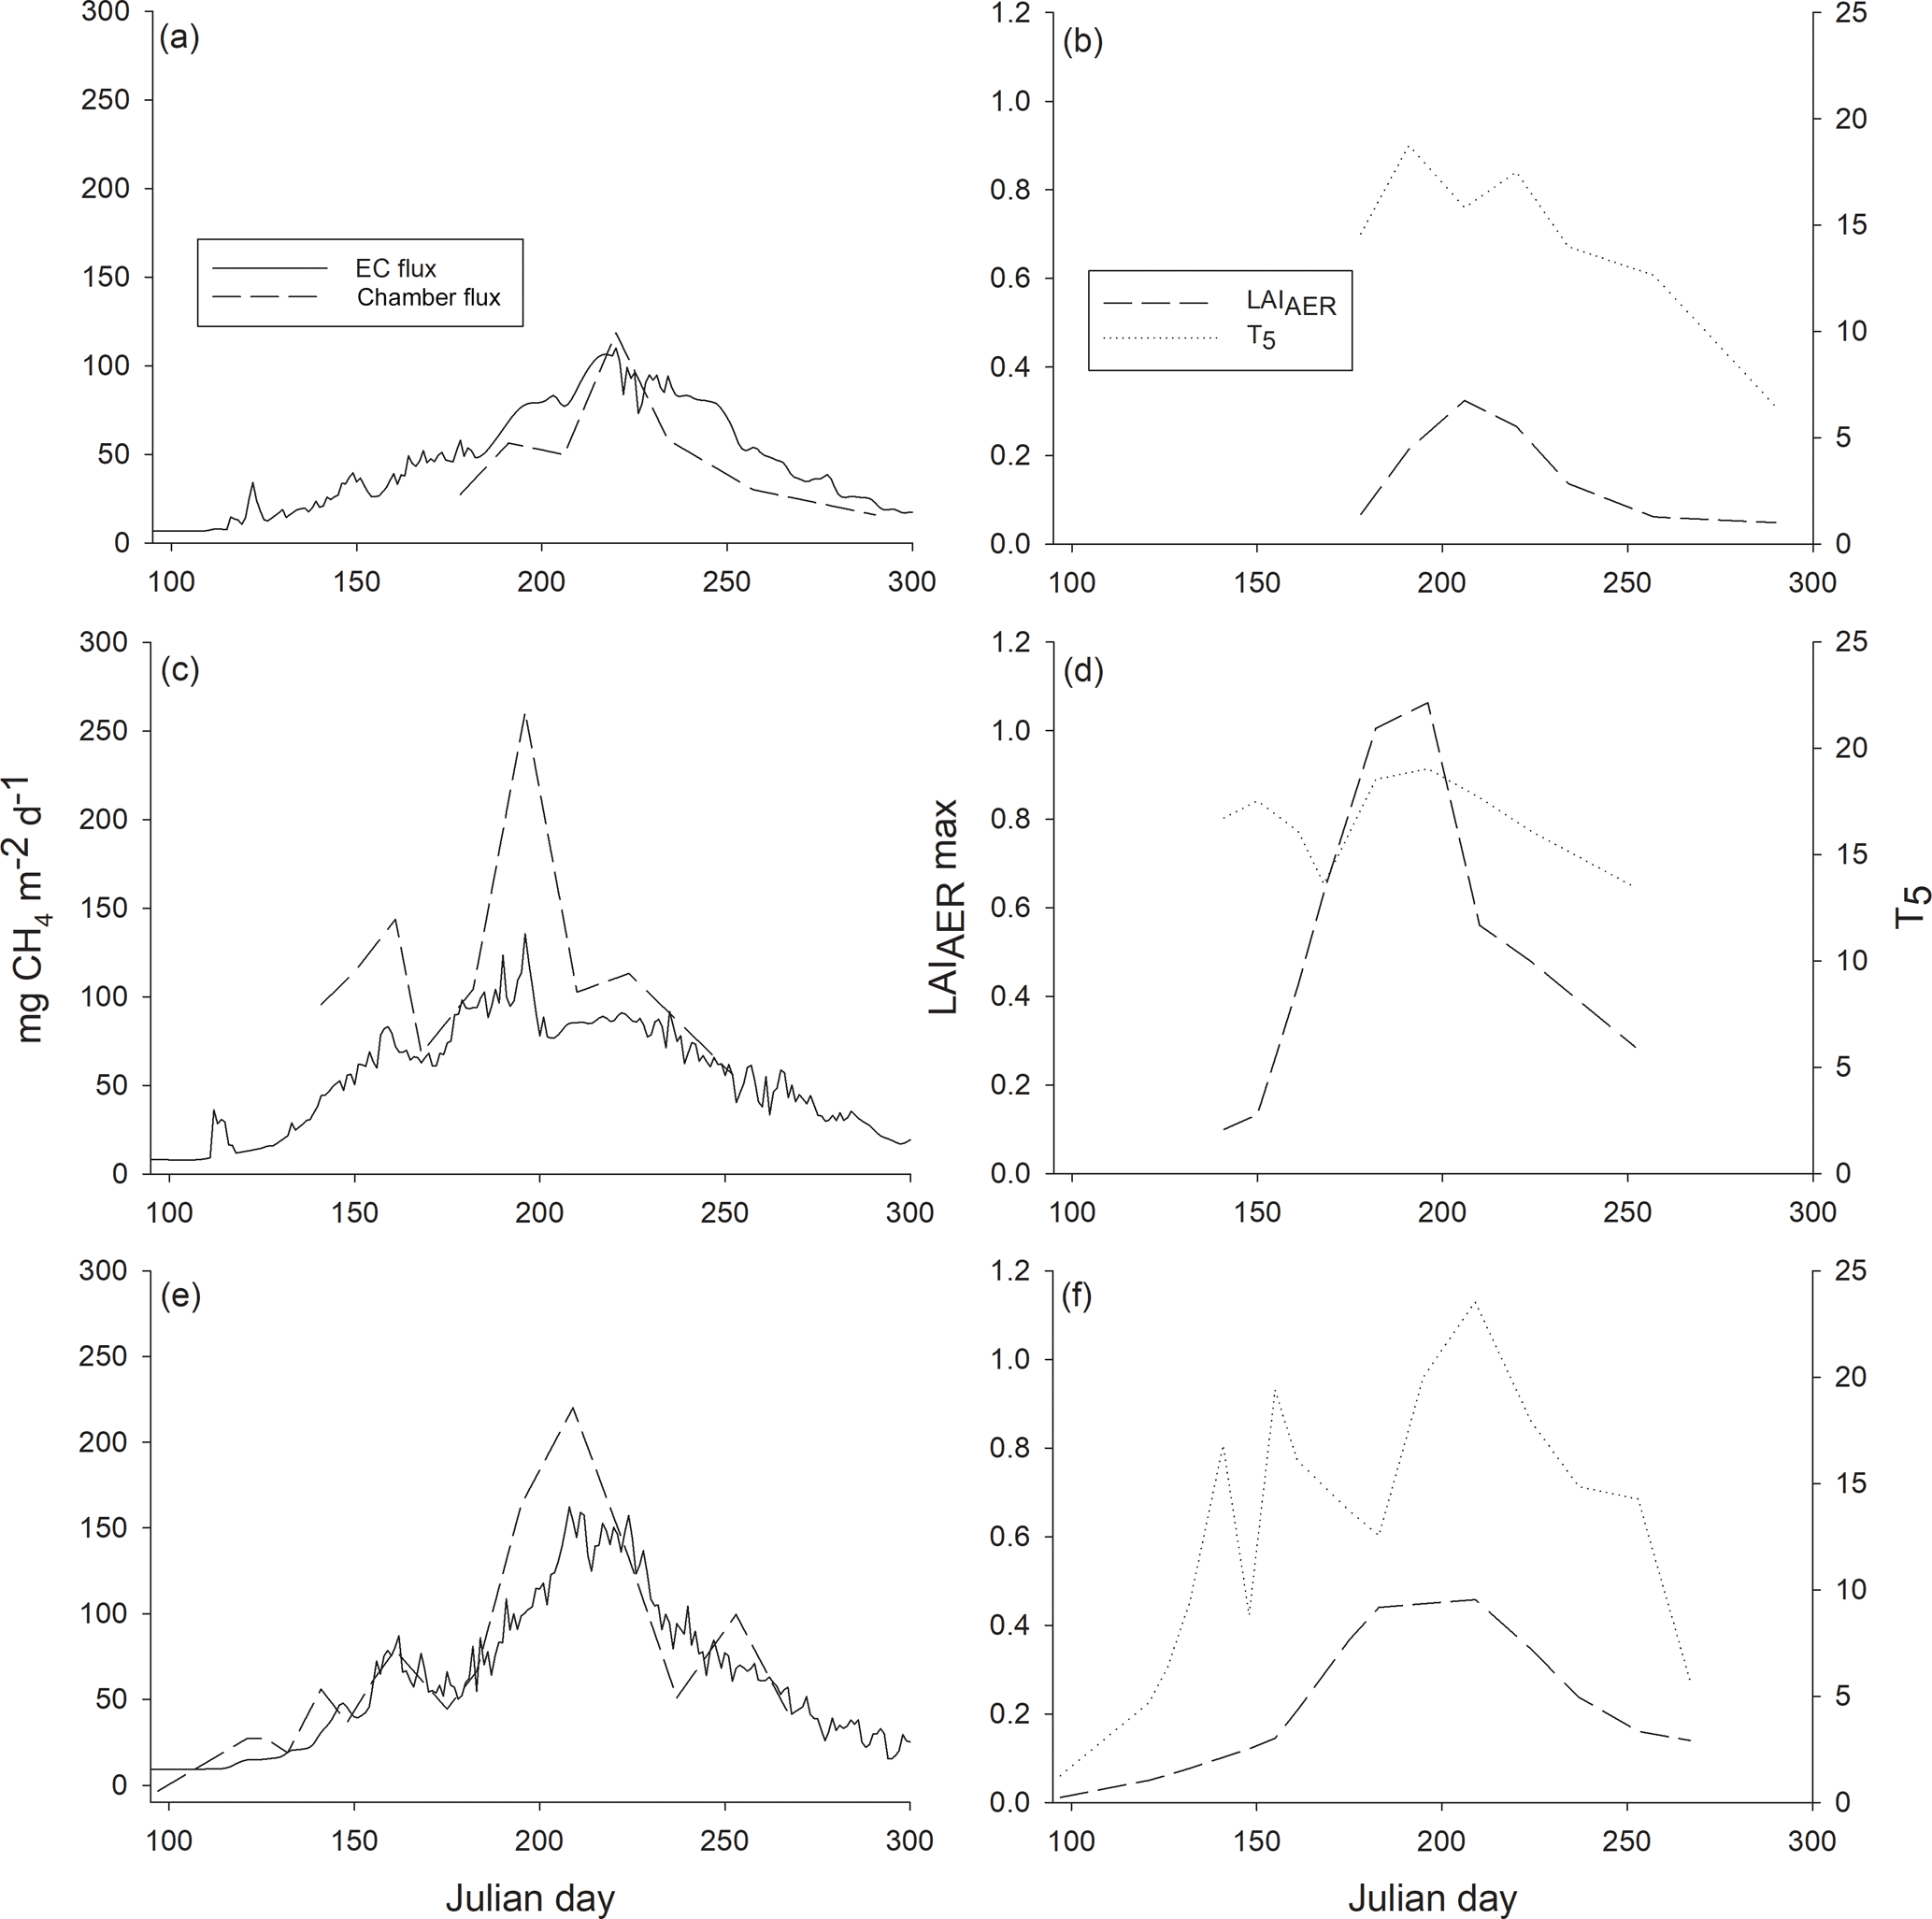
Figure 5Ecosystem-level methane fluxes measured with the eddy covariance (EC) technique and upscaled from chamber measurements (chamber flux) (a, c, e) and maximum leaf area index of aerenchymatous plant species (LAIAER max) and peat temperature at the depth of 5 cm (T5) (b, d, f) over the growing seasons (a–b) 2012, (c–d) 2013 and (e–f) 2014.
As the chamber measurement periods differed among the years, we compared the warmest period with the highest fluxes, namely July and August, on an ecosystem level. As the measured fluxes were similar among the different plant community types, methane flux was interpolated to ecosystem level flux as a mean of all the 18 sample plots. The upscaled monthly methane emissions for the whole ecosystem in July and August were 1.7 and 2.5 g m−2 mo−1 in 2012, 5.4 and 3.1 g m−2 mo−1 in 2013, and 4.9 and 3.5 g m−2 mo−1 in 2014. Cumulative EC methane fluxes for July and August amounted to 2.3 and 2.8 g m−2 mo−1 in 2012, 2.9 and 2.5 g m−2 mo−1 in 2013, and 3.4 and 3.7 g m−2 mo−1 in 2014. Methane emission peaks seen in EC fluxes over the three growing seasons were also found in upscaled chamber fluxes (Fig. 5). The ecosystem-level fluxes followed the seasonal pattern of peat temperature and LAI increasing in spring, with the highest peak in the middle of summer and decreasing towards autumn (Fig. 5).
The methane fluxes measured in this study ranged from −309 to 1254 mg m−2 d−1. When the lowest and the highest 2.5 % of all the fluxes are excluded, the methane fluxes (95 % confidence interval (CI) around the median) measured in this study range from −7 to 387 mg m−2 d−1. They are, on average, of the same magnitude as methane fluxes reported in previous studies of bog ecosystems (Crill et al., 1988; Waddington and Roulet, 1996; MacDonald et al., 1998; Laine et al., 2007). Turetsky et al. (2014) presented the mean methane flux of 15 bog sites as 96 ± 6 mg m−2 d−1, which is a little higher than the mean fluxes in 2012 and 2014 (57 ± 6 and 77 ± 7 mg m−2 d−1) but lower than the mean flux in the warmest year 2013 (131 ± 12 mg m−2 d−1) in this study. Similarly, another review (Wilson et al., 2016) that included wintertime fluxes calculated lower mean methane flux for boreal nutrient-poor sites, 4100 mg m−2 yr−1 with 95 % CI from 50 to 24 600 mg m−2 yr−1.
Contrary to our hypothesis, the measured methane fluxes showed very little spatial variation in a highly heterogenous environment. We expected to find higher methane fluxes from wetter plant community types that have more aerenchymatous vegetation, as high WT reduces the thickness of the aerobic peat layer and consequently methane consumption, while transport through aerenchymatous plants facilitates methane emission from peat to the atmosphere. However, even though the plant community types differed in their WT, LAITOT and LAIAER, they generally had similar methane fluxes. This observation holds for each of the three growing seasons studied, which indicates that the spatial homogeneity of methane fluxes is not an artifact but a characteristic property of the studied bog. The same site has been previously shown to also have spatially homogeneous biomass production and net ecosystem exchange rates, except on bare peat surfaces with little vegetation (Karofeld, 2004; Korrensalo, 2017). We found only small spatial variation, as hummocks and high lawns had a higher methane flux than high hummocks and bare peat surfaces in 2013, and bare peat surfaces had a higher methane flux than high hummocks in 2014. This result found in 2013 was opposite to previous studies that have found a lower methane flux from hummocks than from hollows and lawns (Bubier et al., 1993; Waddington and Roulet, 1996; Saarnio et al., 1997; MacDonald et al., 1998; Frenzel and Karofeld, 2000; Laine et al., 2007). Correspondingly, it is likely that the similarity of the methane fluxes among the plant community types results from underlying microbial processes of methane production and consumption. Methane oxidation partly regulates methane emissions, as potential methane oxidation is usually greater than potential methane production (Segers, 1998). Juottonen et al. (2015) showed that both methane-producing and methane-consuming microbe communities may have strong variation depending on site in boreal bogs. In addition, the effect of plant community type on activity of the microbe communities is not consistent and varies among bogs (Juottonen et al., 2015). Studying the microbial communities and their methane production and oxidation potentials in the Siikaneva bog would be the next step to understand why methane fluxes are so similar over the different plant community types at the site. This could also clarify to what extent the high negative net fluxes are explained by microbial methane oxidation.
As commonly found for biological processes, measured methane emissions increased with increasing peat temperature, similar to previous studies (Kettunen et al., 1996; Daulat and Clymo, 1998; Frenzel and Karofeld, 2000; Laine et al., 2007). As temperature affects the activity of the methane-producing microbes, rising temperature increases methane production until reaching the temperature optimum of the microbes around 20–30 ∘C (Dunfield et al., 1993). Increasing temperature may also enhance the methane transport through aerenchymatous plants (Große, 1996). For example, plant conductance for methane has been shown to correlate positively with soil temperature at the depth of 5 cm in rice plants (Hosono and Nouchi, 1997). As global warming will increase peat temperatures and prolong the growing season in boreal peatlands, more methane can be emitted through aerenchymatous plants. Methane-producing microbial activity may also increase as long as there are anoxic conditions and available substrates. However, in boreal climates warming is predicted to lower the WT, leading to thicker aerobic peat, which potentially creates a higher methane consumption rate layer (Yrjälä et al., 2011). Thus, changes in WT may compensate for the effect of rising temperature under a warmer climate.
As expected, methane flux increased with higher LAIAER. Plants with aerenchymatous tissues facilitate methane emissions by serving as conduits for methane from peat to the atmosphere, which avoids the methane oxidation in the aerobic peat layer. Frenzel and Karofeld (2000) measured the highest methane fluxes from plots with E. vaginatum and S. palustris and showed that methane emission ceased when S. palustris was clipped below the WT. Interestingly, we found that methane flux also increased with LAITOT, even when LAIAER was already taken into account. The effect of LAITOT on methane flux was about one-third higher than the effect of LAIAER. Previously, Marushchak et al. (2016) have found a positive correlation between LAI of vascular plants and methane emissions that explained most of the differences in methane fluxes among the fens and willow stands they measured. The positive effect of LAITOT on methane flux can be explained by the fact that it provides organic substrate for methanogenesis (Chanton et al., 1995). Although higher and drier plant community types had a lower LAIAER compared to wet plant community types, they had a higher LAITOT that provided more substrate material than some wetter plant community types. This can partly explain our result that methane fluxes from drier plant community types were similar to the fluxes measured from wetter plant community type.
Both LAITOT and LAIAER increased in the beginning of the growing season before reaching the maximum around July and subsequently decreasing. A similar pattern could be seen in the measured methane fluxes that were generally higher in the middle of the growing season and had their peak around late July. This indicates that methane fluxes have a seasonal variation following LAITOT and LAIAER. As climate change is predicted to alter WT in peatlands, their vegetation composition will also change, potentially affecting the methane dynamics. Decreasing WT and increasing thickness of the aerobic peat layer will enable non-aerenchymatous plant species, such as shrubs, to grow on previously wetter sites. Because plant-mediated methane transport forms a significant part of the total methane flux (Bhullar et al., 2013), the flux rate can be straightly affected by a change in the abundance of aerenchymatous plant species. At the same time, a longer growing season and increasing primary production and substrate availability are able to increase methane emission. Our results show that it is important to take into account both LAITOT and LAIAER in future models of peatland methane dynamics.
Negative fluxes, i.e., net fluxes from the atmosphere to soil took place on both dry and wet plant community types, and the highest fluxes towards ecosystem were in fact measured from bare peat surfaces. In 2013, negative net flux was measured twice from one sample plot on a high hummock. This high hummock was the only sample plot that showed negative net fluxes each year. In 2012, negative fluxes were recorded from all plant community types except high lawns and lawns, and in 2013 from all plant community types but lawns. Generally, negative fluxes have been associated with higher methane oxidation by methanotrophic microbes than methane production by archaea. Since methanotrophic microbes are aerobic, methane oxidation capacity is higher in drier plant community types that have a thicker aerobic peat layer (Sundh et al., 1995). This is typical for hummocks that can even serve as a sink for atmospheric methane (Frenzel and Karofeld, 2000). Methane oxidation activity is usually the highest near average WT, where methanotrophs have an optimal availability of both methane and oxygen (Sundh et al., 1995; Dedysh, 2002). Therefore, methane consumption also takes place in wetter plant community types that have a WT close to the soil surface when they are not waterlogged. In this study, hollows and bare peat surfaces had a WT mainly below the soil surface at the time they showed negative net fluxes. For example, the two highest negative fluxes (−309 and −185 mg m−2 d−1) were measured from the same bare peat surface of the first plot cluster in spring 2014, while its WT was below the soil surface and partly frozen. These fluxes are high compared to the highest negative fluxes measured previously from a boreal peatland (−48.5 mg m−2 d−1), from a bog ecosystem (−19.5 mg m−2 d−1), from drying peatlands (−15.7 mg m−2 d−1) (Turetsky et al., 2014) and from mineral soil (ca. −4 mg m−2 d−1) (Smith et al., 2000). Negative net fluxes were also measured twice on waterlogged plant community types (hollow and bare peat). This could be explained by plants with aerenchymatous tissues that are typical for these community types and can transport oxygen to their rhizosphere enabling methane consumption. It is also possible that part of the methane oxidation has been anaerobic (Smemo and Yavitt, 2007).
Methane fluxes measured with the chamber technique (chamber fluxes) and upscaled to an ecosystem level for July and August were of the same magnitude as the corresponding monthly fluxes measured with the EC technique (EC fluxes). At the studied bog site, the source area (footprint) of EC measurements includes open pools and thus the EC flux includes methane emitted via ebullition that is excluded from the chamber measurements. Therefore, the EC flux would be expected to be higher than the upscaled chamber flux. However, this was rarely the case, and chamber fluxes were occasionally higher than the EC fluxes. A higher chamber flux than EC flux could be explained by shifting of the EC footprint as it is affected by many factors, such as wind direction (Kormann and Meixner, 2001). While chamber measurements are always conducted on the same fixed sample plots, EC measurement footprint changes and thus its area of open pools that do not have vegetation serving as a conduit for methane varies also. Overall, upscaling the chamber fluxes to the ecosystem level appeared to be successful as it showed the same methane emission peaks that were detected with EC measurements over the three growing seasons. This was seen even in 2012 when only a few chamber measurement campaigns were conducted. In the future, regular measurements with automatic chambers through the growing season would make the upscaling of chamber fluxes more accurate and improve the comparison of the two methods as well as reveal the commonness of abnormalities measured only with chambers.
Highly different plant community types had generally similar methane flux rates over the three studied growing seasons. Methane fluxes increased with increasing peat temperature, LAITOT and LAIAER but were not affected by WT. Therefore, while the relation to LAIAER shows the importance of plant-mediated methane transport from soil to the atmosphere, LAITOT further explains the methane flux rates, likely by indicating substrate availability for methanogenesis. However, LAIAER and LAITOT only partly explain the lack of spatial variation in methane fluxes in the studied bog, which likely results from underlying microbial processes. We also found that negative net fluxes took place occasionally every year and it was detected on both dry and wet plant community types. As both methane-producing and methane-oxidizing microbe communities have been shown to vary depending on the bog, studies of the microbial communities and their methane production and oxidation potentials in the Siikaneva bog are needed to fully understand the methane dynamics of the site. Finally, the chamber fluxes were upscaled to the ecosystem level and compared to the fluxes measured with the EC technique. Upscaling appeared to be successful as the chamber fluxes and the EC fluxes were of the same magnitude, and as the same methane emission peaks could be seen in both fluxes in each growing season. However, upscaled chamber fluxes were often higher than EC fluxes, although they do not include methane ebullition from open pools as EC fluxes do. Regular measurements with automatic chambers would help to explain the differences and improve the comparison of the two methods in the future.
Data are available upon request to the corresponding author.
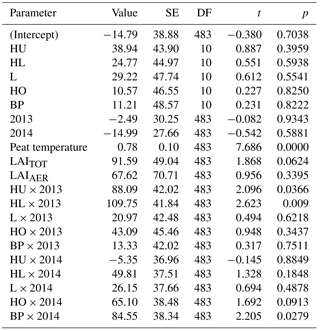
Table A1Parameter estimates of the linear mixed-effects model for methane flux. Estimate value, standard error (SE), degrees of freedom (DF), and test statistics t and p values are given to the fixed predictors of the model as compared to high hummocks in 2012 (intercept). Fixed predictors are plant community type divided into high hummocks, hummocks (HU), high lawns (HL), lawns (L), hollows (HO) and bare peat surfaces (BP), measurement year (2012–2014), interaction of plant community type and year (e.g., HU × 2013), peat temperature at the depth of 5 cm, leaf area index of all vegetation (LAITOT), and leaf area index of aerenchymatous plant species (LAIAER).
EST came up with the idea and design. AK conducted the chamber measurements and processed the chamber and LAI data. Eddy covariance data were collected and analyzed by PA, TV, IM and JR. AK and EM fitted the mixed-effects models. The paper was written by EM, AK and EST and commented on by all the other authors.
The authors declare that they have no conflict of interest.
This work is supported by the faculty of Science and Forestry, University of
Eastern Finland, Academy of Finland (project codes: 287039 and CARB-ARC
285630), the Academy of Finland Centre of Excellence (118780), Academy
Professor projects (1284701 and 1282842), ICOS-Finland (281255) and the
Finnish Cultural Foundation. We would like to thank Hyytiälä Forest
Research Station and its staff for research facilities and Salli Uljas and
Janne Sormunen for the help with the measurements. We would also like to thank
Olli Peltola for the help with eddy covariance data analysis.
Edited by: Paul Stoy
Reviewed by: Tim Moore
and one anonymous referee
Ahti, T., Hämet-Ahti, L., and Jalas, J.: Vegetation zones and their sections in northwestern Europe, Ann. Bot. Fenn., 5, 169–211, 1968.
Alm, J., Shurpali, N. J., Tuittila, E-S., Laurila, T., Maljanen, M., Saarnio, S., and Minkkinen, K.: Methods for determining emission factors for the use of peat and peatlands – flux measurements and modelling, Boreal Environ. Res., 12, 85–100, 2007.
Aubinet, M., Vesala, T., and Papale, D. (Eds.): Eddy covariance: a practical guide to measurement and data analysis, Springer Science & Business Media, 2012.
Aurela, M., Riutta, T., Laurila, T., Tuovinen, J.-P., Vesala, T., Tuittila, E.-S., Rinne, J., Haapanala, S., and Laine, J.: CO2 exchange of a sedge fen in southern Finland – the impact of a drought period, Tellus B, 59, 826–837, 2007.
Bhullar, G. S., Edwards, P. E., and Venteriink, H. O.: Variation in the plant-mediated methane transport and its importance for methane emission from intact wetland peat mesocosm, J. Plant Ecol., 6, 298–304, https://doi.org/10.1093/jpe/rts045, 2013.
Bosse, U. and Frenzel, P.: Activity and Distribution of Methane-Oxidizing Bacteria in Flooded Rice Soil Microcosms and in Rice Plants (Oryza sativa), Appl. Environ. Microbiol., 63, 1199–1207, 1997.
Bubier, J.: The relationship of vegetation to methane emission and hydrochemical gradients in northern peatlands, J. Ecol., 83, 403–420, 1995.
Bubier, J., Costello, A., Moore, T. R., Roulet, N. T., and Savage, K.: Microtopography and methane flux in boreal peatlands, northern Ontario, Canada, Can. J. Botany, 71, 1056–1063, 1993.
Bubier, J., Moore, T., Savage, K., and Crill, P.: A comparison of methane flux in a boreal landscape between a dry and a wet year, Global Biogeochem. Cy., 19, GB1023, https://doi.org/10.1029/2004GB002351, 2005.
Chanton, J. P., Bauer, J. E., Glaser, P. A., Siegel, D. I., Kelley, C. A., Tyler, S. C., Romanowicz, E. H., and Lazrus, A.: Radiocarbon evidence for the substrates supporting methane formation within northern Minnesota peatlands, Geochim. Cosmochim. Ac., 59, 3663–3668, 1995.
Crill, P. M., Bartlett, K. B., Harris, R. C., Gorham, E., Verry, E. S., Sebacher, D. I., Madar, L., and Saner, W.: Methane flux from Minnesota peatlands, Global Biogeochem. Cy., 2, 371–384, 1988.
Daulat, W. E. and Clymo, R. S.: Effects of temperature and water table on the efflux of methane from peatland surface cores, Atmos. Environ., 32, 3207–3218, 1998.
Dedysh, S. N.: Methanotrophic bacteria of acidic Sphagnum peat bogs, Microbiology, 71, 638–650, 2002.
Dise, N. B., Gorham, E., and Verry, E. S.: Environmental factors controlling methane emissions from peatlands in northern Minnesota, J. Geophys. Res., 98, 10583–10594, 1993.
Dunfield, P., Knowles, R., Dumont, R., and Moore, T. R.: Methane production and consumption in temperate and subarctic peat soils: Response to temperature and pH, Soil Biol. Biochem., 25, 321–326, 1993.
Frenzel, P. and Karofeld, E.: CH4 emission from a hollow-ridge complex in a raised bog: The role on CH4 production and oxidation, Biogeochemistry, 51, 91–112, 2000.
Frenzel, P. and Rudolph, J.: Methane emission from a wetland plant: the role of CH4 oxidation in Eriophorum, Plant Soil, 202, 27–32, 1998.
Große, W.: The mechanism of thermal transpiration (= thermal osmosis), Aquat. Bot., 54, 101–110, 1996.
Hanson, R. S. and Hanson, T. E.: Methanotrophic Bacteria, Microbiol. Rev., 60, 439–471, 1996.
Hosono, T. and Nouchi, I.: The dependence of methane transport in rice plants on the root zone temperature, Plant Soil, 191, 233–240, 1997.
IPCC: Climate Change 2014: Synthesis Report, Contribution of Working Groups I, and III to the Fifth Assessment Report of the Intergovernmental Panel on Climate Change, edited by: Core Writing Team, Pachauri, R. K., and Meyer, L. A., IPCC, Geneva, Switzerland, 151 pp., 2014.
Joabsson, A., Christensen, T. R., and Wallén, B.: Vascular plant controls on methane emissions from northern peatforming wetlands, Trends Ecol. Evol., 14, 385–388, 1999.
Juottonen, H., Kotiaho, M., Robinson, D., Merilä, P., Fritze, H., and Tuittila, E.-S.: Microform-related community patterns of methane-cycling microbes in boreal Sphagnum bogs are site specific, FEMS Microbiol. Ecol., 91, fiv094, https://doi.org/10.1093/femsec/fiv094, 2015.
Karofeld, E.: Mud-bottom hollows: exceptional features in carbon-accumulation bogs?, Holocene, 14, 119–124, 2004.
Kettunen, A., Kaitala, V., Alm, J., Silvola, J., Nykänen, H., and Martiakinen, P. J.: Cross-correlation analysis of the dynamics of methane emissions from a boreal peatland, Global Biogeochem. Cy., 10, 457–471, 1996.
Kirschke, S., Bousquet, P., Ciais, P., Saunois, M., Canadell, J. G., Dlugokencky, E. J., Bergamaschi, P., Bergmann, D., Blake, D. R., Bruhwiler, L., Cameron-Smith, P., Castaldi, S., Chevallier, F., Feng, L., Fraser, A., Heimann, M., Hodson, E. L., Houweling, S., Josse, B., Fraser, P. J., Krummel, P. B., Lamarque, J.-F., Langenfelds, R. L., Le Quéré, C., Naik, V., O'Doherty, S., Palmer, P. I., Pison, I., Plummer, D., Poulter, B., Prinn, R. G., Rigby, M., Ringeval, B., Santini, M., Schmidt, M., Shindell, D. T., Simpson, I. J., Spahni, R., Steele, L. P., Strode, S. A., Sudo, K., Szopa, S., van der Werf, G. R., Voulgarakis, A., van Weele, M., Weiss, R. F., Williams, J. E., and Zeng, G.: Three decades of global methane sources and sinks, Nat. Geosci., 6, 813–823, https://doi.org/10.1038/ngeo1955, 2013.
Korrensalo, A.: Behind the stability of boreal bog carbon sink: Compositional and functional variation of vegetation across temporal and spatial scales, PhD thesis, School of Forest Sciences, University of eastern Finland, Finland, 2017.
Kormann, R. and Meixner, F. X.: An analytical footprint model for non-neutral stratification, Bound.-Lay. Meteorol., 99, 207–224, https://doi.org/10.1023/A:1018991015119, 2001.
Kotiaho, M., Fritze, H., Merilä, P., Tuomivirta, T., Väliranta, M., Korhola, A., Karofeld, E., and Tuittila, E.-S.: Actinobacteria community structure in the peat profile of boreal bogs follows a variation in the microtopographical gradient similar to vegetation, Plant Soil, 369, 103–114, 2013.
Larmola, T., Tuittla, E.-S., Tiirola, M., Nykänen, H., Martikainen, P. J., Yrjälä, K., Tuomivirta, T., and Fritze, H.: The role of Sphanum mosses in the methane cycling of a boreal mire, Ecology, 91, 2356–2365, 2010.
Laine, A., Wilson, D., Kiely, G., and Byrne, K. A.: Methane flux dynamics in an Irish lowland blanket bog, Plant Soil, 299, 181–193, https://doi.org/10.1007/s11104-007-9374-6, 2007.
LeMer, J. and Roger, P.: Production, oxidation, emission and consumption of methane by soils: A review, Eur. J. Soil Biol., 37, 25–50, 2001.
Li, T., Raivonen, M., Alekseychik, P., Aurela, M., Lohila, A., Zheng, X., Zhang, Q., Wang, G., Mammarella, I., Rinne, J., Yu, L., Xie, B., Vesala, T. and Zhang, W.: Importance of vegetation classes in modelling CH4 emissions from boreal and subarctic wetlands in Finland, Sci Total Environ., 572, 1111–1122, 2016.
MacDonald, J. A., Fowler, D., Harraves, K. J., Skiba, U., Leith, I. D., and Murray, B.: Methane emission rates from a northern wetland; response to temperature, water table and transport, Atmos. Environ., 32, 3219–3227, 1998.
Mammarella, I., Peltola, O., Nordbo, A., Järvi, L., and Rannik, Ü.: Quantifying the uncertainty of eddy covariance fluxes due to the use of different software packages and combinations of processing steps in two contrasting ecosystems, Atmos. Meas. Tech., 9, 4915–4933, https://doi.org/10.5194/amt-9-4915-2016, 2016.
Marushchak, M. E., Friborg, T., Biasi, C., Herbst, M., Johansson, T., Kiepe, I., Liimatainen, M., Lind, S. E., Martikainen, P. J., Virtanen, T., Soegaard, H., and Shurpali, N. J.: Methane dynamics in the subarctic tundra: combining stable isotope analyses, plot- and ecosystem-scale flux measurements, Biogeosciences, 13, 597–608, https://doi.org/10.5194/bg-13-597-2016, 2016.
Melton, J. R., Wania, R., Hodson, E. L., Poulter, B., Ringeval, B., Spahni, R., Bohn, T., Avis, C. A., Beerling, D. J., Chen, G., Eliseev, A. V., Denisov, S. N., Hopcroft, P. O., Lettenmaier, D. P., Riley, W. J., Singarayer, J. S., Subin, Z. M., Tian, H., Zürcher, S., Brovkin, V., van Bodegom, P. M., Kleinen, T., Yu, Z. C., and Kaplan, J. O.: Present state of global wetland extent and wetland methane modelling: conclusions from a model inter-comparison project (WETCHIMP), Biogeosciences, 10, 753–788, https://doi.org/10.5194/bg-10-753-2013, 2013.
Moore, T. R., De Young, A., Bubier, J. L., Humphreys, E. R., Lafleur, P. M., and Roulet, N. T.: A multi-year record of methane flux at the Mer Bleue bog, southern Canada, Ecosystems, 14, 646–657, https://doi.org/10.1007/s10021-011-9435-9, 2011.
Nisbet, E. G., Dlugokencky, E. J., Manning, M. R., Lowry, D., Fisher, R. E., France, J. L., Michel, S. E., Miller, J. B., White, J. W. C., Vaughn, B., Bousquet, P., Pyle, J. A., Warwick, N. J., Cain, M., Brownlow, R., Zazzeri, G., Lanoisellé, M., Manning, A. C., Glooe, E., Worthy, D. E. J., Brunkle, E.-G., Labuschagne, C., Wolff, E. W., and Ganesan, A. L.: Rising atmospheric methane: 2007–2014 growth and isotopic shift, Global Biogeochem. Cy., 30, 1356–1370, https://doi.org/10.1002/2016GB005406, 2016.
Raghoebarsing, A. A., Smolders, A. J., Schmid, M. C., Rijpstra, W. I. C., Wolters-Arts, M., Derksen, J., Jetten, M. S., Schouten, S., Sinninghe Damsté, J. S., Lamers, L. P., Roelofs, J. G., Op den Camp, H. J., and Strous, M.: Methanotrophic symbionts provide carbon for photosynthesis in peat bogs, Nature, 436, 1153–1156, 2005.
Raivonen, M., Smolander, S., Backman, L., Susiluoto, J., Aalto, T., Markkanen, T., Mäkelä, J., Rinne, J., Peltola, O., Aurela, M., Lohila, A., Tomasic, M., Li, X., Larmola, T., Juutinen, S., Tuittila, E.-S., Heimann, M., Sevanto, S., Kleinen, T., Brovkin, V., and Vesala, T.: HIMMELI v1.0: HelsinkI Model of MEthane buiLd-up and emIssion for peatlands, Geosci. Model Dev., 10, 4665–4691, https://doi.org/10.5194/gmd-10-4665-2017, 2017.
Riley, W. J., Subin, Z. M., Lawrence, D. M., Swenson, S. C., Torn, M. S., Meng, L., Mahowald, N. M., and Hess, P.: Barriers to predicting changes in global terrestrial methane fluxes: analyses using CLM4Me, a methane biogeochemistry model integrated in CESM, Biogeosciences, 8, 1925–1953, https://doi.org/10.5194/bg-8-1925-2011, 2011.
Rinne, J., Riutta, T., Pihlatie, M., Aurela, M., Haapanala, S., Tuovinen, J.-P., Tuittila, E.-S., and Vesala, T.: Annual cycle of methane emission from a boreal fen measured by the eddy covariance technique, Tellus B, 59, 449–457, 2007.
Rinne, J., Tuittila, E-S., Peltola, O., Li, X., Raivonen, M., Alekseychik, P., Haapanala, S., Pihlatie, M., Aurela, M., Mammarella, I., and Vesala, T.: Temporal variation of ecosystem scale methane emission from a boreal fen in relation to temperature, water table position, and carbon dioxide fluxes, Global Biogeochem. Cy., submitted, 2018.
Riutta, T., Laine, J., Aurela, M., Rinne, J., Vesala, T., Laurila, T., Haapanala, S., Pihlatie, M., and Tuittila, E.-S.: Spatal variation in plant community functions regulates carbon gas dynamics in a boreal fen ecosystem, Tellus B, 59, 838–852, 2007.
Rydin, H. and Jeglum, J: The biology of peatlands, 2nd Edn., Oxford University Press Inc., New York, NY, 2013.
Saarnio, S., Alm, J., Silvola, J., Lohila, A., Nykänen, H., and Martikainen, P. J.: Seasonal variation in CH4 emissions and production and oxidation potentials at microsites on an oligotrophic pine fen, Oecologia, 110, 414–422, 1997.
Segers, R.: Methane production and methane consumption: a review of processes underlying wetland methane fluxes, Biogeochemistry, 41, 23–51, 1998.
Smemo, K. A. and Yavitt, J. B.: Evidence for anaerobic CH4 oxidation in freshwater peatlands, Geomicrobiol. J., 24, 583–597, 2007.
Smith, K. A., Dobbie, K. E., Ball, B. C., Bakken, L. R., Sitaula, B. K., Hansen, S., Brumme, R., Borken, W., Christensen, S., Priemé, A., Fowler, D., MacDonald, J. A., Skiba, U., Klemedtsson, L., Kasimir-Klemedtsson, A., Degórska, A., and Orlanski, P.: Oxidation of atmospheric methane in Northern European soils, comparison with other ecosystems, and uncertainties in the gobal terrestrial sink, Glob. Change Biol., 6, 791–803, 2000.
Ström, L., Ekberg, A., Mastepanov, M., and Christensen, T. R.: The effect of vascular plants on carbon turnover and methane emissions from tundra wetland, Glob. Change Biol., 9, 1185–1192, 2003.
Sundh, I., Mikkelä, C., Nilsson, M., and Svensson, B. H.: Potential aerobic methane oxidation in a Spahgnum-dominated peatland – controlling factors and relation to methane emission, Soil Biol. Biochem., 27, 829–837, 1995.
Turetsky, M. R., Kotowska, A., Bubier, J., Dise, N. B., Crill, P., Hornibrook, E. R. C., Minkkinen, K., Moore, T. R., Myers-Smith, I. H., Nykänen, H., Olefeldt, D. Rinne, J., Saarnio, S, Shurpali, N., Tuittila, E.-S., Waddington, J. M., White, J. R., Wickland, K. P., and Wilmking, M.: A synthesis of methane emissions from 71 northern, temperate, and subtropical wetlands, Glob. Change Biol., 20, 2183–2197, https://doi.org/10.1111/gcb.12580, 2014.
Turunen, J., Tomppo, E., Tolonen, K., and Reinikainen, A.: Estimating carbon accumulation rates of undrained mires in Finland – application to boreal and subarctic regions, Holocene, 12, 69–80, 2002.
Waddington, J. M. and Roulet, N. T.: Atmosphere-wetland carbon exchanges: Scale dependency of CO2 and CH4 exchange on the developmental topography of a peatland, Gobal Biogeochem. Cy., 10, 233–245, 1996.
Waddington, J. M., Roulet, N. T., and Swanson, R. V.: Water table control of CH4 emission enhancement by vascular plants in boreal peatlands, J. Geophys. Res., 101, 22775–22785, 1996.
Wilson, D., Alm, J., Riutta, T., Laine, J., Byrne, K. A., Farrell, E. P., and Tuittila, E.-S.: A high resolution green area index for modelling the seasonal dynamics of CO2 exchange in peatland vasvular plant communities, Plant Ecol., 190, 37–51, 2007.
Wilson, D., Blain, D., Couwenberg, J., Evans, C. D., Murdiyarso, D., Page, S. E., Renou-Wilson, F., Rieley, J. O., Sirin, A., Strack, M., and Tuittila, E.-S.: Greenhouse gas emission factors associated with rewetting of organic soils, Mires Peat, 17, 1–28, 2016.
Yrjälä, K., Tuomivirta, T., Juottonen, H., Putkinen, A., Lappi, K., Tuittila, E.-S., Penttilä, T., Minkkinen, K., Laine, J., Peltoniemi, K., and Fritze, H.: CH4 production and oxidation processes in a boreal fen ecosystem after long-term water table drawdown, Glob. Change Biol., 17, 1311–1320, https://doi.org/10.1111/j.1365-2486.2010.02290.x, 2011.
Yu, Z.: Holocene carbon flux histories of the world's peatlands: Global carbon-cycle implications, Holocene, 21, 761–774, 2011.