the Creative Commons Attribution 4.0 License.
the Creative Commons Attribution 4.0 License.
 | 16 Apr 2018
Flux balance modeling to predict bacterial survival during pulsed-activity events
Nicholas A. Jose
Rebecca Lau
Tami L. Swenson
Niels Klitgord
Ferran Garcia-Pichel
Benjamin P. Bowen
Richard Baran
Trent R. Northen
Desert biological soil crusts (BSCs) are cyanobacteria-dominated surface soil microbial communities common to plant interspaces in arid environments. The capability to significantly dampen their metabolism allows them to exist for extended periods in a desiccated dormant state that is highly robust to environmental stresses. However, within minutes of wetting, metabolic functions reboot, maximizing activity during infrequent permissive periods. Microcoleus vaginatus, a primary producer within the crust ecosystem and an early colonizer, initiates crust formation by binding particles in the upper layer of soil via exopolysaccharides, making microbial dominated biological soil crusts highly dependent on the viability of this organism. Previous studies have suggested that biopolymers play a central role in the survival of this organism by powering resuscitation, rapidly forming compatible solutes, and fueling metabolic activity in dark, hydrated conditions. To elucidate the mechanism of this phenomenon and provide a basis for future modeling of BSCs, we developed a manually curated, genome-scale metabolic model of Microcoleus vaginatus (iNJ1153). To validate this model, gas chromatography–mass spectroscopy (GC–MS) and liquid chromatography–mass spectroscopy (LC–MS) were used to characterize the rate of biopolymer accumulation and depletion in in hydrated Microcoleus vaginatus under light and dark conditions. Constraint-based flux balance analysis showed agreement between model predictions and experimental reaction fluxes. A significant amount of consumed carbon and light energy is invested into storage molecules glycogen and polyphosphate, while β-polyhydroxybutyrate may function as a secondary resource. Pseudo-steady-state modeling suggests that glycogen, the primary carbon source with the fastest depletion rate, will be exhausted if M. vaginatus experiences dark wetting events 4 times longer than light wetting events.
- Article
(592 KB) - Full-text XML
-
Supplement
(2869 KB) - BibTeX
- EndNote


Biological soil crusts (BSCs), estimated to contain ∼ 4.9 Pg of terrestrial carbon globally, play critical roles in stabilizing the soil in desert and arid lands that comprise nearly 40 % of planetary dry land masses (Garcia-Pichel et al., 2002; Elbert et al., 2012). BSCs exist in a desiccated and metabolically dormant state that is highly robust to environmental stresses yet are able to rapidly reboot metabolism within minutes of wetting, enabling them to capitalize on infrequent pulsed-activity events that occur upon wetting (Garcia-Pichel et al., 2013). The scale and potential sensitivity of BSCs to temperature and wetting frequency/duration make them particularly relevant to understanding the impact of climate change on soil microbial communities (Grote et al., 2010). Climate models predict alterations in precipitation frequency, intensity, and seasonality, all of which may negatively impact BSCs given that they often exist on the fringe of habitability (Belnap et al., 2004; Johnson et al., 2012). The validity of this concern has been experimentally validated by Reed et al. (2012), who showed a demise of mosses from BSCs when exposed to frequent low-intensity wetting events (Reed et al., 2012).
Pioneering cyanobacteria, such as Microcoleus vaginatus, initiate the formation of BSCs by binding particles in the upper layers of the soil with polysaccharide fibers (Garcia-Pichel and Wojciechowski, 2009). This not only stabilizes the soil but also creates a local environment that is conducive to diverse succession of microbes. However, development of mature crusts from raw soils is a slow process, typically taking many years and presenting many challenges to environmental restoration efforts. The reason for this phenomenon is not well understood, but it has been ascribed to the limited and sporadic periods of growth. Presumably BSC organisms have evolved to capitalize on wetting events that range from several hours to a few days and appear to be poised to immediately restart metabolism (Potts, 1999). Indeed, after re-hydration, BSC microorganisms start respiration within seconds, photosynthesis within minutes, and nitrogen fixation within tens of minutes (Rajeev et al., 2013; Garcia-Pichel and Belnap, 1996). Somewhat paradoxically, isolates of M. vaginatus grown in idealized laboratory conditions are still extremely slow-growing, with doubling times of weeks. This may be a result of ingrained evolutionary pressures that prioritize robustness to various environmental stresses over growth.
Previous studies on the desiccation cycle in M. vaginatus based on transcript analysis in intact BSCs indicated multiple metabolic states (Rajeev et al., 2013). These states are associated with genes responsible for biopolymer formation and depletion, such as cyanophycin, glycogen, β-polyhydroxybutyrate (PHB), and polyphosphate. Wetting of dry crusts results in increased expression in genes for sugar transporters and biopolymer biosynthesis. During the diel cycle, the expression patterns of biopolymer-associated genes suggest that depletion occurs at night and accumulation during the day. Drying resulted in elevated expression of genes involved in biopolymer metabolism, including glycogen breakdown. Together these observations reinforce the centrality of osmolytes and biopolymers in the M. vaginatus desiccation cycle. Consistent with this view, our recent D2O labeling study of wetted M. vaginatus and Synechococcus sp. 7002 revealed that in light, low-growth, constant osmotic conditions many osmolytes are rapidly turned over (Baran et al., 2017). To gain insights into this process, stable isotope probing experiments were performed using the osmolyte glucosylglycerol, showing that Synechococcus sp. 7002 rapidly converts this osmolyte into glycogen. This suggests a mechanism where high fluxes of compatible solutes are maintained through conversion to biopolymers. This high flux would enable cells to survive rapid desiccation by simultaneously turning off compatible solute polymerization and mobilizing biopolymer hydrolysis. Therefore, we expect wet-up and dry-down metabolism in the dark likely have fixed biopolymer costs, whereas metabolism in the light enables replenishment of biopolymer reserves. Given the importance of biopolymers to M. vaginatus, the balance of costs vs. accumulation could be used to predict net carbon accumulation and survival of M. vaginatus during various climate scenarios.
Here, as a first step towards this goal, we constructed a genome-scale metabolic network of M. vaginatus (iNJ1153). To our knowledge, this is the first for a terrestrial cyanobacterium and describes a flux balance approach that accounts for biopolymer accumulation using polyphosphate, PHB, and glycogen, important storage molecules and osmolytes (Diamond et al., 2015). We use this model in combination with direct measurements of biopolymer concentrations and carbon dioxide flux to examine dark and light flux distributions in M. vaginatus. We interpret these results using a simple cost–benefit framework. The “cost” is biopolymer depletion in the dark, and the “benefit” is biopolymer accumulation in the light.
2.1 Chemicals
Potassium phosphate (dibasic) (CAS 7758-11-4), crotonic acid (CAS 107-93-7), D-glucose (CAS 50-99-7), 98 % methoxyamine hydrochloride (CAS 593-56-6), pyridine (CAS 110-86-1), fatty acid methyl ester (FAME) standards (kit ME10-1KT), and liquid chromatography–mass spectroscopy (LC–MS)-grade acetonitrile (CAS 75-05-8) were from Sigma (St. Louis, MO). LC–MS grade water was from J. T. Baker. N-methyl-N-(trimethylsilyl)trifluoroacetamide (MSFTA) containing 1 % trimethylchlorosilane was from Restek (Bellafonte, PA, USA).
2.2 Culturing
M. vaginatus PCC 9802 was grown at 22 ∘C in minimal Jaworski's media with a 12 h light–12 h dark cycle. Light was provided by a 6500 K, 2000 lm fluorescent source. Light flux measured at the level of the petri dishes was approximately 4.5–10 µmol photons m−2 s−1 photosynthetically active radiation. Because different culture containers were used between respiration experiments and biopolymer experiments, they possessed different photon fluxes (measured in µmol g−1 h−1), which is reflected in Table 3. This is accounted for in simulations. A minimum of three replicates grown at identical conditions were used for each experiment. To determine the biopolymer flux rates, three samples were taken at the start and end of 12 h growing at a given condition.
While the radiation incident on the crust surface can be orders of magnitude higher than the one we used, it is subject to intense multiple-scattering losses, so that only 1 % of incident radiation remains a couple of millimeters down into the soil. M. vaginatus makes a living within this steep light gradient, usually in the subsurface, coming up to the surface only when light intensity is very moderate (in morning, overcast conditions). It has a “shade plant” phenotype possessing low photosynthesis saturation intensity, heavy complement of light-harvesting pigments, and no sunscreen pigments. Isolate M. vaginatus does not grow in liquid media under desert light levels that we used previously to mimic more natural conditions in the lab with intact biocrusts (∼ 600 µmol m−2 s−1) (Rajeev et al., 2013). The growth conditions used are close to the growth optimum of M. vaginatus in liquid media.
2.3 Respiration measurement
Carbon dioxide flux was determined from three biological replicates in both light and dark conditions with a Micro-Oxymax Respirometer (Columbus Instruments) in sealed 100 mL mason jars. The system monitored carbon dioxide accumulation across all samples over a 48 h period with a time resolution of approximately 48 min per measurement. These values are scaled to moles per gram ( µmol g−1) biomass.
2.4 Biopolymer extraction
Immediately following respiration measurements, triplicate aliquots of M. vaginatus cultures (1 mL) from both light and dark conditions were removed and transferred to a pre-weighed 1.5 mL tube. Cells were pelleted by centrifuging at 3000 xg for 3 min, resuspended in 1 mL methanol, and homogenized with sterile metal ball bearings using a Mini-Beadbeater (BioSpec Products). Samples were centrifuged at 3000 xg for 3 min, and supernatant was discarded. Homogenization and centrifugation were repeated for a total of three times. The remaining biomass was dried in a Savant SpeedVac SPD111V, and dry weight was measured. To allow efficient hydrolysis of polyphosphate, glycogen, and PHB, 500 µL of 2 M HCl was added and the mixture heated at 95 ∘C for 1 h while shaking (1400 rpm) (Dephilippis et al., 1992; Eixler et al., 2005; Ernst and Boger, 1985). Samples were then dried and resuspended in 1 mL methanol by vortexing and bath sonication (VWR Symphony). Samples were cleared of any remaining cells by centrifuging at 3000 xg for 3 min and filtered through 0.22 µm centrifugal filters (Nanosep MF, Pall Corporation, Port Washington, NY, USA).
2.5 GC–MS measurement of glucose and phosphate
An aliquot of the hydrolyzed biopolymers (10 % of the original biomass) was dried for gas chromatography–mass spectroscopy (GC–MS) analysis of glucose and phosphate. To each dried sample, 10 µL of 40 mg mL−1 methoxyamine hydrochloride in pyridine was added. The mixture was shaken for 1.5 h at 30 ∘C and 1400 rpm. FAME standards (1 µL) (Swenson et al., 2015) in 90 µL MSTFA were added to each sample and standard. The mixture was shaken at 37 ∘C for 30 min and 1400 rpm. The contents were then transferred to glass vials with micro-inserts and submitted to GC–MS analysis.
GC–MS data were acquired on an Agilent 7890 gas chromatograph (Agilent Technologies, Santa Clara, CA, USA) and an Agilent 5977 single quadrupole as described in Swenson et al. (2015). In summary, derivatized samples were injected (0.2–0.5 µL) using a Gerstel automatic liner exchange MPS system (Gerstel, Muehlheim, Germany) into a Gerstel Cooled Injection System (CIS4) operated in splitless mode. Analytes were separated using a Rxi-5Sil MS capillary column (Restek, Bellefonte, PA, USA) with a 0.25 mm ID Integra-Guard under an initial oven temperature of 60 ∘C, held for 1 min, and then ramped at 10 ∘C min−1 to 310 ∘C, with a total runtime of 36 min. Glucose was detected as two peaks at 17.5 and 17.7 min, and phosphate at 10.0 min. Glucose and phosphate were quantified based on a five-point standard curve (in triplicate) from 0.5 to 10 µg. All measurements fell within the linear range. Calculated concentrations were then normalized to original dried biomass.
2.6 Quantification of PHB via LC–MS measurement of crotonic acid
Polyhydroxybutyrate breaks down to form crotonic acid in strongly acidic environments. The quantity of crotonic acid formed is used to calculate PHB quantity. Crotonic acid was measured by LC–MS/MS on an Agilent 1290 UHPLC (Agilent Technologies, Santa Clara, CA, USA) coupled to a Q Exactive mass spectrometer (Thermo Scientific, San Jose, CA, USA). A sample volume of 2 µL was injected onto a Kinetix XB-C18 column (150 mm × 2.6 µ × 100 Å) (Phenomenex, Torrance, CA, USA) and eluted over a linear gradient of water + 0.1 % formic acid (FA) (A) to acetonitrile + 0.1 % FA (B), with an initial 1 min hold at 100 % A, a 7 min gradient to 100 % B, followed by a 1.5 min hold at 100 % B, and a 2 min re-equilibration at 100 % A. Crotonic acid was eluted at 2.2 min and was detected in positive mode. Crotonic acid was quantified based on a five-point standard curve (in triplicate) using the parent ion (87.0447 m∕z in positive mode), and all sample measurements fell within the linear range (10 ng mL−1 to 100 µg mL−1). Crotonic acid concentrations were normalized to original dry biomass weights.
2.7 Metabolic network reconstruction and refinement
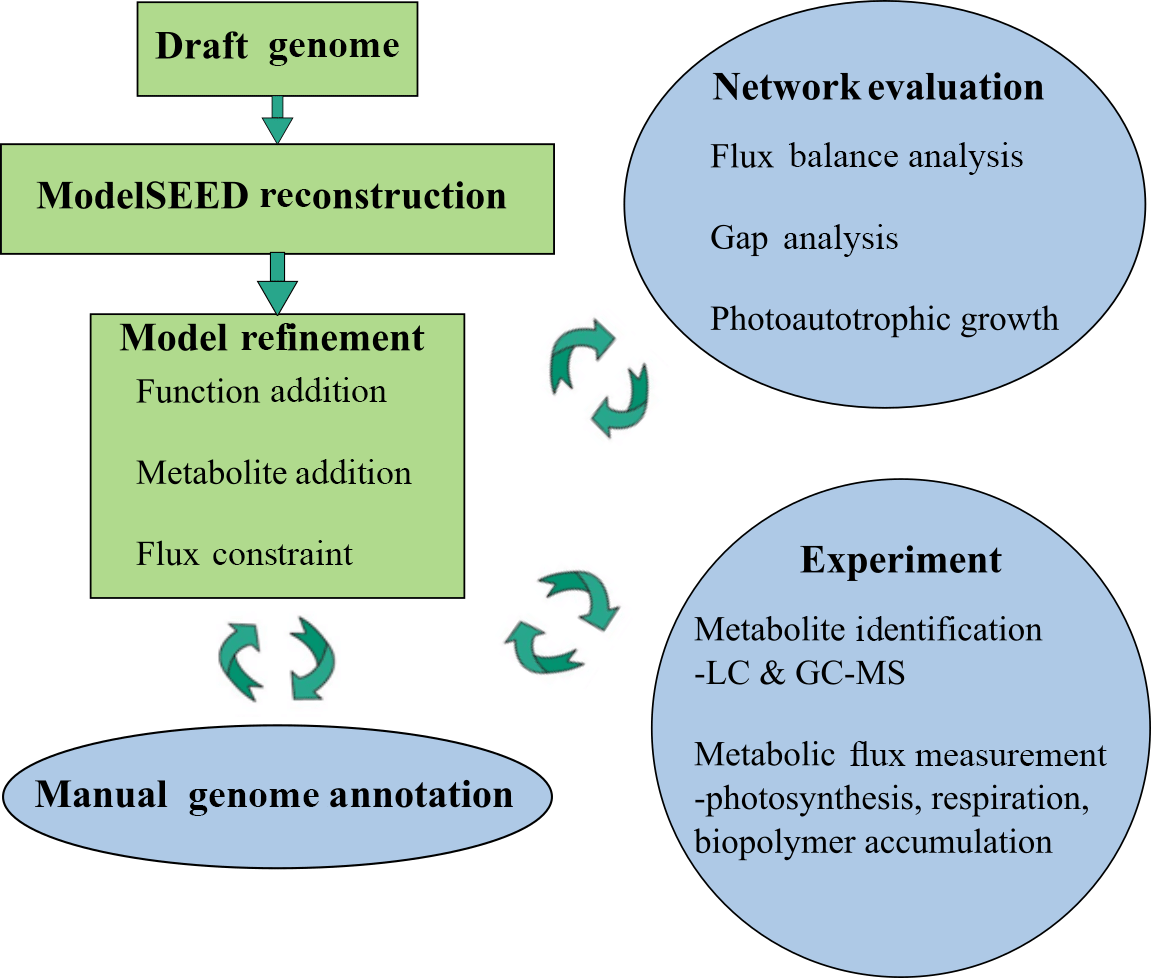
The genome of M. vaginatus PCC 9802 was first sequenced by the US Department of Energy Joint Genome Institute. The draft reconstruction of this genome was obtained using ModelSEED, a pipeline for generating metabolic models from genome data (Henry et al., 2010). The genome was automatically annotated using RAST (Rapid Annotation using Subsystems Technology; Overbeek et al., 2014). A reaction network complete with gene–protein–reaction (GPR) relationships predicted values for Gibbs free energy of reaction, and an organism-specific biomass reaction including non-universal cofactors such as wall components and lipids was generated. This network was also converted into its mathematical form, allowing quantitative systems biology analysis via flux balance analysis (FBA).
Automatic annotations were further refined through manual annotation. This was necessary because automated modeling databases occasionally do not contain strong homologues for a certain function and thus fail to assign it to the genome via simple homology search algorithms. Extensive manual refinement was performed to examine RAST-predicted functions and GPR relations, and to fill gaps in metabolic pathways. Detailed manual annotation reports can be seen in the Supplement. This was performed using literature review, flux balance analysis, and the databases KEGG and MetaCyc (Kanehisa and Goto, 2000; Karp et al., 2002). Flux balance analysis was run using the COBRA Toolbox (Becker et al., 2007). The refinement process is illustrated in Fig. 1.
M. vaginatus' biochemical capabilities are relatively unstudied in the literature to date; hence, strong sequence homology to related bacterial enzymes and to previous literature findings were used as criteria in assigning functionalities, gene–protein–reaction relationships, and reaction directionalities. Although photosynthetic genes were identified via automatic annotation, photosynthetic reactions were not present in the generated mathematical model. To reconcile this, and given the fact that only a few models exist for cyanobacterial oxygenic photosynthesis, the model of photosynthesis developed for the cyanobacterium Cyanothece sp. ATCC 51 142 (iCce806) was adopted (Vu et al., 2012). In addition, to enable the analysis of biopolymer fluxes, reactions for the synthesis and metabolism of biopolymers polyphosphate, glycogen, and PHB, which were not given within the automated annotation, were added after being found in the genome through extensive manual annotation.
Constraint-based flux balance analysis is a common approach that abstracts the metabolic capabilities of an organism as a set of linear equations and then uses constraint-based linear optimization to predict the pathway usage and flux through a network (Orth et al., 2010). In this study, a pseudo-steady-state approximation Eq. (1) is used, where the accumulation of each metabolite is zero over time. S is the stoichiometric matrix of equations, and v is the vector of flux values. The flux is constrained by upper and lower bound vectors, LB and UB, in Eq. (2).
Model metabolites were separated into the extracellular and cytosol (inner) domains. Sink reactions simulated transport between the environment and extracellular domains, while exchange reactions mediated transport between extracellular and cytosol domains.
Despite initial manual curation efforts, the model was initially unable to simulate photoautotrophic growth using minimal media using the biomass reaction from ModelSEED. Minimal media is defined as only containing essential trace minerals, oxygen, carbon dioxide, light, sulphate, and nitrate/ammonium. Missing precursors – mainly, thiamine phosphate, L-cysteine, and spermidine – were found to prevent growth. Using the databases KEGG and MetaCyc, possible reactions that allow M. vaginatus to produce biomass were identified in a process known as “gap filling”. Once found, these functions were cross-checked to determine if they were predicted with lower homology in M. vaginatus' genome and common in related cyanobacteria. If these criteria were not fulfilled but the function was absolutely required, the reaction was still incorporated in the model with a low confidence rating.
2.8 Modeling biopolymer accumulation and utilization
Automated model generation typically does not assume that biopolymers act as resources that may accumulate or deplete. Modeling biopolymer depletion was accomplished by treating biopolymer subunits as bounded external resources. In other words, instead of the typical accumulation reaction, “pool” reactions, Eqs. (3) and (5), were created for each biopolymer, where A is a side reactant, B is a side product, X is a polymer subunit, and Xn is a polymer with length n. “Nothing” is not a physical term but a mathematical way to describe resource accumulation in a steady-state simulation. The sink reaction, Eq. (5), then allows the model to undergo steady-state simulation. The fluxes through the sink reactions from FBA simulation represent rates of accumulation or depletion.
To predict respiration in the dark, the light flux rate was set to 0 and biopolymer flux rates were constrained by the experimentally determined values. To set the flux of an individual reaction, Eq. (6) was used, where UBi and LBi are the upper and lower constraints of reaction i, respectively, and is the measured flux.
Modeling biopolymer accumulation under light was accomplished by including biopolymer requirements within the biomass objective function, according to their stasis levels as measured during experiments. Biopolymer accumulation rates can then be calculated using the simulated biomass accumulation rate.
The ability of the constructed network to quantitatively predict metabolic activity was assessed by comparing the calculated rates of respiration in the dark and CO2 uptake and biopolymer accumulation in the light, with the experimentally determined values.
To address the issue of biological variation across samples and their impact on model predictions, sensitivity analysis was performed on the flux constraints. Biopolymer constraints were varied within 2 standard deviations of the average measured value, light flux levels were varied within ±1 µmol photons m−2 s−1, and biomass levels were varied within ±2 mg. A total of 30 619 different simulations were performed in this analysis.
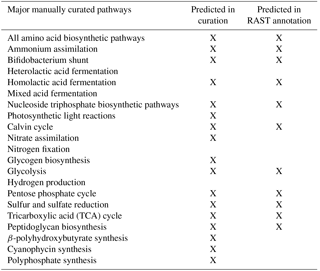
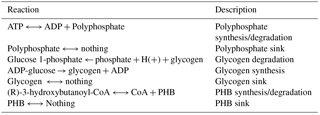
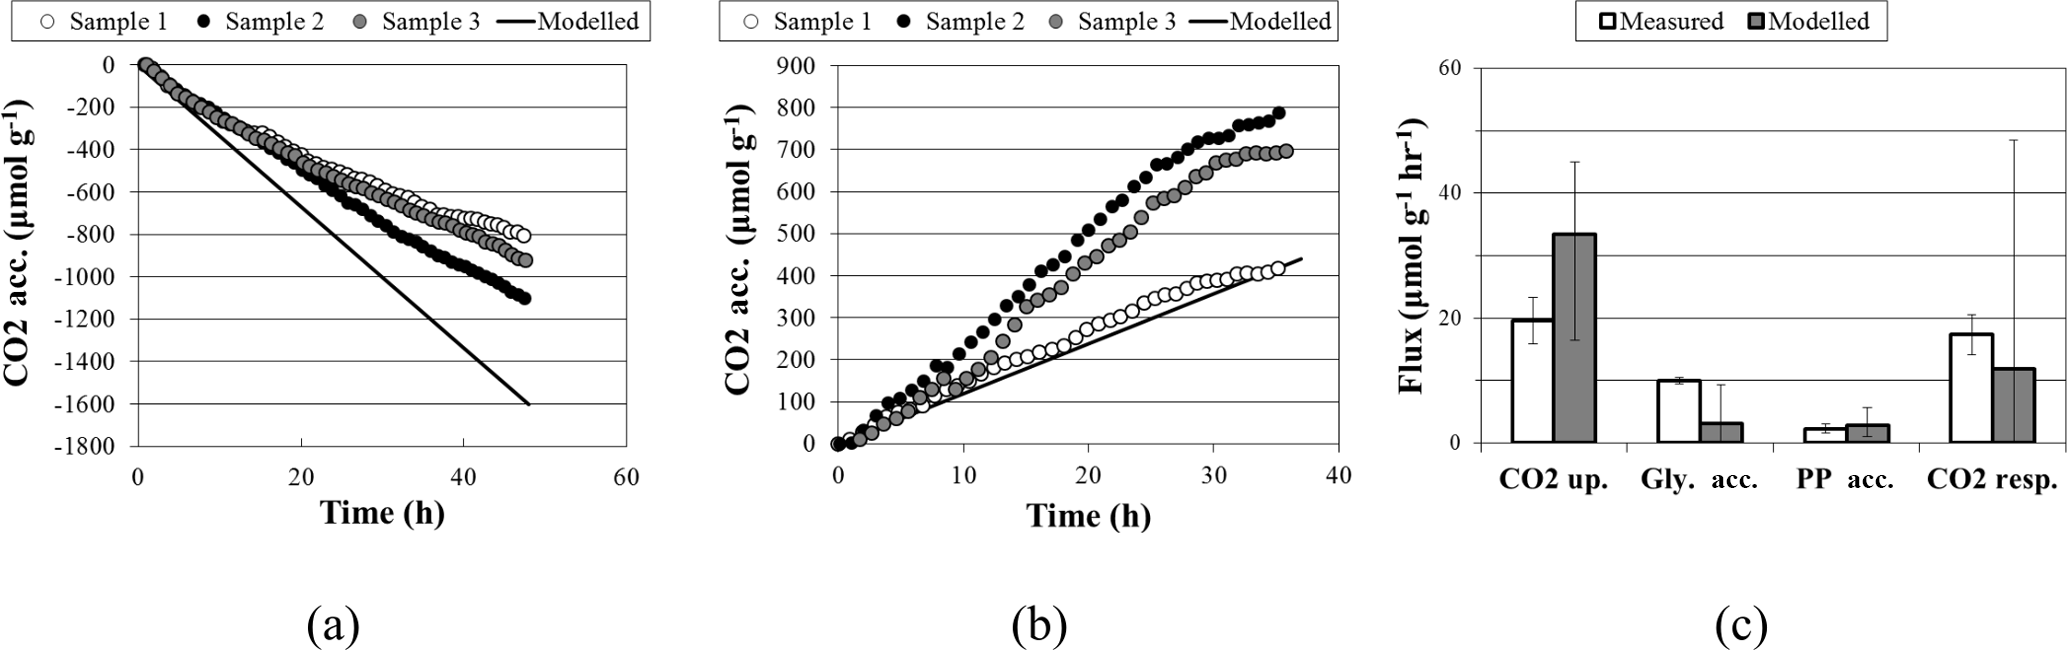
Figure 2Comparisons of experimental and modeled CO2 accumulation (a) in the light, where a negative value indicates uptake, and (b) in the dark, where a positive value indicates respiration. Biopolymer and CO2 flux rates are compared in (c), where error bars on modeled flux rates are the upper and lower bounds determined through sensitivity analysis; error bars on measured flux rates are standard deviations.
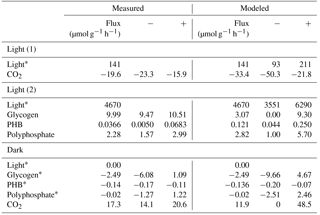
Table 3Experimental and modeled flux values over light and dark conditions. Constraint fluxes are noted with a “*”. Negative and positive CO2 fluxes represent uptake and respiration, respectively, while negative and positive biopolymer flux rates represent depletion and accumulation, respectively. Measured “−” and “+” refer to the standard deviation. Modeled “−” and “+” refer to the upper and lower values obtained from sensitivity analysis. In modeled constraint reactions for light, “−” and “+” represent the assumed deviation that is input into sensitivity analysis.
3.1 Metabolic network reconstruction
The resulting reconstructed genome-scale model possesses 858 genes, 1153 reactions, and 1078 metabolites. A total of 146 reactions were added from manual curation and gap analysis, and for biopolymer simulations of polyphosphate, glycogen, and PHB. For a comparison of the automated and curated annotation, see Table 1. Added biopolymer reactions are shown in Table 2. To view the model in Excel and Matlab structure formats, see the Supplement.
3.2 Experimentally determined fluxes during photosynthesis and respiration
In both light and dark conditions, carbon dioxide concentrations varied linearly with time, supporting the assumption that M. vaginatus' metabolism behaves like a quasi-steady-state system over 12 h time cycles. It also indicates that using experimental data to validate and constrain a steady-state flux balance model is reasonable on a 12 h timescale.
With a light flux of approximately 141 µmol mg−1 h−1, M. vaginatus accumulated carbon dioxide at approximately 19.6 ± 3.7 µmol g−1 biomass h−1. Without light, it released carbon dioxide at 17.3 ± 3.2 µmol g−1 biomass h−1. The biopolymer flux rates in the dark and under a light flux of 4670 µmol mg−1 h−1 are reported in Table 3.
Interestingly, the rate of glycogen depletion in the dark is approximately a quarter of the rate of accumulation in the light. For these conditions, M. vaginatus has a conservative metabolism, accumulating much more biopolymer in a day than is necessary for the following night. We can speculate that biopolymer reserves may be accumulated such that sufficient quantities may drive physiological responses such as cell division, making it akin to the yeast metabolic cycling observed for low-glucose conditions (Yin et al., 2003). Since this photoautotroph is limited by nutrients other than carbon, they are likely routing flux from intracellular biopolymers into exopolysaccharide (EPS) formation, consistent with our earlier results showing export of a diversity of oligosaccharides (Baran et al., 2013).
Gene expression studies showed increased expression of hydrolytic enzymes (e.g., glycogen debranching enzyme) during dry-down, which may provide a mechanism to rapidly produce compatible solutes (Baran et al., 2017). These are presumably excreted during wet-up, resulting in an additional metabolic cost for wet-up that must be recouped through biopolymer accumulation. Thus, the observed high flux to glycogen may provide multiple physiological adaptations that are critical to survival in arid climates.
Polyphosphate possesses an uptake rate like that of the glycogen but is only depleted 1 % as fast in the dark, indicating that this resource is conserved quite well. Polyphosphate is likely an important biopolymer for M. vaginatus across many different stressed conditions, as a reservoir of phosphate for later growth, through so-called “luxury uptake” and storage when growth is halted by some other factor, and as a reservoir of energy in the form of phosphate–phosphate bonds under conditions of abundant energy generation or a lack of conditions to use it for growth or homeostasis. This importance of polyphosphate has been identified in gene expression studies (Rajeev et al., 2013).
PHB accumulates at roughly 0.4 % of the rate that glycogen accumulates, indicating that it is not the primary polymer used for storage. Interestingly, its depletion rate is higher than its accumulation rate. It may be used as a secondary storage polymer or for other metabolic activities that do not require a constant energy source, such as replication. The study of PHB over multiple light–dark and dry–wet cycles may be crucial to understanding the role that PHB plays.
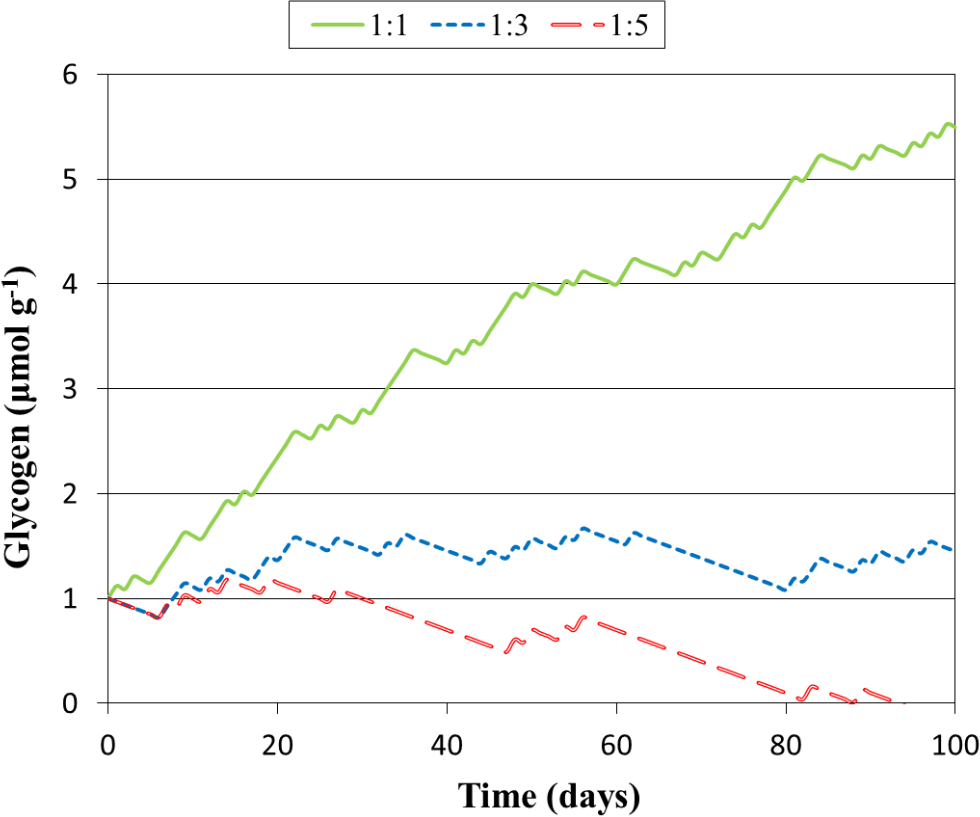
Figure 3Predicted glycogen depletion over 1 month under three climate scenarios, where the ratio of light : dark wetting events is 1:1, 1:3, and 1:5.
Although each bacterial sample was taken from the same culture, variation in metabolic activity existed regardless of dry biomass normalization. This may be attributed to differing amounts of polysaccharide sheaths surrounding active cells (Bertocchi et al., 1990). The large amounts of exopolysaccharides in M. vaginatus (Hokputsa et al., 2003), which are considered distinct in chemical form and function from glycogen, may also interfere with GC–MS quantification of storage glucose. A complete study of EPS composition in M. vaginatus has yet to be completed in the authors' existing knowledge. Therefore, we have limited our analysis to using these measurements as the upper and lower bounds on metabolic fluxes. Improvements in methods for quantifying glucose levels from glycogen without EPS bias will be important for further model refinement, as would be extension of the model to include EPS.
3.3 Simulation results and experimental validation
A comparison of simulation and experimental CO2 accumulation rates can be seen in Fig. 2. In the dark, the predicted average carbon dioxide flux was 11.9 µmol day−1 g−1, close to the measured value of 17.3 ± 3.2 µmol day−1 g−1. In the light, the predicted average carbon dioxide uptake flux using the measured light flux as a constraint was −33.4 µmol g−1 biomass h−1, compared to the experimental value of −19.6 ± 3.7. Sensitivity analysis showed that the variation in biopolymer flux measurements, illumination, and biomass could account for this variation.
Accumulation rates of polyphosphate and PHB fall within the range predicted by simulation. The average simulated glycogen accumulation is lower than the experimentally measured glycogen accumulation rate, though sensitivity analysis may account for this. Another possible reason for this lower estimate could be that M. vaginatus biomass requirements are less than the requirements given by ModelSEED. To verify the biomass composition, a more thorough investigation may be conducted.
From the modeled fluxes, we estimate that, under constant wetted conditions, M. vaginatus routes 2 % of its carbon uptake to the generation of storage glycogen and PHB, while the rest may be attributed to cell maintenance, biomass growth, or other unknown storage molecules. Although this value is expected to change depending on growth conditions, it provides a basis for future studies. Further analysis of the network fluxes may prove useful in investigating potentially important pathways in M. vaginatus' metabolism. For such studies, flux information from light and dark experiments across all reactions has been included in the Supplement.
Compared to the modeled metabolism of Synechocystis sp. PCC 6803 (Knoop et al., 2013), CO2 uptake and glycogen accumulation per photon of light are 2.5 and 5.7 times faster, respectively. Glycogen depletion in the dark is only 36 % faster. The accelerated accumulation of carbon indicates that M. vaginatus may have a more efficient pathway for converting CO2 to biopolymer storage, which is a possible reason for its role as a pioneer organism in BSCs.
3.4 Survivability during pulsed-activity events
BSCs are vulnerable to alteration in wetting events (Reed et al., 2012). This coupled with predictions of alterations in rainfall and increasing aridity in biocrust habitats (Maestre et al., 2015a, b) makes it important to develop tools to predict survival under changing rainfall and light intensity. Towards this goal, we can use the results from our model as a crude estimate of the “health” of M. vaginatus based on biopolymer levels. Certainly, this is overly simplistic and there are many other factors that impact “health”. However, given the central role of biopolymers in surviving in the dark and producing compatible solutes, their levels are expected to be critical to survival. Because glycogen, the primary carbon biopolymer, is consumed at about 25 % of the accumulation rate, if wetting events in the dark are more than 4 times as long as wetting events in the light, M. vaginatus' health will begin to deteriorate. For lower light intensities than the ones used here, the rate of glycogen accumulation would decrease, reducing M. vaginatus resistance to persistent dark wetting events.
The model constructed here may be applied to more complicated, dynamic events, such as those with varied intensities of light and wetting time. To illustrate how this might be achieved, we simulated glycogen depletion over 100 days for various wetting frequencies in the light and dark, seen in Fig. 3, where for each day there is a 12 h wetting event either in the light or in the dark. When the ratio of light : dark events of 1:3, glycogen storage is maintained, whereas at 1:1 accumulation is rapid. At 1:5 glycogen stores become depleted after 94 days. This simulation may be improved in future studies by considering dynamic responses to light variation as well as the drying and re-wetting of soil.
We have generated the first reconstruction of the M. vaginatus metabolic network through careful manual annotation and inclusion of biopolymer reactions known to be important to cyanobacterial physiology. We use the model within a conceptual framework of “costs” and “benefits” associated with specific environmental changes. More precisely, we observed that dark reactions have a cost which is recouped during light reactions. Using these experimental constraints on biopolymer and light fluxes, the model generates CO2 and biopolymer fluxes that match experimental results. Using this model and laboratory experiments, we found that, in light, 2 % of carbon uptake is routed to storage polymers via photosynthesis. In the dark, glycogen functions as the primary carbon source. Using depletion and accumulation rates, we then predicted the gradual depletion of M. vaginatus' biopolymer reserves if dark wetting events were 4 times as long as light wetting events. This work lays the foundation for additional research on this important desert microbe and its microbial community. Since M. vaginatus is a keystone organism in many biocrusts, its loss would have a major impact on the community. Yet it is important to emphasize that these laboratory experiments are a vast extrapolation from native conditions, and future work will focus on extending these models to more realistic environmental conditions. Additional steady-state experiments using different growth conditions found in desert environments – varying lighting intensities, levels of moisture, soil compositions, and other microbial interactions – have the potential to refine the model and identify key metabolic states related to resuscitation and dormancy to more accurately model environmental responses.
Underlying research data are given in the Supplement.
| Abbreviations | |
|---|---|
| BSC | Biological soil crust |
| EPS | Exopolysaccharides |
| FBA | Flux balance analysis |
| GC–MS | Gas chromatography–mass spectrometry |
| GPR | Gene–protein–reaction |
| Acc | Accumulation |
| Resp | Respiration |
| Chemicals | |
| ADP | Adenosine diphosphate |
| ATP | Adenosine triphosphate |
| FAME | Fatty acid methyl ester |
| Gly | Glycogen |
| MeOX | Methoxyamine hydrochloride |
| MSFTA | N-methyl-N-(trimethylsilyl)trifluoroacetamide |
| PHB | β-polyhydroxybutyrate |
| PP | Polyphosphate |
| Notation | |
| A | Generic side reactant |
| B | Generic side product |
| LBi | Flux lower bound of reaction i |
| LB | Vector of flux lower bound values |
| P | Phosphate level |
| S | Stoichiometry matrix of reaction equations |
| UBi | Flux upper bound of reaction i |
| UB | Vector of flux upper bound values |
| Experimentally determined flux value of reaction i | |
| v | Vector of flux values |
| X | Polymer precursor |
| Xn | Polymer subunit |
| Units | |
| Å | ångström |
| g | gram |
| h | hour |
| L | liter |
| m | meter |
| M | moles per liter |
| mg | milligram |
| min | minute |
| mL | milliliter |
| mm | millimeter |
| mmol | millimole |
| mol | mole |
| rpm | rotations per minute |
| s | second |
| xg | g-force (×9.81 m s−2) |
| µg | microgram |
| µL | microliter |
| µm | micrometer |
| µmol | micromole |
The supplement related to this article is available online at: https://doi.org/10.5194/bg-15-2219-2018-supplement.
The authors declare that they have no conflict of interest.
We acknowledge the contribution of Seth Axen, Rahul Basu, Kriti Sondhi, and
David Soendjojo with their assistance annotating the M. vaginatus genome. This work was
supported in part by previous breakthroughs obtained through the Laboratory
Directed Research and Development Program of the Lawrence Berkeley National
Laboratory supported by the US Department of Energy Office of Science and
by the US Department of Energy Office of Science's Biological and
Environmental Research Early Career Research Program (award to Trent R. Northen), both under
contract number DE-AC02-05CH11231.
Edited by: Kees Jan van Groenigen
Reviewed by: two anonymous referees
Baran, R., Ivanova, N. N., Jose, N., Garcia-Pichel, F., Kyrpides, N. C., Gugger, M., and Northen, T. R.: Functional genomics of novel secondary metabolites from diverse cyanobacteria using untargeted metabolomics, Mar. Drugs., 11, 3617–3631, https://doi.org/10.3390/md11103617, 2013.
Baran, R., Lau, R., Bowen, B. P., Diamond, S., Jose, N., Garcia-Pichel, F., and Northen, T. R.: Extensive Turnover of Compatible Solutes in Cyanobacteria Revealed by Deuterium Oxide (D2O) Stable Isotope Probing, ACS Chem. Biol., 12, 674–681, 10.1021/acschembio.6b00890, 2017.
Becker, S. A., Feist, A. M., Mo, M. L., Hannum, G., Palsson, B. O., and Herrgard, M. J.: Quantitative prediction of cellular metabolism with constraint-based models: the COBRA Toolbox, Nat. Protoc., 2, 727–738, https://doi.org/10.1038/nprot.2007.99, 2007.
Belnap, J., Phillips, S. L., and Miller, M. E.: Response of desert biological soil crusts to alterations in precipitation frequency, Oecologia, 141, 306–316, https://doi.org/10.1007/s00442-003-1438-6, 2004.
Bertocchi, C., Navarini, L., Cesaro, A., and Anastasio, M.: Polysaccharides from cyanobacteria 1, Carbohyd. Polym., 12, 127–153, https://doi.org/10.1016/0144-8617(90)90015-k, 1990.
Dephilippis, R., Sili, C., and Vincenzini, M.: Glycogen and poly-beta-hydroxybutyrate synthesis in spirulina-maxima, J. Gen. Microbiol., 138, 1623–1628, 1992.
Diamond, S., Jun, D., Rubin, B. E., and Golden, S. S.: The circadian oscillator in Synechococcus elongatus controls metabolite partitioning during diurnal growth, P. Natl. Acad. Sci. USA, 112, 1916–1925, https://doi.org/10.1073/pnas.1504576112, 2015.
Eixler, S., Selig, U., and Karsten, U.: Extraction and detection methods for polyphosphate storage in autotrophic planktonic organisms, Hydrobiologia, 533, 135–143, https://doi.org/10.1007/s10750-004-2406-9, 2005.
Elbert, W., Weber, B., Burrows, S., Steinkamp, J., Budel, B., Andreae, M. O., and Poschl, U.: Contribution of cryptogamic covers to the global cycles of carbon and nitrogen, Nat. Geosci., 5, 459–462, 2012.
Ernst, A. and Boger, P.: Glycogen accumulation and the induction of nitrogenase activity in the heterocyst-forming cyanobacterium Anabaena-variabilis, J. Gen. Microbiol., 131, 3147–3153, 1985.
Garcia-Pichel, F. and Belnap, J.: Microenvironments and microscale productivity of cyanobacterial desert crusts, J. Phycol., 32, 774–782, 1996.
Garcia-Pichel, F. and Wojciechowski, M. F.: The Evolution of a Capacity to Build Supra-Cellular Ropes Enabled Filamentous Cyanobacteria to Colonize Highly Erodible Substrates, Plos One, 4, https://doi.org/10.1371/journal.pone.0007801, 2009.
Garcia-Pichel, F., Belnap, J., Neuer, S., and Schanz, F.: Estimates of global cyanobacterial biomass and its distribution, Arch. Hydrobiol. Suppl. Alg Studies, 213–228, 2002.
Garcia-Pichel, F., Loza, V., Marusenko, Y., Mateo, P., and Potrafka, R. M.: Temperature Drives the Continental-Scale Distribution of Key Microbes in Topsoil Communities, Science, 340, 1574–1577, https://doi.org/10.1126/science.1236404, 2013.
Grote, E. E., Belnap, J., Housman, D. C., and Sparks, J. P.: Carbon exchange in biological soil crust communities under differential temperatures and soil water contents: implications for global change, Glob. Change Biol., 16, 2763–2774, https://doi.org/10.1111/j.1365-2486.2010.02201.x, 2010.
Henry, C. S., DeJongh, M., Best, A. A., Frybarger, P. M., Linsay, B., and Stevens, R. L.: High-throughput generation, optimization and analysis of genome-scale metabolic models, Nat. Biotechnol., 28, 977–982, https://doi.org/10.1038/nbt.1672, 2010.
Hokputsa, S., Hu, C. X., Paulsen, B. S., and Harding, S. E.: A physico-chemical comparative study on extracellular carbohydrate polymers from five desert algae, Carbohyd. Polym., 54, 27–32, https://doi.org/10.1016/s0144-8617(03)00136-x, 2003.
Johnson, S. L., Kuske, C. R., Carney, T. D., Housman, D. C., Gallegos-Graves, L. V., and Belnap, J.: Increased temperature and altered summer precipitation have differential effects on biological soil crusts in a dryland ecosystem, Glob. Change Biol., 18, 2583–2593, https://doi.org/10.1111/j.1365-2486.2012.02709.x, 2012.
Kanehisa, M. and Goto, S.: KEGG: kyoto encyclopedia of genes and genomes, Nucleic Acids Res., 28, 27–30, 2000.
Karp, P. D., Riley, M., Paley, S. M., and Pellegrini-Toole, A.: The MetaCyc Database, Nucleic Acids Res., 30, 59–61, 2002.
Knoop, H., Gründel, M., Zilliges, Y., Lehmann, R., Hoffmann, S., Lockau, W., and Steuer, R.: Flux Balance Analysis of Cyanobacterial Metabolism: The Metabolic Network of Synechocystis sp. PCC 6803, PLOS Comput. Biol., 9, e1003081, https://doi.org/10.1371/journal.pcbi.1003081, 2013.
Maestre, F. T., Delgado-Baquerizo, M., Jeffries, T. C., Eldridge, D. J., Ochoa, V., Gozalo, B., Quero, J. L., Garcia-Gomez, M., Gallardo, A., Ulrich, W., Bowker, M. A., Arredondo, T., Barraza-Zepeda, C., Bran, D., Florentino, A., Gaitan, J., Gutierrez, J. R., Huber-Sannwald, E., Jankju, M., Mau, R. L., Miriti, M., Naseri, K., Ospina, A., Stavi, I., Wang, D., Woods, N. N., Yuan, X., Zaady, E., and Singh, B. K.: Increasing aridity reduces soil microbial diversity and abundance in global drylands, P. Natl. Acad. Sci. USA, 112, 15684–15689, https://doi.org/10.1073/pnas.1516684112, 2015a.
Maestre, F. T., Escolar, C., Bardgett, R. D., Dungait, J. A., Gozalo, B., and Ochoa, V.: Warming reduces the cover and diversity of biocrust-forming mosses and lichens, and increases the physiological stress of soil microbial communities in a semi-arid Pinus halepensis plantation, Front. Microbiol., 6, p. 865, https://doi.org/10.3389/fmicb.2015.00865, 2015b.
Orth, J. D., Thiele, I., and Palsson, B. O.: What is flux balance analysis?, Nat. Biotechnol., 28, 245–248, https://doi.org/10.1038/nbt.1614, 2010.
Overbeek, R., Olson, R., Pusch, G. D., Olsen, G. J., Davis, J. J., Disz, T., Edwards, R. A., Gerdes, S., Parrello, B., Shukla, M., Vonstein, V., Wattam, A. R., Xia, F., and Stevens, R.: The SEED and the Rapid Annotation of microbial genomes using Subsystems Technology (RAST), Nucleic Acids Res., 42, 206–214, https://doi.org/10.1093/nar/gkt1226, 2014.
Potts, M.: Mechanisms of desiccation tolerance in cyanobacteria, Eur. J. Phycol., 34, 319–328, https://doi.org/10.1017/s0967026299002267, 1999.
Rajeev, L., da Rocha, U. N., Klitgord, N., Luning, E. G., Fortney, J., Axen, S. D., Shih, P. M., Bouskill, N. J., Bowen, B. P., Kerfeld, C. A., Garcia-Pichel, F., Brodie, E. L., Northen, T. R., and Mukhopadhyay, A.: Dynamic cyanobacterial response to hydration and dehydration in a desert biological soil crust, Isme J., 7, 2178–2191, https://doi.org/10.1038/ismej.2013.83, 2013.
Reed, S. C., Coe, K. K., Sparks, J. P., Housman, D. C., Zelikova, T. J., and Belnap, J.: Changes to dryland rainfall result in rapid moss mortality and altered soil fertility, Nature Climate Change, 2, 752–755, https://doi.org/10.1038/nclimate1596, 2012.
Swenson, T. L., Jenkins, S., Bowen, B. P., and Northen, T. R.: Untargeted soil metabolomics methods for analysis of extractable organic matter, Soil Biol. Biochem., 80, 189–198, https://doi.org/10.1016/j.soilbio.2014.10.007, 2015.
Vu, T. T., Stolyar, S. M., Pinchuk, G. E., Hill, E. A., Kucek, L. A., Brown, R. N., Lipton, M. S., Osterman, A., Fredrickson, J. K., Konopka, A. E., Beliaev, A. S., and Reed, J. L.: Genome-Scale Modeling of Light-Driven Reductant Partitioning and Carbon Fluxes in Diazotrophic Unicellular Cyanobacterium Cyanothece sp ATCC 51142, Plos Comput. Biol., 8, https://doi.org/10.1371/journal.pcbi.1002460, 2012.
Yin, Z., Wilson, S., Hauser, N. C., Tournu, H., Hoheisel, J. D., and Brown, A. J.: Glucose triggers different global responses in yeast, depending on the strength of the signal, and transiently stabilizes ribosomal protein mRNAs, Mol. Microbiol., 48, 713–724, 2003.