the Creative Commons Attribution 3.0 License.
the Creative Commons Attribution 3.0 License.
Ocean acidification changes the structure of an Antarctic coastal protistan community
Alyce M. Hancock
Andrew T. Davidson
John McKinlay
Andrew McMinn
Kai G. Schulz
Rick L. van den Enden
Antarctic near-shore waters are amongst the most sensitive in the world to ocean acidification. Microbes occupying these waters are critical drivers of ecosystem productivity, elemental cycling and ocean biogeochemistry, yet little is known about their sensitivity to ocean acidification. A six-level, dose–response experiment was conducted using 650 L incubation tanks (minicosms) adjusted to a gradient in fugacity of carbon dioxide (fCO2) from 343 to 1641 µatm. The six minicosms were filled with near-shore water from Prydz Bay, East Antarctica, and the protistan composition and abundance was determined by microscopy during 18 days of incubation. No CO2-related change in the protistan community composition was observed during the initial 8 day acclimation period under low light. Thereafter, the response of both autotrophic and heterotrophic protists to fCO2 was species-specific. The response of diatoms was mainly cell size related; microplanktonic diatoms (> 20 µm) increased in abundance with low to moderate fCO2 (343–634 µatm) but decreased at fCO2 ≥ 953 µatm. Similarly, the abundance of Phaeocystis antarctica increased with increasing fCO2 peaking at 634 µatm. Above this threshold the abundance of micro-sized diatoms and P. antarctica fell dramatically, and nanoplanktonic diatoms (≤ 20 µm) dominated, therefore culminating in a significant change in the protistan community composition. Comparisons of these results with previous experiments conducted at this site show that the fCO2 thresholds are similar, despite seasonal and interannual differences in the physical and biotic environment. This suggests that near-shore microbial communities are likely to change significantly near the end of this century if anthropogenic CO2 release continues unabated, with profound ramifications for near-shore Antarctic ecosystem food webs and biogeochemical cycling.
- Article
(1932 KB) - Full-text XML
- Companion paper 1
- Companion paper 3
-
Supplement
(283 KB) - BibTeX
- EndNote


Eukaryotic and prokaryotic microbes are the most abundant organisms in the oceans and comprise the base of all marine food webs (Kirchman, 2008; Cooley and Doney, 2009; Doney et al., 2012). Their composition and abundance determines the quality and quantity of food available to higher trophic levels and the conservation of biological diversity (Cooley and Doney, 2009; Doney et al., 2012). Without understanding the effect of ocean acidification on protistan community structure the indirect effects on high trophic levels cannot be assessed. In the Southern Ocean, microbes are not only drivers of productivity but also play key roles in elemental cycling and ocean biogeochemistry, meaning their response to environmental stressors is a key determinant of Southern Ocean feedbacks to global climate change (Arrigo and Thomas, 2004; Arrigo et al., 2008; Kirchman, 2008).
The Southern Ocean is particularly vulnerable to ocean acidification due to its cold temperature, naturally low calcium carbonate saturation state, extensive upwelling and naturally large seasonal fluctuations in pH. Cold waters have a higher solubility of carbon dioxide (CO2) meaning that CO2 concentrations are higher in polar waters compared to warmer waters, and the calcium carbonate saturation is lower. Furthermore, the surface waters of the Southern Ocean are being exposed to increased CO2 from upwelling of deep CO2 rich waters (Orr et al., 2005), a phenomenon which is enhanced in near-shore Antarctica (McNeil et al., 2010; IPCC, 2011). Prydz Bay, off Davis Station East Antarctica, has a large fluctuation in the annual cycle of CO2 concentration (Gibson and Trull, 1999; Roden et al., 2013). During autumn and winter, sea ice covers the ocean, light is limiting and the draw-down of CO2 by primary production and air–sea gas exchange is negligible, resulting in an increase in CO2 to as high as 450 µatm. During spring and summer the sea ice retreats and phytoplankton bloom due to the increased light availability, resulting in a decrease in CO2 to levels lower than 100 µatm (Gibson and Trull, 1999; Roden et al., 2013). Thus, phytoplankton in these coastal Antarctic waters are exposed to highly variable carbonate chemistry conditions over the full annual cycle.
Studies investigating the effects of ocean acidification on natural Antarctic microbial communities have mainly been conducted in the Ross Sea and western Antarctica (Antarctic Peninsula and Weddell Sea areas). In the Ross Sea, Tortell et al. (2008b) and Feng et al. (2010) found that the protistan community shifted from being dominated by pennate diatoms to larger chain-forming diatoms with increased CO2 levels, whereas in the Weddell Sea Hoppe et al. (2013) found a shift from Pseudo-nitzschia to smaller pennate diatom species. However, there are also studies in both regions that have found no significant shift in community composition (Tortell et al., 2008a, in the Ross Sea and Young et al., 2015, at Palmer Station, West Antarctic Peninsula). East Antarctica has received comparatively little attention, with only one series of experiments conducted on pelagic coastal communities in Prydz Bay (Davidson et al., 2016, and Thomson et al., 2016). This study reported significant change in species abundance and biomass with increased CO2 (Westwood et al., 2018; Davidson et al., 2016; Thomson et al., 2016). Below 643 µatm the community was dominated by micro-sized diatoms species, but above this level nano- and picoplankton dominated. These results differ from the findings of Tortell et al. (2008b) and Feng et al. (2010) who found a shift towards larger diatoms species, but is consistent with Hoppe et al. (2013) and microbial communities studied elsewhere in the world, particularly in the Arctic, where a shift to pico- and nanoplankton at high CO2 has been observed (Hare et al., 2007; Brussaard et al., 2013). Schulz et al. (2017) recently reviewed 31 community level studies, finding an increase in picoeukaryotes at high CO2 in most studies, particularly prasinophytes and chlorophytes. The effects of increased CO2 on larger marine diatoms was less clear with evidence for both promotion and inhibition. Schulz et al. (2017) concluded that the effects on marine diatoms are likely to be expressed at a species level rather than the community level, and therefore could be more difficult to predict.
Incubations of natural communities, which include the effects of interaction and competition among species, are essential to accurately assess and project the effects of ocean acidification on these communities and future elemental cycling (Schulz et al., 2017). This study will address the following questions with respect to a natural protistan community from near-shore East Antarctic waters.
-
Do individual species of a natural Antarctic protistan community show species-specific differences in CO2 tolerance?
-
Does the protistan community composition and abundance change with increased levels of CO2? What CO2 level elicits this change?
-
When compared to Davidson et al. (2016) and Thomson et al. (2016), does our experiment indicate that the response by the protistan community at this site is consistent in nature and threshold, irrespective of seasonal and interannual differences in the composition of the community and the availability of nutrients?
A six-level, dose–response experiment was conducted with a natural, near-shore Antarctic protistan community over a gradient of CO2 levels (343, 506, 634, 953, 1140 and 1641 µatm). The experiment was conducted using a temperature controlled shipping container housing six, 650 L polythene tanks (minicosms). This allowed temperature, light and mixing to be controlled, and CO2 levels to be varied between minicosm tanks. Due to the constraint of six minicosms, an unreplicated design with six CO2 levels was chosen to best identify potential thresholds in protistan response.
The minicosm experiment was conducted between the 19 November and the 7 December 2014. Initially, the microbes in the tanks were given a day at low light to acclimatize to the minicosm conditions. This was followed by a five-day (days 1–5) acclimation period of gradually increasing CO2 levels at low light, precluding phytoplankton growth while cellular physiology acclimated to the CO2 increase (see below in minicosm operation). Thereafter, CO2 was re-adjusted daily to maintain the CO2 target level in each treatment for the remainder of the experiment (see below in carbonate chemistry manipulation, measurements and calculations). To minimize potential effects of sample removal on the competition and succession of microbes, the experiment was stopped on day 18 before the volume of water in the minicosms dropped below 20 % of the initial volume (due to sample collection).
2.1 Minicosm operation
Seawater was collected on the 19 November 2014 approximately 1 km offshore from Davis Station, Antarctica (68∘35′ S, 77∘58′ E) from an area of ice-free water amongst broken fast ice. The seawater was collected using a thoroughly rinsed 720 L Bambi bucket slung beneath a helicopter and transferred into a 7000 L polythene reservoir tank. After filling, the contents of the reservoir tank were immediately gravity fed to the minicosms via a teflon lined hose fitted with an in-line 200 µm Arkal filter to exclude metazooplankton. Microscopy showed that few metazooplankton passed through the pre-filter, therefore they are not considered further. Tanks were filled simultaneously to ensure a uniform starting community, and at a slow flow rate to minimize damage to delicate cells by turbulence. The ambient water temperature at the time of collection was −1.03 ± 0.17 ∘C and the minicosms were maintained at a temperature of 0 ± 0.5 ∘C (full properties of the seawater at the time of collection are provided in the Supplement Table S1). At the centre of each minicosm there was an auger shielded for much of its length by a tube of polythene. This auger rotated at 15 rpm to gently mix the contents of the tanks. Each minicosm tank was covered with an acrylic air-tight lid to prevent out-gassing of CO2 from the minicosm headspace. For a more detailed description of the minicosm set-up see Davidson et al. (2016).
Each minicosm was illuminated using a 150 W metal halide lamp (Osram) on a 19 : 5 h light : dark cycle. During the initial acclimation phase of the experiment (days 1–5) the light was filtered using one layer of quarter colour temperature (CT) blue filter, two 90 % neutral density (ND) filters (Arri) and a light-scattering filter, resulting in a low light intensity (photosynthetic active radiation of 0.9 ± 0.2 ). Following acclimation to the various CO2 treatments, light was incrementally increased over 24 h to 90.52 ± 21.45 via the removal of the two 90 % ND filters leaving the CT blue and light-scattering filter. This final light intensity was maintained for the remainder of the experiment (days 8–18) on a 19 : 5 light : dark cycle. Despite increasing chlorophyll a concentrations, this light intensity was found to be saturating for photosynthesis from day 8 to the end of the experiment (see Deppeler et al., 2018, for details).
2.2 Carbonate chemistry manipulation, measurements and calculations
Fugacity of CO2 (fCO2) was adjusted in each minicosm throughout the experiment by the addition of CO2 enriched natural seawater. During the acclimation phase adjustments were made incrementally until target levels were reached on day 5, and thereafter re-adjusted on a daily basis. Every morning pH measurements were conducted prior to regular sampling using a portable, NBS-calibrated probe (Mettler Toledo). This measurement was used to estimate the deviation in fCO2 from target levels. Re-adjustments were then conducted by adding appropriate quantities of 0.2 µm filtered CO2 enriched natural seawater, fed into the minicosms from 1000 mL infusion bags at a rate of 50 mL min−1. Samples were then collected to quantify the carbonate chemistry speciation in each minicosm using measured dissolved inorganic carbon (DIC), pHT (total scale), temperature and salinity.
DIC was measured by infra-red absorption on an Apollo SciTech AS-C3 analyzer equipped with a LICOR7000. pHT was measured following the spectrophotometric approach described in Dickson et al. (2007) using the pH indicator m-cresol purple on a GBC UV-Vis 916 spectrophotometer in a 10 cm thermostated cuvette. Samples for the carbonate chemistry speciation measurements were collected without headspace in 250 mL glass bottles with stoppers (Dickson et al., 2007) and daily measurements of certified reference material (batch CRM127) were used for improved accuracy (Dickson, 2010). Salinity measurements were made using a WTW197 conductivity meter. Daily carbonate chemistry speciation (fCO2 and practical alkalinity, PA) were calculated from measured DIC and pHT (for further details see Schulz et al., 2017). The mean carbonate chemistry conditions for each minicosm are presented in the supplementary online material (Table S2, Figs. S1 and S2 in the Supplement).
2.3 Macronutrients sampling and measurements
Macronutrient samples were taken by filtration through sterile 0.45 µm Sartorius filters into 50 mL falcon tubes following the protocol of Davidson et al. (2016). These samples were frozen at −20 ∘C and transported to the Australian Antarctic Division, Hobart, Australia. On return to Australia the samples were analysed using flow injection at Analytical Services Tasmania and the concentrations of nitrate/nitrite (NOx), dissolved reactive phosphorus (P) and molybdate reactive silica (Si) were calculated (Supplement Figs. S3–S5).
2.4 Protistan community structure
About 960 mL of water were collected from each minicosm on days 1, 3, 5, 8, 10, 12, 14, 16 and 18 for microscopic analysis to determine protistan identity and abundance. Samples were fixed with 40 mL of Lugol's iodine and allowed to sediment at 4 ∘C for ≥ 4 days. Once cells had settled, the supernatant was gently aspirated until approximately 200 mL remained. This concentrate was resuspended and transferred to a 250 mL measuring cylinder and again allowed to settle (as above) with the supernatant gently aspirated. The remaining ∼ 20 mL were transferred into a 30 mL amber glass bottle.
An additional 1 L of water was taken on days 0, 6, 13 and 18 for analysis by field emission scanning electron microscope (FESEM). These samples were concentrated to 5 mL by filtration over a 0.8 µm polycarbonate filter. Cells were resuspended, the concentrate transferred to a glass vial and fixed to a final concentration of 1 % EM-grade glutaraldehyde (ProSciTech Pty Ltd).
All samples were stored and transported at 4 ∘C to the Australian Antarctic Division, Hobart, Australia for analysis.
2.4.1 Electron microscopy
Glutaraldehyde-fixed samples were prepared for FESEM imaging using a modified polylysine technique (Marchant and Thomas, 1983). In brief, a few drops of glutaraldehyde-fixed sample were placed on polylysine coated cover slips and post-fixed for 30 min with OsO4 (4 %) vapour, allowing cells to settle onto the coverslips. The coverslips were then rinsed in distilled water and dehydrated through a graded ethanol series ending with emersion in 100 % dry acetone. Finally, the samples were critically point dried in a Tousimis Autosamdri-815 Critical Point Dryer to replace acetone molecules with CO2. The coverslips were mounted onto 12.5 mm diameter aluminium stubs and coated with 7 nm of platinum/palladium using a Cressington 208HRD coater. Samples were examined using a JEOL JSM-6701F FESEM and protists identified using Scott and Marchant (2005).
2.4.2 Light microscopy
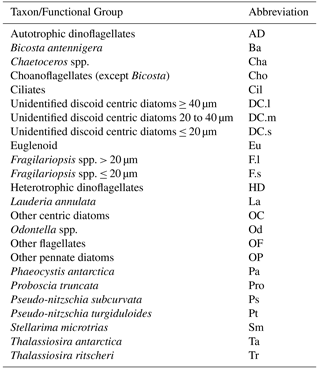
Lugol's-fixed and sedimented samples were analysed by light microscopy within two years of collection. Between 2 to 10 mL (depending on cell density) of Lugol's-concentrated samples were placed into a 10 mL Utermöhl cylinder (Hydro-Bios, Kiel) and the cells allowed to settle overnight using the method of Olrik (1998). Due to the large variation in size and taxa, a stratified counting procedure was employed to ensure both accurate identification of nanoplanktonic cells and representative counts of rare, larger microplanktonic cells. All cells greater than 20 µm were identified and counted at 200× magnification; those less than 20 µm at 400× magnification. To check that abundance estimates were accurate, mean cell counts of each taxon were recorded versus number of fields of view (FOVs) counted. These plots showed that the mean stabilized at 10–15 FOVs for small cells and 15–20 for large cells. Consequently, we counted 20 FOVs per sample for both nano- and microplanktonic cells to ensure that counts gave truly representative estimates of the mean species abundance. For nanoplanktonic cells (≤ 20 µm), each FOV of 2.51×105 µm2 area, provided on average counts totalling approximately 2000 cells, ranging from 50 for rare taxa and over 1000 for abundant species. For microplanktonic cells (> 20 µm), each FOV of 3.66×106 µm2 area, provided on average counts of approximately 1000 cells, ranging from 5 for rare taxa to over 300 for abundant chain forming taxa (i.e. Chaetoceros spp.). Rare taxa with high variance but similar response to fCO2 treatment, were combined into functional groups and abundant taxa with low variance were examined separately (see Table 1 for taxon/functional groups and abbreviations). Counts were conducted on an Olympus IX 81 microscope with Nomarski interference optics and identifications were based on Scott and Marchant (2005) and FESEM images. Autotrophic protists were distinguished from heterotrophs via their taxonomic identity and the presence of chloroplasts.
2.5 Statistical analysis
The minicosm experiment was a dose–response experiment based on a repeated measures design. Due to the lack of replication, no formal statistics could be undertaken on the interactions between time and fCO2 treatment. Temporal changes in species abundances between treatment groups were informally assessed by plotting the mean microbial abundance at each time for each treatment. Means and standard errors were calculated from separate FOV counts; as these are sub-samples from a single treatment, they should be considered pseudo-replicates and are indicative of abundance estimate variability. To avoid over-plotting in the figures, data points from the different fCO2 treatments were slightly offset on the x axis at each sample time. Cluster analyses and ordinations were performed on Bray–Curtis resemblance matrices formed from square-root transformed abundance data. This transformation was assessed as appropriate for reducing the influence of abundant species, as judged from a one-to-one relationship between observed dissimilarities and ordination distances (Shepard diagram, not shown). The Bray–Curtis metric was used as it is recommended for ecological data due to its treatment of joint absences (i.e. these do not contribute towards similarity), and giving more weight to abundant taxa rather than rare taxa (Bray and Curtis, 1957). The effect of fCO2 on protistan community composition was assessed separately for the 8 day acclimation period and 10 days of growth.
Hierarchical agglomerative cluster analyses were performed using group-average linkage and the Bray–Curtis resemblance matrices. Significantly different clusters of samples were determined using SIMPROF (similarity profile permutations method) (Clarke et al., 2008) with an alpha value of 0.05 and based on 1000 permutations. An unconstrained ordination by non-metric multidimensional scaling (nMDS) using a primary (“weak”) treatment of ties, was repeated over 50 random starts (Kruskal, 1964a, b). The Procrustean superimposition approach advocated by Peres-Neto and Jackson (2001) was used to ensure a globally optimal solution. In the nMDS plot, clusters are displayed using colour and weighted averages of species sample scores were plotted to show the approximate contribution of each species to each sample. The assumption of a linear trend for covariates in the ordination was checked, and in all instances was found to be justified.
A constrained canonical analysis of principal coordinates (CAP) was conducted according to the Oksanen et al. (2017) protocol using the Bray–Curtis resemblance matrix. This analysis assessed the significance of the environmental covariates, or constraints, in determining the protistan community structure. Unlike the nMDS ordination, the CAP analysis uses the similarity matrix to partition the total variance into two components, a constrained component that comprises only the variation that can be attributed to the constraining variables (fCO2, Si, P and NOx), and an unconstrained component not attributed to the constraining variables. Permutation tests were used to assess the significance of each environmental constraint (Legendre and Anderson, 1999), with a minimum subset determined by a forward selection strategy (Legendre et al., 2011). This provided a final model that included only the significant predictors while still accounting for a majority of the variation potentially explained by constraining covariates.
All analyses were performed using R v1.0.136 (R Core Team, 2016) and the add-on package vegan v2.4-2 (Oksanen et al., 2017).
3.1 Protistan community overview
The starting protistan community was characteristic of a post sea-ice break-out community in the near-shore seawater of Prydz Bay (Waters et al., 2000). It was highly diverse with over 100 species present, ranging from small flagellates (< 2 µm) to large diatoms (> 100 µm). The overall protistan abundance at the beginning of the experiment was quite low (approximately 300 cells mL−1), but increased to between 6400 and 19 000 cells mL−1 towards the end of the experiment, depending on the treatment. Abundances remained low during the acclimation period (days 1 to 8) then increased exponentially from days 10 to 16 (Fig. 1). Between days 16 and 18 there was a decrease in abundance in all treatments except at 634 and 1641 µatm (but with high variance associated with the day 18 at 634 µatm). From day 14 onwards the total cell abundance increased with low to moderate fCO2 (506–953 µm) but in higher fCO2 treatments (1140 and 1641 µm) remained either similar to, or lower than that of ambient (343 µm) (Fig. 1).
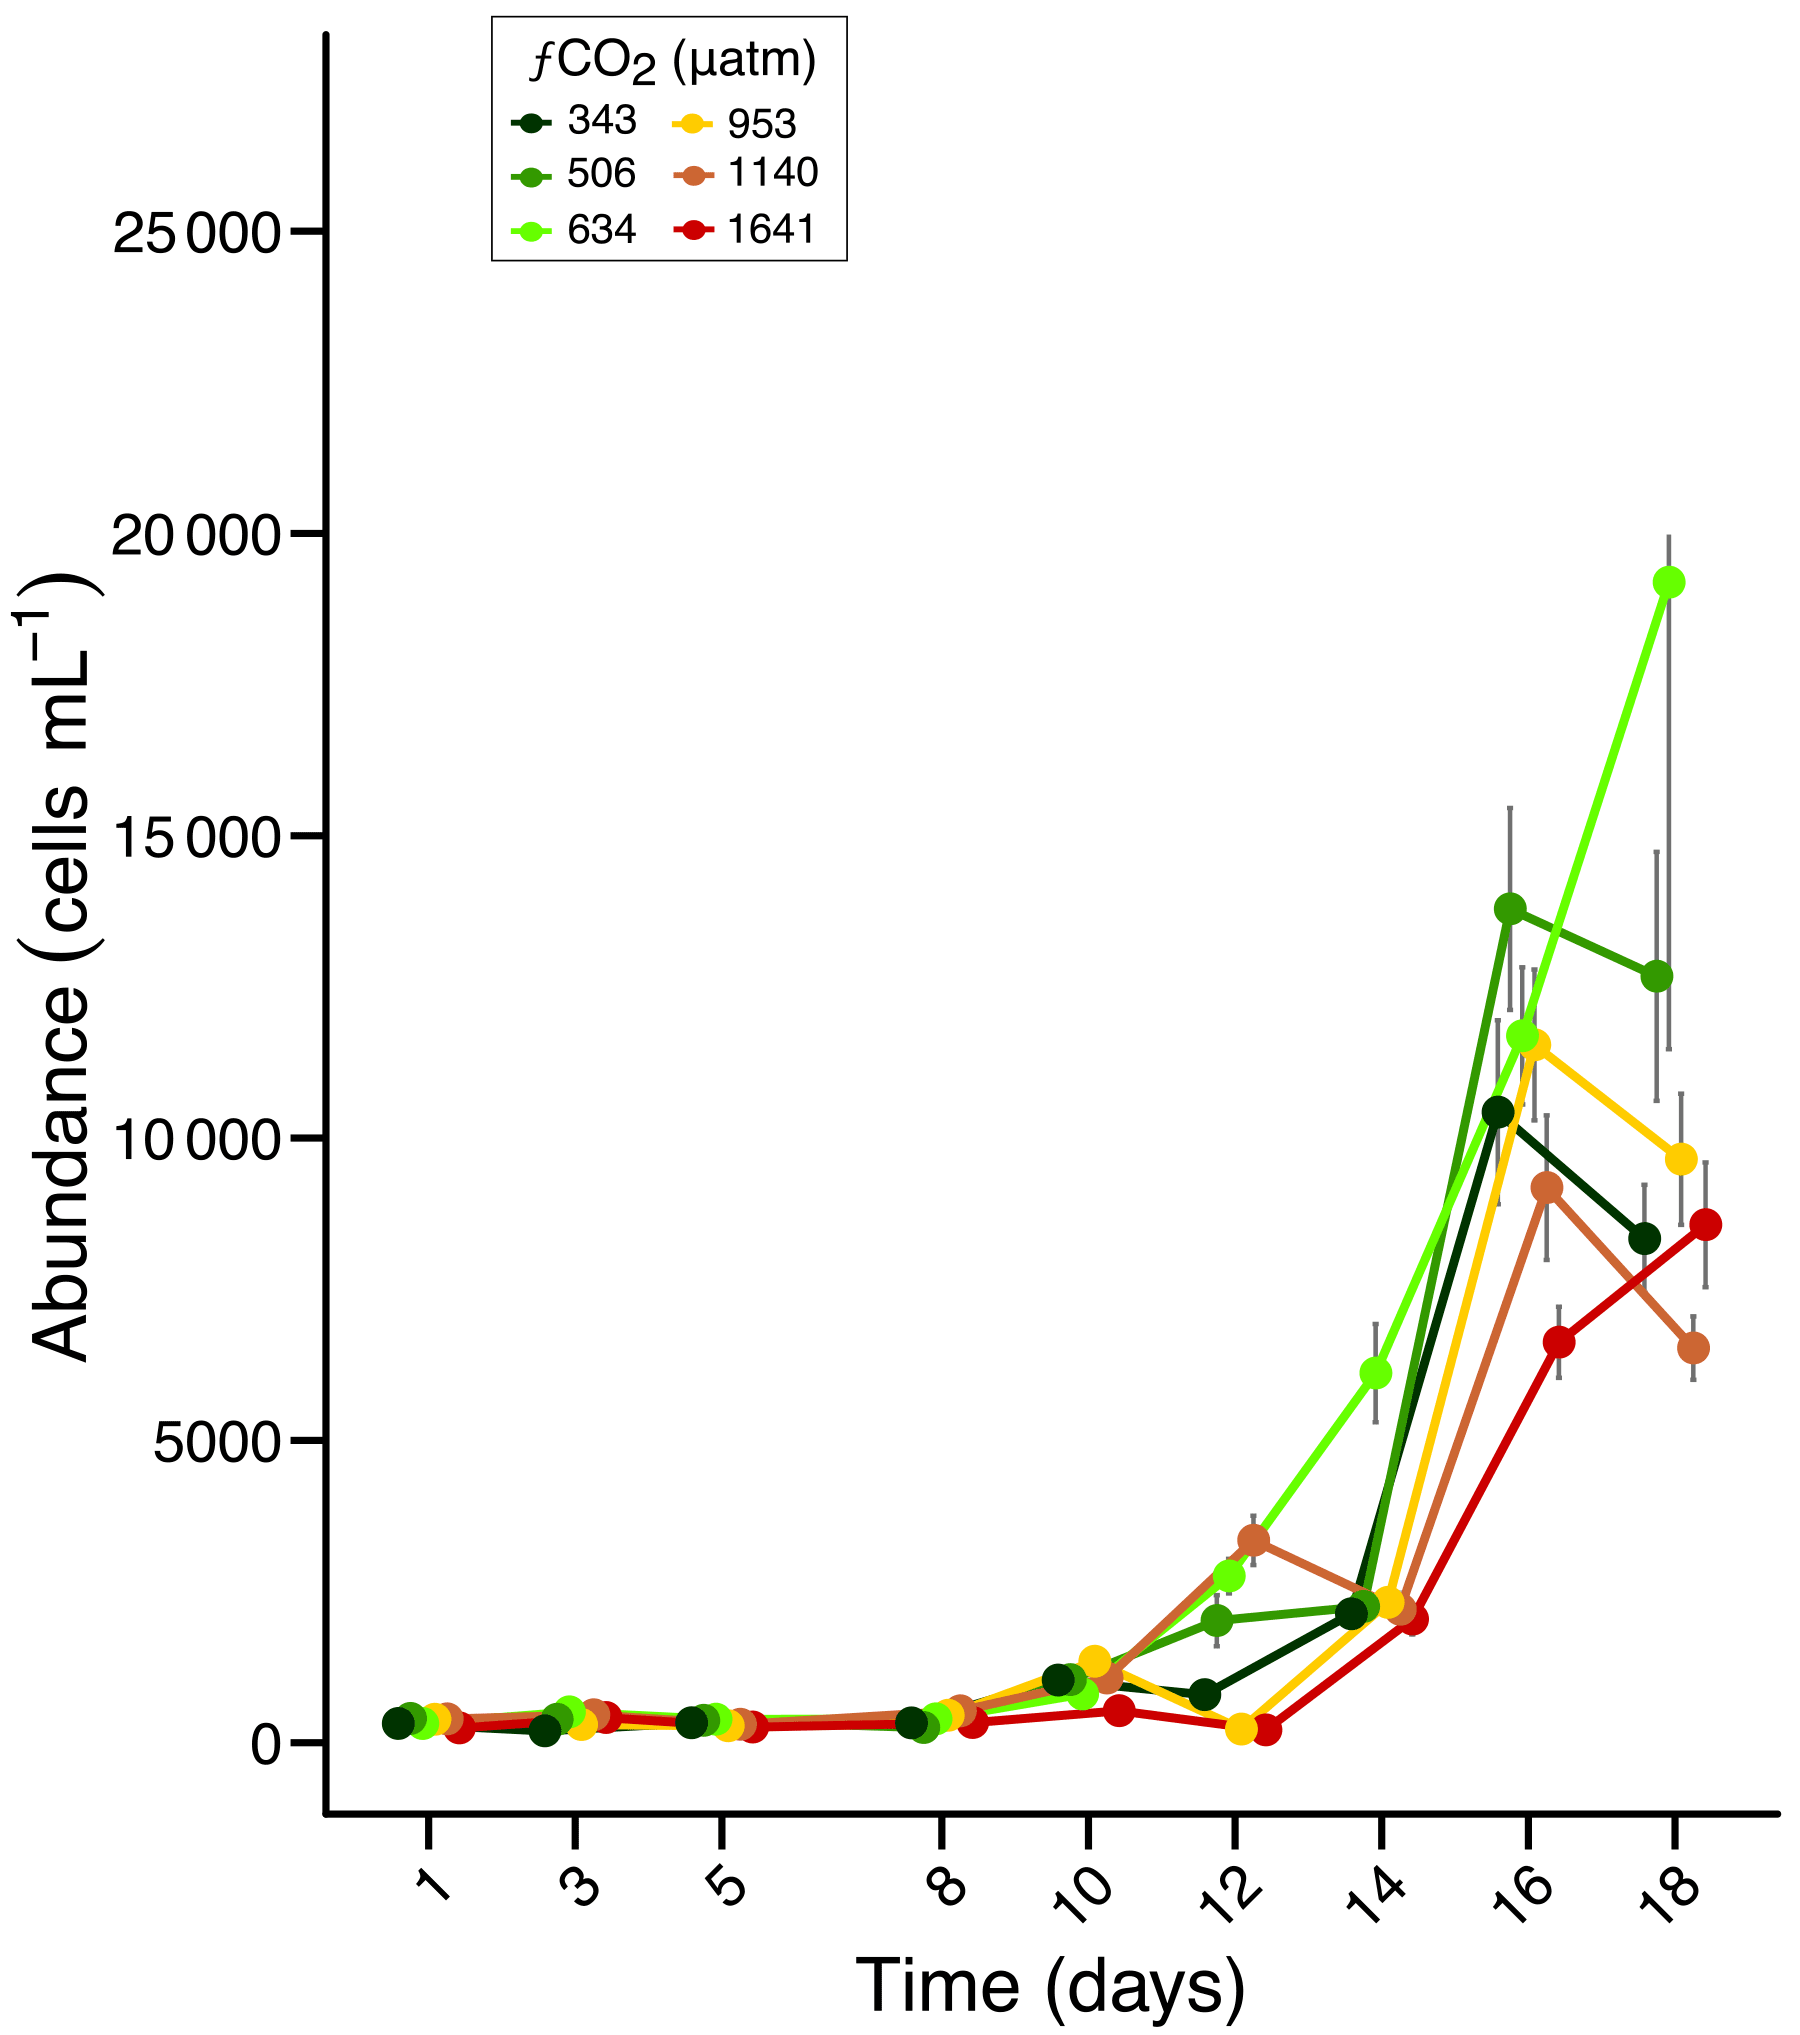
Figure 1Abundance of total protists over an 18 day incubation of a natural protistan community in tanks maintained at different fCO2 levels. Error bars are standard errors derived from pseudo-replicates undertaken at each time point for each treatment.
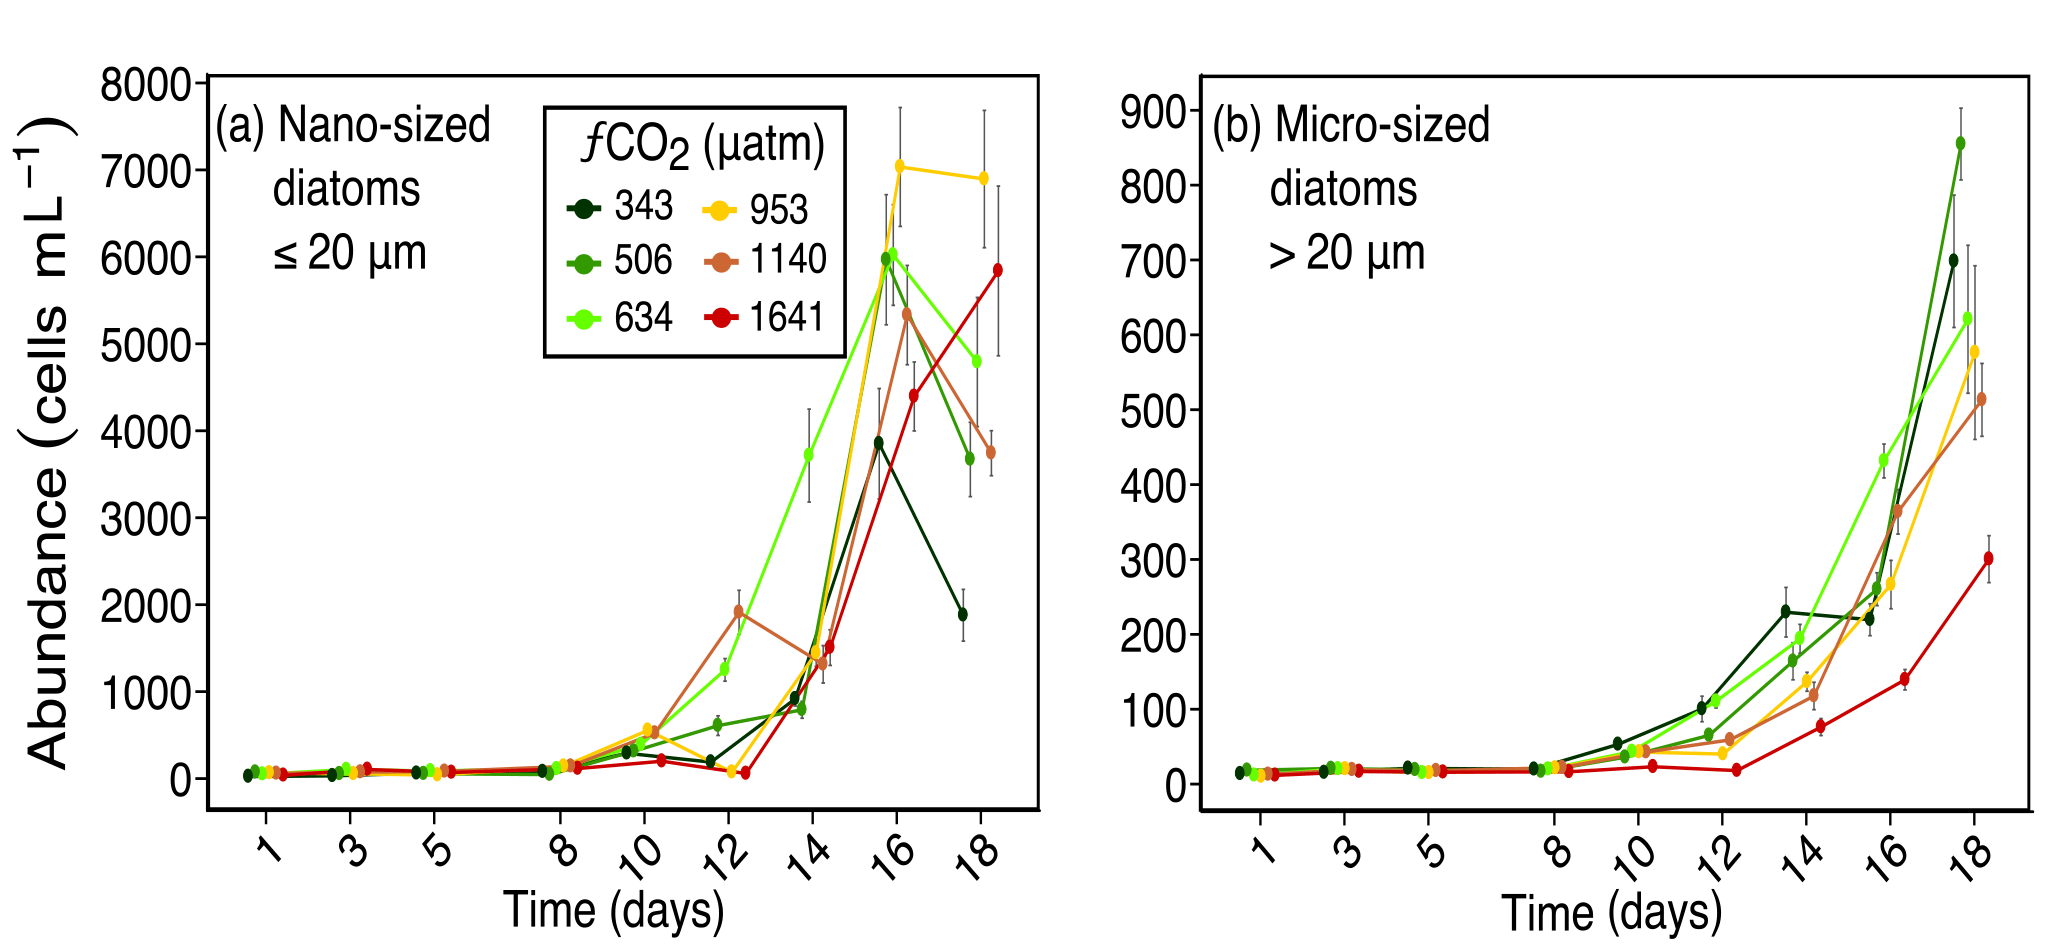
Figure 2Abundances of (a) nano-sized diatoms (longest length ≤ 20 µm), and (b) micro-sized diatoms (longest length > 20 µm) over days 1 to 18 of the incubation of a natural protistan community in tanks maintained at different fCO2 levels. Error bars are standard errors derived from pseudo-replicates undertaken at each time point for each treatment.
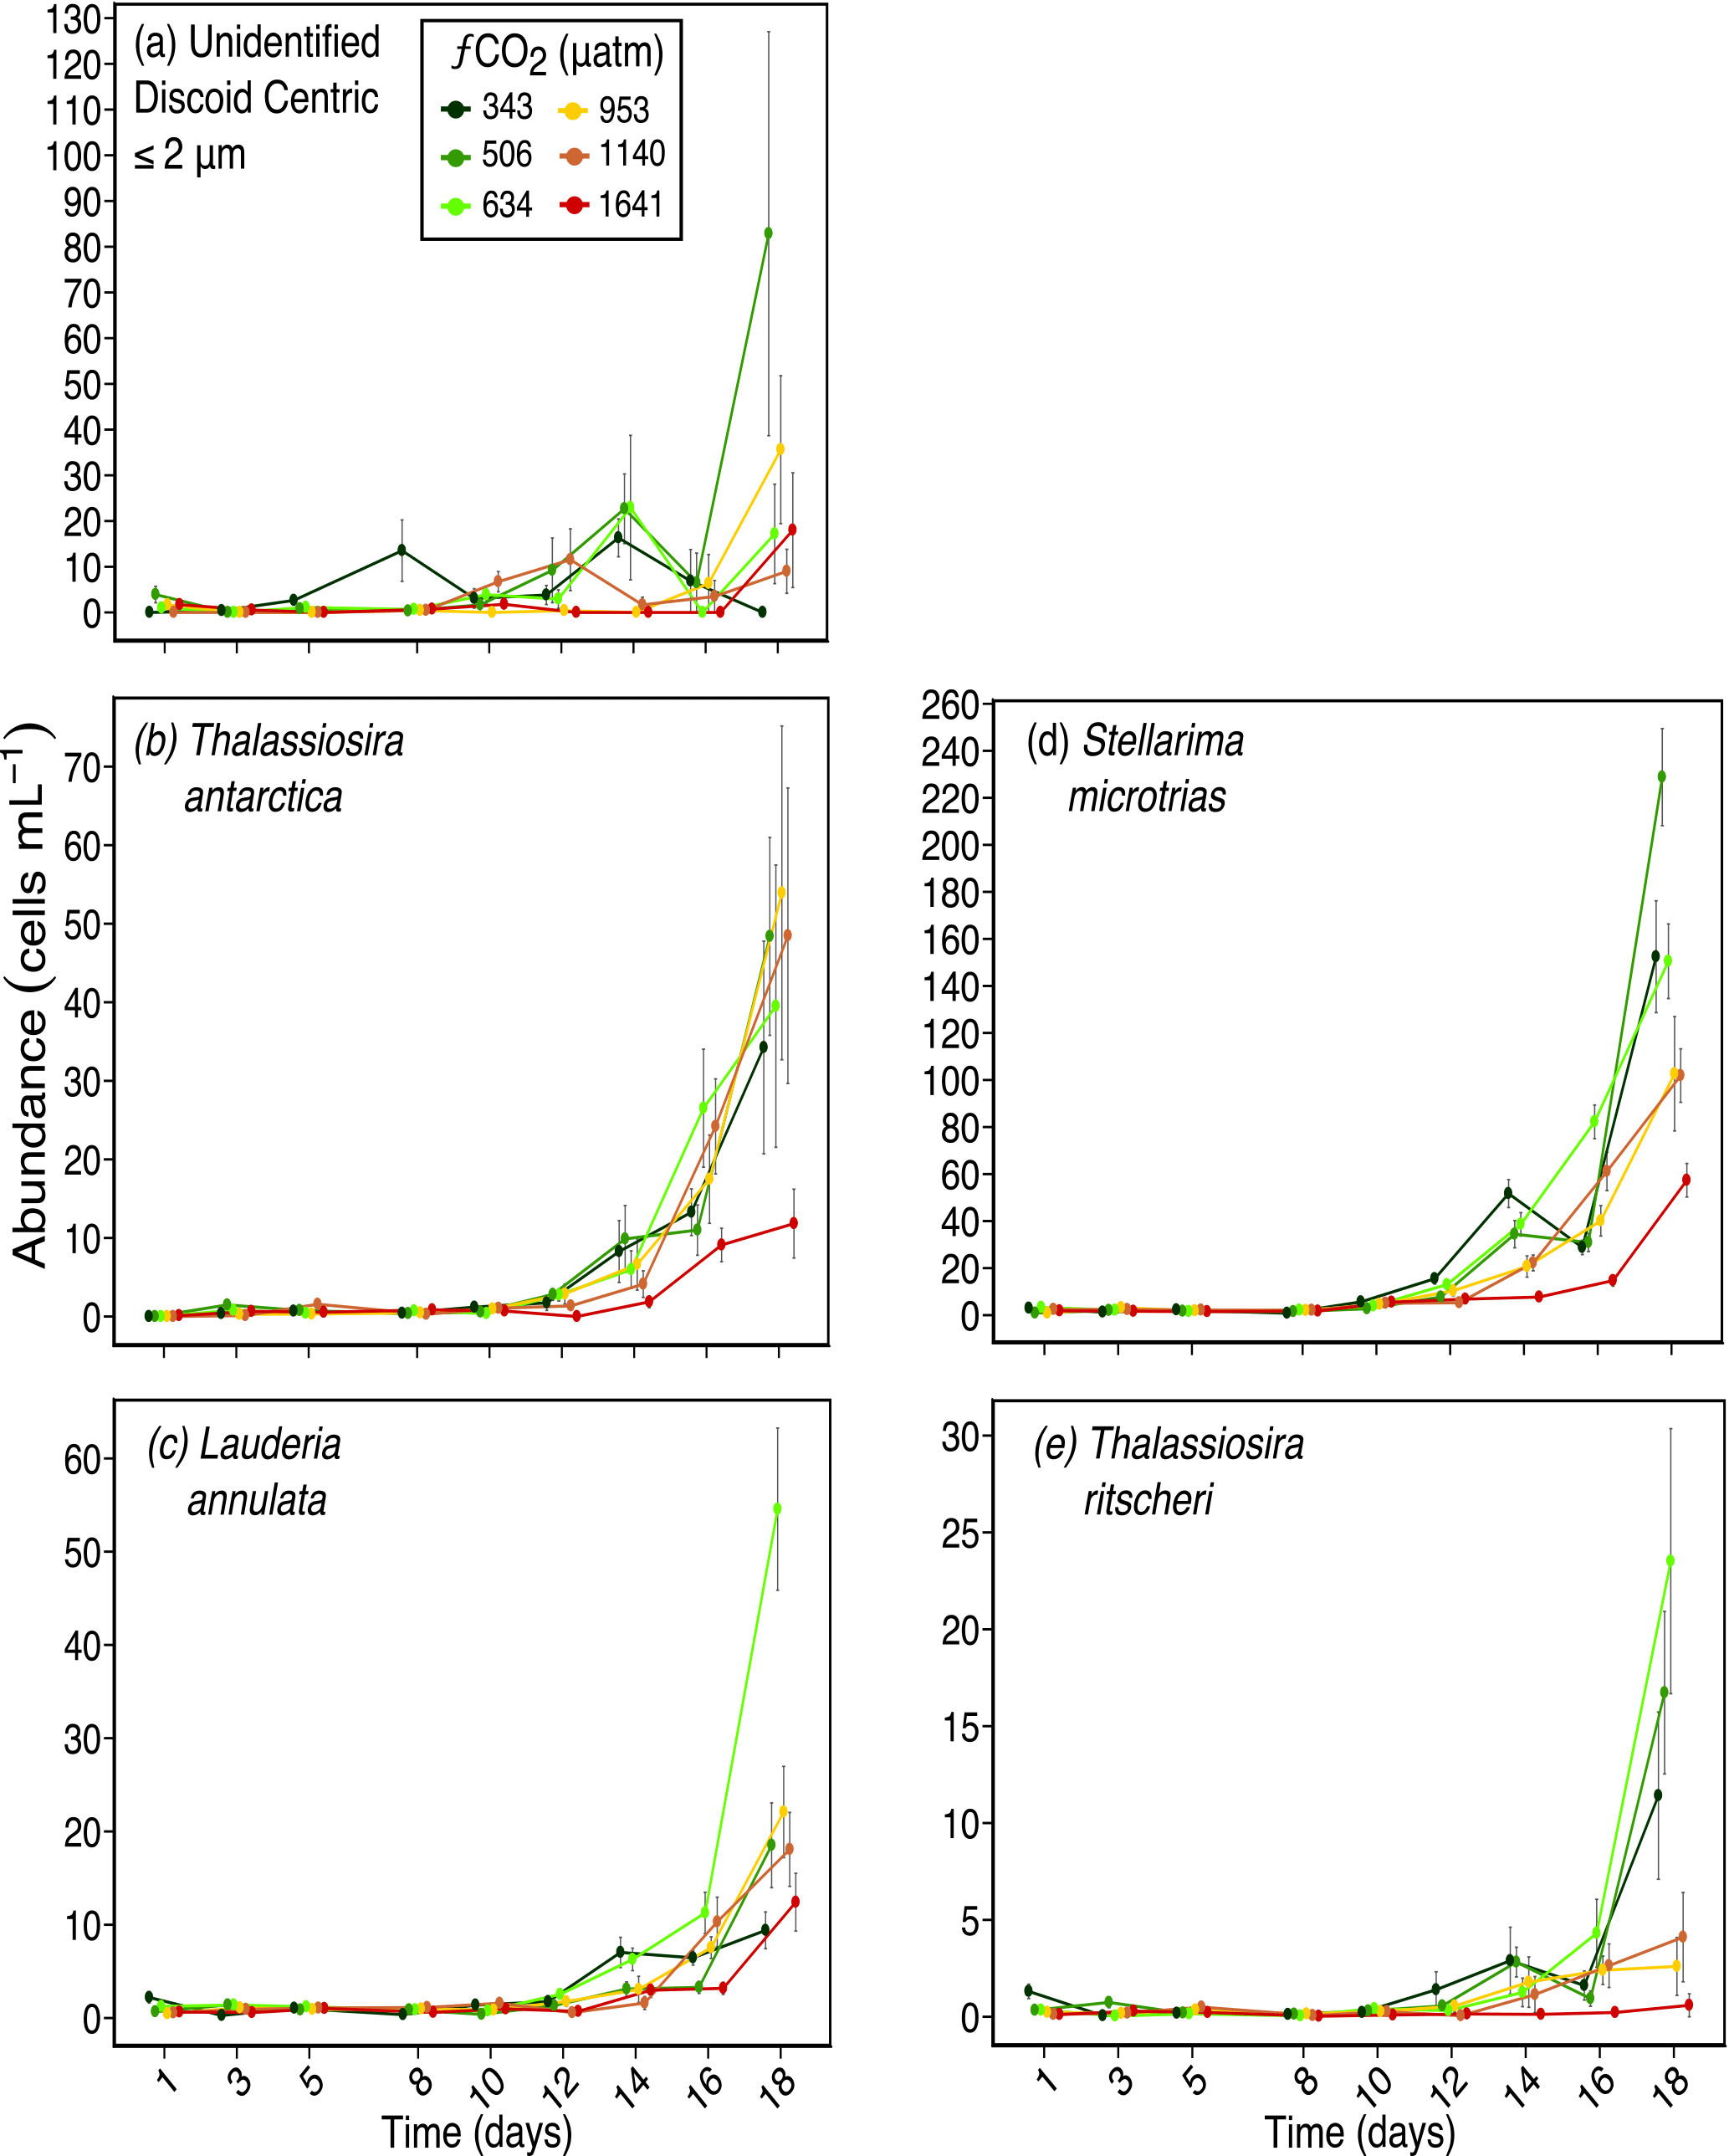
Figure 3Abundances of (a) unidentified discoid centric diatoms (valve diameter) ≤ 2 µm; (b) Thalassiosira antarctica (valve diameter ≈ 20 µm); (c) Lauderia annulata (valve diameter ≈ 55 µm); (d) Stellarima microtrias (valve diameter ≈ 55 µm); and (e) Thalassiosira ritscheri (valve diameter ≈ 50 µm) over days 1 to 18 of the incubation of a natural protistan community in tanks maintained at different fCO2 levels. Error bars are standard errors derived from pseudo-replicates undertaken at each time point for each treatment.
3.2 Species-specific fCO2 tolerances
3.2.1 Diatoms
Diatoms dominated the protistan community and had marked responses to increased fCO2 levels. The response of diatoms was mainly size related, with nanoplanktonic diatoms (≤ 20 µm) being more tolerant to higher fCO2 exposure than microplanktonic diatoms (> 20 µm) (Fig. 2). Nano-sized diatoms had abundances similar to, or higher than ambient (343 µatm) in all treatments from days 14 to 18. In contrast, micro-sized diatoms increased in abundance at moderate fCO2 levels (≤ 634 µatm) but declined at the three higher fCO2 treatments (Fig. 2). The abundance of micro-sized diatoms was particularly low in the highest fCO2 treatment from day 10 of the experiment.
This size-related response was also observed at a species level, with the response of discoid centric diatoms being mainly related to size. Here, centric diatoms with a valve diameter greater than the pervalvar dimension (i.e. diatoms of the genera Thalassiosira, Lauderia and Stellarima or similar), have been grouped as “discoid centric diatoms”. The smallest, unidentified 1 to 2 µm diameter discoid centric diatoms, had no significant response to increasing fCO2 (Fig. 3a). Thalassiosira antarctica, with an average valve diameter of 20 µm also did not respond to increased fCO2 except in the highest treatment level of 1641 µatm (Fig. 3b). Two larger discoid centric species, Stellarima microtrias (average valve diameter of 55 µm) and Thalassiosira ritscheri (average valve diameter of 50 µm), had increased abundances in the low to moderate fCO2 treatments (≤ 634 µatm), but decreased in abundance at the three higher fCO2 levels (Fig. 3d and e respectively). These responses emerged between days 12 and 14 of the experiment. One discoid centric diatom which did not follow this size-related trend was Lauderia annulata, a larger sized cell with an average valve diameter of 55 µm. Unlike S. microtrias and T. ritscheri, it had a similar abundance in all fCO2 treatments except the 634 µatm treatment, where its abundance was higher than the other treatments on days 16 and 18 of the experiment (Fig. 3c).
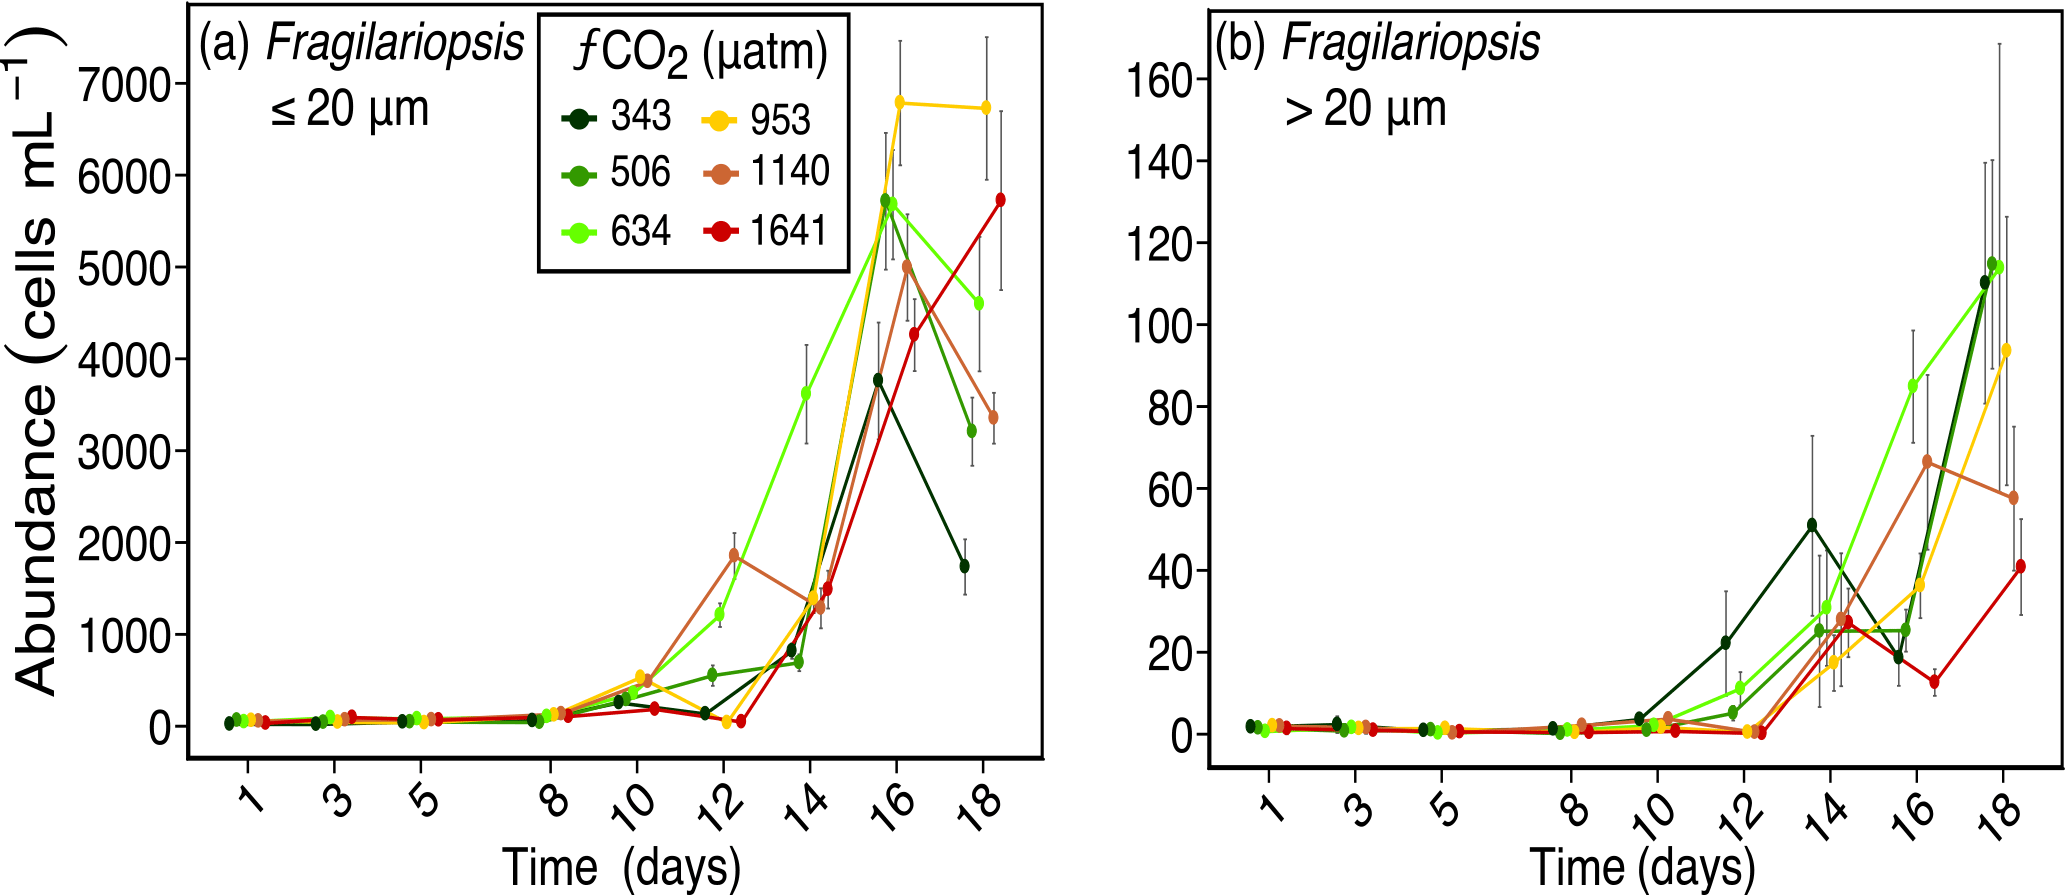
Figure 4Abundances of (a) Fragilariopsis spp. (≤ 20 µm in length), and (b) Fragilariopsis spp. (> 20 µm in length) over days 1 to 18 of the incubation of a natural protistan community in tanks maintained at different fCO2 levels. Error bars are standard errors derived from pseudo-replicates undertaken at each time point for each treatment.
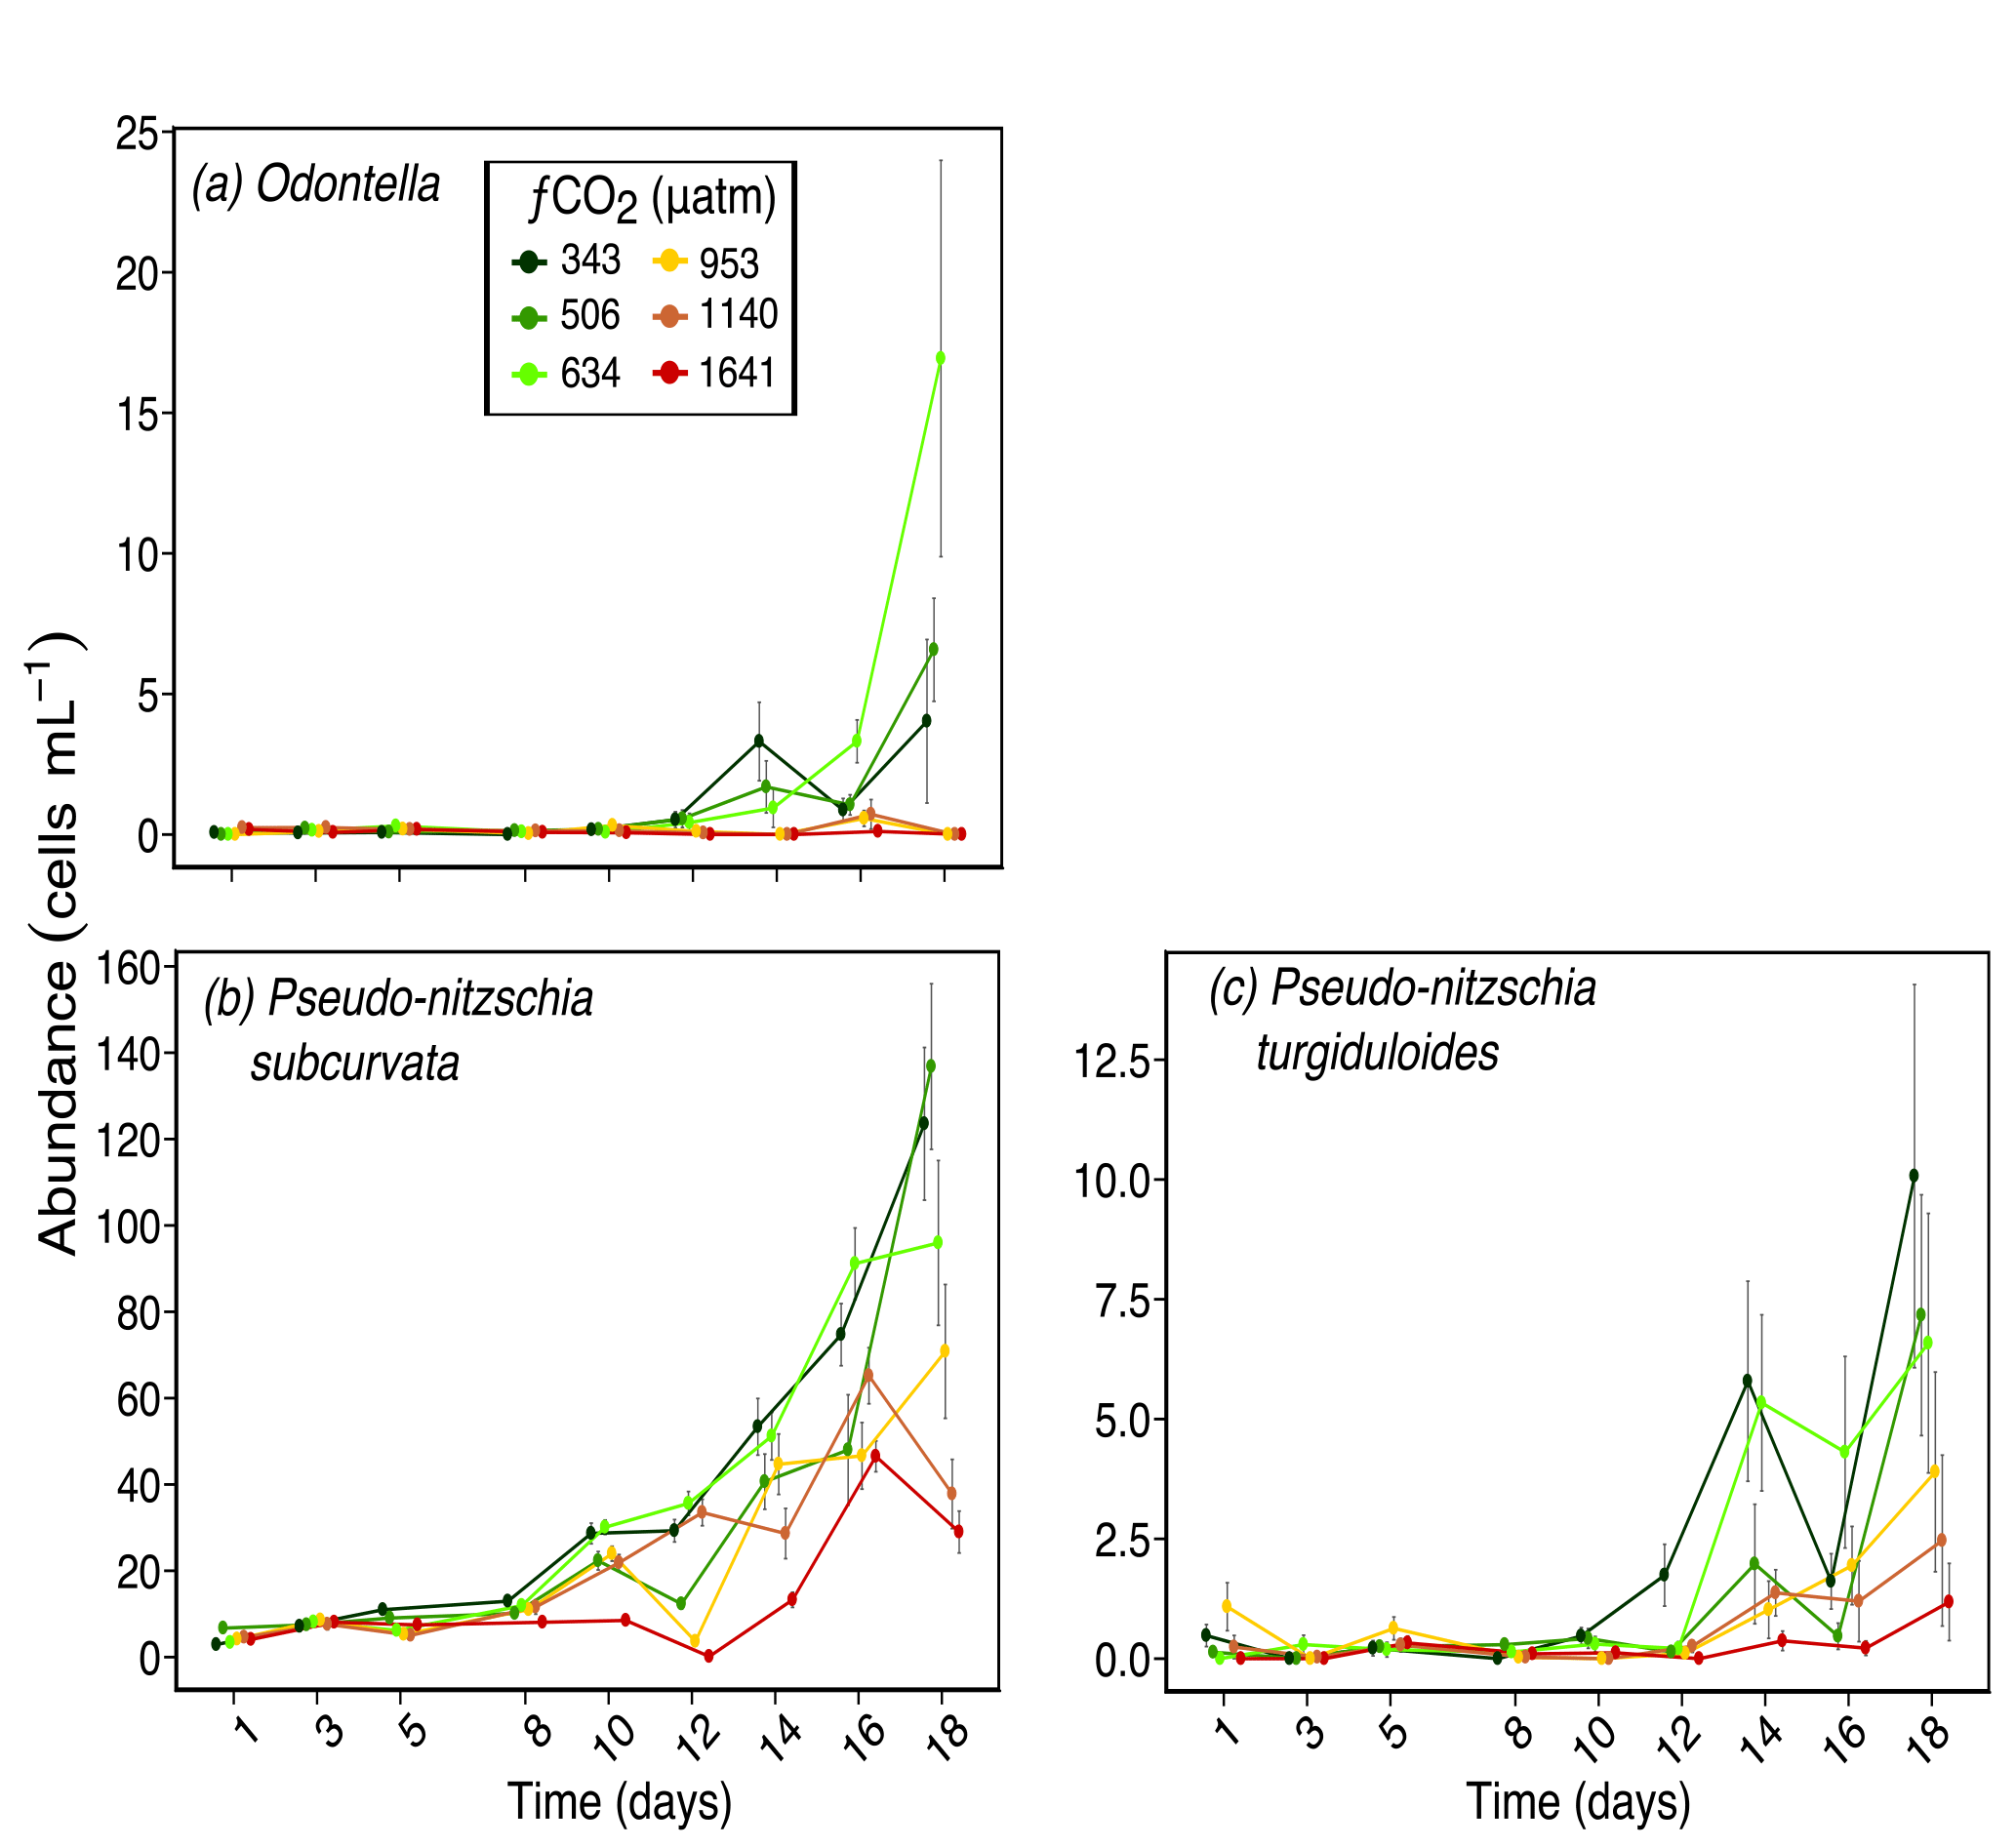
Figure 5Abundances of (a) Odontella spp. (pervalve length ≈ 70 µm); (b) Pseudo-nitzschia subcurvata (≈ 55 µm in length); and (c) Pseudo-nitzschia turgiduloides (≈ 85 µm in length) over days 1 to 18 of the incubation of a natural protistan community in tanks maintained at different fCO2 levels. Error bars are standard errors derived from pseudo-replicates undertaken at each time point for each treatment.
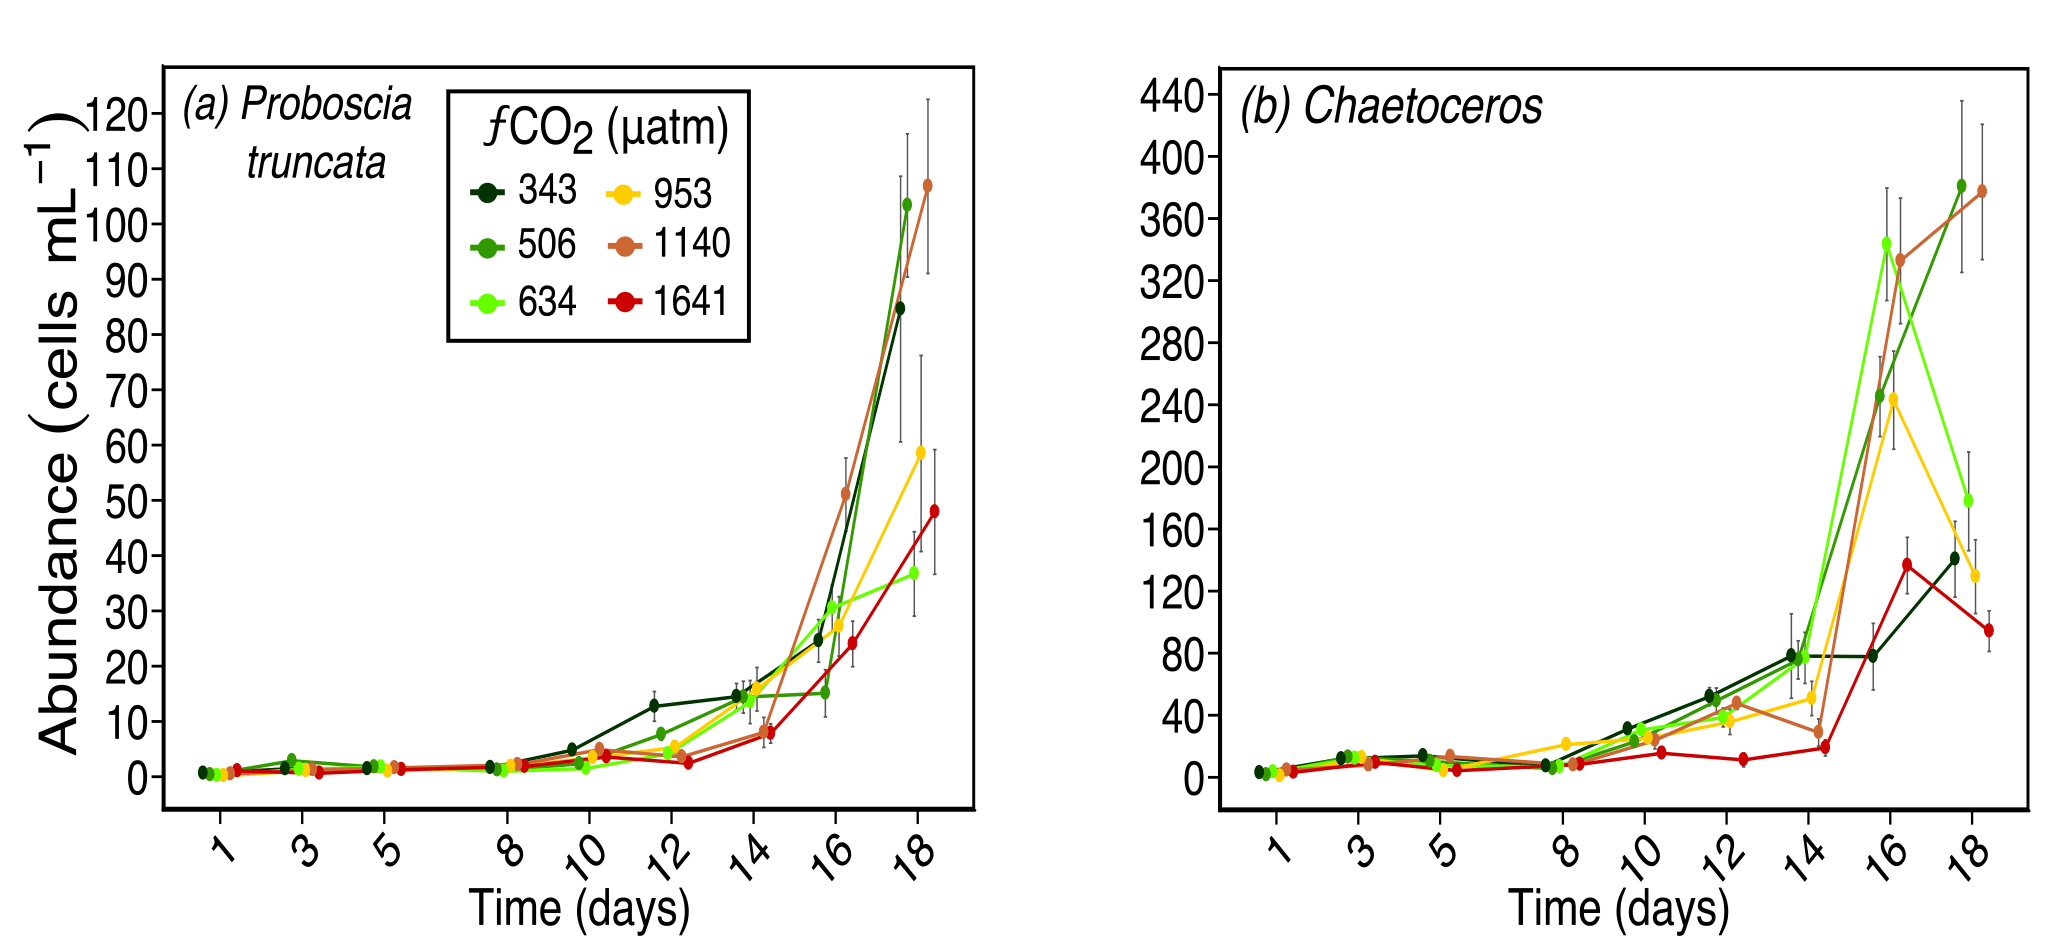
Figure 6Abundances of (a) Proboscia truncata (pervalvar length ≈ 130 µm), and (b) Chaetoceros spp. (pervalvar length ≈ 10 µm) over days 1 to 18 of the incubation of a natural protistan community in tanks maintained at different fCO2 levels. Error bars are standard errors derived from pseudo-replicates undertaken at each time point for each treatment.
A similar size-related response was observed for Fragilariopsis spp. cells (mostly F. cylindrus but included occasional F. curta and F. kerguelensis). Fragilariopsis spp., which was the dominant diatom, ranged in length from 2 to > 50 µm and comprised between 15 to 50 % of the total phytoplankton abundance. From day 14, the abundance of nano-sized Fragilariopsis spp. cells (≤ 20 µm) was similar or higher in all treatments exposed to enhanced fCO2 compared to that of the ambient (343 µatm) (Fig. 4a). In contrast, micro-sized cells of Fragilariopsis spp. (> 20 µm) had higher abundance in the three lower fCO2 treatments and considerably lower abundances in the two highest fCO2 treatments on day 18. The abundance of micro-sized cells in the 953 µm treatment fell between these two extremes (Fig. 4b). This trend was not evident until day 18 of the experiment.
Other larger diatoms had a similar response to S. microtrias, T. ritscheri and micro-sized Fragilariopsis spp. Odontella spp. (mainly O. weissflogii but also some O. litigiosa) and the pennate diatoms Pseudo-nitzschia subcurvata and Pseudo-nitzschia turgiduloides (Fig. 5a, b and c respectively) all had higher abundances in fCO2 treatments 343, 506 and 634 µatm but lower abundances in the three highest fCO2 treatments (953–1641 µatm). The abundance of Proboscia truncata was unrelated to fCO2 despite being a larger diatom species (average pervalvar length of 130 µm) (Fig. 6a). At day 14, Chaetoceros spp. (mainly C. castracanei but C. tortissimus and C. bulbosus were also present) had lower abundances in the three higher fCO2 treatments but by day 18 no fCO2 related trend was evident (Fig. 6b).
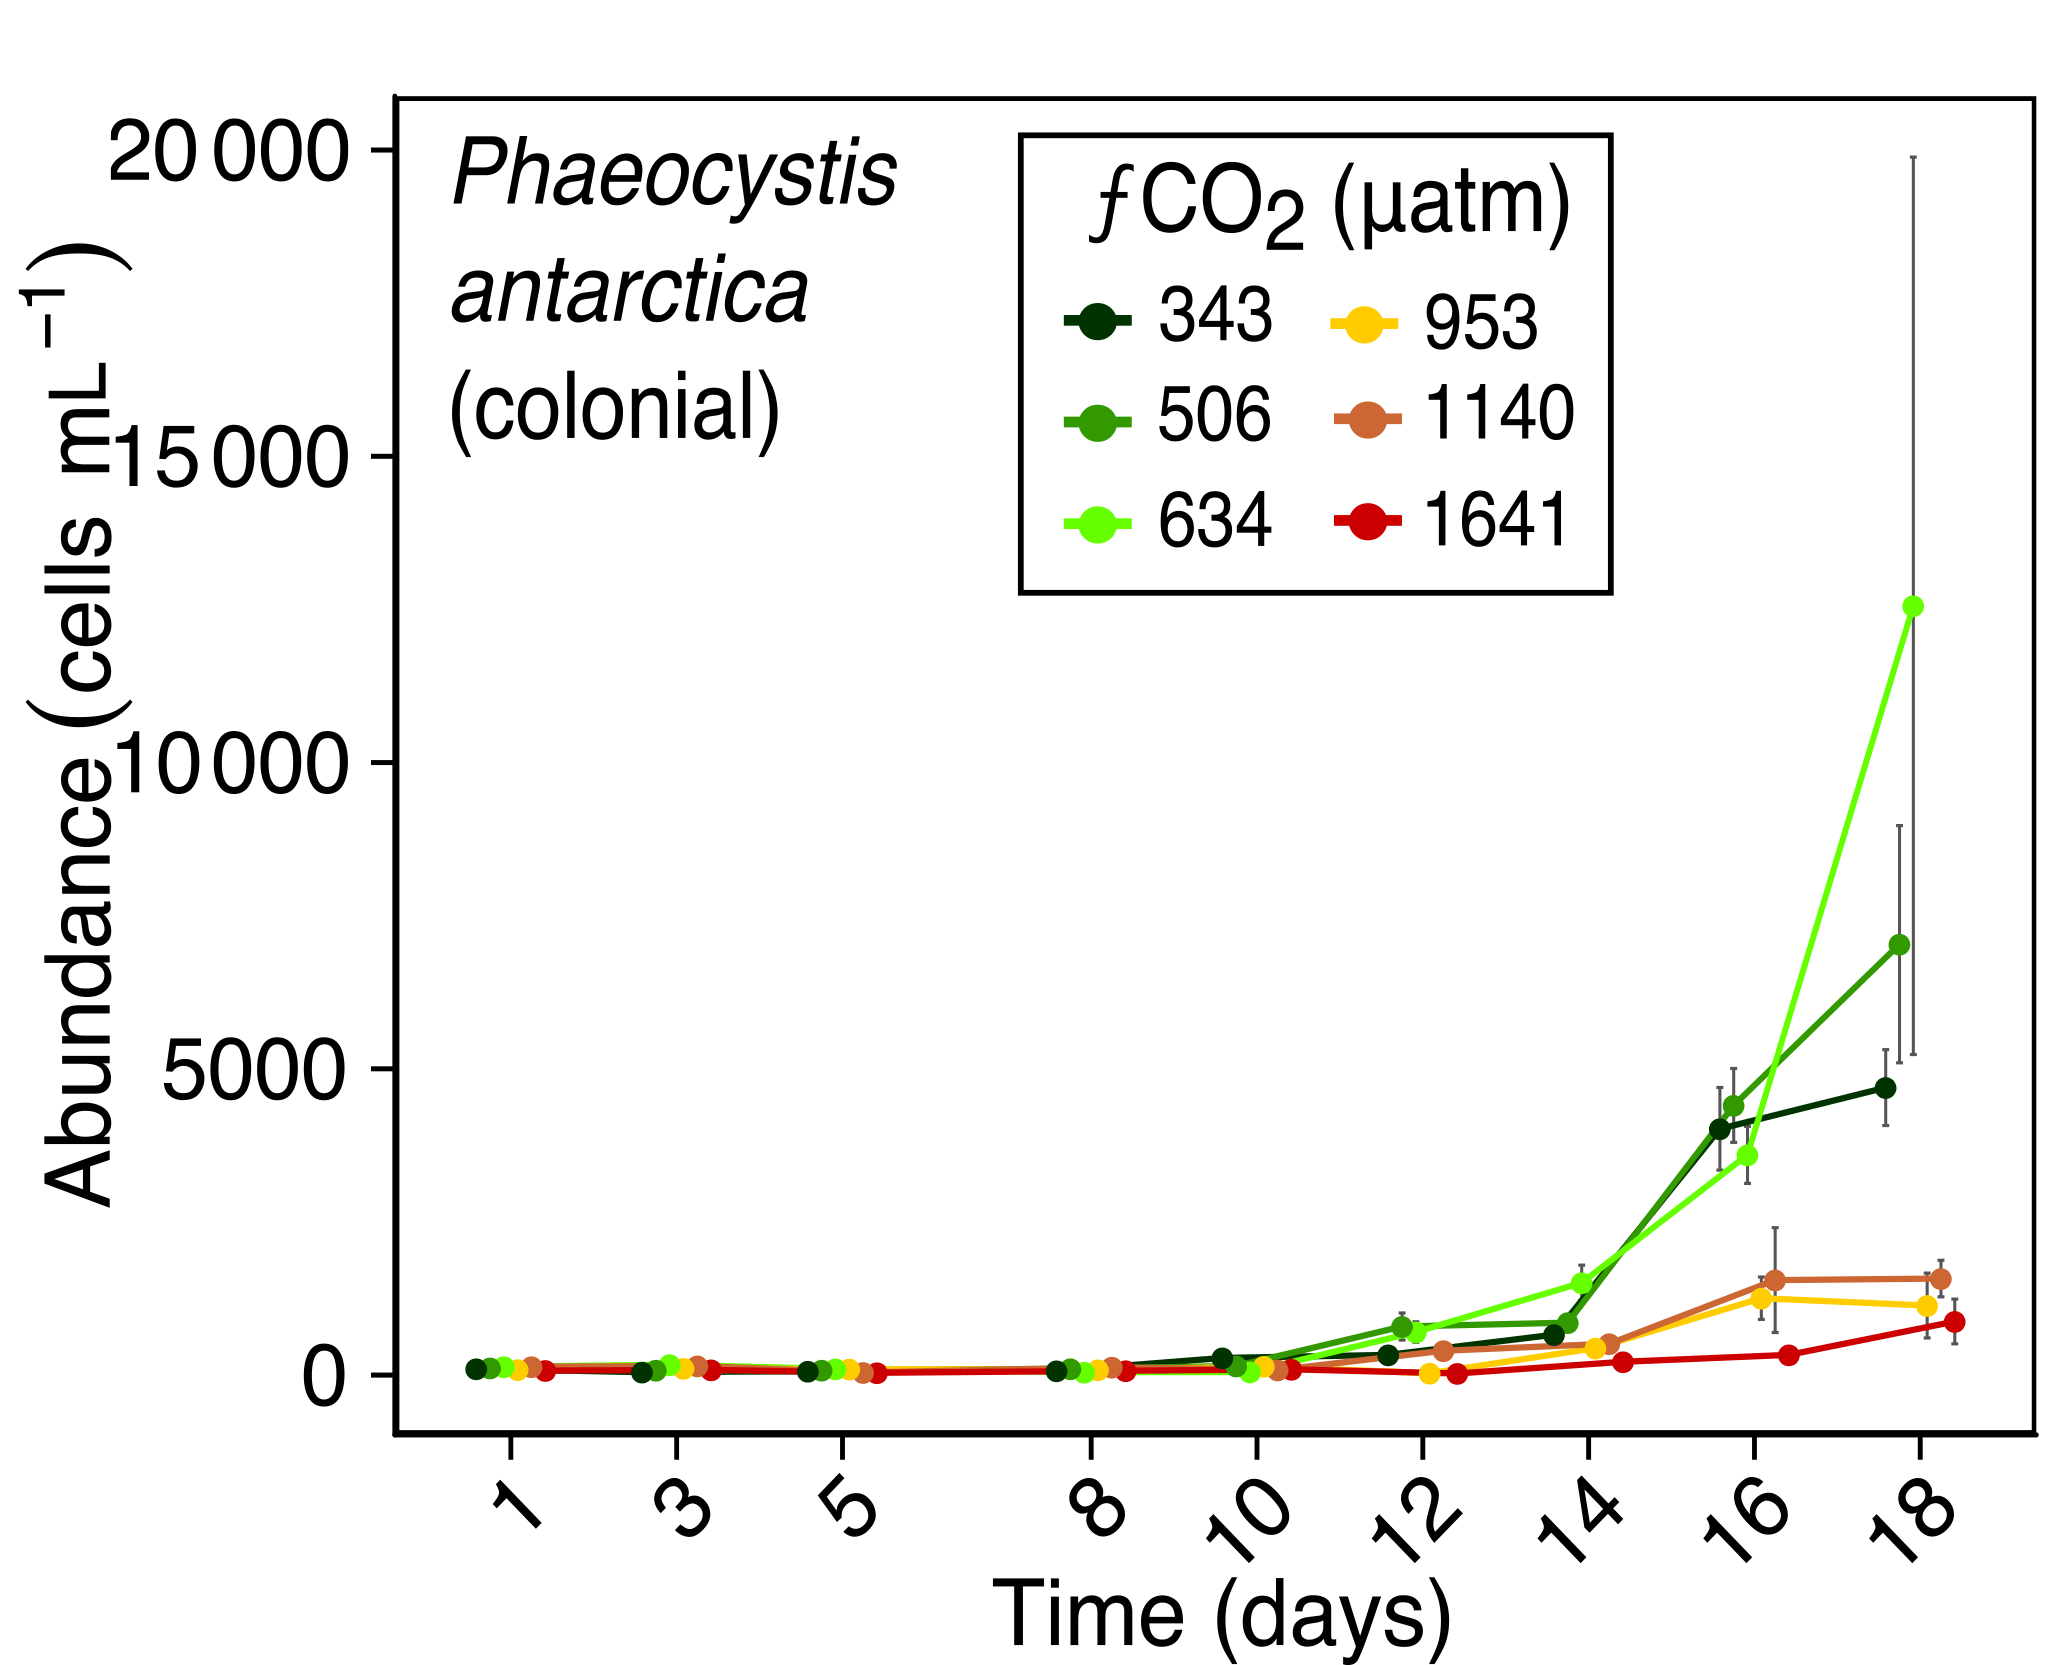
Figure 7Abundance of Phaeocystis antarctica (colonial form) over days 1 to 18 of the incubation of a natural protistan community in tanks maintained at different fCO2 levels. Error bars are standard errors derived from pseudo-replicates undertaken at each time point for each treatment.

Figure 8Abundances of (a) Bicosta antennigera, and (b) Choanoflagellates (except Bicosta) over days 1 to 18 of the incubation of a natural protistan community in tanks maintained at different fCO2 levels. Error bars are standard errors derived from pseudo-replicates undertaken at each time point for each treatment.
3.2.2 Flagellates
The colonial life stage of Phaeocystis antarctica occurred in much higher abundances in the three lower fCO2 treatments. It was the most abundant flagellate in this study, ranging from ∼100 cells mL−1 at the start of the experiment to 12 600 cells mL−1 on day 18 in fCO2 treatments ≤ 634 µatm (Fig. 7). This starkly contrasted with abundances at fCO2 levels ≥ 953 µatm which did not exceed 1600 cells mL−1. This strong difference in abundances between the three lower and three higher fCO2 treatments emerged early in the experiment, with a discernible difference by day 12.
Other abundant flagellate taxa in our study had a variety of responses. The choanoflagellate Bicosta antennigera responded similarly to P. antarctica with higher abundances in fCO2 treatments ≤ 506 µatm and lower abundances at higher fCO2 levels (Fig. 8a). Other choanoflagellates (mainly Diaphanoeca multiannulata) had no consistent trend in response to fCO2 level (Fig. 8b).
The abundances of other nanoflagellates and heterotrophic protists were low and seemingly unrelated to fCO2 treatment. All other nanoflagellates were low in abundance and had high variance between field of view counts, therefore these were grouped together. This group, termed “Other Flagellates”, includes gamete and flagellate forms of P. antarctica, Telonema antarctica, Leucocryptos sp., Polytoma sp., Pyramimonas gelidicola, Geminigera sp., Mantoniella sp., Bodo sp., Triparma laevis subsp. ramispina, T. laevis subsp. pinnatilobata and an unidentified haptophyte. Similarly microheterotrophs comprised only ∼ 1 % of all cells, of which an unidentified euglenoid was the most abundant (making up 80 % of the total microheterotrophic abundance). Dinoflagellates were grouped into autotrophic dinoflagellates (mainly Gymnodinium and Heterocapsa) and heterotrophic dinoflagellates (predominantly Gyrodinium spp., G. glaciale, G. lachryma and Protoperidinium cf. antarcticum). Ciliates were grouped together but were mostly comprised of Strombidium spp. While none of these functional groups had a response correlated with fCO2 treatment, this may be due to uncertainties related to overall low counts.
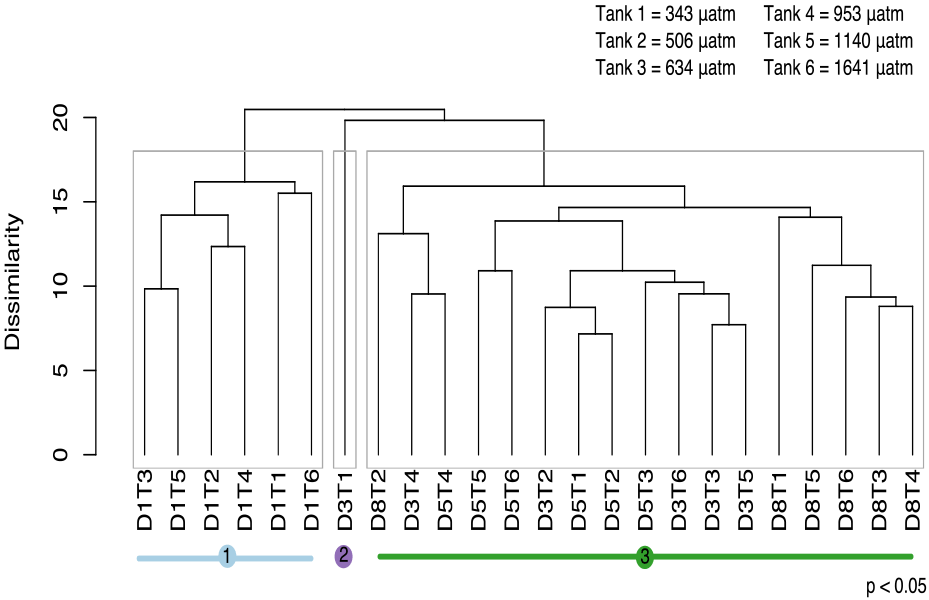
Figure 9Cluster analysis based on similarity in protistan community structure among fCO2 treatments and times during the acclimation period (days 1 to 8). In this analysis there are three significantly different groups identified by SIMPROF (denoted by grey boxes around clusters and coloured lines beneath sample labels). Samples are abbreviated according to days of incubation (D1–8) and fCO2 treatment (T1–6 representing 343, 506, 634, 953, 1140, 1641 µatm, respectively).
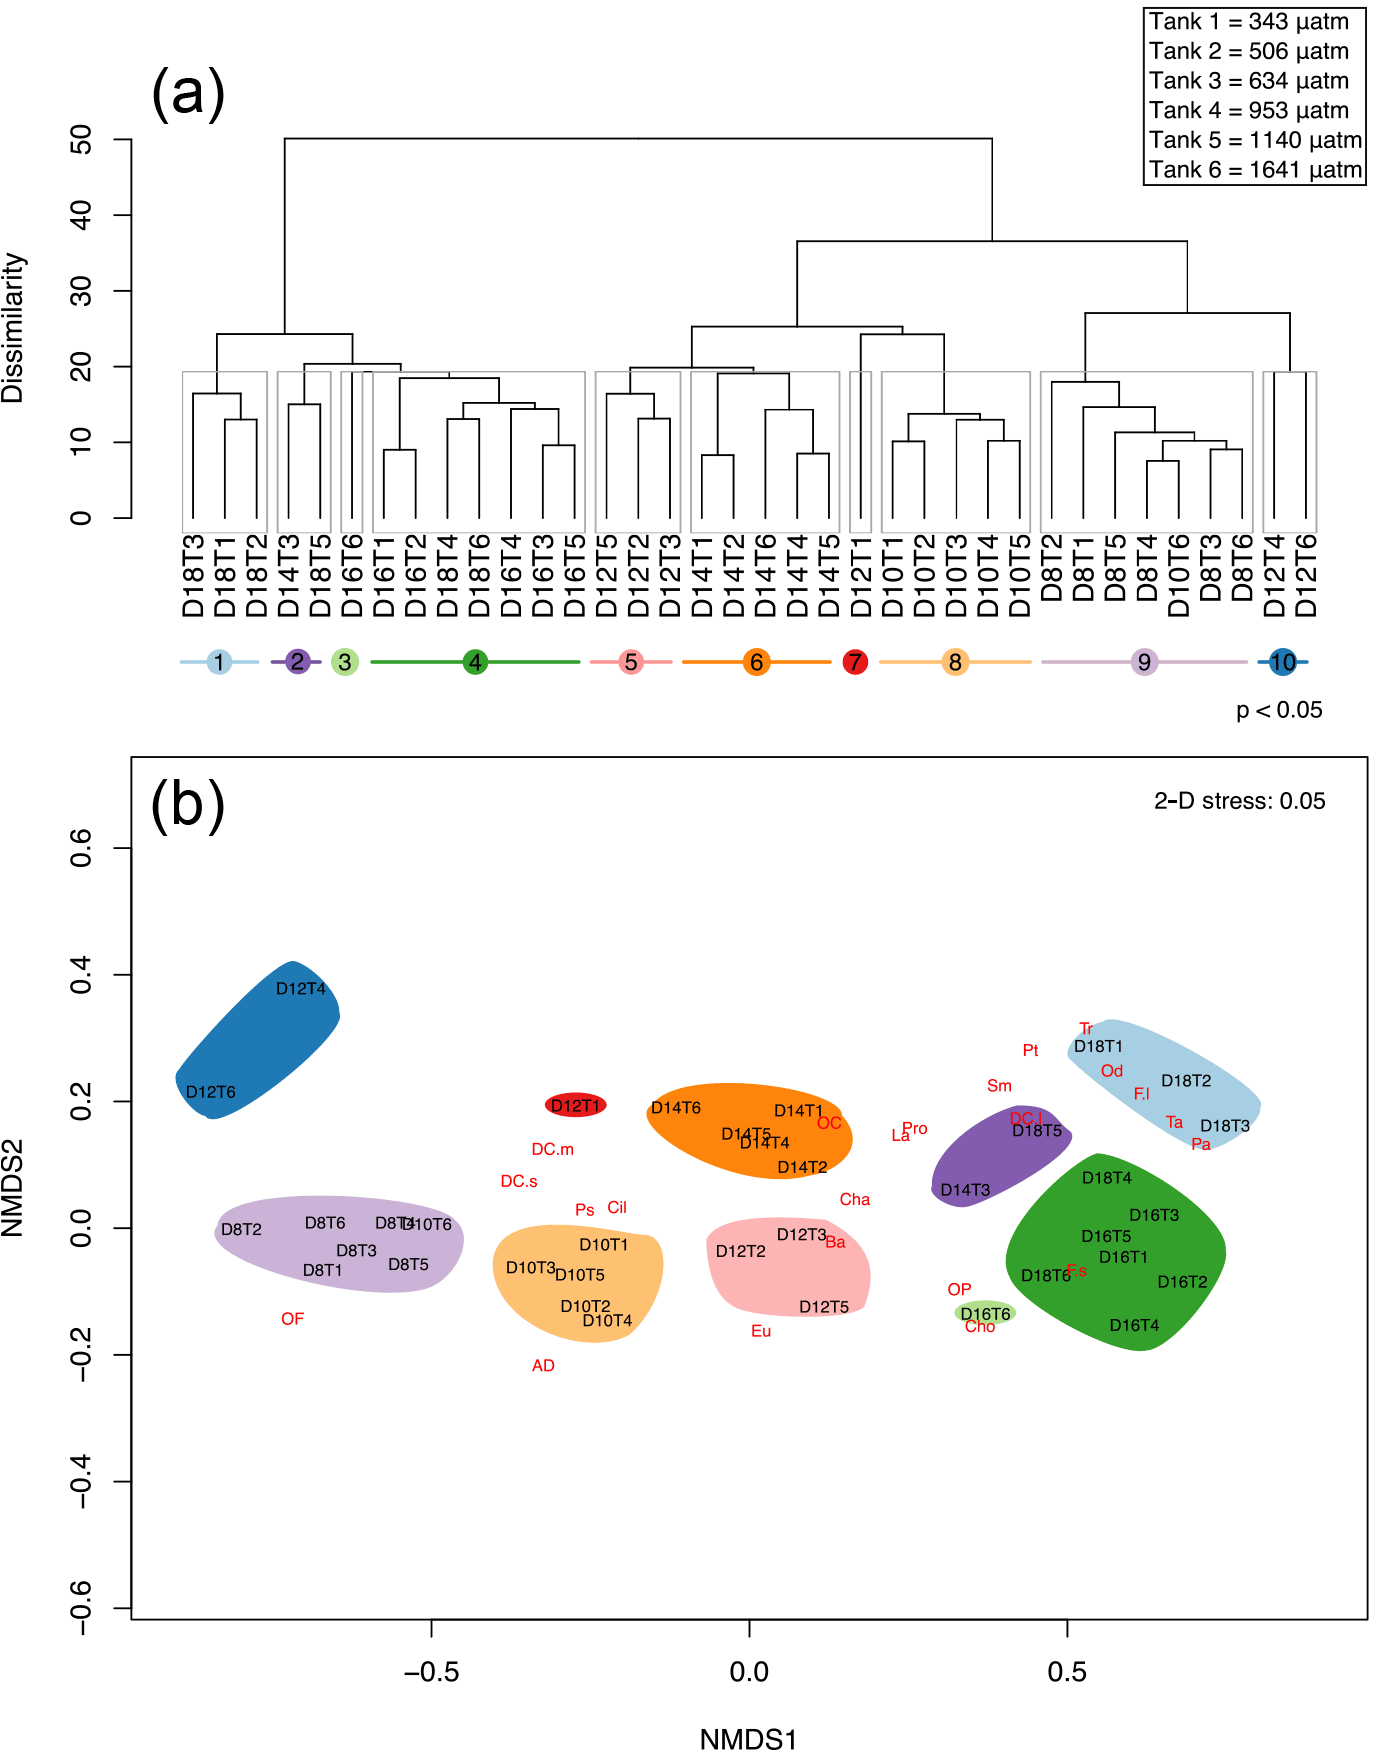
Figure 10Cluster analysis and nMDS based on similarity in protistan community structure among fCO2 treatments and times over days 8 to 18 of the incubation. (a) The cluster analysis with ten significantly different groups obtained by SIMPROF (denoted by grey boxes around clusters and coloured lines beneath sample labels). (b) nMDS plot structure of the unconstrained ordination of dissimilarities in protistan community structure with time and fCO2 treatment in two dimensions, overlaid with weighted-averages of the day-treatment scores for each protistan taxa/functional group (see Table 1 for abbreviations). Samples are abbreviated according to days of incubation (D8–18) and fCO2 treatment (T1–6 representing 343, 506, 634, 953, 1140, 1641 µatm, respectively).

Figure 11Canonical analysis of principal co-ordinates (CAP) based on the similarity in protistan community structure among fCO2 treatments and times over days 8 to 18 of the incubation, showing the trajectory of change in the protistan community for each fCO2 level (coloured arrows) based on the abundance of the component taxa/functional groups. Arrow starting points are day 8 and all arrows end on day 18 of the experiment. Linear projections of significant constraints CO2, Si and P appear as blue linear arrows.
3.3 Community-level responses
Analyses of the community-level responses have been separated into the 8 day acclimation and 10 day growth periods. During acclimation, the growth of the cells was limited by low light. SIMPROF analysis of the protistan community over the acclimation period identified three significant groups (p<0.05) (Fig. 9). Group 1 is comprised of all the treatments at day 1. Group 3 contains all the treatments over days 3, 5 and 8 except for the lowest fCO2 treatment on day 3 (D3T1, group 2).
Cluster analysis and SIMPROF, based on the composition of the protistan community, identified 10 significantly different groups of samples (p value < 0.05) during the growth period (days 8 to 18) (Fig. 10a). On days 8 and 10 the communities did not differ among treatments, except for the highest fCO2 treatment on day 10 (D10T6), which was clustered with the day 8 samples (clusters 8 and 9, Fig. 10a). Day 12 treatments are scattered across the cluster groups but day 14 samples are again grouped together (all treatments except 634 µatm together in cluster 6). On day 16 the fCO2 treatments were clustered together except at the highest fCO2 level. By day 18 the fCO2 treatments had separated into two distinctly different groups; one with the three lowest fCO2 treatments and the second with the three highest fCO2 treatments. Interestingly, these three highest fCO2 treatments fall into the cluster with the day 16 samples (or nearby cluster 2). This means that at day 18 the higher fCO2 treatments (≥ 953 µatm) contained a protistan community more similar to that of day 16, and were significantly different to that of the day 18 lower fCO2 treatments (Fig. 10a).
A nMDS in two dimensions proved a reasonable approximation to the full multivariate structure (stress = 0.05), and depicts the similarity among clusters along with the relative contribution of each specific taxon/functional groups to each cluster (the more closely species are located to a sample in the nMDS, the more abundant it is in that sample) (Fig. 10b). The community at day 8 was dominated by unidentified discoid centric diatoms with a valve diameter smaller than 40 µm, flagellates, ciliates, P. subcurvata and dinoflagellates (heterotrophic dinoflagellates are located off to the left of the plot in Fig. 10b). By day 18 the community had shifted to be dominated by Fragilariopsis spp., T. antarctica, T. ritscheri, Odontella spp. and P. antarctica (Fig. 10b). During the experiment other taxa emerged between days 10 and 14, including an unidentified euglenoid, L. annulata, B. antennigera and other centric diatoms. Other taxa increased in abundance between days 14 and 16, including other choanoflagellates, micro-sized centric diatoms (i.e. P. truncata and S. microtrias), and pennate diatoms (i.e. P. turgiduloides) (Fig. 10b). At the end of the experiment (day 18) micro-sized diatoms, T. ritscheri, Odontella spp. and Fragilariopsis spp. (> 20 µm) as well as P. antarctica are located close to the lower fCO2 treatments for day 18 (cluster 1), and resistant nano-sized Fragilariopsis spp. (≤ 20 µm) is found near the high fCO2 treatments (cluster 4). Interestingly, T. antarctica is also located close to the lower fCO2 treatments despite being quite resistant to increased fCO2 when analysed as a single species (Figs. 10b and 3b).
Table 2Canonical analysis of principal coordinates (CAP) axis significance against covariates. Permutation tests assessing the significance of each constrained axis in CAP using the covariates fCO2, P and Si as constraints upon community structure.
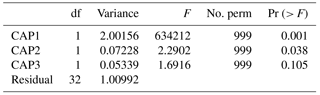
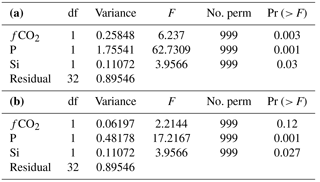
Table 3Permutation tests assessing the significance of each environmental covariate (constraint) in determining protistan community structure using principal co-ordinates (CAP), with significance of each term when (a) sequential added (b) marginal effects for fCO2, P and Si.
From the nMDS the lag in community growth and succession in the highest fCO2 level (Tank 6, 1641 µatm) can be seen. At day 10, the community in this treatment is grouped among all tanks sampled on day 8, likewise at day 12, 14, 16 and 18 it is consistently closer to samples from the previous time point (Fig. 10b). Thus, the highest fCO2 level inhibits growth and succession in the protistan community such that it is consistently a time point behind the other fCO2 treatments.
Differences in the trajectory of the protistan community succession over time in the different fCO2 treatments is represented in the CAP analysis (Fig. 11). This analysis, using covariates fCO2, NOx, Si and P, provided a model which explained 71.61 % of the variation in similarity among samples (, p<0.001 based on 999 permutations). However, NOx was not significant (, p>0.200 based on 999 permutations) and was therefore dropped from the model. In the reduced CAP model, CAP1 and CAP2 were both significant (p<0.05) (Table 2), and the remaining terms fCO2, Si and P together accounted for 70.35 % of the total variance (, p<0.001 based on 999 permutations). Considering each term marginal to all others (i.e. the contribution of a term after first accounting for all other terms), fCO2 accounted for 2.92 %, P 22.68 % and Si 5.21 % of the variance. The remaining terms present in the reduced model were all significant when sequentially added, but in the marginal effects only P and Si were significant, not fCO2 (p>0.100) (Table 3a and b respectively). The CAP analysis shows a separation of the protistan community between low (≤ 506 µatm), medium (634 to 1140 µatm) and high (1641 µatm) fCO2 treatments (Fig. 11). At day 18 there are two distinct treatment groups; those exposed to low and moderate fCO2 (343, 506 and 634 µatm) and those exposed to high fCO2 (953, 1140 and 1641 µatm).
4.1 Acclimation to high fCO2
Changes in the protistan composition and abundance during the acclimation period of the experiment (days 1 to 8) were likely due to the transfer and establishment of the natural communities in the minicosm tanks rather than exposure to increasing fCO2. There was a significant shift in species composition between day one and all other sampling times during acclimation. The collection of seawater and the minicosm conditions may have been sub-optimal for some species (Kim et al., 2008). It is likely this change in community composition reflects the change in environmental conditions between the natural environment and the minicosms (i.e. light, temperature, turbulence etc.).
Throughout the experiment the community structure of the highest fCO2 (1641 µatm) was more closely associated with that of other treatments at the previous time point, rather than those on the same day. For example, the community structure at 1641 µatm on day 10 is associated with the community structure of day 8, rather than the other treatments on day 10. This suggests that the highest fCO2 inhibits growth and succession in the protistan community. Deppeler et al. (2018) showed that during acclimation there was a decrease in the photosynthetic health of the community, but whilst all treatments had recovered by day 12, the highest fCO2 treatment had a greater decline in photosynthetic health and took longer to recover. This was also seen in the increase in chlorophyll a, rate of productivity and depletion of macronutrients (Deppeler et al., 2018). Together with the findings reported herein, this data suggests that there is a “lag” in the development of the protistan community at the highest fCO2 treatment.
4.2 Autotrophic protist taxa-specific responses
The protistan community in this study was highly diverse, and the detailed taxonomic classification employed allowed the range of responses by the individual taxa to be resolved. In diatoms the response was mainly size-related. Nano-sized diatom abundance was unaffected by fCO2 treatment, but the abundance of most micro-sized diatoms increased at moderate fCO2 levels (634–953 µatm) but decreased in higher fCO2 treatments. This trend is even evident in a single species as Fragilariopsis spp. cells > 20 µm had a similar response to other micro-sized centric diatoms, but those ≤ 20 µm showed no effect of fCO2. Whilst the response for most diatom taxa was related to cell size, a couple of species did not follow this trend. Proboscia truncata and Lauderia annulata are both larger diatom species but had no fCO2 response. Interestingly, this size-related trend was not present in non-diatom taxa. Unlike nano-sized diatoms, the dominant nano-sized autotrophic flagellate, Phaeocystis antarctica, dramatically declined in abundance at the three highest fCO2 levels. P. antarctica had an increase in abundance with moderate fCO2 levels but had a strong threshold level between 634 and 963 µatm, above which abundances were low. This might indicate that the size-related effect of fCO2 is restricted to diatoms.
For some diatom taxa, such as P. truncata and L. annulata, the response to fCO2 was not size-related and other factors effected their abundances. On day 18 of the experiment, NOx levels fell below detection in all fCO2 treatments and on day 16 treatments of 343, 634 and 953 µatm of fCO2 had lower NOx concentrations compared to the other three treatments (Fig. S3). The abundances of total cells, Fragilariopsis spp. ≤ 20 µm and Chaetoceros spp. all decreased between days 16 and 18. It was thought that this may have been due to nutrient depletion rather than fCO2, however the decrease in abundances often did not occur in those tanks with the lowest nutrient levels on day 16 (343, 634 and 953 µatm). The greatest rate of decline in the total cell abundance between days 16 and 18 was seen at 1140 µatm, not 343, 634 or 953 µatm, which had the lowest NOx concentration. Similarly, the decline in abundance of nano-sized Fragilariopsis spp. was greatest at 506 µatm, and Chaetoceros spp. had an increase in abundance at 343 µm despite NOx being lowest at day 16 in these treatments. Thus, while differences in the concentration of nutrients among tanks may have influenced the abundance of protists on day 18 of the experiment, the poor correlation of changes in abundance with nutrient depletion suggest that other factors, such as inter-specific competition, exerted a greater effect on the community composition.
A number of Antarctic studies have found that the ratios of larger sized diatoms to smaller diatom taxa have increased with increasing CO2 (Feng et al., 2010; Tortell et al., 2008b; Hoppe et al., 2013; Trimborn et al., 2013). This study is consistent with that of Tortell et al. (2008b) where Pseudo-nitzschia subcurvata decreased in abundance with increased CO2. However unlike Tortell et al. (2008b), this study shows a shift towards smaller pennate species similar to Hoppe et al. (2013), not larger chain-forming diatoms. This may be due to the difference in Chaetoceros species between the two studies: mainly C. castracanei and C. tortissimus here compared to the larger C. debilis in the study by Tortell et al. (2008b). This study also contrasts with other Antarctic ocean acidification studies that found that P. antarctica abundance either increased (Trimborn et al., 2017) or was not affected at CO2 levels above that of the current ambient level (Tortell et al., 2008b; Feng et al., 2010; Trimborn et al., 2013; Young et al., 2015). It is noted that these studies were conducted in the Ross Sea where the community fluctuates between being diatom dominant and Phaeocystis dominant dependent on the level of mixing (Arrigo et al., 1999). This contrasts with other coastal East Antarctic areas, where the summer phytoplankton community is dominated by Phaeocystis and subsequently diatom blooms which then shifts to small flagellates once nutrients are exhausted, making it a very different system to the Ross Sea (Waters et al., 2000; Wright and van den Enden, 2000; Davidson et al., 2010; Deppeler and Davidson, 2017). In addition to these regional differences, the fCO2 treatments used in this study extend well past the range of other studies, in which the highest level was typically between 750 and 1000 µatm (compared to 1641 µatm here). When the results of this study are compared with CO2 levels used in the other studies, the conclusions are mostly in agreement. For example, the increase in larger diatoms at CO2 levels between 700 and 800 µatm in Antarctica (Tortell et al., 2008b; Feng et al., 2010), and elsewhere around the world (i.e. Wu et al., 2014), agree with the increase in micro-sized diatoms in this study at fCO2 between 343–634 µatm. Trimborn et al. (2017) saw an increase in P. antarctica at 800 µatm CO2 agreeing with the increase in P. antarctica here to CO2 ≤ 634 µatm. Thus, the different findings between this study and previous studies are likely due to the choice of experimental CO2 levels relative to the tolerance threshold of the species or community being studied.
It has been hypothesized that phytoplankton will generally benefit from increased CO2 due to the low affinity of RuBisCO's for CO2 (Reinfelder, 2011). The half saturation constant of RuBisCO for CO2 is substantially higher than the concentration of CO2 in ambient seawater, and it has been proposed that the anthropogenic rise in oceanic CO2 may enhance the rates of phytoplankton photosynthesis (Rost et al., 2008). Most phytoplankton species have highly regulated carbon concentrating mechanisms (CCMs) which enhance the CO2 available for photosynthesis by increasing the CO2 supply so that it is less rate-limiting (Reinfelder, 2011; Trimborn et al., 2013). This was observed by Tortell et al. (2008a) who found that natural phytoplankton assemblages up-regulated their CCMs to compensate for low CO2 compared to phytoplankton in higher CO2 conditions (Trimborn et al., 2013). The response of CCM activity to increased fCO2 in this study is reported by Deppeler et al. (2018), and showed that CCM activity was down-regulated in the highest fCO2 treatment but not at the lowest fCO2. Yet these beneficial effects of enhanced CO2 availability are offset against the coincident increase of H+ ion concentration. It is thought that the energy saved by decreased CCM activity will be off-set against the energy required to increase intracellular processes that mitigate this H+ increase in the cell (i.e. proton pump) (Taylor et al., 2012; McMinn et al., 2014; Cyronak et al., 2015; Gafar et al., 2017). McMinn et al. (2014) showed sea ice algal growth was unaffected by an increase in CO2 but declined when the elevation of CO2 led to a consequent decrease in pH (and increase in H+ ions), as is predicted in future ocean acidification conditions. The results from this experiment suggest a combination of these two effects with a tipping point for this trade-off between beneficial effects of increase CO2 and the inhibitory effects of increased H+ ion concentration between 634 and 953 µatm or pH 7.85 and 7.69.
4.3 Response of heterotrophic protists
Intriguingly, CO2-induced different responses in the two dominant choanoflagellate taxa/groups of this study; Bicosta antennigera abundance declined above 506 µatm, while other choanoflagellates (> 90 % being Diaphanoeca multiannulata) were unaffected by fCO2. This is the first study to report differing responses of choanoflagellate abundances to ocean acidification. Previous studies have reported no effect (Moustaka-Gouni et al., 2016a, b) or a decrease (Davidson et al., 2016) of choanoflagellates due to increased CO2, but have not identified taxon specific differences. The reasons for choanoflagellate taxa responding differently to elevated CO2 are unclear. Gong et al. (2010) found that lorica formation in choanoflagellates can be effected by pH changes but SEM preparations in this study found no evidence of this. Some studies on the flagella of sperm from reef invertebrates and oysters have suggested that increased CO2 can slow metabolic rates or interrupt flagella function (Havenhand and Schlegel, 2009; Morita et al., 2009). This difference in sensitivity to CO2 may reflect the differences in lorica complexity, cellular morphology or physiology among taxa.
If the species-specific response of choanoflagellates is indicative of the broader microheterotrophic community, then this finding highlights a previously unseen level of complexity regarding the effect of ocean acidification on microbial communities. Previous studies have observed no direct CO2 related effect on microheterotrophic protozoan community composition (Suffrian et al., 2008; Aberle et al., 2013). Unfortunately, the abundance of protistan heterotrophs other than choanoflagellates in this study was generally low and with highly variable, making it difficult to detect any CO2 response. If the species-specific responses observed in choanoflagellates are indicative of CO2-induced responses by other microheterotrophic grazers (e.g. heterotrophic dinoflagellates and ciliates), the implications for top-down control of protists and prokaryotes could be significant.
4.4 Community-level responses
In this study there is a significant shift in the protistan community structure with increasing fCO2. The community response is not linear with a general increase in abundances between 343 to 634 µatm favouring micro-sized centric diatoms and P. antarctica. Above a threshold of 634 µatm in fCO2 there is a decrease in abundance and shift towards nano-sized Fragilariopsis spp. While the nMDS and CAP show that the primary driving factor behind community change was sampling day (which covaried with nutrient concentration), a significant fCO2 induced response was observed. Concentrations of NOx were at a minimum in treatments 343, 634 and 953 µatm on day 16, and dropped below detection in all treatments between days 16 and 18. Despite this depletion of NOx, it is not a significant driver in the shifts of the protistan community structure. NOx was dropped in the reduced CAP model but P and Si were significant despite these macronutrients remaining above detectable levels throughout the entire experiment. Community-level studies have reported shifts in community composition with increased fCO2 (Schulz et al., 2017, and references therein), but what has not been reported before is the curved response of a natural Antarctic protistian community to a CO2 gradient (with enhanced abundance at intermediate levels and a decrease at higher).
Davidson et al. (2016) and Thomson et al. (2016) found a significant shift in the structure of the protistan community at CO2 levels between 750 to 1281 µatm during a similar series of minicosm experiments at Prydz Bay in 2008–2009. As here, above the threshold there was a shift in the structure of the protistan community towards a picoplankton dominated community, and an overall decrease in total protistan abundance. Thomson et al. (2016) reported results from three different starting communities and nutrients levels, but despite these differences the threshold remained the same. This study differs from that of Davidson et al. (2016) and Thomson et al. (2016) in that it has a narrower CO2 range in the treatments, and it also included an acclimation period. Despite these differences, the threshold level found in our study falls in that of Davidson et al. (2016) and Thomson et al. (2016). Unlike those previous studies, microplankton abundance increased at moderate CO2 enrichment (506 to 634 fCO2). This could be due to having six treatments across a smaller CO2 range, therefore allowing a higher resolution in the response of the community prior to the threshold. It could also be due to the inclusion of an acclimation period, giving cells time to adjust to the CO2 level prior to the beginning of growth and therefore allowing them to capitalize on the benefits of moderately elevated CO2. In summary, there is a consistent CO2 threshold that elicits changes in the structure of microbial communities in near-shore waters of Prydz Bay, East Antarctica, both within a season and among seasons. Furthermore, irrespective of including an acclimation phase, the nature of the change in the protistan communities at high CO2 remains similar, although the magnitude can change greatly.
The flow on effect of decreased abundance and a structural shift in the protistan community to a nano- and picoplankton dominated community could be far-reaching, altering the near-shore Antarctic food web and biogeochemical cycles. Many studies have found that a shift in protistan community composition can affect the palatability, nutritional quality and availability of phytoplankton cells available to grazers and the higher trophic levels (Rossoll et al., 2012; Caron and Hutchins, 2013; Bermúdez et al., 2016; Davidson et al., 2016). Antarctic microbes are also a vital component of many elemental cycles and play important roles in the feedback of the Southern Ocean to global climate change (Arrigo and Thomas, 2004; Arrigo et al., 2008; Kirchman, 2008). The results of this study suggest that the abundance of P. antarctica could significantly change with future increases in fCO2. This species is particularly important in a number of near-shore Antarctic nutrient cycles through their substantial production of dimethyl sulfide, which acts as a cloud condensation nuclei when released into the atmosphere (Liss et al., 1994). P. antarctica also plays a vital role in the carbon flux when in colonial form. Davidson and Marchant (1992) found that the majority of Phaeocystis biomass remains unutilized and therefore enters the carbon cycle in a dissolved organic form. Likewise, micro-sized diatom species are also important in the sequestration of carbon to the deep ocean through their role in the vertical carbon flux (Passow and Carlson, 2012; Caron and Hutchins, 2013). The effect of a protistan community dominated by nano- and picoplankton on this vertical flux is uncertain, but any decline in this flux would have a positive feedback on atmospheric CO2 levels, as instead of being sequestrated to the deep ocean it would be respired in near-surface waters and released into the atmosphere.
Returning to the aims of this study, there are three main conclusions:
-
The responses to increased fCO2 was taxon-specific in both autotrophic and heterotrophic protists, with different taxa having different tolerance thresholds for fCO2. In diatoms this response was mainly driven by cell size, with nanoplankton having a high tolerance to increased fCO2 while microplanktonic diatoms were less tolerant. This trend is consistent even within a taxon as demonstrated by the nano- to micro-sized Fragilariopsis spp. cells in this experiment.
-
An increase in fCO2 significantly changes the composition and abundance of protists in this coastal East Antarctic community, with a threshold for change estimated to be between 634 and 953 µatm. Below this threshold there is an increase in protistan abundance and the community was characterized by large centric diatoms and Phaeocystis antarctica. Above the threshold there was a decrease in total abundance and the community was dominated by nano-sized diatoms, mainly Fragilariopsis spp. ≤ 20 µm.
-
Comparisons with Davidson et al. (2016) and Thomson et al. (2016) find that this threshold level is not only consistent across a season but also between years for protistan communities at Prydz Bay, East Antarctica.
The results of this study suggest that there is a consistent threshold level above which the structure of this near-shore Antarctic protistan community significantly changes, and this threshold is around the CO2 level predicted for the end of this century (IPCC, 2014). This change could have significant flow-on effects to the coastal Antarctic ecosystem as it could alter the many ecosystem services that marine microbes provide, and result in cascading effects through the Antarctic food web and elemental cycling in general, with feedbacks on global climate.
Abundance data and environmental covariate data used in the statistical analyses is available via the Australian Antarctic Division Data Centre (Hancock et al., 2017a).
Environmental data including macronutrient, temperature, light, and carbonate chemistry speciation is available via the Australian Antarctic Division Data Centre (Deppeler et al., 2017).
Code used for the statistical analyses is available via the Australian Antarctic Division Data Centre (Hancock et al., 2017b).
The supplement related to this article is available online at: https://doi.org/10.5194/bg-15-2393-2018-supplement.
ATD designed the research and led the minicosm experiment at Davis Station, Antarctica and all carbonate chemistry measurements, calculations and manipulations were performed by KGS. ATD collected the samples during the experiment and AMH performed all light and electron microscopy work with assistance from ATD and RLvdE. AMH conducted the data and statistics analysis using R code and the statistical approach was developed by JM. ATD and JM provided assistance and guidance with data and statistical analysis and interpretation. AMH prepared the manuscript with contributions from all co-authors.
The authors declare that they have no conflict of interest.
This article is part of the special issue “The Ocean in a High-CO2 World IV”. It is a result of the 4th International Symposium on the Ocean in a High-CO2 World, Hobart, Australia, 3–6 May 2016.
This work was supported by the Australian Government Department of
Environment and Energy as part of Australian Antarctic Science project 4026
at the Australian Antarctic Division, as well as the Australian Research
Council's Special Research Initiative for Antarctic Gateway Partnership
(Project ID SR140300001) and the Australian Governments Cooperative Research
Centres Program through the Antarctic Climate and Ecosystems Cooperative
Research Centre (ACE CRC). We would like to acknowledge the Australian
Antarctic Division for technical and logistical support, as well as the other
members of the minicosm experimental team at Davis Station 2014 and the
expedition members at Davis Station the summer of 2014 and 2015 for their support
and assistance. We would also like to thank Simon Reeves for providing R code
that created the temporal graphs.
Edited by: Elizabeth H. Shadwick
Reviewed by: four anonymous referees
Aberle, N., Schulz, K. G., Stuhr, A., Malzahn, A. M., Ludwig, A., and Riebesell, U.: High tolerance of microzooplankton to ocean acidification in an Arctic coastal plankton community, Biogeosciences, 10, 1471–1481, https://doi.org/10.5194/bg-10-1471-2013, 2013. a
Arrigo, K. R. and Thomas, D. N.: Large scale importance of sea ice biology in the Southern Ocean, Antarct. Sci., 16, 471–486, https://doi.org/10.1017/S0954102004002263, 2004. a, b
Arrigo, K. R., Robinson, D. H., Worthen, D. L., Dunbar, R. B., DiTullio, G. R., VanWoert, M., and Lizotte, M. P.: Phytoplankton community structure and the drawdown of nutrients and CO2 in the Southern Ocean, Science, 283, 365–367, 1999. a
Arrigo, K. R., van Dijken, G. L., and Bushinsky, S.: Primary production in the Southern Ocean, 1997-2006, J. Geophys. Res. Ocean., 113, C08004, https://doi.org/10.1029/2007JC004551, 2008. a, b
Bermúdez, J. R., Riebesell, U., Larsen, A., and Winder, M.: Ocean acidification adversely affects trophic interactions and transfer of essential biochemical compounds in a natural plankton community, Sci. Rep., 6, 1–8, https://doi.org/10.1038/srep27749, 2016. a
Bray, J. R. and Curtis, J. T.: An Ordination of the Upland Forest Communities of Southern Wisconsin, Ecol. Monogr., 27, 325–349, https://doi.org/10.2307/1942268, 1957. a
Brussaard, C. P. D., Noordeloos, A. A. M., Witte, H., Collenteur, M. C. J., Schulz, K., Ludwig, A., and Riebesell, U.: Arctic microbial community dynamics influenced by elevated CO2 levels, Biogeosciences, 10, 719–731, https://doi.org/10.5194/bg-10-719-2013, 2013. a
Caron, D. A. and Hutchins, D. A.: The effects of changing climate on microzooplankton grazing and community structure: Drivers, predictions and knowledge gaps, J. Plankton Res., 35, 235–252, https://doi.org/10.1093/plankt/fbs091, 2013. a, b
Clarke, K. R., Somerfield, P. J., and Gorley, R. N.: Testing of null hypotheses in exploratory community analyses: similarity profiles and biota-environment linkage, J. Exp. Mar. Bio. Ecol., 366, 56–69, https://doi.org/10.1016/j.jembe.2008.07.009, 2008. a
Cooley, S. R. and Doney, S. C.: Anticipating ocean acidification's economic consequences for commercial fisheries, Environ. Res. Lett., 4, 024007, https://doi.org/10.1088/1748-9326/4/2/024007, 2009. a, b
Cyronak, T., Schulz, K. G., and Jokiel, P. L.: The Omega myth: what really drives lower calcification rates in an acidifying ocean, ICES J. Mar. Sci., 73, 558–562, 2015. a
Davidson, A. T. and Marchant, H. J.: Protist abundance and carbon concentration during a Phaeocystis-dominated bloom at an Antarctic coastal site, Polar Biol., 12, 387–395, https://doi.org/10.1007/BF00243109, 1992. a
Davidson, A. T., Scott, F. J., Nash, G. V., Wright, S. W., and Raymond, B.: Physical and biological control of protistan community composition, distribution and abundance in the seasonal ice zone of the Southern Ocean between 30 and 80 E, Deep-Sea Res. Pt. II, 57, 828–848, 2010. a
Davidson, A. T., McKinlay, J., Westwood, K., Thomson, P. G., van den Enden, R., de Salas, M., Wright, S., Johnson, R., and Berry, K.: Enhanced CO2 concentrations change the structure of Antarctic marine microbial communities, Mar. Ecol. Prog. Ser., 552, 93–113, 2016. a, b, c, d, e, f, g, h, i, j, k
Deppeler, S. L. and Davidson, A. T.: Southern Ocean Phytoplankton in a Changing Climate, Front. Mar. Sci., 4, 40, https://doi.org/10.3389/fmars.2017.00040, 2017. a
Deppeler, S. L., Davidson, A. T., and Schulz, K.: Environmental data for Davis 14/15 ocean acidification minicosm experiment, Australian Antarctic Data Centre, https://doi.org/10.4225/15/599a7dfe9470a, 2017.
Deppeler, S., Petrou, K., Schulz, K. G., Westwood, K., Pearce, I., McKinlay, J., and Davidson, A.: Ocean acidification of a coastal Antarctic marine microbial community reveals a critical threshold for CO2 tolerance in phytoplankton productivity, Biogeosciences, 15, 209–231, https://doi.org/10.5194/bg-15-209-2018, 2018. a, b, c, d
Dickson, A. G.: The carbon dioxide system in seawater: equilibrium chemistry and measurements, in: Guid. to best Pract. Ocean Acidif. Res. data Report., edited by: Riebesell, U., Fabry, V. J., Hansson, L., and Gattuso, J.-P., chap. 1, p. 260, https://doi.org/10.2777/58454, 2010. a
Dickson, A. G., Sabine, C. L., and Christian, J. R.: Guide to best practices for ocean CO2 measurements., PICES Spec. Publ., 3, 191, https://doi.org/10.1159/000331784, 2007. a, b
Doney, S. C., Ruckelshaus, M., Emmett Duffy, J., Barry, J. P., Chan, F., English, C. A., Galindo, H. M., Grebmeier, J. M., Hollowed, A. B., Knowlton, N., Polovina, J., Rabalais, N. N., Sydeman, W. J., and Talley, L. D.: Climate Change Impacts on Marine Ecosystems, Ann. Rev. Mar. Sci., 4, 11–37, https://doi.org/10.1146/annurev-marine-041911-111611, 2012. a, b
Feng, Y., Hare, C. E., Rose, J. M., Handy, S. M., DiTullio, G. R., Lee, P. A., Smith, W. O., Peloquin, J., Tozzi, S., Sun, J., Zhang, Y., Dunbar, R. B., Long, M. C., Sohst, B., Lohan, M., and Hutchins, D. A.: Interactive effects of iron, irradiance and CO2 on Ross Sea phytoplankton, Deep-Sea Res. Pt. I, 57, 368–383, https://doi.org/10.1016/j.dsr.2009.10.013, 2010. a, b, c, d, e
Gafar, N. A., Eyre, B. D., and Schulz, K. G.: A conceptual model for projecting coccolithophorid growth, calcification and photosynthetic carbon fixation rates in response to global ocean change, Frontiers in Marine Science, 4, 433, https://doi.org/10.3389/fmars.2017.00433, 2017. a
Gibson, J. A. E. and Trull, T. W.: Annual cycle of fCO2 under sea-ice and in open water in Prydz Bay, East Antarctica, Mar. Chem., 66, 187–200, 1999. a, b
Gong, N., Wiens, M., Schröder, H. C., Mugnaioli, E., Kolb, U., and Müller, W. E. G.: Biosilicification of loricate choanoflagellate: organic composition of the nanotubular siliceous costal strips of Stephanoeca diplocostata, J. Exp. Biol., 213, 3575–3585, https://doi.org/10.1242/jeb.048496, 2010. a
Hancock, A. M., Davidson, A. T., McKinlay, J., McMinn, A., Schulz, K., and van den Enden, D.: Ocean acidification changes the structure of an Antarctic coastal protistan community, Australian Antarctic Data Centre, https://doi.org/10.4225/15/592b83a5c7506, 2017a.
Hancock, A. M., Davidson, A. T., McKinlay, J., McMinn, A., Schulz, K., and van den Enden, D.: Ocean acidification changes the structure of an Antarctic coastal protistan community, Australian Antarctic Data Centre, CAASM Metadata available at: https://data.aad.gov.au/metadata/records/AAS_4026_Microscopy_Multivariate_Statistics_Rcode (created on: 29 May 2017), 2017b.
Hare, C. E., Leblanc, K., DiTullio, G. R., Kudela, R. M., Zhang, Y., Lee, P. A., Riseman, S., and Hutchins, D. A.: Consequences of increased temperature and CO2 for phytoplankton community structure in the Bering Sea, Mar. Ecol. Prog. Ser., 352, 9–16, https://doi.org/10.3354/meps07182, 2007. a
Havenhand, J. N. and Schlegel, P.: Near-future levels of ocean acidification do not affect sperm motility and fertilization kinetics in the oyster Crassostrea gigas, Biogeosciences, 6, 3009–3015, https://doi.org/10.5194/bg-6-3009-2009, 2009. a
Hoppe, C. J. M., Hassler, C. S., Payne, C. D., Tortell, P. D., Rost, B., and Trimborn, S.: Iron Limitation Modulates Ocean Acidification Effects on Southern Ocean Phytoplankton Communities, PLoS One, 8, e79890, https://doi.org/10.1371/journal.pone.0079890, 2013. a, b, c, d
IPCC: Workshop Report of the Intergovernmental Panel on Climate Change Workshop on Impacts of Ocean Acidification on Marine Biology and Ecosystems, edited by: Field, C. B., Barros, V., Stocker, T. F., Qin, D., Mach, K. J., Plattner, G.-K., Mastrandrea, M. D., Tignor, M., and Ebi, K. L., IPCC Working Group II Technical Support Unit, Carnegie Institution, Stanford, California, United States of America, 2011. a
IPCC: Climate Change 2014. Contribution of Working Groups I, II and III to the Fifth Assessment Report of the Intergovernmental Panel on Climate Change, edited by: Core Writing Team, Pachauri, R. K., and Meyer, L. A., IPCC, Geneva, Switzerland, 2014. a
Kim, J.-M., Shin, K., Lee, K., and Park, B.-K.: In situ ecosystem-based carbon dioxide perturbation experiments: Design and performance evaluation of a mesocosm facility, Limnol. Oceanogr. Methods, 6, 208–217, https://doi.org/10.4319/lom.2008.6.208, 2008. a
Kirchman, D. L. (Ed.): Microbial Ecology of the Oceans, John Wiley & Sons Inc., New Jersey, 2008. a, b, c
Kruskal, J. B.: Nonmetric multidimensional scaling: a numberical method, Psychometrika, 29, 115–129, 1964a. a
Kruskal, J. B.: Multidimensional scaling by optimizing goodness of fit to a nonmetric hypothesis, Psychometrika, 29, 1–27, 1964b. a
Legendre, P. and Anderson, M. J.: Distance-Based Redundancy Analysis: Testing Multispecies Responses in Multifactorial Ecological Experiments, Ecol. Monogr. Ecol. Monogr., 69, 1–24, 1999. a
Legendre, P., Oksanen, J., and ter Braak, C. J. F.: Testing the significance of canonical axes in redundancy analysis, Methods Ecol. Evol., 2, 269–277, https://doi.org/10.1111/j.2041-210X.2010.00078.x, 2011. a
Liss, P., Malin, G., Turner, S., and Holligan, P.: Dimethyl sulphide and Phaeocystis: a review, J. Marine Syst., 5, 41–53, 1994. a
Marchant, H. J. and Thomas, D. P.: Polylysine as an adhesive for the attachment of nanoplankton to substrates for electron microscopy, J. Microsc., 131, 127–129, 1983. a
McMinn, A., Müller, M. N., Martin, A., and Ryan, K. G.: The Response of Antarctic Sea Ice Algae to Changes in pH and CO2, PLoS One, 9, e86984, https://doi.org/10.1371/journal.pone.0086984, 2014. a, b
McNeil, B. I., Tagliabue, A., and Sweeney, C.: A multi-decadal delay in the onset of corrosive `acidified' waters in the Ross Sea of Antarctica due to strong air-sea CO2 disequilibrium, Geophys. Res. Lett., 37, L19607, https://doi.org/10.1029/2010GL044597, 2010. a
Morita, M., Suwa, R., Iguchi, A., Nakamura, M., Shimada, K., Sakai, K., and Suzuki, A.: Ocean acidification reduces sperm flagellar motility in broadcast spawning reef invertebrates, Zygote, 18, 103–107, https://doi.org/10.1017/S0967199409990177, 2009. a
Moustaka-Gouni, M., Genitsaris, S., Kormas, K. A., Scotti, M., Vardaka, E., and Sommer, U.: Heterotrophic pico- and nano-flagellates: a food web within pelagic food webs, Rapp. Comm. int. Mer Médit., 41, 401, 2016a. a
Moustaka-Gouni, M., Kormas, K. A., Scotti, M., Vardaka, E., and Sommer, U.: Warming and Acidification Effects on Planktonic Heterotrophic Pico- and Nanoflagellates in a Mesocosm Experiment, Protist, 167, 389–410, https://doi.org/10.1016/j.protis.2016.06.004, 2016b. a
Oksanen, J., Blanchet, F. G., Friendly, M., Kindt, R., Legendre, P., McGlinn, D., Minchin, P. R., O'Hara, R. B., Simpson, G. L., Solymos, P., Stevens, M. H. H., Szoecs, E., and Wagner, H.: vegan: Community Ecology Package, r package version 2.4-2, 2017. a, b
Olrik, K.: Methods for Quantitative Assessment of Phytoplankton in Freshwaters, Part I, Swedish Environmental Protection Agency, Stockholm, 1998. a
Orr, J. C., Fabry, V. J., Aumont, O., Bopp, L., Doney, S. C., Feely, R. A., Gnanadesikan, A., Gruber, N., Ishida, A., Joos, F., Key, R. M., Lindsay, K., Maier-Reimer, E., Matear, R., Monfray, P., Mouchet, A., Najjar, R. G., Plattner, G.-K., Rodgers, K. B., Sabine, C. L., Sarmiento, J. L., Schlitzer, R., Slater, R. D., Totterdell, I. J., Weirig, M.-F., Yamanaka, Y., and Yool, A.: Anthropogenic ocean acidification over the twenty-first century and its impact on calcifying organisms., Nature, 437, 681–686, https://doi.org/10.1038/nature04095, 2005. a
Passow, U. and Carlson, C. A.: The biological pump in a high CO2 world, Mar. Ecol. Prog. Ser., 470, 249–271, https://doi.org/10.3354/meps09985, 2012. a
Peres-Neto, P. R. and Jackson, D. A.: How Well Do Multivariate Data Sets Match? The Advantages of a Procrustean Superimposition Approach over the Mantel Test, Oecologia, 129, 169–178, https://doi.org/10.1007/s004420100720, 2001. a
R Core Team: R: A Language and Environment for Statistical Computing, R Foundation for Statistical Computing, Vienna, Austria, 2016. a
Reinfelder, J. R.: Carbon Concentrating Mechanisms in Eukaryotic Marine Phytoplankton, Ann. Rev. Mar. Sci., 3, 291–315, https://doi.org/10.1146/annurev-marine-120709-142720, 2011. a, b
Roden, N. P., Shadwick, E. H., Tilbrook, B., and Trull, T. W.: Annual cycle of carbonate chemistry and decadal change in coastal Prydz Bay, East Antarctica, Mar. Chem., 155, 135–147, https://doi.org/10.1016/j.marchem.2013.06.006, 2013. a, b
Rossoll, D., Bermúdez, R., Hauss, H., Schulz, K. G., Riebesell, U., Sommer, U., and Winder, M.: Ocean acidification-induced food quality deterioration constrains trophic transfer, PLoS One, 7, 2–7, https://doi.org/10.1371/journal.pone.0034737, 2012. a
Rost, B., Zondervan, I., and Wolf-Gladrow, D.: Sensitivity of phytoplankton to future changes in ocean carbonate chemistry: Current knowledge, contradictions and research directions, Mar. Ecol. Prog. Ser., 373, 227–237, https://doi.org/10.3354/meps07776, 2008. a
Schulz, K. G., Bach, L. T., Bellerby, R., Bermúdez, R., Büdenbender, J., Boxhammer, T., Czerny, J., Engel, A., Ludwig, Andrea nad Meyerhöfer, M., Larsen, A., Paul, A., Sswat, M., and Riebesell, U.: Phytoplankton blooms at increasing levels of atmospheric carbon dioxide: experimental evidence for negative effects on prymnesiophytes and positive on small picoeukaryotes, Front. Mar. Sci., 4, 64, https://doi.org/10.3389/fmars.2017.00064, 2017. a, b, c, d, e
Scott, F. J. and Marchant, H. J. (Eds.): Antarctic marine protists, Australian Biological Resources Study, Canberra, 2005. a, b
Suffrian, K., Simonelli, P., Nejstgaard, J. C., Putzeys, S., Carotenuto, Y., and Antia, A. N.: Microzooplankton grazing and phytoplankton growth in marine mesocosms with increased CO2 levels, Biogeosciences, 5, 1145–1156, https://doi.org/10.5194/bg-5-1145-2008, 2008. a
Taylor, A. R., Brownlee, C., and Wheeler, G. L.: Proton channels in algae: Reasons to be excited, Trends Plant Sci., 17, 675–684, https://doi.org/10.1016/j.tplants.2012.06.009, 2012. a
Thomson, P. G., Davidson, A. T., and Maher, L.: Increasing CO2 changes community composition of pico- and nano-sized protists and prokaryotes at a coastal Antarctic site, Mar. Ecol. Prog. Ser., 554, 51–69, https://doi.org/10.3354/meps11803, 2016. a, b, c, d, e, f, g, h
Tortell, P. D., Payne, C., Gueguen, C., Strzepek, R. F., and Boyd, P. W.: Inorganic carbon uptake by Southern Ocean phytoplankton, Limnol. Oceanogr., 53, 1266–1278, 2008a. a, b
Tortell, P. D., Payne, C. D., Li, Y., Trimborn, S., Rost, B., Smith, W. O., Riesselman, C., Dunbar, R. B., Sedwick, P., and DiTullio, G. R.: CO2 sensitivity of Southern Ocean phytoplankton, Geophys. Res. Lett., 35, 1–5, https://doi.org/10.1029/2007GL032583, 2008b. a, b, c, d, e, f, g, h
Trimborn, S., Brenneis, T., Sweet, E., and Rost, B.: Sensitivity of Antarctic phytoplankton species to ocean acidification: growth, carbon acquisition, and species interaction, Limnol. Oceanogr., 58, 997–1007, https://doi.org/10.4319/lo.2013.58.3.0997, 2013. a, b, c, d
Trimborn, S., Thoms, S., Brenneis, T., Heiden, J. P., Beszteri, S., and Bischof, K.: Two Southern Ocean diatoms are more sensitive to ocean acidification and changes in irradiance than the prymnesiophyte Phaeocystis antarctica, Physiol. Plant., 160, 155–170, https://doi.org/10.1111/ppl.12539, 2017. a, b
Waters, R., van den Enden, R., and Marchant, H.: Summer microbial ecology off East Antarctica (80–150 E): protistan community structure and bacterial abundance, Deep-Sea Res. Pt. II, 47, 2401–2435, 2000. a, b
Westwood, K., Thomson, P., van den Enden, R., Maher, L., Wright, S., and Davidson, A.: Ocean acidification impacts primary and bacterial production in Antarctic coastal waters during austral summer, J. Exp. Mar. Bio. Ecol., 498, 46–60, https://doi.org/10.1016/j.jembe.2017.11.003, 2018. a
Wright, S. W. and van den Enden, R. L.: Phytoplankton community structure and stocks in the East Antarctic marginal ice zone (BROKE survey, January–March 1996) determined by CHEMTAX analysis of HPLC pigment signatures, Deep-Sea Res. Pt. II, 47, 2363–2400, 2000. a
Wu, Y., Campbell, D. A., Irwin, A. J., Suggett, D. J., and Finkel, Z. V.: Ocean acidification enhances the growth rate of larger diatoms, Limnol. Oceanogr., 59, 1027–1034, https://doi.org/10.4319/lo.2014.59.3.1027, 2014. a
Young, J. N., Kranz, S. A., Goldman, J. A. L., Tortell, P. D., and Morel, F. M. M.: Antarctic phytoplankton down-regulate their carbon-concentrating mechanisms under high CO2 with no change in growth rates, Mar. Ecol. Prog. Ser., 532, 13–28, https://doi.org/10.3354/meps11336, 2015. a, b
- Article
(1932 KB) - Full-text XML