the Creative Commons Attribution 4.0 License.
the Creative Commons Attribution 4.0 License.
 | 04 May 2018
Dynamics and controls of heterotrophic prokaryotic production in the western tropical South Pacific Ocean: links with diazotrophic and photosynthetic activity
France Van Wambeke
Audrey Gimenez
Solange Duhamel
Cécile Dupouy
Dominique Lefevre
Mireille Pujo-Pay
Thierry Moutin
Heterotrophic prokaryotic production (BP) was studied in the western tropical South Pacific (WTSP) using the leucine technique, revealing spatial and temporal variability within the region. Integrated over the euphotic zone, BP ranged from 58 to 120 mg C m−2 d−1 within the Melanesian Archipelago, and from 31 to 50 mg C m−2 d−1 within the western subtropical gyre. The collapse of a bloom was followed during 6 days in the south of Vanuatu using a Lagrangian sampling strategy. During this period, rapid evolution was observed in the three main parameters influencing the metabolic state: BP, primary production (PP) and bacterial growth efficiency. With N2 fixation being one of the most important fluxes fueling new production, we explored relationships between BP, PP and N2 fixation rates over the WTSP. The contribution of N2 fixation rates to bacterial nitrogen demand ranged from 3 to 81 %. BP variability was better explained by the variability of N2 fixation rates than by that of PP in surface waters of the Melanesian Archipelago, which were characterized by N-depleted layers and low DIP turnover times (TDIP < 100 h). This is consistent with the fact that nitrogen was often one of the main factors controlling BP on short timescales, as shown using enrichment experiments, followed by dissolved inorganic phosphate (DIP) near the surface and labile organic carbon deeper in the euphotic zone. However, BP was more significantly correlated with PP, but not with N2 fixation rates where DIP was more available (TDIP > 100 h), deeper in the Melanesian Archipelago, or within the entire euphotic zone in the subtropical gyre. The bacterial carbon demand to gross primary production ratio ranged from 0.75 to 3.1. These values are discussed in the framework of various assumptions and conversion factors used to estimate this ratio, including the methodological errors, the daily variability of BP, the bacterial growth efficiency and one bias so far not considered: the ability for Prochlorococcus to assimilate leucine in the dark.
- Article
(8413 KB) - Full-text XML
- BibTeX
- EndNote


Heterotrophic prokaryotes can process, on average, 50 % of the carbon (C) fixed by photosynthesis in many aquatic systems (Cole, 1988). Understanding the controls of heterotrophic bacterial production and respiration rates is fundamental for two major aspects of marine C cycling: (i) to explore the possible fate of primary production through the microbial food web, and (ii) to construct a metabolic balance based on C fluxes. To assess these two major features, bacterial carbon demand (BCD; i.e., the sum of heterotrophic bacterial production (BP) and bacterial respiration (BR)) is compared to primary production (PP). The metabolic state of the ocean, and in particular the status of net heterotrophy within oligotrophic systems, has been largely debated in the last decade (see for example the review in Duarte et al., 2013; Ducklow and Doney, 2013; Williams et al., 2013).
Table 1Review of integrated primary production rates published in the South Pacific, PP fluxes in mg C m−2 d−1. Only open sea data were included.
The South Pacific Gyre (GY) is ultra-oligotrophic, and is characterized by deep UV penetration, by deep chlorophyll maximum (dcm) depth as great as 200 m, and by a 0.1 µM nitrate (NO3) isocline at 160 m (Claustre et al., 2008b; Halm et al., 2012). Our knowledge of the South Pacific Ocean's metabolic state based on C fluxes is fragmentary, since only few primary production data have previously been reported, and never simultaneously with BP (see references in Table 1). The exception is the BIOSOPE cruise conducted in the GY and eastern tropical South Pacific (ETSP) in November/December 2004, where both PP and BP were estimated simultaneously (Van Wambeke et al., 2008b).
The waters coming from the GY are essentially transported by the South Equatorial Current toward the Melanesian archipelagos in the western tropical South Pacific (WTSP). Interest in this region has increased due to field and satellite observation showing intermittent phytoplankton blooms in the area associated with Trichodesmium (Dupouy et al., 1988, 2011; Tenorio et al., 2018). The WTSP is a highly dynamic region (Rousselet et al., 2017) where patches of chlorophyll blooms can persist for up to a few weeks (de Verneil et al., 2017). The WTSP is a hotspot for biological nitrogen fixation (N2fix, Bonnet et al., 2017), extending to this whole oceanic region what was already measured locally near New Caledonia (Garcia et al., 2007). Based on nitrogen budgets, such blooms can sustain significant new production and export in this area (Caffin et al., 2018). The development of these blooms is explained by different hypotheses, including temperature thresholds (in particular regulating Trichodesmium blooms); increased light providing more energy; the stratification of surface waters favoring depletion of nitrate and reducing competition with non-fixing primary producers; and increased availability of iron and phosphate (DIP) due to island mass effects, volcanic activities or atmospheric nutrient deposition (Moutin et al., 2005, 2008; Luo et al., 2014; Martino et al., 2014; Shiozaki et al., 2014, Bonnet et al., 2018).
While the dynamics of heterotrophic prokaryotes coupling with primary producers has been explored in many regions of the ocean, these processes have not been studied in the WTSP. Because most oligotrophic oceans are nitrogen limited, PP and N2fix have already been sampled simultaneously in diverse studies and their relationships examined. Taking a Redfield ratio of 6.6, the contribution of N2fix rates to PP, integrated over the euphotic zone, has been found to range from 1 to 9 % in diverse provinces of the Atlantic (Fonseca-Batista et al., 2016). The ratio is 15–21 % in the WTSP and 3–4 % in the center of the GY (Raimbault and Garcia, 2008; Caffin et al., 2018). Few studies have attempted to examine how the variability of N2fix can be linked to that of heterotrophic activity, or to identify the contribution of N2fix rates to heterotrophic prokaryotic N demand. Yet, recent genomic analyses exploring the diversity of the nitrogenase reductase (nifH) gene have revealed the importance of non-cyanobacterial nitrogen fixers (Gradoville et al., 2017, and references therein). Owing to the fact that a great abundance of nifH gene copies does not imply that N2fix is occurring (see for example Turk-Kubo et al., 2014), diverse tests have been conducted to assess heterotrophic N2 fixation indirectly. For example, in the oligotrophic eastern Mediterranean Sea, aphotic N2fix can account for 37 to 75 % of the total daily integrated N2fix rates (Rahav et al., 2013). In the Red Sea, N2fix rates are correlated with BP but not with PP during the stratified summer season, while during a Trichodesmium bloom in winter, both PP and BP increased with N2fix rates, although the correlation was still insignificant with PP (Rahav et al., 2015). In the South Pacific, the presence of non-cyanobacterial nitrogen fixers has been detected in the dark ocean as well as in the euphotic layer, with detectable levels of nifH gene expression, as measured by qPCR or N2fix activity determined in darkness (in the GY: Halm et al., 2012; Moisander et al., 2014; in the eastern tropical South Pacific Ocean: Bonnet et al., 2013; in the Bismarck and Solomon seas: Benavides et al., 2015). The addition of selected organic molecules such as glucose (Dekaezemacker et al., 2013) or natural organic matter such as transparent expolymer particles, can also influence N2fix rates (Benavides et al., 2015). Finally, recent experiments based on incubation with 15N-labeled N2 coupled to nano-SIMS analyses also demonstrated that a rapid transfer, at the scale of 24 to 48 h, can occur between N2 fixers, non-fixing phytoplankton and heterotrophic prokaryotes (Bonnet et al., 2016).
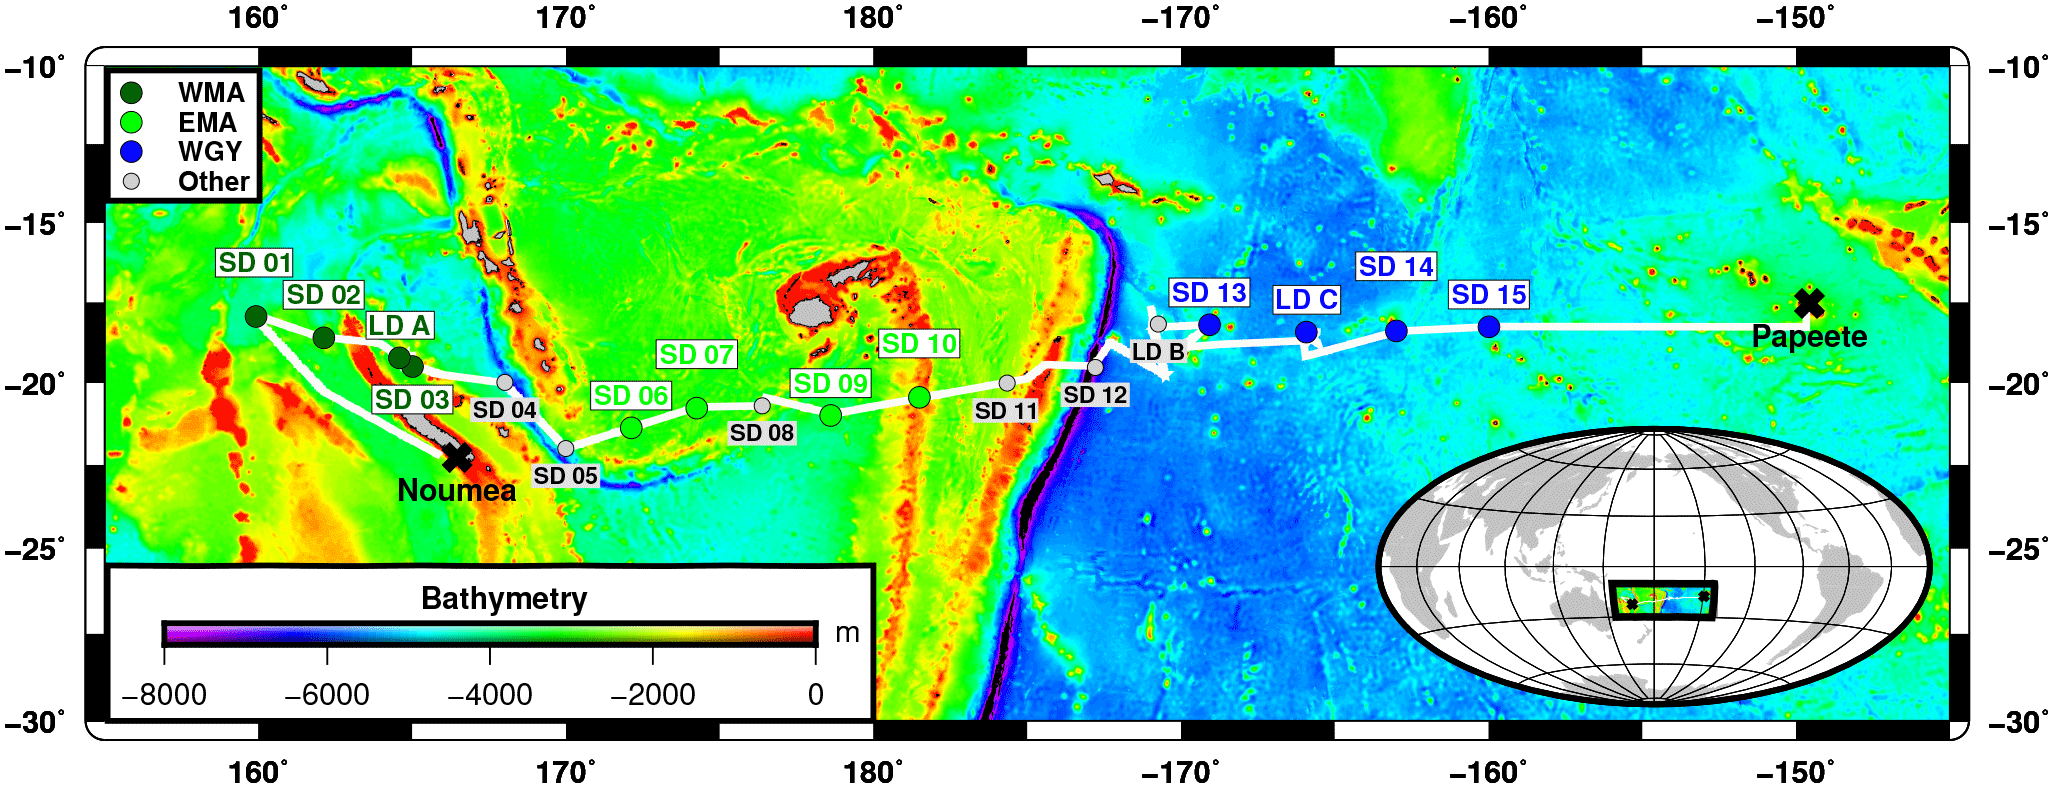
Figure 1Position of stations during the OUTPACE cruise. The white line shows the vessel route (data from the hull-mounted ADCP positioning system). In dark green WMA (Western Melanesian Archipelago) including SD1, 2, 3 and LDA; in light green, EMA: Eastern Melanesian Archipelago including SD6, 7, 9 and 10 and in blue WGY (Western Subtropical Gyre) including stations SD13, 14, 15 and LDC. Figure courtesy of Thibaut Wagener.
In this study, we examined the horizontal and vertical distributions of heterotrophic prokaryotic production alongside photosynthetic rates, N2fix rates and phosphate turnover times across the WTSP, in order to relate these fluxes to bottom–up controls (related to nitrogen, phosphorus and labile C availability). Particular attention was given to determine the coupling between BP and PP or N2fix rates, to examine the variability of bacterial carbon demand (BCD) in comparison to gross primary production (GPP) ratios and to discuss the metabolic state of this region.
2.1 Sampling strategy
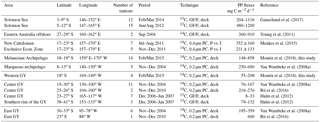
The OUTPACE cruise (https://doi.org/10.17600/15000900) was conducted in the WTSP region, from 18 February to 3 April 2015, along a transect extending from the north of New Caledonia to the western part of the South Pacific Gyre (WGY) (25∘ S, 115∘ E–15∘ S, 149∘ W, Fig. 1). For details on the strategy of the cruise, see Moutin et al. (2017). Stations of short duration (< 8 h, 15 stations named SD1 to SD15, Fig. 1) and long duration (6 days, 3 stations named LDA to LDC) were sampled. Generally, at least three CTD casts going down to 200 m were conducted at each short station, except at SD5 and SD9 (two casts) and at SD13 (one cast). The LD stations were abbreviated LDA (situated north of New Caledonia), LDB (in the Vanuatu area) and LDC (oligotrophic reference in the GY area). LD stations were selected based on satellite imagery, altimetry and Lagrangian diagnostics (Moutin et al., 2017), and by the abundance of selected diazotrophs nifH gene copies analyzed by quantitative polymerase chain reaction (qPCR), in real time on board (Stenegren et al., 2018). At these LD stations, CTD casts were performed every 3 h following the water mass using a Lagrangian sampling strategy during at least 5 days. All samples were collected from a CTD-rosette system fitted with 20 12 L Niskin bottles and a Sea-Bird SBE9 CTD.
At the SD stations, water samples used for measuring in situ simulated primary production (PPdeck), dissolved inorganic phosphate turnover times (the ratio of DIP concentration to DIP uptake rate, TDIP) and N2fix rates came from the same rosette cast as water used for measuring BP. At the LD sites, we also conducted biodegradation experiments to determine bacterial growth efficiency (BGE), along with enrichment experiments to explore the factors limiting BP.
In addition to the measurements of chlorophyll a, BP, PP, TDIP and DOC described below, other data presented in this paper include hydrographic properties, nutrients and N2fix, for which detailed protocols of analysis and considerations for methodology are available in Moutin et al. (2017, 2018) and Bonnet et al. (2018). Briefly, DIP and nitrate concentrations were measured using standard colorimetric procedures on a AA3 AutoAnalyzer (Seal-Analytical). The quantification limits were 0.05 µM for both nutrients. N2 fixation rates were measured using the 15N2 tracer method in 4.5 L polycarbonate bottles inoculated with 5 mL of 15N2 gas (99 atom % 15N, Eurisotop). Note that the risk of underestimation by this bubble method was checked by subsampling and fixing 12 mL of each bottle after incubation and to analyze the dissolved 15N2 with a Membrane Inlet Mass Spectrometer.
2.2 Chlorophyll a
For chlorophyll a (Chl a), a sample of 288 mL of seawater was filtered through 25 mm Whatman GF/F filters immediately after sampling and placed at −80 ∘C in Nunc tubes until analysis. At the laboratory (3 months after the cruise), after grinding the GF/F filter in 5 mL methanol, pigments (Chl a and phaeophytin) were extracted in darkness over a 2 h period at 4 ∘C and analyzed with a Trilogy Turner 7200-000 fluorometer according to Le Bouteiller et al. (1992). Sampling for Chl a analysis started only at site LDA (Dupouy et al., 2018). In vivo fluorescence was performed with an AquaTraka III (ChelseaTechnologies Group Ltd) sensor mounted on the CTD.
The overall correlation between in vivo fluorescence (Chl iv) and Chl a was very patchy (Chl a = 1.582 × Chl iv + 0.0241, n=169, r=0.61). This is due to the heterogeneity at the time of sampling and the nature of the populations present, i.e., essentially different fluorescence yields over depth and species (Neveux et al., 2010). Thus in vivo fluorescence was used only to track high-frequency variability at the LD sites, the shape of a vertical profile's distributions and the location of the dcm, as well as longitudinal trends. Fluorometric discrete data (Chl a) were used for calculating and comparing integrated Chl a stocks.
2.3 Bacterial production
Bacterial production (BP, sensus stricto referring to heterotrophic prokaryotic production) was determined onboard using the microcentrifuge method with the 3H-leucine (3H-Leu) incorporation technique to measure protein production (Smith and Azam, 1992). Triplicate 1.5 mL samples and a killed control with trichloracetic acid (TCA) at 5 % final concentration were incubated with a mixture of [4,5-3H]leucine (Amersham, specific activity 112 Ci mmol−1) and nonradioactive leucine at final concentrations of 7 and 13 nM, respectively. Samples were incubated in the dark at the respective in situ temperatures for 1–4 h. On nine occasions, we checked that the incorporation of leucine was linear with time. Incubations were ended by the addition of TCA to a final concentration of 5 %, followed by three runs of centrifugation at 16 000 g for 10 min. Bovine serum albumin (BSA, Sigma, 100 mg L−1 final concentration) was added before the first centrifugation. After discarding the supernatant, 1.5 mL of 5 % TCA was added before the second centrifugation. For the last run, after discarding the supernatant, 1.5 mL of 80 % ethanol was added. The ethanol supernatant was then discarded and 1.5 mL of liquid scintillation cocktail (Packard Ultimagold MV) was added. The radioactivity incorporated into macromolecules was counted using a Packard LS 1600 Liquid Scintillation Counter onboard the ship. A factor of 1.5 kg C mol leucine−1 was used to convert the incorporation of leucine to carbon equivalents, assuming no isotopic dilution (Kirchman, 1993). Indeed, isotopic dilution ranged from 1.04 to 1.18, as determined in five experiments where we checked the saturating level of 3H-leucine. Standard deviation associated with the variability between triplicate measurements averaged 12 and 8 % for BP values lower and higher than 10 ng C L−1 h−1, respectively. At the LD sites, BP was sampled every day at 12:00 local time.
2.4 Primary production and phosphate turnover times
Primary production (PP) and dissolved inorganic phosphate turnover times (TDIP) were determined using a dual 14C-33P labelling technique following Duhamel et al. (2006) and described in Moutin et al. (2018). Briefly, after inoculation with 10 µCi of 14C sodium bicarbonate and 4 µCi of 33P-orthophosphoric acid, 150 mL polycarbonate bottles were incubated in on-deck incubators equipped with blue screens (75, 54, 36, 19, 10, 2.7, 1, 0.3 and 0.1 % incident light, https://outpace.mio.univ-amu.fr/spip.php?article135, last access: 27 April 2018) and flushed continuously with surface sea water. Incubation times lasted 4 (western stations) to 24 h (South Pacific Gyre area) and were chosen according to expected TDIP. Samples were then filtered through 0.2 µm polycarbonate membranes, with radioactivity retained by the filters being assessed by liquid scintillation counting directly on board and after 12 months in the laboratory. Rates of daily primary production were computed using the conversion factors τ(Ti;T) according to Moutin et al. (1999) to calculate normalized (dawn-to-dawn) daily rates from the incubation period measured in the on-deck incubators (PPdeck).
Measurements of PP using the JGOFs protocol (in situ moored lines immerged for 24 h from dawn-to-dawn, IPPin situ) were also performed at each long station on days 1, 3 and 5 (see Caffin et al., 2018, for details). Integrated rates within the euphotic zone were estimated by trapezoidal integrations, assuming the same rate between 0 m and the shallowest sampled depth and considering PP to be zero at 20 m below the deepest sampled depth.
2.5 Bacterial growth efficiency and dark community respiration
Bacterial growth efficiency (BGE) and DOC lability were estimated at the three LD sites using dilution experiments with seawater sampled in the mixed layer. The seawater used for these experiments was sampled from Niskin bottles (9 m at LDA, 7 m at LDB and 16 m at LDC) from a CTD cast done at 12:00 local time on the first day of occupation at each LD site. A 1∕5 dilution culture was established by mixing a bacterial inoculum from the same seawater sample (0.4 L of a < 0.8 µm filtrate) with 1.6 L of < 0.2 µm filtrate, in a borosilicate bottle. Samples were incubated in the dark, for up to 10 days, in a laboratory incubator set at in situ temperature. Periodically, for up to 10 days, subsamples were taken to estimate DOC concentrations and bacterial production. The BGE was estimated from DOC and bacterial production estimates on a given time interval corresponding to the exponential phase of BP following Eq. (1):
where BPint is the trapezoidal integration of BP with time for the period considered, and DOCcons the dissolved organic carbon consumed during that period, corresponding to the difference in DOC concentration between initial (DOCinitial) and minimal DOC (DOCmin). From these experiments, the labile fraction of DOC (LDOC) was determined following Eq. (2):
Samples for DOC concentration were filtered through two precombusted (24 h, 450 ∘C) glass fiber filters (Whatman GF/F, 25 mm) using a custom-made all-glass/Teflon filtration syringe system. Samples were collected into precombusted glass ampoules and acidified to pH 2 with phosphoric acid (H3PO4). Ampoules were immediately sealed until analyses by high-temperature catalytic oxidation (HTCO) on a Shimadzu TOC-L analyzer (Cauwet, 1999). Typical analytical precision is ±0.1–0.5 (SD) or 0.2–0.5 % (CV). Consensus reference materials (http://www.rsmas.miami.edu/groups/biogeochem/CRM.html, last access: 27 April 2018) were injected every 12 to 17 samples to ensure stable operating conditions.
Rates of dark community respiration (DCR) were used to estimate bacterial growth efficiency (see the discussion). Briefly, DCR was estimated from changes in the dissolved oxygen (O2) concentration during dark incubations of unfiltered seawater (24 h) carried out at LD stations, in situ on the same mooring lines used for PPin situ. Quadruplicate biological oxygen demand bottles were incubated in the dark at each sampled depth. The concentration of oxygen was determined by Winkler titration (Williams and Jenkinson, 1982). DCR was calculated as the difference between initial and final O2 concentrations. The mean standard error of volumetric DCR rates was 0.28 µmol O2 L−1 d−1.
Table 2Physical and biological characteristics of main biogeochemical areas and long duration stations sampled during the OUTPACE cruise. Depth of the dcm (deep chlorophyll maximum, based on vertical profiles of in vivo fluorescence), σt: sigma-theta at the dcm (kg m−3), Ichl a (integrated chlorophyll a from fluorometric discrete analyses on extracted samples), IN2 fix (integrated N2 fixation rates), IPP (integrated primary production), IBP (integrated bacterial production at the depth of the euphotic zone), DCR (dark community respiration integrated over the euphotic layer). WMA clustered stations SD1, 2, 3 and LDA, EMA clustered SD 6, 7, 9 and 10, WGY clustered SD13, 14, 15 and LDC. In order to encompass only spatial variability for WMA, EMA and WGY groups of stations, means and ranges of dcm depths and of σt at the dcm depth were based on the averages values set individually at each SD or LD stations as more than one cast was sampled per station. Means ± SD and range values given for LDA, LDB and LDC illustrate the temporal variability at LD sites: all ctd casts sampled at each LD site down to 200 m were included.
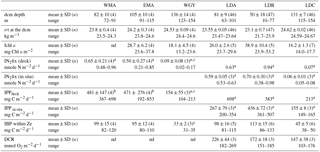
a Values from Bonnet et al. (2018) and Caffin et al. (2018) also presented in Fig. 3b. b Values from Moutin et al. (2018) also presented in Figs. 2 and 3a. c At station SD13, BP and N2fix rates were not measured; PP obtained was abnormally low (55 mg C m−2 d−1) and excluded from the mean; nd: not determined.
2.6 Enrichment experiment
Enrichment experiments were performed along vertical profiles at the three LD sites LDA, LDB and LDC. Seawater was sampled at 12:00 local time on day 2 of occupation at each site (CTD cast numbers 33, 117 and 166, respectively). Nutrients were added in 60 mL transparent polycarbonate bottles at a final concentration of 1 µM NH4Cl + 1µM NaNO3 in “N” amended bottles, 0.25 µM Na2HPO4 in “P” amended bottles and 10 µM C-glucose in “G” amended bottles. The sum of all these elements was added in “NPG” amended bottles. Controls “C” were left unamended. Bottles were incubated on average for 24 h under simulated in situ conditions (in the same on-deck incubators as those used for PPdeck). Selected depths chosen encompassed the euphotic zone. At LDA: 9, 24, 35, 70, and 100 m were incubated under 54, 10, 3, 1, and 0.3 % incident light; at LDB: 7, 12, 27, and 42 m were incubated under 54, 36, 10, and 3 % incident light; and at LDC: 16, 60, 91, and 135 m were incubated under 54, 10, 3, and 1 % incident light, respectively. For depths deeper than the euphotic zone (200 m at LDA, 100 and 200 m at LDB and 200 m at LDC), flasks were incubated in the dark in a laboratory incubator set at in situ temperature. After 24 h of incubation, subsamples were taken from each flask to perform BP incubations as described for in situ samples (triplicate estimates, incubation in the dark), except that incubations lasted only 1 h. Results are presented as an enrichment factor relative to the unamended control.
2.7 Statistics
Relationships between variables were established using model II Tessier linear regressions, from log-transformed data. Multiple regressions were also used to study the simultaneous effects of PP and N2fix rates on BP variability. The effect of enrichments was tested by comparing BP obtained in the unamended control with BP obtained in the amended samples using a Mann–Whitney non-parametric test. This test was also used to estimate differences between geographic zones described in Table 2. Standard errors (SE) of integrated rates were calculated following the propagation procedures.
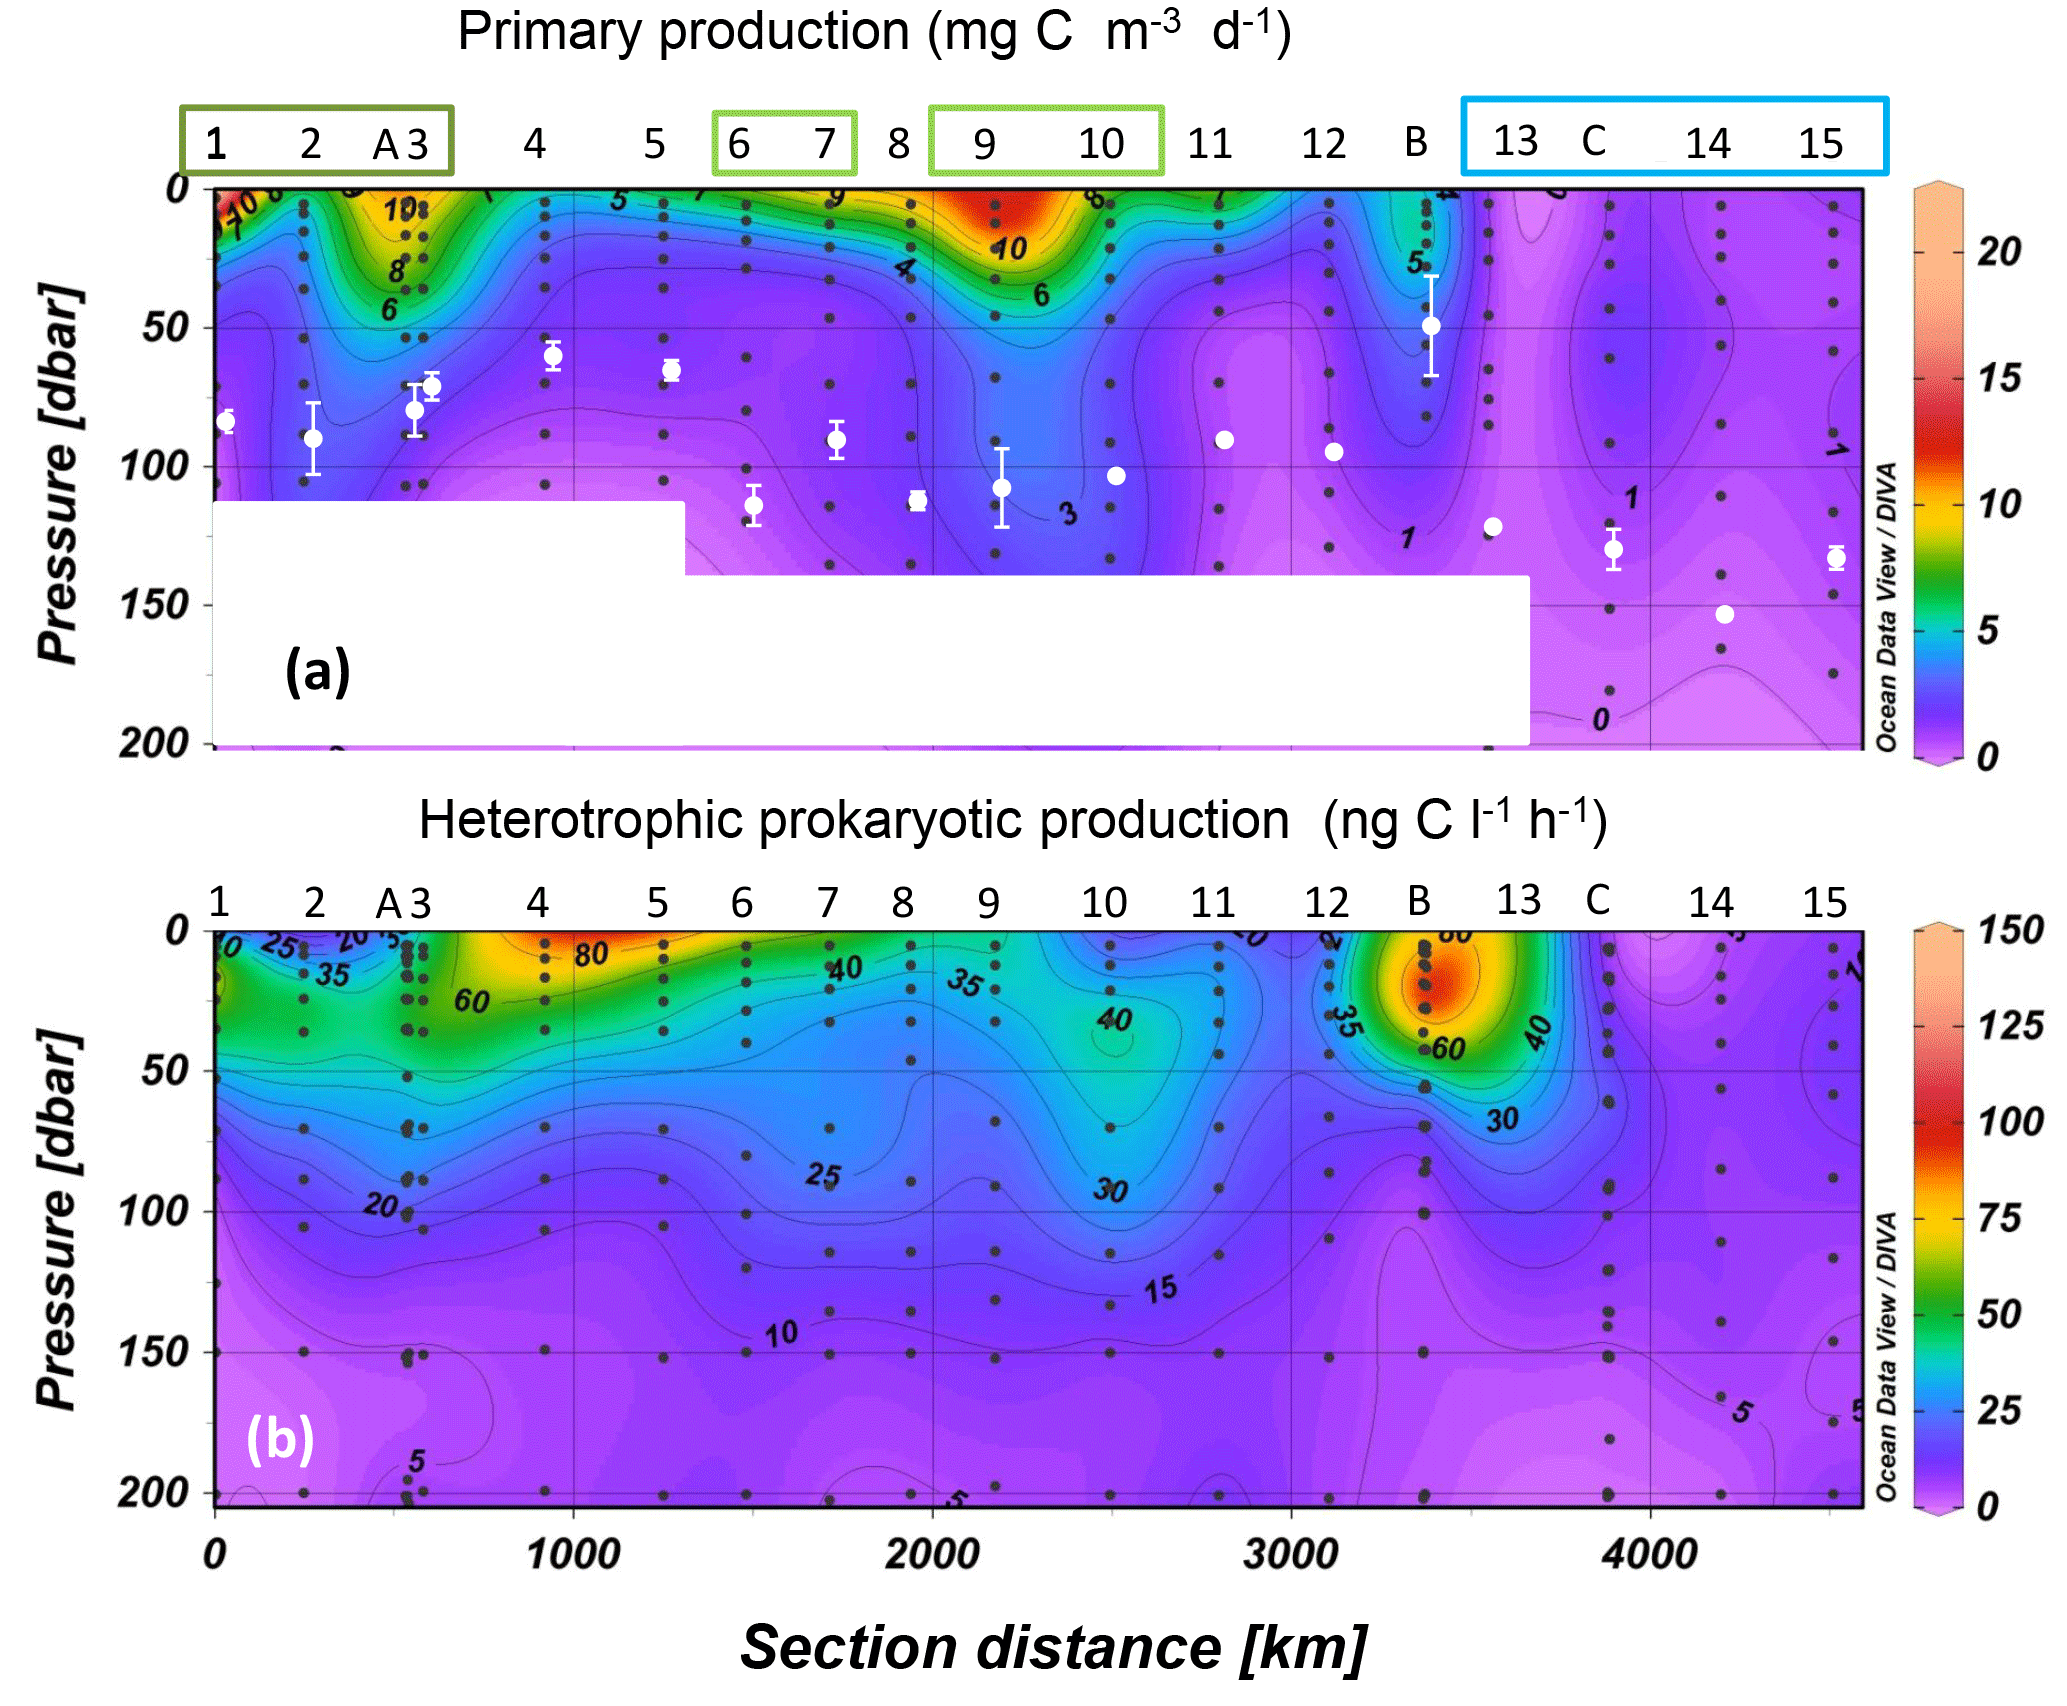
Figure 2Distribution of primary production (a) and heterotrophic prokaryotic production (b) along the OUTPACE cruise transect; WMA (dark green), EMA (light green) and WGY (blue) stations are noted by colored rectangles. Interpolation between sampling points in contour plots was made with the Ocean Data View software (VG gridding algorithm, Schlitzer, 2004). In order to be homogeneous for the whole transect, for sites LDA, LDB and LDC the data plotted for PP were from a single profile, that of PPdeck, while for BP we plotted all profiles. The white dots in (a) correspond to the average ± SD of the dcm depth at each station. The white rectangles mask abnormal extrapolation due to the absence of PP data.

Figure 3(a) Distribution of integrated heterotrophic prokaryotic production (IBP) and primary production (IPPdeck) along the transect, data were integrated over the euphotic zone. WMA (dark green), EMA (light green) and WGY (blue) stations are noted by colored rectangles. (b) Distribution of integrated N2 fixation rates and of ratio N2 fixation rates to bacterial nitrogen demand (I N2fix/I-BND, assuming a bacterial C ∕ N ratio of 5 and no nitrogen excretion) along the transect. Data were integrated down to the deepest sampled depth for N2 fixation rates. Data plotted for sites LDA, LDB and LDC correspond to BP, PPdeck and N2fix measured on day 5. Error bars are standard errors (SE) derived from triplicate measurements at each depth (BP, PPdeck, N2fix rates). For BP, error bars also take into account the daily variability, and final SE were calculated after propagation of errors. PP obtained at SD13 was abnormally low (55 mg C m−2 d−1) and was excluded; BP and N2fix rates were not measured at this station.
3.1 Regional oceanographic settings
The longitudinal transect started northwest of New Caledonia, crossed the Vanuatu and Fiji Arcs and finished inside the western part of the ultra-oligotrophic South Pacific Gyre. It covered a vast region of the WTSP and the main gradient of biogeochemical and biological properties between the Melanesian Archipelago (MA) (stations SD1 to SD12 and LDA) and the western part of the South Pacific Gyre (WGY) (SD13 to SD15 and LDC) separated by the Tonga Volcanic Arc (Fig. 1). Temperature ranged from 19.7 to 30.2 ∘C within the 0–200 m layer (see Fig. 3a in Moutin et al., 2017). Density revealed shallow mixed layers, due to the sharp vertical temperature gradients. The transition between these MA and WGY areas is particularly evidenced by an enhanced degree of oligotrophy in the WGY area. The WGY area was characterized by dcm depth greater than 115 m (Table 2), a deep nitracline (130 m), nitrite peaks around 150 m and detectable amounts of phosphate at the surface (> 100 nM, Moutin et al., 2018). A detailed analysis of the vertical distribution of nutrients and organic matter made it possible to identify two groups of stations within the MA area, each having common biogeochemical characteristics: one group between 160 and 170∘ E called WMA for “Western Melanesian Archipelago” clustered SD1, 2, 3 and LDA and a second group south of Fiji called EMA for “Eastern Melanesian Archipelago” clustered SD6, 7, 9 and 10 (Moutin et al., 2018). Main biogeochemical differences between these two groups of stations were related to shallower depths for the phosphacline (20 m), nitracline (76 m), and dcm (82 m) in the WMA group (see Table 2 and Fig. 5b, c in Moutin et al., 2018). The EMA group had depths for these parameters intermediate to those recorded at the WMA and WGY groups (phosphacline 44 m, nitracline 100 m and dcm 105 m). Although geographically included within the MA area, LDB corresponded to a particular bloom condition and is therefore presented and discussed separately.
3.2 Longitudinal distributions
The mixed layers for most of the cruise were ≤ 20 m (Moutin et al., 2018; de Verneil et al., 2018), except at SD13 and LDC, where the mixed layer depths were 27 and 34 m, respectively. The dcm depth ranged between 61 and 115 m in the MA and between 123 and 154 m in the WGY (Table 2; see Fig. 3d in Moutin et al., 2017). Integrated Chl a concentrations ranged from 13 to 23 mg Chl a m−2 in the WGY, and were significantly lower than those in the MA (20–38 mg Chl a m−2, Mann–Whitney test, p=0.013). The mean dcm depth within the EMA was slightly deeper (mean ± SD: 105 ± 10 m, Table 2) than in the WMA (82 ± 10 m, Mann–Whitney test, p=0.03).
Maximum primary production rates reached 20.8 mg C m−3 d−1 (Fig. 2a). PP rates greater than 10 mg C m−3 d−1 were obtained in the MA at SD1, SD7, and SD9 and also at sites LDA and LDB (see below), whereas stations in the WGY showed values less than 1.3 mg C m−3 d−1. Bacterial production ranged from 0.8 to 138 ng C L−1 h−1 in the 0–200 m layer (Fig. 2b). Within the MA area, BP reached values greater than 100 ng C L−1 h−1 at SD1 and SD5 within the surface (5 m depth, Fig. 2b). High BP values were also found at LDB (see below). Within the WGY, maximum BP rates reached 27 ng C L−1 h−1 (at site LDC; see below).
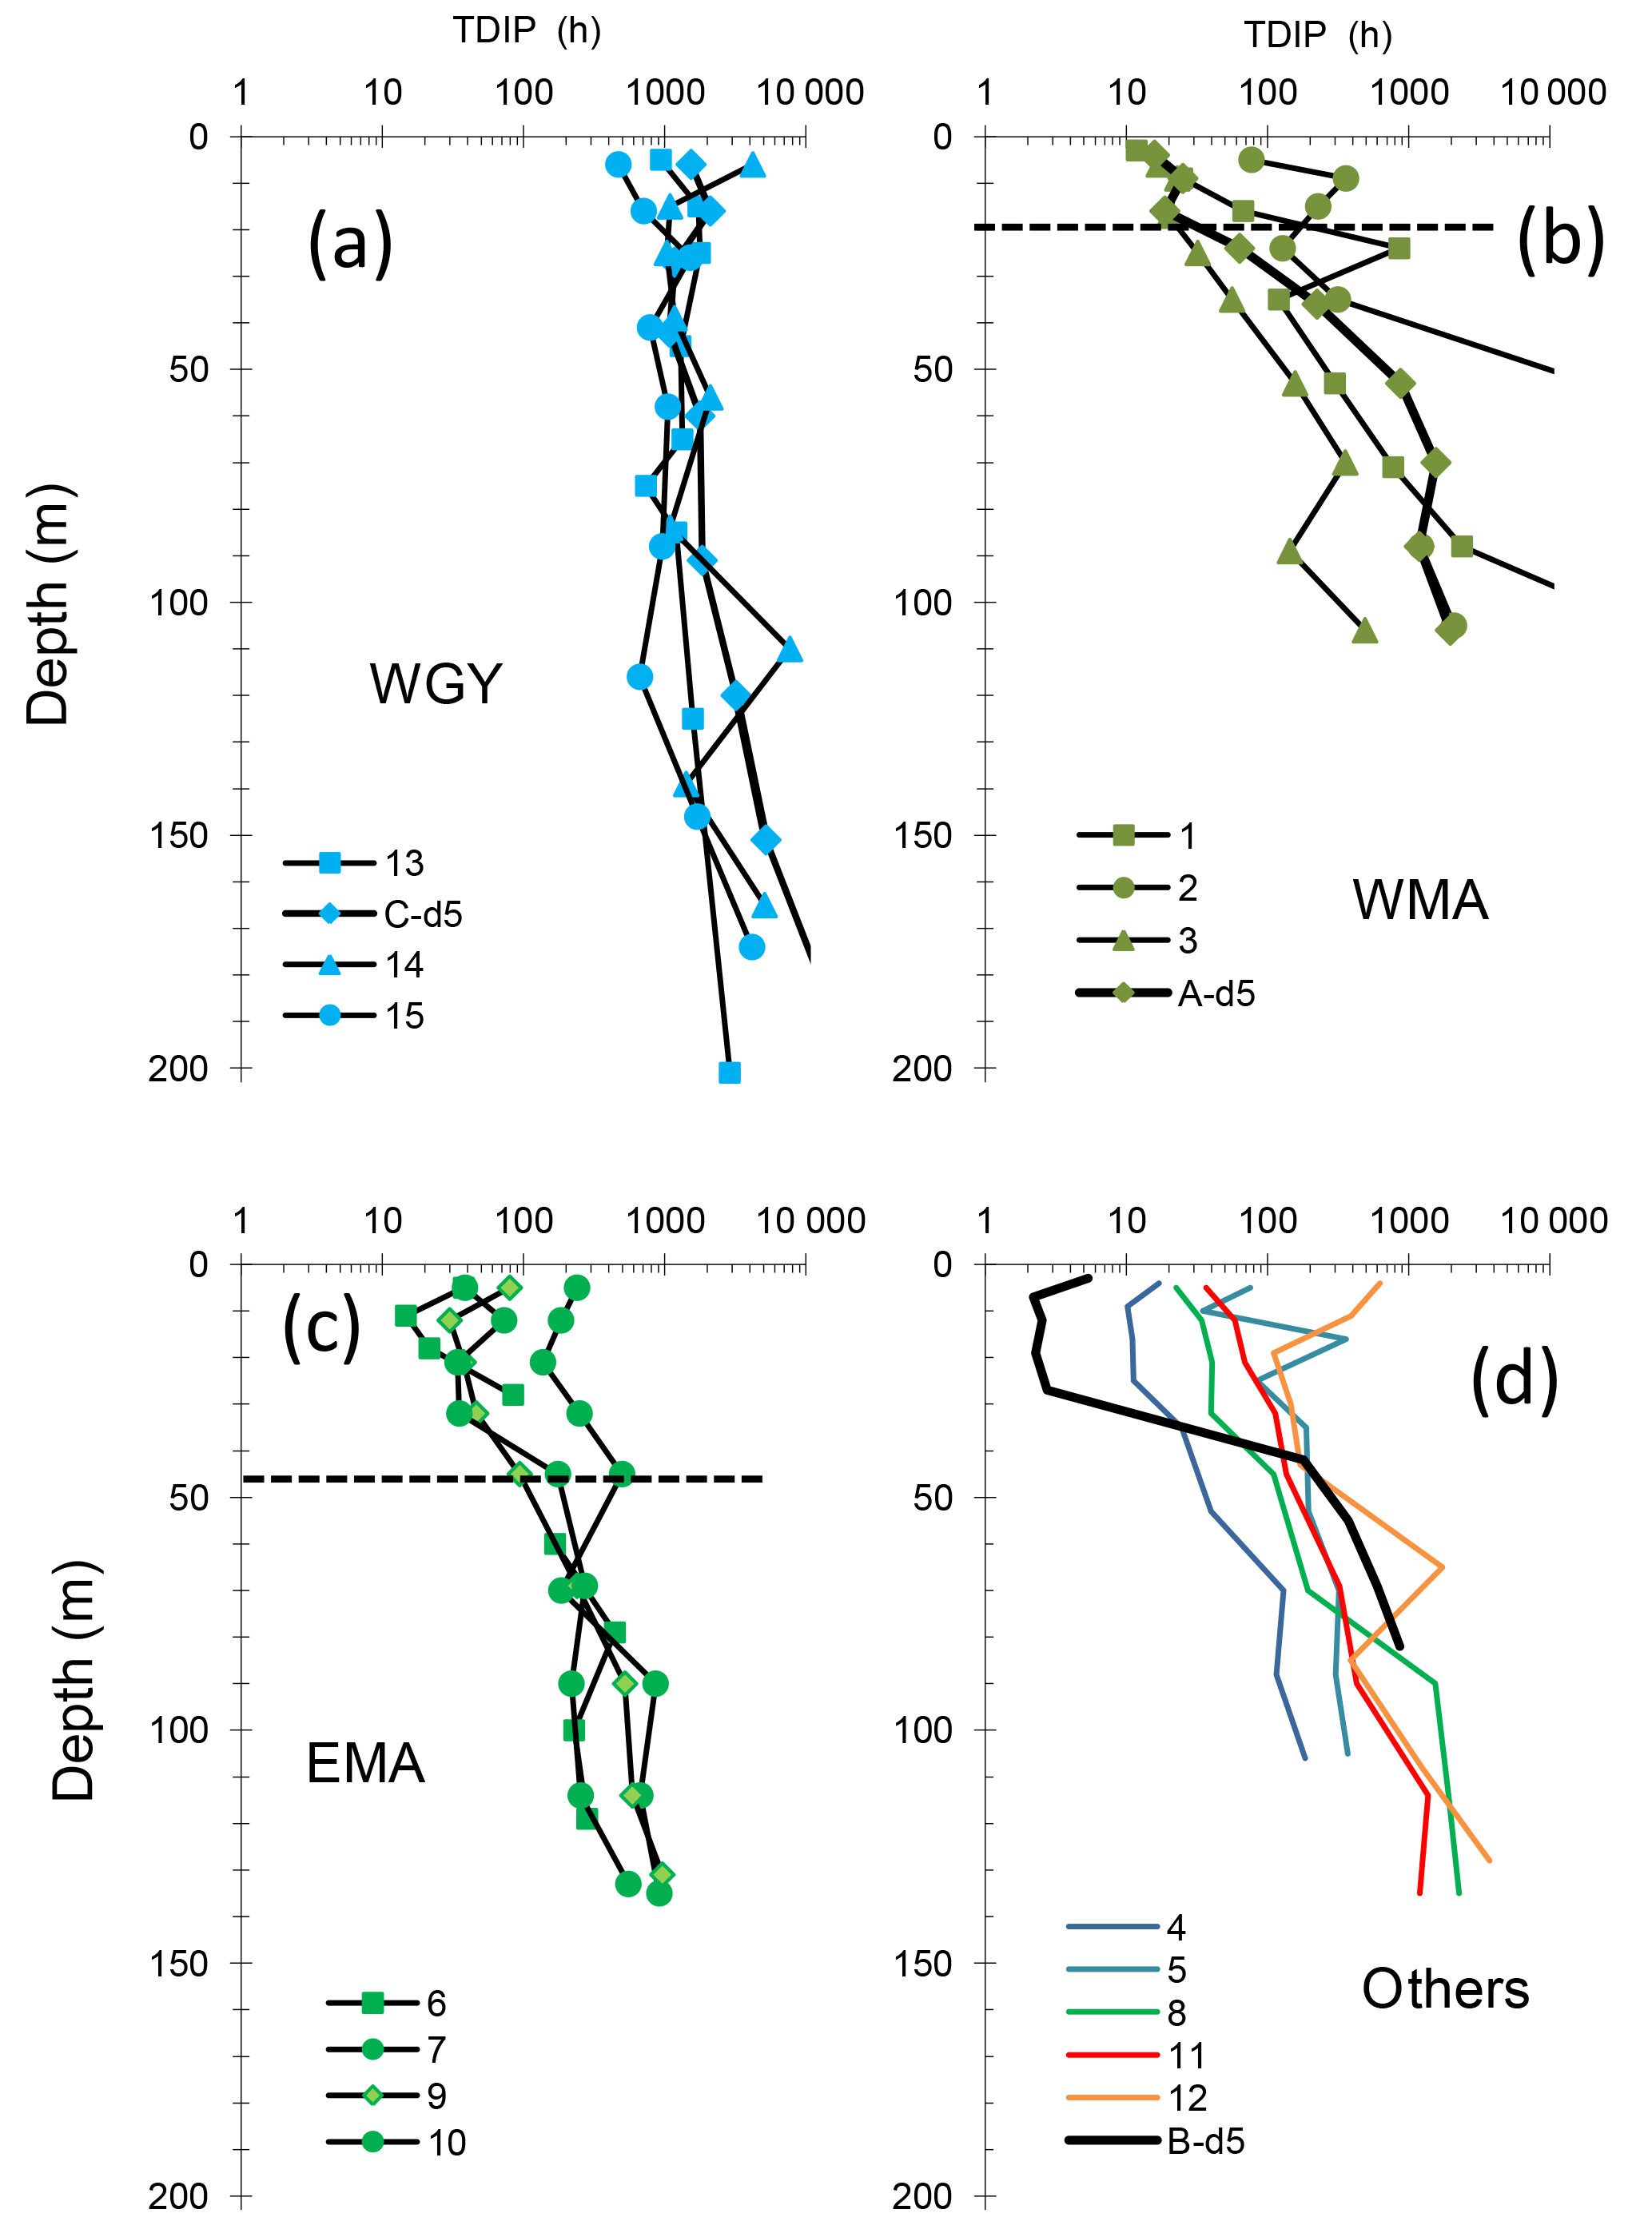
Figure 4Vertical distributions of phosphate turnover times (TDIP) in groups of stations WGY (a), WMA (b), and EMA (c) and other stations (d). At the long-duration sites LDA, LDB and LDC, TDIP profiles were determined at day 5 (bold lines). The horizontal bar in (b) (WMA) and (c) (EMA) delineates the mean phosphacline depth (mean ± SD: 20 ± 7 m and 44 ± 10 m, respectively) as determined by Moutin et al. (2018). At WGY (a), DIP concentrations were >100 nM at all depths.
Integrated primary production (IPPdeck) ranged from 178 to 853 mg C m−2 d−1 within the MA and from 104 to 213 mg C m−2 d−1 within the WGY (Fig. 3a). Integrated BP (IBP) over the euphotic zone ranged from 58 to 120 mg C m−2 d−1 within the MA and from 31 to 35 mg C m−2 d−1 within the WGY (Fig. 3a). Both integrated fluxes over the euphotic zone were statistically lower within WGY (Mann–Whitney test, p=0.01 for IBP and p=0.03 for IPPdeck). In contrast, for the WMA and EMA group of stations, integrated fluxes were not statistically different, neither for IBP (99 ± 15 versus 95 ± 12 mg C m−2 d−1, Mann–Whitney test, p > 0.05) nor for IPPdeck (481 ± 47 versus 471 ± 276 mg C m−2 d−1, p > 0.05).
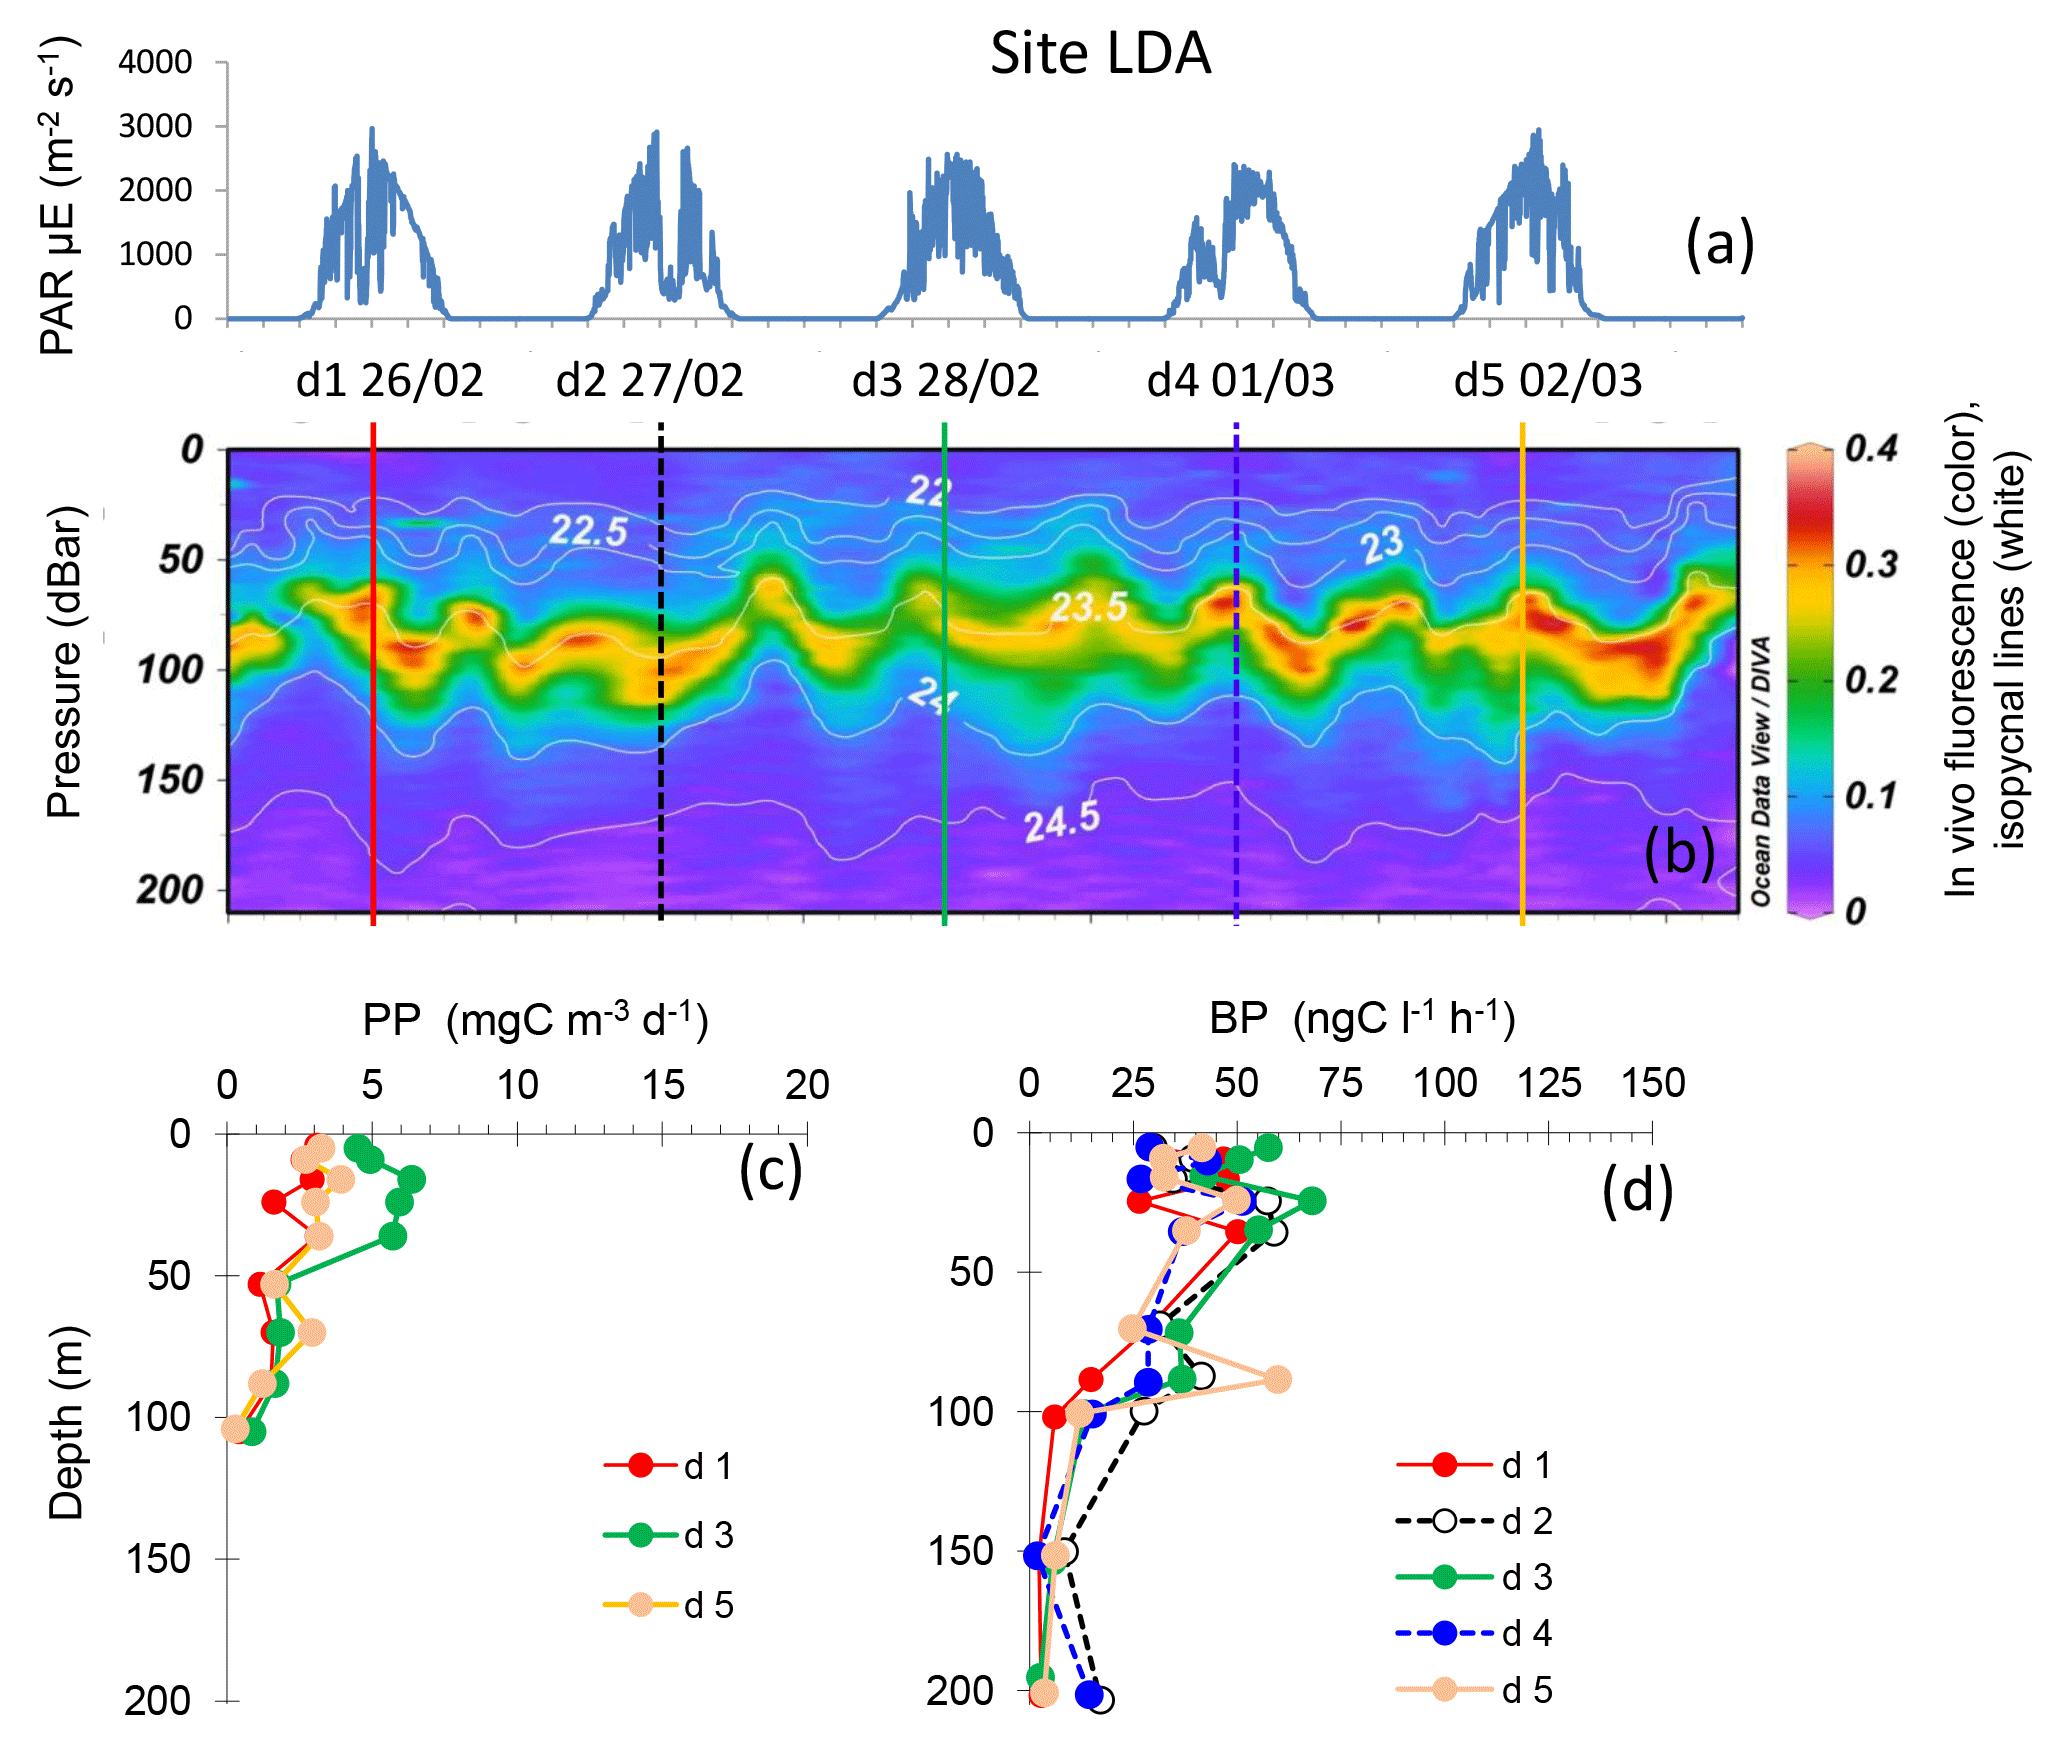
Figure 5Evolution of surface PAR (a), in vivo fluorescence and pycnoclines (b), PP (c) and BP (d) at site LDA. Time units in local time; day 1 was 26 February 2015. BP samples were taken at the 12:00 ctd cast, while samples for PPin situ were taken at the 03:00 ctd casts (days 1, 3 and 5). In graph (b), in vivo fluorescence is in color, isopycnes (kg m−3) are the white lines and vertical bars show the 12:00 ctd cast sampled for BP each day (1 to 5), with corresponding colors used for plotting BP vertical profiles in (d).
DIP turnover times (TDIP) ranged over 4 orders of magnitude along the transect (from 2.1 up to 1000 h, Fig. 4). TDIP roughly increased with depth, coincident with the increase in DIP concentrations below the phosphacline. TDIP also showed a clear MA–WGY transition zone. Within the WGY mixed layers, TDIP ranged from 469 to 4200 h (Fig. 4a), coincident with detectable amounts of DIP (around 100 nM) in this area (Moutin et al., 2018). TDIP were lower in the MA than in the WGY. However, TDIP ranged from 2 to 857 h in the mixed layers of the MA, with lower values associated with stations LDB-d5, LDA-d5, SD3, SD4 and SD6, and with elevated values being measured at SD2, SD5, SD7 and SD12. This TDIP range, encompassing 2 orders of magnitude, suggests a much higher range of DIP availability than DIP concentration alone would suggest. Below the phosphacline, TDIP increased with depth more sharply in the WMA (Fig. 4b) than for the EMA (Fig. 4c).
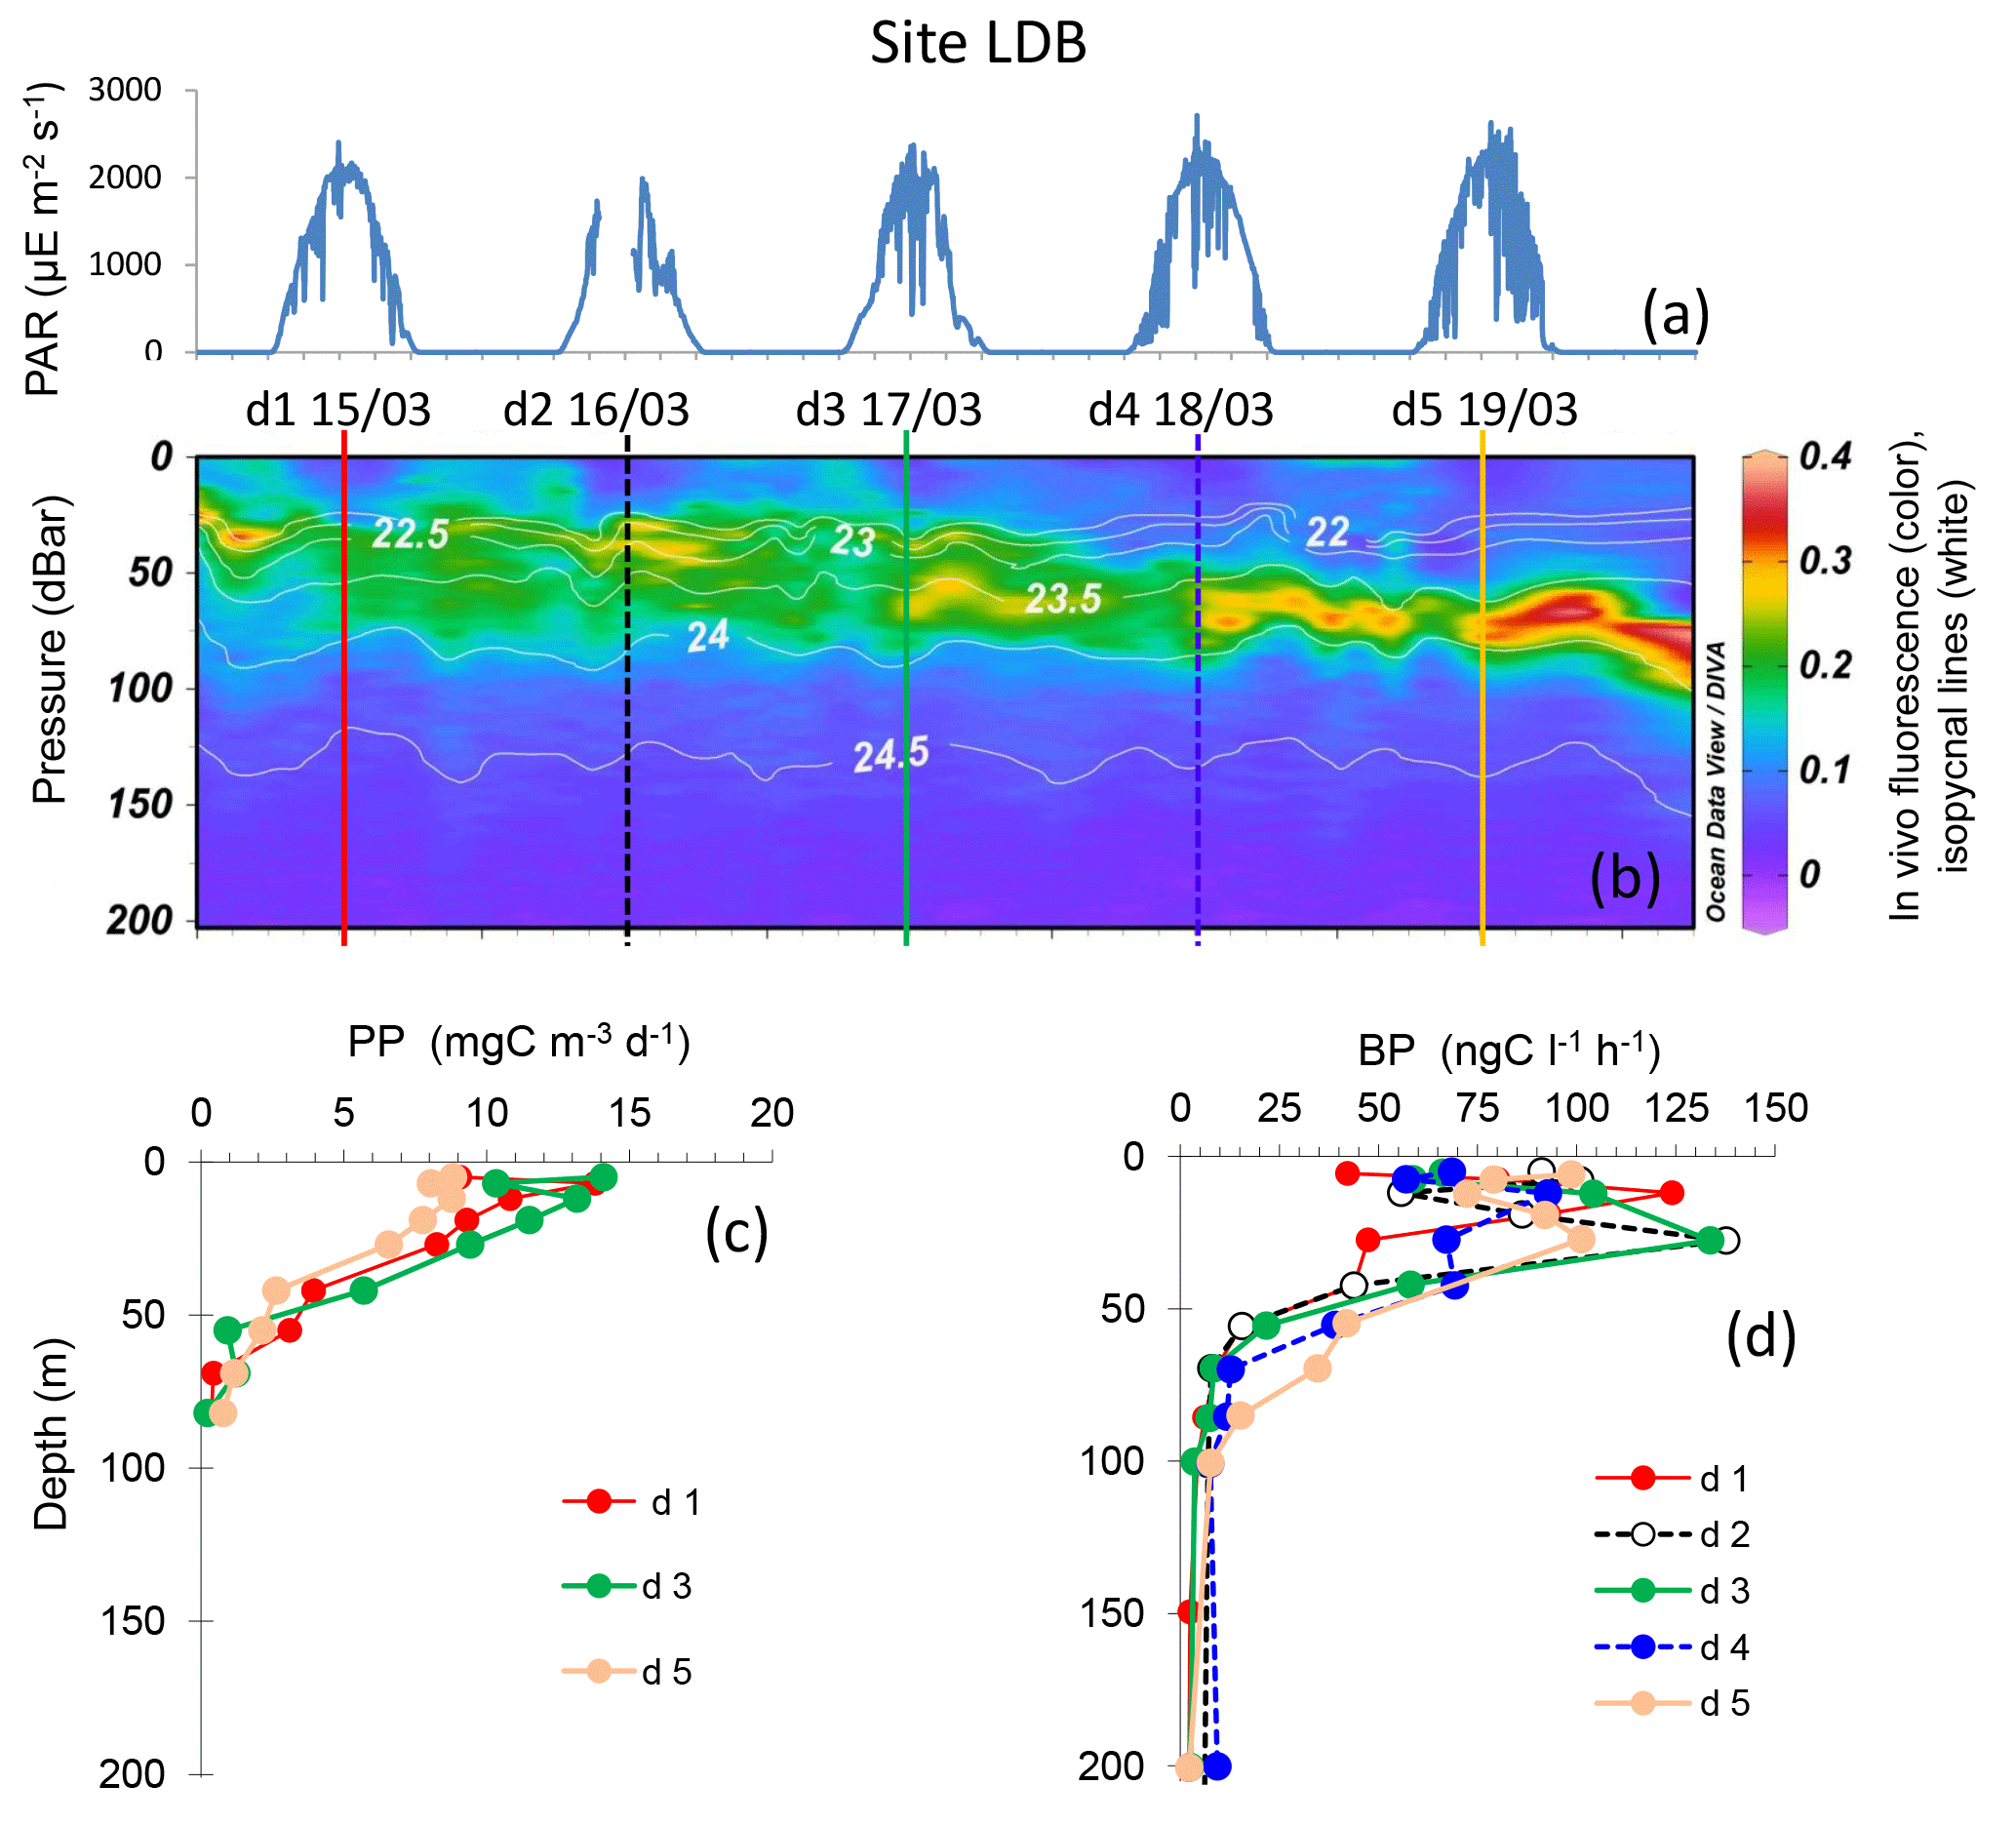
Figure 6Evolution of surface PAR (a), in vivo fluorescence and pycnoclines (b), PP (c) and BP (d) at site LDB. Time units in local time; day 1 was 15 March 2015. BP samples were taken at the 12:00 ctd cast, while samples for PPin situ were taken at the 03:00 ctd casts (days 1, 3 and 5). In graph (b) in vivo fluorescence is in color, isopycnes (kg m−3) are the white lines and vertical bars show the 12:00 ctd cast sampled for BP each day (1 to 5), with corresponding colors used for plotting BP vertical profiles in (d).
3.3 Daily variability at the long occupation sites
Site LDA showed variable dcm depth during the occupation time, with patches of in vivo fluorescence moving up and down the water column with time over a band of 40 m height (dcm depth varied between 63 and 101 m, Table 2). However, the dcm depth corresponded to a stable density horizon (σt 23.55 ± 0.04 kg m−3), with its fluctuation corresponding to internal waves characterized by a periodicity of about 2 per day (Bouruet-Aubertot et al., 2018; Fig. 5). BP and PP peaked in shallower layers, at 10–25 m depth (range 47–68 ng C L−1 h−1 for BP and 3–6 mg C m−3 d−1 for PP), and sometimes presented a second, much less intense peak close to the dcm depth (Fig. 5). Overall, BP and PP showed parallel trends, increasing slightly on day 3 compared to days 1 and 5. Integrated Chl a was on average 26.0 ± 2.6 mg Chl a m−2, IPPin situ 267 ± 79 mg C m−2 d−1 and IBP 98 ± 16 mg C m−2 d−1 (Table 2). DCR means (±SD) were 226 ± 43 mmole O2 m−2 d−1 (Table 2).
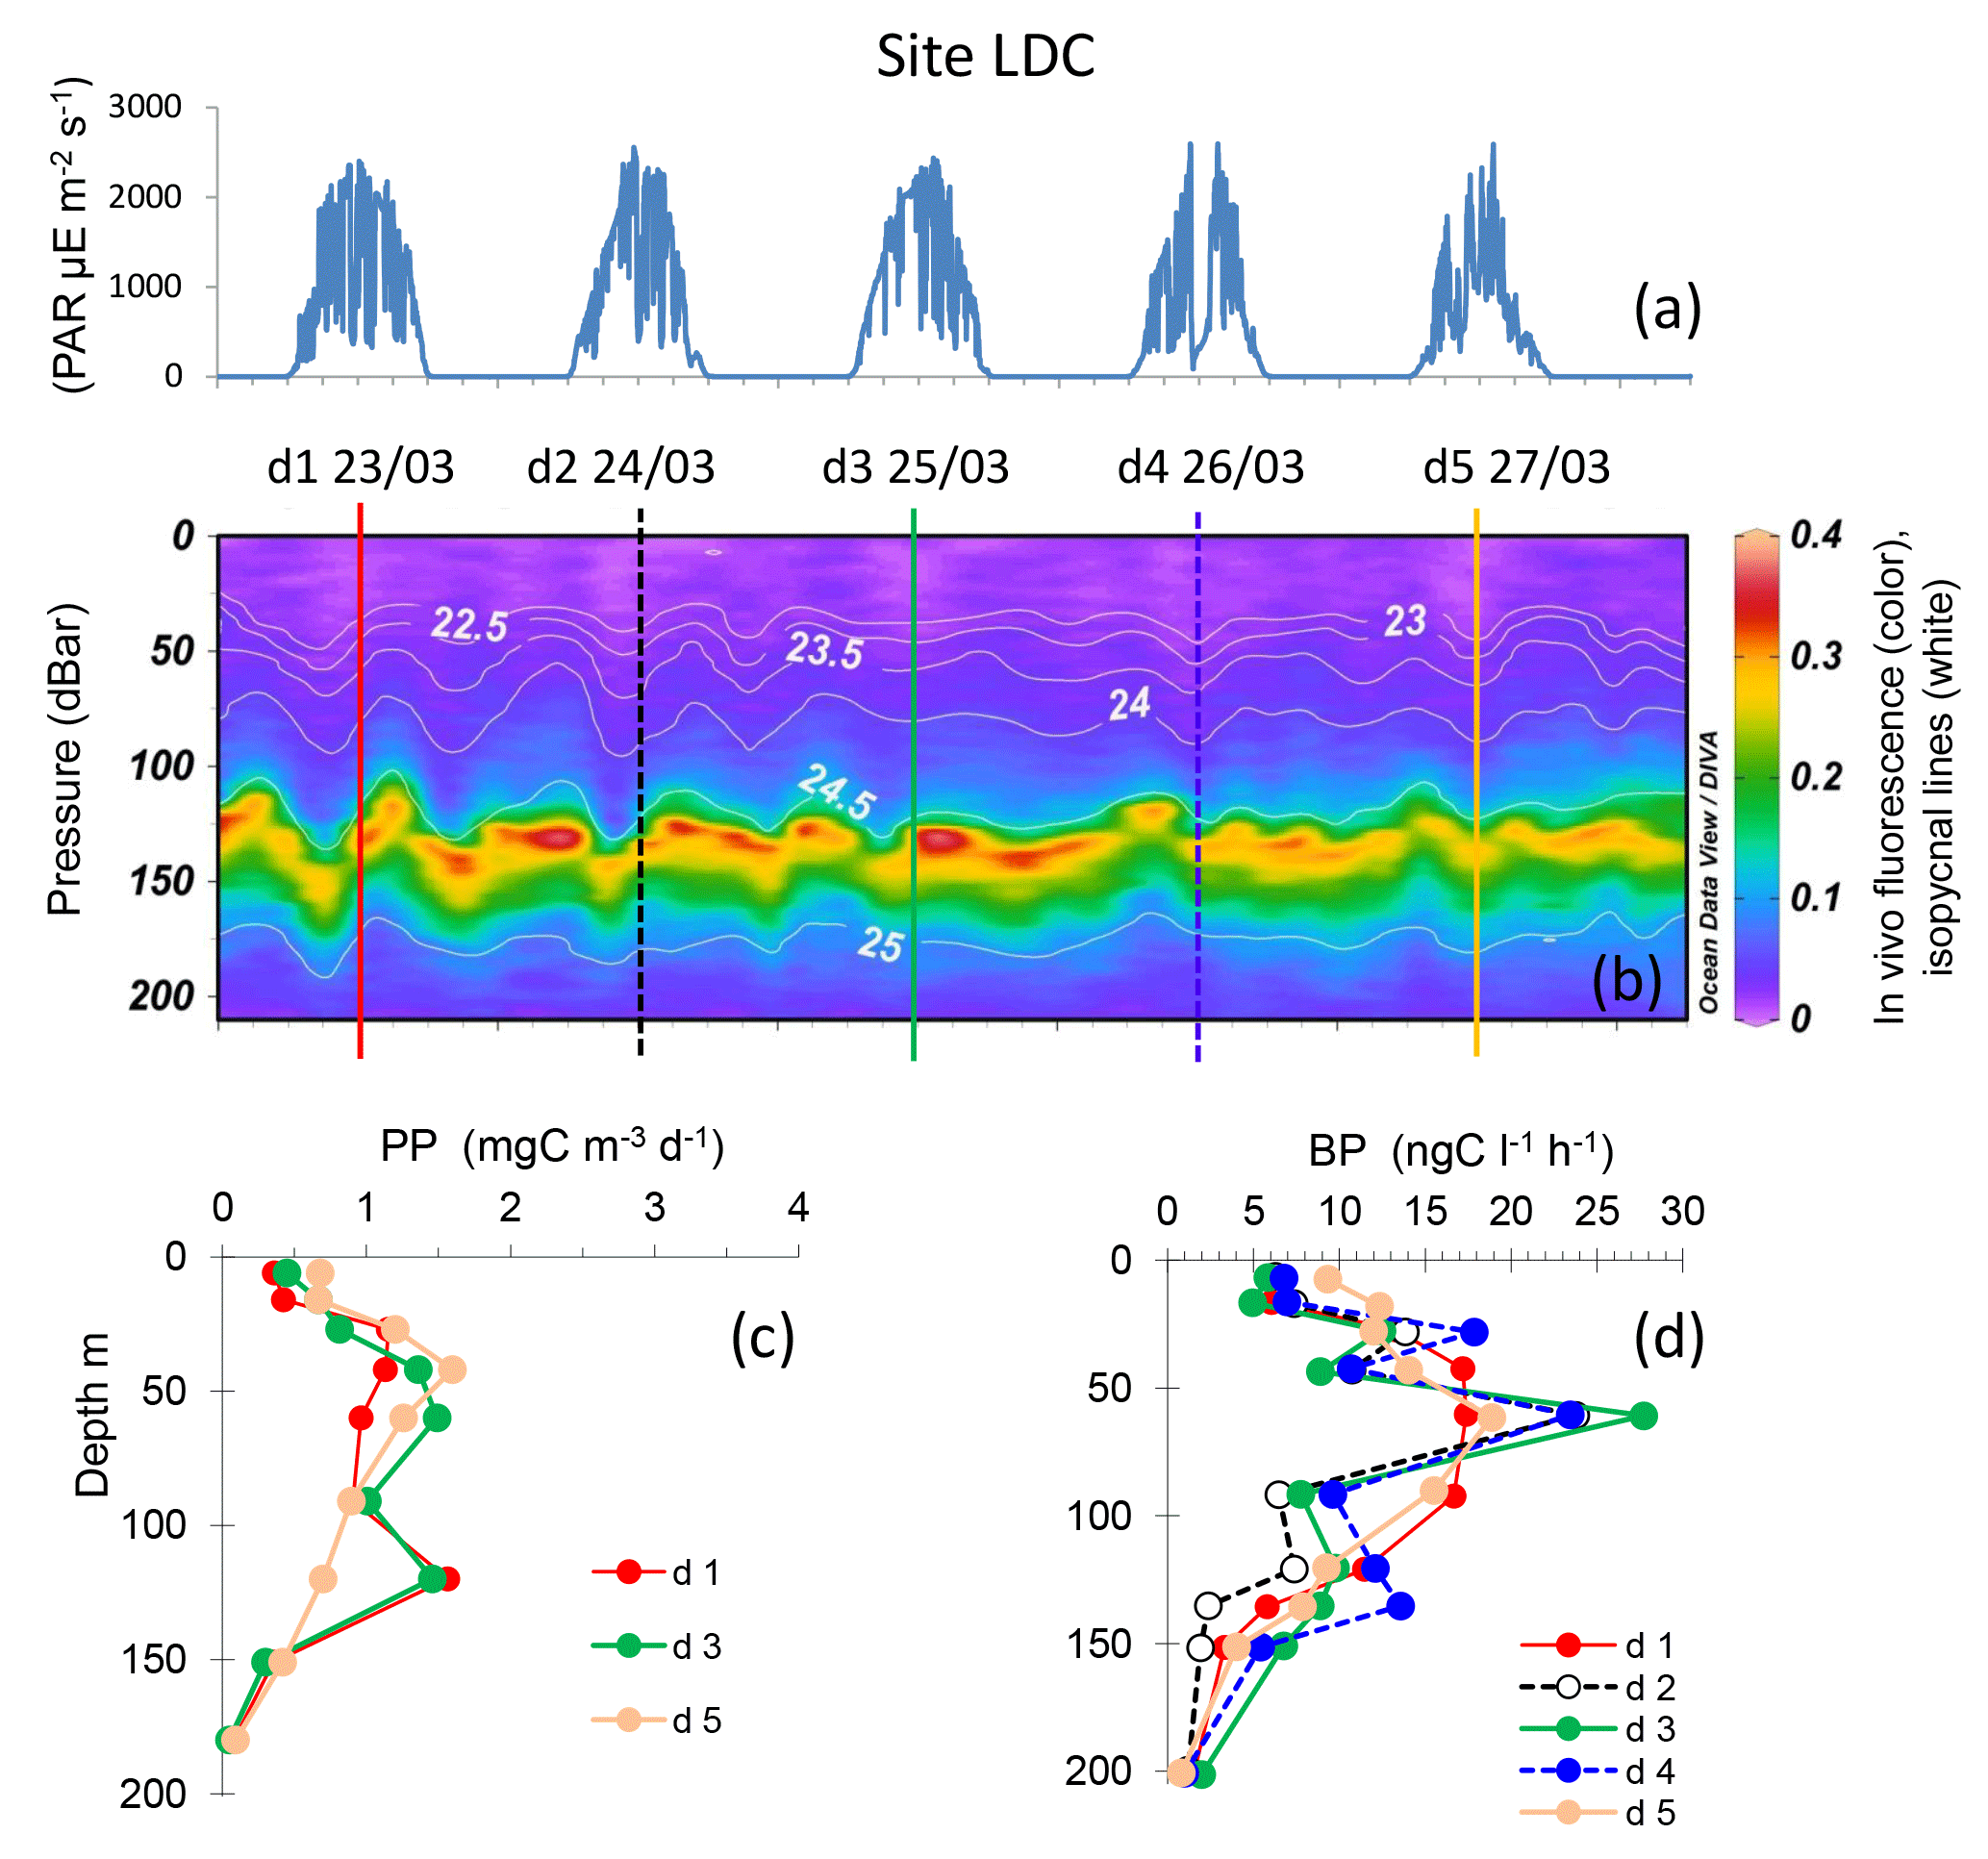
Figure 7Evolution of surface PAR (a), in vivo fluorescence and pycnoclines (b), PP (c) and BP (d) at site LDC. Time units in local time; day 1 was 23 March 2015. BP samples were taken at the 12:00 ctd cast, while samples for PPin situ were taken at the 03:00 ctd casts (days 1, 3 and 5). In graph (b) in vivo fluorescence is in color, isopycnes (kg m−3) are the white lines and vertical bars show the 12:00 ctd cast sampled for BP each day (1 to 5), with corresponding colors used for plotting BP vertical profiles in (d).
Site LDB, sampled inside a high chlorophyll patch, showed maxima of in vivo fluorescence between 10 and 77 m, the chlorophyll maximum depth showing a significant linear deepening with time (10.4 ± 0.8 m d−1, r=0.89, n=45, p < 0.001). Contrarily to site LDA, the dcm depth did not correspond to a stable pycnocline horizon, as density associated with the dcm depth varied between 21.8 and 23.9 kg m−3, and reached a plateau after day 4 (data not shown). Chl was distributed over a larger layer (between the surface and 80 m) during the first three days, and then presented a narrower and deeper zone of accumulation, with intensities increasing (Fig. 6). Integrated Chl a decreased from 53.2 to 23.9 mg Chl a m−2 between days 1 and 5, which corresponded to a chlorophyll biomass net loss of about 7.3 mg Chl a m−2 d−1. The shape of BP and PP vertical profiles was particularly modified at day 5, showing a small decrease in subsurface values for BP (125 down to 100 ng C L−1 h−1) and a larger one for PP (15 down to 9 mg C m−3 d−1). In contrast, BP increased within the dcm depth at day 5. Integrated PP decreased by approximatively 145 mg C m−2 d−1 between days 3 and 5. PP was not measured at day 4, but a decrease of BP rates in sub-surface layers was already visible. Six profiles were available for BP from which we estimated a linear increasing trend of 7.2 mg C m−2 d−1 per day (n=6, r=0.78). DCR decreased with time from 185 to 151 mmole O2 m−2 d−1, from day 1 to day 5, respectively.
Site LDC, typical of the ultra-oligotrophic WGY area, presented a deeper dcm depth, ranging from 115 to 154 m, due to internal waves (Fig. 7). Similarly to site LDA, the dcm depth corresponded to a stable density horizon (σt 24.59 ± 0.02 kg m−3, n=46). PP exhibited two peaks around 40–60 and 120 m, but they remained very low (max. 2.3 mg C m−3 d−1) compared to the other sites LDA and LDB. BP profiles paralleled those of PP, also reaching small maxima at 60 m and occasionally a second one at 120 m. The maximum BP rate was 27.7 ng C L−1 h−1. IPPin situ ranged from 149 to 165 mg C m−2 d−1, and IDCR ranged from 103 to 173 mmole O2 m−2 d−1. IBP values were also low (44 ± 5 mg C m−2 d−1) and the three integrated rates exhibited no trend with time.
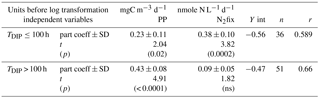
Table 3Results of multiple regressions log BP = f(log PP, log N2fix). The BP unit before log transformation is ng C L−1 h−1. Y int is the intercept with the Y axis. Partial coefficient of regression (part coeff), t value (t) and probability of the regression to be significant (p).
ns: not significant.
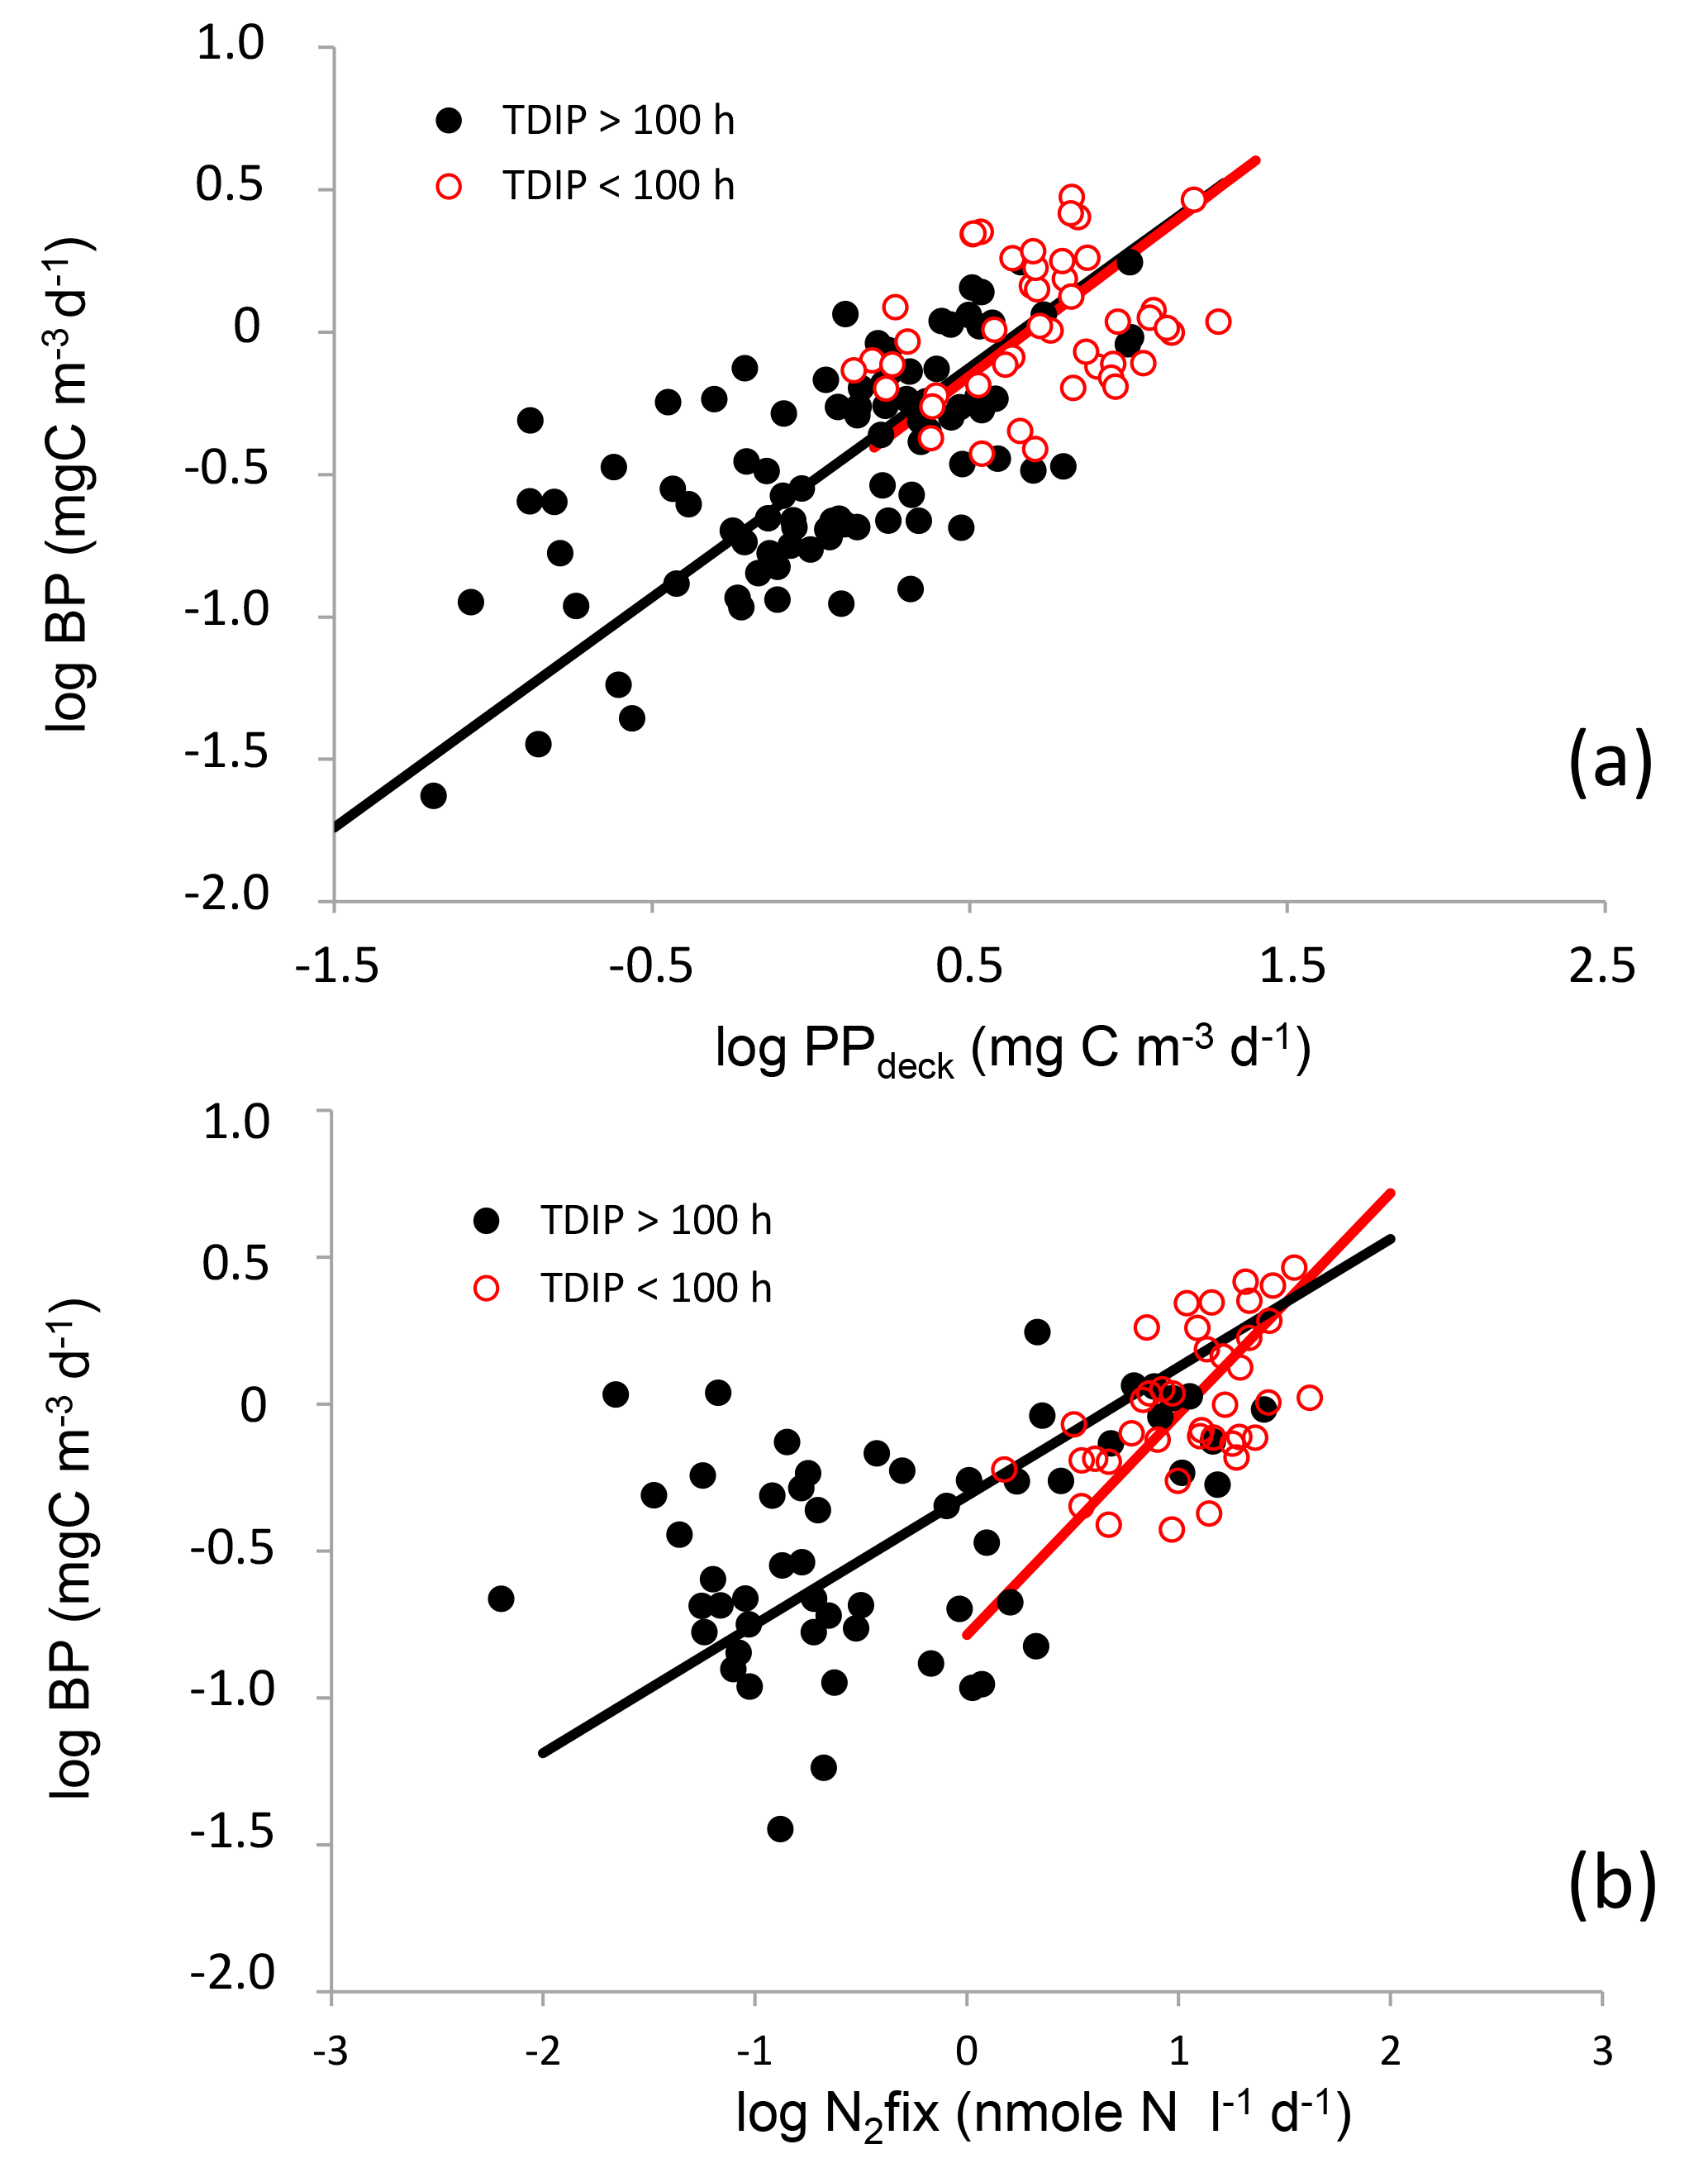
Figure 8Log–log relationships between volumetric rates of heterotrophic prokaryotic production (BP) and primary production (PP, a) and between BP and nitrogen fixation rates (N2fix, b). Red and black dots show samples where TDIP were < and > than 100 h, respectively. Lines are fitted Tessier model II regressions for data clustering samples where TDIP values were greater (black lines) and lower (red lines) than 100 h.
3.4 Relationships between BP, PP, N2fix and TDIP
There are several limitations when comparing PPdeck and PPin situ. Incubation on mooring lines for 24 h dawn to dawn is considered to be a good compromise by JGOFS recommendations (JGOFS, 1988), as conditions of temperature and light are close to in situ (except UV). Incubation on deck under simulated in situ conditions suffers from biases related to the use of artificial screens to mimic light attenuation with depth and also from biases related to temperature differences for deeper samples, as they are incubated at sea-surface temperature. During our cruise, at each LD site on day 5, we used both incubation methods, but unfortunately did not sample the same ctd cast: PPin situ was sampled at 03:00, while PPdeck was sampled at 09:00. At site LDA, differences between the mean IPP in situ and IPPdeck were particularly high. Besides artifacts related to screens and temperature described above, this difference could also be due partly to internal waves. For instance, at site LDA on day 5, the dcm depth changed from 69 to 87 m between the 03:00 ctd cast and the 09:00 ctd cast. At site LDB, the bloom collapsed rapidly and a trend with time was clearly detected, making the comparison between both methods impossible, even with a time lag of only 6 h. For this reason, and to keep relative comparisons consistent, we used only PPdeck data when exploring relationships between BP, PP, N2fix and TDIP.
Log–log relationships between BP and PPdeck presented similar trends for all samples with TDIP values below or above 100 h (Fig. 8a). Values below 50–100 h are representative of a restricted access to DIP by microorganisms (Moutin et al., 2008). TDIP below 2 days was shown to be critical for Trichodesmium spp. growth (Moutin et al., 2005). The depth at which this threshold was reached varied from surface to 64 m in MA, although all TDIP values were higher than 100 h in the WGY. For samples where TDIP was ≤ 100 and > 100 h, log–log relationships were, respectively,
and
In contrast, log–log relationships linking BP and N2fix presented different trends for samples corresponding to depths where TDIP was below or above 100 h (Fig. 8b). For samples where TDIP was ≤ 100 h and > 100 h, relationships were, respectively,
and
This shows that BP was more correlated with N2fix than with PPdeck in the P-depleted surface waters of the MA. However, as PPdeck and N2fix could co-vary, a multiple regression BP =f (PPdeck, N2fix) was tested (Table 3). The partial coefficient was not significant for N2fix for samples with TDIP > 100 h. The partial coefficients were both significant for N2fix and for PP for samples characterized by TDIP≤ 100 h, but N2fix better explained the distribution of BP in the multiple regression analysis compared to PP (t-test, p=0.024 for PP and p < 0.0001 for N2fix).
Integrated N2fix accounted for 3.3 to 81 % of the bacterial nitrogen demand along the transect, assuming a stoichiometric molar C ∕ N ratio of 5 for heterotrophic prokaryotic biomass (Fig. 3b). Among the three LD sites, the variability of this ratio was lower at sites LDA and LDC, with no particular temporal trend at any of these sites. The ratio ranged from 28 to 46 % at LDA, with a mean of 37 % ± 9 %, greater than that obtained at LDC (range 6–10 %, mean ± SD 8 % ± 2 %). The ratio exhibited no particular temporal trend, whereas a decrease was clearly observed at LDB, (68, 37 and 19 % on days 1, 3 and 5, respectively). This was due to a simultaneous decrease of N2fix rates (from 0.98 ± 0.058 mmole N m−2 d−1 on day 1 to 0.758 ± 0.058 and 0.38 ± 0.019 mmole N m−2 d−1 on days 3 and 5, respectively) and an increase in BP as described in Sect. 3.3. The mean contribution was 40 ± 20 % over all the transect, and including data from LD sites (n=26 profiles).
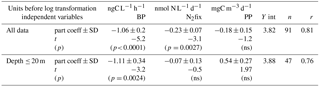
Table 4Results of multiple regressions log TDIP=f (log BP, log PP, log N2fix). The unit of TDIP before log transformation is h. Y int is the intercept with the Y axis. Partial coefficient of regression (part coeff), t value (t) and probability of the regression to be significant (p).
ns: not significant.

Figure 9Enrichment experiments. Initial conditions illustrated by vertical profiles (0–200 m) of in vivo fluorescence, BP, nutrients (nitrate (NO3), nitrite (NO2), and phosphate (DIP)) and enrichment factors sampled from the 12:00 ctd cast on day 2 of occupation at each LD site. As DOC was not sampled on this cast, we showed the data from all the other casts at the corresponding LD site (circles) and the average profile (line). Enrichment factors are the ratio of BP after a given enrichment (DIP: P in red; nitrate + ammonium: N in green; glucose: G in blue; and all components: NPG in black) compared to the unamended control, both measured after 24 h incubations. The error bar is standard deviation within triplicates, and a bar is shown only if BP is significantly greater than in the control (Mann–Whitney test, p < 0.05).
We also examined relationships between TDIP and other biological fluxes using multiple regressions [logTDIP=f(log PP, log N2fix, log BP)], incorporating 91 samples for which the three rates were measured simultaneously (Table 4). The partial coefficients were significant for both N2fix (p < 0.0001) and BP (p=0.003) but not for PP (p=0.23). As all biological rates decreased with depth, we also examined this correlation using data within the mixed layer to avoid the depth effect. With this restricted dataset (47 samples) the partial coefficients were significant only for BP (p=0.0024), just under the significance threshold for N2fix (p=0.056) and still non-significant for PP.
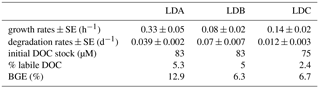
Table 5Results of biodegradation experiments. Growth rates determined from BP data, degradation rates computed from DOC data and BGE computed from Eq. (1).
3.5 DOC lability and BGE
In the three biodegradation experiments starting on day 1 at each LD site using sub-surface waters, BP increased significantly, with growth rates (determined from exponential phase of BP increase) ranging from 0.08 to 0.14 h−1. DOC was slightly consumed, with DOC concentrations decreasing only 2 to 5 % over 10 days, and with the lowest percentage of labile fraction being measured at site LDC (Table 5). Bacterial growth efficiencies were 13, 6.3 and 6.7 % at sites LDA, LDB and LDC, respectively (Table 5).
3.6 Enrichment experiments
Conditions prevailing before enrichments are presented together with enrichment factors obtained at the different depths tested as vertical distributions of in vivo fluorescence, nutrients and BP sampled from a CTD cast starting at 12:00 on day 2 of each LD site (Fig. 9). Nitrate concentrations were below the detection limits of standard methods in upper layers. The depth of the nitracline varied with the dcm depth at LDA and LDC (100 m at LDA, 135 m at LDC), but not at LDB (a large peak of chlorophyll was observed within 20–70 m with a nitracline at 100 m). Slight peaks of nitrite also occurred in the vicinity of the nitracline. Phosphate concentrations exhibited more contrasted vertical profiles than did nitrate: DIP concentrations were greater than 100 nM in the surface layers of LDC, but presented a phosphacline shallower than the nitracline at LDA and LDB, with DIP reaching concentrations below the analytical detection limits in the mixed layer (i.e., < 50 nM; see Moutin et al., 2018, for more details on nutrient distribution). As DOC was not sampled on day 2, DOC data are presented for the whole site instead. DOC peaked near the surface at site LDA (77 ± 1 µM) and was more variable but higher near the surface at site LDB, with maximum values covering a larger surface layer down to 27 m, with average DOC of 84 ± 1 µM. Site LDC presented a large sub-surface maximum within 28–42 m, reaching 77 ± 2 µM.
At site LDA, nitrogen was the first factor stimulating BP down to 100 m depth, which corresponded to the dcm depth and a nitrite regeneration layer. Although significant at 9, 24, 35 and 100 m in depth (Mann–Whitney test, p< 0.05), the response to N amendments was small, at best an enhancement factor of ×1.6. Glucose alone stimulated BP at 35 m, but only by a factor of ×1.4. However, below the euphotic zone, glucose was the first factor stimulating BP (enhancement factor ×2.4 at 200 m). NPG additions produced the largest increase in BP (×2.5–×3.0) along the profile, except at 9 m were NPG amendments did not significantly affect BP compared to the control.
At site LDB, between the surface and 42 m, both nitrogen alone and phosphate alone stimulated BP to a larger extent than at site LDA, but only by a factor ×1.5–3 for P, and ×1.8–3.7 for N. At 100 and 200 m, nitrogen continued to stimulate BP to a small extent (×3.0 and ×2.2, respectively), but the maximum enhancement was obtained after glucose addition alone (×59 and ×107, respectively). At these depths, the BP response after addition of NPG was also largely amplified compared to shallower layers (×120–132 compared to ×3.7–6.8, respectively).
At site LDC, BP reacted mostly to glucose alone, with enhancement factors increasing from ×2.6 at 16 m to ×24 at 200 m. Nitrogen alone also stimulated BP, but to a smaller extent than glucose, even within surface layers (×1.2 to ×9). In comparison to single amendments, the NPG addition particularly stimulated BP at 60 and 90 m depth.
4.1 An overview of BP and PP fluxes in the WTSP
Here, we provide a unique, coherent dataset with simultaneous estimates of PP, BP, TDIP and N2fix rates in the WTSP. Although recent interest has increased in describing fluxes and planktonic communities responsible for N2fix rates in diverse environments, particularly in oligotrophic open oceans, measurements in the tropical area of the South Pacific Ocean are rare (summarized in Gruber et al., 2016, and more recently in Bonnet et al., 2017). Moreover, few studies have attempted to simultaneously study the consequences of such activities on the functioning of the microbial food webs.
Stations in the western part of the transect along the Melanesian Archipelago (MA) generally displayed greater fluxes of PP, BP and N2fix rates than those in the WGY area, with a large degree of longitudinal variability. This was mirrored by TDIP variability spanning 2 orders of magnitude in the upper 40 m layers within MA (2 to 700 h, Fig. 4). The role of the submesoscale activity largely explained such variabilities in biogeochemical parameters and fluxes (Rousselet et al., 2018).
Previous in situ measurements of primary production in the tropical South Pacific, not directly focusing on coastal areas or within upwelling areas in the east, are scarce (Table 1). These daily particulate primary production rates, based on the 14C or 13C technique, confirm the trend that we observed in the WTSP, i.e., extremely low values in the central GY area ranging from 8 to 167 mg C m−2 d−1. PP increased in the periphery of the GY, but rates remained typical of oligotrophic to mesotrophic conditions, in the eastern region of the GY, in the south of the GY, and in the western part of the WTSP around New Caledonia and between New Caledonia and Australia (Table 1). Further northwest, in the Solomon Sea, PP increased to much greater values in an area of intense nitrogen fixation, up to 3000 mg C m−2 d−1 (Table 1). However, although an increasing number of PP and N2fix values are available in the WTSP and within the GY, the only other BP data available in these regions, to our knowledge, are those estimated during the BIOSOPE cruise (November/December 2004), along a longitudinal transect further east between Tahiti and Chile (Van Wambeke et al., 2008b). The authors measured BP integrated across the euphotic zone ranging from 86 to 144 mg C m−2 d−1 within the Marquesas Archipelago area, from 43 to 114 mg C m−2 d−1 within the center of the GY and from 57 to 93 mg C m−2 d−1 within the eastern part of the GY. Therefore, in the WTSP we encountered the same range of BP values as in the GY area east of 140∘ W.
4.2 BGE and metabolic state
Although the metabolic state of oligotrophic oceans is still controversial (Duarte et al., 2013; Ducklow and Donney, 2013; Williams et al., 2013; Serret et al., 2015; Letscher et al., 2017), a consensus emerges that in vitro estimates (involving O2 derived rates or labelling with 18O2, 13C, or 14C isotopes) tend to show net heterotrophy in oligotrophic environments. This is indeed what we obtained here, with negative Net Community Production (NCP) values at the three sites LDA, LDB and LDC (−97 to −198, −73 to −134, and −61 to −141 mmole O2 m−2 d−1, respectively, Dominique Lefevre, personal communication, 2018). In the WTSP, negative NCP were also obtained in the oligotrophic waters offshore of New Caledonia (Pringault et al., 2007). However, in vitro technique estimates suffer from many biases related to reproducibility, bottle effects, type of flasks used (selecting light wavelengths), condition of incubations and handling artifacts, and a lack of high-frequency measurements (Aranguren-Gassis et al., 2012a, b). For example, following the same water mass during 5 days, a substantial temporal variation in NCP by nearly 2-fold was observed at the LDA, LDB and LDC sites. In contrast, in situ based estimates, based on observations of mixed-layer net oxygen exchanges (O2 ∕ Ar technique), tend to favor slight net autotrophy (Williams et al., 2013). However, these results also suffer from biases related to the estimate of the mixed layer depth considered and the diffusive coefficients used for gases. Another approach based on the use of oxygen sensors in Argo floats recently showed annual NCP close to zero in the South Pacific Ocean (Yang et al., 2017). Recent models encompassing all seasons and a large areal basis find the global ocean to be net autotrophic, including all five oligotrophic subtropical gyres (Letscher et al., 2017). Estimating the metabolic balance by comparing different methods is thus of great interest but rare, especially in the South Pacific. For instance, in the center of the GY, between the Polynesian Archipelago and Easter Island, net heterotrophy was also obtained (although not statistically different from zero) using the in vitro O2 technique (Van Wambeke et al., 2008b), whereas a non-intrusive bio-optical method showed metabolic balance (Claustre et al., 2008a).
Simultaneous estimates of PP, BP and N2fix rates are almost absent in oligotrophic waters and to date, BP has not been measured in the WTSP. Here we analyse the contribution of primary production to bacterial carbon demand by comparing separate estimates from the WTSP using our C-based discrete biological fluxes. The ratio of bacterial carbon demand (BCD) to gross primary production (GPP) is presented as an index of the coupling between primary producers and heterotrophic bacteria and of metabolic balance (Hoppe et al 2002; Fouilland and Mostajir, 2010): to sustain heterotrophy when BCD exceeds GPP, populations can be temporally non-synchronous and/or allochthonous sources of DOM may be required.
It is known that the in vitro 14C method measures an intermediate state between net PP and GPP. However, Moutin et al. (1999) showed that GPP could be reasonably estimated from daily net PP determined from dawn-to-dawn as GPP = 1.72 × PP. On the other hand, dealing with the assumptions made to convert hourly leucine incorporation rates to daily BCD, there are many biases that have been largely debated, primarily those resulting from daily variability, assumptions about BGE or BR (Alonzo-Saez et al., 2007; Aranguren-Gassis et al., 2012b), carbon to leucine conversion factors (Alonso-Saez et al., 2010), and light conditions of incubations including UV (Ruiz-Gonzales et al., 2013). In this study, we provide direct and indirect estimation of BGE to discuss its variability. Daily variability will also be taken into account using results from previous experiments in the South Pacific Gyre (BIOSOPE cruise, Van Wambeke et al., 2008). Finally, we will also discuss one largely unexplored bias, related to the ability of Prochlorococcus to assimilate leucine in the dark.
Bacterial growth efficiencies (BGE) obtained from biodegradation experiments ranged from 6 to 12 %, with a small labile fraction of DOC (only 2–5 % of biodegradable DOC in 10 days). Thus, the bulk DOC was mainly refractory, although DOC concentration was high in the surface (Moutin et al., 2018). Large stocks of DOC, with C ∕ N ratios ranging from 16 to 23, have also been reported in the surface waters of the SPG (Raimbault et al., 2008). Both high C ∕ N ratios and a small labile fraction suggests that this surface bulk pool of DOC is probably largely recalcitrant due to UV photodegradation or photooxidation (Keil and Kirchman, 1994; Tranvik and Stephan, 1998; Carlson and Hansel, 2015) or by action of the microbial carbon pump (Jiao et al., 2010). Small BGE and small labile fraction could also be due to strong resource dependence as low nutrient concentrations cause low primary production rates and low transfer across food webs. Indeed, Letscher et al. (2015) also observed surface DOC recalcitrant to remineralization in the oligotrophic part of the eastern tropical South Pacific. But as shown by these authors, incubation with microbial communities from the twilight zone, provided by addition of an inoculum concentrated in a small volume, allowed DOC remineralization. This was explained by relief from micronutrient limitation or by the co-metabolism of relatively labile DOC provided by the inoculum with more recalcitrant DOC. Results from our enrichment experiments effectively suggest nutrient limitation, although the second hypothesis cannot be excluded.
In order to better explain the variability of BGE measurements, we also estimated this parameter indirectly, using simultaneously measured dark community respiration (DCR) and BP data. We converted DCR to carbon units assuming a respiratory quotient RQ = 0.9, and computed BGE from Ze-integrated BP and DCR assuming either bacterial respiration (BR) to be within a range of 30 % of DCR (BGE = BP ∕ (BP + DCR × 0.9 × 30 %), Rivkin and Legendre, 2001; del Giorgio and Duarte, 2002) or 80 % of DCR (BGE = BP ∕ (BP + DCR × 0.9 × 80 %), Lemée et al., 2002; Aranguren-Gassis et al., 2012b). These indirect estimates of BGE ranges were similar to those obtained from the biodegradation experiments: 3–12 % at site LDA, 4–17 % at site LDB and 2–7 % at site LDC. Note, however, an increasing trend from day 1 to day 5 at site LDB: on average 8 % on day 1, 10 % on day 3 and 12 % on day 5. Including all direct and indirect estimates, the mean (±SD) BGE was 8 ± 4 % (n=21).
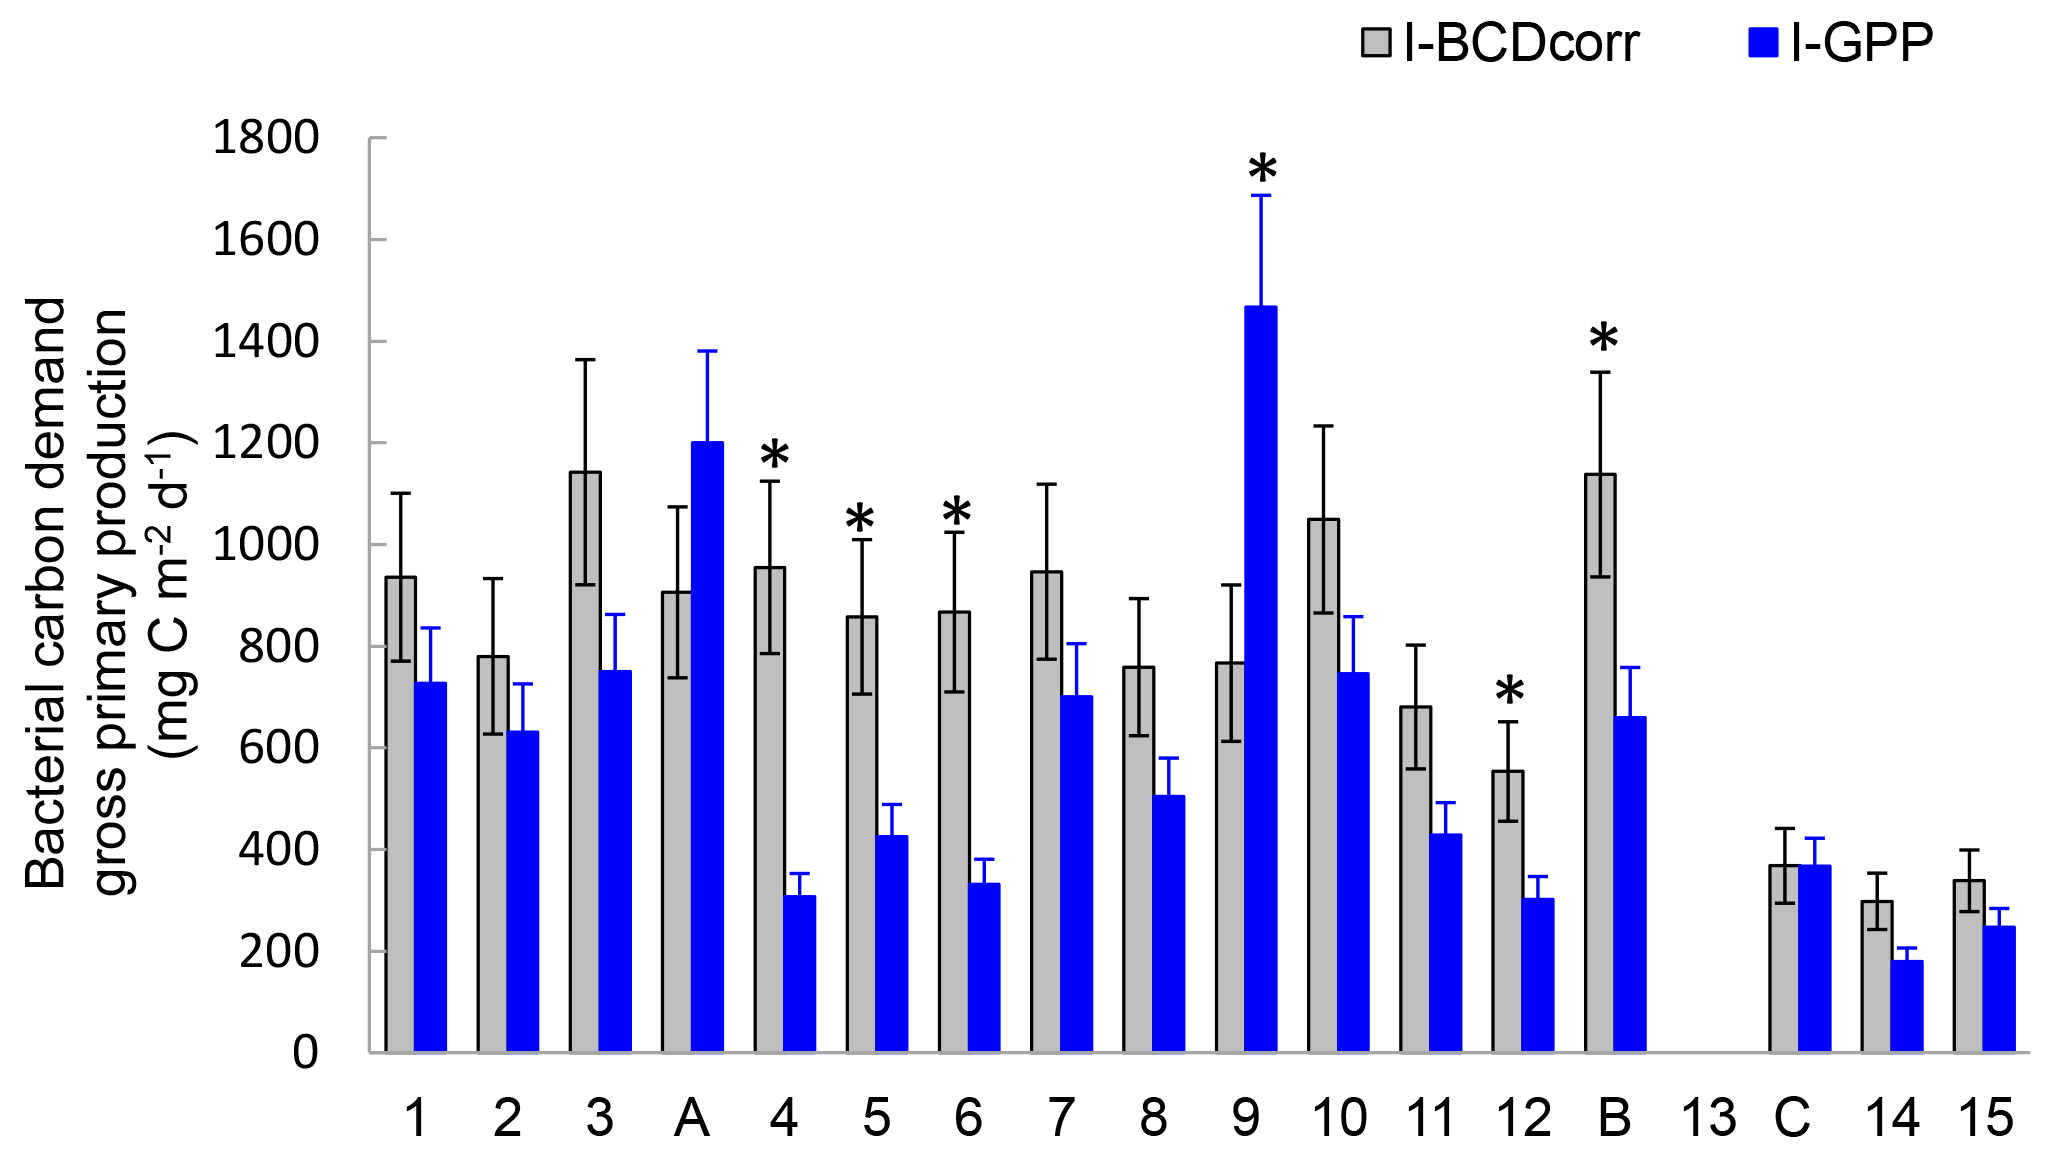
Figure 10Distribution of integrated bacterial carbon demand corrected for Prochlorococcus assimilation (I-BCDcorr, grey bars) gross primary production derived from IPPdeck (I-GPP, blue bars), along the transect. Error bars are standard errors (SE), calculated using propagation of errors. We included analytical SE (triplicate measurement at each depth for PP and BP), SE due to daily BP variability, SE from BGE, and SE due to leucine assimilation by Prochlorococcus. * Shows stations in which I-BCDcorr minus I-GPP was statistically different from zero.
Although bias introduced when converting hourly to daily BP rates was not studied here, we used a dataset obtained in the South Pacific Gyre (Van Wambeke et al., 2008) to estimate conversion errors. During the BIOSOPE cruise, vertical profiles of BP were acquired every 3 up to 72 h, using the leucine technique within the euphotic zone at three selected sites using a Lagrangian sampling strategy. For the three series of profiles, standard deviations of BPI with time were 13 % (n=13), 16 % (n=16) and 19 % (n= 9). Thus, standard errors represented 3.6, 4.2 and 6.1 % of the mean BPI, respectively. We used the average value of this percentage (5 %) to estimate the bias introduced by the conversion from hourly to daily BPI estimates of the OUPACE cruise.
Finally, we considered the ability of Prochlorococcus to assimilate leucine in the dark. Using flow cytometry cell sorting of samples labelled with 3H-leucine during the OUTPACE cruise, Duhamel et al. (2018) demonstrated the mixotrophic capacity of Prochloroccoccus, as this phytoplankton group was able to incorporate leucine, even under dark conditions, albeit at lower rates than under light conditions. This group was found to be able to assimilate ATP, leucine, methionine and glucose, a single C-containing molecule (Duhamel et al., 2018, and references therein). To date, few organic molecules have been tested, and those mainly include N, P or S sources. As leucine assimilation by Prochloroccoccus was significantly detected in dark incubations in all examined samples, it will affect BP measurements. We thus corrected BP (BPcorr) to represent the assimilation of leucine in the dark by heterotrophic bacteria alone. Based on Duhamel et al. (2018), leucine assimilation by HNA + LNA bacteria in the dark corresponded on average (±SD) to 76 ± 21 % (n=5, range 44–100 %) of the activity determined for the community including Prochlorococcus (HNA + LNA + Proc). I-BCDcorr was then calculated and its distribution presented with I-GPP (Fig. 10), assuming a mean 8 % for BGE in all our integrated data. Among 14 stations over the 17 presented the mean integrated I-BCDcorr is greater than I-GPP. We tested whether the confidence interval 95 % of the difference I-BCDcorr minus I-GPP is included or not zero (t-test) before concluding on the metabolic balance, and found that I-GPP is significantly lower than I-BCDcorr at stations SD4, 5, 6, 12 and LDB (i.e., only 5 stations among 17), and greater at only one (SD9). The remaining stations (11 among 17) were in metabolic balance. These results confirm the necessity to include the variability of different conversion factors before making conclusions about whether GPP satisfies (or not) BCD and accounting for the bias introduced by Prochlorococcus assimilation of leucine in BP estimates.
Such comparisons between GPP and BCD would be more complex if the short-term temporal variability in conversion factors was considered. For example, site LDB illustrates how rapidly these relative fluxes changed during the collapse of the bloom. LDB was located inside a massive chlorophyll patch, which had been drifting eastwards for several months (de Verneil et al., 2017) and which collapsed at the time LDB was sampled. Considering the decreasing Chl a stocks, decreasing PP and increasing BP, I-BCDcorr to I-GPP ratios would increase from 1.08 (day 1) to 1.83 (day 5), based on a constant BGE of 8 %. However, using the actual BGE increase measured from days 1 to 5, the ratio would increase only from 1.1 to 1.2, and the site would have been under metabolic balance during that period. Unfortunately, it is nearly impossible to assess all correction and conversion factors at the same resolution as BP and PP measurements, leading to unconstrained budgets (Gasol et al., 2008).
4.3 Nutrient limitation and relationships with nitrogen fixers
Phylogenetic analyses of the functional gene nifH showed the prevalence of gamma-proteobacteria and unicellular cyanobacteria UCYN-A (presumably photo-heterotroph) in the surface layers of the ultra-oligotrophic center of the GY (Halm et al., 2012). However, quantifying gene transcripts in the GY and in the WTSP, Moisander et al. (2014) found nifH expression by UCYN-A to be 1–2 orders of magnitude greater than for a gamma proteobacterial diazotroph (γ-24774A11). Along the Australian Great Barrier Reef, as determined by qPCR, the abundance of nifH gene copies of the Gamma A group (with peaks of only 5.9 × 10² nifH copies L−1) were in general also 1–2 orders of magnitude less abundant than those of Trichodesmium (Messer et al., 2017). Unfortunately, to date, there are no data on the nifH gene diversity of heterotrophic nitrogen fixers, nor on their expression, in the euphotic layers for the OUTPACE cruise, but nifH gene presence in some heterotrophs has been detected in the aphotic zone (Benavides et al., 2018). Using a qPCR analysis of nifH gene copies in selected diazotrophs, focusing on cyanobacteria (unicellular, filaments and heterocystous symbionts) during the OUTPACE cruise, Stenegren et al. (2018) showed that Trichodesmium dominated in surface layers (0–35 m) within MA, but was rare or undetected in the WGY. Within MA the second and third most abundant populations of cyanobacteria detected were, respectively, UCYN-B and heterocystous endosymbionts (diatom–diazotroph associations). Among the investigated cyanobacterial diazotrophs, this study showed a temperature–depth gradient separating two groups of cyanobacteria, with Trichodesmium occupying the warmest and shallowest waters, UCYN-A occupying the coldest and deeper waters and UCYN-B having a more widespread distribution.
Regardless of the intermediary processes relating both fluxes, the amount of N2 fixed corresponded to 15–83 % of heterotrophic bacterial nitrogen demand in MA and 3–34 % in the WGY (Fig. 3b). This fraction could be particularly high in the MA area, where N2fix rates reached maximum values for the cruise (1 mmole m−2 d−1 at station SD11). Besides this exception, the activity of N2 fixers generally sustained less than half the heterotrophic bacterial N demand (mean ± SD: 34 ± 20 %, n=26). Nevertheless, the activity of N2 fixers was responsible for the injection of new N in the microbial food chain, enabling a cascade transfer through non-fixing autotrophs and heterotrophs, and possibly C and N export by sedimentation even in the oligotrophic areas of the WTSP (Caffin et al., 2018). The transfer between N2 fixers and heterotrophic prokaryotes occurs on a daily scale, as confirmed by nano-scale secondary ion mass spectrometry (nanoSIMS) experiments, which make it possible to track the fate of 15N2 at the individual cell level. These experiments have shown a rapid N transfer from Trichodesmium colonies to heterotrophic epiphyte bacterial cells (Eichner et al., 2017). Although it is not known from this study if the 15N can reach free living heterotrophic prokaryotes or non-fixing phytoplankton, other experiments suggest that 15N fixed by Trichodesmium reaches rapidly non-fixing diatoms (Foster et al., 2011; Bonnet et al., 2016). Using diazotroph cultures inoculated in natural sea waters from the New Caledonia lagoon, Berthelot et al. (2016) also showed a rapid transfer (48 h) from a Trichodesmium (T. erythraeum) and a UCYN-B (Chrocosphaera. Watsonii) towards heterotrophic bacteria. Recent evidence also suggests a rapid transfer from the symbiotic photo-heterotrophic cyanobacterium UCYN-A, which have much greater growth rates than Trichodesmium, to its associated eukaryotic algae (Martinez-Perez et al., 2016).
Consequently, most N2-fixing cyanobacteria detected in the WTSP during this cruise have the potential to transfer N rapidly (1–2 days) towards strict heterotrophic bacteria or non-fixing phytoplankton. We found that the correlation between N2fix rate and BP was better within the mixed layers and when the TDIP is low (< 100 h), i.e., in areas of phosphate deficiency (Moutin et al., 2008). Greater correlation between BP and N2fix than between BP and PP would suggest that bacteria may have been more dependent on the availability of new sources of N than C, which is in agreement with results from enrichment experiments at LDA and LDB. Because TDIP was lower in areas of high N2fix rates, it is likely that DIP drawdown was due to diazotrophs which, while bringing new sources of N, reduced DIP availability. Indeed, at site LDB within the mixed layers, BP increased after N addition alone but also after P addition alone, which suggests a direct limitation of BP by N and potentially a cascade effect of P addition towards heterotrophic prokaryotes: P would directly stimulate N2 fixers which rapidly would transfer new N and labile C available to stimulate BP. At sites LDA and LDB, the addition of the three-element NPG stimulated BP more than P alone or N alone, suggesting possible NP co-limitation of heterotrophic prokaryotes. Furthermore, if N was shown to be the first limiting nutrient during a short timescale experiment, addition of P stimulates N2fix, PP and export at longer timescales (Van Den Brock et al., 2004; Berthelot et al., 2015; Gimenez et al., 2016).
Below the surface layers, where TDIP increases, and where UCYN-A dominates, DIP becomes available and nitrate diffusing through the nitracline sustains primary production. BP and PP were correlated within these layers, suggesting a strong coupling between BP and PP through the release of labile organic C. Indeed, our enrichment experiments revealed that BP was limited first by labile C, secondarily by N within these layers (Fig. 9).
Finally, within the WGY area, where TDIP were elevated in the mixed layer (more than 100 h), with detectable DIP concentrations reaching 100 nM, the activity of N2 fixers was extremely low. In this area, BP was limited mainly by the availability of energy or labile C. Indeed, within site LDC, glucose alone stimulated BP to a larger extent than did N alone, even when the latter was provided in the form of ammonium. This trend was also observed from enrichment experiments performed in the center and the eastern zones of the GY (Van Wambeke et al., 2008a). UCYN-B dominated the N2 fixing populations in the WGY, which accounted for 81–100 % of the total detected cyanobacterial nifH gene copies (Stenegren et al., 2018). Among UCYN-B, Crocosphaera is one of the most studied representatives. One of its sub-populations is recognized to produce EPS (Bench et al., 2016), which could be a significant energy source for heterotrophic prokaryotes. In the North Pacific Subtropical Gyre, Wilson et al. (2017) hypothesized that Crocosphaera could fix N2 in excess of its growth requirements and could release fixed N in seawater. They also showed a highly dynamic Crocosphaera growth and decay during diel cycles, suggesting rapid switch between cell growth and mortality processes, such as grazing and viral infection. The resources provided by leakage, lysis and grazing processes likely directed energy and N towards heterotrophic bacteria at a daily scale when N2 fixation was favorable, as shown in the North Pacific. However, in the WGY, N2fix rates were very low and could only sustain a low percentage of bacterial and phytoplankton N demand.
Our results provide a unique set of simultaneous measurements of BP, PP and N2fix rates in the WTSP. BP obtained in the WTSP was in the same range as those previously measured in the GY area east of 140∘ W. BGE was low (8 % on average) and the bulk DOC was found to be refractory (labile DOC 2–5 % on average). We show that the interpretation of PP and BP fluxes based on instantaneous methods (radioisotopic labelling) needs regular tests to verify the major methodological biases and conversion factors hypotheses. In particular, to make conclusions about the metabolic state of oceanic regions, it is necessary to consider the variability of all conversion factors used to estimate carbon-based GPP and BCD. In addition, the use of the leucine technique to estimate BP should be used with caution in N-limited environments due to the potential mixotrophy by cyanobacteria. Taking these corrections into account and using propagation of errors, we compared I-BCDcorr and I-GPP as indexes of the coupling between primary producers and heterotrophic bacteria. We found that the system was in metabolic balance at 11 over the 17 stations investigated. In the N and relatively DIP depleted surface waters, BP was more strongly correlated with N2fix than with PP, while the more traditional coupling of BP with PP occurred deeper in the euphotic zone. This suggests that in surface layers with elevated diazotrophic activity, BP was more dependent on the availability of new N from the activity of N2 fixers than on the availability of fresh C from the activity of primary producers, as was also demonstrated through enrichment experiments.
All data and metadata are available at the French INSU/CNRS LEFE CYBER database (scientific coordinator: Hervé Claustre; data manager and webmaster: Catherine Schmechtig) at the following web address: http://www.obs-vlfr.fr/proof/php/outpace/outpace.php (INSU/CNRS LEFE CYBER, 2017).
The authors declare that they have no conflict of interest.
This article is part of the special issue “Interactions between planktonic organisms and biogeochemical cycles across trophic and N2 fixation gradients in the western tropical South Pacific Ocean: a multidisciplinary approach (OUTPACE experiment)”. It is not associated with a conference.
We thank Sandra Helias, Olivier Grosso, and Mathieu Caffin for their support
in providing nutrient and N2 fixation data, Nicholas Bock for linguistic
check, David Nérini for discussions on statistics, Sophie Bonnet and Mar
Benavides for discussions on diazotrophs, María Aranguren-Gassis and an
anonymous reviewer for their constructive advices to improve the manuscript.
This is a contribution of the OUTPACE (Oligotrophy from Ultra-oligoTrophy
PACific Experiment) project (https://outpace.mio.univ-amu.fr/, last
access: 27 April 2018) funded by the French research national agency
(ANR-14-CE01-0007-01), the LEFECyBER program (CNRS-INSU), the GOPS program
(IRD), the CNES (BC T23, ZBC 4500048836) and the European FEDER Fund (project
1166-39417). The OUTPACE cruise (http://dx.doi.org/10.17600/15000900)
was managed by MIO (OSU Institut Pytheas, AMU) from Marseille (France).
Solange Duhamel was funded by the National Science Foundation (OCE-1434916).
Edited by: Emilio Maranón
Reviewed by: María Aranguren-Gassis and one anonymous referee
Alonso-Saez, L., Gasol, J. M., Aristegui, J., Vilas, J. C., Vaque, D., Duarte, C. M., and Agusti, S.: Large scale variability in surface bacterial carbon demand and growth efficiency in the subtropical northeast Atlantic Ocean, Limnol. Oceanogr., 52, 533–546, 2007.
Alonso-Saez, L., Vasquez-Dominguez, E., Cardelus, C., Pinhassi, J., Montserrat Sala, M., Lekunberri, I., Balagué, V., Vila-Costa, M., Unrein, F., Massana, R., Simo, R., and Gasol, J.: Leucine to carbon empirical conversion factor experiments: does bacterial community structure have an influence?, Environ. Microbiol., 12, 2988–2997, 2010.
Aranguren-Gassis, M., Serret, P., Fernández, E., Herrera, J. L., Dominguez, J. F., Perez, V., and Escanez, J.: Balanced plankton net community metabolism in the oligotrophic North Atlantic subtropical gyre from Lagrangian observations, Deep-Sea Res. Pt. I, 68, 116–122, 2012a.
Aranguren-Gassis, M., Teira, E., Serret, P., Martínez-García, M., and Fernández, E.: Potential overestimation of bacterial respiration rates in oligotrophic plankton communities, Mar. Ecol. Prog. Ser., 453, 1–10, 2012b.
Benavides, M., Moisander, P., Berthelot, H., Dittmar, T., Grosso, O., and Bonnet, S.: Mesopelagic N2 Fixation Related to Organic Matter Composition in the Solomon and Bismarck Seas (Southwest Pacific), Plos One, 10, e0143775, https://doi.org/10.1371/journal.pone.0143775, 2015.
Benavides, M., Shoemaker, K. M., Moisander, P. H., Niggemann, J., Dittmar, T., Duhamel, S., Grosso, O., Pujo-Pay, M., Hélias-Nunige, S., and Bonnet, S.: Aphotic N2 fixation along an oligotrophic to ultraoligotrophic transect in the Western Tropical South Pacific Ocean, Biogeosciences Discuss., doi.org/10.5194/bg-2017-542, in press, 2018.
Bench, S. R., Frank, I., Robidart, J., and Zehr, J. P.: Two subpopulations of Crocosphaera watsonii have distinct distributions in the North and South Pacific, Environ. Microbiol., 18, 514–524, 2016.
Berthelot, H., Moutin, T., L'Helguen, S., Leblanc, K., Hélias, S., Grosso, O., Leblond, N., Charrière, B., and Bonnet, S.: Dinitrogen fixation and dissolved organic nitrogen fueled primary production and particulate export during the VAHINE mesocosm experiment (New Caledonia lagoon), Biogeosciences, 12, 4099–4112, https://doi.org/10.5194/bg-12-4099-2015, 2015.
Berthelot, H., Bonnet, S., Grosso, O., Cornet, V., and Barani, A.: Transfer of diazotroph-derived nitrogen towards non-diazotrophic planktonic communities: a comparative study between Trichodesmium erythraeum, Crocosphaera watsonii and Cyanothece sp., Biogeosciences, 13, 4005–4021, 2016.
Bonnet, S., Dekaezemacker, J., Turk-Kubo, K. A., Moutin, T., Hamersley, R. M., Grosso, O., Zehr, J. P., and Capone, D. G.: Aphotic N2 Fixation in the Eastern Tropical South Pacific Ocean, PLoS ONE, 8, e81265, https://doi.org/10.1371/journal.pone.0081265, 2013.
Bonnet, S., Berthelot, H., Turk-Kubo, K. A., Cornet-Barthaux, V., Fawcett, S., Berman-Frank, I., Barani, A., Grégori, G., Dekaezemacker, J., Benavides, M., and Capone, D. G.: Diazotroph derived nitrogen supports diatom growth in the South West Pacific: A quantitative study using nanoSIMS, Limnol. Oceanogr., 61, 1549–1562, https://doi.org/10.1002/lno.10300, 2016.
Bonnet, S., Caffin, M., Berthelot, H., and Moutin, T.: Hot spot of N2 fixation in the western tropical South Pacific pleads for a spatial decoupling between N2 fixation and denitrification, PNAS Letter, 114, E2800–E2801, doi/10.1073/pnas.1619514114, 2017.
Bonnet, S., Caffin, M., Berthelot, H., Grosso, O., Benavides, M., Helias-Nuninge, H., Guieu, C., Stenegren, M. and Foster, R.: In depth characterization of diazotroph activity across the Western Tropical South Pacific hot spot of N2 fixation, Biogeosciences Discuss., doi.org/10.5194/bg-2017-567, 2018.
Bouruet-Aubertot, P., Cuypers, Y., Doglioli, A., Caffin, M., Yohia, C., de Verneil, A., Petrenko, A., Lefèvre, D., Le Goff, H., Rougier, G., Picheral, M., and Moutin, T.: Longitudinal contrast in Turbulence along a ∼ 19S section in the Pacific and its consequences on biogeochemical fluxes, Biogeosciences Discuss., https://doi.org/10.5194/bg-2018-170, in review, 2018.
Caffin, M., Moutin, T., Foster, R. A., Bouruet-Aubertot, P., Doglioli, A. M., Berthelot, H., Grosso, O., Helias-Nunige, S., Leblond, N., Gimenez, A., Petrenko, A. A., de Verneil, A., and Bonnet, S.: Nitrogen budgets following a Lagrangian strategy in the Western Tropical South Pacific Ocean: the prominent role of N2 fixation (OUTPACE cruise), Biogeosciences Discuss., https://doi.org/10.5194/bg-2017-468, in press, 2018.
Carlson, C. A. and Hansell, D. A.: DOM sources, sinks, reactivity and budgets, in: Biogeochemistry of Marine Dissolved organic matter, 2nd Edn., edited by: Hansell, D. A. and Carlson, C. A., Academic Press, Chapter, 3, 66–95, 2015.
Claustre, H., Huot, Y., Obernosterer, I., Gentili, B., Tailliez, D., and Lewis, M.: Gross community production and metabolic balance in the South Pacific Gyre, using a non intrusive bio-optical method, Biogeosciences, 5, 463–474, doi.org/10.5194/bg-5-463-2008, 2008a.
Claustre, H., Sciandra, A., and Vaulot, D.: Introduction to the special section bio-optical and biogeochemical conditions in the South East Pacific in late 2004: the BIOSOPE program, Biogeosciences, 5, 679–691, https://doi.org/10.5194/bg-5-679-2008, 2008b.
Cauwet, G.: Determination of dissolved organic carbon (DOC) and nitrogen (DON) by high temperature combustion, in: Methods ofseawater analysis, 3rd Edn., edited by: Grashoff, K., Kremling, K., and Ehrhard, M., 407–420, 1999.
Cole, J. J., Findlay, S., and Pace, M. L.: Bacterial production in fresh and saltwater ecosystems: a cross – system overview, Mar. Ecol. Prog. Ser., 43, 1–10, 1988.
Dekaezemacker, J., Bonnet, S., Grosso, O., Moutin, T., Bressac, M., and Capone, D. G.: Evidence of active dinitrogen fixation in surface waters of the eastern tropical South Pacific during El Niño and La Niña events and evaluation of its potential nutrient controls, Global Biogeochem. Cy., 27, 1–12, 2013.
del Giorgio, P. and Duarte, C.: Respiration in the open ocean, Nature, 420, 379–384, 2002.
de Verneil, A., Rousselet, L., Doglioli, A. M., Petrenko, A. A., and Moutin, T.: The fate of a southwest Pacific bloom: gauging the impact of submesoscale vs. mesoscale circulation on biological gradients in the subtropics, Biogeosciences, 14, 3471–3486, doi.org/10.5194/bg-14-3471-2017, 2017.
de Verneil, A., Rousselet, L., Doglioli, A. M., Petrenko, A. A., Maes, C., Bouruet-Aubertot, P., and Moutin, T.: OUTPACE long duration stations: physical variability, context of biogeochemical sampling, and evaluation of sampling strategy, Biogeosciences, 15, 2125–2147, https://doi.org/10.5194/bg-15-2125-2018, 2018.
Duarte, C. M., Regaudie-de-Gioux, A., Arrieta, J. M., Delgado-Huertas, A., and Agustí, S.: The Oligotrophic Ocean Is Heterotrophic, Ann. Rev. Mar. Sci., 5, 551–569, 2013.
Ducklow, H. W. and Doney, S. C.: What is the metabolic state of the oligotrophic ocean? A debate, Ann. Rev. Mar. Sci., 5, 525–533, 2013.
Duhamel, S., Zeman, F., and Moutin, T.: A dual-labeling method for the simultaneous measurement of dissolved inorganic carbon and phosphate uptake by marine planktonic species, Limnol. Oceanogr. Methods, 4, 416–425, 2006.
Duhamel, S., Van Wambeke, F., Lefevre, D., Benavides, M., and Bonnet, S.: Mixotrophic metabolism by natural communities of unicellular cyanobacteria in the western tropical South Pacific Ocean, Environ. Microbiol. Rep., in press, https://doi.org/10.1111/1462-2920.14111, 2018.
Dupouy, C., Petit, M., and Dandonneau, Y.: Satellite detected cyanobacteria bloom in the southwestern tropical Pacific, Implication for nitrogen fixation, Int. J. Remote Sens., 8, 389–396, 1988.
Dupouy, C., Benielli-Gary, D., Neveux, J., Dandonneau, Y., and Westberry, T. K.: An algorithm for detecting Trichodesmium surface bloom in the South Western Tropical Pacific, Biogeosciences, 8, 3631–3647, https://doi.org/10.5194/bg-8-3631-2011, 2011.
Dupouy, C., Frouin, R., Tedetti, M., Maillard, M., Rodier, M., Lombard, F., Guidi, L., Picheral, M., Duhamel, S., Charrière, B., and Sempéré, R.: diazotrophic Trichodesmium influences ocean color and pigment composition in the South West tropical Pacific, Biogeosciences Discuss., doi.org/10.5194/bg-2017-570, in review, 2018.
Eichner, M. J., Klawonn, I., Wilson, S. T., Littmann, S., Whitehouse, M. J., Church, M. J., Kuypers, M. M., Karl, D. M., and Ploug, H.: Chemical microenvironments and single-cell carbon and nitrogen uptake in field-collected colonies of Trichodesmium under different pCO2, ISME J., 11, 1305–1317 2017.
Fonseca-Batista, D., Dehairs, F., Riou, V., Fripiat, F., Elskens, M., Deman, F., Brion, N., Quéroué, F., Bode, B., and Auel, H.: Nitrogen fixation in the eastern Atlantic reaches similar levels in the Southern and Northern Hemisphere, J. Geophys. Res.-Ocean., 122, 587–601, 2016.
Foster, R. A., Kuypers, M. M., Vagner, T., Pearl, R. W., Musat, N., and Zehr, J. P.: Nitrogen fixation and transfer in open ocean diatom–cyanobacterial symbioses, ISME J., 5, 184–1493, 2011.
Fouilland, E. and Mostajir, B.: Revisited phytoplanktonic carbon dependencyof heterotrophic bacteria infreshwaters, transitional, coastal and oceanic waters, FEMS Microbiol. Ecol., 73, 419–429, 2010.
Ganachaud, A., Cravatte, S., Sprintall, J., Germineaud, C., Marion Alberty, M., Jeandel, C., Eldin, G., Metzl, N., Bonnet, S., Benavides, M., Heimburger, L.-E., Lefèvre, J., Michael, S., Resing, J., Quéroué, F., Sarthou, G., Rodier, Berthelot, H., Baurand, F., Grelet, J., Hasegawa, T., Kessler, W., Kilepak, M., Lacan, F., Privat, E., Send, U., Van Beek, P., Souhaut, S., and Sonke, J. E.: The Solomon Sea: its circulation, chemistry, geochemistry and biology explored during two oceanographic cruises, Elem. Sci. Anth., 5, 33, https://doi.org/10.1525/elementa.221, 2017.
Garcia, N., Raimbault, P., and Sandroni, V.: Seasonal nitrogen fixation and primary production in the Southwest Pacific: nanoplankton diazotrophy and transfer of nitrogen to picoplankton organisms, Mar. Ecol. Prog. Ser., 343, 25–33, 2007.
Gasol, J. M., Pinhassi, J., Alonso-Sáez, L., Ducklow, H., Herndl, G. J., Koblízek, M., Labrenz, M., Luo, Y., Morán, X. A., Reinthaler, T., and Simon, M.: Towards a better understanding of microbial carbon flux in the sea, Aquat. Microb. Ecol., 53, 21–38, 2008.
Gimenez, A., Baklouti, M., Bonnet, S., and Moutin, T.: Biogeochemical fluxes and fate of diazotroph-derived nitrogen in the food web after a phosphate enrichment: modeling of the VAHINE mesocosms experiment, Biogeosciences, 13, 5103–5120, https://doi.org/10.5194/bg-13-5103-2016, 2016.
Gradoville, M. R., Bombar, D., Crump, B. C., Letelier, R. M., Zehr, J. P., and White, A. E.: Diversity and activity of nitrogen-fixing communities across ocean basins, Limnol. Oceanogr., 62, 1895–1909, 2017.
Gruber, N.: Elusive marine nitrogen fixation, PNAS, 113, 4246–4248, 2016.
Halm, H., Lam, P., Ferdelman, T. G., Lavik, G., Dittmar, T., LaRoche, J., D'Hondt, S., and Kuypers, M. M.: Heterotrophic organisms dominate nitrogen fixation in the South Pacific Gyre, ISME J., 6, 1238–1249, 2012.
Hoppe, H. G., Gocke, K., Koppe, R., and Begler, C.: Bacterial growth and primary production along a north-south transect of the Atlantic Ocean, Nature, 416, 168–171, 2002.
Jiao, N., Herndl, G. J., Hansell, D. A., Benner, R., Kattner, G. K., Wilhelm, S. W., Kirchman, D. L., Weinbauer, M. G., Luo, T., Chen, F., and Azam, F.: Microbial production of recalcitrant dissolved organic matter: long-term carbon storage in the global ocean, Nat. Rev. Microbiol., 8, 593–599, 2010.
Kirchman, D. L.: Leucine incorporation as a measure of biomass production by heterotrophic bacteria, in: Handbook of methods in aquatic microbial ecology, edited by: Kemp, P. F., Sherr, B. F., Sherr, E. B., and Cole, J. J., Boca Raton, Lewis, 509–512, 1993.
Keil, R. G. and Kirchman, D. L.: Abiotic transformation of labile protein to refractory protein in sea water, Mar. Chem., 45, 187–196, 1994.
Le Bouteiller, A., Blanchot, J., and Rodier, M.: Size distribution patterns of phytoplankton in the western tropical Pacific: towards a generalization for the tropical ocean, Deep-Sea Res. 39, 803–823, 1992.
Lemée, R., Rochelle-Newall, E., Van Wambeke, F., Pizay, M.-D., Rinaldi, P., and Gattuso, J.-P.: Seasonal variation of bacterial production, respiration and growth efficiency in the open NW Mediterranean Sea, Aquat. Microb. Ecol., 29, 227–237, 2002.
Letscher, R. T. and Moore, J. K.: Modest net autotrophy in the oligotrophic ocean, Global Biogeochem. Cy., 31, 699–708, 2017.
Letscher, R. T., Knapp, A. N., James, A. K., Carlson, C. A., Santoro, A. E., and Hansell, D. A.: Microbial community composition and nitrogen availability influence DOC remineralization in the South Pacific Gyre, Mar. Chem., 177, 325–334, 2015.
Luo, Y.-W., Lima, I. D., Karl, D. M., Deutsch, C. A., and Doney, S. C.: Data-based assessment of environmental controls on global marine nitrogen fixation, Biogeosciences, 11, 691–708, https://doi.org/10.5194/bg-11-691-2014, 2014.
Martínez-Pérez, C., Mohr, W., Löscher, C. R., Dekaezemacker, J., Littmann, S., Yilmaz, P., Lehnen, N., Fuchs, B. M., Lavik, G., Schmitz, R. A., LaRoche, J., and Kuypers, M. M.: The small unicellular diazotrophic symbiont, UCYN-A, is a key player in the marine nitrogen cycle, Nat. Microbiol., 1, 16163, https://doi.org/10.1038/nmicrobiol.2016.163., 2016.
Martino, M., Hamilton, D., Baker, A. R., Jickells, T. D., Bromley, T., Nojiri, Y., Quack, B., and Boyd, P. W.: Western Pacific atmospheric nutrient deposition fluxes, their impact on surface ocean productivity, Global Biogeochem. Cy., 28, 712–728, 2014.
Menkes, C. E., Allain, V., Rodier, M., Gallois, F., Lebourges-Dhaussy, A., Hunt, B. P. V., Smeti, H., Pagano, M., Josse, E., Daroux, A., Lehodey, P., Senina, I., Kestenare, E., Lorrain, A., and Nicol, S.: Seasonal oceanography from physics to micronekton in the south-west Pacific, Deep-Sea Res. Pt. II, 113, 125–144, 2015.
Messer, L. F., Brown, M. V., Furnas, M. J., Carney, R. L., McKinnon, A. D., and Seymour, J. R.: Diversity and Activity of Diazotrophs in Great Barrier Reef Surface Waters, Front. Microbiol., 8, 967, https://doi.org/10.3389/fmicb.2017.00967, 2017.
Moisander, P. H., Serros, T., Paerl, R. W., Beinart, R. A., and Zehr, J. P.: Gammaproteobacterial diazotrophs and nifH gene expression in surface waters of the South Pacific Ocean, ISME J., 8, 1962–1973, https://doi.org/10.1038/ismej.2014.49, 2014.
Moutin, T., Raimbault, P., and Poggiale, J. C.: Production primaire dans les eaux de surface de la Méditerranée occidentale: Calcul de la production journalière, C. R. Acad. Sci. Paris, 322, 651–659, 1999.
Moutin, T., Van Den Broeck, N., Beker, B., Dupouy, C., Rimmelin, P., and Le Bouteiller, A.: Phosphate availability controls Trichodesmium spp. biomass in the SW Pacific ocean, Mar. Ecol. Prog. Ser., 297, 15–21, 2005.
Moutin, T., Karl, D. M., Duhamel, S., Rimmelin, P., Raimbault, P., Van Mooy, B. A. S., and Claustre, H.: Phosphate availability and the ultimate control of new nitrogen input by nitrogen fixation in the tropical Pacific Ocean, Biogeosciences, 5, 95–109, https://doi.org/10.5194/bg-5-95-2008, 2008.
Moutin, T., Doglioli, A. M., de Verneil, A., and Bonnet, S.: Preface: The Oligotrophy to the UlTra-oligotrophy PACific Experiment (OUTPACE cruise, 18 February to 3 April 2015), Biogeosciences, 14, 3207–3220, doi.org/10.5194/bg-14-3207-2017, 2017.
Moutin, T., Wagener, T., Caffin, M., Fumenia, A., Gimenez, A., Baklouti, M., Bouruet-Aubertot, P., Pujo-Pay, M., Leblanc, K., Lefevre, D., Helias Nunige, S., Leblond, N., Grosso, O., and de Verneil, A.: Nutrient availability and the ultimate control of the biological carbon pump in the Western Tropical South Pacific Ocean, Biogeosciences Discuss., https://doi.org/10.5194/bg-2017-565, in press, 2018.
Neveux, J., Lefebvre, J. P., Le Gendre, R., Dupouy, C., Gallois, F., Courties, C., Gérard, P., Fernandez, J. M., and Ouillon, S.: Phytoplankton dynamics in the southern New Caledonian lagoon during a southeast trade winds event, J. Mar. Syst., 82, 230–244, 2010.
Pringault, O., Tassas, V., and Rochelle-Newall, E.: Consequences of respiration in the light on the determination of production in pelagic systems, Biogeosciences, 4, 105–114, https://doi.org/10.5194/bg-4-105-2007, 2007.
Rahav, E., Bar-Zeev, E., Ohayon, S., Elifantz, H., Belkin, N., Herut, B., Mulholland, M. R., and Ilana Berman-Frank, I.: Dinitrogen fixation in aphotic oxygenated marine environments, Front. Microbiol., 4, 227, https://doi.org/10.3389/fmicb.2013.00227, 2013.
Raimbault, P. and Garcia, N.: Evidence for efficient regenerated production and dinitrogen fixation in nitrogen-deficient waters of the South Pacific Ocean: impact on new and export production estimates, Biogeosciences, 5, 323–338, https://doi.org/10.5194/bg-5-323-2008, 2008.
Raimbault, P., Garcia, N., and Cerutti, F.: Distribution of inorganic and organic nutrients in the South Pacific Ocean – evidence for long-term accumulation of organic matter in nitrogen-depleted waters, Biogeosciences, 5, 281–298, https://doi.org/10.5194/bg-5-281-2008, 2008.
Rii, Y. M., Duhamel, S., Bidigare, R. R., Karl, D. M., Repeta, D. J., and Church, M. J.: Diversity and productivity of photosynthetic picoeukaryotes in biogeochemically distinct regions of the South East Pacific Ocean, Limnol. Oceanogr., 61, 806–824, 2016.
Rivkin, R. B. and Legendre, L.: Biogenic carbon cycling in the upper ocean: effects of microbial respiration, Science, 291, 2398–2400, 2001.
Rousselet, L., de Verneil, A., Doglioli, A. M., Petrenko, A. A., Duhamel, S., Maes, C., and Blanke, B.: Large to submesoscale surface circulation and its implications on biogeochemical/biological horizontal distributions during the OUTPACE cruise (SouthWest Pacific), Biogeosciences, 15, 2411–2431, https://doi.org/10.5194/bg-15-2411-2018, 2018
Ruiz-González, C., Simó, R., Sommaruga, R., and Gasol, J. M.: Away from darkness: a review on the effects of solar radiation on heterotrophic bacterioplankton activity, Front. Microbiol., 4, 13, https://doi.org/10.3389/fmicb.2013.00131, 2013.
Serret, P., Robinson, C., Aranguren-Gassis, M., García-Martín, E. E. N. G., Kitidis, V., Lozano, J., Stephens, J., Harris, C., and Thomas, R.: Both respiration and photosynthesis determine the scaling of plankton metabolism in the oligotrophic ocean, Nat. Commun., 6, 6961, https://doi.org/10.1038/ncomms7961, 2015.
Shiozaki, T., Kodama, T., and Furuya, K.: Large-scale impact of the island mass effect through nitrogen fixation in the western South Pacific Ocean, Geophys. Res. Lett., 41, 2907–2913, 2014.
Smith, D. C. and Azam, F.: A simple, economical method for measuring bacterial protein synthesis rates in sea water using 3H-Leucine, Mar. Microb. Food Webs, 6, 107–114, 1992.
Stenegren, M., Caputo, A., Berg, C., Bonnet, S., and Foster, R. A.: Distribution and drivers of symbiotic and free-living diazotrophic cyanobacteria in the western tropical South Pacific, Biogeosciences, 15, 1559–1578, doi.org/10.5194/bg-15-1559-2018, 2018.
Tenório, M. M., Dupouy, C., Rodier, M., and Neveux, J.: Trichodesmium and other planktonic cyanobacteria in New Caledonian waters (South West Tropical Pacific) during an El Niño Episode, Aquatic Microbial Ecology, in press, https://doi.org/10.3354/ame01873, 2018
Tranvik, L. and Kokalj, S.: Biodegradability of algal DOC due to interactive effects of UV radiation and humic matter, Aquat. Microb. Ecol., 14, 301–307, 1998.
Turk-Kubo, K. A., Karamchandani, M., Capone, D. G., and Zehr, J. P.: The paradox of marine heterotrophic nitrogen fixation: abundances of heterotrophic diazotrophs do not account for nitrogen fixation rates in the Eastern Tropical South Pacific, Environ. Microbiol., 16, 3095–3114, 2014.
Van Den Broeck, N., Moutin, T., Rodier, M., and Le Bouteiller, A.: Seasonal variations of phosphate availability in the SW Pacific ocean near New Caledonia, Mar. Ecol. Prog. Ser., 268, 1–12, 2004.
Van Wambeke, F., Bonnet, S., Moutin, T., Raimbault, P., Alarcón, G., and Guieu, C.: Factors limiting heterotrophic bacterial production in the southern Pacific Ocean, Biogeosciences, 5, 833–845, https://doi.org/10.5194/bg-5-833-2008, 2008a.
Van Wambeke, F., Obernosterer, I., Moutin, T., Duhamel, S., Ulloa, O., and Claustre, H.: Heterotrophic bacterial production in the eastern South Pacific: longitudinal trends and coupling with primary production, Biogeosciences, 5, 157–169, https://doi.org/10.5194/bg-5-157-2008, 2008b.
Williams, P. J. L. B. and Jenkinson, N. W.: A transportable microprocessor-controlled precise Winkler titration suitable for field station and shipboard use, Limnol. Oceanogr., 27, 576–584, 1982.
Williams, P. J. L. B., Quay, P. D., Westberry, T. K., and Behrenfeld, M. J.: The Oligotrophic Ocean Is Autotrophic, Annu. Rev. Mar. Sci., 5, 535–549, 2013.
Wilson, S. T., Aylward, F. O., Ribalet, F., Barone, B., Casey, J. R., Connell, P. E., Eppley, J. M., Ferrón, S., Fitzsimmons, J. N., Hayes, C. T., Romano, A. E., Turk-Kubo, K. A., Vislova, A., Armbrust, E. V., Caron, D. A., Church, M. J., Zehr, J. P., Karl, D. M., and DeLong, E. F.: Coordinated regulation of growth, activity and transcription in natural populations of the unicellular nitrogen-fixing cyanobacterium Crocosphaera, Nat. Microbiol., 2, 17118, https://doi.org/10.1038/nmicrobiol.2017.118, 2017.
Yang, B., Emerson, S. R., and Bushinsky, S. M.: Annual net community production in the subtropical Pacific Ocean from in situ oxygen measurements on profiling floats, Global Biogeochem. Cy., https://doi.org/10.1002/2016GB005545, 2017.
Yang, B., Emerson, S. R., and Bushinsky, S. M.: Annual net community production in the subtropical Pacific Ocean from in situ oxygen measurements on profiling floats, Global Biogeochem. Cy., https://doi.org/10.1002/2016GB005545, 2017.
Young, J. W., Hobday, A. J., Campbell, R. A., Kloser, R. J., Bonham, P. I., Clementson, L. A., and Lansdell, M. J.: The biological oceanography of the East Australian Current and surrounding waters in relation to tuna and billfish catches off eastern Australia, Deep-Sea Res. Pt. II, 58, 720–733, 2011.