the Creative Commons Attribution 4.0 License.
the Creative Commons Attribution 4.0 License.
 | 16 May 2018
Short-term fate of intertidal microphytobenthos carbon under enhanced nutrient availability: a 13C pulse-chase experiment
Joanne M. Oakes
Bradley D. Eyre
Shallow coastal waters in many regions are subject to nutrient enrichment. Microphytobenthos (MPB) can account for much of the carbon (C) fixation in these environments, depending on the depth of the water column, but the effect of enhanced nutrient availability on the processing and fate of MPB-derived C (MPB-C) is relatively unknown. In this study, MPB was labeled (stable isotope enrichment) in situ using 13C-sodium bicarbonate. The processing and fate of the newly fixed MPB-C was then traced using ex situ incubations over 3.5 days under different concentrations of nutrients (NH and PO: ambient, 2× ambient, 5× ambient, and 10× ambient). After 3.5 days, sediments incubated with increased nutrient concentrations (amended treatments) had increased loss of 13C from sediment organic matter (OM) as a portion of initial uptake (95 % remaining in ambient vs. 79–93 % for amended treatments) and less 13C in MPB (52 % ambient, 26–49 % amended), most likely reflecting increased turnover of MPB-derived C supporting increased production of extracellular enzymes and storage products. Loss of MPB-derived C to the water column via dissolved organic C (DOC) was minimal regardless of treatment (0.4–0.6 %). Loss due to respiration was more substantial, with effluxes of dissolved inorganic C (DIC) increasing with additional nutrient availability (4 % ambient, 6.6–19.8 % amended). These shifts resulted in a decreased turnover time for algal C (419 days ambient, 134–199 days amended). This suggests that nutrient enrichment of estuaries may ultimately lead to decreased retention of carbon within MPB-dominated sediments.
- Article
(883 KB) - Full-text XML
-
Supplement
(363 KB) - BibTeX
- EndNote


Intertidal sediments are important sites for the processing of carbon (C) within estuaries, producing, remineralizing, and transforming considerable amounts of organic material prior to its export to the coastal shelf (Bauer et al., 2013). Algal production is a key source of C within the coastal zone and is primarily derived from microphytobenthos (MPB) in shallow photic sediments (Hardison et al., 2013; Middelburg et al., 2000). In addition to algal cells being a labile carbon source, MPB exudes large amounts of carbohydrates as extracellular polymeric substances (EPSs) (Goto et al., 1999) that allow for vertical migration and enhance sediment stability (Stal, 2010). A better understanding of the carbon pathways utilized during processing of algal cells and exudates within sediments is important for determining the quality and quantity of carbon exported from estuarine waters to continental shelves.
Application of rare isotope tracers can render fractionation effects and variability that affect natural abundance stable isotope techniques negligible and has been useful for elucidating pathways for the processing and loss of MPB-derived C (MPB-C) within estuarine sediments. Loss pathways for MPB-derived C include resuspension (Oakes and Eyre, 2014), fluxes of dissolved inorganic C (DIC) due to mineralization and respiration (Evrard et al., 2012; Oakes et al., 2012), fluxes of dissolved organic C (DOC) comprised of microbial exudates and products from cell lysis (Oakes et al., 2010a), and direct production of CO2 (Oakes and Eyre, 2014). Stable isotope tracer studies have also enabled quantification of the trophic transfer of MPB-C (Middelburg et al., 2000; Miyatake et al., 2014; Nordström et al., 2014; Oakes et al., 2010a) and flux of newly produced C from sediments (Andersson et al., 2008; Oakes et al., 2012; Van Nugteren et al., 2009).
When 13C is combined with analysis of phospholipid-linked fatty acids (PLFAs), it becomes possible to trace C transfer into individual microbial groups that account for the living biomass within sediment organic C (OC) (Drenovsky et al., 2004; Hardison et al., 2011; Oakes et al., 2012; Oakes and Eyre, 2014; Spivak, 2015). This allows for the quantification of microbial transfers of newly produced algal C between MPB and bacteria and the relative contributions of MPB and bacteria to microbial biomass in sediment OC. This technique has shown that EPS produced by MPB is readily utilized as a C source for heterotrophic bacteria (Oakes et al., 2010a; van Oevelen et al., 2006; Hardison et al., 2011). Pathways for processing of MPB-derived C have been reasonably well described, but the response of these pathways to local environmental changes remains a significant knowledge gap.
A major source of environmental change in coastal systems is nutrient over-enrichment (Cloern et al., 2001), which may affect the assimilation and flux pathways of MPB-derived carbon through (1) increased microbial biomass or an increase in production of extracellular enzymes resulting from relaxation of nutrient limitation, (2) increased algal production that drives elevated heterotrophic processes as bacteria utilize newly produced C, and (3) increased loss of C as DIC via respiratory pathways as heterotrophic processes dominate. MPB are able to use both porewater and water column nutrients, and, although MPB biomass can increase with elevated nutrient availability (Armitage and Fong, 2004; Cook et al., 2007), this is not always the case, with multiple studies finding no corresponding increase in MPB biomass (Alsterberg et al., 2012; Pascal et al., 2013; Piehler et al., 2010; Spivak and Ossolinski, 2016). Processing and mineralization of C are significantly affected by changes in the relationship between MPB and bacteria (Evrard et al., 2012). Both EPS production and bacterial utilization of newly produced EPS may decrease with increasing nutrient availability (Cook et al., 2007). Increased autochthonous production driven by nutrient enrichment can lead to increased heterotrophy, as newly produced organic matter (OM) is mineralized (Fry et al., 2015), resulting in increased DIC production. Increased remineralization of newly produced MPB-C will result in greater loss of DIC from intertidal sediment via bacterial respiration (Hardison et al., 2011).
In this 13C pulse-chase study we aimed to quantify the short-term effects of increased nutrient concentrations on the processing pathways for MPB-derived C within subtropical intertidal sediments. The in situ MPB community was used to provide a pulse of labeled MPB-C of similar quantity and quality to normal production. Even application of separate label applications for each plot prior to incubation served to isolate the subsequent effect of increased nutrient availability on the processing of MPB-derived C. Pathways considered included transfer through sediment compartments (MPB, bacteria, uncharacterized and sediment OC) and loss via fluxes of DOC and DIC. We expected increased nutrient availability to stimulate production of MPB-C after initial labeling, resulting in decreased turnover times for MPB-C as well as a shift towards dominance of heterotrophic processes as bacteria utilized this additional labile C. We further hypothesized that enhanced heterotrophy would increase loss of newly fixed algal-derived C via respiration as DI13C. Incorporation of 13C into biomarkers should reflect the shift towards heterotrophy, with quicker shifts towards increased bacterial utilization of newly produced algal C corresponding with increased nutrient load. Both DIC and DOC should be significant loss pathways for newly produced algal C as labile OM is readily processed by heterotrophs.
2.1 Study site
The study site was a subtropical intertidal shoal ∼ 2 km upstream of the mouth of the Richmond River estuary in New South Wales, Australia (28∘52′30 S, 153∘33′26 E). The 6900 km2 catchment has an annual rainfall of 1300 mm (McKee et al., 2000) and an average flow rate of 2200 ML day−1 (daily gauged flow adjusted for catchment area, averaged over years for which data was available; 1970–2013). Although the Richmond River estuary has highly variable flushing, salinity, and nutrient concentrations associated with frequent episodic rainfall events and flooding (Eyre, 1997; Mckee et al., 2000), this study was undertaken during a dry period. The site experiences semidiurnal tides with a range of ∼ 2 m. Samples were collected in the austral summer of January 2015 with an average site water temperature of 25.6±2.3 ∘C. Sediment at depths of 0–2, 2–5, and 5–10 cm was dominated by fine sand (66–73 %), and sediment across 0–10 cm had an organic C content of 17.5±0.02 mol C m−2. Sediment molar C : N was lowest at 2–5 cm but comparable across all other depths (top scrape, TS, 14.4±1.6, 0.13±0.02 %OC; 0–2 cm 17.2±1.7, 0.18±0.07 %OC; 2–5 cm 10.9±0.5, 0.23±0.06 %OC; 5–10 cm 16.2±2.2, 0.14±0.03 %OC).
2.2 Overview
We labeled MPB with 13C via in situ application of 13C-labeled sodium bicarbonate to exposed intertidal sediments. Unincorporated 13C was flushed from the sediment during the next tidal inundation of the site. Sediment cores were collected and incubated in the laboratory over 3.5 days under four nutrient enrichment scenarios (ambient, minimal, moderate, and elevated) using pulsed nutrient additions. Incubation of cores ex situ allowed for explicit control of nutrient additions and examination of the short-term processing and fate (loss to overlying water) of MPB carbon. Sediments remained inundated during incubations with minimal water exchange, as might be expected during neap tide at this site. Inundation also served to minimize C loss via physical resuspension and export while we were examining sediment processing.
2.3 13C labeling
Bare sediment within a 2 m2 experimental plot was 13C labeled when sediments were first exposed during the ebbing tide in the middle of the day by using motorized sprayers to evenly apply 99 % NaH13CO3 onto individual 400 cm2 subplots, closely following the method outlined in Oakes and Eyre (2014). Label applications were prepared using NaCl-amended Milli-Q matching site salinity (34.6), and 20 mL aliquots (1.7 mmol 13C) were applied to each individual subplot, resulting in application of 42.5 mmol 13C m−2. The use of individual aliquots of label ensured even 13C application across the sediment surface. Assimilation of label by the sediment community occurred over ∼ 4 h with average light exposure of 1376 µE m−2 s−1, before tidal inundation removed the majority of unincorporated 13C. Removal was confirmed by loss of 99.0 % of the applied 13C from treatment applications within initial cores sampled in the field.
2.4 Collection of sediment cores
Prior to label application, three cores (9 cm diameter, 20 cm depth) were collected from unlabeled sediment surrounding the treatment plots and immediately extruded and sectioned (0–0.2 cm, TS; 0.2–2; 2–5; and 5–10 cm) to provide control natural abundance sediment OC δ13C values for sediment depths within the study site. Eleven hours after label application, at low tide, 35 sediment cores were similarly collected from the labeled plot using Plexiglas core liners. Immediately, three cores were extruded and sectioned as above to determine initial 13C uptake and grain size distribution for all sediment depths, as well as chlorophyll a (Chl a) concentrations in 0–1 cm sediments. All samples were placed within plastic ziplock bags, transported to the laboratory on ice, and stored frozen in the dark (−20 ∘C). Plexiglas plates were used to seal the bottom of the core liners, and cores for incubation were then transported to the laboratory within 2 h of sampling. Site water (400 L) was collected and transported to the laboratory for use in incubations.
2.5 Nutrient amendment
Pulsed applications of nutrients for each treatment amendment were used to mimic a range of nutrient concentrations without exceeding sediment capacity for uptake. The treatment tanks were set up at ambient concentration (site water, DIN of 2.5 ± 0.04 µmol N L−1, measured on incoming tide) and with N () and P (H3PO4) amendment to unfiltered site water at 2× (minimal treatment), 5× (moderate treatment), and 10× (elevated treatment) average water column concentrations near the study site (4 µmol L−1 and 5 µmol L−1 ; Eyre (1997, 2000). To allow thorough mixing, the initial pulse of nutrients was added to both incubation tanks and bags holding replacement water for sampling, 1 h prior to cores being transferred into the incubation tanks. An additional pulse of was applied to incubation tanks at 1.5 days (after sample collection) to mimic the nutrient availability that occurs with regular inundation of tidal sediments. Silica (Si) was also added to all incubation tanks at 2.5 days (after sample collection) to ensure that isolation of the benthic diatom-dominated sediment from regular water turnover did not result in secondary limitation of Si. There was no significant accumulation of within treatment tank water, as nutrients were readily processed (Fig. S1 in the Supplement). Processing of newly fixed MPB-C occurred in the 13 h prior to incubation with nutrient amendments, but was likely similar across cores as they were kept in identical conditions prior to incubation before random allocation to treatments. Although MPB-C was not freshly fixed at 13 h and likely more refractory as a result, the available C was still relatively labile and readily processed across all treatments.
2.6 Benthic flux incubations
In the laboratory, cores were fitted with magnetic stir bars positioned 10 cm above the sediment surface, filled with ∼ 2 L of site water, and randomly allocated to one of the four 85 L treatment tanks (ambient, minimal, moderate, elevated; eight cores per treatment). Water in the treatment tanks and cores was continuously recirculated, held at in situ temperature (25 ± 1 ∘C) by a chiller on each tank, and aerated. Cores were stirred via a rotating magnet at the center of each treatment tank, which interacted with the magnetic stir bars. Stirring occurred at a rate below the threshold for sediment resuspension (Ferguson et al., 2003). Three sodium halide lamps suspended above the treatment tanks provided 824 ± 40 µE m−2 s−1 to the sediment–water interface within the cores on a 12 h-light–12 h-dark cycle which approximated the average light level measured at the sediment surface during inundation (941.4 ± 139 µE m−2 s−1). Cores were allowed to acclimate in tanks for 6 h prior to the start of incubation to allow for the re-establishment of microclimates and anaerobic zonation that was potentially disturbed by coring. Cores remained open to the tank water until 30 min before sampling, when clear Plexiglas lids were fitted to each core liner to seal-in overlying water within the core for the duration of the incubation (∼ 15 h). Dissolved oxygen (±0.01 mg L−1) and pH (±0.002 pH) were measured optically and electrically (Hach HQ40d multi-parameter meter) via a sampling port in the lid. Initial samples were taken 30 min after closure of the lids, dark samples were taken after ∼ 12 h incubation with no light, and light samples were taken after 3 h of illumination following the end of the dark period. Light incubations were of shorter duration to prevent supersaturation of dissolved oxygen which would have compromised additional analyses required for a complementary study. During sampling, 50 mL of water was syringe filtered (precombusted Whatman GF/F filters) into precombusted 40 mL glass vials with Teflon-coated septa, sterilized with HgCl2 (20 µL saturated solution), and refrigerated prior to analysis for concentration and δ13C of DIC and DOC. Sample water was simultaneously replaced by water held in replacement bags as sampling occurred at each time point. No samples were collected for analysis of gaseous CO2 fluxes from exposed sediments, as this was previously determined to be a negligible pathway for loss of MPB-C at this site (Oakes and Eyre, 2014). At the end of sampling for the light period, cores were extruded, sectioned, and sampled for Chl a in the same manner as control cores and stored frozen (−20 ∘C). Eight cores (two cores per treatment) were sampled in this manner for water column fluxes, PLFAs, and sediment OC after 1.5, 2.5, and 3.5 days of incubation. These sampling time periods were chosen to capture the active dynamics of 13C processing that were expected to occur over the first few days of the study, based on previous work by Oakes and Eyre (2014). Additionally, eight cores (two cores per treatment) were sampled for only PLFAs and sediment OC at 0.5 days of incubation.
2.7 Sample analysis
Chl a was measured by colorimetry (Lorenzen, 1967) for each core (0–1 cm depth). MPB-C biomass was calculated assuming a C : Chl a ratio of 40, within the range reported for algae in Australian subtropical estuaries (30–60; Ferguson et al., 2004; Oakes et al., 2012). Biomass measurements utilizing Chl a were used to compare biomass across controls and treatments and were not utilized in calculations for uptake of 13C into MPB or bacteria using PLFAs. Bacterial C biomass for controls was estimated based on MPB-C biomass derived from Chl a and the ratio of MPB to bacterial biomass obtained from PLFA analysis of the control cores (n=3).
Sediment samples were lyophilized, loaded into silver capsules, acidified (10 % HCl), dried (60 ∘C to constant weight), and analyzed for %C and δ13C using a Thermo Flash elemental analyzer coupled to a Delta V isotope-ratio mass spectrometer (IRMS) via a Thermo ConFlo IV. Samples were run alongside glucose standards that are calibrated against international standards (NBS 19 and IAEA CH6). Precision for δ13C was 0.1 ‰ with decreasing precision for enrichments above 100 ‰.
PLFAs specific to bacteria (i+a 15 : 0) were used as biomarkers for this group. However, although visual analysis confirmed the presence of a large number of pennate diatoms at the study site and diatom-specific PLFAs (e.g., 20 : 5(n−3)) were detected, chromatographic peaks for these PLFAs were sometimes indistinct. The 16 : 1(n−7) PLFA, which represents 27.4 % of total diatom PLFAs (Volkman et al., 1989), was consistently present across all samples and was used as a biomarker for diatoms, following correction for contributions from gram-negative bacteria, cyanobacteria, and sulfate-reducing bacteria, determined using 18 : 1 n7 as described in the calculations section below and in Oakes et al. (2016). Extraction of PLFAs used 40 g of freeze-dried sediment and a modified Bligh and Dyer technique. Sediment was spiked with an internal standard (500 µL of 1 mg mL−1 tridecanoic acid, C13); immersed in 30–40 mL of a 3 : 6 : 1 mixture of dichloromethane (DCM), methanol, and Milli-Q water; sonicated (15 min); and centrifuged (15 min, 9 g). The supernatant was removed into a separating funnel and the pellet was resuspended in 30–40 mL of the DCM : MeOH : Milli-Q mixture, sonicated, and centrifuged twice more to ensure complete removal of biomarkers. DCM (30 mL) and water (30 mL) were added to the supernatant, gently mixed, and phases were allowed to separate prior to removal of the bottom layer into a round bottom flask. The top layer was then rinsed with 15 mL of DCM, gently shaken, and phases were allowed to separate prior to addition to the round bottom flask. This extract was then concentrated under vacuum and separated using silica solid-phase extraction columns (Grace; 500 mg, 6.0 mL) by elution with 5 mL each of chloroform, acetone, and methanol. The fraction containing methanol was retained, reduced to dryness under N2, methylated (3 mL 10 : 1 : 1 MeOH : HCl : CHCl3, 80 ∘C, 2 h), quenched using first 3 and then 2 mL of 4 : 1 hexane : DCM, evaporated to ∼ 200 µL under N2, transferred to a GC (gas chromatography) vial for analysis, and stored frozen (−20 ∘C). PLFA concentrations and δ13C values were measured using a non-polar 60 m HP5-MS column in a Trace GC coupled to a Delta V IRMS with a Thermo ConFlo III interface following the protocol outlined in Oakes et al. (2010a).
DIC and DOC concentrations and δ13C values were measured via continuous-flow wet oxidation isotope-ratio mass spectrometry using an Aurora 1030W total organic C analyzer coupled to a Thermo Delta V IRMS (Oakes et al., 2010b). Sodium bicarbonate (DIC) and glucose (DOC) of known isotopic composition dissolved in He-purged Milli-Q were used to correct for drift and verify both concentration and δ13C of samples. Reproducibility was ±0.2 mg L−1 and ±0.1 ‰ for DIC and ±0.2 mg L−1 and ±0.4 ‰ for DOC.
2.8 Calculations
Incorporation of 13C into sediment OC, bacteria, and MPB (mmol 13C m−2) was calculated as the product of excess 13C (fraction 13C in sample − fraction 13C in control) and the mass of OC within each pool. For sediment, OC was the product of %C and dry mass per unit area. Percentages calculated from these pools are presented as portions of the sum of total 13C contained within the sediment and the interpolated fluxes of DIC and DOC that were estimated to have occurred from 0 days until each sampling time.
Excess 13C for PLFAs was determined only for 0–2, 2–5, and 5–10 cm depths, as there was inadequate sample mass for the 0–0.2 cm top scrape. Due to limitations of time and cost, PLFA samples were taken from only one of the two cores incubated for each treatment at each sampling period. PLFA excess 13C for both bacteria and diatoms was the product of excess 13C contained in the PLFA (fraction 13C in PLFA in sample − fraction 13C in PLFA in control) and the concentrations of C within respective biomarkers. Concentrations of PLFA C were calculated from their peak areas relative to the internal C13 standard spike. Biomass of diatoms and bacteria were calculated using the method described by Oakes et al. (2016). Briefly, bacterial biomass was calculated as
where a represents the average concentration of PLFA (0.056 g C PLFA per g C biomass; Brinch-Iversen and King, 1990) in bacteria and b represents the average fraction of PLFA accounted for by i+a15 : 0 within bacteria-dominated marine sediments (0.16, Osaka Bay, Japan; Rajendran et al., 1993, 1994). Biomass estimates for bacteria calculated using the minimum and maximum fraction values (16–19 % for i+a15 : 0; Rajendran et al., 1993) resulted in a 16 % difference.
For diatoms, a mixing model was used to correct the concentration and δ13C value of 16 : 1(n−7) for any contribution from non-diatom sources. Due to the scarcity of cyanobacteria observed using light microscopy (1000×), low sediment D- / L-alanine ratios measured previously at this site (as low as 0.0062, Riekenberg et al., 2017), and lack of the characteristic 18 : 2(n−6) peak (Bellinger et al., 2009), cyanobacteria were assumed to make a negligible contribution to the 16 : 1(n−7) peak. A two-source mixing model was applied to correct the concentration and δ13C value of the 16 : 1(n−7) peak for the contribution of gram-negative bacteria, based on a typical ratio of 18 : 1(n−7) to 16 : 1(n−7) for gram-negative bacteria of 0.7 (Edlund et al., 1985) as previously applied in Oakes et al. (2016). Biomass for diatoms was calculated using the following formula:
where c is the average fraction of diatom PLFAs accounted for by corrected 16 : 1(n−7) (0.67; Volkman et al., 1989) and d is the average PLFA concentration in diatoms (0.035 g PLFA C per g of C biomass; Middelburg et al., 2000). Biomass estimates for diatoms calculated using maximum and minimum fraction values for 16 : 1(n−7) (18–33 %; Volkman et al., 1989) were within 50 % of estimates based on the average value. Microbial biomass is the sum of calculated diatom and bacterial biomass. Uncharacterized 13C was calculated as
where 13Csediment organic represents total 13C in sediment organic carbon and 13Cmicrobial biomass represents the 13C contained in microbial biomass within the same core.
Fluxes across the sediment–water interface were calculated from two measured concentrations, at the start and finish of each dark and light period (e.g., Oakes and Eyre, 2014), as a function of incubation time, core water volume, and sediment surface area. Dark flux rates were calculated using concentration data from the dark incubation period and light flux rates from the light incubation period. The following parameters were calculated from dark and light rates:
To prevent the potential development of resource limitations during incubation, O2 concentrations were not allowed to drop below 60 % saturation in the dark and light incubations were shortened (∼ 3 h) to ensure that production was not allowed to become supersaturated.
Total 13C in DIC and DOC (µmol 13C) in the overlying water in the sediment core was calculated for the initial period, the end of the dark period, and the end of the light period as the product of excess 13C (excess 13C in labeled sample versus relevant natural abundance control), core volume, and concentration. Total excess flux of 13C as DIC or DOC (µmol 13C m−2 h−1) was then calculated as
where excess 13Cstart and excess 13Cend represent excess 13C of DIC or DOC at the start and end of dark and light incubation periods, SA is sediment surface area, and t is incubation period length (h). Net fluxes of excess 13C (excess 13C m−2 h−1) for DIC and DOC were calculated as
Total 13C lost via flux to the water column from initial labeling of each sampling period was interpolated from measured net flux values by calculating the area underneath the curve for each treatment. Because all 13C was contained within the cores, values for 13C budgets add up to 100 %. Starting values were estimated by looking at how much 13C remained in the sediment and how much was lost to the water column (initial 13C=13C remaining +13C lost).
2.9 Data analysis
The 13C remaining in sediment and MPB-C biomass was determined using Chl a data for cores within all treatments for 0.5, 1.5, 2.5, and 3.5 days. We therefore used a two-way analysis of variance (ANOVA) to determine whether either 13C remaining in sediment or MPB-C biomass were affected by treatment and/or time. P / R ratios were determined for 1.5, 2.5, and 3.5 days to determine whether significant differences occurred between treatments within each time period (α=0.05). Levene's tests indicated that variances were homogeneous in all cases and there were no significant interactions between variables in either analysis. For significant effects of treatment or time, post hoc Tukey tests were used to identify significant differences between groups.
Total uptake for 13C into both MPB and bacteria and relative 13C uptake into MPB were determined for only a single core across all treatments from 0.5, 1.5, 2.5, and 3.5 days. To increase replication for statistical analysis, and therefore increase the power to detect a significant difference, we grouped data across times into two levels: before 1.5 days (including 0.5 and 1.5 days) and after 1.5 days (including 2.5 and 3.5 days). There was no pooling of data across treatments. A two-way ANOVA was then used to determine whether significant differences occurred among treatments within each pooled time period (α=0.05). No significant interactions were observed for total uptake into MPB or bacteria, but there was a significant interaction observed for relative 13C uptake into MPB. For significant effects of interaction, treatment, and time, post hoc Tukey tests were used to identify significant differences between groups.
The data for 13C remaining in sediment OC were further examined by fitting an exponential decay function for each treatment across 3.5 days using the Exp2PMod1 function in OriginPro 2017 and 13C turnover estimates were then determined by solving for y=0.05 % remaining 13C (a value close to 0) and x=30 days for each treatment. Loss rate constants are reported as positive numbers following mathematical conventions associated with loss rates (Fig. 6).
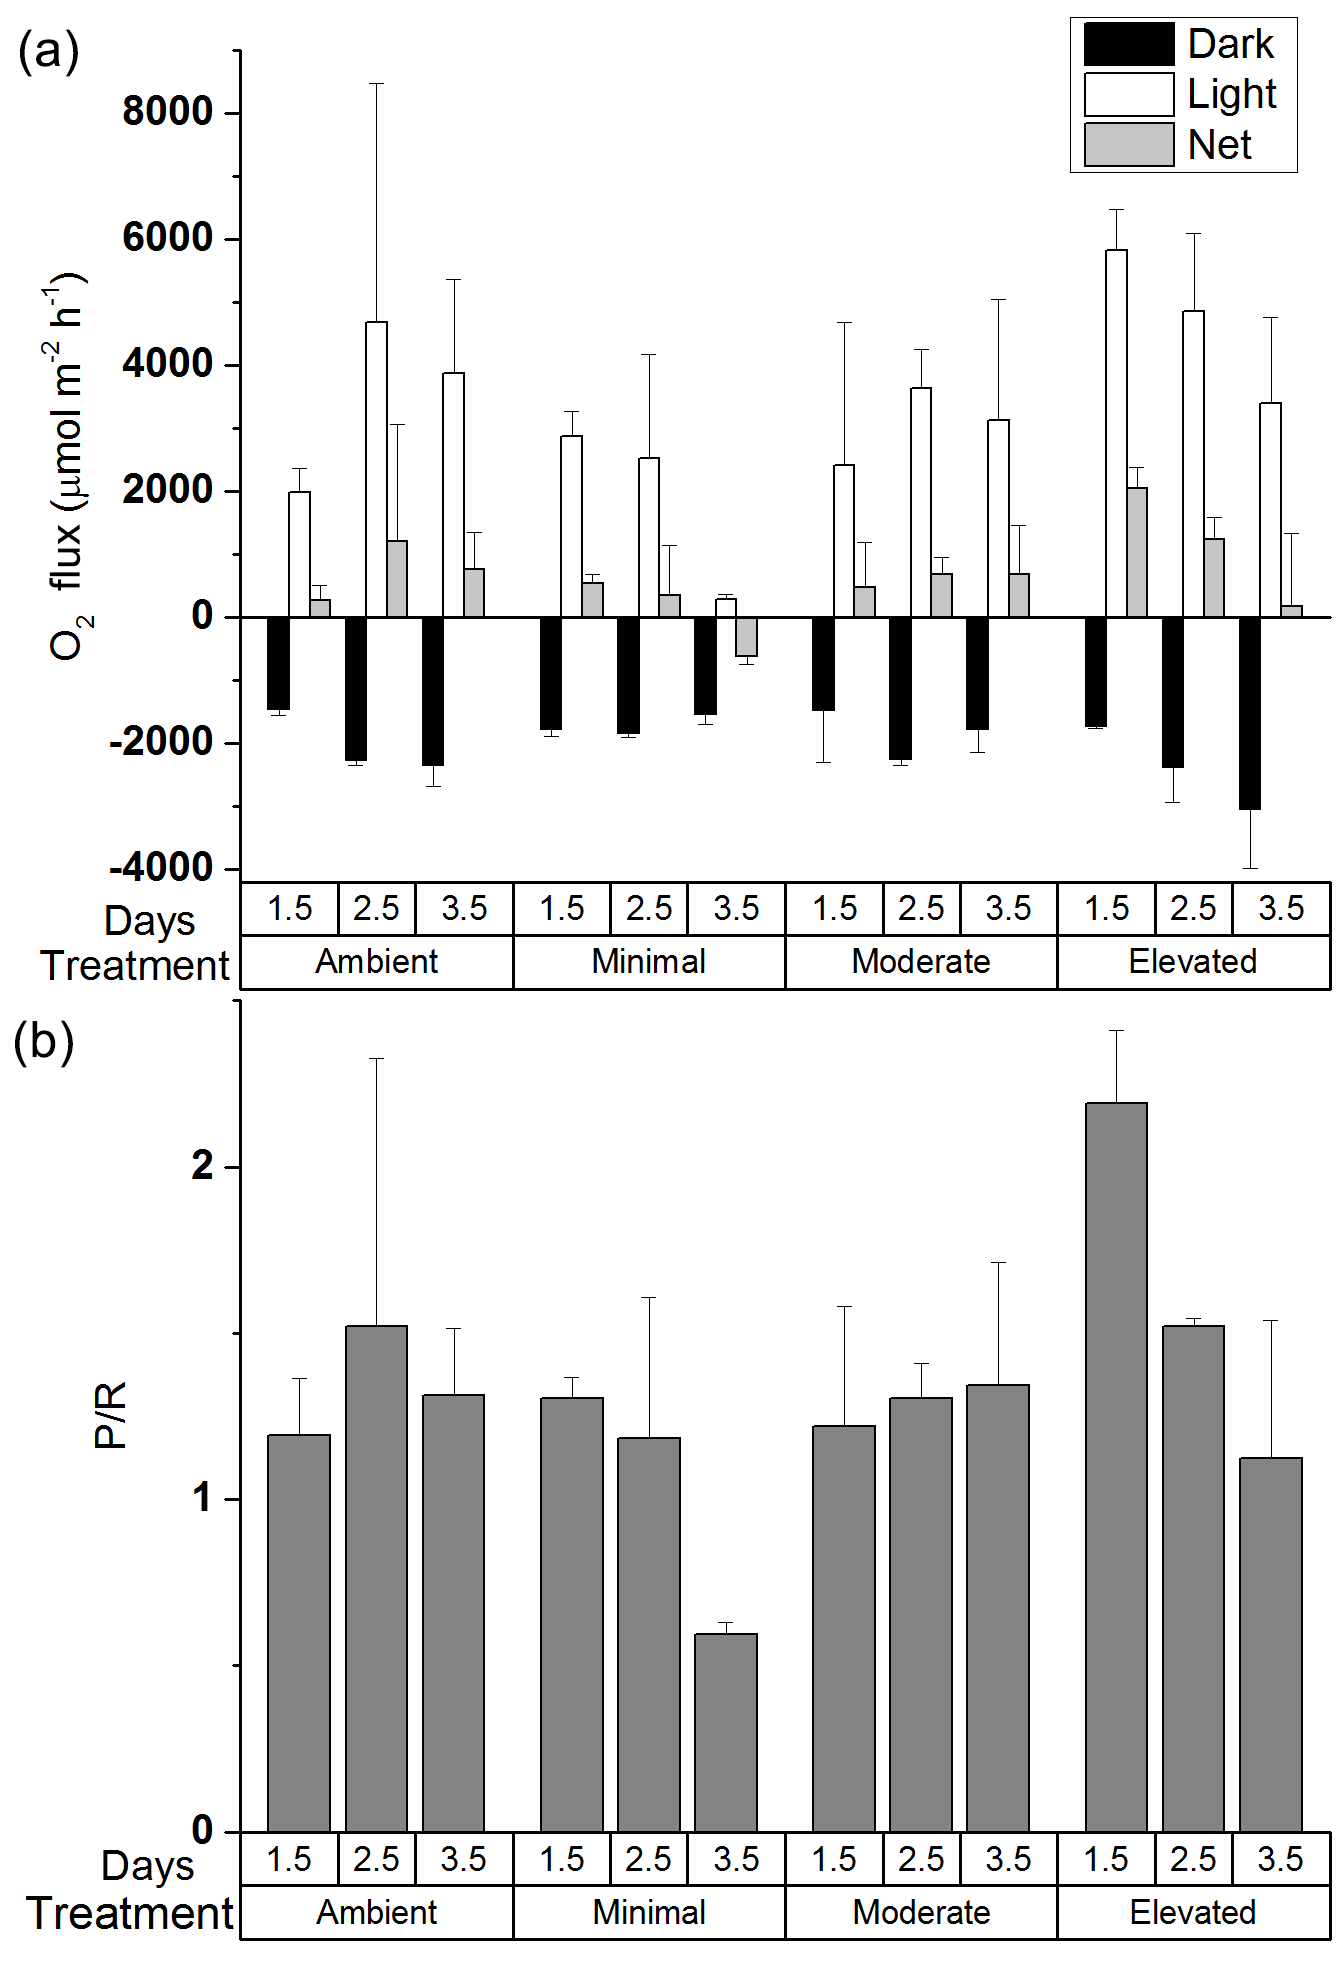
Figure 1(a)Oxygen fluxes and (b) ratio of production to respiration (P / R) for all treatments across 24 h calculated from oxygen fluxes for individual cores. Values are mean ± SE.
3.1 Uptake of nutrient additions
Uptake of the added nutrients into the sediment was rapid and substantial, as indicated by decreases in dissolved inorganic nitrogen ( + NOx) concentrations in the overlying core water to < 1.2 ± 0.1 µM L−1 by 0.5 days. Across the incubation periods, elevated DIN concentrations in overlying water were occasionally observed (Fig. S1 in the Supplement) but corresponded with times when the cores were sealed for light and dark incubations, indicating that DIN production was a result of in-core processing rather than nutrient amendments.
3.2 Sediment characteristics
Control sediment OC content was greater in the 2–5 cm depth (187.5 ± 27.7 µmol C g−1) than at all other sediment depths (112.3 ± 11.4 µmol C g−1 in the TS, 149.8 ± 31.6 µmol C g−1 at 0–2 cm, and 120.1 ± 16.5 µmol C g−1 at 5–10 cm). Natural abundance δ13C values were most enriched in surface sediments (−18.7 ‰ in TS) and became progressively depleted within deeper sediments to −22.1 ‰ at 5–10 cm (Table 1). In the 0–2 cm depth of the control sediment, MPB-C biomass was 321.9 ± 42.0 mmol C m−2 and bacterial biomass was 500.4 ± 65.3 mmol C m−2 (Table 1).
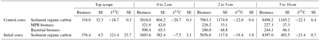
Table 1The δ13C values (‰) and carbon biomass (µmol C m−2) for control (natural abundance, n=3) and initially labeled cores (n=3, 0 days). Microphytobenthos and bacterial biomasses are only provided for control cores.
3.3 Initial 13C uptake
Uptake of 13C into sediment OC occurred rapidly and was observed in the first cores collected (11 h after labeling, after tidal flushing, and with cores sectioned in the field). At this time, prior to laboratory incubation and nutrient amendment, 1549 ± 140 µmol 13C m−2 had been incorporated into sediment OC. Sediment OC was 13C enriched across all sediment depths at this time (Table 1), but 78 % of the initially incorporated 13C was in the uppermost 2 cm of sediment (compared to 12.8 % for 2–5 cm and 9.4 % for 5–10 cm). Prior to incubation,13C uptake into microbial biomass at 0–2 cm was dominated by MPB (92.7 ± 1.6 %), despite their lower biomass (200.2 ± 26.5 mmol C m−2) compared to bacteria (311.3 ± 56.4 mmol C m−2) within the labeled cores. Conversely, bacteria dominated 13C uptake in 2–5 cm sediment (66.8 ± 17.2 % of the 13C within microbial biomass). Although sediment OC at 5–10 cm was 13C enriched, minimal uptake was detected in microbial biomarkers.
3.4 Effect of nutrient additions on P / R
Average MPB biomass remained similar across treatments over the 3.5-day incubation (two-way ANOVA: treatment , p=0.99; time , p=0.94, Fig. S3 in the Supplement). However, there were changes in P / R ratio that varied among treatments. Examination of the effects of treatment and time on P / R showed no significant differences (two-way ANOVA: treatment , p=0.08; time , p=0.11), although the post hoc Tukey comparison between ambient and elevated treatments was nearly significant (p=0.0506). For the ambient, minimal, and moderate treatments, P / R ratios were dominated by autotrophy and changed little over the first 2.5 days (1.5 ± 0.8, 1.2 ± 0.4, and 1.3 ± 0.1, respectively, Fig. 1b), as any increases in production were offset by increased respiration (Fig. 1a). By 3.5 days the minimal treatment had shifted into heterotrophy (0.6 ± 0.1) as a result of increased respiration and decreased production, whereas P / R ratios for the ambient and moderate treatments remained essentially unchanged (1.3 ± 0.2, 1.3 ± 0.4). P / R in the elevated treatment was initially high compared to all other treatments (2.2 ± 0.2 at 0.5 days), indicating strong dominance of autotrophic production (Fig. 1a and b). However, P / R in the elevated treatment decreased to 1.1 ± 0.4 after 3.5 days (Fig. 1b), indicating a strong shift away from autotrophy and towards dominance of heterotrophic processes as respiration increased and production decreased (Fig. 1a).
3.5 Incorporation of 13C into sediment organic carbon
3.5.1 Uptake of 13C into 0–2 cm sediment
At 0.5 days, the 13C incorporated into sediment OC was predominantly contained in the 0–2 cm depth across all treatments (∼ 65–90 %, Fig. 2) and was statistically similar across treatments (one-way ANOVA: , p=0.1). By 3.5 days, 13C retention was lower within sediment from nutrient-amended treatments compared to the ambient treatment, whereas the 13C contained in the 0–2 cm depth in the ambient treatment was similar across 3.5 days (78.9 ± 8.8 % 1.5 days, 77.0 ± 16.4 % 2.5 days, 81.6 ± 4.4 % 3.5 days); the 13C content decreased in the minimal, moderate, and elevated treatments to 70.3 ± 8.3, 73.6 ± 16.4, and 68.8 ± 7.6 %, respectively (Fig. 2).
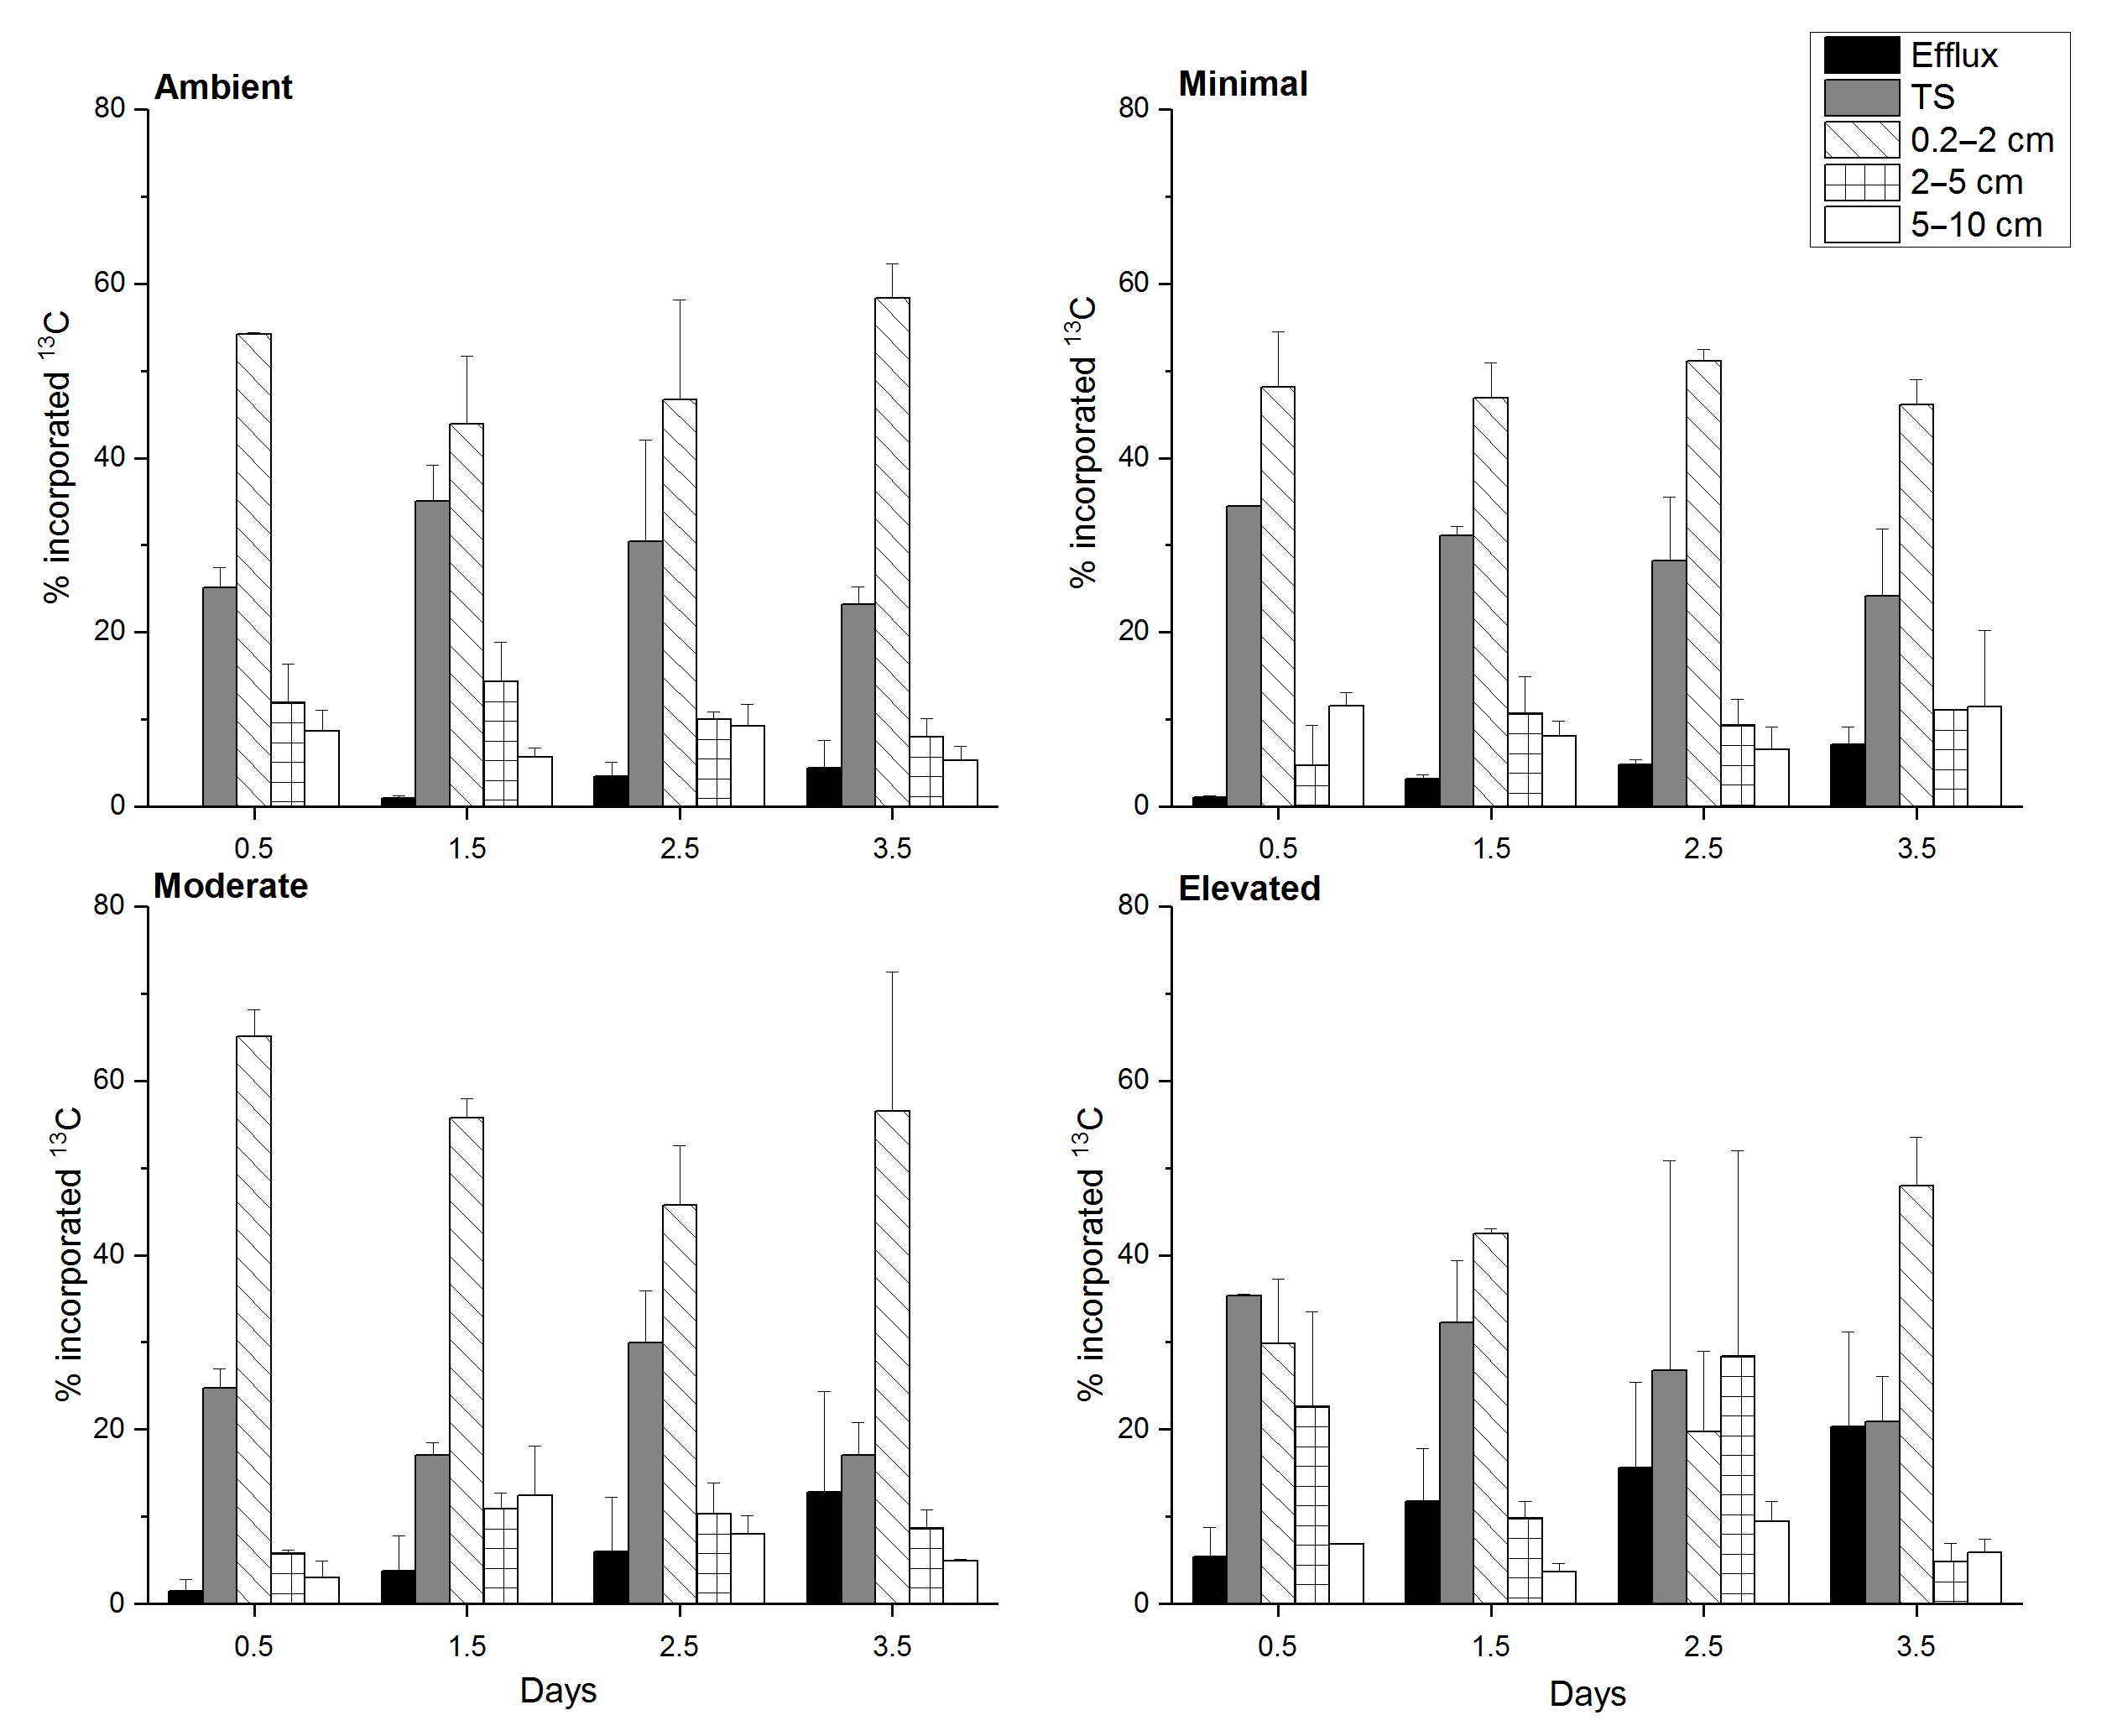
Figure 2Carbon budget for excess 13C within sediment OC at top scrape (TS), 0.2–2, 2–5, 5–10 cm, and the cumulative excess 13C exported to the water column via the combined efflux of DIC and DOC for each treatment at each sampling time. All values are as a percentage of the 13C initially incorporated into sediment OC (0–10 cm). Some error bars are too small to be seen (mean ± SE).
3.5.2 Downward transport below 2 cm
Downward transport of newly labeled material to 2–5 cm depth was low across all treatments, but was higher for the elevated treatment at both 0.5 and 2.5 days. At 0.5 days there was less downward transport in minimal and moderate treatments compared to the ambient and elevated treatments. By 2.5 days downward transport was similar for ambient, minimal, and moderate treatments (10, 9, 10 %, respectively; Fig. 2), but was considerably higher in the elevated treatment (28.4 %). By 3.5 days, 13C incorporation into 2–5 cm sediment OC was similarly low for ambient, minimal, and moderate treatments (8.0 ± 2.1, 11.1 ± 0.1, and 8.7 ± 2.1 %, respectively), but lower in the elevated treatment (4.8 ± 2.1 %). At 0.5 days, downward transport into the 5–10 cm layer was a relatively small portion of initial 13C, but was higher in ambient and minimal treatments (8.7 ± 2.4 and 11.6 ± 1.5 %) when compared to moderate and elevated treatments (2.3 ± 1.9 and 6.8 ± 0.1 %, Fig. 2). Downward transport below 5 cm was similar (5–11 %) for all treatments at 2.5 and 3.5 days.
3.6 13C distribution amongst sediment compartments
3.6.1 Microbial biomass
The total 13C content of MPB (mmol 13C m−2; Fig. 4a) decreased significantly from before 1.5 to after 1.5 days for all treatments (two-way ANOVA: , p=0.008), but there was no significant difference among treatments (two-way ANOVA: , p=0.12). The total 13C content of bacteria (mmol 13C m−2; Fig. 4a) did not change significantly with time and was not significantly affected by treatment. The majority of the 13C assimilated into the cores was present in the 0–2 cm depth (0–2 cm 82.4 ± 5.8 %; 2–5 cm 9 ± 0.8 %; and 5–10 cm 5.2 ± 0.5 %; Fig. S4a, b, and c in the Supplement). 13C incorporation was largely dominated by bacteria across all treatments in sediments below 2 cm, with few exceptions. Increased bacterial contribution occurred more quickly and was more pronounced in nutrient-amended treatments at both 2–5 and 5–10 cm (Figs. S5 and S6 in the Supplement).
Total uptake of excess 13C (Fig. 4a), while informative about the amount of label contained within each core at each time period, is not as useful for comparison between microbial groups due to variations in the total amount of 13C assimilated between cores. It is important to consider the relative contribution to 13C uptake (Fig. 4b) of both microbial groups as each data point was sampled from separate cores that assimilated similar, but different, initial concentrations of newly fixed 13C. MPB contribution (%) to uptake of 13C decreased significantly after 1.5 days (two-way ANOVA: , p < 0.0001; Fig. 4a) but showed no significant difference between treatments (, p=0.008), although there was a significant interaction between tested variables (, p=0.008). Tukey tests found that MPB contributed less to microbial uptake of 13C in the elevated treatment than in the ambient treatment (p=0.01) as well as the moderate treatment being lower than the minimal treatment (p=0.014). MPB dominated the relative incorporation of 13C into microbial biomass at 0–2 cm in all treatments initially (0.5 days; 90 % ambient, 90 % minimal, 92 % moderate, and 92 % elevated; Fig. 4b) and throughout the 3.5-day incubation (81–90 % ambient, 82–91 % minimal, 74–92 % moderate, and 65–92 % elevated; Fig. 4b). The relative bacterial contribution to microbial 13C incorporation increased across all treatments as the incubations progressed, but increases in the moderate and elevated treatments at 2.5 and 3.5 days (Fig. 4b) corresponded with decreased 13C incorporation into MPB (Fig. 4a).
3.6.2 Uncharacterized
A portion of the 13C contained within sediment OC was uncharacterized, i.e., not contained within the viable microbial biomass measured using PLFA biomarkers. Initially (0.5 days) the uncharacterized pool accounted for less sediment 13C within the nutrient-amended treatments (1–3 %) than within the ambient treatment (12 %; Fig. 3), indicating that there was more 13C contained in viable microbial biomass under increased nutrient availability after 12 h of incubation. By 3.5 days, increased contribution to the uncharacterized pool in the moderate and elevated treatments (29 % ambient, 32 % minimal, 41 % moderate, and 45 % elevated; Fig. 3) corresponded with decreased 13C contained in MPB (52 % ambient, 49 % minimal, 42 % moderate, and 26 % elevated). In contrast, changes in the 13C in the uncharacterized pool did not relate to 13C contained in bacteria, as the bacterial contribution to 13C remained relatively unchanged (17 % ambient, 14 % minimal, 15 % moderate, and 15 % elevated) and was similar among treatments at 3.5 days.
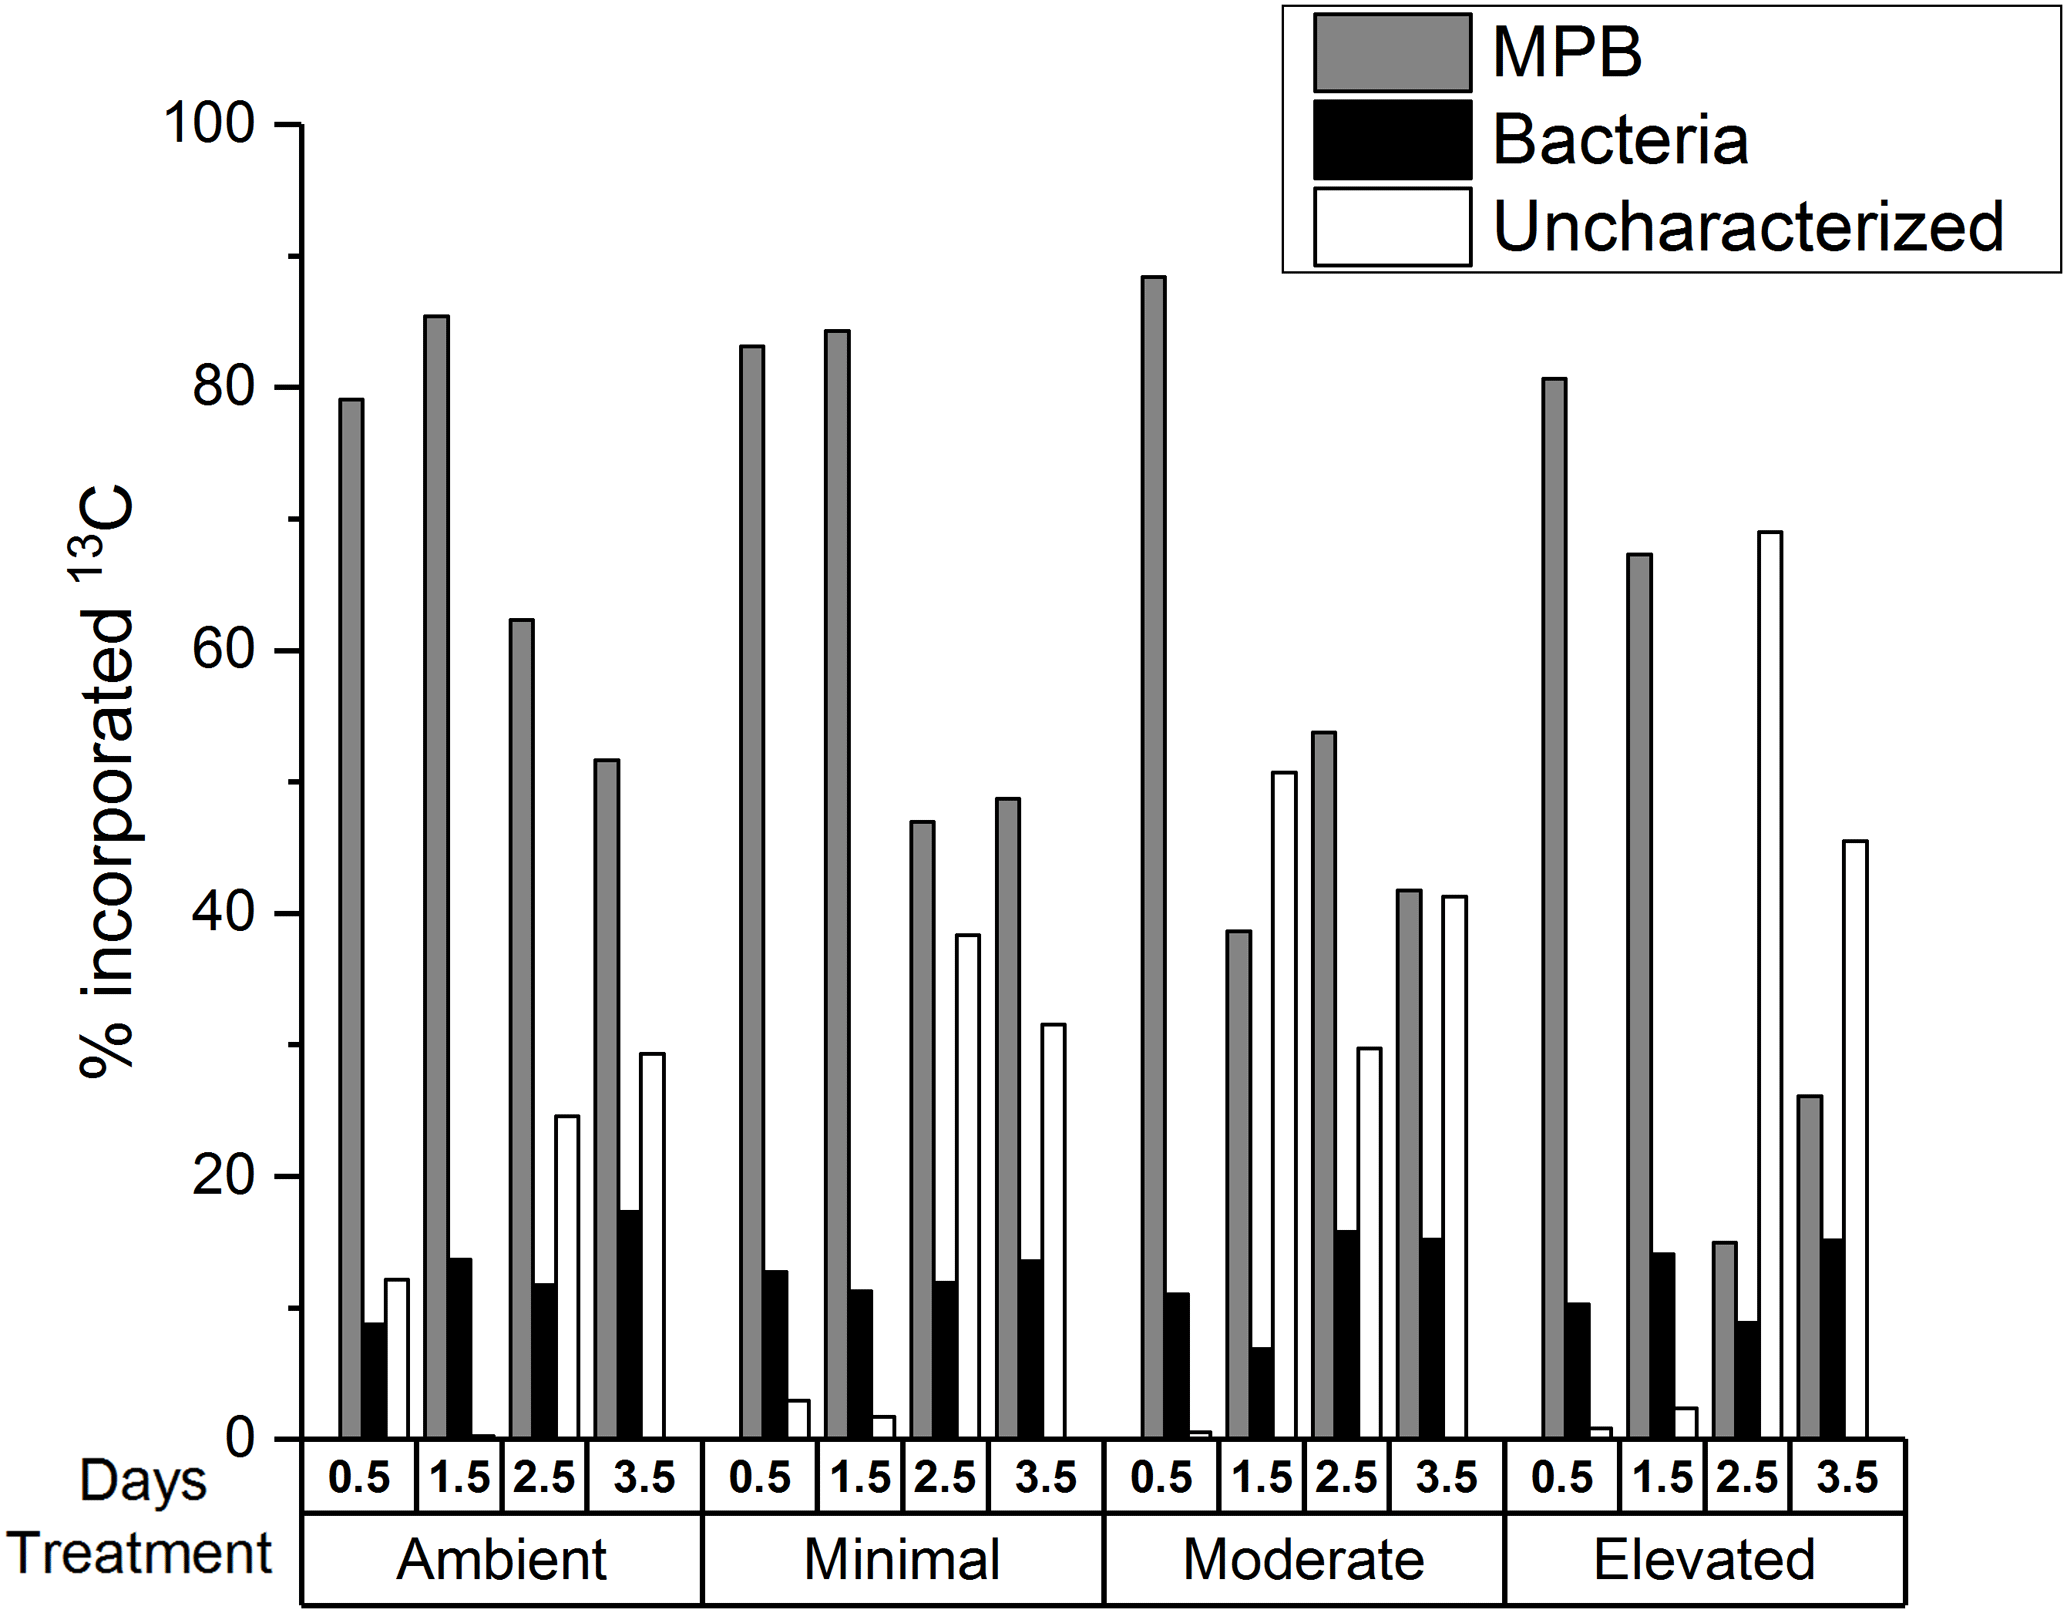
Figure 3Excess 13C incorporation into microphytobenthos, bacteria, and uncharacterized OC as a percentage of 13C contained in sediment OC in 0–10 cm. There are no error bars as PLFAs were analyzed for only one replicate sample from each time period.
3.7 Loss of 13C from sediment OC
The total 13C remaining in sediment (Fig. 6) varied significantly among treatments (two-way ANOVA: , p=0.008) and across sampling times (, p=0.03). Throughout the study, there was generally less 13C remaining within the elevated treatment than in than either the ambient (p=0.008) or minimal treatments (p=0.02), and there was significantly less 13C remaining within the sediment at 3.5 days than at 0.5 days (p=0.02). Rates of 13C loss from sediment OC to the water column were highest in the moderate and elevated treatments (total lost at 3.5 days: ambient 5 %, minimal, 7 %, moderate 11 %, and elevated 20 %; Figs. 5 and 6). Reflecting this, loss rate constants for the 13C remaining in sediment OC after accounting for losses of DI13C and DO13C across 3.5 days were equivalent for ambient and minimal treatments (0.018 ± 0.024, R2=0.95 and 0.021 ± 0.001, R2=0.99, respectively; Fig. 6), but were higher for both moderate and elevated treatments (0.0383 ± 0.009, R2=0.86, 0.0566 ± 0.003, R2=0.99, respectively; Fig. 6). Since the intercept is known, i.e., the initial value equals 100 % at time 0, linear models where only the slopes were estimable were fitted to further analyze the differences between slopes. Assuming an exponential decay, the percentage remaining 13C (Y) was log10 transformed and the value 2 was subsequently subtracted (Z=log10(Y) −2), which implies that the intercept of Z versus time equals 0. The model with different slopes for each treatment fit significantly better than the model with a single slope (F test, , P < 0.001, Fig. S2 in the Supplement). The analysis was performed in R.
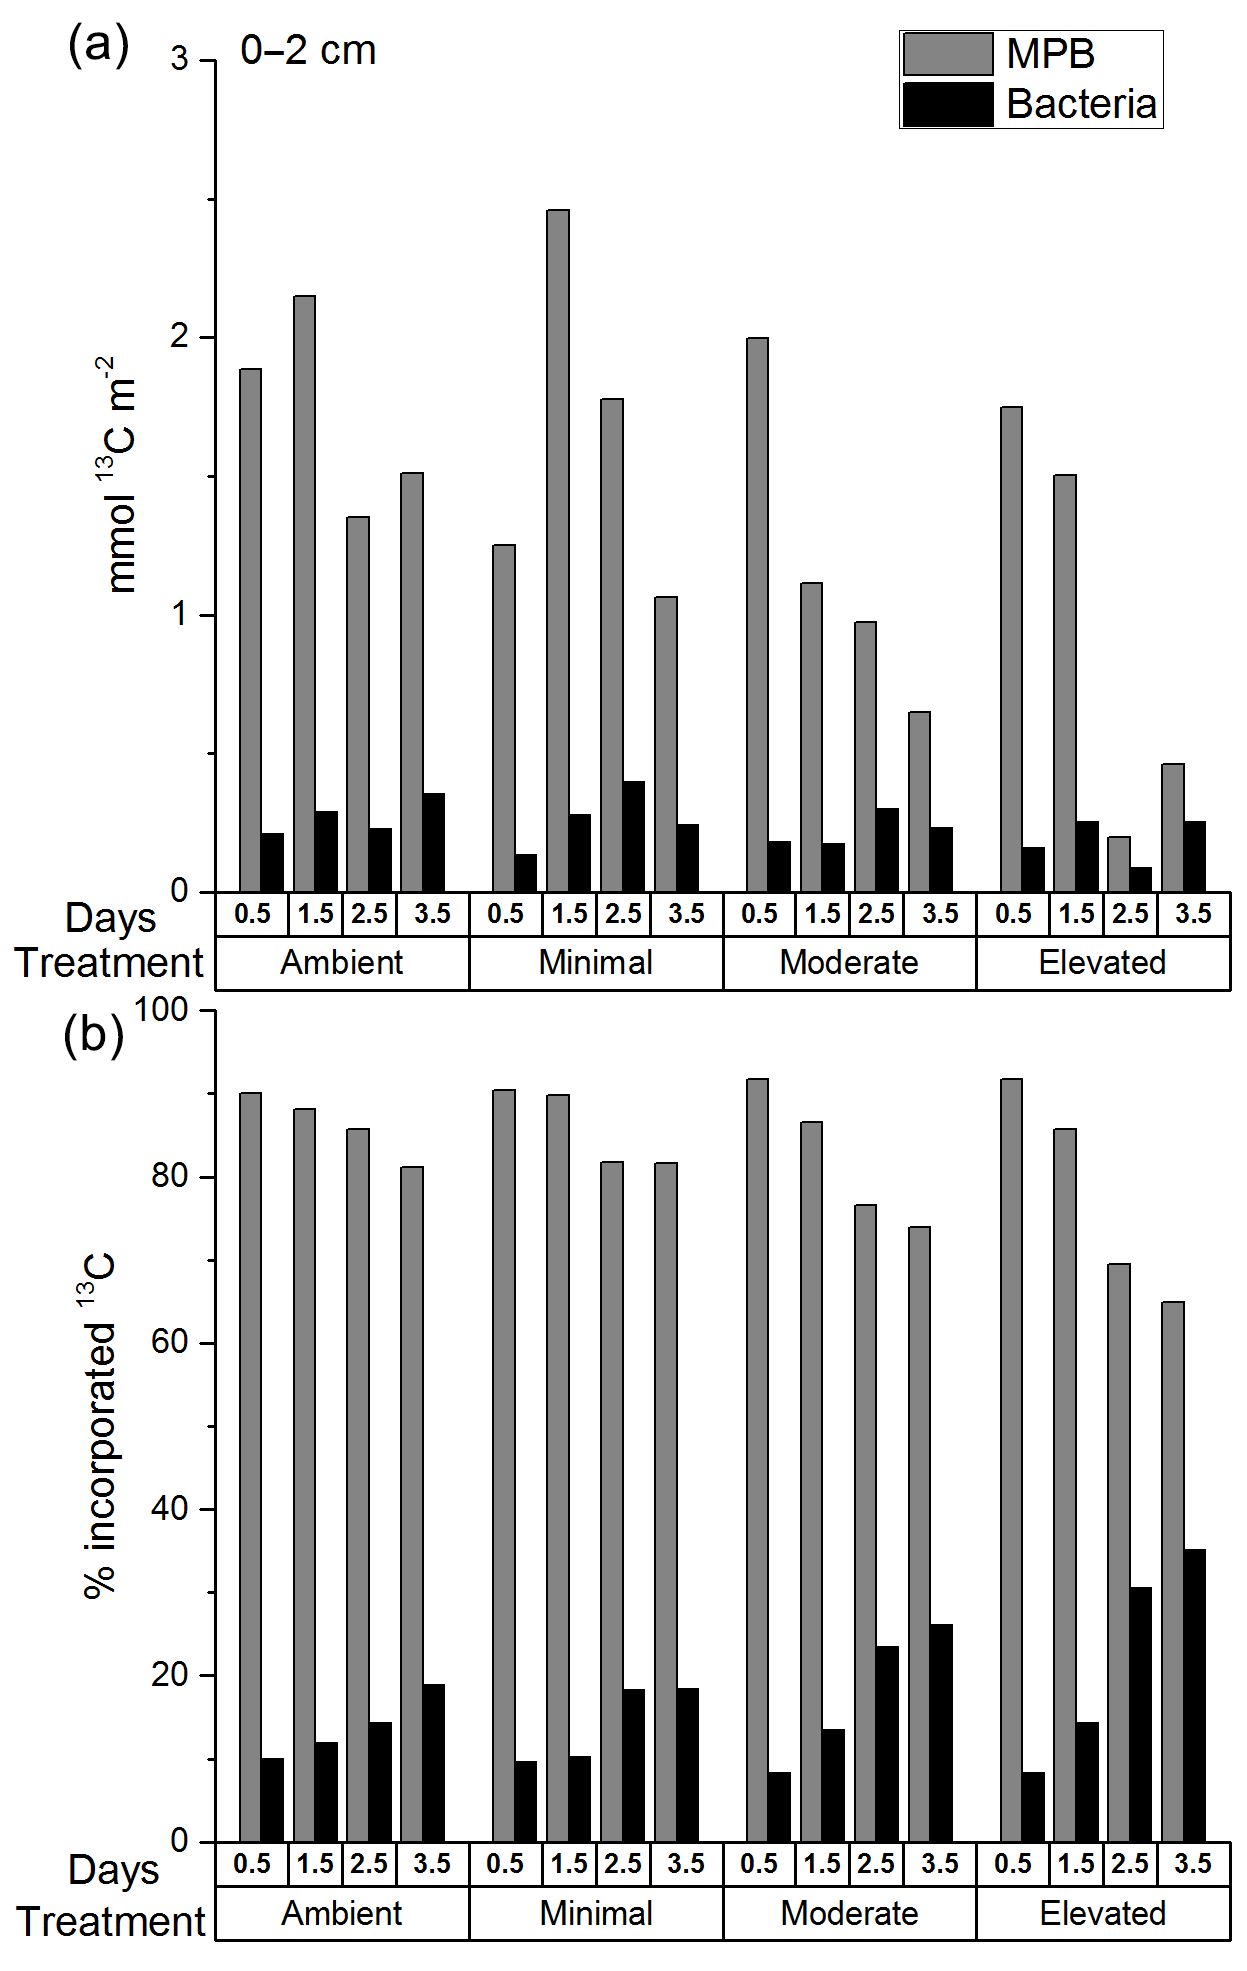
Figure 4The 13C within MPB and bacterial biomass in sediment at 0–2 cm depth as (a) total excess 13C (mmol 13C m−2) and (b) a percentage of the total 13C in microbial biomass at 0–2 cm at each time period. There are no error bars as PLFAs were analyzed for only one replicate sample from each time period.
Across all treatments, most of the 13C loss from sediment during the incubation occurred via DIC fluxes (Fig. 5). Cumulative 13C export to the water column via DIC fluxes was considerably larger than via DOC fluxes for all treatments (9× ambient, 11× minimal, 10× moderate and 17× elevated). Initial DI13C loss (0.5 days) was higher in the elevated treatment than in the ambient, minimal, and moderate treatments (5.3 ± 3.4 %, versus 0 %, 1.1 ± 0.3 %, and 1.4 ± 1.4 %, respectively; Fig. 5). After 3.5 days, cumulative losses of DI13C were higher in moderate and elevated treatments (12.4 ± 11.6 % moderate, 19.8 ± 10.8 % elevated; Fig. 5) than in ambient (4.0 ± 3.2 %) and minimal treatments (6.6 ± 2.0 %; Figs. 5 and 7).
DOC export was a less important pathway for 13C loss than DIC across all treatments. The 13C loss via DOC export was comparable and low across all treatments with similar maximum export at 3.5 days (0.5 ± 0.2 % ambient, 0.5 ± 0.2 % minimal, 0.4 ± 0.2 % moderate, and 0.6 ± 0.5 % elevated; Fig. 5).
This study examined the effects of enhanced nutrient loading on the processing pathways for MPB-derived C in intertidal estuarine sediments. Enhanced nutrient availability (1) increased loss of MPB-derived C from sediment via DIC efflux (Figs. 5 and 6), (2) shifted benthic metabolism to be less autotrophic (Fig. 1), and (3) decreased retention of C within MPB (Figs. 3 and 4). These multiple lines of evidence indicate that intertidal sediments in areas experiencing increased nutrient loading are likely to process C differently, resulting in reduced potential for C retention within the sediment.
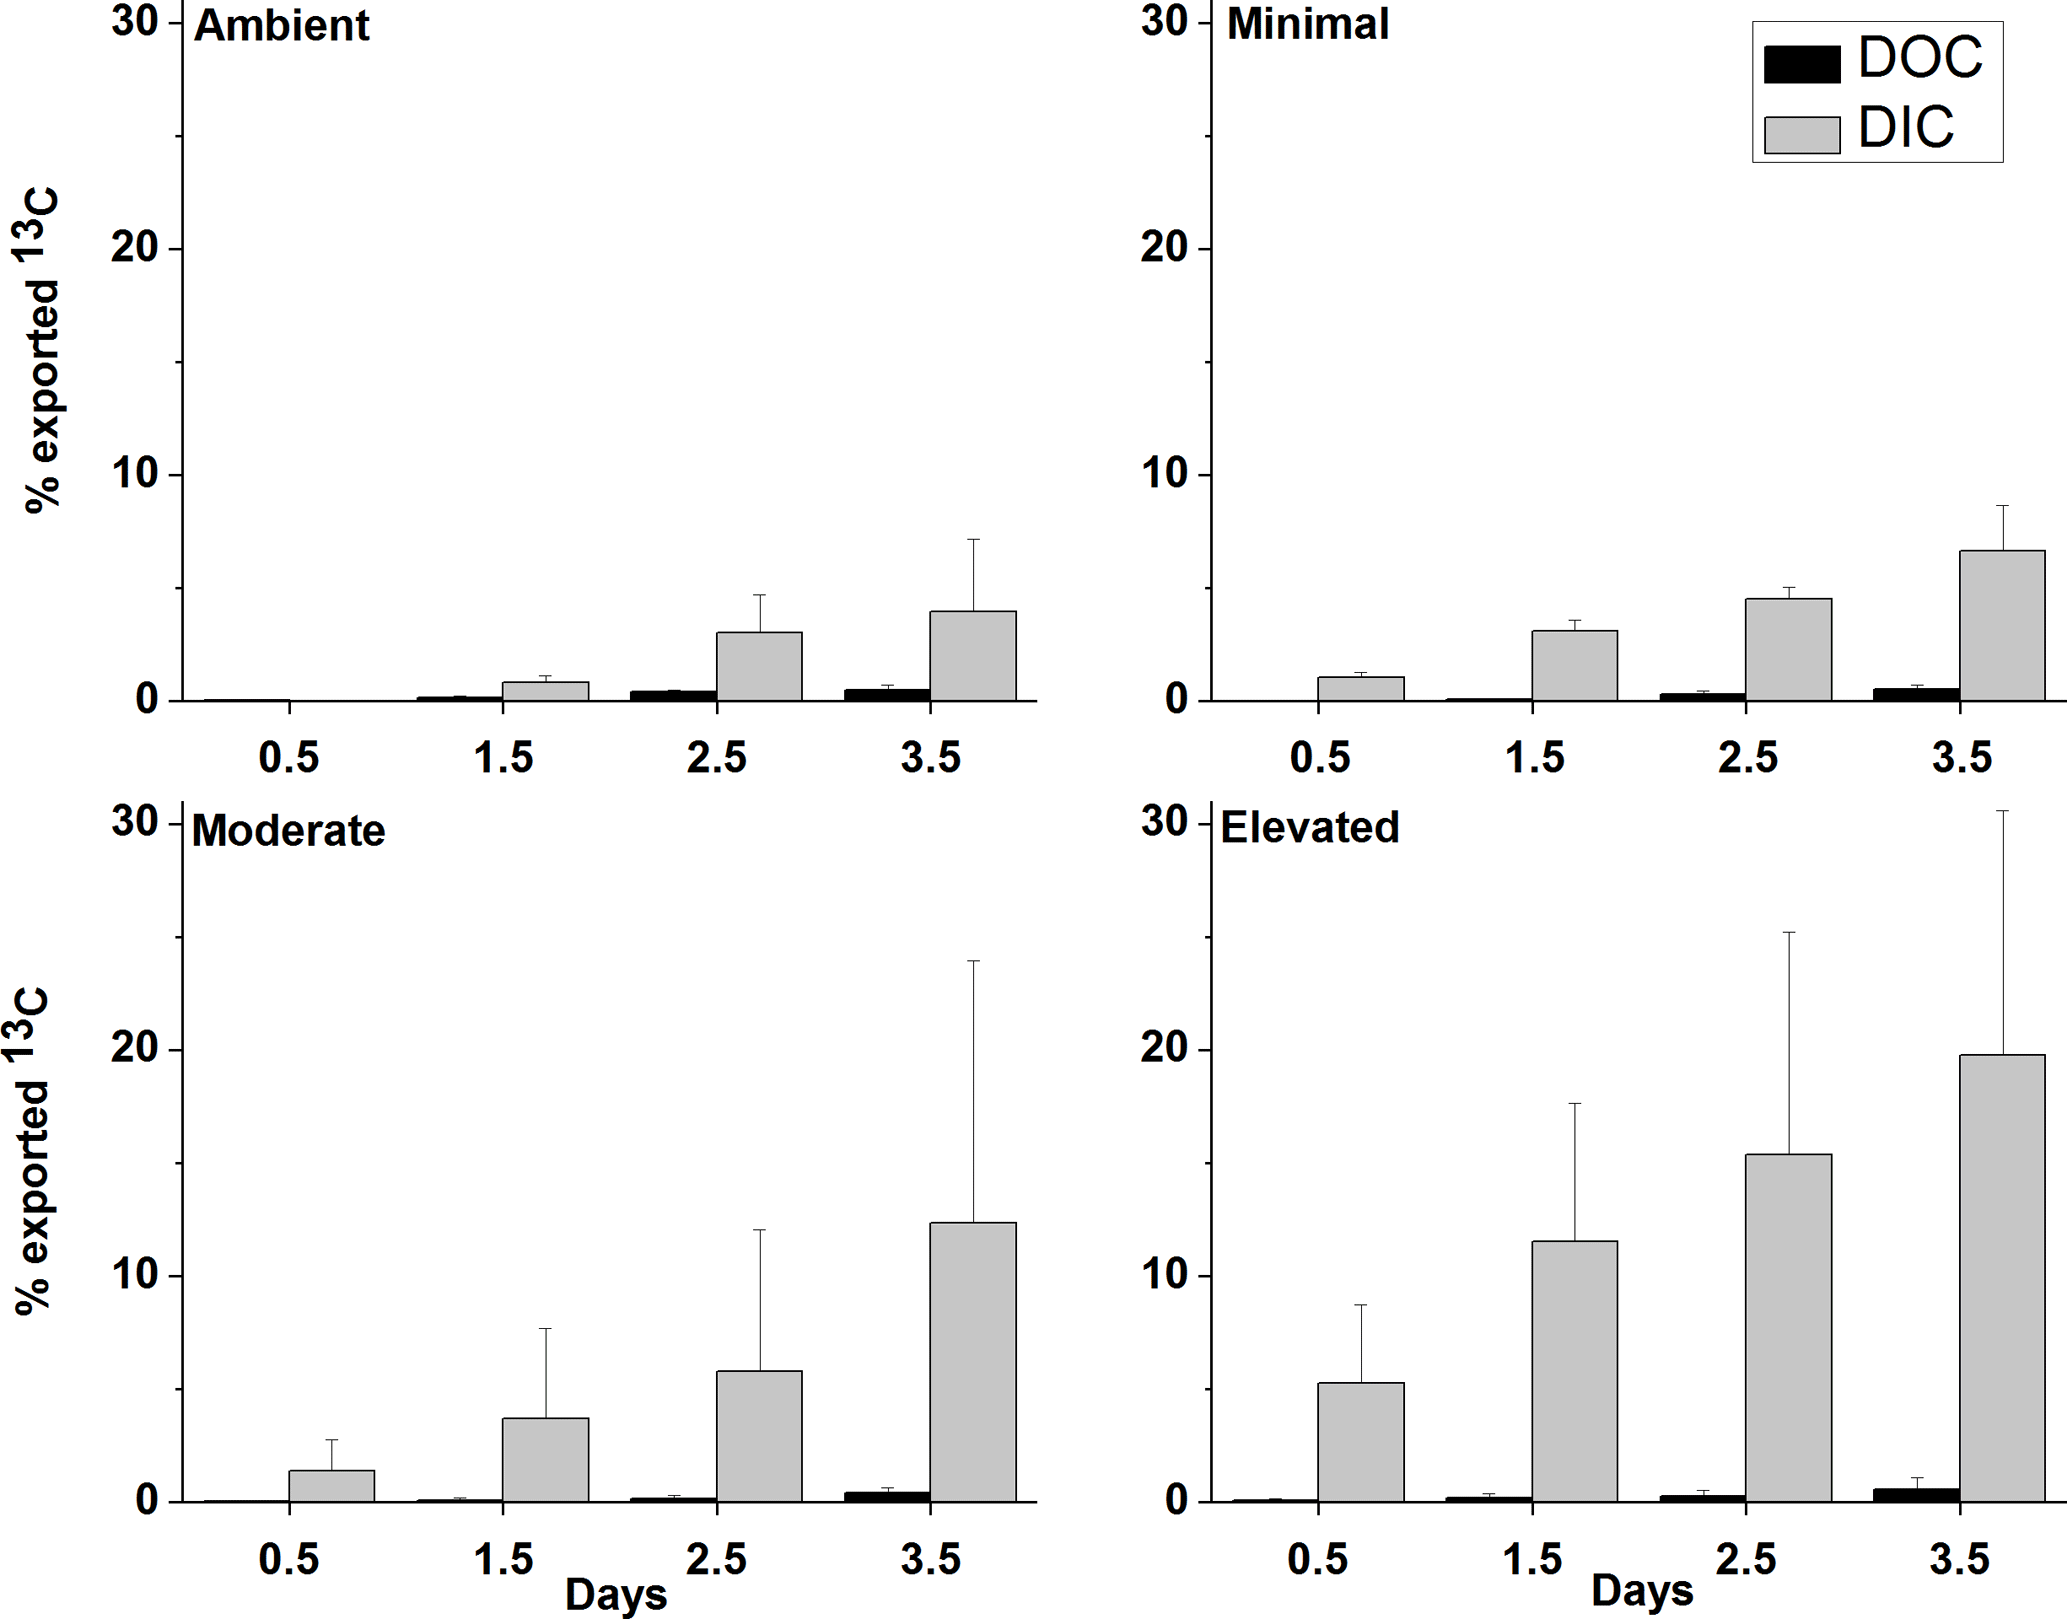
Figure 5Effluxes of 13C from the sediment as dissolved organic carbon (DOC) and dissolved inorganic carbon (DIC) as a percentage of the total 13C contained in sediment at 0–10 cm depth at each sampling time (mean ± SE).
4.1 Loss pathways for 13C
Increased nutrient additions caused additional loss of 13C from sediment OC, largely driven by DIC fluxes to the water column (Figs. 5 and 6). Complete loss of newly produced C from sediment OC, as estimated from exponential decay functions, occurred more quickly in nutrient-amended treatments than in ambient (15 % increase for minimal, 210 % increase for moderate, and 310 % increase for elevated, Fig. 6). Increased loss rates indicated reduced turnover time for newly produced MPB-derived C under increased nutrient load (419 days ambient versus 199 days moderate and 134 days elevated). It should be noted that the loss rate constant for the minimal treatment (0.021 ± 0.001, R2=0.99, 366 days) was comparable to that for the ambient treatment (0.018 ± 0.024, R2=0.95, 419 days), indicating that a small nutrient addition may not cause significant decreases in C turnover time. Increased loss rates imply that C retention and burial in MPB-dominated photic sediments are greatest when nutrients are limiting and that increased nutrient availability alters the processing of MPB-C within the sediment. Increased nitrogen availability appears to have decreased the retention of C within MPB biomass (Fig. 3). Increased turnover of the newly fixed MPB-derived C from the sediment likely occurred as the net result of exudation of material and breakdown of cells. This increased turnover may have caused the increased efflux of MPB-derived C as exudates and cell components were increasingly available to support respiration. The focus of this study was the short-term fate of MPB-C, but our findings also show potential implications for longer-term retention. Our calculated retention times may be under or over-estimated due to their reliance on short-term data. However, the relative differences between treatments (decreased retention with increased nutrient amendment) are clear. The rationale for utilizing exponential functions in this study follows previous findings in Oakes et al. (2014) that 13C export from subtidal sediments at this site were well described by an exponential decay function across a longer time period (31 days). Additionally, the 30-day estimates provided within this study (18–58 %) fall across a range similar to that of other previous labeling experiments (30–50 %; Hardison et al., 2011; Oakes and Eyre, 2014; Oakes et al., 2012), leading the authors to conclude that the use of exponential functions to describe this relationship was valid in this study.
Across all treatments, DIC was the main loss pathway for MPB-C, DOC was a minor pathway, and loss via CO2 was considered negligible (Oakes and Eyre, 2014) (Figs. 5 and 6). Loss of 13C via the DIC pathway appears to be stimulated by nutrient additions, resulting in increased export occurring earlier within incubations as a result of increased bacterial remineralization (Figs. 2 and 5). Increased DI13C export represents the portion of DI13C produced via respiration in excess of that which is recaptured and utilized by MPB to drive production. Given the close proximity of bacteria and MPB in the sediment, there is the potential for considerable utilization of the DI13C arising from bacterial remineralization to support algal production. Relatively low fluxes of DI13C to the water column in the ambient treatment across 2.5 days likely indicate more complete utilization and recycling of DI13C to support algal production (Fig. 5). Export of DI13C was considerably higher in both the moderate and elevated treatments, indicating production of DI13C during bacterial remineralization in excess of utilization of DI13C by MPB. Decreased recycling of DI13C from remineralization in elevated treatments could develop due to (1) decreased DIC demand as algal production decreased after initial stimulation or (2) increased production of unlabeled DIC through remineralization of previously refractory organic material providing an alternative unlabeled source to support algal production.
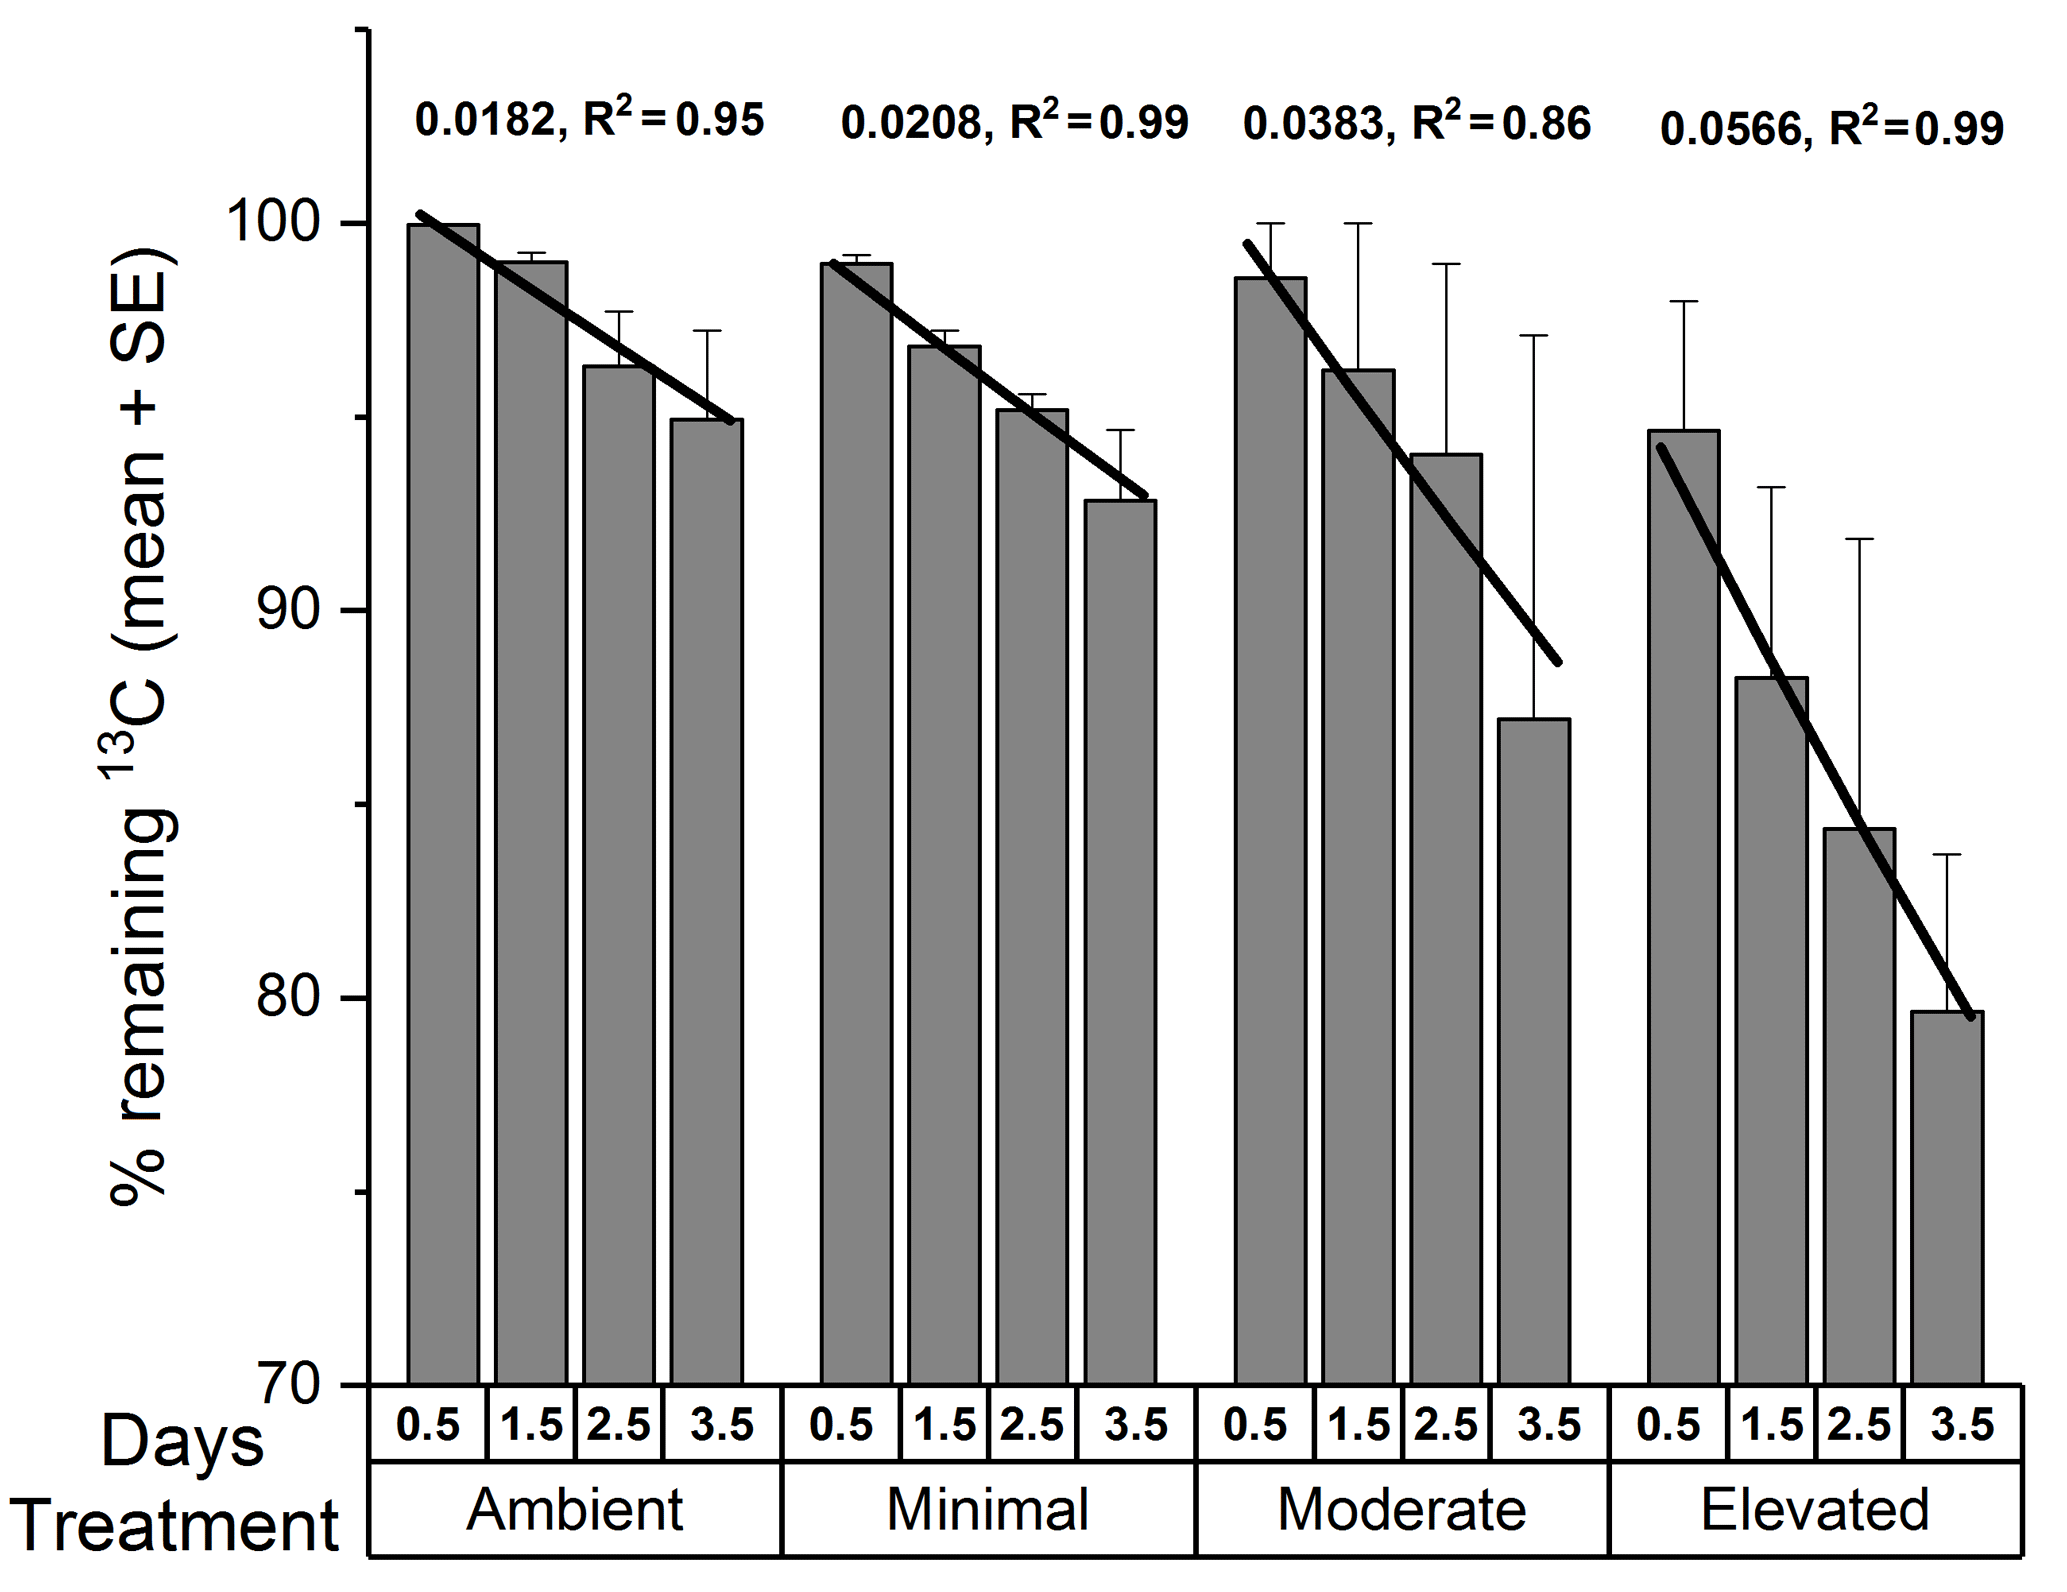
Figure 6The percentage of 13C remaining in sediment OC (0–10 cm depth; mean ± SE) from the calculated budget for total 13C. Lines are exponential decay functions for each treatment across the 3.5 days of incubation (loss rate constant, R2 of function).
Cumulative losses of DO13C were low for all treatments across 3.5 days (< 1.5 % of total 13C, Fig. 5) and did not appear to change significantly with increased nutrient availability. Previous studies have also found that DOC fluxes are a relatively minor contributor to loss of MPB-derived carbon (Oakes et al., 2012; Oakes and Eyre, 2014), as observed in the current study, but DOC may be a significant export pathway in other settings. Produced DOC may be labile and respired to DIC prior to loss from the sediment, but this pathway was not greatly altered due to increased nutrient availability.
4.2 Shifts in benthic metabolism
Each nutrient amendment produced a different shift in benthic metabolism within the core incubations (Fig. 1) with no clear dose–effect relationship between increased nutrient availability and P / R observed among nutrient-amended treatments. Heterogeneity in both bacterial and MPB biomass are routinely observed within intertidal sediment and can lead to substantial variability between the production and respiration observed between cores (Eyre et al., 2005; Glud, 2008). Despite a background of variability between cores, both minimal and elevated treatments displayed a decrease in autotrophy. The minimal treatment shifted into heterotrophy (P / R < 1) and the elevated treatment stimulated initial algal production sufficiently to cause a subsequent spike in respiration. Increased respiration by 3.5 days was partially offset by maintained production that kept P / R above 1. In contrast, the moderate treatment maintained a steady P / R across 3.5 days, although substantial error bars indicate considerable variability between the cores within the treatment. MPB-dominated sediment is expected to be net autotrophic, with positive GPP (Tang and Kristensen, 2007) that may be further stimulated by nutrient inputs (Underwood and Kromkamp, 1999). Increased algal production of labile organic matter subsequently stimulates heterotrophic respiration, increasing oxygen consumption and lowering P / R (Glud, 2008; McGlathery et al., 2007). Quick increases in MPB productivity followed by increased respiration have been observed in response to pulses of organic matter in both oligotrophic and estuarine sediments (Eyre and Ferguson, 2005; Glud et al., 2008). Rapid increases in respiration rates, as reflected in the oxygen fluxes for the elevated treatment (Fig. 1a), are often associated with an increased supply of labile C and can occur at rates higher than expected for in situ temperature. This has been observed in subtropical sediments (Eyre and Ferguson, 2005) as well as polar and temperate systems (Banta et al., 1995; Rysgaard et al., 1998). Although the sediments in this study were not oligotrophic, the extent of the shift towards heterotrophy is still likely controlled by the amount and relative quality (C / N ratio) of the organic matter available for processing (Cook et al., 2009; Eyre et al., 2008). It is important to note that the elevated treatment did not shift to a P / R less than 1, but did display a considerable increase in respiration. The rapid increase in respiration in the elevated treatment suggests that the newly produced organic matter was readily bioavailable and quickly processed by bacteria as a result of increased nutrient availability.
4.3 Retention of carbon within microphytobenthos biomass
Within surface sediments, MPB biomass did not increase with increased nutrient load, despite apparent increases in productivity (Fig. S3 in the Supplement). Although MPB biomass did not change, by 3.5 days the 13C retained within MPB biomass in the nutrient-amended treatments appears to have decreased (Fig. 4a) indicating increased turnover of newly fixed C out of MPB biomass. This aligns with many previous reports that increased productivity does not necessarily correspond with increased algal biomass (Alsterberg et al., 2012; Ferguson and Eyre, 2013; Ferguson et al., 2007; Hillebrand and Kahlert, 2002; Piehler et al., 2010; Spivak and Ossolinski, 2016). Lack of change in MPB biomass, despite increased productivity, may occur as a result of grazing or secondary nutrient limitation (Hillebrand and Kahlert, 2002), but these explanations are unlikely for the current study. Grazing is likely to have occurred at only a low level. There was very little fauna, including grazers, within sediment at the study site and, although any grazers such as copepods that were within the site water would have been included in the incubations, larger, mobile grazers were excluded. Secondary nutrient limitation of P or Si was avoided through additions of both elements at 0 days for P and 2.5 days for Si during incubation. It is more likely that the microbial community responded to pulses of increased nutrients through increased production of extracellular compounds (MPB: carbohydrates; bacteria: enzymes) rather than increasing their biomass (Thornton et al., 2010). This may be a strategy to optimally utilize intermittently available nutrient resources, given that increased cell numbers (biomass) within a biofilm community may otherwise increase competition among cells (Decho, 2000; Drescher et al., 2014). Allocation of additional N towards increased production of extracellular enzymes or storage molecules rather than new biomass may therefore benefit the community. Strong competition between MPB and bacteria for available N resulted in a minimal contribution from denitrification as a pathway for N loss likely as a result of limited availability of for denitrifying bacteria (unpublished data).
4.4 13C distribution within the sediment
4.4.1 Microbial biomass
Decreased autotrophy is somewhat reflected in the relative partitioning of 13C from newly produced algal C between MPB and bacteria within the individual treatments (Figs. 1 and 4b). Initially, uptake of 13C was strongly dominated by MPB amongst treatments, with minimal incorporation by bacteria. As incubations progressed, a shift towards increased relative contribution by bacteria was apparent in all treatments, but was more substantial in the elevated treatment (3.5 days; 19 % ambient, 18 % minimal, 26 % moderate, and 35 % elevated, Fig. 4b). This quicker shift towards bacterial dominance of 13C incorporation corresponded with the largest decrease in P / R ratios observed in this study, as increased respiration and decreased production caused the elevated treatment to become less autotrophic (Fig. 1). These corresponding factors are likely a result of a tight coupling and intense recycling between algal production and bacterial processing of newly produced MPB-derived C. EPS can be a large export pathway for newly fixed C from algal cells (up to 70.3 % Goto et al., 1999) and can provide a labile C source for heterotrophic or denitrifying bacteria. The 13C incorporated into bacteria represents the balance of respiration and uptake and is expected to become increasingly muddled by 13C being processed through other pathways (denitrification) as incubations progress. Therefore, this study only considered the transfer of MPB-C into bacteria at the 0.5-day sampling. However, given the low initial transfer of 13C to bacteria in all treatments over 24 h following labeling (0.5 days; 0.8 % h−1 ambient, 0.8 % h−1 minimal, 0.7 % h−1 moderate, 0.7 % h−1 elevated; Fig. 3), it appears that either production or utilization of EPS containing newly fixed C was relatively low in the current study, regardless of nutrient addition. This transfer was the net result of EPS production and bacterial remineralization and would have become increasingly muddled as 13C-containing detrital material accumulated as incubations progressed. Low EPS production at 0.5 days may indicate that N is not limiting for MPB in these sediments, as exuded EPS does not appear to be copious, as would be expected under severe N limitation (van den Meersche et al., 2004). Similarly low rates of C transfer from MPB to bacteria were previously reported for the site (0.83 % h−1, Oakes and Eyre, 2014) and are towards the lower end of the range of EPS production rates for benthic diatoms (0.05 to 73 % h−1; Underwood and Paterson, 2003). At 0.5 days nutrient availability appears to have had little effect on the initial transfer rates from MPB to bacteria, but appears to have decreased the turnover of MPB-C out of the microbial community, as contributions of 13C to the uncharacterized pool were lower in the nutrient-amended treatments (Fig. 3). By 3.5 days, increased nutrient availability appears to stimulate the transfer of 13C from microbial biomass in the uncharacterized pool, but had no effect on 13C in bacteria as the bacterial pool was equal across all treatments (15–18 %, Figs. 3 and 7).

Figure 7Distribution of 13C at 3.5 days of incubation of inundated sediment including loss pathways for DIC and DOC. The 13C contained in sediment organic carbon (sediment OC) is further partitioned into microphytobenthos, bacteria, and uncharacterized organic carbon as a percentage of the 13C in sediment organic carbon at 0–10 cm 3.5 days after labeling (Figure layout from Eyre et al., 2016).
4.4.2 Uncharacterized
A portion of the 13C incorporated into sediment OC was uncharacterized (i.e., not within microbial biomass). By 3.5 days, the portion of initially incorporated 13C that was within the uncharacterized pool varied substantially among the treatments (29–46 %, Fig. 7). This uncharacterized C is likely to represent a mixture of both labile and refractory OC (Veuger et al., 2012), including metabolic byproducts, senescent cells undergoing breakdown, EPS, extracellular enzymes, carbohydrates, and a variety of complex, molecularly uncharacterized organic matter (Hedges et al., 2000). Collectively, these molecules form a pool of labeled intra- and extracellular material remaining in sediment OC derived from both MPB and bacteria that is not characterized as microbial biomass when using PLFAs to estimate microbial biomass (e.g., 13C contained in storage products or enzymes that was not incorporated into phospholipids). Given that MPB can direct up to 70 % of their newly fixed C to EPS (Goto et al., 1999), carbohydrates are likely to form a considerable portion of the uncharacterized 13C. A study using a similar 13C-labeling approach reported that 15–30 % of MPB-derived carbon was transferred to intra- and extracellular carbohydrates within 30 days after an initial transfer rate of ∼ 0.4 % into bacteria (2 days; Oakes et al., 2010a). In light of the higher transfer rates for 13C into bacteria observed in this study (0.7 to 0.9 % h−1), there is potential for a considerable portion of the uncharacterized pool to be accounted for by EPS.
When quantified, the uncharacterized C pool typically has a high C : N ratio (10 to 60; Cook et al., 2009; Eyre et al., 2016a), indicating that nitrogen availability may have a role in regulating its content and accumulation. Given that nitrogen limitation has been observed to suppress processing pathways of otherwise labile OM in soils (Jian et al., 2016; Schimel and Bennett, 2004), a similar mechanism may be possible in estuarine sediments. This mechanism may include a priming effect due to either increased production of extracellular enzymes or due to increased energy from labile C compounds allowing for the increased breakdown of sediment OM (Bianchi, 2011). Increased extracellular enzyme production would result in more complete utilization of sediment OM through promotion of hydrolysis (Arnosti, 2011; Huettel et al., 2014), a potentially limiting step during the breakdown of organic material. This would result in more complete utilization of 13C by microbial biomass and a smaller pool of uncharacterized C within sediment OC, as was observed in the nutrient-amended treatments at 0.5 days (Fig. 3). This is further supported by the increased turnover of MPB-C from microbial biomass into the uncharacterized pool observed within the nutrient-amended treatments (2.5 days, Fig. 3), indicating 13C that was previously incorporated into MPB was processed into the uncharacterized pool more quickly with increased nutrient availability. After 2.5 days, the 13C content of the uncharacterized pool was substantially larger for the elevated treatment (Figs. 3 and 7) and looks to have been largely sourced from MPB 13C, given that bacterial contribution to sediment OM remained stable. Composition of the uncharacterized pool will be study-specific depending on the different biomarker techniques utilized to estimate microbial biomass incorporating different pools of material. The metabolic pathways and ecological strategies regulating the portion of 13C entering the uncharacterized pool warrant further investigation.
4.5 Downward transport
Increased nutrient availability reduced the downward transport of fixed 13C, particularly within 2–5 cm, mainly as a result of increased export of MPB-C to the water column. In the ambient treatment, downward transport to 2–5 cm (10.0 %) and 5–10 cm (9.2 %) across 60 h was comparable to that reported by Oakes and Eyre (2014) for the same site (8.3 % 2–5 cm, 14.9 % 5–10 cm, 60 h). Oakes and Eyre (2014) suggested that resuspension resulting from a flood event limited the downward transport of 13C, but a comparable and lower rate of downward transport at 60 h (12.1 % 2–5 cm, 9 % 5–10 cm, ambient treatment) was observed in the current study in the absence of marked freshwater inflow. Downward transport is not a large pathway for loss of 13C within this system as transport to sediment below 2 cm was minimal and appeared further reduced in the elevated treatment (Fig. S4b and c in the Supplement). Decreased downward transport of MPB-derived C under increased nutrient load may reflect (1) decreased transport to depth as diatoms reduce migration downward to find nutrients (Saburova and Polikarpov, 2003) or (2) relaxation of the tight recycling and retention of newly fixed C between MPB and bacteria within surface sediments allowing for increased export of labile C to the water column (Cook et al., 2007). Decreased downward transport in this study likely reflects a combination of reduced algal transport of 13C to depth and increased loss of 13C from surface sediments to the water column.
This study has provided valuable insight into the processing of MPB-derived C under increased nutrient availability using multiple lines of evidence (budgeting 13C within sediment compartments and sediment–water effluxes, partitioning of C pools via biomarkers, and changes in P / R) and is among the first to have addressed this problem. However, some caveats on interpretation are important to note and are described as follows. (1) Ex situ incubation of sediment cores may not be directly comparable to processes occurring in situ and may overestimate C retention, as there is reduced potential for loss via sediment resuspension due to tidal movement, water currents, and grazing. (2) Removal of grazers may also increase MPB production and their release of exudates (Fouilland et al., 2014), which could enhance 13C transfer to bacteria. However, given the lack of apparent grazers at the site of the current study, and the low observed 13C transfer rate to bacteria (0.7–0.9 % h−1 Fig. 4b) that was comparable to previously measured in situ rates in Oakes and Eyre (2014), grazers appear to have had little potential impact on sediment processing in this study.
The findings show that increased nutrient availability reduced C retention, but the main export pathway for algal carbon remained the same (primarily loss via DIC). Coastal environments are recognized as important sites for carbon storage. Although the focus has primarily been on vegetated environments (Duarte et al., 2005), which store the most carbon, unvegetated sediments also have capacity for longer-term retention (e.g., ∼ 50 % after 21 days Hardison et al., 2011, 30 % after 30 days Oakes and Eyre, 2014; 31 % after 30 days Oakes et al., 2012). Based on N burial rates (and corresponding unpublished C burial rates) some coastal systems can have higher C burial rates in subtidal and intertidal macrophyte-free MPB sediments than in macrophyte-dominated sediments (Eyre et al., 2016b; Maher and Eyre, 2011), although this was shown in only one of the three estuaries studied. Increased nutrient loading into coastal settings has been implicated in historical decreases of long-term carbon storage through a shift from macrophyte-dominated systems (seagrass and mangrove) towards MPB-dominated systems (Macreadie et al., 2012) within coastal environments. Carbon storage potential within MPB-dominated sediments remains a significant knowledge gap within the carbon budgets of estuaries. The primary focus of this study was the short-term fate of MPB-C, but the significant decrease in retention observed with nutrient amendments suggests that short-term processes may have implications for longer-term retention. It is interesting to consider how these short-term changes may affect the longer-term retention (30 days) reported by previous studies (e.g., Oakes and Eyre, 2014), with the caveat that the substantial extrapolation required could introduce considerable error to estimates of retention. At 30 days, estimates of retention of C identified for ambient and minimal treatments were considerable in the current study (58 and 54 %); however, increased nutrient loading reduced this retention considerably (32 % moderate, 18 % elevated). Given that nutrient inputs have increased globally and bare photic sediment accounts for a large surface area within estuaries, these two factors could have resulted in substantial release of currently stored carbon and demonstrate the capacity for further substantial reduction of C storage potential globally if elevated nutrient inputs continue within estuarine systems.
Although MPB-dominated sediments probably have less decadal-scale long-term storage of C than macrophyte-dominated sediments, this study clearly demonstrates that the existing storage potential is further degraded by increased nutrient loading within MPB-dominated sediments. These sediments may lock away less C per area but are fairly ubiquitous within photic coastal and oceanic sediments and may contribute significantly to carbon storage within coastal systems due to this increased area. The observed increases in mobility of newly fixed algal carbon from intertidal sediments (Fig. 6) as a result of elevated anthropogenic nutrient loading will directly translate to increased carbon export to coastal oceans and reduced carbon storage potential within shallow photic estuarine sediments.
We have not put this data set into a publicly available repository yet as other portions of the data set for this experiment are still being finalized for other manuscripts. These data are available on request from the corresponding author.
The supplement related to this article is available online at: https://doi.org/10.5194/bg-15-2873-2018-supplement.
PMR planned the experimental design and field work; performed the field work, isolation of biomarkers, and laboratory analysis; and wrote the manuscript. JMO planned the experimental design and field work, contributed to the data interpretation, and assisted with statistical analysis and writing of the manuscript. BDE planned the experimental design and field work, contributed to the data interpretation, and assisted with the writing of the manuscript. The group of coauthors has approved the submission of this paper.
The authors declare that they have no conflict of interest.
We thank Jaap van der Meer for assistance with statistical analyses, Natasha
Carlson-Perret and Jessica Riekenberg for field assistance, Iain Alexander
for laboratory analysis, and Matheus Carvalho for isotope analysis. This
study was funded by an Australian Research Council (ARC) Linkage
Infrastructure, Equipment and Facilities grant to Bradley D. Eyre
(LE0668495), an ARC Discovery Early Career Researcher Award to Joanne M.
Oakes (DE120101290), an ARC Discovery grant to Bradley D. Eyre (DP160100248),
and ARC Linkage grants to Bradley D. Eyre (LP110200975; LP150100451;
LP150100519).
Edited by: Tina
Treude
Reviewed by: two anonymous referees
Alsterberg, C., Sundback, K., and Hulth, S.: Functioning of a shallow-water sediment system during experimental warming and nutrient enrichment, Plos One, 7, e51503, https://doi.org/10.1371/journal.pone.0051503, 2012.
Andersson, J. H., Woulds, C., Schwartz, M., Cowie, G. L., Levin, L. A., Soetaert, K., and Middelburg, J. J.: Short-term fate of phytodetritus in sediments across the Arabian Sea Oxygen Minimum Zone, Biogeosciences, 5, 43–53, https://doi.org/10.5194/bg-5-43-2008, 2008.
Armitage, A. R. and Fong, P.: Upward cascading effects of nutrients: shifts in a benthic microalgal community and a negative herbivore response, Oecologia, 139, 560–567, 2004.
Arnosti, C.: Microbial extracellular enzymes and the marine carbon cycle, Ann. Rev. Mar. Sci., 3, 401–425, 2011.
Banta, G. T., Giblin, A. E., Hobbie, J. E., and Tucker., J.: Benthic respiration and nitrogen release in Buzzards Bay, Massachusetts, J. Mar. Res., 53, 107–135, 1995.
Bauer, J. E., Cai, W. J., Raymond, P. A., Bianchi, T. S., Hopkinson, C. S., and Regnier, P. G.: The changing carbon cycle of the coastal ocean, Nature, 504, 61–70, 2013.
Bellinger, B. J., Underwood, G. J. C., Ziegler, S. E., and Gretz, M. R.: Significance of diatom-derived polymers in carbon flow dynamics within estuarine biofilms determined through isotopic enrichment, Aquat. Microb. Ecol., 55, 169–187, 2009.
Bianchi, T. S.: The role of terrestrially derived organic carbon in the coastal ocean: A changing paradigm and the priming effect, P. Natl. Acad. Sci. USA, 108, 19473–19481, 2011.
Brinch-Iversen, J. and King, G. M.: Effects of substrate concentration, growth state, and oxygen availability on relationships among bacterial carbon, nitrogen and phospholipid content, FEMS Microb. Ecol., 74, 345–356, 1990.
Cloern, J. E.: Our evolving conceptual model of the coastal eutrophication problem, Mar. Ecol. Prog. Ser., 210, 223–253, 2001.
Cook, P., Van Oevelen, D., Soetaert, K., and Middelburg, J.: Carbon and nitrogen cycling on intertidal mudflats of a temperate Australian estuary, IV, Inverse model analysis and synthesis, Mar. Ecol.-Prog. Ser., 394, 35–48, 2009.
Cook, P. L. M., Veuger, B., Boer, S., and Middelburg, J. J.: Effect of nutrient availability on carbon and nitrogen and flows through benthic algae and bacteria in near-shore sandy sediment, Aquat. Microb. Ecol., 49, 165–180, 2007.
Decho, A. W.: Microbial biofilms in intertidal systems: an overview, Cont. Shelf Res., 20, 1257–1273, 2000.
Drenovsky, R. E., Elliott, G. N., Graham, K. J., and Scow, K. M.: Comparison of phospholipid fatty acid (PLFA) and total soil fatty acid methyl esters (TSFAME) for characterizing soil microbial communities, Soil Biol. Biochem., 36, 1793–1800, 2004.
Drescher, K., Nadell, C. D., Stone, H. A., Wingreen, N. S., and Bassler, B. L.: Solutions to the public goods dilemma in bacterial biofilms, Curr. Biol., 24, 50–55, 2014.
Duarte, C. M., Middelburg, J. J., and Caraco, N.: Major role of marine vegetation on the oceanic carbon cycle, Biogeosciences, 2, 1–8, https://doi.org/10.5194/bg-2-1-2005, 2005.
Edlund, A., Nichols, P. D., Roffey, R., and White, D. C.: Extractable and lipopolysaccharide fatty acid and hydroxy acid profiles from Desulfovibrio species, J. Lipid Res., 26, 982–988, 1985.
Evrard, V., Huettel, M., Cook, P. L. M., Soetaert, K., Heip, C. H. R., and Middelburg, J. J.: Importance of phytodetritus and microphytobenthos for heterotrophs in a shallow subtidal sandy sediment, Mar. Ecol.-Prog. Ser., 455, 13–31, 2012.
Eyre, B. D.: Water quality changes in an episodically flushed sub-tropical Australian estuary: A 50 year perspective, Mar. Chem., 59, 177–187, 1997.
Eyre, B. D.: Regional evaluation of nutrient transformation and phytoplankton growth in nine river-dominated sub-tropical east Australian estuaries, Mar. Ecol. Progr. Ser., 205, 61–83, 2000.
Eyre, B. D. and Ferguson, A. J. P.: Benthic Metabolism and Nitrogen Cycling in a Subtropical East Australian Estuary (Brunswick): Temporal Variability and Controlling Factors, Limnol. Oceanogr., 50, 81–96, 2005.
Eyre, B. D., Glud, R. N., and Patten, N.: Mass coral spawning: A natural large-scale nutrient addition experiment, Limnol. Oceanogr., 53, 997–1013, 2008.
Eyre, B. D., Ferguson A. J. P., Webb, A., Maher, D., and Oakes, J. M.: Metabolism of different benthic habitats and their contribution to the carbon budget of a shallow oligotrophic sub-tropical coastal system (southern Moreton Bay, Australia), Biogeochemistry, 102, 87–110, 2011.
Eyre, B. D., Oakes, J. M., and Middelburg, J. J.: Fate of microphytobenthos nitrogen in subtropical sediments: A 15N pulse-chase study, Limnol. Oceanogr., 61, 1144–1156, 2016a.
Eyre, B. D., Maher, D. T., and Sanders, C.: The contribution of denitrification and burial to the nitrogen budgets of three geomorphically distinct Australian estuaries: Importance of seagrass habitats, Limnol. Oceanogr., 61, 1144–1156, 2016b.
Ferguson, A. and Eyre, B. D.: Interaction of benthic microalgae and macrofauna in the control of benthic metabolism, nutrient fluxes and denitrification in a shallow sub-tropical coastal embayment (western Moreton Bay, Australia), Biogeochemistry, 112, 423–440, 2013.
Ferguson, A., Eyre, B., and Gay, J.: Organic matter and benthic metabolism in euphotic sediments along shallow sub-tropical estuaries, northern New South Wales, Australia, Aquat. Microb. Ecol., 33, 137–154, 2003.
Ferguson, A., Eyre, B., and Gay, J.: Benthic nutrient fluxes in euphotic sediments along shallow sub-tropical estuaries, northern New South Wales, Australia, Aquat. Microb. Ecol., 37, 219–235, 2004.
Ferguson, A., Eyre, B., Gay, J., Emtage, N., and Brooks, L.: Benthic metabolism and nitrogen cycling in a sub-tropical coastal embayment: spatial and seasonal variation and controlling factors, Aquat. Microb. Ecol., 48, 175–195, 2007.
Fouilland, E., Tolosa, I., Bonnet, D., Bouvier, C., Bouvier, T., Bouvy, M., Got, P., Le Floc'h, E., Mostajir, B., Roques, C., Sempéré, R., Sime-Ngando, T., and Vidussi, F.: Bacterial carbon dependence on freshly produced phytoplankton exudates under different nutrient availability and grazing pressure conditions in coastal marine waters, FEMS Microb. Ecol., 87, 757–769, 2014.
Fry, B., Justić, D., Riekenberg, P., Swenson, E. M., Turner, R. E., Wang, L., Pride, L. Rabalais, N. N., Kurtz, J. C., Lehrter, J. C. Murrell, M. C., Shadwick, E. H., and Boyd, B.: Carbon dynamics on the Louisiana continental shelf and cross-shelf feeding of hypoxia, Estuar Coast, 38, 703–721, 2015.
Glud, R. N.: Oxygen dynamics of marine sediments, Mar. Biol. Res., 4, 243–289, 2008.
Glud, R. N., Eyre, B. D., and Patten, N.: Biogeochemical responses to mass coral spawning at the Great Barrier Reef: Effects on respiration and primary production, Limnol. Oceanogr., 53, 1014–1024, 2008.
Goto, N., Kawamura, T., Mitamura, O., and Terai, H.: Importance of extracellular organic carbon production in the total primary production by tidal-flat diatoms in comparison to phytoplankton, Mar. Ecol.-Prog. Ser., 190, 289–295, 1999.
Hardison, A., Anderson, I., Canuel, E., Tobias, C., and Veuger, B.: Carbon and nitrogen dynamics in shallow photic systems: Interactions between macroalgae, microalgae, and bacteria, Limnol. Oceanogr., 56, 1489–1503, 2011.
Hardison, A. K., Canuel, E. A., Anderson, I. C., Tobias, C. R., Veuger, B., and Waters, M. N.: Microphytobenthos and benthic macroalgae determine sediment organic matter composition in shallow photic sediments, Biogeosciences, 10, 5571–5588, https://doi.org/10.5194/bg-10-5571-2013, 2013.
Hedges, J. I., Eglinton, G., Hatcher, P. G., Kirchman, D. L., Arnosti, C., Derenne, S., Evershed, R. P., Kögel-Knabner, I., de Leeuw, J. W., Littke, R., Michaelis, W., and Rullkötter, J.: The molecularly-uncharacterized component of nonliving organic matter in natural environments, Org. Geochem., 31, 945–958, 2000.
Hillebrand, H. and Kahlert, M.: Effect of grazing and water column nutrient supply on biomass and nutrient content of sediment microalgae, Aquat. Bot., 72, 143–159, 2002.
Huettel, M., Berg, P., and Kostka, J.: Benthic Exchange and Biogeochemical Cycling in Permeable Sediments, Ann. Rev. Mar. Sci., 6, 23–51, 2014.
Jian, S. Li, J., Chen, J., Wang, G., Mayes, M. A., Dzantor, K. E., Hui, D., and Luo, Y.: Soil extracellular enzyme activities, soil carbon and nitrogen storage under nitrogen fertilization: A meta-analysis, Soil Biol. Biochem., 101, 32–43, 2016.
Lorenzen, C.: Determinations of chlorophyll and phaeopigments: spectrophotometric equations, Limnol. Oceanogr., 12, 343–346, 1967.
Macreadie, P. I., Allen, K., Kelaher, B. P., Ralph, P. J., and Skilbeck, C. G.: Paleoreconstruction of estuarine sediments reveal human-induced weakening of coastal carbon sinks, Glob. Change Biol., 18, 891–901, 2012.
Maher, D. and Eyre, B. D.: Benthic carbon metabolism in southeast Australian estuaries: Habitat importance, driving forces, and application of artificial neural network models, Mar. Ecol.-Prog. Ser., 439, 97–115, 2011.
McGlathery, K. J., Sundbäck, K., and Anderson, I. C.: Eutrophication in shallow coastal bays and lagoons: The role of plants in the coastal filter, Mar. Ecol.-Prog. Ser., 348, 1–18, 2007.
McKee, L. J., Eyre, B. D., and Hossain, S.: Transport and retention of nitrogen and phosphorus in the sub-tropical Richmond River estuary, Australia: A budget approach, Biogeochemistry, 50, 241–278, 2000.
Middelburg, J. J., Barranguet, C., Boschker, H. T. S., Herman, M. J., Moens, T., and Heip, C.: The fate of intertidal microphytobenthos carbon: An in situ 13C-labeling study, Limnol. Oceanogr., 45, 1224–1225, 2000.
Miyatake, T., Moerdijk-Poortvliet, T. C. W., Stal, L. J., and Boschker, H. T. S.: Tracing carbon flow from microphytobenthos to major bacterial groups in an intertidal marine sediment by using an in situ 13C pulse-chase method, Limnol. Oceanogr., 59, 1275–1287, 2014.
Nordström, M. C., Currin, C. A., Talley, T. S., Whitcraft, C. R., and Levin, L. A.: Benthic food-web succession in a developing salt marsh, Mar. Ecol.-Prog. Ser., 500, 43–55, 2014.
Oakes, J. M., Eyre, B. D., Middelburg, J. J., and Boschker, H. T. S.: Composition, production, and loss of carbohydrates in subtropical shallow subtidal sandy sediments: Rapid processing and long-term retention revealed by 13C-labeling, Limnol. Oceanogr., 55, 2126–2138, 2010a.
Oakes, J. M. and Eyre, B. D.: Transformation and fate of microphytobenthos carbon in subtropical, intertidal sediments: potential for long-term carbon retention revealed by 13C-labeling, Biogeosciences, 11, 1927–1940, https://doi.org/10.5194/bg-11-1927-2014, 2014.
Oakes, J. M., Eyre, B. D., Ross, D. J., and Turner, S. D.: Stable isotopes trace estuarine transformations of carbon and nitrogen from primary- and secondary-treated paper and pulp mill effluent, Environ. Sci. Technol., 44, 7411–7417, 2010b.
Oakes, J. M., Eyre, B. D., and Middelburg, J. J.: Transformation and fate of microphytobentos carbon in subtropical shallow subtidal sands: A 13C-labeling study, Limnol. Oceanogr., 57, 1846–1856, 2012.
Oakes, J. M., Rysgaard, S., Glud, R. N., and Eyre, B. D.: The transformation and fate of sub-Arctic microphytobenthos carbon revealed through 13C-labeling, Limnol. Oceanogr., 61, 2296–2308, 2016.
Pascal, P. Y., Fleeger, J. W., Boschker, H. T. S., Mitwally, H. M., and Johnson, D. S.: Response of the benthic food web to short- and long-term nutrient enrichment in saltmarsh mudflats, Mar. Ecol. Prog. Ser., 474, 27–41, 2013.
Piehler, M. F., Currin, C. A., and Hall, N. S.: Estuarine intertidal sandflat benthic microalgal responses to in situ and mesocosm nitrogen additions, J. Exp. Mar. Biol. Ecol., 390, 99–105, 2010.
Rajendran, N., Suwa, Y., and Urushigawa, Y.: Distribution of phospholipid ester-linked fatty acid biomarkers for bacteria in the sediment of Ise Bay, Japan, Mar. Chem., 42, 39–56, 1993.
Rajendran, N., Matsuda, O., Urushigawa, Y., and Simidu, U.: Characterization of microbial community structure in the surface sediment of Osaka Bay, Japan, by phospholipid fatty acid analysis, Appl. Environ. Microb., 60, 248–257, 1994.
Riekenberg, P. M., Oakes, J. M., and Eyre, B. D.: Uptake of dissolved organic and inorganic nitrogen in microalgae-dominated sediment: Comparing dark and light in situ and ex situ additions of 15N, Mar. Ecol.-Prog. Ser., 571, 29–42, 2017.
Rysgaard, S., Thamdrup, B., Risgaard-Petersen, N., Fossing, H., Berg, P., Christensen, P. B., and Dalsgaard, T.: Seasonal carbon and nutrient mineralization in a high-Arctic coastal marine sediment, Young Sound, Northeast Greenland, Mar. Ecol.-Prog. Ser., 175, 261–276, 1998.
Saburova, M. A. and Polikarpov, I. G.: Diatom activity within soft sediments: behavioural and physiological processes, Mar. Ecol.-Prog. Ser., 251, 115–126, 2003.
Schimel, J. P. and Bennett, J.: Nitrogen mineralization: Challenges of a changing paradigm, Ecology, 85, 591–602, 2004.
Spivak, A. C.: Benthic biogeochemical responses to changing estuary trophic state and nutrient availability: A paired field and mesocosm experiment approach, Limnol. Oceanogr., 60, 3–21, 2015.
Spivak, A. C. and Ossolinski, J.: Limited effects of nutrient enrichment on bacterial carbon sources in salt marsh tidal creek sediments, Mar. Ecol.-Prog. Ser., 544, 107–130, 2016.
Stal, L. J.: Microphytobenthos as a biogeomorphological force in intertidal sediment stabilization, Ecol. Eng., 36, 236–245, 2010.
Tang, M. and Kristensen, E.: Impact of microphytobenthos and macroinfauna on temporal variation of benthic metabolism in shallow coastal sediments, J. Exp. Mar. Biol. Ecol., 349, 99–112, 2007.
Thornton, D. C. O., Kopac, S. M., and Long, R. A.: Production and enzymatic hydrolysis of carbohydrates in intertidal sediment, Aquat. Microb. Ecol., 60, 109–125, 2010.
Underwood, G. J. C. and Kromkamp, J.: Primary production by phytoplankton and microphytobenthos in estuaries, Adv. Ecol. Res., 29, 93–153, 1999.
Underwood, G. J. C. and Paterson, D. M.: The importance of extracellular carbohydrate production by marine epipelic diatoms, Adv. Bot. Res., 40, 183–240, 2003.
Van den Meersche, K, Middelburg, J. J., Soetaert, K., van Rijswijk, P., Boschker, H. T. S., and Heip, C.: Carbon-nitrogen coupling and algal-bacterial interactions during an experimental bloom: Modeling a 13C tracer experiment, Limnol. Oceangr., 49, 862–878, 2004.
Van Nugteren, P., Moodley, L., Brummer, G.-J., Heip, C. H. R., Herman, P. M. J., and Middelburg, J. J.: Seafloor ecosystem functioning: the importance of organic matter priming, Mar. Biol., 156, 2277–2287, 2009.
Van Oevelen, D., Middelburg, J. J., Soetaert, K., and Moodley, L.: The fate of bacterial carbon in an intertidal sediment: Modeling an in situ isotope tracer experiment, Limnol. Oceanogr., 51, 1302–1314, 2006.
Veuger, B., Van Oevelen, D., and Middelburg, J. J.: Fate of microbial nitrogen, carbon, hydrolysable amino acids, monosaccharides, and fatty acids in sediment, Geochim. Cosmochim. Acta, 83, 217–233, 2012.
Volkman, J. K., Jeffrey, S. W., Nichols, P. D., Rogers, G. I., and Garland, C. D.: Fatty acid and lipid composition of 10 species of microalgae used in mariculture, J. Exp. Mar. Biol. Ecol., 128, 219–240, 1989.