the Creative Commons Attribution 4.0 License.
the Creative Commons Attribution 4.0 License.
 | 09 Jul 2018
Long-chain diols in rivers: distribution and potential biological sources
Frédérique Kirkels
Francien Peterse
Chantal V. Freymond
Timothy I. Eglinton
Jens Hefter
Gesine Mollenhauer
Sergio Balzano
Laura Villanueva
Marcel T. J. van der Meer
Ellen C. Hopmans
Jaap S. Sinninghe Damsté
Stefan Schouten
Long-chain diols (LCDs) occur widespread in marine environments and also in lakes and rivers. Transport of LCDs from rivers may impact the distribution of LCDs in coastal environments, however relatively little is known about the distribution and biological sources of LCDs in river systems. In this study, we investigated the distribution of LCDs in suspended particulate matter (SPM) of three river systems (Godavari, Danube, and Rhine) in relation with precipitation, temperature, and source catchments. The dominant long-chain diol is the C32 1,15-diol followed by the C30 1,15-diol in all studied river systems. In regions influenced by marine waters, such as delta systems, the fractional abundance of the C30 1,15-diol is substantially higher than in the river itself, suggesting different LCD producers in marine and freshwater environments. A change in the LCD distribution along the downstream transects of the rivers studied was not observed. However, an effect of river flow is observed; i.e., the concentration of the C32 1,15-diol is higher in stagnant waters such as reservoirs and during seasons with river low stands. A seasonal change in the LCD distribution was observed in the Rhine, likely due to a change in the producers. Eukaryotic diversity analysis by 18S rRNA gene sequencing of SPM from the Rhine showed extremely low abundances of sequences (i.e., < 0.32 % of total reads) related to known algal LCD producers. Furthermore, incubation of the river water with 13C-labeled bicarbonate did not result in 13C incorporation into LCDs. This indicates that the LCDs present are mainly of fossil origin in the fast-flowing part of the Rhine. Overall, our results suggest that the LCD producers in rivers predominantly reside in lakes or side ponds that are part of the river system.
- Article
(5635 KB) - Full-text XML
-
Supplement
(326 KB) - BibTeX
- EndNote


Long-chain diols (LCDs) occur widespread in marine environments and have been shown to mainly consist of C28 and C30 1,13-diols, C30 and C32 1,15-diols (Versteegh et al., 1997, 2000; Gogou and Stephanou, 2004; Smith et al., 2013; Schmidt et al., 2010; Rampen et al., 2012, 2014a), and C28 and C30 1,14-diols (Sinninghe Damsté et al., 2003; Rampen et al., 2011, 2014a). Culture studies showed that eustigmatophyte algae (isolated from snow, soil, marine, and freshwater environments) produce 1,13- and 1,15-diols (Volkman et al., 1999; Rampen et al., 2007, 2014b), but with a distribution different than encountered in marine sediments, i.e., cultures of eustigmatophytes produce mainly the C32 1,15-diol, while in marine sediments the C30 1,15-diol is generally dominant. Furthermore, eustigmatophyte algae are rarely reported in marine environments, indicating that the cultivated marine eustigmatophytes are likely not the main producers of 1,13- and 1,15-diols in marine environments (Volkman et al., 1999). Culture studies of Proboscia diatoms show that they produce mainly 1,14-diols and minor amounts of 1,13-diols (Sinninghe Damsté et al., 2003; Rampen et al., 2007), while the marine dictyochophycean alga Apedinella radians (Rampen et al., 2011) also produces 1,14-diols. Proboscia diatoms are mainly present in upwelling areas and are likely the main source of 1,14-diols in nutrient-rich marine environments (Rampen et al., 2008; Willmott et al., 2010; Gal et al., 2018).
LCDs also occur in freshwater environments, i.e., in lakes (Shimokawara et al., 2010; Castañeda et al., 2011; Zhang et al., 2011; Romero-Viana et al., 2012; Rampen et al., 2014b; Villanueva et al., 2014) and in rivers (De Bar et al., 2016; Lattaud et al., 2017a). Shimokawara et al. (2010) showed that the LCD distribution in Lake Baikal was similar to that of cultivated freshwater eustigmatophytes, indicating that they may be a source of LCDs in freshwater environments. In addition, Villanueva et al. (2014) observed a correlation between the LCD concentration in the water column of Lake Chala and the abundance of 18S rRNA gene copies of uncultivated eustigmatophytes. Rampen et al. (2014b) studied the LCD distribution of several freshwater eustigmatophyte cultures, showing that for the Goniochloridaceae and Monodopsidaceae families the main LCD is the C32 1,15-diol, while the LCDs of members of the Eustigmataceae family are dominated by a mix of C28 1,13-, C30 1,15-, and C32 1,15-diols. Interestingly, an increase in the temperature at which these algae were cultivated resulted in an increase in the fractional abundance of the C32 1,15-diol (Rampen et al., 2014b). Apart from lakes, LCDs have recently also been reported to occur in rivers (De Bar et al., 2016; Lattaud et al., 2017a) with the C32 1,15-diol and, to a lesser extent, the C30 1,15-diol as the most abundant LCDs. In contrast to marine and lake systems, however, the spatial occurrence and sources of LCDs in river systems have not been studied in detail.
In this study we investigated three river systems, i.e., the Rhine, Godavari, and Danube rivers, to constrain the impact of river characteristics on the distribution of LCDs. Furthermore, we analyzed the algal community composition using 18S rRNA gene sequencing and quantitative polymerase chain reaction (qPCR) analysis and performed labeling studies in the Rhine to constrain potential biological sources of LCDs.
2.1 Material
2.1.1 Godavari
The Godavari is the largest river of India not draining the Himalayas with a catchment area of 310 × 103 km2 (Balakrishna and Probst, 2005) and a length (of the main river) of 1465 km (Ramasubramanian et al., 2006). The principal tributaries of the river are the Pranhita, Wainganga, and Wardha forming a subcatchment (called Pranhita) in the north and the Indravati and Sabari draining the Eastern Ghats (called Indravati). In addition to these subcatchments, the main stem of the Godavari River can be divided into the Upper Godavari (from the source to Sironcha), the Middle Godavari (from Sironcha to the Dowleswaram reservoir), and the Lower Godavari (downstream of the reservoir). The climate over the basin is semiarid to monsoonal (10 to 45 ∘C; Biksham and Subramanian, 1988) and rainfall increases along a west–east gradient. Maximal rainfall is experienced during the southwest monsoon over India (annual rainfall is 1185 mm with 84 % falling during monsoonal months, June to September; Biksham and Subramanian, 1988; Pradhan et al., 2014). Approximately 98 % of the total suspended sediment load of the Godavari River is transported during the monsoon period (Rao et al., 2015).
A total of 62 (20 in dry and 42 in wet season) suspended particulate matter (SPM) and 65 (34 in dry and 30 in wet season) riverbed sediments were collected as described by Usman et al. (2018) during the dry (February–March) and the wet (July–August) seasons in 2015 (Fig. 1a). The SPM was generally sampled at the surface of the river except for two locations where multiple depth profiles (0, 4, and 8 m deep) were obtained during the wet and dry seasons. For SPM sampling, 5–50 L of river water was filtered over a pre-ashed glass fiber filter (Whatman GF-F, 0.7 µm, 142 mm diameter). Riverbed sediments were collected from the middle of the stream from bridges, using a van Veen grab sampler.
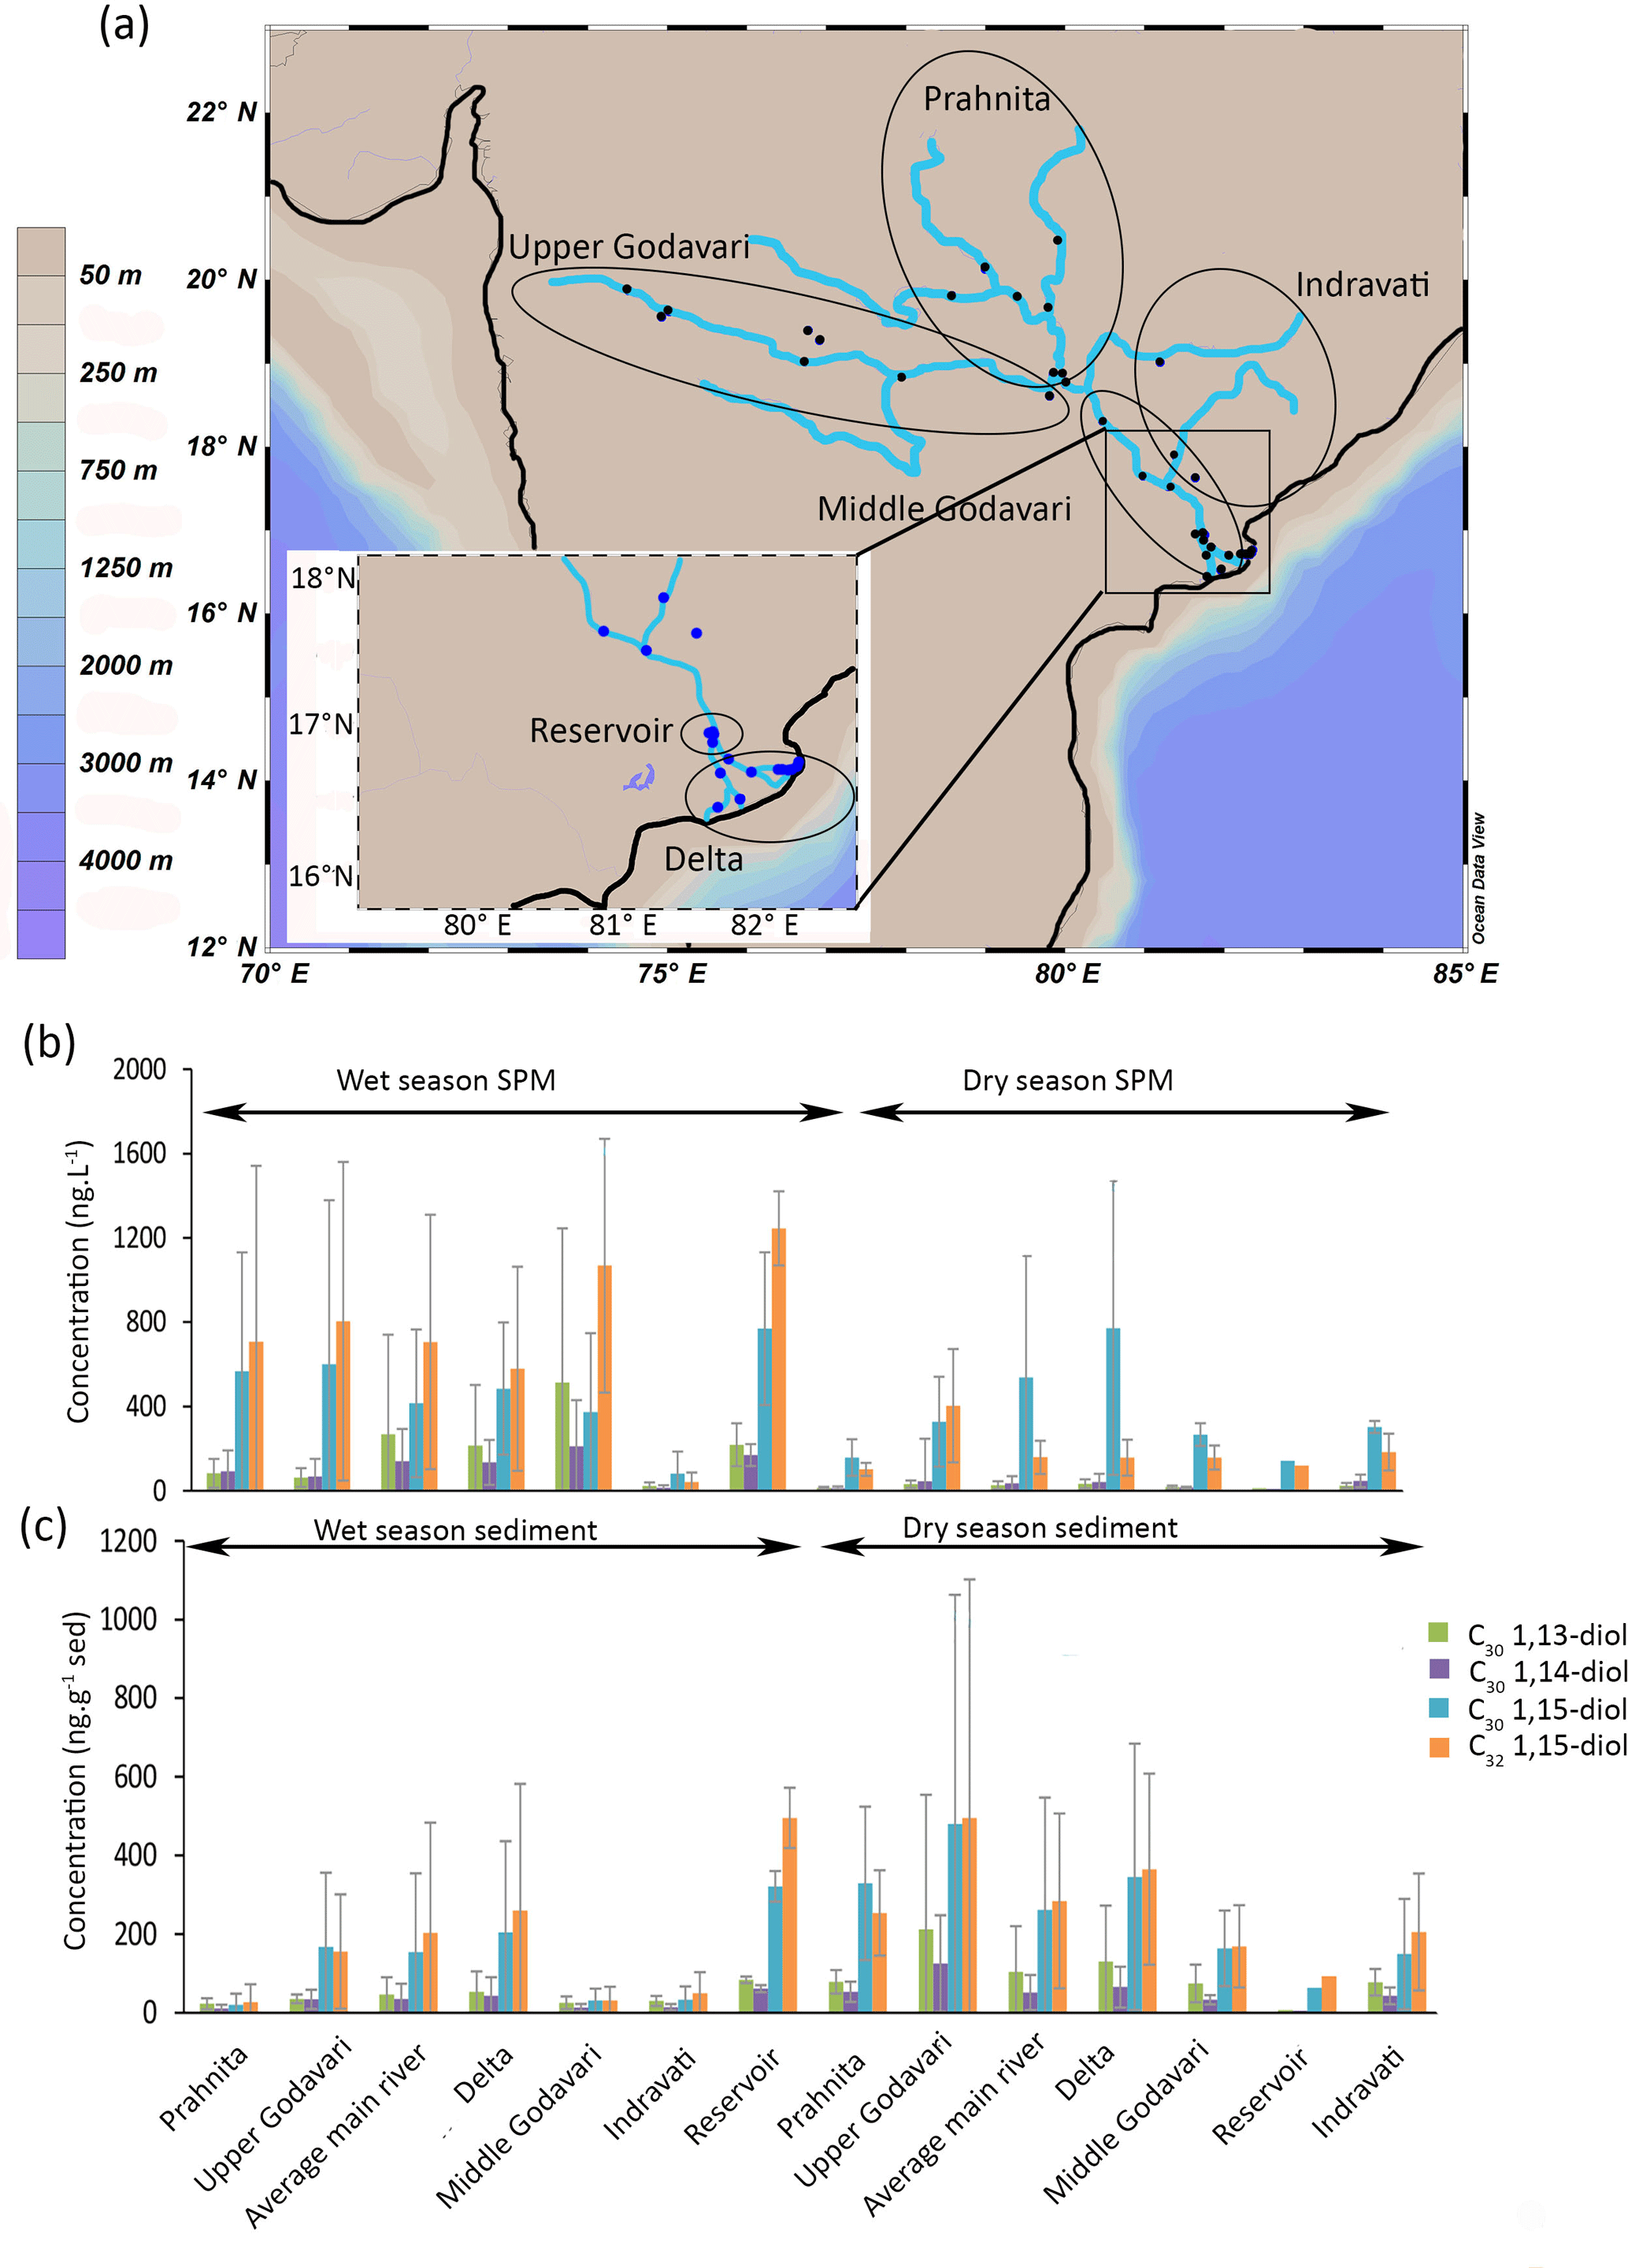
Figure 1(a) Location of the Godavari samples (Usman et al., 2018) with enhanced view of the delta region, (b) concentrations of LCDs in SPM (collected during wet and dry seasons), and (c) concentrations of LCDs in sediments (collected during wet and dry seasons). Grey bars indicate the standard deviation for each area.
2.1.2 Danube and Black Sea
The Danube is the second largest river of Europe with a catchment area of 800 × 103 km2 and a length of 2850 km (Freymond et al., 2017). Its catchment can be divided into four subregions: the upper Danube (from the source to the Devín Gate), the middle Danube (from the Devín Gate to the Iron Gates reservoir), the lower Danube (downstream of the Iron Gates reservoir to the delta), and the delta. The Danube flows directly into the Black Sea through three main branches of its delta: Chilia, Sulina, and Sfântu Gheorghe. In the Black Sea, south of the Crimean Peninsula, surface water flows westward onto the northwestern shelf. On the shelf, the surface current turns southward along the coast (Tolmazin, 1985). The climate in the Danube catchment is diverse, with an oceanic influence on the western part of the upper basin, a Mediterranean influence in the south and central part of the middle basin, and a continental climate influence in the other parts. The annual precipitation varies from 2000 mm yr−1 in the mountain area to 500 mm yr−1 in the plains (Rimbu et al., 2002).
There were 46 riverbed sediments (main river and tributaries, Fig. 2a) collected as described by Freymond et al. (2018) in spring 2013 and 2014. The riverbed sediments were wet sieved with Milli-Q water over a 63 µm sieve on a shaking table and the fine fraction (< 63 µm) was studied. In total 14 surface sediments from the Black Sea were included in this study. Of these, 10 surface sediments (Fig. 2a) were obtained as described by Kusch et al. (2010, 2016; called the Meteor–Poseidon surface sediments); one was collected in 2016 by the R/V Pelagia during cruise 64PE408, and three were collected in 2017 with the R/V Pelagia during cruise 64PE418 (collectively called the Pelagia surface sediments).

Figure 2(a) Location of the Danube samples with enhanced view of the Danube River mouth samples, (b) concentration of LCDs (this study) and BIT values (from Freymond et al., 2017) in the Danube sediments (n = 1 for the reservoir), and (c) fractional abundance of the LCDs in the Danube (average of the upper, middle, and lower Danube), Danube delta, Danube River mouth (stations P128 and P177), and Black Sea (12 stations). Grey bars indicate the standard deviation for each area.
2.1.3 Rhine
The Rhine is the third largest river of Europe with a catchment area of 185 × 103 km2 and a length of 1320 km (Hoffmann et al., 2007). It can be divided into three hydrological areas: the upper Rhine (the Alpine region), the middle Rhine (German and French Rhine), and the lower Rhine (the delta region). The upper Rhine receives up to 2000 mm of precipitation per year, the middle Rhine is characterized by a temperate oceanic climate, with annual rainfall ranging from 570 to 1100 mm, and the lower Rhine receives an average of 800 mm of rain per year and has a temperate oceanic climate influenced by the North Sea and the Atlantic Ocean (Pfister et al., 2004).
Five sites along the middle Rhine were sampled (Fig. 3a): Karlsruhe (station of the Landesanstalt für Umwelt, Messungen und Naturschutz Baden-Württemberg), Mainz (station of the Landesamt für Umwelt, Wasserwirtschaft und Gewerbeaufsicht), Koblenz (station of Landesamt für Umwelt Rheinland-Pfalz), Cologne (Ecological Rhine Station of the University of Cologne), and Kleve-Bimmen (international monitoring station). A total of 62 L of river water was collected manually with a bucket at the side of the river at each station in March and September 2016. Of this 20 L was used for LCD analysis, 1 L for DNA analysis, 500 mL for chlorophyll analysis, and 40 L was used for stable carbon isotope incubations.
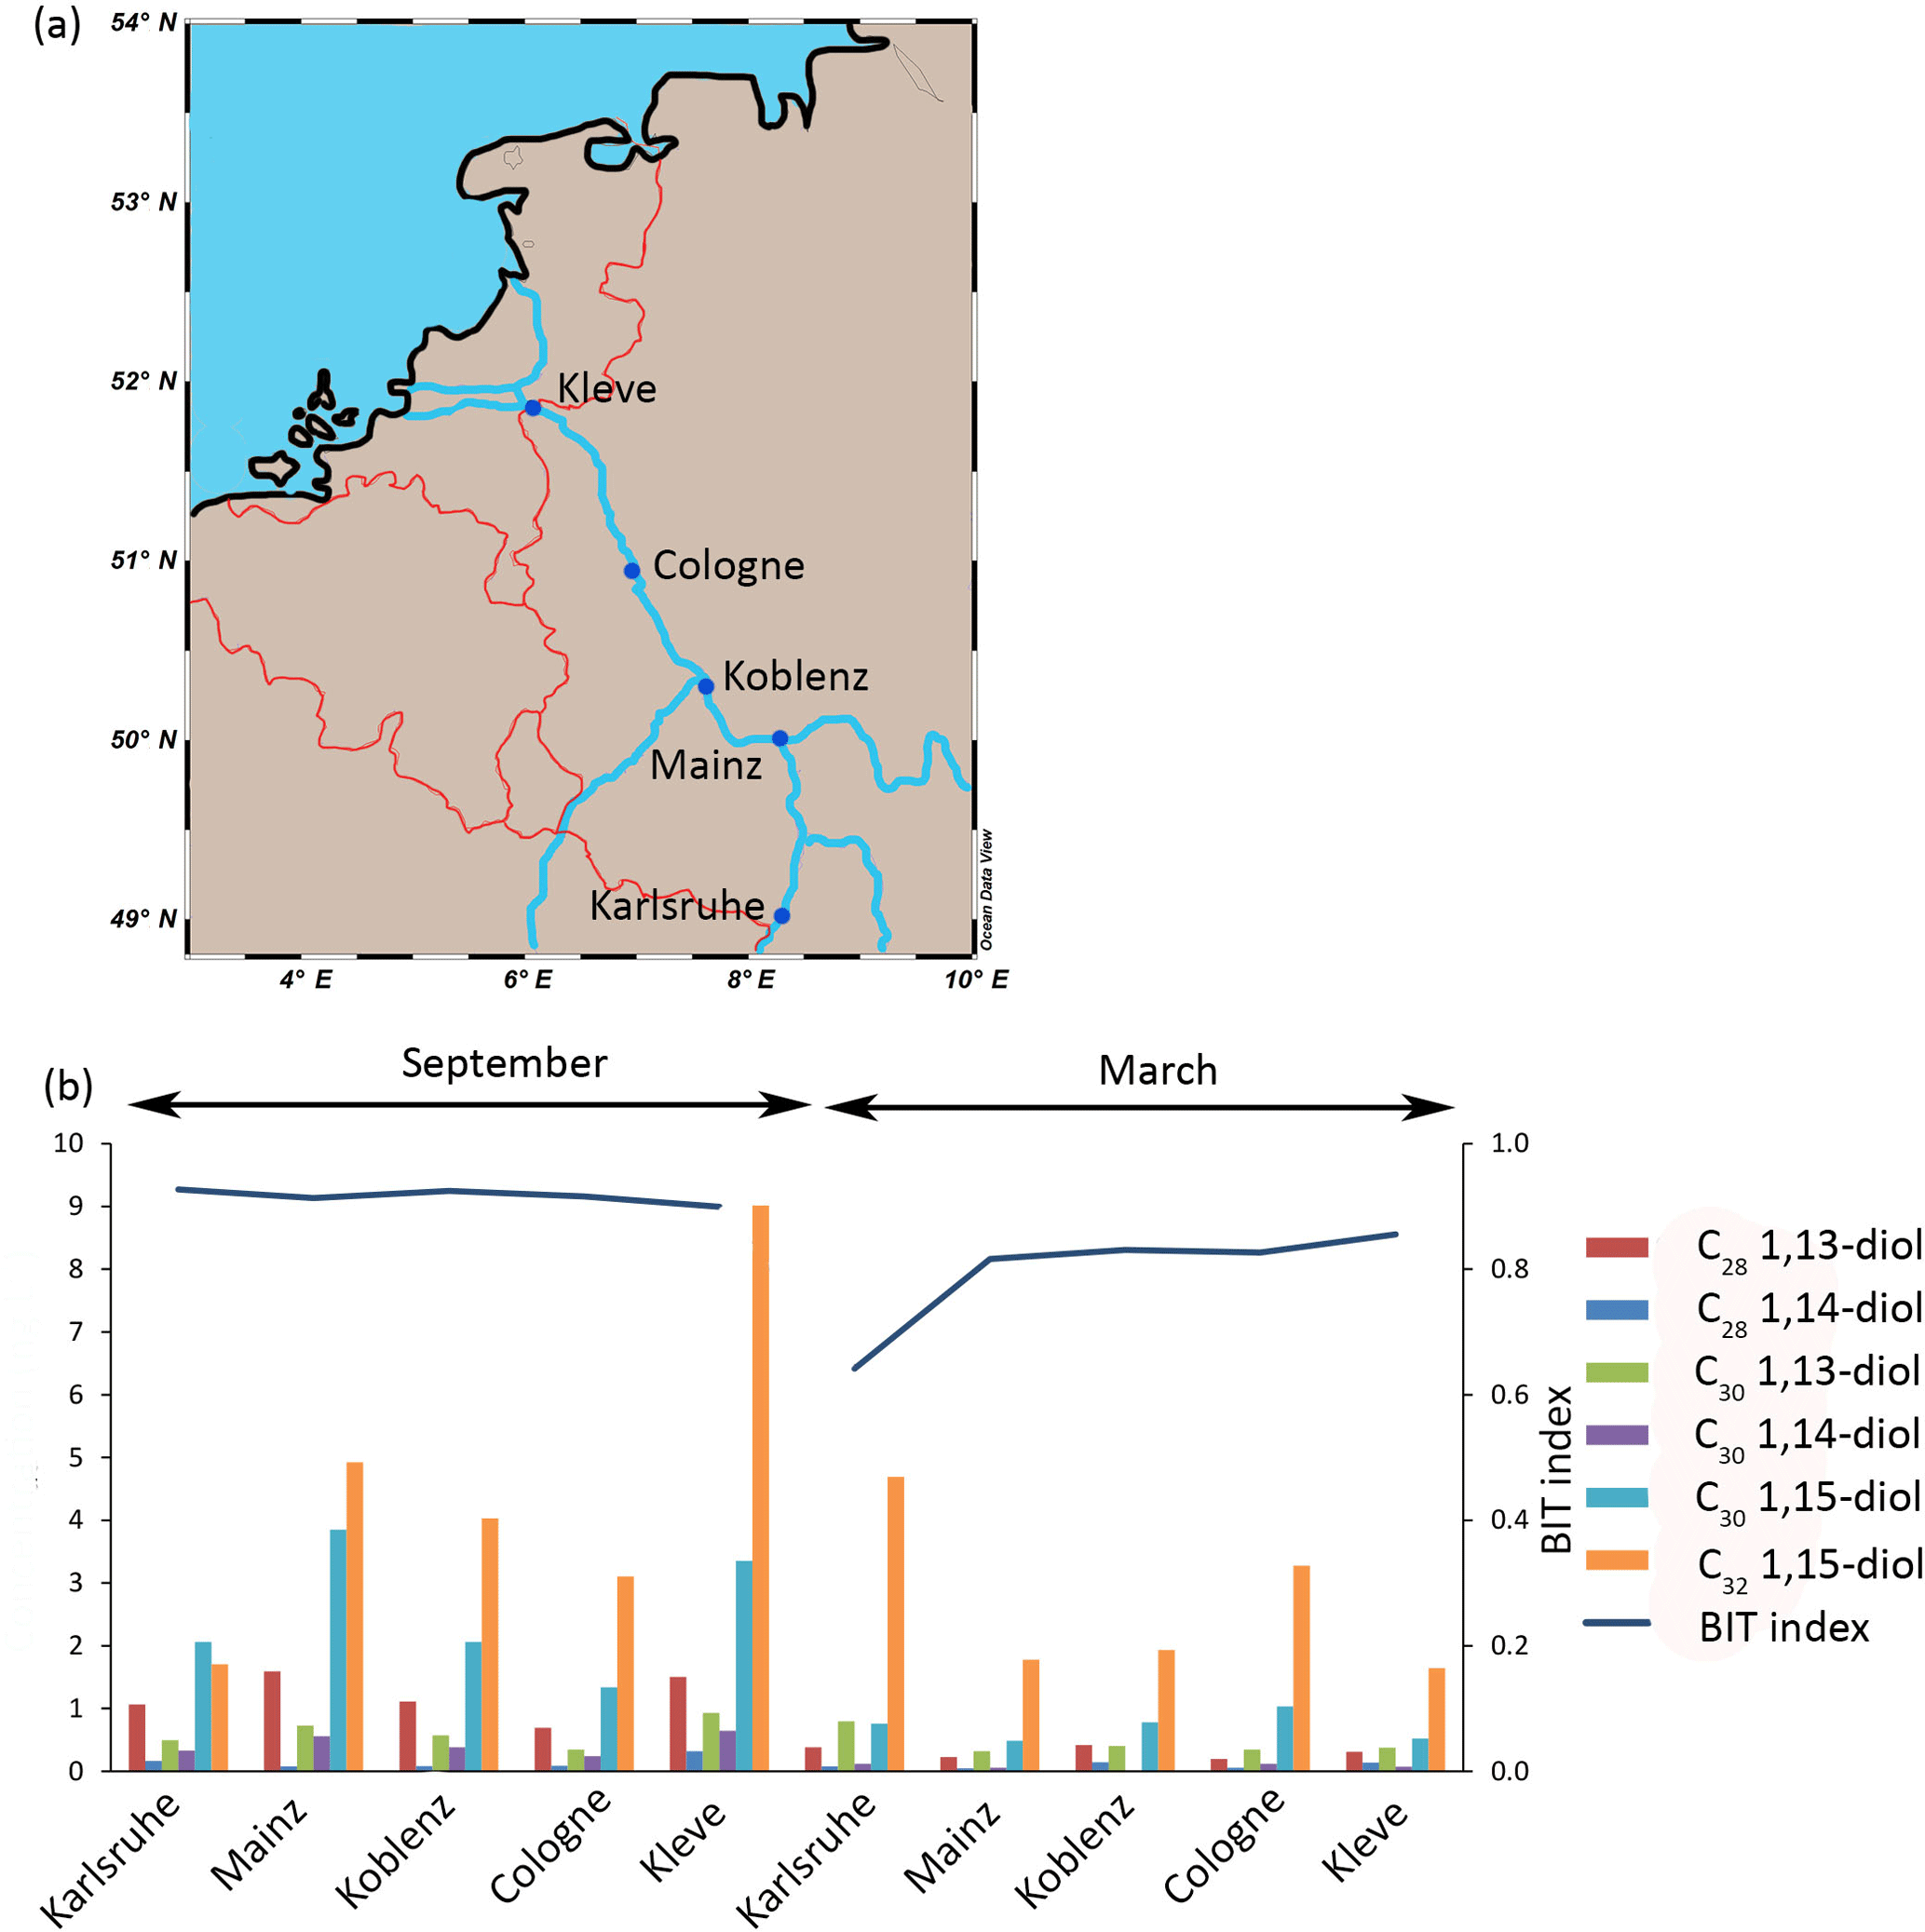
Figure 3(a) Location of the Rhine samples (n = 1 per site) and (b) concentration of LCDs and BIT values (September and March) in the Rhine SPM.
2.2 Methods
2.2.1 13C-labeling study
For the incubation experiments, two 20 L Nalgene bottles were filled with Rhine water and incubated in light at ambient air temperature during 52 h (day–night cycle) with 100 mg 13C-labeled bicarbonate (Cambridge Isotope Laboratories, Inc., USA). The bottles were shaken at the start of the incubation and then once a day to avoid particles sinking to the bottom of the bottle. The bottles were not sealed so gas exchange with the atmosphere was possible. The water was filtered using pre-ashed glass fiber filters (Whatman GF-F, 0.7 µm, 142 mm diameter) using a peristaltic pump (WTS, McLane Labs, Falmouth, MA). All samples were kept frozen at −20 ∘C.
2.2.2 Lipid extraction
Filters of the Rhine and the incubation experiment were base hydrolyzed with 12 mL of 1 N KOH in methanol (MeOH) solution by refluxing for 1 h. Afterwards the pH was adjusted to 4 with 2 N HCl : MeOH (1:1, v∕v) and the extract was transferred into a separatory funnel. The residues were further extracted once with MeOH : H2O (1:1, v∕v), twice with MeOH, and three times with dichloromethane (DCM). The extracts were combined in the separatory funnel and bidistilled water (6 mL) was added. The combined solutions were mixed, shaken, and separated into a MeOH : H2O and a DCM phase, after which the DCM phase was removed and collected into a centrifuge tube. The MeOH : H2O layer was re-extracted twice with 3 mL DCM. The pooled DCM layers were dried over a Na2SO4 column and the DCM was evaporated under a stream of nitrogen. The extract was then acid hydrolyzed with 2 mL of 1.5 N HCl in MeOH solution under reflux for 2 h. The pH was adjusted to 4 by adding 2 N KOH : MeOH. A total of 2 mL of DCM and 2 mL of bidistilled water were added to the hydrolyzed extract, mixed, and shaken and, after phase separation, the DCM layer was transferred into another centrifuge tube. The remaining aqueous layer was washed twice with 2 mL of DCM. The combined DCM layers were dried over a Na2SO4 column and the DCM was evaporated under a stream of nitrogen.
The SPM filters and riverbed sediments from the Godavari were freeze-dried, and river sediments were homogenized by milling. Both filters and riverbed sediments were extracted as described by Usman et al. (2018). Briefly, extraction was performed (3 ×) using an accelerated solvent extractor (ASE 350, Dionex, Thermo Scientific, Sunnyvale, CA, USA) with 9:1 (v∕v) DCM : MeOH at 100 ∘C and 7.6 × 10⁶ Pa. The extracts were dried under N2 and an 80 % aliquot was further processed for analysis. The samples from the Danube were extracted as described by Freymond et al. (2018) using microwave extraction (MARS) with 9:1 DCM : MeOH (v∕v, 25 min at 100 ∘C). The Meteor–Poseidon Black Sea surface sediments were extracted three times ultrasonically with a 9:1 DCM : MeOH (v∕v) solvent mixture after addition of 1.96 µg of C22 7,16-diol as the internal standard. The four Pelagia Black Sea surface sediments were extracted using an ASE with a DCM : MeOH mixture of 9:1 (v∕v) and a pressure of 7.6 × 10⁶ Pa at 100 ∘C.
2.2.3 Separation of the lipid extract
To the total lipid extracts of the Rhine SPM, the incubation experiment and the Pelagia Black Sea surface sediments an internal standard was added (C22 7,16-diol). They were subsequently separated into three fractions on an Al2O3 (activated for 3 h at 150 ∘C) column. The apolar fraction was eluted with four column volumes of 9:1 (v∕v) hexane (hex) : DCM, the ketone fraction with three column volumes of 1:1 (v∕v) hex : DCM, and the polar fraction (containing the diols) with three column volumes of 1:1 (v∕v) DCM : MeOH.
For all other samples, the C46 glycerol trialkyl glycerol tetraether (GDGT; Huguet et al., 2006) was added as an internal standard.
The Godavari SPM from the wet season and Danube total extracts were saponified with KOH in MeOH (0.5 M, 2 h at 70 ∘C). A total of 5 mL of Milli-Q water with NaCl was added and the neutral phase was back extracted with hexane and further separated into apolar and polar fractions on a SiO2 column with hex : DCM (9:1, v∕v) and DCM : MeOH (1:1, v∕v), respectively. For the Godavari River sediments and SPM from the dry season, the total extracts were saponified with KOH in MeOH (0.5 M, 2 h at 70 ∘C) and subsequently separated on a SiO2 column with hex : DCM (9:1, v∕v) and DCM : MeOH (1:1, v∕v). The Meteor–Poseidon surface sediment total extracts were saponified with KOH in MeOH at 80 ∘C for 2 h. The neutral fraction was recovered in hexane and separated into an apolar and a polar fraction by silica gel column chromatography using DCM : hex (2:1, v∕v) for the apolar and DCM : MeOH (1:1, v∕v) for the polar fraction.
2.2.4 Diol analysis
The polar fractions were transferred into gas chromatography (GC) vials and silylated with N,O-Bis(trimethylsilyl)trifluoroacetamide (BSTFA) and pyridine (10 µL each) and heated at 60 ∘C for 30 min, after which ethyl acetate was added. All diols except the Meteor–Poseidon Black Sea surface sediments were analyzed by gas chromatography (Agilent 7990B GC) coupled to mass spectrometry (Agilent 5977A MSD) (GC–MS) equipped with a fused silica capillary column (Agilent CP Sil-5, length 25 m; diameter 320 µm; film thickness 0.12 µm). The temperature program for the oven was as follows: started at 70 ∘C, increased to 130 ∘C at 20 ∘C min−1, increased to 320 ∘C at 4 ∘C min−1, held at 320 ∘C for 25 min. Flow was held constant at 2 mL min−1. The MS source was held at 250 ∘C and the quadrupole at 150 ∘C. The electron impact ionization energy of the source was 70 eV. The diols of the Meteor–Poseidon Black Sea surface sediment were analyzed by GC–MS using an Agilent 6850 GC instrument coupled to an Agilent 5975C MSD equipped with a fused silica capillary column (Restek Rxi-1ms; length 30 m; diameter 250 µm; film thickness 0.25 µm). The temperature program for the oven was as follows: held at 60 ∘C for 3 min, increased to 150 ∘C at 20 ∘C min−1, increased to 320 ∘C at 4 ∘C min−1, held at 320 ∘C for 15 min. Flow was held constant at 1.2 mL min−1. The MS source was held at 230 ∘C and the quadrupole at 150 ∘C. The electron impact ionization energy of the source was 70 eV.
The diols were identified and quantified via SIM (single-ion monitoring) of the m∕z = 299.3 (C28 1,14-diol), 313.3 (C28 1,13-diol, C30 1,15-diol), 327.3 (C30 1,14-diol), and 341.3 (C30 1,13-diol, C32 1,15-diol) ions (Versteegh et al., 1997; Rampen et al., 2012).
Absolute concentrations were calculated using the C22 7,16-diol as the internal standard for the Rhine SPM, Meteor–Poseidon and Pelagia surface sediments and the C46 glycerol dialkyl glycerol tetraether (GDGT) as the internal standard for the Godavari sediments and SPM and Danube SPM.
2.2.5 13C analysis of LCDs
LCDs in the polar fractions of the extracts of the SPM of the 13C incubation experiments were isolated using semi-preparative normal phase high-performance liquid chromatography (HPLC). Prior to injection the polar fraction was dissolved in 750 µL hex : isopropanol (99:1, v∕v) and filtered over a polytetrafluoroethylene (PTFE) filter (0.45 µm pore size). An amount of 3 × 250 µL was injected into an 1260 infinity LC system (Hewlett-Packard, Palo Alto, CA, USA) equipped with a thermostated autoinjector, column oven, and a Foxy R1 fraction collector (Teledyne ISCO, Lincoln, NE, USA) as described in De Bar et al. (2016). Briefly, the different diol isomers were separated over a normal phase semi-preparative Alltech Econosphere silica column (250 mm × 10 mm; 10 µm) at room temperature. After 35 min at 14 % A (hex : isopropanol, 9:1, v∕v) and 86 % B (hexane) the mobile phase was adjusted to 100 % A in 1 min. It was then held at 100 % A between 35 and 55 min. Finally, the column was reconditioned with 14 % A in hex at 3 mL min−1. The fractions were collected from 15 to 40 min every 30 s and analyzed by GC–MS as described above. The LCDs of interest were eluted between 22.5 and 27.5 min and were collected in three pools: pool 1 from 22.5 to 24.5 min (containing 100 % C32 1,15-diol and 95 % C30 1,15-diol), pool 2 from 25 to 26 min (containing 83 % C28 1,14-diol and 5 % C30 1,15-diol), and pool 3 from 26.5 to 27.5 min (containing 100 % C28 1,13-diol, 17 % C28 1,14-diol, and 100 % C30 1,13-diol). These pools were analyzed using gas chromatography–isotope ratio mass spectrometry (GC irMS, Thermo Finnigan DeltaPLUS isotope ratio monitoring mass spectrometer coupled to an Agilent 6890 GC instrument via a Combustion III interface). The gas chromatograph was equipped with a fused silica capillary column (25 m × 320 µm) coated with CP Sil-5 (film thickness = 0.12 µm) with helium as the carrier gas (2 mL min−1). The LCDs were silylated as described above using BSTFA with a known δ13C value of −32.2 ± 0.5 ‰. Subsequently, the LCDs were injected splitless at an oven temperature of 70 ∘C (injector temperature was 250 ∘C); then the oven was programmed to 130 ∘C at 20 ∘C min−1, and then at 20 to 320 ∘C min−1 at which it was held isothermally (10 min). The δ13C values were calculated by integrating the masses 44, 45, and 46 ion currents of the peaks produced by combustion of the chromatographically separated compounds and that of CO2 peaks produced by the CO2 reference gas with a known 13C content at the beginning and end of the analytical run. All samples were analyzed in triplicate and the average is reported.
2.2.6 Glycerol dialkyl glycerol tetraether (GDGT) analysis
GDGTs were analyzed from the polar fractions of the Rhine and Pelagia Black Sea surface sediments. Prior to GDGT analysis an aliquot of the polar fractions was filtered through a 0.45 µm PTFE membrane filter using hex : isopropanol (99:1, v∕v). Analyses were performed using Agilent 1260 ultra-high-pressure liquid chromatography (UHPLC) coupled to a 6130 quadrupole MSD in selected ion monitoring mode following the method described by Hopmans et al. (2016). The branched vs. isoprenoid tetraether (BIT) index was calculated according to Hopmans et al. (2004). This proxy reflects soil and river input into marine environments but is also affected by in situ marine production of brGDGT (De Jonge et al., 2014; Sinninghe Damsté et al., 2016).
2.2.7 18S rRNA gene sequencing analysis
The 18S rRNA gene sequencing analysis was performed exclusively on DNA extracted from the Rhine water. To this end, one-eighth of the DNA filter was extracted using the PowerSoil kit (Qiagen, Valencia, CA) following manufacturer's instructions. To amplify the eukaryotic V4 region of the 18S rRNA gene, we used the universal forward primer TAReuk454FWD1, V4F (5'-CCA GCA SCY GCG GTA ATT CC-3', S. cerevisiae position 565-584) and a reverse primer TAReuk454REV3, V4R (5′-ACTTTCGTTCTTGAT(C/T)(A/G)A-3′, S. cerevisiae position 964–981) from Stoeck et al. (2010). PCR reactions were performed on five replicates for each sample and each reaction included about 6 ng of DNA template, 1.75 µL of each primer, 25 µL of Master Mix Phusion, 1.5 µL of DMSO, and 19.25µL of deionized nuclease-free water for a total volume of 50 µL. Specifically, PCR consisted of an initial denaturation at 98 ∘C for 30 s, 11 × (98 ∘C for 10 s, 53 ∘C for 30 s, 72 ∘C for 30 s), and 17 × (98 ∘C for 10 s, 48 ∘C for 30 s, 7 ∘C for 30 s) as described in Logares et al. (2012). The PCR products were stained with SYBR® Safe (Life Technologies, the Netherlands) and visualized on a 1 % agarose gel. Bands were excised with a sterile scalpel and purified with QIAquick Gel Extraction Kit (Qiagen, Valencia, CA) following the manufacturer's instructions. Equimolar concentrations of the bar-coded PCR products were pooled and sequenced on the GS FLX Titanium platform (454 Life Sciences) by Macrogen Inc., South Korea.
To estimate the concentration of total 18S rRNA genes of the Rhine SPM we carried out qPCR using the same primers and the same cycling conditions as described above. The qPCR analysis was performed on a Bio-Rad CFX96TM Real-Time System/C1000 Thermal cycler equipped with CFX Manager software. Each reaction contained 12.5 µL of Master Mix Phusion, 8.25 µL of deionized nuclease-free water, 0.75 µL of DMSO, 1 µL from each primer, 0.5 µL of SYBR green, and 1 µL of DNA template. Reactions were performed on iCycler iQTM 96-Well plates (Bio-Rad). A mixture of V4 18S rRNA gene amplicons obtained as described above was used to prepare standard solutions. All qPCR reactions were performed in triplicate with standard curves from 640 to 6.4 × 10⁸ V4 18S rRNA molecules per microliter. Specificity of the qPCR was verified with melting curve analyses (50 to 95 ∘C).
2.2.8 Bioinformatic analyses
Bioinformatic analyses of the sequencing results were carried out using the bioinformatic pipeline Quantitative Insights Into Microbial Ecology (QIIME) (Caporaso et al., 2010). A total of 121 232 raw sequencing reads were cleaned and demultiplexed; then chimeras and singletons were removed as described previously (Balzano et al., 2015) for a final dataset consisting of 58 480 good-quality reads. Sequences were clustered into operational taxonomic units (OTUs) based on 97 % sequence identity. The dataset was then normalized by multiplying the percentage of reads with the concentration of V4 copies measured by qPCR. Relationships between LCDs and microbial eukaryotes were inferred by Spearman correlation analyses using the QIIME script observation_metadata_correlation.py and p values were corrected for false discovery rate (Benjamini and Hochberg, 1995).
2.2.9 Chlorophyll analysis
Rhine River water filters for pigment analysis were extracted following Holm-Hansen et al. (1965) and Arar and Collins (1997). Briefly, 20 mL of cold acetone was added to the filters and stored in the fridge overnight. Subsequently, they were sonicated for 2 min in an ice bath to avoid chlorophyll degradation and 10 mL was transferred into a centrifuge tube and centrifuged for 10 min at 4000 rpm. A total of 3 mL of the extract was then transferred into the observatory cuvette. The chlorophyll measurement was realized using a fluorescence spectrophotometer (Hitachi F-2500) calibrated with two standards containing 50 and 100 µg L−1 of chlorophyll a in acetone. Samples were measured one time to obtain Rb (fluorescence before acidification) and another time when two drops of a solution of 10 % hydrochloric acid were added to obtain Ra (fluorescence after acidification). Chlorophyll concentration was then calculated as follows:
where Chl a is the chlorophyll a concentration, and A and B are constants obtained by measuring the standards ( and ).
3.1 LCDs in the Godavari
The most abundant LCD in the SPM collected during the dry season is the C30 1,15-diol (average 500 ± 520 ng L−1, n = 18) followed by the C32 1,15-diol (200 ± 170 ng L−1, Fig. 1b). The C30 1,13- and C30 1,14-diols occur in substantially lower concentrations (30 ± 30 ng L−1 and 30 ± 20 ng L−1, respectively), whilst the C28 1,13- and C28 1,14-diols only occur in even lower concentrations (4 ± 5 ng L−1 and 4 ± 6 ng L−1, respectively; Fig. 1b). In the SPM collected during the wet season, the concentration of total LCDs is significantly higher than during the dry season (t test, p< 0.05). The C32 1,15-diol is the most abundant of the LCDs in the wet season SPM (Fig. 1b, 740 ± 710 ng L−1, n = 41), followed by the C30 1,15-diol (500 ± 530 ng L−1), with much lower concentrations of C30 1,13- and C30 1,14-diol (20 ± 10 and 30 ± 20 ng L−1, respectively).
In the Godavari riverbed sediments, the C32 1,15-diol and C30 1,15-diol are the most abundant LCDs. The C32 1,15-diol is higher in abundance in the sediments collected during the dry season than in the wet season sediments (330 ± 370 ng g−1, n = 30; 160 ± 240 ng g−1, n = 34, respectively; Fig. 1c) except for the wet season sediments from the Dowleswaram reservoir where the highest abundances are found (500 ± 80 ng g−1, n = 2).
3.2 LCDs in the Danube and Black Sea
In the Danube sediments the main LCD is also the C32 1,15-diol (3600 ± 1300 ng g−1, n = 51), followed by the C30 1,15-diol and the C30 1,13-diol (1500 ± 1000 ng g−1 and 500 ± 100 ng g−1, respectively). Furthermore, sediment from the Iron Gates reservoir shows the highest concentration (t test, p< 0.001) of C32 1,15-diol (5400 ng g−1, n = 1; Fig. 2b) in comparison with any of the other parts of the Danube River system (1500 ± 3200 ng g−1, n = 22 in the upper Danube; 3800 ± 2400 ng g−1, n = 14 in the middle Danube; 4400 ± 3400 ng g−1, n = 10 in the lower Danube; and 3000 ± 1400 ng g−1, n = 4 in the delta).
For the Black Sea sediments (n = 14) the C30 1,15-diol is the main LCD, with the two sediments from sites located closest to the river mouth (P128 and P177, Fig. 2a) having a lower fractional abundance of this diol (0.57) than all other sediments (0.80 of all LCDs). In the Black Sea sediments the main LCDs were the C30 1,15-diol (6500 ± 9000 ng g−1) followed by the C30 1,14-diol (1100 ± 1600 ng g−1).
3.3 LCDs in the Rhine
The main LCD in the SPM (n = 5 in March; n = 5 in September) of the Rhine is the C32 1,15-diol (2.7 ± 1.2 ng L−1 in March; 4.6 ± 2.5 ng L−1 in September) followed by the C30 1,15-diol (0.7 ± 0.2 ng L−1 in March; 2.5 ± 0.9 ng L−1 in September). The C30 1,13-diol (0.5 ± 0.2 ng L−1 in March; 0.6 ± 0.2 ng L−1 in September) and C28 1,13-diol (0.3 ± 0.1 ng L−1 in March; 1.2 ± 0.3 ng L−1 in September) are also present, while the C30 1,14-diol (0.1 ± 0 ng L−1 in March; 0.4 ± 0.2 ng L−1 in September) and C28 1,14-diol (0.1 ± 0 ng L−1 in March and 0.2 ± 0.1 ng L−1 in September) are only minor compounds. The concentration of the C32 1,15-diol was the highest at the sampling location in Karlsruhe in September with 9.1 ng L−1 (see Fig. 3b) and varies from 1.6 to 9.1 ng L−1 for all sites, while the C30 1,15-diol varies from 1.0 to 7.6 ng L−1. The LCD concentration is significantly higher in September than in March (sum of all diols is 9.4 ± 3.8 ng L−1 and 4.3 ± 1.5 ng L−1, respectively, p< 0.001). The BIT index varies from 0.64 to 0.93 (Fig. 3b), and is higher in September than in March (average 0.92 ± 0.01 and 0.79 ± 0.02, respectively). In March there is an increase in the BIT index downstream (0.64 in Karlsruhe to 0.86 in Kleve) but it remains constant in September. The chlorophyll concentrations vary from 1 to 6 µg L−1 and peak in September at most locations (4 ± 2 and 3 ± 1 µg L−1 in September and March, respectively), indicating a small seasonal trend.
We sequenced the 18S rRNA gene from the Rhine SPM using universal eukaryote primers. Overall the libraries were dominated by reads affiliated to Opisthokonta (31 %), Stramenopiles (28 %), Hacrobia (24 %), and Alveolata (10 %) (see Fig. 2 in the Supplement). All the LCD-producing phytoplankton known to date (Eustigmatophyceae, Proboscia spp., and Apedinella radians) are affiliated to the Stramenopile supergroup, and the Stramenopiles found here mostly include diatoms and Chrysophyceae. However, the diatom OTUs most closely related to Proboscia belong to the genera Melosira, Aulacoseira, and Actinocyclus, which have never been reported to contain LCDs. The presence of LCDs within Chrysophyceae has also never been determined.
One eustigmatophyceaen OTU (denovo161 Monodus guttula, Supplement 3) represented by two reads (one in Koblenz and one in Kleve in September) and five 18S rRNA gene reads (one in Cologne in March, three in Mainz, one in Koblenz, and two in Kleve in September) associated with two OTUs from Pedinellales (denovo18 unidentified Pedinellales and denovo338 Pseudopedinella sp., Supplement 3) were found in the Rhine SPM. The concentration of 18S rRNA genes varied between 2.7 ± 0.1 × 10⁷ and 1.0 ± 0.1 × 10⁸ copies L−1 in March and 1.6 ± 0.1 × 10⁷ and 4.7 ± 0.7 × 10⁷ copies L−1 in September (Fig. 5c and Supplement 1). Spearman rank correlation analyses performed using QIIME indicate that none of the OTUs found here exhibit significant correlation with LCDs (data not shown).
4.1 Where are LCDs produced in rivers?
For the different river systems a link between water conditions and LCD concentrations can often be observed. In particular, for the Godavari SPM there is a higher concentration of LCDs in the SPM from the wet season compared to that of the dry season (1900 ± 1000 ng L−1 vs. 570 ± 260 ng L−1, respectively). The Godavari sediments collected during the dry season have a higher concentration of LCDs (t test, p< 0.05) than the riverbed sediments from the wet season, opposite to what is observed in the SPM. During the wet season, the Godavari is more turbid and has a higher flow velocity. This high turbidity of the river water (Balakrishna and Probst, 2005; Syvitsky and Saito, 2007) may reduce LCD production as this limits light availability and therefore algal productivity. However, the higher concentration of LCDs observed in the SPM during the wet season indicates that this explanation is likely not valid. Alternatively, the low concentration of LCDs in the wet season sediments could be due to the high flow velocity of the river water that prevents the LCDs formed in the rivers from being deposited in the riverbed sediments.
During the wet season, the C32 1,15-diol is present in significantly (t test, p< 0.001) higher quantities in the sediments of the Dowleswaram reservoir (500 ± 80 ng g−1) compared to other parts of the river system, indicating that either the C32 1,15-diol production is enhanced in the reservoir or the C32 1,15-diol is transported from upstream and accumulates within the reservoir. In the reservoir, both SPM and sediments have a higher organic carbon content compared to the rest of the river, whereas the suspended particle load is only slightly lower (Usman et al., 2018), which could be explained by contribution of primary produced organic carbon. This suggests that increased production of the C32 1,15-diol is facilitated by the calm stagnant conditions in the reservoir. Similarly, in the Danube system the highest concentration of the C32 1,15-diol is also found in a calm and stagnant water area: the Iron Gates reservoir (5500 ng g−1 vs. 3200 ± 1100 ng g−1 on average for the rest of the catchment, Fig. 2b).
Pradhan et al. (2014) reported a major input (i.e., 40–45 %) of organic matter from freshwater algae in sediments from the Upper Godavari, based on the C ∕ N ratio and δ13C values of the sedimentary organic carbon, suggesting optimal conditions for aquatic production in impoundments in this driest part of the river basin. Indeed, significantly (t test, p< 0.05) higher concentrations of the C32 1,15-diol are found in the Upper Godavari sediments collected during the dry season compared to the rest of the catchment, indicating that low flow, calm, and stagnant water conditions are optimal for C32 1,15-diol production.
Collectively, our results suggest that LCDs and especially the C32 1,15-diol are preferentially produced in relatively calm and stagnant areas of river systems.
4.2 River vs. marine LCDs
During the dry season, the SPM in the delta of the Godavari exhibits a LCD distribution significantly (t test, p< 0.05) deviating from the general distribution in river SPM and sediments, i.e., the LCDs are dominated by the C30 1,15-diol (fractional abundance of 0.74 ± 0.14 for the delta vs. 0.47 ± 0.16 for the rest of the river in the dry season) rather than the C32 1,15-diol. This dominance of the C30 1,15-diol is different from LCD distributions usually found in rivers (De Bar et al., 2016; Lattaud et al., 2017a, this study) but similar to that observed in tropical marine sediments (Rampen et al., 2014a; Lattaud et al., 2017a). This suggests a marine influence on the LCDs in the delta during the dry season. Indeed, the electrical conductivity of the delta river water in this season is typical for brackish water (Gupta et al., 1997; Sarma et al., 2009, 2010). The electrical conductivity decreases land inwards, indicating that the influence of marine waters is substantially reduced upstream.
The LCD distributions in the Black Sea sediments are also dominated by the C30 1,15-diol (fractional abundance >0.9, Fig. 2c), whereas the C32 1,15-diol is the most abundant diol in the sediments of the Danube. The fractional abundance of the C32 1,15-diol decreases with increasing distance from the river mouth as do the values for the BIT index (Fig. 2c). This decrease in C32 1,15-diol abundance is similar to that observed in the delta of the Godavari River during the dry season, but can now be followed along a much larger gradient; the Black Sea sediment has a clear marine signal (BIT = 0.06 ± 0.03, n = 12, this study; Kusch et al., 2016) with a dominant C30 1,15-diol, whereas the Danube River is dominated by the C32 1,15-diol and has an average BIT index value of 0.91 ± 0.04 (n = 43; Freymond et al., 2017).
To visualize the differences between marine and river LCD distributions, a ternary plot was generated with the poles representing the different fractional abundances of the LCDs: C30 1,15-diol, C32 1,15-diol, and the sum of C30 1,13 and C28 1,13-diols (Fig. 4a). The 1,14-diols were excluded from this plot as they likely have a different biological source (Sinninghe Damsté et al., 2003; Rampen et al., 20011, 2014b). Data from the river SPM from this study have been included as well as river SPM and sediments from Lattaud et al. (2017a) and lake sediments from Rampen et al. (2014b). For the marine dataset, the marine sediments from the studies of Lattaud et al. (2017b), Rampen et al. (2012), and De Bar et al. (2016) were used. This ternary diagram shows that river SPM and sediments, as well as the lake sediments, contain a higher proportion of C32 1,15-diol than open marine surface sediments, where their fractional abundance is nearly always <10 %. This major difference in the distribution of LCDs in marine and freshwater environments suggests that LCDs are likely produced by different organisms in freshwater and marine systems (see Lattaud et al., 2017a). This difference is useful to differentiate river-influenced sediments and marine sediment (see Lattaud et al., 2017b).

Figure 4Ternary plot (C28 1,13-diol; C30 1,13- and C30 1,15-diols; C32 1,15-diol) of (a) marine sediments (from Rampen et al., 2012; De Bar et al., 2016; Lattaud et al., 2017b), river sediments (this study, Lattaud et al., 2017a), lake sediment (from Rampen et al., 2014b), river SPM (this study, Lattaud et al., 2017a), (b) cultivated algae (Rampen et al., 2014b), and river SPM (this study, Lattaud et al., 2017a).
4.3 Who is producing LCDs in river systems?
4.3.1 Comparison with culture data
In all of the three river systems investigated here the C32 1,15-diol is the major diol (average fractional abundance of 0.47 ± 0.17 for Danube, Rhine, and Godavari), followed by the C30 1,15-diol (0.31 ± 0.21) (Figs. 1–3). To constrain potential biological producers of the LCDs, the LCD distributions in river SPM from this study and those of Lattaud et al. (2017a) and De Bar et al. (2016) were plotted in another ternary diagram (Fig. 4b), along with the LCD distribution of cultured eustigmatophyte algae (data from Rampen et al., 2014b). This diagram uses the fractional abundances of C28 1,13-diol and C32 1,15-diol and the sum of the C30 1,13- and C30 1,15-diols. SPM from delta regions with a clear marine contribution was excluded, i.e., SPM with low BIT values (BIT < 0.3).
Most of the river LCD distributions are similar to the LCD distribution of Goniochloris sculpta from the Goniochloridaceae family, especially for the Rhine (this study), Danube (this study), and Tagus (data from De Bar et al., 2016). However, LCD distributions in rivers from a tropical region such as the Godavari and Amazon do not plot close to this species (Rampen et al., 2014b). This observation may point to a role of temperature in the distribution of LCDs, or to different producers in tropical freshwater systems. However, there is no significant correlation between the fractional abundance (excluding 1,14-diols) of the C32 1,15-diol, or other diols, in rivers and mean annual air temperature of the river catchment (r2= 0.002, p= 0.6). This is in contrast to the study of Rampen et al. (2014b), in which a positive relation between the growth temperature of cultures of eustigmatophyte families and the fractional abundance of C32 1,15-diol was observed. Potentially, this difference could be due to the fact that we are using mean annual air temperature and not in situ river temperatures.
Villanueva et al. (2014) determined the diversity and abundance of specific eustigmatophyte algae using 18S rRNA gene sequences of the SPM at different water depths in Lake Chala, tropical East Africa. Villanueva et al. (2014) found 214 eustigmatophycean sequences affiliated to five distinct phylogenetic clades, one of which was affiliated to the Goniochloridaceae family, and four novel groups, two of which were closely related to the Monodopsidaceae and Eustigmatophyceae families. This suggests a role of novel uncultured Eustigmatophyceae in LCD production in riverine ecosystems. Furthermore, they quantified LCDs in monthly sediment trap material from the middle of the lake and observed that LCD distributions varied on a seasonal basis. The proportion of C32 1,15-diol was highest in February and June, while C30 1,15-diol dominated in April, indicating separate blooms of different LCD producers. Our results suggest that there are potentially unknown eustigmatophycean LCD producers in river systems or that there may be multiple LCD producers, depending on the season and the location.
4.3.2 18S rRNA gene sequencing analysis of SPM in the Rhine
An alternative approach to comparing culture data to lipid distribution for identifying producers of LCDs is to analyze the DNA composition of river water in which LCDs are detected (see Villanueva et al., 2014). To characterize the producers of the 1,13- and 1,15-diols, we sequenced the V4 region of the 18S RNA gene in the SPM from the Rhine using 454 sequencing. This sequencing effort yielded ca. 60 000 reads for the pooled samples (see Supplement 3) but we only detected three OTUs and nine reads associated with potential LCD producers. Indeed, the near absence of eustigmatophyte reads in the Rhine SPM (Fig. 5a) suggests that they are not the major producers of LCDs. Also, dichtyochophytes were not detected in all the SPM in contrast to LCDs. There is no correlation between the OTUs found in the Rhine River and the concentration of 1,13- and 1,15-diols.
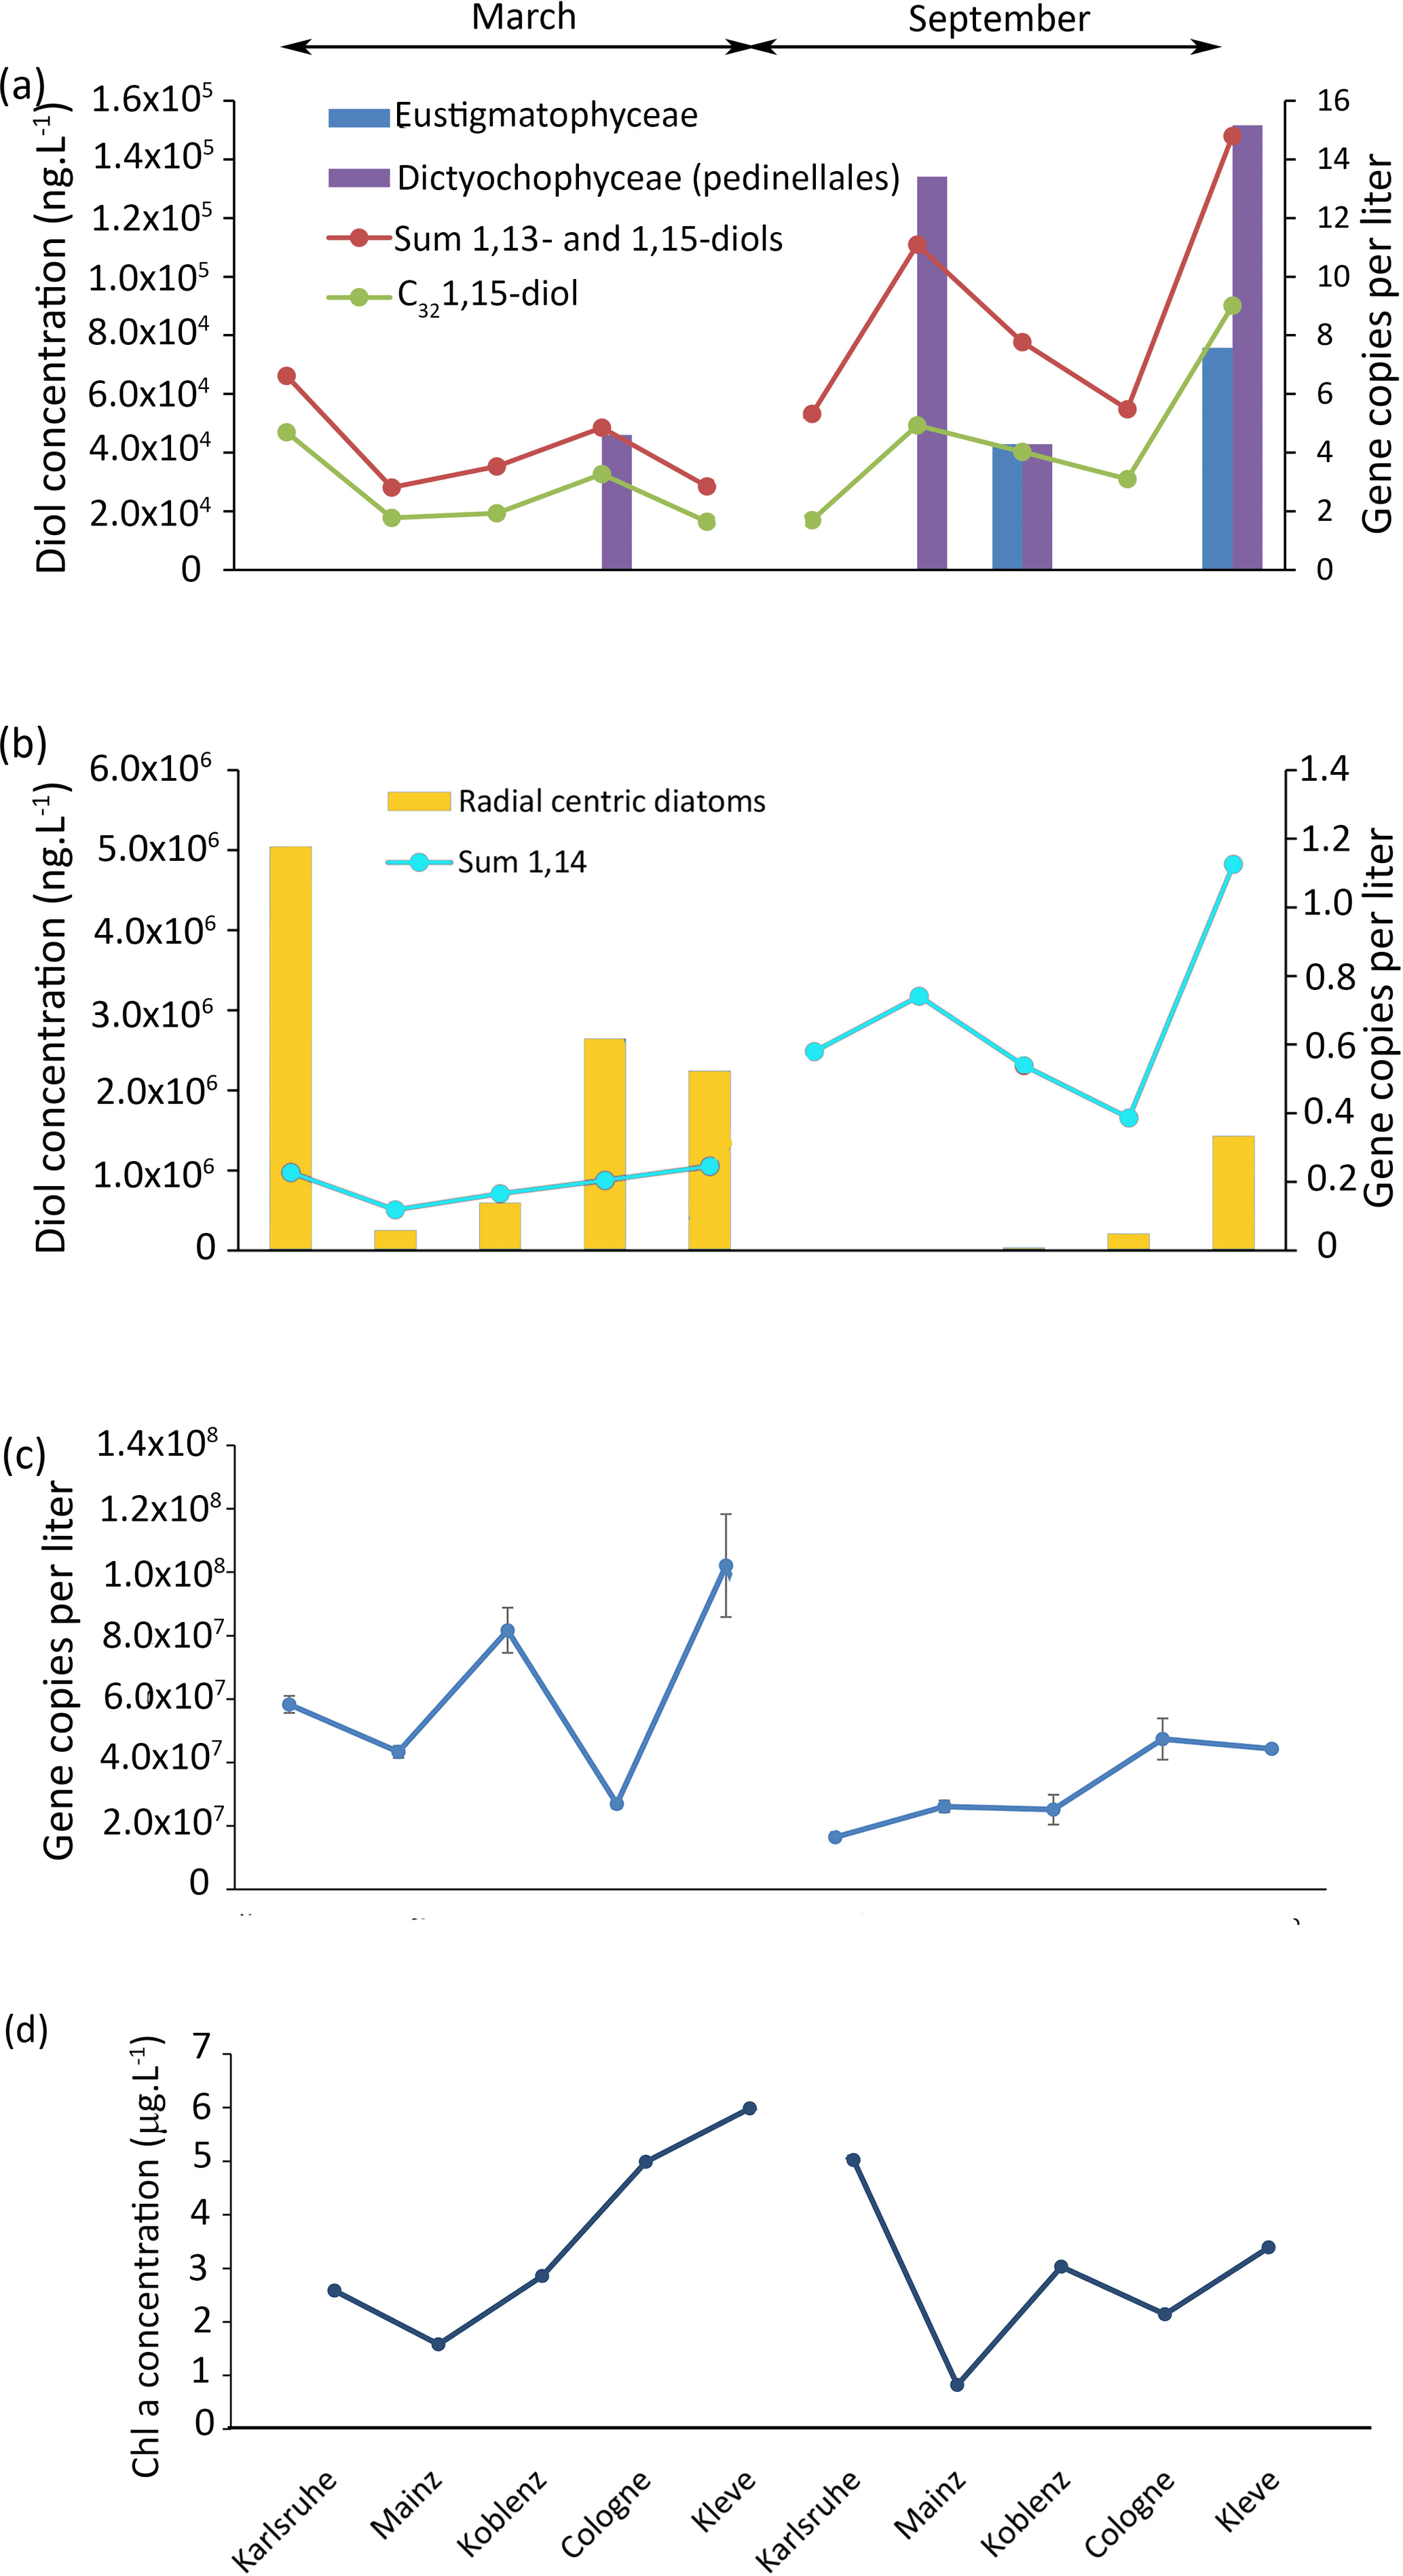
Figure 5Results of the 18S rRNA analysis of the Rhine water, (a) gene copy per liter of eustigmatophytes and dictyochophytes and concentration of 1,13- and 1,15-diols as well as concentration of the C32 1,15-diol. (b) Gene copy number per liter of radial centric diatoms and concentration of 1,14-diols. (c) Total gene copy per liter and (d) chlorophyll a concentration.
To pinpoint the producers of the 1,14-diols, we investigated the diatom distribution in the Rhine water. Proboscia, the only currently known diatom genus producing 1,14-diols (Sinninghe Damsté et al., 2003; Rampen et al., 2014b), contains marine species (Moita et al., 2003; Lassiter et al., 2006; Takahashi et al., 2011) and, consistently, was not detected in our libraries. Other genera from the same group as Proboscia (radial centric diatoms) were found at all sites in March, and are also found in Karlsruhe and Mainz in September (Fig. 5b). To establish whether these diatoms represent a potential source of 1,14-diols, we estimated their abundance by quantifying the concentration of total 18S rRNA gene copies multiplied with the percentage of each OTU of the total reads. However, there is no correlation between the concentration of 1,14-diols and the number of gene copies per liter of radial centric diatoms (r2=0.08; p value = 0.4).
4.3.3 Are LCDs coming from dead organic matter or in situ living organisms?
Interestingly, there is no significant correlation (r2= 0.2, p=0.2) between the concentration of chlorophyll a (Fig. 5d) and the concentration of total LCDs, 1,14-diols, or 1,13- plus 1,15-diols (Fig. 5a, b); i.e., there is no apparent link between primary production and LCD production. The lack of correlation between LCDs and both OTUs and Chl a suggests that the LCDs in the Rhine are either not produced in situ or are derived from unknown organisms (Villanueva et al., 2014).
To distinguish if the LCDs are a part of dead organic matter, we performed an incubation experiment using 13C-labeled bicarbonate. After 52 h, 13C incorporation was detected in lipids such as β-sitosterol ( 120 ‰), indicating uptake by phytoplankton. However, at the same time, we did not detect any incorporation of 13C in LCDs, suggesting that the incubation time may be too short for LCD producers to take up the 13C or that the LCDs are not synthesized in situ during the time of sampling. If LCD producers are photosynthetic eukaryotes as indicated by culture studies (Volkman et al., 1999; Rampen et al., 2007, 2014b), then the incubation time used in the experiment should be sufficient for them to take up the 13C bicarbonate dissolved in the water. This suggests that LCDs are likely not synthesized at any of the sampling locations of the Rhine.
The absence of in situ LCD production could be due to the high flow velocity at these sampling sites. As also observed in the Godavari and Danube, the high flow velocity areas show a lower abundance of LCDs, while low flow areas show a higher abundance of LCDs. It is likely that LCDs in the Rhine would be produced in more stagnant waters like in lakes, or dead river branches, and that they would be more abundant in these areas. Thus, LCDs, which are likely degraded more slowly than DNA, reflect a fossil signal, while the DNA reflects an in situ signal. Similarly, Villanuaneva et al. (2014) showed that, while LCDs were abundantly present in the surface water of Lake Chala, the DNA of eustigmatophytes could not be detected.
We studied three river systems to determine where LCDs are produced in rivers, if their distribution is different from that of marine LCDs, and to constrain their producers. Confirming previous results, riverine LCDs show a striking difference in distribution from marine LCDs as they are characterized by a high fractional abundance of the C32 1,15-diol (> 40 %), while marine LCDs have generally more of the C30 1,15-diol (> 50 %). The C32 1,15-diol is more abundant in calm stagnant waters than in fast-flowing parts of the rivers, indicating that they are likely produced in calmer water. Comparison of LCD distributions of Eustigmatophyceae cultures with those in rivers indicate that Goniochloris species might be important 1,13- and 1,15-diol producers in some river systems. The 18S rRNA gene analysis of one of these rivers, the Rhine, did not, however, lead to any identification of this species, nor did a labeling study using bicarbonate lead to labeling of LCDs. This might indicate that LCDs in fast-flowing parts of rivers are not derived from in situ living plankton but from plankton residing in stagnant waters of these river systems such as lakes or side ponds.
All data are in the Supplement.
The supplement related to this article is available online at: https://doi.org/10.5194/bg-15-4147-2018-supplement.
The authors declare that they have no conflict of interest.
The anonymous reviewer and Julien Planq are thanked for their comments, which improved the paper. We thank Gabriella Weiss, Anchelique Mets, Kirsten Kooijman, and Jort Ossebaar for analytical help. Heike Robakowski and the LUBW Landesanstalt für Umwelt, Messungen und Naturschutz Baden-Württemberg, Peter Diehl and the LUWG, Helmut Fisher and the Landesamt für Umwelt Rheinland-Pfalz, Georg Becker and the University of Cologne, Jochen Lacombe and the Internationale Messstation Bimmen-Lobith, and Sophie Reiche for providing help with the sampling. Huub Zwart, Chris Martes (UU), Muhammed Usman (ETH), and Sayak Basu (IISER Kolkata) are thanked for help in the field during Godavari fieldwork; we thank the captain and crew of the R/V Pelagia of cruises 64PE408 and 64PE418.
This research has been funded by the European Research Council (ERC) under
the European Union's Seventh Framework Program (FP7/2007–2013) ERC grant
agreement (339206) to Stefan Schouten. The work was further supported by funding from the
Netherlands Earth System Science Center (NESSC) through a gravitation grant
(NWO 024.002.001) from the Dutch Ministry for Education, Culture and Science
to Jaap S. Sinninghe Damsté, Ellen C. Hopmans and Stefan Schouten. The Godavari River project was funded by
NWO-Veni grant no. 863.13.016 to Francien Peterse. The Danube River project (“CAPS-LOCK”
and “CAPS-LOCK2”; no. 200021_140850) was supported by the
Swiss National Science Foundation SNF by a grant to Francien Peterse.
Edited by: Xinming Wang
Reviewed by: Julien
Plancq and one anonymous referee
Arar, E. J. and Collins, G. B.: In Vitro Determination of Chlorophyll-a and Pheophytin-a in Marine and Freshwater Algae by Fluorescence, Environmental Protection Agency (EPA), Method 445.0, Cincinnati, 1997.
Balakrishna, K. and Probst, J. L.: Organic carbon transport and C∕N ratio variations in a large tropical river: Godavari as a case study, India, Biogeochemistry, 73, 457–473, https://doi.org/10.1007/s10533-004-0879-2, 2005.
Balzano, S., Abs, E., and Leterme, S. C.: Protist diversity along a salinity gradient in a coastal lagoon, Aquatic Microbial Ecol., 74, 263–277, https://doi.org/10.3354/ame01740, 2015.
Benjamini, Y. and Hochberg, Y.: Controlling the false discovery rate. A practical and powerful approach to multiple testing, J. Roy. Stat. Soc. B. Met., 57, 289–300, 1995.
Biksham, G. and Subramanian, V.: Sediment transport of the Godavari River basin and its controlling factors, J. Hydrol., 101, 275–290, https://doi.org/10.1016/0022-1694(88)90040-6, 1988.
Caporaso, J. G., Kuczynski, J., Stombaugh, J., Bittinger, K., Bushman, F. D., Costello, E. K., Fierer, N., Pena, A. G., Goodrich, J. K., Gordon, J. I., Huttley, G. A., Kelley, S. T., Knights, D., Koenig, J. E., Ley, R. E., Lozupone, C. A., McDonald, D., Muegge, B. D., Pirrung, M., Reeder, J., Sevinsky, J. R., Tumbaugh, P. J., Walters, W. A., Widmann, J., Yatsunenko, T., Zaneveld, J., and Knight, R.: QIIME allows analysis of high-throughput community sequencing data, Nat. Methods, 7, 335–336, https://doi.org/10.1038/nmeth.f.303, 2010.
Castañeda, I. S., Werne, J. P., Johnson, T. C., and Powers, L. A.: Organic geochemical records from Lake Malawi (East Africa) of the last 700 years, part II: Biomarker evidence for recent changes in primary productivity, Palaeogeogr. Paleoclim. Palaeocl., 303, 140–154, https://doi.org/10.1016/j.palaeo.2010.01.006, 2011.
De Bar, M., Dorhout, D. J. C., Hopmans, E. C., Sinninghe Damsté, J. S., and Schouten, S.: Constraints on the application of long chain diol proxies in the Iberian Atlantic margin, Org. Geochem., 101, 184–195, https://doi.org/10.1016/j.orggeochem.2016.09.005, 2016.
De Jonge, C., Stadnitskaia, A., Hopmans, E. C., Cherkashov, G., Fedotov, A., and Sinninghe Damsté, J. S.: In situ produced branched glycerol dialkyl glycerol tetraethers in suspended particulate matter from the Yenisei River, Eastern Siberia, Geochim. Cosmochim. Acta, 125, 476–491, https://doi.org/10.1016/j.gca.2013.10.031, 2014.
Freymond, C. V., Peterse, F., Fischer, L. V., Filip, F., Giosan, L., and Eglinton, T. I.: Branched GDGT signals in fluvial sediments of the Danube River basin: Method comparison and longitudinal evolution, Org. Geochem., 103, 88–96, https://doi.org/10.1016/j.orggeochem.2016.11.002, 2017.
Freymond, C. V., Kundig, N., Stark, C., Peterse, F., Buggle, B., Lupker, M., Platze, M., Blattmann, T. M., Filip, F., Giosan, L., and Eglinton, T. I.: Evolution of biomolecular loadings along a major river system, Geochim. Cosmochim. Act., 223, 389–404, https://doi.org/10.1016/j.gca.2017.12.010, 2018.
Gal, J.-K., Kim, J.-H., and Shin, K.-H.: Distribution of long chain alkyl diols along a south-north transect of the northwestern Pacific region: Insights into a paleo sea surface nutrient proxy, Org. Geochem., 119, 80–90, https://doi.org/10.1016/j.orggeochem.2018.01.010, 2018.
Gogou, A. and Stephanou, E. G.: Marine organic geochemistry of the Eastern Mediterranean: 2. Polar biomarkers in Cretan Sea surficial sediments, Mar. Chem., 85, 1–25, https://doi.org/10.1016/j.marchem.2003.08.005, 2004.
Gupta, L. P., Subramanian, V., and Ittekkot, V.: Biogeochemistry of particulate organic matter transported by the Godavari River, India, Biogeochemistry, 38, 103–128, https://doi.org/10.1023/A:1005732519216, 1997.
Hoffmann, T., Erkens, G., Gerlach, R., Klostermann, J., and Lang, A.: Trends and controls of Holocene floodplain sedimentation in the Rhine catchment, Catena, 77, 96–106, https://doi.org/10.1016/j.catena.2008.09.002, 2007.
Holm-Hansen, O., Lorenzen, C. J., Holmes, R. W., and Strickland, J. D. H.: Fluorometric determination of chlorophyll, ICES J. Mar. Sci., 30, 3–15, https://doi.org/10.1093/icesjms/30.1.3, 1965.
Hopmans, E. C., Weijers, J. W. H., Schefuß, E., Herfort, L., Sinninghe Damsté, J. S., and Schouten, S.: A novel proxy for terrestrial organic matter in sediments based on branched and isoprenoid tetraether lipids, Earth Planet. Sc. Lett., 224, 107–116, https://doi.org/10.1016/j.epsl.2004.05.012, 2004.
Hopmans, E. C., Schouten, S., and Sinninghe Damsté, J. S.: The effect of improved chromatography on GDGT-based palaeoproxies, Org. Geochem., 93, 1–6, https://doi.org/10.1016/j.orggeochem.2015.12.006, 2016.
Huguet, C., Hopmans, E. C., Febo-Ayala, W., Thompson, D. H., Sinninghe Damsté, J. S., and Schouten, S.: An improved method to determine the absolute abundance of glycerol dibiphytanyl glycerol tetraether lipids, Org. Geochem., 37, 1036–1041, https://doi.org/10.1016/j.orggeochem.2006.05.008, 2006.
Kusch, S., Rethemeyer, J., Schefuß, E., and Mollenhauer, G.: Controls on the age of vascular plant biomarkers in Black Sea sediments, Geochim. Cosmochim. Act., 74, 7031–7047, https://doi.org/10.1016/j.gca.2010.09.005, 2010.
Kusch, S., Rethemeyer, J., Hopmans, E.C., Wacker, L., and Mollenhauser, G.: Factors influencing 14C concentrations of algal and archaeal lipids and their associated sea surface temperature proxies in the Black Sea, Geochim. Cosmochim. Ac., 188, 35–57, https://doi.org/10.1016/j.gca.2016.05.025, 2016.
Lassiter, A. M., Wilkerson, F. P., Dugdale, R. C., and Hogue, V. E.: Phytoplankton assemblages in the CoOP-WEST coastal upwelling area, Deep-Sea Res. Pt. II, 53, 3063–3077, https://doi.org/10.1016/j.dsr2.2006.07.013, 2006.
Lattaud, J., Kim, J.-H., De Jonge, C., Zell, C., Sinninghe Damsté, J. S., and Schouten, S.: The C32 alkane-1,15-diol as a tracer for riverine input in coastal seas, Geochim. Cosmochim. Ac., 202, 146–158, https://doi.org/10.1016/j.gca.2016.12.030, 2017, 2017a.
Lattaud, J., Dorhout, D., Schulz, H., Castañeda, I. S., Schefuß, E., Sinninghe Damsté, J. S., and Schouten, S.: The C32 alkane-1,15-diol as a proxy of late Quaternary riverine input in coastal margins, Clim. Past, 13, 1049–1061, https://doi.org/10.5194/cp-13-1049-2017, 2017b.
Logares, R., Audic, S., Santini, S., Pernice, M. C., de Vargas, C., and Massana, R.: Diversity patterns and activity of uncultured marine heterotrophic flagellates unveiled with pyrosequencing, ISME J., 6, 1823–1833, https://doi.org/10.1038/ismej.2012.36, 2012.
Moita, M. T., Oliveira, P. B., Mendes, J. C., and Palma, A. S.: Distribution of chlorophyll a and Gymnodinium catenatum associated with coastal upwelling plumes off central Portugal, Acta. Oecol., 24, S125–S132, https://doi.org/10.1016/S1146-609X(03)00011-0, 2003.
Pfister, L., Kwadijk, J., Musy, A., Bronstert, A., and Hoffmann, L.: Climate change, land use change and runoff prediction in the Rhine-Meuse basins, River Res. Applic., 20, 229–241, https://doi.org/10.1002/rra.775, 2004.
Pradhan, U. K., Wu, Y., Shirodkar, P. V., Zhang, J., and Zhang, G.: Multi-proxy evidence for compositional change of organic matter in the largest tropical (peninsular) river basin of India, J. Hydrol., 519, 999–1009, https://doi.org/10.1016/j.jhydrol.2014.08.018, 2014.
Ramasubramanian, R., Gnanappazham, L., Ravishankar, L., and Navamuniyammal, M.: Mangroves of Godavari – Analysis Through Remote Sensing Approach, Wetl. Ecol. Manag., 14, 29–37, https://doi.org/10.1007/s11273-005-2175-x, 2006.
Rampen, S. W, Schouten, S., Wakeham, S. G., and Sinninghe Damsté, J. S.: Seasonal and spatial variation in the sources and fluxes of long chain diols and mid-chain hydroxy methyl alkanoates in the Arabian Sea, Org. Geochem., 38, 165–179, https://doi.org/10.1016/j.orggeochem.2006.10.008, 2007.
Rampen, S. W., Schouten, S., and Sinninghe Damsté, J. S.: Occurrence of long chain 1,14-diols in Apedinella radians, Org. Geochem., 42, 572–574, https://doi.org/10.1016/j.orggeochem.2011.03.009, 2011.
Rampen, S. W., Willmott, V., Kim, J.-H., Uliana, E., Mollenhauer, G., Schefuß, E., Sinninghe Damsté, J. S., and Schouten, S.: Long chain 1,13- and 1,15-diols as a potential proxy for palaeotemperature reconstruction, Geochim. Cosmochim. Acta., 84, 204–216, https://doi.org/10.1016/j.gca.2012.01.024, 2012.
Rampen, S. W., Willmott, V., Kim, J-H., Rodrigo-Gamiz, M., Uliana, E., Mollenhauer, G., Schefuss, E., Sinninghe Damsté, J. S., and Schouten, S.: Evaluation of long chain 1,14-alkyl diols in marine sediments as indicators for upwelling and temperature, Org. Geochem., 76, 39–47, https://doi.org/10.1016/j.orggeochem.2014.07.012, 2014a.
Rampen, S. W., Datema, M., Rodrigo-Gámiza, M., Schouten, S., Reichart, G.-J., and Sinninghe Damsté, J. S.: Sources and proxy potential of long chain alkyl diols in lacustrine environments, Geochimi. Cosmochimi. Acta, 144, 59–71, https://doi.org/10.1016/j.gca.2014.08.033, 2014b.
Rao, K. N., Saito, Y., Nagakumar, K. C. V., Demudu, G., Rajawat, A. S., Kubo, S., and Li, Z.: Palaeogeography and evolution of the Godavari delta, east coast of India during the Holocene: An example of wave-dominated and fan-delta settings, Palaeogeogr. Paleoclim. Palaeocl., 440, 213–233, https://doi.org/10.1016/j.palaeo.2015.09.006, 2015.
Rimbu, N., Boroneant, C., Buta, C., and Dima, M.: Decadal variability of the Danube River flow in the lower basin and its relation with the North Atlantic oscillation, Int. J. Climatol., 22, 1169–1179, https://doi.org/10.1002/joc.788, 2002.
Romero-Viana, L., Kienel, U., and Sachse, D.: Lipid biomarker signatures in a hypersaline lake on Isabel Island (Eastern Pacific) as a proxy for past rainfall anomaly (1942–2006 AD), Palaeogeogr. Paleoclim. Palaeocl., 350–352, 49–61, https://doi.org/10.1016/j.palaeo.2012.06.011, 2012.
Sarma, V. V. S. S., Gupta, S. N. M., Babu, P. V. R., Acharya, T., Harikrishnachari, N., Vishnuvardhan, K., Rao, N. S., Reddy, N. P. C., Sarma, V. V., Sadhuram, Y., Murty, T. V. R., and Kumar, M. D.: Influence of river discharge on plankton metabolic rates in the tropical monsoon driven Godavari estuary, India, Estuar. Coast. Shelf Sci., 85, 515–524, https://doi.org/10.1016/j.ecss.2009.09.003, 2009.
Sarma, V. V. S. S., Prasad, V. R., Kumar, B. S. K., Rajeev, K., Devi, B. M. M., Redyy, N. P. C., Sarma, V. V., and Kumar, M. D.: Intra-annual variability in nutrients in the Godavari estuary, India, Cont. Shelf Res., 30, 2005–2014, https://doi.org/10.1016/j.csr.2010.10.001, 2010.
Schmidt, F., Hinrichs, K.-U., and Elvert, M.: Sources, transport, and partitioning of organic matter at a highly dynamic continental margin, Mar. Chem, 118 37–55, https://doi.org/10.1016/j.marchem.2009.10.003, 2010.
Shimokawara, M., Nishimura, M., Matsuda, T., Akiyama, N., and Kawai, T.: Bound forms, compositional features, major sources and diagenesis of long-chain alkyl mid-chain diols in Lake Baikal sediments over the past 28 000 years, Org. Geochim., 41, 753–766, 2010.
Sinninghe Damsté, J. S., Rijpstra, W. I. C., Abba, B., Muyzer, G., and Schouten, S.: A diatomaceous origin for long-chain diols and mid-chain hydroxy methyl alkanoates widely occurring in Quaternary marine sediments: indicators for high nutrient conditions, Geochim. Cosmochim. Acta, 67, 1339–1348, https://doi.org/10.1016/S0016-7037(02)01225-5, 2003.
Sinninghe Damsté, J. S.: Spatial heterogeneity of sources of branched tetraethers in shelf systems: The geochemistry of tetraethers in the Berau River delta (Kalimantan, Indonesia), Geochim. Cosmochim. Acta, 186, 13–31, https://doi.org/10.1016/j.gca.2016.04.033, 2016.
Smith, M., De Deckker, P., Rogers, J., Brocks, J., Hope, J., Schmidt, S., Lopes dos Santos, R., and Schouten, S.: Comparison of Uk'37, TEXH86 and LDI temperature proxies for reconstruction of south-east Australian ocean temperatures, Org. Geochim., 64, 94.104, https://doi.org/10.1016/j.orggeochem.2013.08.015, 2013.
Stoeck, T., Bass, D., Nebel, M., Christen, R., Jones, M. D. M., Breiner, H.-W., and Richards, T. A.: Multiple marker parallel tag envvironmental DNA sequencing reveals a highly complex eukaryotic community in marine anoxic water, Mol. Ecol., 19, 21–31, https://doi.org/10.1111/j.1365-294X.2009.04480.x, 2010.
Syvitsky, J. P. M. and Saito, Y.: Morphodynamics of deltas under the influence of humans, Global Planet. Change, 57, 261–282, https://doi.org/10.1016/j.gloplacha.2006.12.001, 2007.
Takahashi, K., Jordans, R., and Priddle, J.: The Diatom genus Proboscia in subartic waters, Diatom Res., 9, 411–428, https://doi.org/10.1080/0269249X.1994.9705317, 1994.
Tolmazin, D.: Changing Coastal oceanography of the Black Sea, I: Northwestern Shelf, Prog. Oceano., 15, 217–276, https://doi.org/10.1016/0079-6611(85)90038-2, 1985.
Usman, M. O., Kirkels, F. M. S. A., Zwart, H. M., Basu, S., Ponton, C., Blattmann, T. M., Ploetze, M., Haghipour, N., McIntyre, C., Peterse, F., Lupker, M., Giosan, L., and Eglinton, T. I.: Reconciling drainage and receiving basin signatures of the Godavari River system, Biogeosciences, 15, 3357–3375, https://doi.org/10.5194/bg-15-3357-2018, 2018.
Versteegh, G. J. M., Bosch, H. J., and de Leeuw, J. W.: Potential palaeoenvironmental information of C24 to C36 mid-chain diols, keto-ols and mid-chain hydroxy fatty acids; a critical review, Org. Geochem., 27, 1–13, https://doi.org/10.1016/S0146-6380(97)00063-6, 1997.
Versteegh, G. J. M., Jansen, J. H. F., de Leeuw, J. W., and Schneider, R. R.: Mid-chain diols and keto-ols in SE Atlantic sediments: a new tool for tracing past sea surface water masses?, Geochim. Cosmochim. Act. 64, 1879–1892, https://doi.org/10.1016/S0016-7037(99)00398-1, 2000.
Villanueva, L., Besseling, M., Rodrigo-Gámiz, M., Rampen, S. W., Verschuren, D., and Sinninghe Damsté, J. S.: Potential biological sources of long chain alkyl diols in a lacustrine system, Org. Geochem., 68, 27–30, https://doi.org/10.1016/j.orggeochem.2014.01.001, 2014.
Volkman, J. K., Barett, S. M., and Blackburn, S. I.: Eustigmatophyte microalgae are potential sources of C29 sterols, C22–C28 n-alcohols and C28–C32 n-alkyl diols in freshwater environments, Org. Geochem., 30, 307–318, https://doi.org/10.1016/S0146-6380(99)00009-1, 1999.
Willmott, V., Rampen, S. W., Domack, E., Canals, M., Sinninghe Damsté, J. S., and Schouten, S.: Holocene changes in Proboscia diatom productivity in shelf waters of the northwestern Antarctic Peninsula, Antarct. Sci., 22, 3–10, https://doi.org/10.1017/S095410200999037X, 2010.
Zhang, Z., Metzger, P., and Sachs, J. P.: Co-occurrence of long chain diols, keto-ols, hydroxy acids and keto acids in recent sediments of Lake El Junco Galapagos Islands, Org. Geochem., 42, 823–837, https://doi.org/10.1016/j.orggeochem.2011.04.012, 2011.