the Creative Commons Attribution 4.0 License.
the Creative Commons Attribution 4.0 License.
 | 27 Jul 2018
Seagrass community-level controls over organic carbon storage are constrained by geophysical attributes within meadows of Zanzibar, Tanzania
Elizabeth Fay Belshe
Dieuwke Hoeijmakers
Natalia Herran
Matern Mtolera
Mirta Teichberg
The aim of this work was to explore the feasibility of using plant functional traits to identify differences in sediment organic carbon (OC) storage within seagrass meadows. At 19 sites within three seagrass meadows in the coastal waters of Zanzibar, Tanzania, species cover was estimated along with three community traits hypothesized to influence sediment OC storage (above and belowground biomass, seagrass tissue nitrogen content, and shoot density). Sediments within four biogeographic zones (fore reef, reef flat, tidal channel, and seagrass meadow) of the landscape were characterized, and sediment cores were collected within seagrass meadows to quantify OC storage in the top 25 cm and top meter of the sediment. We identified five distinct seagrass communities that had notable differences in the plant traits, which were all residing within a thin veneer (ranging from 19 to 78 cm thick) of poorly sorted, medium to coarsely grained carbonate sands on top of carbonate rock. One community (B), dominated by Thalassodendron ciliatum, contained high amounts of above (972±74 g DW m−2) and belowground (682±392 g DW m−2) biomass composed of low-elemental-quality tissues (leaf C : N = 24.5; rhizome C : N = 97). While another community (C), dominated by small-bodied ephemeral seagrass species, had significantly higher shoot density (4178 shoots m−2). However, these traits did not translate into differences in sediment OC storage and across all communities the percentage of OC within sediments was similar and low (ranging from 0.15 % to 0.75 %), as was the estimated OC storage in the top 25 cm (14.1±2.2 Mg C ha−1) and top meter (33.9±7.7 Mg C ha−1) of sediment. These stock estimates are considerably lower than the global average (194.2±20.2 Mg C ha−1) reported for other seagrass ecosystems and are on the lower end of the range of estimates reported for the tropical Indo-Pacific bioregion (1.9 to 293 Mg C ha−1). The uniformly low OC storage across communities, despite large inputs of low-quality belowground tissues in community B, indicates that the geophysical conditions of the coarse, shallow sediments at our sites were not conducive to OC stabilization and outweighed any variation in the quantity or quality of seagrass litter inputs. These results add to a growing body of evidence showing that geophysical conditions of the sediment modulate the importance of plant traits in regards to retention of OC within blue carbon ecosystems and cautions against the use of plant traits as a proxy for sediment OC storage across all seagrass ecosystems.
- Article
(1934 KB) - Full-text XML
-
Supplement
(797 KB) - BibTeX
- EndNote


Seagrasses influence key ecological functions within coastal ecosystems through their productivity and by trapping sediment, altering hydrodynamics, and modifying biogeochemical processes in the water column and sediment (Duarte and Chiscano, 1999; Marba et al., 2006). Through their effects on ecosystem processes, seagrasses provide numerous ecosystem services including sediment stabilization, coastline protection, nutrient cycling, pathogen reduction, support of fisheries, and enhancement of biodiversity (Duffy, 2006; de la Torre Castro and Rönnbäck, 2004; Lamb et al., 2017; Orth et al., 2006). In the last 2 decades, seagrasses have been recognized as important “blue” carbon (organic carbon sequestered by vegetated coastal ecosystems) sinks, adding climate regulation to their list of well-established ecosystem services (Duarte et al., 2005; Fourqurean et al., 2012a; Macreadie et al., 2014; Mateo et al., 1997; Nellemann et al., 2009; Pergent et al., 1994; Romero et al., 1994).
A surge in research efforts has revealed the wide range (up to 18-fold) of sediment organic carbon (OC) storage within seagrass sediments, with OC stocks varying with seagrass species (Gullström et al., 2017; Lavery et al., 2013; Serrano et al., 2014, 2016a), plant characteristics (Dahl et al., 2016; Jankowska et al., 2016; Samper-Villarreal et al., 2016), meadow attributes (Armitage and Fourqurean, 2016; Samper-Villarreal et al., 2016; Serrano et al., 2014, 2016b), sediment characteristics (Campbell et al., 2014; Dahl et al., 2016; Miyajima et al., 2017; Röhr et al., 2016; Serrano et al., 2016a), landscape configurations (Campbell et al., 2014; Gullström et al., 2017; Lavery et al., 2013; Phang et al., 2015), and climatic zones (Fourqurean et al., 2012a; Lavery et al., 2013; Miyajima et al., 2015). The potential for high variability in OC stocks presents a formidable obstacle for reliably valuing the ecosystem service of OC storage because baseline stock estimates are needed before conservation or restoration can be incentivized under a blue carbon framework (Barbier et al., 2011; Costanza et al., 1997; 2014; Herr et al., 2012; Macreadie et al., 2014). To achieve IPCC tier 3 standards of accuracy for OC stock inventories, considerable sampling effort is required (Howard et al., 2014; Macreadie et al., 2014).
A potential solution is to utilize easy-to-measure functional traits that can be linked to ecosystem functions underlying the service of OC storage as a proxy for sediment OC content (de Bello et al., 2010; de Chazal et al., 2008; Grime, 2001; Kremen, 2005). Plant functional traits have been shown to be valuable tools for assessing and managing ecosystem services (de Bello et al., 2010; Díaz et al., 2007). An important trade-off of plant traits linked to OC cycling, known as the “fast–slow plant economic spectrum”, consists of a suite of coordinated characteristics that either promote fast carbon acquisition and decomposition or promote the conservation of resources within well-protected tissues with inherently slower decomposition rates (Conti and Díaz, 2012; Díaz et al., 2004; Freschet et al., 2012; Grime, 2001; Reich et al., 1997; Wright et al., 2004). Acquisition traits such as high specific leaf area, high nutrient content, and low tissue longevity and density are consistently associated with high OC inputs via photosynthesis and high OC losses through decomposition (Cornwell et al., 2008; Díaz et al., 2004; Grime et al., 1997; Herms and Mattson, 1992; Reich, 2014; Wright et al., 2004). Conservative traits include the opposite of the above characteristics and promote slow-growing, long-lived biomass with low OC losses via decomposition. At the ecosystem level, acquisition traits promote high carbon fluxes, while conservation traits are conducive for the retention of OC stocks (Conti and Díaz, 2012; De Deyn et al., 2008; Díaz et al., 2009; Wardle et al., 2004).
Several seagrass traits have been proposed to be influential on OC sequestration and storage within seagrass sediments (Duarte et al., 2011). Canopy characteristics, such as high leaf density and complexity, have been shown to enhance the OC burial flux into the sediment by filtering and trapping particles from the water column and promoting sediment deposition and retention (Peterson et al., 2004; Duarte and Chiscano, 1999; Duarte et al., 2005; Gacia and Duarte, 2001; Gacia et al., 1999; Hendriks et al., 2008; Samper-Villarreal et al., 2016). Furthermore, seagrass sediment OC stocks have been positively correlated with shoot density, both directly (Dahl et al., 2016) and indirectly (Serrano et al., 2014). Seagrass tissue stoichiometry has been correlated with decomposition rates, with tissues containing relatively higher nitrogen and phosphorus content decomposing faster (Enriquez et al., 1993), at least in the initial phase of decomposition (Berg and McClaugherty, 2014). Low concentrations of nitrogen (C : N ratio above 20–25) within tissues indicate the potential for microbial nitrogen limitation, necessitating nitrogen immobilization from the environment and resulting in low carbon-use efficiency during litter decomposition (Berg and McClaugherty, 2014; Hessen et al., 2004; Sinsabaugh et al., 2013). Furthermore, the nutrient content of tissues covaries with other structural and chemical properties that reflect the plant species' ecological strategy and can serve as a proxy of tissue quality and decomposability (Birouste et al., 2012; Cornwell et al., 2008; Freschet et al., 2012; Zechmeister-Boltenstern et al., 2015). Seagrass biomass has been positively correlated to OC storage (Armitage and Fourqurean, 2016; Gullström et al., 2017; Serrano et al., 2016a). Belowground (BG) production of seagrass roots and rhizomes places OC directly into sediments, which can be stabilized on mineral surfaces, within aggregates, or if microbial activity is suppressed due to lack of oxygen (Belshe et al., 2017; Duarte et al., 2011). In addition, the binding of the sediment by the root–rhizome system (Christianen et al., 2013) and the high lignin content of BG tissues (Klap et al., 2000) can promote OC storage. Larger plants disproportionately contribute to OC accumulation by shedding more biomass per unit of ground area (Garnier et al., 2004; Lavorel and Grigulis, 2011). Seagrass interspecies variation in these traits places them within the continuum of the fast–slow plant economic spectrum, with small-bodied, ephemeral species, such as Halophila spp., Halodule spp., and Zostera spp., on the fast acquisition end, and large-bodied, persistent species, such as Enhalus spp., Thalassia spp., and Posidonia spp., on the slow conservation end (Orth et al., 2006).
The aim of this study was to determine whether seagrass community traits can be linked to differences in sediment OC content within meadows residing in the open coastal waters of Zanzibar, Tanzania. Our sites were located within three meadows that contained up to eight co-occurring seagrass species, with a wide breadth of functional traits (Gullström et al., 2002), all residing within a landscape with similar abiotic conditions (Shaghude et al., 2002). Our goal was to add to the growing body of evidence investigating where, and to what extent, plant community traits can be used to determine the size of and variability in OC storage within seagrass sediments.
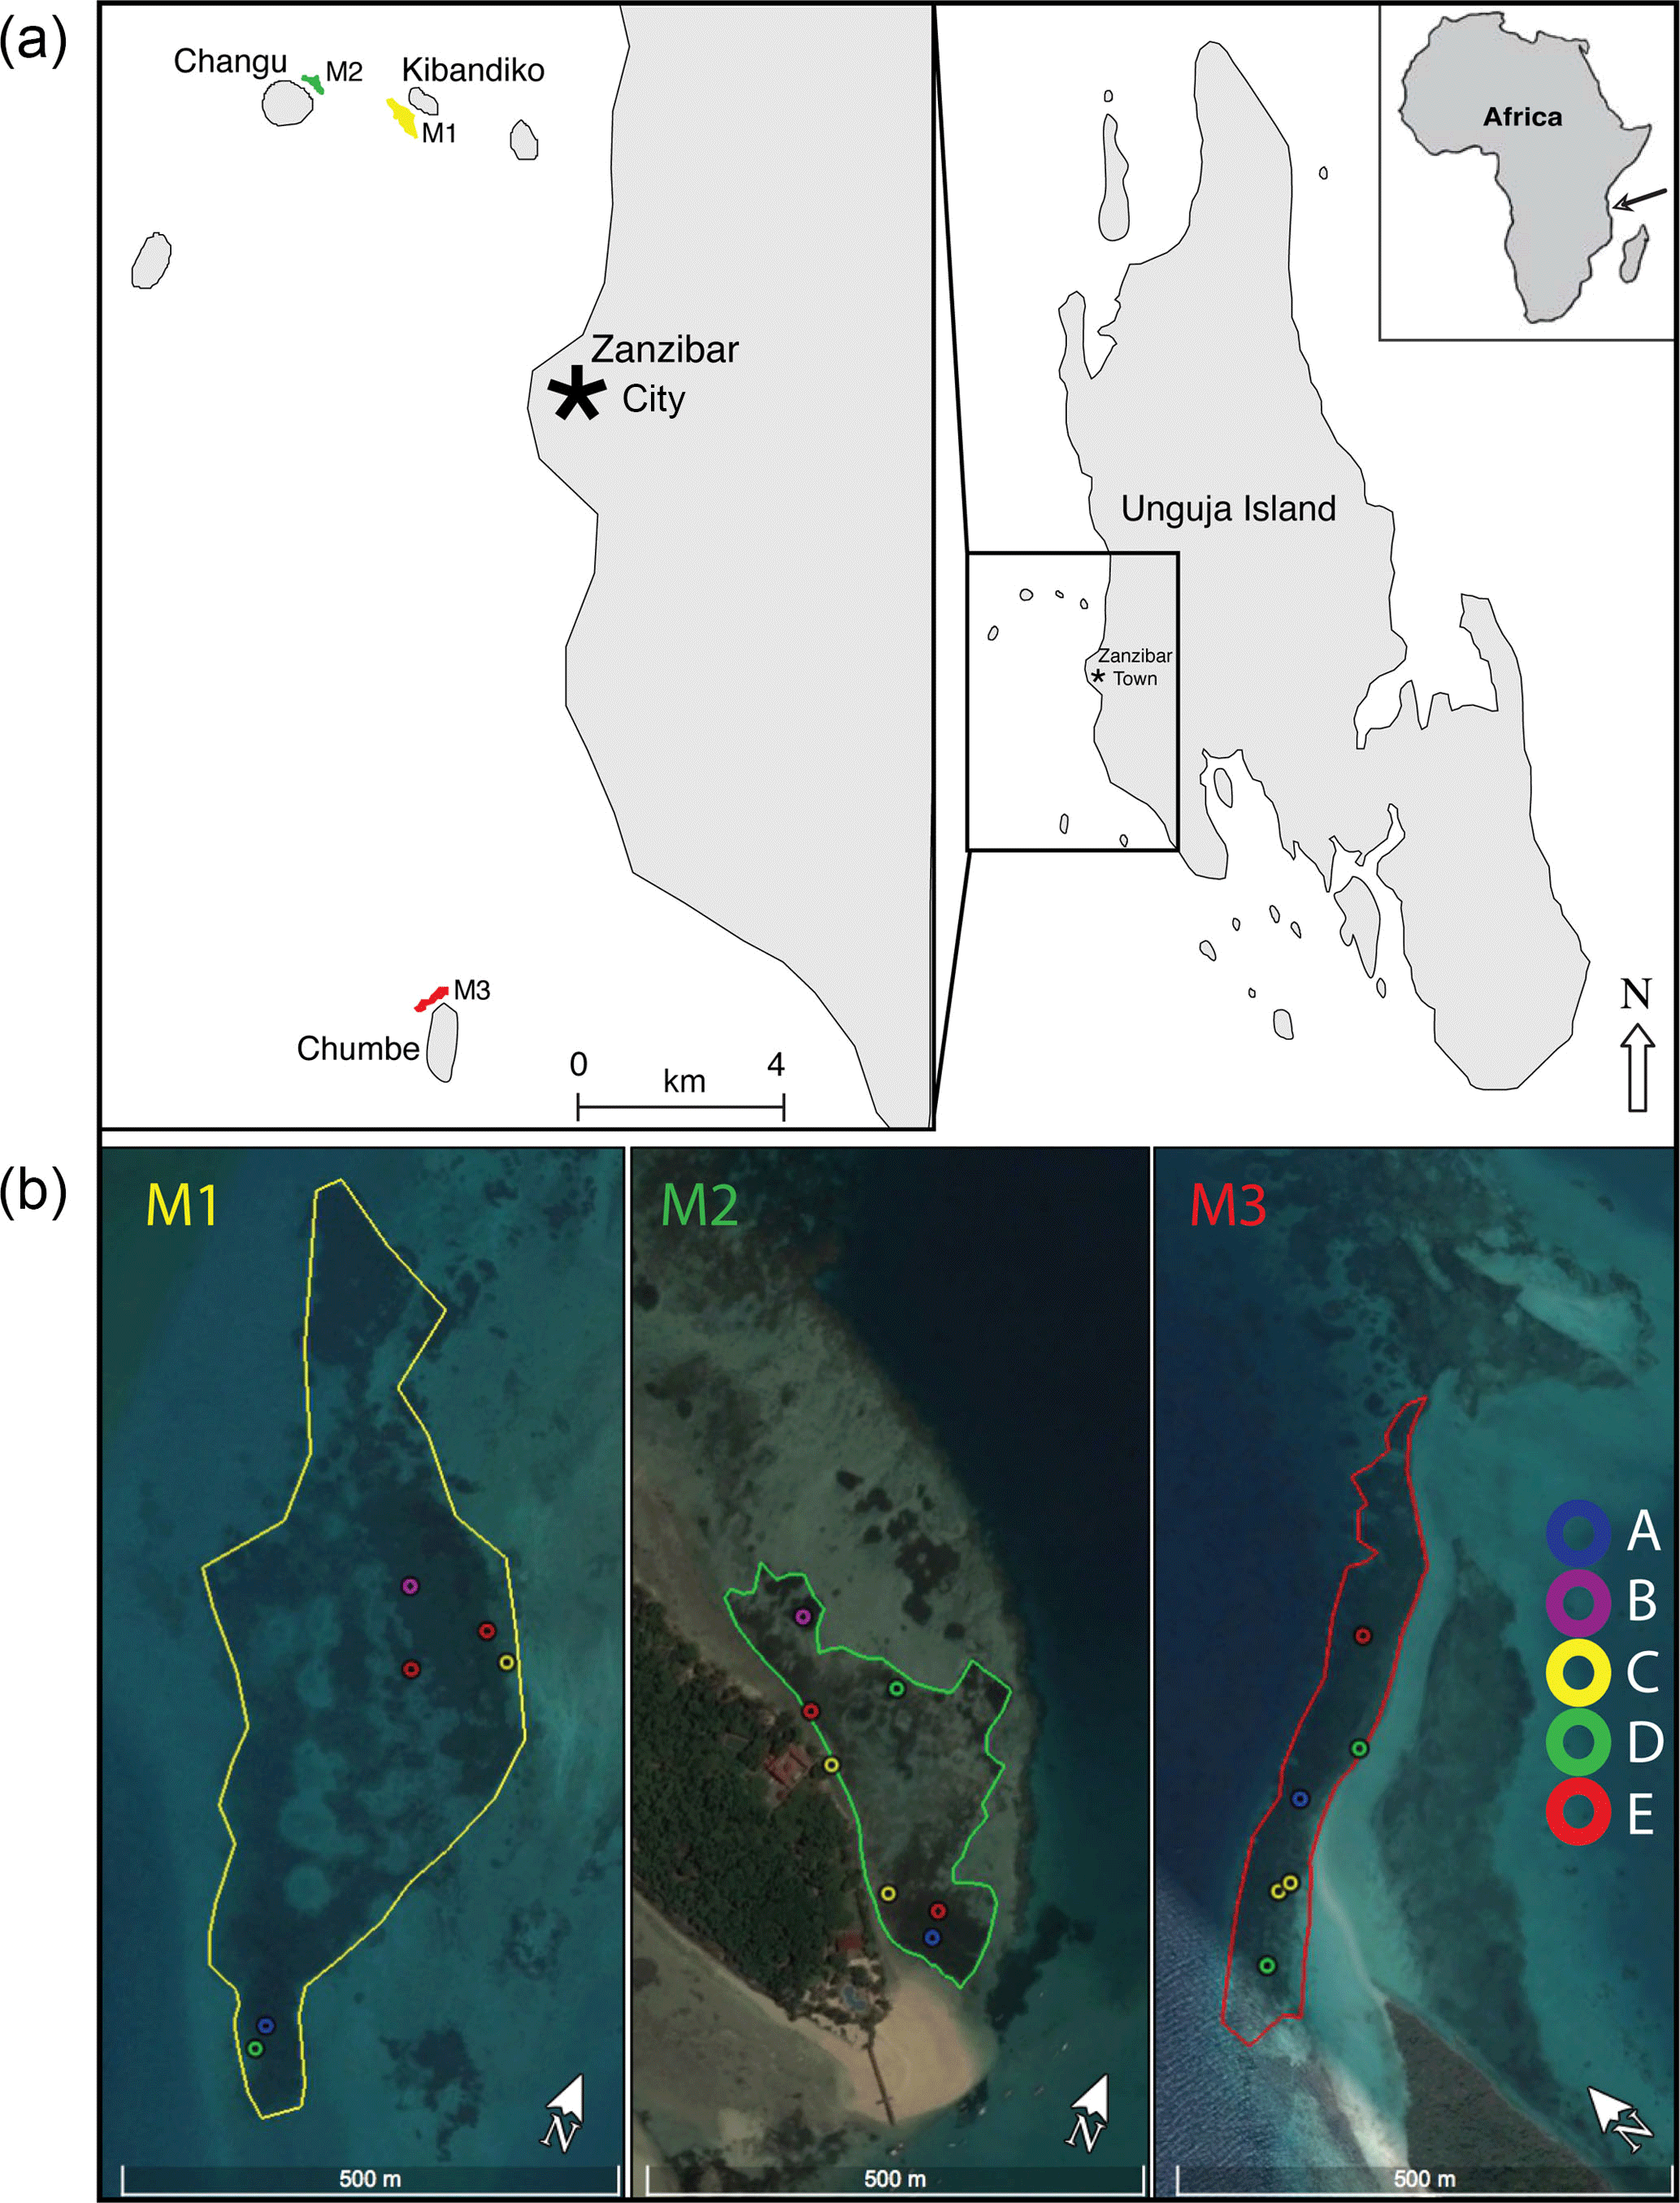
Figure 1Study sites were located within three meadows (M1, M2, M3) in open coastal waters adjacent to coral cays west of the main city, Zanzibar City, Unguja Island (−6.15809∘ S, 39.19181∘ E) of Zanzibar, Tanzania. Locations of the 19 sample sites within the three meadows (M1, M2, M3) are shown in (b). Images were produced in Google Earth Pro 7.3.0.3832 (18 August 2017), Data SIO, NOAA, U.S. Navy, IGA, and GEBCO. Images© 2017 DigitalGlobe (https://www.google.com/earth/; last access: 19 August 2017).
2.1 Description of study sites
This study was conducted within the tropical Indo-Pacific bioregion (Short et al., 2007) in diverse seagrass meadows of the western Indian Ocean (WIO), specifically in coastal waters of Unguja Island (−6.15809∘ S, 39.19181∘ E) of Zanzibar, Tanzania. The climate is tropical, with temperatures between 27 and 35 ∘C, with an annual rainfall of 1600 mm that is strongly influenced by two opposing monsoon seasons driven by the southeast monsoonal circulation of the central WIO (Mahongo and Shaghude, 2014; McClanahan, 1988). The northeast monsoon occurs from November to February and the southeast monsoon occurs from April to September. The regional hydrodynamics are complex and primarily influenced by ebb–flood tidal phases but are also influenced by the East African Coastal Current and monsoon winds (Mahongo and Shaghude, 2014; Shaghude et al., 2002; Zavala-Garay et al., 2015). The tidal cycles are semidiurnal ranging from mesotidal during neap tide (∼ 1 m amplitude) to macrotidal (from 3 to 4 m in amplitude) during spring tide (Shaghude et al., 2002; Zavala-Garay et al., 2015). Strong tidal currents can reach velocities that range from 0.25 to 2 m s−1 (Shaghude et al., 2002).
Sample sites were established within three seagrass meadows (M1, M2, M3) in open coastal waters adjacent to coral cays west of the main city, Zanzibar City (Fig. 1). These meadows were chosen because they contained a range of seagrass species (up to eight species) with different life-history strategies, and at the same time had similar landscape positions and abiotic properties, such as shallow water depth, carbonate sediments, and negligible terrestrial inputs (Shaghude et al., 2002). M1 is located in shallow waters (70–380 cm in depth) to the southeast of Kibandiko Island and encompasses an area of 15 ha, which includes several small intermittent patch reefs. M2 is also located 1.5 km to the west of M1, and encompasses an area of 4.8 ha. M2 resides within a shallow lagoon (50–320 cm in depth) adjacent to a sand spit and fringing reef on the northeastern side Changu Island. M3 covers 4.6 ha and is located in shallow waters (50–375 cm in depth) north of Chumbe Island, adjacent to patch reefs and a sand spit. M3 resides 16 and 17 km south of M1 and M2, respectively. The seagrass within these meadows grows within a shallow sediment layer on top of an uplifted Pleistocene carbonate platform (Kent et al., 1971; Short et al., 2007). The sediments are biogenic, with the major constituents being benthic foraminifera, molluscs (pelecypods and gastropods), and coral, with negligible terrigenous inputs (Gita R. Narayan, unpublished; Shaghude et al., 2002).
During October 2013, physical properties (temperature, pH, dissolved oxygen, and conductivity) of the water column were measured using a WTW 3430 multiparameter probe (Weilheim, Germany) within the three meadows. Light levels at the surface (I0) and bottom (Id) of the water column were measured with a Li-1400 instrument (Li-cor Biosciences, Lincoln, Nebraska, USA). Light attenuation (k) at a given depth (d) was calculated using the following equation: k = ln. To characterize the sediments of the landscape, sediments were collected within four biogeographic zones (reef flat, fore reef, tidal channel, and seagrass meadow). For this landscape-level sediment characterization, the upper 5–10 cm of sediment was collected using a Van Veen sampler (3 mm plate, 250 cm−1) at 29 locations following the bathymetric gradient and spatially distributed to cover the four biogeographic zones. Sediment samples were rinsed with clean freshwater in order to remove soluble components and dried at 40 ∘C for at least 48 h. Two subsamples (of each set) were sieved in a stack-shaker sieve for 10 min. To assess differences in local sediment characteristics, compared to landscape sediment properties, surface sediments within different seagrass communities (see below for details on communities) were collected by scooping the top 2–3 cm of sediment by hand into a 50 mL falcon tube.
2.2 Seagrass community composition
Between 17 September and 17 October 2013, 19 sample sites were established across the three meadows (M1, M2, M3) to capture the zonation of species assemblages found across the extent of each meadow. A snorkeling survey was conducted at each meadow, consisting of five 50 m transects (perpendicular to the coastline) throughout each meadow. Based on this initial survey, six to seven distinct vegetation zones were identified for each meadow. The pattern of zonation within the meadows was a mosaic of patches, following both the depth gradient and running parallel to the coastline. Within each zone, a 0.25 m2 quadrat was randomly tossed to establish the specific site locations. Within a meadow, sites ranged from 15 to 370 m apart, with the average distance between sites being 261±194 m for M1, 170±93 m for M2, and 165±98 m for M3 (Fig. 1).
At each site, seagrass species composition was quantified within six randomly tossed 0.25 m2 quadrats by visually estimating seagrass cover and assigned values based on a modified Braun-Blanquet scale (Mueller-Dombios and Ellenberg, 2012). In total, eight seagrass species were identified: Thalassodendron ciliatum, Cymodocea serrulata, Cymodocea rotundata, Thalassia hemprichii, Syringodium isoetifolium, Halodule uninervis, Holophila ovalis, and Halophila stipulacea.
2.3 Seagrass functional traits
To quantify traits of each seagrass community, three biomass cores and five ramets of each seagrass species present were collected at each of the 19 sites. Biomass cores encompassing both seagrass shoots and the entire rhizosphere (ranging from 10 to 30 cm of depth) were taken by placing a 13 cm diameter PVC ring on top of the sediment and using a knife and garden trowel to remove all plant biomass within the ring. This methodology was utilized because of the coarse, shallow carbonate sediments at our sites. Plant material was placed directly into a mesh bag (2 mm mesh size), rinsed free of sediment in the field, stored in plastic bags, and frozen for subsequent analysis. After thawing in the lab, seagrasses were sorted by species, and short-shoot density (shoot m−2) was calculated. Green leaves (aboveground (AG) biomass) and living root, rhizome, and short shoots (BG biomass) were separated, scraped of epiphytes, and dried at 60 ∘C until a constant weight was reached; then they were weighed to obtain AG and BG biomass (g DW m−2) for each species. Species weights were then summed for core-level estimates of AG and BG biomass. Five seagrass ramets per species were collected from each site and used to quantify the percentage of nitrogen (N) of leaf and rhizome tissue of each species. A section of rhizome and the second-ranked (from youngest) leaf of each of the five shoots was taken, scraped gently to remove epiphytes, and dried at 60 ∘C for 48 h. Tissue samples were then homogenized with a mortar and pestle and subsequently measured on an elemental analyzer (Euro EX 3000; Eurovector) to determine the %N and %C of each species at each site, and tissue stoichiometry (C : N ratio) was calculated.
2.4 Sediment organic carbon
To determine if carbon storage within sediments varied among different seagrass communities, sediment cores were taken within the five seagrass communities (determined from the multivariate analysis) during October of 2014. Three sediment cores were taken with a hand-driven, 7.6 cm internal diameter corer on a SCUBA, within each of the five identified seagrass communities and on bare sediment adjacent to, but outside of, the seagrass meadows. Within each community, cores were distributed among the three meadows, resulting in one core extracted per community per meadow. Due to the shallow and variable sediment accumulation on top of the carbonate platform at our sites, the depth of penetration of sediment cores varied from 19 to 78 cm. The presence of the impenetrable carbonate layer was verified manually after the core was extracted by hand or by inserting a metal rod. Core compaction was not measured in this study but was assumed to be minimal due to the coarse sediment composition. We also assumed that there were no historic differences in community composition, plant traits, or meadow extent during past carbon deposition because there were no historic data available at our sites, which is a limitation of this study.
In the lab, cores were sectioned into 3 cm slices. From each slice, a 15 cm3 ( cm) rectangular cavity was used to further subset each slice of sediment, which was subsequently oven-dried (60 ∘C) and weighed for dry bulk density (DBD) determination. Dried sediments were homogenized in a ball mill and percentage of OC was determined, after acidification with 1 M HCL to remove carbonates, on an elemental analyzer (Euro EX 3000; Eurovector). The OC content (CC; g C cm3) of each 3 cm slice was calculated from measured %OC and the DBD of the slice following Eq. (1):
where zslice is the slice thickness (cm), and the %OC content of the slice is multiplied by 100 to convert % to grams of OC per gram of dry weight. The amount of carbon stored in each core was calculated by summing the OC content in each depth increment (slice). Because the total core length varied among sites (from 19 to 78 cm), total core carbon storage was estimated in two ways. First, estimates of storage in the top 25 cm of sediment were calculated because at this depth there were nearly full data sets in all cores (16 out of 18 cores were longer than 25 cm). Second, to make estimates comparable to other studies, storage in the top meter of sediment was estimated by gap-filling missing data down to 1 m using a negative exponential model with the drc package (version 3.0-1; Ritz et al., 2015).
2.5 Statistical analysis
To characterize the sediments of the four landscape zones (fore reef, reef flat, tidal channel, seagrass), we applied the Udden–Wentworth scale (Wentworth, 1922) as follows: gravel (> 2000 µm), coarse sand (1000–2000 µm), medium sand (500–1000 µm), medium-fine sand (250–500 µm), fine sand (125–250 µm), very fine sand (63–125 µm), and silt (< 63 µm). Each individual fraction was calculated as weight percentage of the total bulk sediment. We used the logarithmic Folk and Ward method (Folk and Ward, 1957) to compare sediment gain size distributions because it places more weight on the central portion of the distribution and less on the tails, and was more appropriate for our sediments, which had a large particle size range (Blott and Pye, 2001). The physical description of sediments was based on the granulometric output and appearance of the bulk sediment after Folk (Folk, 1954). Summary statistics (mean, median (D50), standard deviation, skewness, and kurtosis) were estimated for each zone based on log-transformed data using the G2Sd R package (Fournier et al., 2014). As an indication of variability in grain sizes found within each zone, a measure of the spread of grain sizes (D10–D90) was calculated by subtracting the grain size at which 10 % (D10) of the grains are more coarse from the grain size (D90) at which 90 % of the grains are found to be more coarse (Blott and Pye, 2001). Differences among the four landscape zones were compared for each grain size class of Udden–Wentworth scale using a Kruskal–Wallis test with a post hoc t test with pooled standard deviation. To assess differences in local sediment characteristics, compared to landscape sediment properties, a representative sediment sample of each seagrass community was photographed at high resolution over a 5 mm grid and qualitatively compared based on appearance and texture (Folk, 1954).
Multivariate analyses were used to describe and categorize the patterns in seagrass species assemblages found at the 19 sample sites. First, Braun-Blanquet cover categories were converted to the midpoint of the cover range (Wilkum and Shanholtzer, 1978) and then square-root transformed to down-weight the influence of abundant species, and finally cover estimates were relativized to the total abundance of each site. A Bray–Curtis similarity index was then calculated based on the similarity of species composition and cover among sites (Bray and Curtis, 1957). Then, based on this similarity matrix, both nonmetric multidimensional scaling (NMDS) and hierarchical cluster analysis (average linkage) were preformed to group sites by similarity in seagrass species composition and cover (ter Braak, 1995; Kent and Coker, 1992; Legendre and Legendre, 1998). These categorizations were used to identify the seagrass species assemblages (communities) present in the sampled meadows. The vegan package (version 2.2-0; (Oksanen et al., 2014) in R (R Core Development Team, 2016) was used for all multivariate analysis.
For all analysis of trait differences among communities, the unbalanced sample design created from the unequal grouping of the original 19 sites into communities (based on similarity of species and cover) necessitated special attention in regards to model appropriateness and validation of assumptions. Model residuals were tested for homogeneity of variance and normality with Levene's and Shapiro–Wilk tests, respectively. Selected models were also validated visually with plots of model residuals (fitted values vs. absolute residuals (homogeneity of variance), a qqplot comparing the distribution of the standardized residuals to the normal distribution (normality), and a lag plot of the raw residuals vs. the previous residual (independence; Zuur et al., 2009). Further, spatial independence was confirmed with variogram plots of model residuals using the gstat package (Zuur et al., 2009).
Differences in AG and BG biomass among communities and meadows were determined using a two-way ANOVA with post hoc Tukey HSD at the p≤0.05 significance level on log-transformed data to meet model assumptions. With the transformation, both assumptions of homogeneity of variance (Levene's test, AG: F=1.262, p=0.274; BG F=0.609, p=0.833) and normality (Shapiro–Wilk, AG: W=0.969, p=0.180; BG: W=0.961, p=0.126) were met. Because sites were distributed across three meadows, models included both community and meadow as direct effects along with their interaction. All models were fit using the base package in R (R Core Development Team, 2016).
Differences in short-shoot density among the seagrass communities and meadows were determined using a generalized linear model, specifically a negative binomial model (link = log) because the data were counted and found to be overdispersed (Zuur et al., 2009). The negative binomial distribution allows for variances not equal to the mean and does not necessitate equal variances among groups (Zuur et al., 2009). Differences among communities, and across meadows within each community, were determined when there was no overlap in 95 % confidence intervals of predicted model estimates. All models were fit using the MASS package (version 7.3-35; Venables and Ripley, 2002) in R.
The %N of each community was estimated by calculating the mean and standard deviation of the %N weighted by the abundance of each species present within the community specific to each meadow. Because of our unequal sample sizes and variance heterogeneity, communities and meadows within a community were simply compared visually and considered different when there was no overlap between 95 % confidence intervals, which were calculated as the weighted mean ± with t0.95 × weighted SD, with t0.95=2.26 based on a t distribution to account for the smallest sample size of our groups (n = 10).
To explore how OC varied among communities and across our sites, models that included both community and meadow as direct effects were evaluated. Because of our relatively small sample size (n = 18) and the general rule of thumb of needing ∼ 10 data points for each parameter estimated, we did not include the interaction between community and meadow. Models were fit for each response variable (percent OC in the top 25 cm, OC storage to 25 cm, and OC storage to 1 m) using ANOVA with post-hoc Tukey HSD at the p≤0.05 significance level. Model validation of normality (Shapiro–Wilk test) was met for all OC models, and variogram plots of model residuals showed no clear patterns indicating that the assumption of independence was met (Supplement Fig. S1). All graphics were produced with the ggplot package (version 1.0.0; Wickham, 2009) in R (R Core Development Team, 2016).
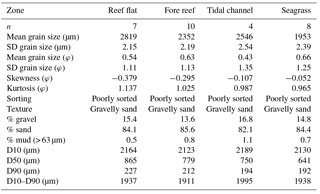
Table 1Landscape sediment characterization of the four biogeographic zones. Summary statistics (mean, standard deviation, skewness, kurtosis) are based on the logarithmic Folk and Ward method and are shown on both micrometer and phi scales. The distribution spread (D10–D90) of grain sizes is calculated as the difference between the grain size (D10) at which 10 % of grains are coarser and the grain size (D90) at which 90 % of the grains are coarser. D50 is the median grain size.
3.1 Seagrass meadow environment
Physical properties of the water column were similar among meadows, with pH ranging from 8.19 to 8.31 (, p=0.06), dissolved oxygen ranging from 6.5 to 8.8 mg L1− (, p=0.09), and conductivity ranging from 53.7 to 54.1 S m1− (, p=0.84). Water temperature ranged from a mean of 26.4 ∘C in M1 to 26.3 ∘C in M2 and 27.1 ∘C in M3. Light attenuation (Kd) through the water column was similar among meadows (mean Kd = 0.35, , p=0.25). Sediments across the landscape were composed of coarse to fine carbonate sands that were poorly sorted but actively reworked. There were no major (compositional or granulometric) differences among the four zones, with all classified as poorly sorted, gravelly sand with negative skewed distributions, indicating a tail of coarser particles (Table 1). All regions contained approximately 15 % gravel, 84 % sand, and 1 % mud. However, the median grain size within seagrass meadows (D50 = 641 µm) was slightly smaller, but within the distribution spread (D10–D90 = 1938 µm), than sediments from the reef flat (865 µm; D10–D90 = 1937 µm), fore reef (779 µm; D10–D90 = 1911 µm), or sediments found in deeper areas of the tidal channel (750 µm; D10–D90 = 1995; Table 1). When comparing zones for each Udden–Wentworth size class individually, there were no differences among zones in regards to their abundance of gravel (> 2000 µm; H(2)=1.27, p=0.736), medium sand (500–1000 µm; H(2)=0.732, p=0.866), fine sand (125–250 µm; H(2)=1.551, p=0.671), very fine sand (63–125 µm; H(2)=2.138, p=0.544), and silt (< 63 µm; H(2)=4.345, p=0.227; Fig. 2). However, there were differences among zones in their abundance of coarse sand (1000–2000 µm; H(2)= 14.328, p=0.003) and medium-fine sand (250–500 µm; H(2)= 8.071, p=0.045), with seagrass sediments containing a lower abundance of coarse sand than the fore reef (p=0.0004) and reef flat (p=0.0008), and seagrass sediments containing a higher abundance of medium-fine sand than the reef flat (p=0.013; Fig. 2). At the local scale, there were no large qualitative visual differences among surface sediments beneath the different seagrass communities, and all were consistent with the sediment characterization of the region (Fig. S2).

Figure 2Average percentage of sediments within each sediment grain size class (top left) for the four biogeographic zones (tidal channel, fore reef, reef flat, and seagrass meadow) found at our study sites. Within each zone, the grain size distributions of each sample are also shown (bottom and left). Grain size classes are based on the Udden–Wentworth grade scale.
3.2 Seagrass community composition
Five distinct seagrass species assemblages were identified, hereafter referred to as communities A, B, C, D, and E (Fig. 3). The first two communities, A and B, are monospecific, composed 100 % of Cymodocea serrulata (CS) and Thalassodendron ciliatum (TC), respectively (Fig. 3). Although a single species does not fit the strict definition of a community, we use the terminology for congruity throughout the paper. Community C was comprised mostly of small-bodied, ephemeral species with 67 % Halodule uninervis (HU), 19 % Cymodocea rotundata (CR), 8 % Halophila ovalis (HO), and 1 % Halophila stipulacea (HS) but also contained a small percentage (5 %) of Thalassia hemprichii (TH). Community D was dominated by TH (91 %) with a lesser occurrence of CR (8 %) and TC (1 %). Community E had the highest evenness of all communities with 46 % TH, 26 % CS, 22 % Syringodium isoetifolium (SI), 5 % HU, and 1 % TC.
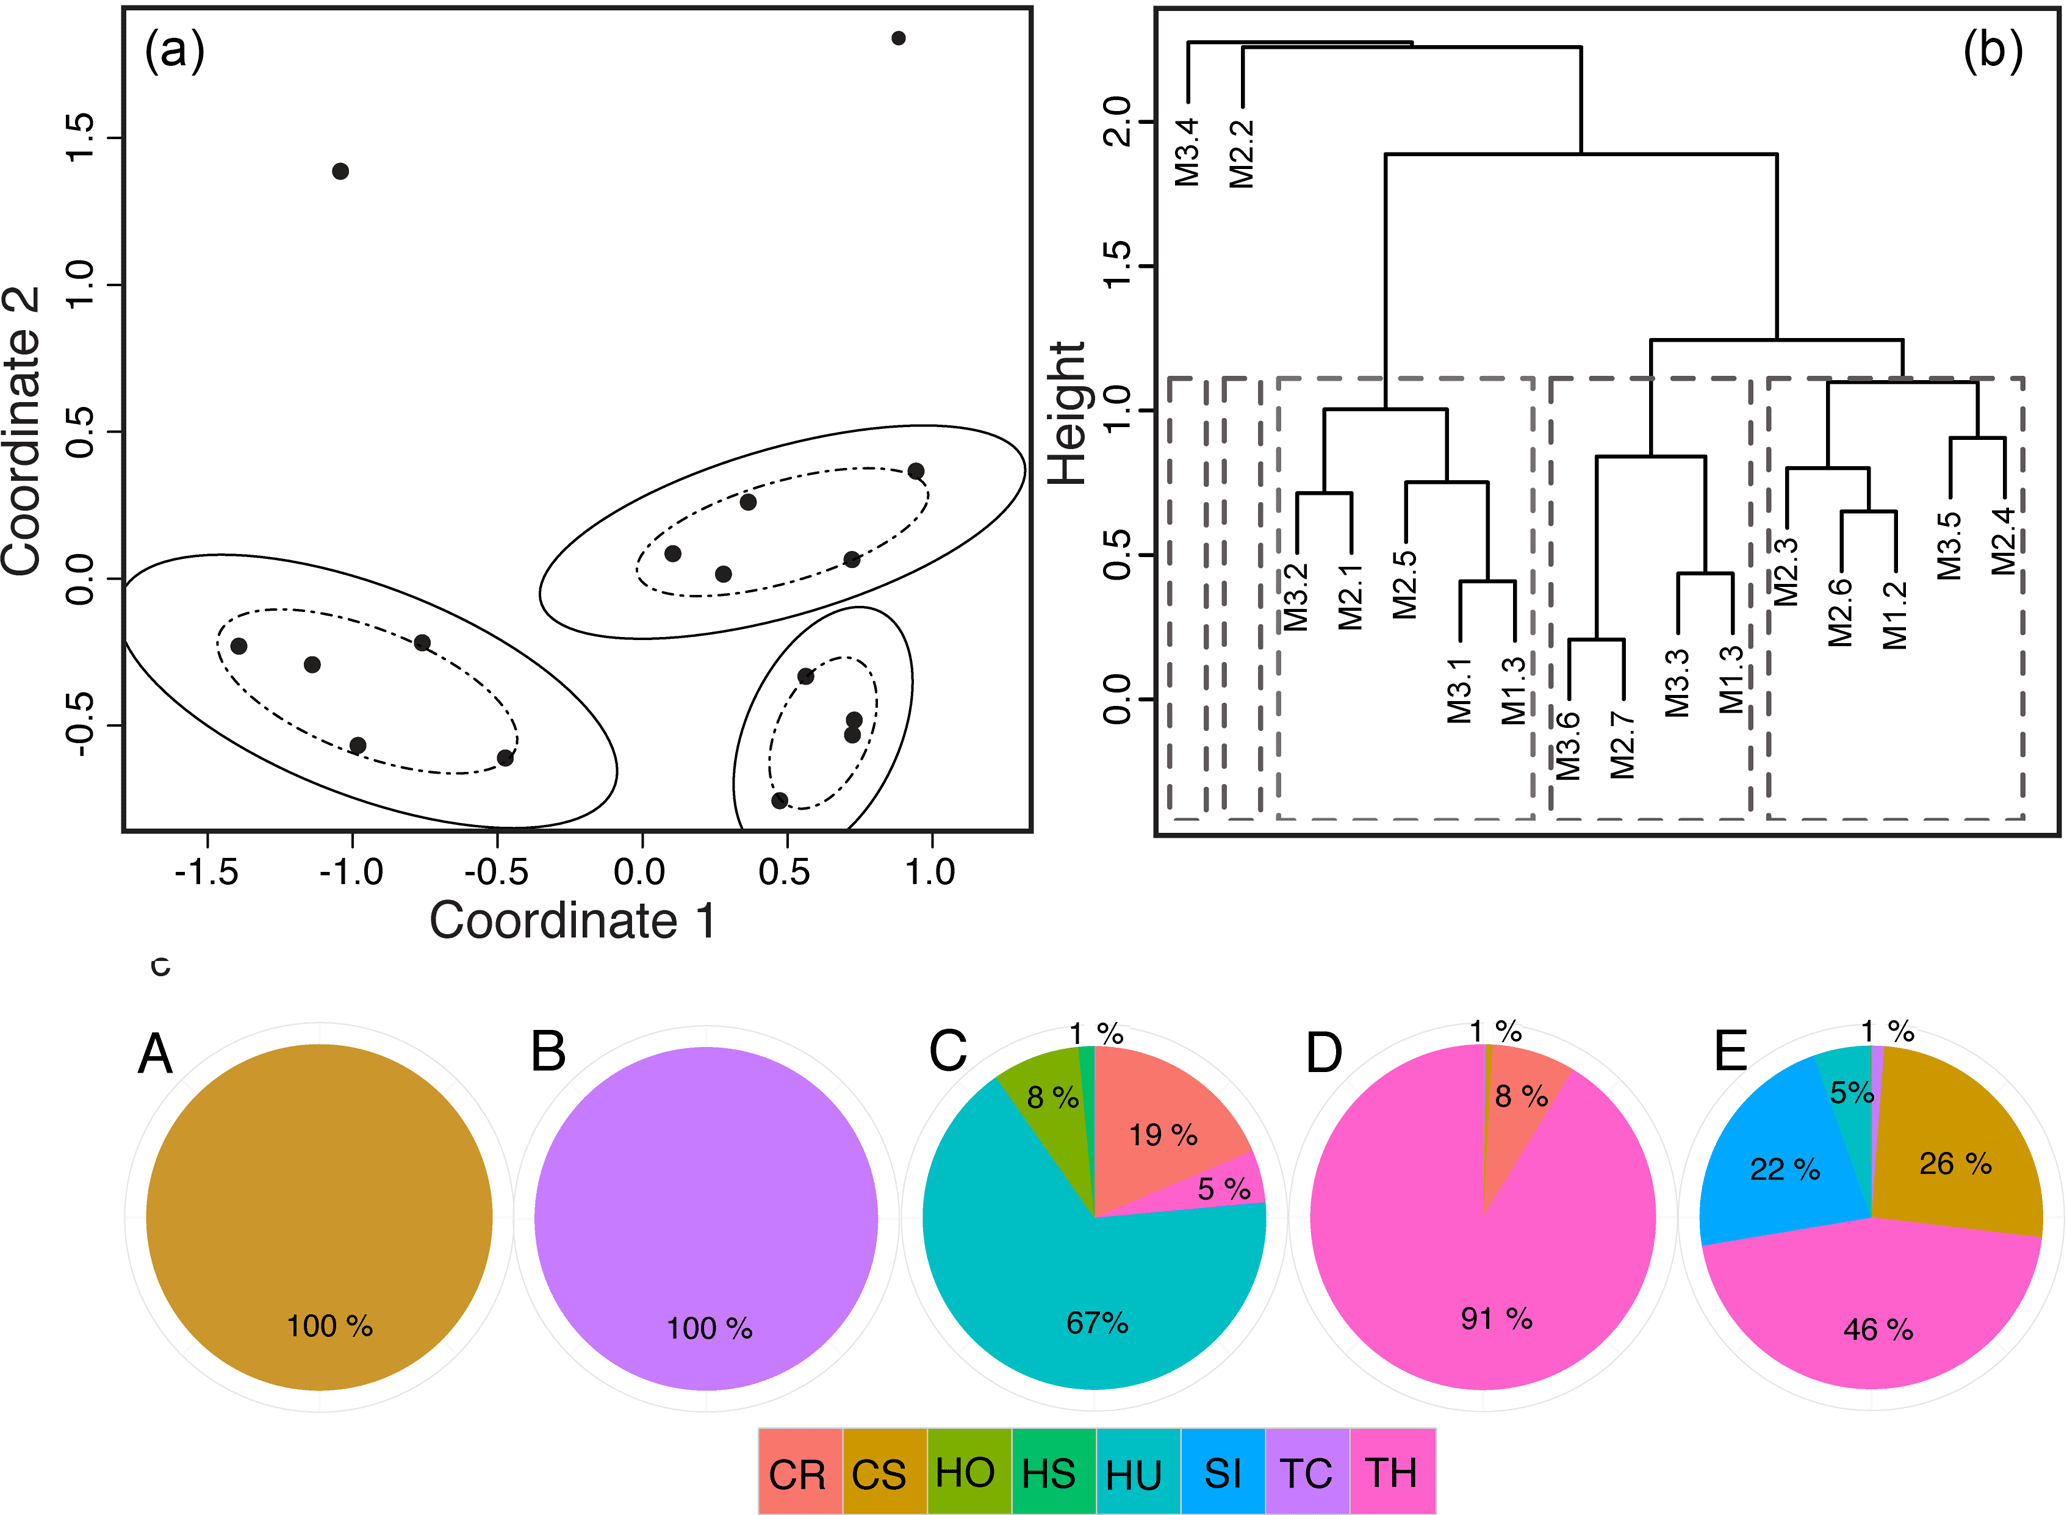
Figure 3Seagrass communities were determined by grouping the 19 sites from three meadows (M1, M2, M3) based on their similarity in seagrass species composition and cover using two methods. First, (a) a NMDS ordination plot was used to group sites (•) into a community if they fell within the dashed and solid ellipses representing the 66 % and 95 % confidence intervals of groupings. Note that within two communities there was 100 % overlap in site similarities, so multiple sites are overlain and confidence ellipses were not plotted. Second, (b) hierarchical cluster analysis converged on the same five communities. Again, because of the high similarity (100 %) of sites within the first two groupings, only one site name is plotted even though multiple sites were grouped into these communities. (c) Pie charts of each community (A–E) show the mean percent cover and species composition, with colors representing the different species: CR: Cymodocea rotundata; CS: Cymodocea serrulata; HO: Holophila ovalis; HS: Halophila stipulacea; HU: Halodule univervis; SI: Syringodium isoetifolium; TC: Thalassodendron ciliatum; TH: Thalassia hemprichii.
3.3 Community traits
There was a significant effect of both community (, p<0.0001) and meadow (, p<0.0001) on AG biomass but no interaction effect (, p=0.128). Community differences were driven by the significantly higher AG biomass in community B (972±74 g DW m−2), which contained at least 7-fold higher AG biomass than the other communities and was dominated by the large-bodied species TC (Fig. 4; Supplement Table S1). There were also significant differences among the other four communities, with community A (127±33 g DW m−2) containing greater AG biomass than communities C, D, and E; community C (38±18 g DW m−2) composed of small-bodied species having the lowest AG biomass; and communities D (69±50 g DW m−2) and E (67±33 g DW m−2) with similar intermediate AG biomass (Fig. 4). Differences among meadows were driven by M3 (96±52 g DW m−2) having significantly less AG biomass than M1 and M2 (M1: 350±72 g DW m−2; M2: 123±40 g DW m−2), which was due to the absence of the high-biomass community B within M3. Within communities, there were no significant among-meadow differences in AG biomass (Table S1).
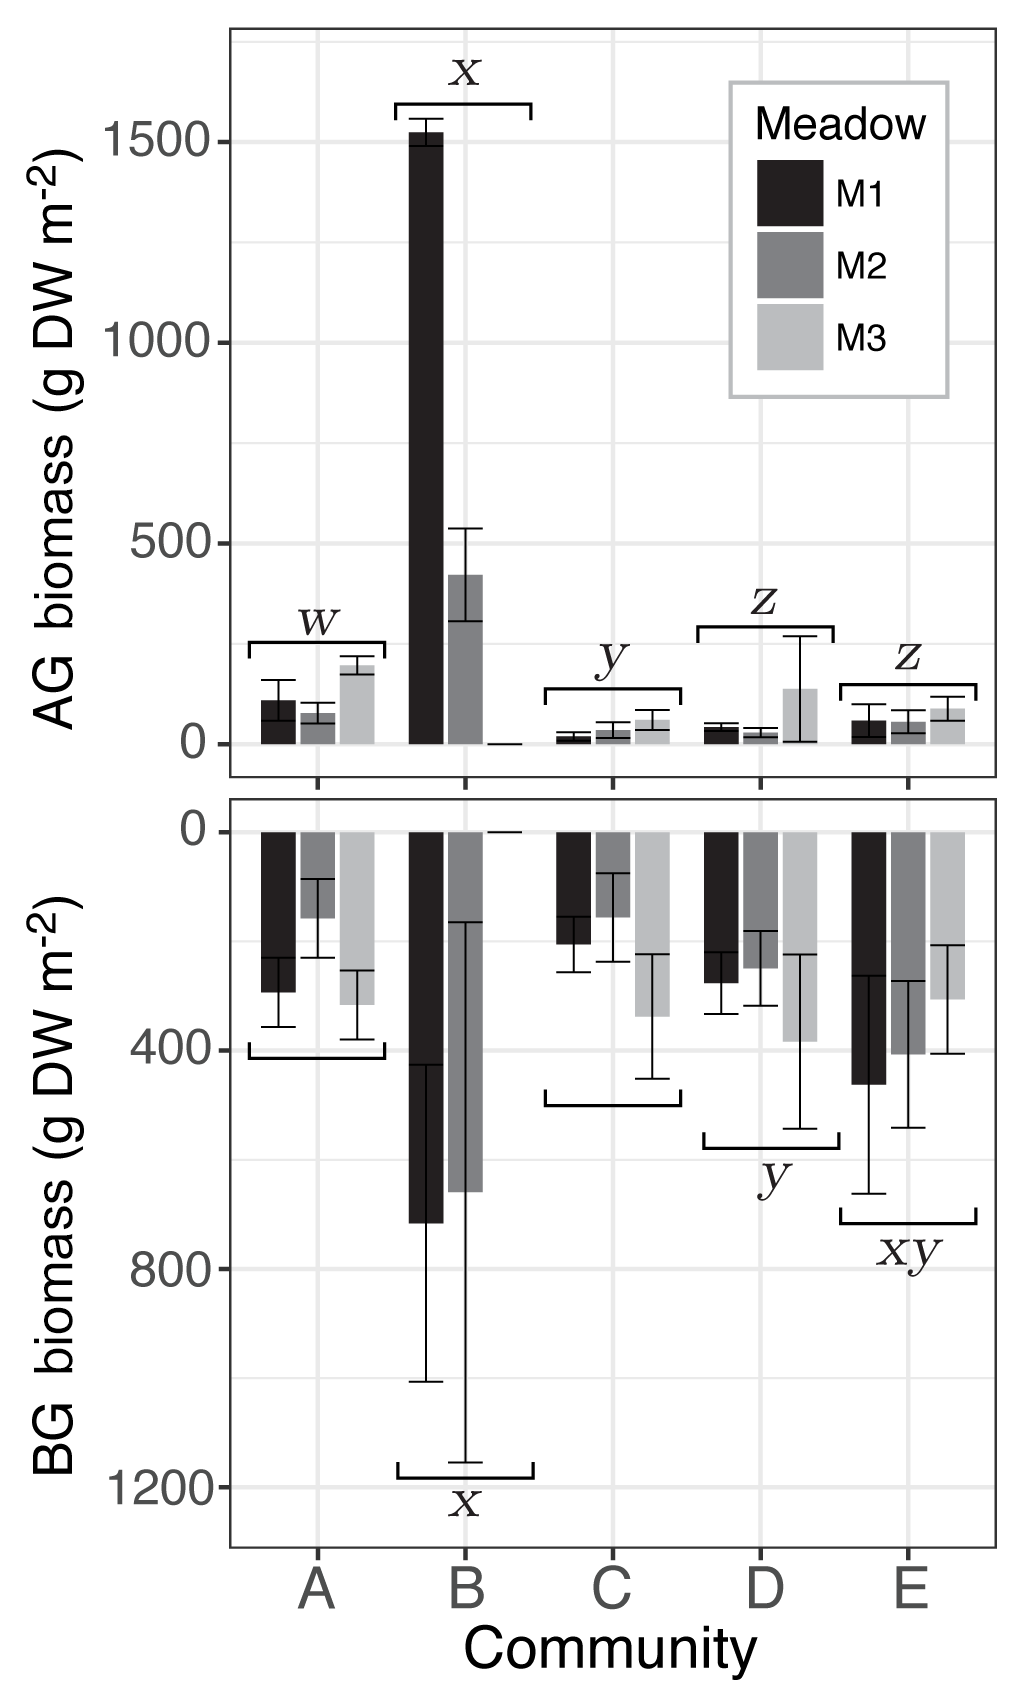
Figure 4Mean seagrass above- (AG) and belowground (BG) biomass (g DW m−2) of sites from the three meadows (M1, M2, M3) for each seagrass community (A–E). Whiskers represent the standard deviation and statistical differences among communities at the significance level p≤0.05 indicated by letters w, x, y, and z. Differences among meadows within each community were tested for with Tukey's post hoc test but no significant differences were found (Tables S2 and S3).
BG biomass followed a similar pattern with significant effects of community (, p<0.0001) and meadow (, p=0.023) but no interaction effect (, p=0.111). Community differences were again mainly driven by a significantly higher BG biomass in the TC-dominated community B (682±392 g DW m−2), which contained on average twice as much BG biomass than the other four communities (Fig. 4). However, BG biomass within community B was not significantly different from community E (392±144 g DW m−2), which had the highest species evenness. BG biomass within community E was not significantly different than community D (303±103 g DW m−2), but was significantly greater than Communities A (256±66 g D Wm−2) and C (233±82 g DW m−2), which contained similarly low BG biomass (Fig. 4; Table S2). Differences among meadows were due to M2 (325±170 g DW m−2) containing on average significantly less BG biomass than meadows 1 and 3 (M1: 390±132 g DW m−2; M3: 335±109 g DW m−2). Within communities, there were no significant among-meadow differences in BG biomass (Table S2).
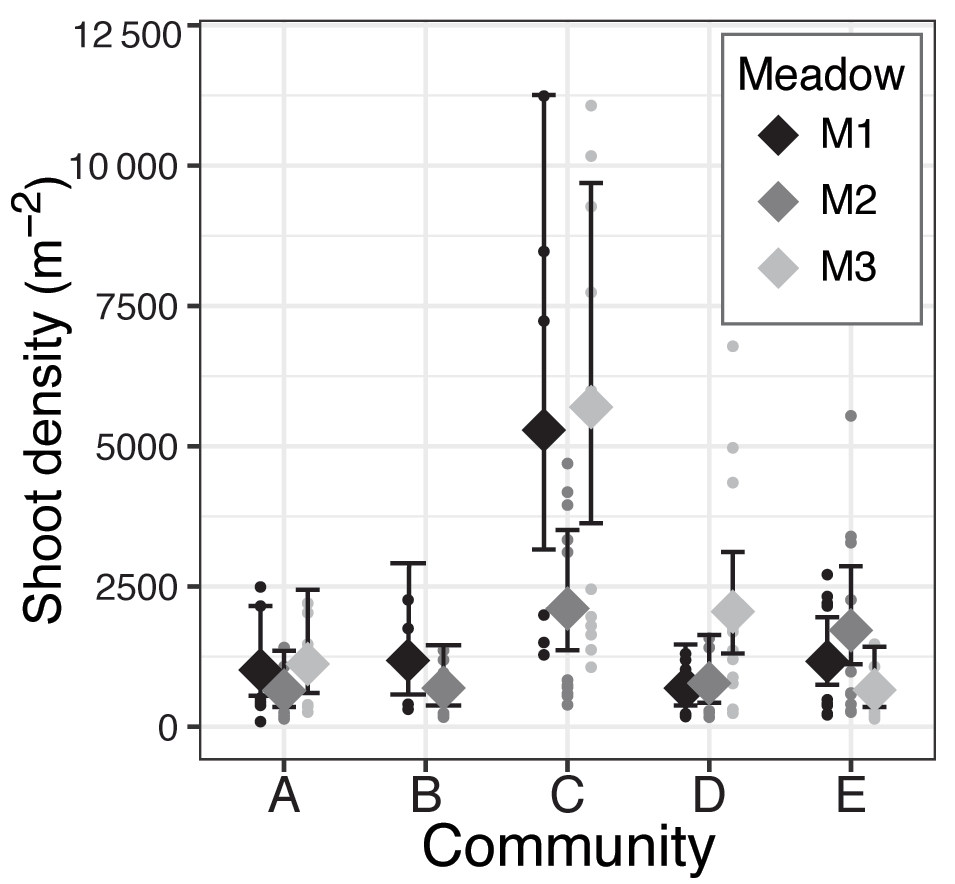
Figure 5Meadow-specific estimated mean (⧫) and 95 % confidence intervals of seagrass shoot density (shoots m−2) for each seagrass community (A–E).
There was a significant effect of community on seagrass short-shoot density (χ2=45.1, df = 4, p<0.001) and a marginally significant effect of meadow (χ2=5.49, df = 2, p=0.064). Community C, dominated by small-bodied ephemeral seagrass species, had the highest shoot density with an estimated mean shoot density of 4178 shoots m−2 (based on the negative binomial model); however, only M1 (M1: 5285 shoots m−2) and M3 (M3: 5696 shoots m−2) were found to contain densities different from other communities (determined by no overlap in 95 % confidence intervals of model predictions, Fig. 5). M2 of community C (M2: 2105 shoots m−2) and the meadow-specific estimated means of the remaining communities were all similar and ranged from 775 to 1781 shoots m−2. Within communities A, B, D, and E, there were no consistent trends or significant differences among meadows in predicted short-shoot densities (Fig. 5).
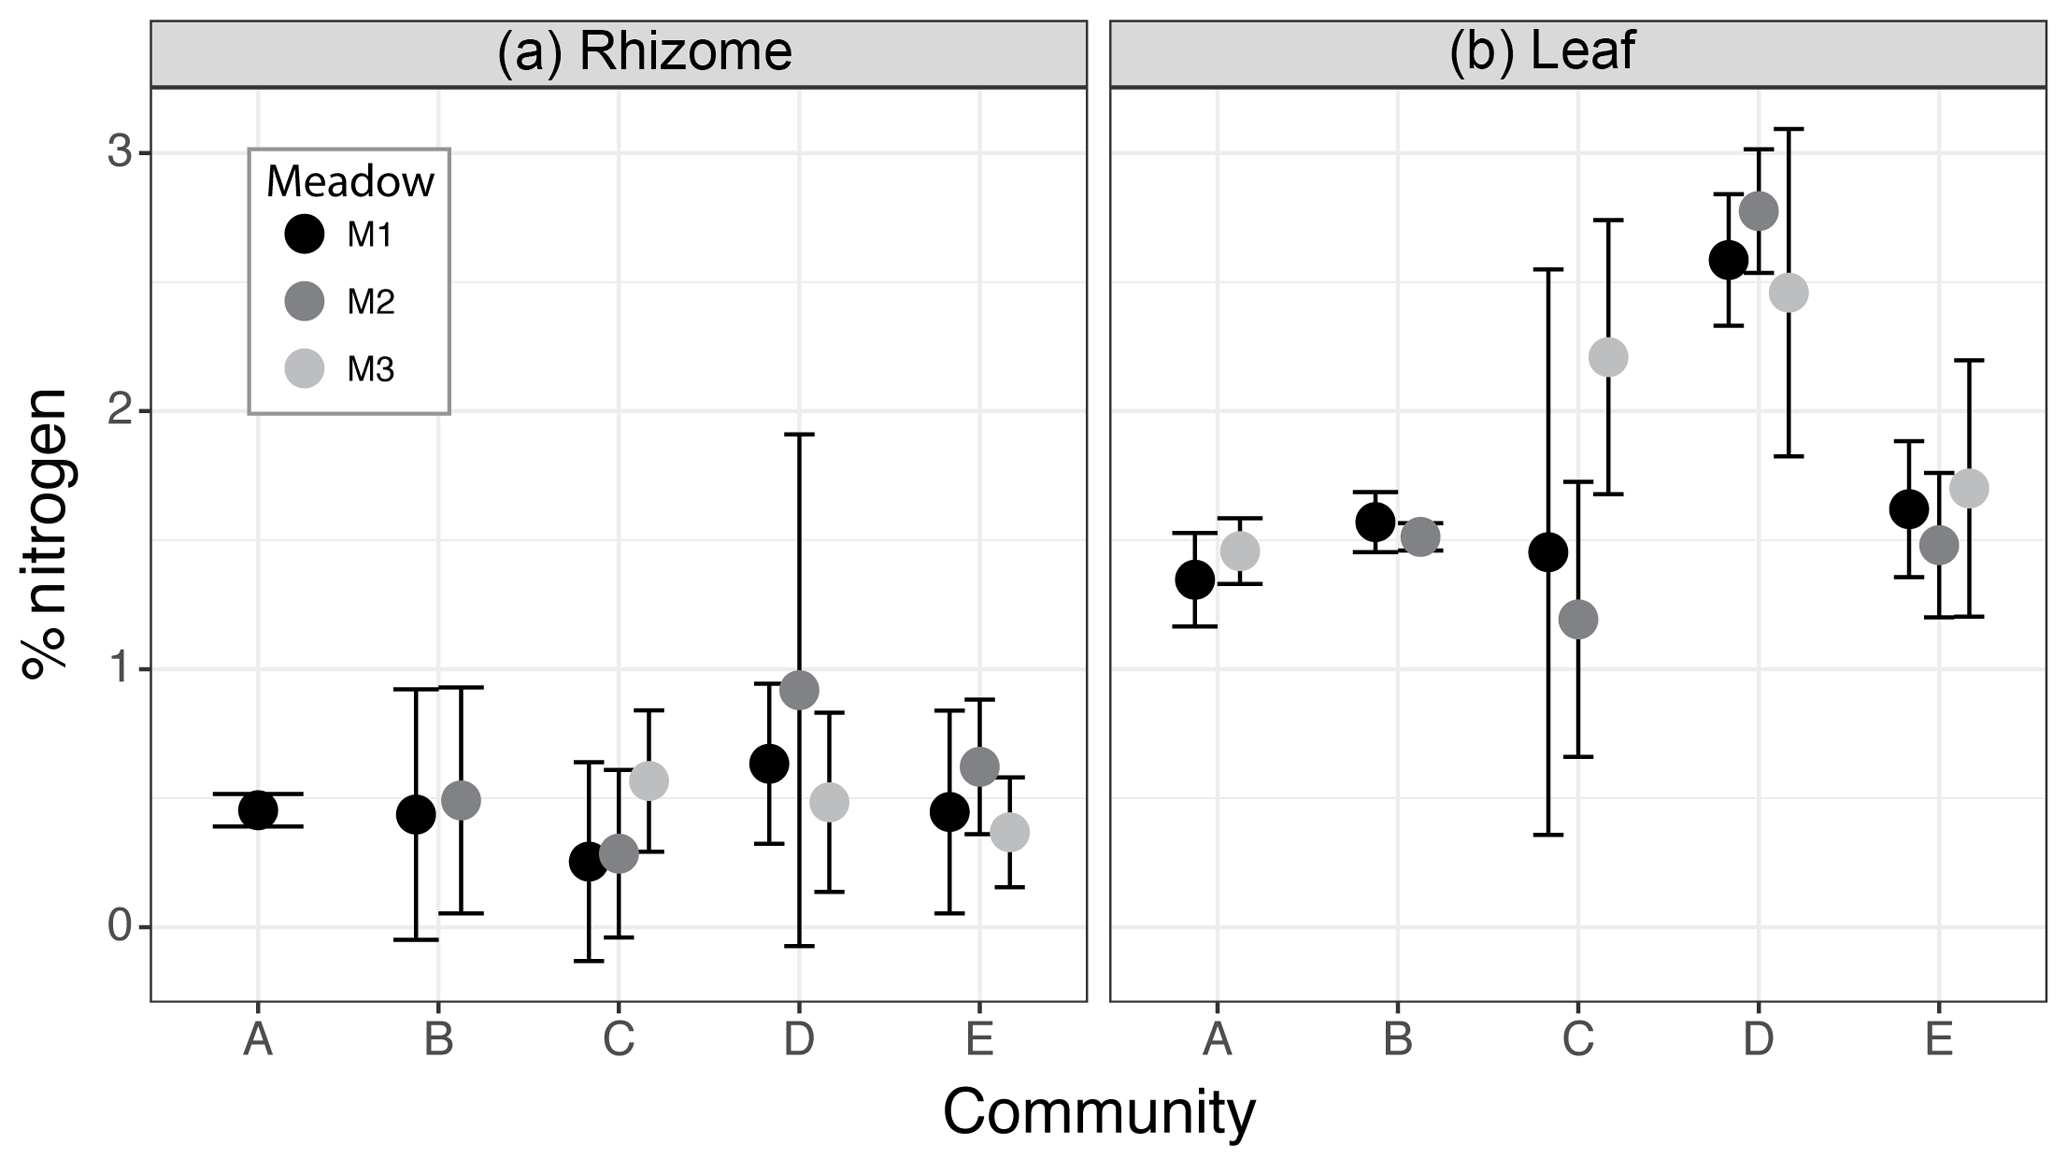
Figure 6Percent nitrogen (N) in rhizome (a) and leaf (b) tissues from seagrass species assemblages of each community specific to each meadow (M1, M2, M3). Circles (•) denote the mean and whiskers the 95 % confidence intervals of the % N weighted by the meadow-specific abundance of each species present within the community (weighted mean ± t0.95 × weighted standard deviation).
The nitrogen content within seagrass leaves varied among seagrass communities (determined by no overlap in 95 % CI), with community D having the highest percentage of nitrogen (M1: 2.58±0.11 %, M2: 2.77±0.10 %, M3: 2.45±0.28 %), which was significantly higher than communities A (M1: 1.34±0.08 %, M3:1.46±0.06 %) and B (M1: 1.56±0.05 %, M2: 1.52±0.04 %) regardless of within community variation due to differences specifically among meadows (Fig. 6). The higher level of leaf nitrogen in community D was driven by the high relative abundance of T. hemprichii, which contained the highest leaf nitrogen (on average 2.46 %) of any seagrass species. Communities C (M1: 1.45±0.48 %, M2: 1.19±0.23 %, M3: 2.20±0.23 %) and E (M1: 1.61±0.11 %, M2: 1.48±0.12 %, M3: 1.70±0.21 %) had intermediate leaf nitrogen concentrations. However, within community C one meadow (M3) contained leaf N content on par with community D due to the presence of C. rotundata (2.2 %N) at this site. Leaf stoichiometry (C : N ratio) was on average within the range of 20–25 for all communities except community D (mean C : N = 16.9, M1: 19.3, M2: 13.8, M3: 17.6). C : N ratios for communities A (mean = 24.3, M1: 25.6, M3: 22.9) and B (mean = 24.5, M1: 23.6, M2: 25.4) were at the upper limit of the range measured for seagrass leaves at our sites.
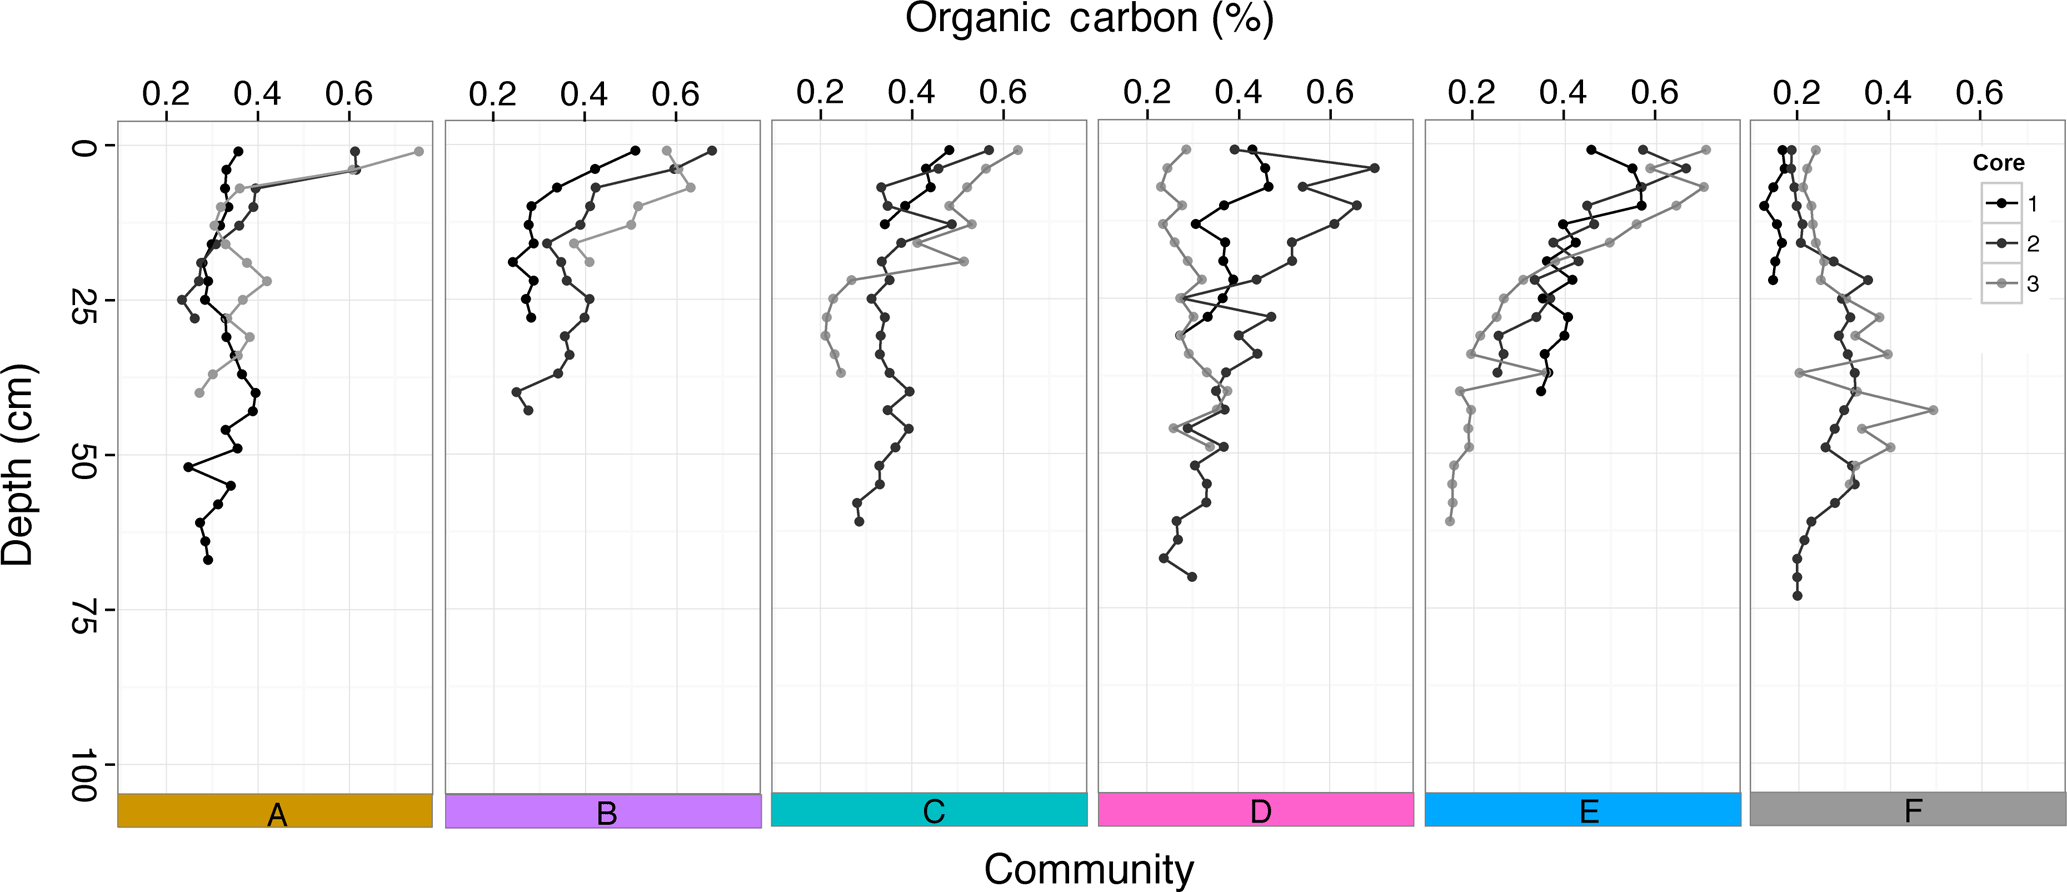
Figure 7Percent organic carbon at different depths (cm) down each sediment core taken within the five seagrass communities (A–E) and bare sediment (F).
The nitrogen content within seagrass rhizomes did not significantly vary among communities or meadows, with the weighted mean percentage of nitrogen in all communities across all meadows ranging from 0.42 % to 0.67 % (Fig. 6) and rhizome C : N ratios ranging from 78 to 97. However, within community D there was notably higher variability in rhizome nitrogen content within M2, which had the highest tissue %N (0.92 %) due to the high relative abundance (74 %) of Thalassia hemprichii.
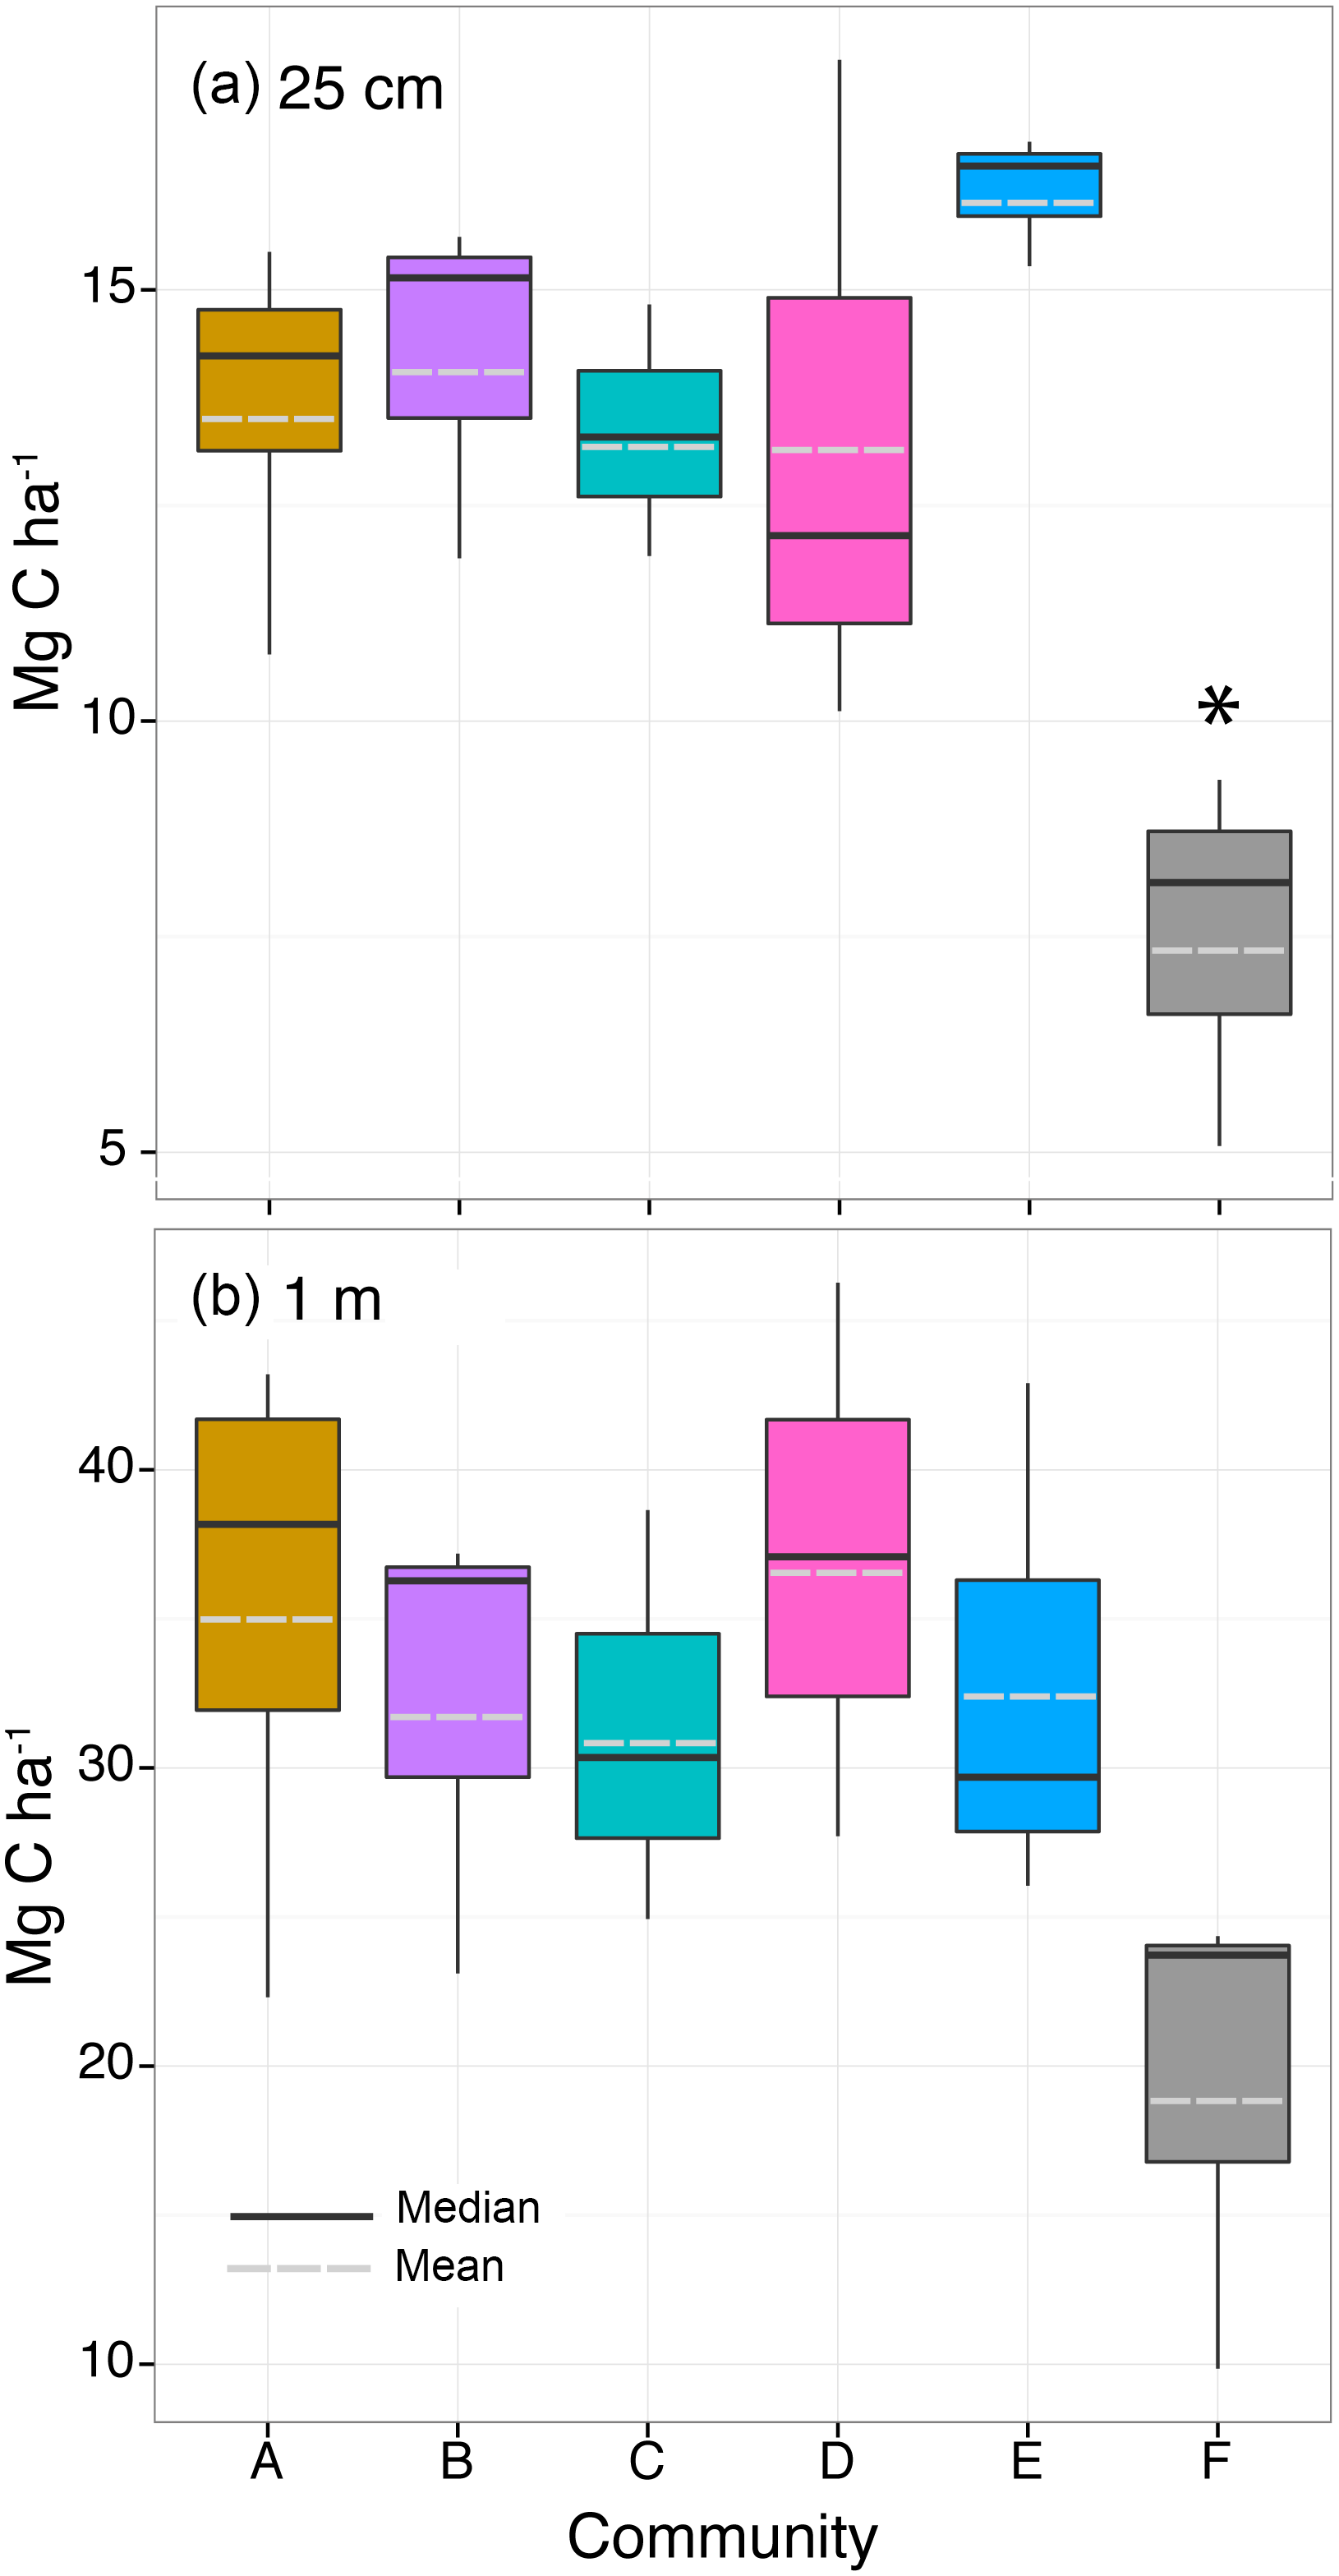
Figure 8Organic carbon storage of (a) the top 25 cm of the sediment and (b) the top meter of sediment within the five seagrass communities (A–E) and bare sediment (F). Box and whiskers denote the 25th and 75th and the 5th and 95th quartiles, respectively, with the solid line denoting the median and dashed line denoting the mean. Statistical difference at the significance level p≤0.05 is indicated by the asterisk (*).
3.4 Sediment carbon
The percentage of OC within the sediment was low within all communities (A–E), varying from a maximum of 0.75 % in surface sediments to a minimum of 0.15 % down core (Fig. 7). There were no differences in %OC in the top 25 cm (where all cores had data) among seagrass communities (A–E; , p=0.34) or among meadows (, p=0.09) but there was significantly higher %OC in communities with seagrass (A–E) compared to bare sediment (F, , p=0.004; Table S3). Most cores (13 out of 18) exhibited the typical trend of decreasing %OC with depth into the sediment, with the notable exception of two cores taken adjacent to seagrass meadows (F: bare sediment; Fig. 7), where %OC increased with depth, which calls into question our assumption that seagrass meadow extent has not changed over time. Sediment bulk density ranged from 0.939 to 1.714 g DW cm−3, with mean and median values of 1.303 and 1.299 g DW cm−3, respectively (Fig. S3). Patterns in sediment OC density (g OC cm−3) mirrored the trends seen in %OC (Fig. S4).
The OC stored within the top 25 cm of sediment did not differ among seagrass communities (A–E, , p=0.30) or among meadows (, p=0.08) and was low, on average 14.1±2.2 Mg C ha−1, but was significantly higher than adjacent bare sediment (7.5±2.1 Mg C ha−1, , p = 0.002; Fig. 8; Table S3). Similarly, OC stored down to 1 m did not differ among seagrass communities (A–E, , p=0.93) or meadows (, p=0.99) and was on average 33.9±7.7 Mg C ha−1, but with the gap-filled data there was no longer a significant difference in OC storage between seagrass communities and bare sediment (19.3±8.2 Mg C ha−1, , p=0.28).
In three seagrass meadows off the coast of Zanzibar City, Tanzania, we identified five distinct seagrass communities. Even with the natural variation across meadows there were still notable differences among communities in key plant traits shown to influence ecological processes linked to OC sequestration and storage in other ecosystems (Aerts and Chapin, 2000; Chapin, 2003; Díaz et al., 2004). However, these trait differences did not translate into differences in sediment OC stocks among seagrass communities. The OC storage in the top 25 cm (14.1±2.2 Mg C ha−1) or the top 1 m (33.9±7.7 Mg C ha−1) of sediment at our sites was comparatively lower than the global average (194.2±20.2 Mg C ha−1 in the top 1 m) for seagrass ecosystems (Fourqurean et al., 2012a); however, it fell within the range of storage (1.9 to 293 Mg C ha−1) reported for seagrass sediments within the tropical Indo-Pacific bioregion (Alongi et al., 2016; Campbell et al., 2014; Fourqurean et al., 2012a; Miyajima et al., 2015; Phang et al., 2015; Rozaimi et al., 2017; Schile et al., 2016). Compared to other sites within the Indo-Pacific bioregion, OC storage at our sites was lower than stocks reported for meadows in Thailand (37.5 to 120.5 Mg C ha−1; Miyajima et al., 2015), Malaysia (46 to 70 Mg C ha−1; Rozaimi et al., 2017), Indonesia (34.3 to 293.3 Mg C ha−1; Alongi et al., 2016), and Singapore (129.4 to 149.6 Mg C ha−1; Phang et al., 2015). Although, in comparison to sites on the western side of the Indo-Pacific region, our sites' OC stocks fell within the range reported for sites in the Arabian Gulf (1.9 to 109 Mg C ha−1; Campbell et al., 2014), Zanzibar, mainland Tanzania, and Mozambique (21.3 to 73.8 Mg C ha−1 in the top 50 cm; Gullström et al., 2017).
A clear contrast emerges when comparing OC storage within community B, dominated by the large-bodied, persistent species T. ciliatum, to locations that contain seagrass species with similar life-history strategies and traits. Even with the combined attributes of producing a high quantity (AG biomass: 972±74 g DW m−2; BG biomass: 682±392 g DW m−2) of low-quality tissues (leaf: 1.54±0.05 %N; rhizome: 0.46±0.2 %N), community B's sediment OC stocks (32.2±7.9 Mg C ha−1) were at least 3-fold lower than what has been reported for Posidonia oceanica (105 to 829 Mg C ha−1), Thalassia testudinum (124 to 210 Mg C ha−1), and Amphibolis antarctica (115 to 335 Mg C ha−1) meadows (Fourqurean et al., 2012b; Mateo et al., 1997; Serrano et al., 2012, 2014). All of these species possess traits that place them on the slow conservation side of the plant economic spectrum associated with higher ecosystem OC storage (Díaz et al., 2004; Orth et al., 2006; Reich, 2014; Wright et al., 2004). The breakdown of the relationship between plant traits and OC storage in this study indicates that other factors may be interacting to control OC deposition and/or stabilization within the sediment.
On the one hand, water flow at our sites is energetic with moderate to high current velocities (ranging from 0.25 to 2 ms−1; Shaghude et al., 2002), sediments are poorly sorted, and both sediment accumulation and the amount of fine sediment (∼ 1 % < 63 size fraction) is low (Table 1). These ecosystem properties are characteristic of low-deposition environments and would support the viewpoint that low OC deposition of AG autochthonous litter and allochthonous inputs limits OC accumulation. However, the high autochthonous inputs of BG tissues (up to 1074 g DW m−2) at our sites places up to an estimated 386.6 g OC m−2 directly into the sediment, providing direct evidence that OC enters the sediment. The C : N ratio (97) of these BG inputs approaches a theoretical threshold (100) at which litter decomposition greatly slows due to nutrient limitation of decomposers (Zechmeister-Boltenstern et al., 2015), and if the tissues of T. ciliatum are similar to other long-lived seagrass species they contain a high abundance of complex chemical compounds such as lignin (Kaal et al., 2016; Klap et al., 2000; Papenbrock, 2012; Trevathan-Tackett et al., 2017). Low OC storage with high autochthonous inputs gives greater weight to the argument that OC is not stabilized within the coarse, shallow sediments of our sites, despite the low quality of seagrass inputs.
These results fit within the emerging framework that the stabilization of OC within soils and sediments is a whole-ecosystem property (Lehmann and Kleber, 2015; Schmidt et al., 2011). This view posits that all organic matter can decay quickly if conditions are right (Gramss et al., 1999; Hamer et al., 2004; Hazen et al., 2010; Wiesenberg et al., 2004). However, decomposition can be altered by ecosystem properties that impede the microbial access to, or remineralization of, certain molecules (Lehmann and Kleber, 2015; Schmidt et al., 2011). For example, in sediments with low oxygen concentrations, the decomposition of complex, recalcitrant OC can be impeded (due to a lack of electron acceptors or enzyme cofactors that require oxygen), resulting in the selective preservation of oxygen-sensitive OC (Arnarson and Keil, 2007; Burdige, 2007; Burdige and Lerman, 2006; Hedges and Keil, 1995; 1999; Keil and Mayer, 2014). Likewise, sediment mineralogy and aggregation can reduce the bioavailability and accessibility of OC to microbes and enzymes (Arnarson and Keil, 2001; 2007; Hedges and Keil, 1999; Keil and Mayer, 2014; Mikutta et al., 2006; Schrumpf et al., 2013; Six et al., 2004; 1998; Sollins et al., 1996; Tisdall and Oades, 1982). Alternatively, in the absence of ecosystem controls, even low-quality, chemically complex compounds such as lignin can be degraded relatively quickly (Dittmar and Lara, 2001). This view shifts plant input quality into an auxiliary role, with the persistence of sediment OC ultimately determined by geophysical properties of the sediment.
The modulation of the role of plant traits in OC storage by sediment properties is seen when comparing our sites on the western coast of Unguja Island, Zanzibar, to meadows located on the south and east coasts of the island. At these other locations, sediment OC storage is 2 to 3 times higher than what was measured at our sites (40.7 to 73.8 Mg C ha−1 in the top 50 cm) and is positively correlated to seagrass biomass at the landscape scale, with the largest stocks located in sediments beneath large, persistent species (Gullström et al., 2017). T. ciliatum occurs at all locations and contains similar amounts (AG biomass: 556±200 g DW m−2; BG biomass: 983±564 g DW m−2) of low-elemental-quality (AG tissue %N: 1.4±0.1; BG tissue %N: 0.7±0.1) plant tissues (Gullström et al., 2017). What does differ between our sites and these meadows to the south and east are the sediments. The biogenic carbonate sediments that occur on the western side (where our sites occur) differ greatly from the eastern and southern coasts of the island (Shaghude et al., 1999). The western carbonate sediments are composed of reef foraminifera, mollusk, echinoderm, and coral components and are characterized as coarse gravelly sand (Table 1), whereas the eastern and southern sediments are composed primarily of remnants from calcareous green algae (Halimeda spp.; Shaghude et al., 1999), which form algal mounds, allowing for greater deposition of fine particles and deeper accumulations of carbonate mud (Kangwe et al., 2012; Muzuka et al., 2005). The narrow range of sediment properties found across the three meadows we sampled leaves us only the ability to piece together trends with data from others' work and speculate that differences in OC storage among regions of the island are due to the disparity in sediment characteristic since plant traits were similar. Another limitation of this work is that we are unable to identify the exact control(s) within the sediment environment controlling OC stabilization (or lack thereof), though we hypothesize it is linked to oxygen availability and sediment structure (accessibility).
However, this study does add a key piece to the growing body of evidence showing that geophysical conditions of the sediment modulate the importance of plant traits in regards to retention of OC within blue carbon ecosystems (Alongi et al., 2016; Armitage and Fourqurean, 2016; Campbell et al., 2014; Dahl et al., 2016; Miyajima et al., 2017; Röhr et al., 2016; Samper-Villarreal et al., 2016; Serrano et al., 2016a). Here we show that once sediments become very coarse and shallow, large inputs of low-quality seagrass OC are not necessarily stabilized against microbial decay. This extends and contrasts previous work from sites without high sediment loading and fine sediments, which show plant traits (biomass, density, and cover) became better predictors for OC storage as sediments become more coarse (Dahl et al., 2016). This increase in explanatory power by plant characteristics as sediments become coarser was also shown for large-bodied, persistent species (Posidonia spp. and Amphibolis spp.) inhabiting more exposed sites (Serrano et al., 2016a). Sites with the largest stores of OC recorded for seagrass are negligibly correlated with fine-sediment content and occur within dense meadows of the long-lived species P. oceanica, which form and persist in stable environments without high sediment inputs (Peirano and Bianchi, 1995; Serrano et al., 2012; Serrano et al., 2016a). However, as the abundance of fine sediments increases, OC storage can be high even in meadows composed of species with fast traits, and characteristics of the sediment become better predictors of OC content (Dahl et al., 2016; Lavery et al., 2013; Röhr et al., 2016; Serrano et al., 2016a; van Katwijk et al., 2011). A positive correlation between fine sediment and OC storage has been shown for small-bodied seagrass species at 20 sites across three bioregions (temperate Southern Ocean, tropical Indo-Pacific, and Mediterranean; Serrano et al., 2016a). At adjacent estuarine sites in Thailand with a high contribution of terrestrial inputs and fine sediment, a relatively smaller-bodied seagrass (Cymodocea serrulata: 120 Mg C ha−1) had higher OC storage than the large-bodied, persistent seagrass (Enhalus acoroides: 86 Mg C ha−1; Miyajima et al., 2015). A similar association between high OC storage and fine sediment was demonstrated across a range of conditions in the temperate North Atlantic for the small-bodied species Zostera marina (Dahl et al., 2016). Based on the results presented here, in combination with the findings outlined above, we hypothesize the interaction between plant traits and sediment properties is nonlinear, with the effect of sediment properties dominating at the extremes of the sediment spectrum. In high depositional environments with an abundance of fine sediments, characteristics of the sediment overshadow the effect of plant traits on OC storage. In moderate depositional areas with coarser sediments, the importance of plant traits increases and meadows with slow traits tend to store more OC. And finally, this study shows that once the flow regime becomes energetic enough to create very coarse sediments and sediment limitation, properties of the sediment can again outweigh plant traits to limit OC storage even under meadows with traits conducive to OC storage.
This study, placed into the context of the growing body of evidence of the large variation in OC storage in seagrass ecosystems (Campbell et al., 2014; Dahl et al., 2016; Lavery et al., 2013; Miyajima et al., 2015; Röhr et al., 2016; Samper-Villarreal et al., 2016; Serrano et al., 2014, 2016a, b), illustrates the complexity of controls and mechanisms that govern OC storage in seagrass sediments. Even within meadows with similar environmental conditions, data on plant traits or carbon sources (as a proxy for OC input quality) cannot alone provide a full picture of the location or magnitude of sediment OC; therefore, we caution against their singular use as proxies for OC storage. Future efforts should focus on quantifying the interactions among properties of OC inputs (quantity and quality) and a suite of geophysical sediment properties, including mineralogy, structure, and the full range of the grain size distribution. Once these interactions can be quantified, spatial information on sediment parent material (Hartmann and Moosdorf, 2012) and composition can be integrated with data on seagrass characteristics and extent to better model the spatial variability in OC storage within seagrass sediments.
In this study, we were unable to link variations in plant traits to differences in sediment OC stocks within diverse seagrass meadows off the coast of Zanzibar City, Tanzania. Geophysical constraints of the sediment outweighed any effects of trait differences on OC stabilization and resulted in low OC storage across all seagrass communities despite high inputs of low-quality OC within some communities. In spite of being constrained within the particular environment, seagrasses still managed to store twice as much OC as bare sediment. This highlights the importance of seagrass habitats for OC cycling in coastal marine ecosystems; however, further research is needed to identify under which geophysical conditions seagrass traits can be linked to the ecosystem function of OC storage.
The data are available from the first author upon request.
The supplement related to this article is available online at: https://doi.org/10.5194/bg-15-4609-2018-supplement.
All authors contributed to this paper; specifically, EFB contributed to the design, data acquisition, analysis, and interpretation and wrote the first draft of the paper. DH contributed to the design, data acquisition, and analysis and provided a critical review of the paper. NH contributed to the design, data acquisition, and analysis and provided a critical review of the paper. MM contributed to the design and data acquisition and critically revised the paper. MT contributed to the design, and data interpretation and critically revised the paper. All authors read and approved the final version of the paper.
The authors declare that they have no conflict of interest.
This project was carried out within the framework of and through funding
provided by the Leibniz Graduate School SUTAS (Sustainable Use of Tropical
Aquatic Systems; SAW-2013-ZMT-4) and the Leibniz Centre for Tropical Marine
Research (ZMT) based in Bremen, Germany. Elizabeth Fay Belshe was supported by the
German Academic Exchange Service (DAAD) with funds from the German Federal
Ministry of Education and Research (BMBF) and the People Programme (Marie
Curie Actions) of the European Union's Seventh Framework Programme
(FP7/2007-2013) under REA grant agreement no. 605728 (P.R.I.M.E. –
Postdoctoral Researchers International Mobility Experience). Dieuwke Hoeijmakers
and Natalia Herran were supported by SUTAS and Mirta Teichberg was supported by the
German Research Foundation (DFG) within the Individual Grants Program,
project SEAMAC, TE 1046/3-1. We thank the following people and organizations
that supported this work: Dr. Christopher Muhando and Dr. Narriman S. Jiddawi at the Institute of
Marine Sciences (IMS), University of Dar es Saalam, and Uli Kloiber and team
from the Chumbe Island Coral Park Ltd. (CHICOP). Lastly, we would like to
thank Dr. Benjamin Bolker (McMaster University, Canada) for support and
advice on modeling procedures and statistical analysis.
Edited by: Peter van Bodegom
Reviewed by: two anonymous referees
Aerts, R. and Chapin III, F. S.: The Mineral Nutrition of Wild Plants Revisited: A Re-evaluation of Processes and Patterns, Adv. Ecol. Res., 30, 1–67, 2000.
Alongi, D. M., Murdiyarso, D., Fourqurean, J. W., Kauffman, J. B., Hutahaean, A., Crooks, S., Lovelock, C. E., Howard, J., Herr, D., Fortes, M., Pidgeon, E., and Wagey, T.: Indonesia's blue carbon: a globally significant and vulnerable sink for seagrass and mangrove carbon, Wetl. Ecol. Manag., 24, 3–13, https://doi.org/10.1007/s11273-015-9446-y, 2016.
Armitage, A. R. and Fourqurean, J. W.: Carbon storage in seagrass soils: long-term nutrient history exceeds the effects of near-term nutrient enrichment, Biogeosciences, 13, 313–321, https://doi.org/10.5194/bg-13-313-2016, 2016.
Arnarson, T. S. and Keil, R. G.: Organic–mineral interactions in marine sediments studied using density fractionation and X-ray photoelectron spectroscopy, Org. Geochem., 32, 1401–1415, 2001.
Arnarson, T. S. and Keil, R. G.: Changes in organic matter–mineral interactions for marine sediments with varying oxygen exposure times, Geochim. Cosmochim. Ac., 71, 3545–3556, https://doi.org/10.1016/j.gca.2007.04.027, 2007.
Barbier, E. B., Hacker, S. D., Kennedy, C., Koch, E. W., Stier, A. C., and Silliman, B. R.: The value of estuarine and coastal ecosystem services, Ecol. Monogr., 81, 169–193, 2011.
Belshe, E. F., Mateo, M. Á., Gillis, L., Zimmer, M., and Teichberg, M.: Muddy Waters: Unintentional Consequences of Blue Carbon Research Obscure Our Understanding of Organic Carbon Dynamics in Seagrass Ecosystems, Front. Mar. Sci., 4, 522–9, https://doi.org/10.3389/fmars.2017.00125, 2017.
Berg, B. and McClaugherty, C.: Plant Litter, 3rd Edn., Springer, New York, 2014.
Birouste, M., Kazakou, E., Blanchard, A., and Roumet, C.: Plant traits and decomposition: are the relationships for roots comparable to those for leaves?, Ann. Bot., 109, 463–472, https://doi.org/10.1093/aob/mcr297, 2012.
Blott, S. J. and Pye, K.: Gradistat: A grain size distribution and statistics package for the analysis of unconsolidated sediments, Earth Surf. Proc. Land., 26, 1237–1248, https://doi.org/10.1002/esp.261, 2001.
Bray, J. R. and Curtis, J. T.: An ordination of the upland forest communities of Southern Wisconsin, Ecol. Monogr., 27, 325–349, 1957.
Burdige, D. J.: Preservation of Organic Matter in Marine Sediments:? Controls, Mechanisms, and an Imbalance in Sediment Organic Carbon Budgets?, Chem. Rev., 107, 467–485, 2007.
Burdige, D. J. and Lerman, A.: Geochemistry of Marine Sediments, Princeton University Press, 2006.
Campbell, J. E., Lacey, E. A., Decker, R. A., Crooks, S., and Fourqurean, J. W.: Carbon Storage in Seagrass Beds of Abu Dhabi, United Arab Emirates, Estuar. Coast., 38, 243–251, https://doi.org/10.1007/s12237-014-9802-9, 2014.
Chapin III, F. S.: Effects of Plant Traits on Ecosystem and Regional Processes: a Conceptual Framework for Predicting the Consequences of Global Change, Ann. Bot., 91, 455–463, https://doi.org/10.1093/aob/mcg041, 2003.
Christianen, M. J. A., van Belzen, J., Herman, P. M. J., van Katwijk, M. M., Lamers, L. P. M., van Leent, P. J. M., and Bouma, T. J.: Low-Canopy Seagrass Beds Still Provide Important Coastal Protection Services, PLoS ONE, 8, e62413, https://doi.org/10.1371/journal.pone.0062413, 2013.
Conti, G. and Díaz, S.: Plant functional diversity and carbon storage – an empirical test in semi-arid forest ecosystems, J. Ecol., 101, 18–28, https://doi.org/10.1111/1365-2745.12012, 2012.
Cornwell, W. K., Cornelissen, J. H. C., Amatangelo, K., Dorrepaal, E., Eviner, V. T., Godoy, O., Hobbie, S. E., Hoorens, B., Kurokawa, H., Pérez-Harguindeguy, N., Quested, H. M., Santiago, L. S., Wardle, D. A., Wright, I. J., Aerts, R., Allison, S. D., van Bodegom, P., Brovkin, V., Chatain, A., Callaghan, T. V., Díaz, S., Garnier, E., Gurvich, D. E., Kazakou, E., Klein, J. A., Read, J., Reich, P. B., Soudzilovskaia, N. A., Vaieretti, M. V., and Westoby, M.: Plant species traits are the predominant control on litter decomposition rates within biomes worldwide, Ecol. Lett., 11, 1065–1071, https://doi.org/10.1111/j.1461-0248.2008.01219.x, 2008.
Costanza, R., d'Arge, R., de Groot, R., Farber, S., Grasso, M., Hannon, B., Limburg, K., Naeem, S., O'Neill, R. V., Paruelo, J., Raskin, R. G., Sutton, P., and van den Belt, M.: The value of the world's ecosystem services and natural capital, Nature, 387, 253–260, https://doi.org/10.1038/387253a0, 1997.
Costanza, R., de Groot, R., Sutton, P., van der Ploeg, S., Anderson, S. J., Kubiszewski, I., Farber, S., and Turner, R. K.: Changes in the global value of ecosystem services, Glob. Environ. Change, 26, 152–158, https://doi.org/10.1016/j.gloenvcha.2014.04.002, 2014.
Dahl, M., Deyanova, D., Gütschow, S., Asplund, M. E., Lyimo, L. D., Karamfilov, V., Santos, R., Björk, M., and Gullström, M.: Sediment Properties as Important Predictors of Carbon Storage in Zostera marina Meadows: A Comparison of Four European Areas, PLoS ONE, 11, e0167493, https://doi.org/10.1371/journal.pone.0167493, 2016.
de Bello, F., Lavorel, S., Díaz, S., Harrington, R., Cornelissen, J. H. C., Bardgett, R. D., Berg, M. P., Cipriotti, P., Feld, C. K., Hering, D., Martins da Silva, P., Potts, S. G., Sandin, L., Sousa, J. P., Storkey, J., Wardle, D. A., and Harrison, P. A.: Towards an assessment of multiple ecosystem processes and services via functional traits, Biodivers. Conserv., 19, 2873–2893, https://doi.org/10.1007/s10531-010-9850-9, 2010.
de Chazal, J., Quetier, F., Lavorel, S., and Van Doorn, A.: Including multiple differing stakeholder values into vulnerability assessments of socio-ecological systems, Glob. Environ. Change, 18, 508–520, https://doi.org/10.1016/j.gloenvcha.2008.04.005, 2008.
De Deyn, G. B., Cornelissen, J. H. C., and Bardgett, R. D.: Plant functional traits and soil carbon sequestration in contrasting biomes, Ecol.. Lett., 11, 516–531, https://doi.org/10.1111/j.1461-0248.2008.01164.x, 2008.
de la Torre Castro, M. and Rönnbäck, P.: Links between humans and seagrasses – an example from tropical East Africa, Ocean Coast. Manag., 47, 361–387, 2004.
Díaz, S., Hector, A., and Wardle, D. A.: Biodiversity in forest carbon sequestration initiatives: not just a side benefit, Curr. Opin. Environ.l Sust., 1, 55–60, https://doi.org/10.1016/j.cosust.2009.08.001, 2009.
Dittmar, T. and Lara, R. J.: Molecular evidence for lignin degradation in sulfate-reducing mangrove sediments (Amazonia, Brazil), Geochem. Cosmochim. Ac., 65, 1417–1428, 2001.
Díaz, S., Hodgson, J. G., Thompson, K., Cabido, M., Cornelissen, J. H. C., Jalili, A., Montserrat-Martí, G., Grime, J. P., Zarrinkamar, F., Asri, Y., Band, S. R., Basconcelo, S., Castro-Díez, P., Funes, G., Hamzehee, B., Khoshnevi, M., Pérez-Harguindeguy, N., Pérez-Rontomé, M. C., Shirvany, A., Vendramini, F., Yazdani, S., Abbas-Azimi, R., Bogaard, A., Boustani, S., Charles, M., Dehghan, M., de Torres-Espuny, L., Falczuk, V., Guerrero-Campo, J., Hynd, A., Jones, G., Kowsary, E., Kazemi-Saeed, F., Maestro-Martínez, M., Romo-Díez, A., Shaw, S., Siavash, B., Villar-Salvador, P., and Zak, M. R.: The plant traits that drive ecosystems: Evidence from three continents, J. Veg. Sci., 15, 295–11, https://doi.org/10.1658/1100-9233(2004)015[0295:TPTTDE]2.0.CO;2, 2004.
Díaz, S., Lavorel, S., de Bello, F., Quetier, F., Grigulis, K., and Robson, T. M.: Incorporating plant functional diversity effects in ecosystem service assessments, Proc. Natl. Acad. Sci. USA, 104, 20684–20689, https://doi.org/10.1073/pnas.0704716104, 2007.
Duarte, C. M. and Chiscano, C. L.: Seagrass biomass and production: a reassessment, Aquat. Bot., 65, 159–174, 1999.
Duarte, C. M., Kennedy, H., Marba, N., and Hendriks, I.: Assessing the capacity of seagrass meadows for carbon burial: Current limitations and future strategies, Ocean Coast. Manag., 83, 32–38, https://doi.org/10.1016/j.ocecoaman.2011.09.001, 2011.
Duarte, C. M., Middelburg, J. J., and Caraco, N.: Major role of marine vegetation on the oceanic carbon cycle, Biogeosciences, 2, 1–8, https://doi.org/10.5194/bg-2-1-2005, 2005.
Duffy, J. E.: Biodiversity and the functioning of seagrass ecosystems, Mar. Ecol. Prog. Ser., 311, 233–250, https://doi.org/10.3354/meps311233, 2006.
Enriquez, S., Duarte, C. M., and Sand-Jensen, K.: Patterns in decomposition rates among photosynthetic organisms: the importance of detritus C : N : P content, Oecologia, 94, 457–471, 1993.
Folk, R. L.: The distinction between grain size and mineral composition in sedimentary rock nomenclature, J. Geol., 62, 344–359, 1954.
Folk, R. L. and Ward, W. C.: Brazos river bar: a study in the significance of grain size parameters, J. Sediment. Petrol., 27, 3–26, 1957.
Fournier, J., Gallon, R. K., and Paris, R.: G2Sd : un nouveau package fonctionnant sous R permettant l'analyse statistique des sédiments non-consolidés, Geomorphologie relief, processus, environment, Geomorphology, 20, 73–78, https://doi.org/10.4000/geomorphologie.10513, 2014.
Fourqurean, J. W., Duarte, C. M., Kennedy, H., Marba, N., Holmer, M., Mateo, M. A., Apostolaki, E. T., Kendrick, G. A., Krause-Jensen, D., McGlathery, K. J., and Serrano, O.: Seagrass ecosystems as a globally significant carbon stock, Nat. Geosci., 5, 505–509, https://doi.org/10.1038/ngeo1477, 2012a.
Fourqurean, J. W., Kendrick, G. A., Collins, L. S., Chambers, R. M., and Vanderklift, M. A.: Carbon, nitrogen and phosphorus storage in subtropical seagrass meadows: examples from Florida Bay and Shark Bay, Mar. Freshw. Res., 63, 967–18, https://doi.org/10.1071/MF12101, 2012b.
Freschet, G. T., Aerts, R., and Cornelissen, J. H. C.: A plant economics spectrum of litter decomposability, Funct. Ecol., 26, 56–65, https://doi.org/10.1111/j.1365-2435.2011.01913.x, 2012.
Gacia, E. and Duarte, C. M.: Sediment Retention by a Mediterranean Posidonia oceanica Meadow: The Balance between Deposition and Resuspension, Estuar. Coast. Shelf Sci., 52, 505–514, https://doi.org/10.1006/ecss.2000.0753, 2001.
Gacia, E., Granata, T. C., and Duarte, C. M.: An approach to measurement of particle flux and sediment retention within seagrass (Posidonia oceanica) meadows, Aquat. Bot., 65, 255–268, https://doi.org/10.1016/S0304-3770(99)00044-3, 1999.
Garnier, E., Cortez, J., Billès, G., Marie-Laure, N., Roumet, C., Debussche, M., Laurent, G., Blanchard, A., Aubry, D., Bellmann, A., Neill, C., and Toussaint, J.-P.: Plant Functional Markers Capture Ecosystem Properties During Secondary Succession, Ecology, 85, 2630–2637, https://doi.org/10.1890/03-0799, 2004.
Gramss, G., Voigt, K., and Kirsche, B.: Degradation of polycyclic aromatic hydrocarbons with three to seven aromatic rings by higher fungi in sterile and unsterile soils, Biodegradation, 10, 51–62, 1999.
Grime, J. P.: Plant Strategies, Vegetation Processes, and Ecosystem Properties, 2nd Edn., John Wiley & Sons, Chichester, 2001.
Grime, J. P., Thompson, K., Hunt, R., Hodgson, J. G., Cornelissen, J. H. C., Rorison, I. H., Hendry, G. A. F., Ashenden, T. W., Askew, A. P., Band, S. R., Booth, R. E., Bossard, C. C., Campbell, B. D., Cooper, J. E. L., Davison, A. W., Gupta, P. L., Hall, W., Hand, D. W., Hannah, M. A., Hillier, S. H., Hodkinson, D. J., Jalili, A., Liu, Z., Mackey, J. M. L., Matthews, N., Mowforth, M. A., Neal, A. M., Reader, R. J., Reiling, K., Ross-Fraser, W., Spencer, R. E., Sutton, F., Tasker, D. E., Thorpe, P. C., and Whitehouse, J.: Integrated Screening Validates Primary Axes of Specialisation in Plants, Oikos, 79, 259–281, https://doi.org/10.2307/3546011, 1997.
Gullström, M., la Torre Castro, de, M., and Bandeira, S. O.: Seagrass ecosystems in the western Indian Ocean, AMBIO, 31, 588–596, 2002.
Gullström, M., Lyimo, L. D., Dahl, M., Samuelsson, G. S., Eggertsen, M., Anderberg, E., Rasmusson, L. M., Linderholm, H. W., Knudby, A., Bandeira, S., Nordlund, L. M., and Björk, M.: Blue Carbon Storage in Tropical Seagrass Meadows Relates to Carbonate Stock Dynamics, Plant – Sediment Processes, and Landscape Context: Insights from the Western Indian Ocean, Ecosystems, 21, 1–16, https://doi.org/10.1007/s10021-017-0170-8, 2017.
Hamer, U., Marschner, B., Brodowski, S., and Amelung, W.: Interactive priming of black carbon and glucose mineralisation, Org. Geochem., 35, 823–830, https://doi.org/10.1016/j.orggeochem.2004.03.003, 2004.
Hartmann, J. and Moosdorf, N.: The new global lithological map database GLiM: A representation of rock properties at the Earth surface, Geochem. Geophy. Geosy., 13, 119–37, https://doi.org/10.1029/2012GC004370, 2012.
Hazen, T. C., Dubinsky, E. A., DeSantis, T. Z., Andersen, G. L., Piceno, Y. M., Singh, N., Jansson, J. K., Probst, A., Borglin, S. E., Fortney, J. L., Stringfellow, W. T., Bill, M., Conrad, M. E., Tom, L. M., Chavarria, K. L., Alusi, T. R., Lamendella, R., Joyner, D. C., Spier, C., Baelum, J., Auer, M., Zemla, M. L., Chakraborty, R., Sonnenthal, E. L., D'haeseleer, P., Holman, H.-Y. N., Osman, S., Lu, Z., Van Nostrand, J. D., Deng, Y., Zhou, J., and Mason, O. U.: Deep-Sea Oil Plume Enriches Indigenous Oil-Degrading Bacteria, Science, 330, 204–208, https://doi.org/10.1126/science.1195979, 2010.
Hedges, J. I. and Keil, R. G.: Sedimentary organic matter preservation: an assessment and speculative synthesis, Mar. Chem., 49, 81–115, https://doi.org/10.1016/0304-4203(95)00008-F, 1995.
Hedges, J. I. and Keil, R. G.: Organic geochemical perspectives on estuarine processes: sorption reactions and consequences, Mar. Chem., 65, 55–65, 1999.
Hendriks, I. E., Sintes, T., Bouma, T. J., and Duarte, C. M.: Experimental assessment and modeling evaluation of the effects of the seagrass Posidonia oceanica on flow and particle trapping, Mar. Ecol. Prog. Ser., 356, 163–173, https://doi.org/10.3354/meps07316, 2008.
Herms, D. A. and Mattson, W. J.: The Dilemma of Plants: To Grow or Defend, Q. Rev. Biol., 67, 283–335, 1992.
Herr, D., Pidgeon, E., and Laffoley, D. (Eds.): Blue Carbon Policy Framework: Based on the discussion of the International Blue Carbon Policy Working Group, IUCN, Gland, Switzerland, IUCN and Arlington, USA, 2012.
Hessen, D. O., Agren, G. I., Anderson, T. R., Elser, J. J., and De Ruiter, P. C.: Carbon sequestration in ecosystems: The role of stoichiometry, Ecology, 85, 1179–1192, 2004.
Howard, J., Hoyt, S., Isensee, K., Pidgeon, P., and Telszewski, M., Eds.: Coastal Blue Carbon: methods for assessing carbon stocks and emissions factors in mangroves, tidal salt marshes, and seagrass meadows, Conservation International, Intergovernmental Oceanographic Commission of UNESCO, International Union for Conservation of Nature, Arlington, Virginis, USA, 180, 1–78, 2014.
Jankowska, E., Michel, L. N., Zaborska, A., and Włodarska-Kowalczuk, M.: Sediment carbon sink in low-density temperate eelgrass meadows (Baltic Sea), J. Geophys. Res.-Biogeo., 121, 1–17, https://doi.org/10.1002/2016JG003424, 2016.
Kaal, J., Serrano, O., Nierop, K. G. J., Schellekens, J., Martínez Cortizas, A., and Mateo, M. A.: Molecular composition of plant parts and sediment organic matter in a Mediterranean seagrass (Posidonia oceanica) mat, Aquat. Bot., 133, 50–61, https://doi.org/10.1016/j.aquabot.2016.05.009, 2016.
Kangwe, J., Semesi, I. S., Beer, S., Mtolera, M., and Björk, M.: Carbonate Production by Calcareous Algae in a Seagrass-Dominated System: in: People, Nature and Research in Chwaka Bay, Zanzibar, Tanzania, edited by: de la Torre Castro, M. and Lyimo, T. J., Zanzibar, 143–156, 2012.
Keil, R. G. and Mayer, L. M.: Mineral Matrices and Organic Matter, in: Treatise on Geochemistry, 2nd Edn., Elsevier Ltd., 12, 337–359, 2014.
Kent, M. and Coker, P.: Vegetation description and analysis: a practical approach, CRC Press, Michigan, 1992.
Kent, P. E., Hunt, J. A., and Johnstone, D. W.: The geology and geophysics of Tanzania, Institute of Geological Sciences, HMS Stationary Office, London, 1971.
Klap, V. A., Hemminga, M. A., and Boon, J. J.: Retention of lignin in seagrasses: angiosperms that returned to the sea, Mar. Ecol. Prog. Ser., 194, 1–11, 2000.
Kremen, C.: Managing ecosystem services: what do we need to know about their ecology?, Ecol. Lett., 8, 468–479, https://doi.org/10.1111/j.1461-0248.2005.00751.x, 2005.
Lamb, J. B., van de Water, J. A. J. M., Bourne, D. G., Altier, C., Hein, M. Y., Fiorenza, E. A., Abu, N., Jompa, J., and Harvell, C. D.: Seagrass ecosystems reduce exposure to bacterial pathogens of humans, fishes, and invertebrates, Science, 355, 731–733, https://doi.org/10.1126/science.aal1956, 2017.
Lavery, P. S., Mateo, M. A., Serrano, O., and Rozaimi, M.: Variability in the Carbon Storage of Seagrass Habitats and Its Implications for Global Estimates of Blue Carbon Ecosystem Service, PLoS ONE, 8, e73748, https://doi.org/10.1371/journal.pone.0073748, 2013.
Lavorel, S. and Grigulis, K.: How fundamental plant functional trait relationships scale-up to trade-offs and synergies in ecosystem services, J. Ecol., 100, 128–140, https://doi.org/10.1111/j.1365-2745.2011.01914.x, 2011.
Legendre, P. and Legendre, L.: Numerical Ecology, Elsevier Science B. V., Amsterdam, the Netherlands, 1998.
Lehmann, J. and Kleber, M.: The contentious nature of soil organic matter, Nature, 113, 143–68, https://doi.org/10.1038/nature16069, 2015.
Macreadie, P. I., Baird, M. E., Trevathan-Tackett, S. M., Larkum, A. W. D., and Ralph, P. J.: Quantifying and modelling the carbon sequestration capacity of seagrass meadows – A critical assessment, Mar. Pollut. Bull., 83, 30–439, 2014.
Mahongo, S. B. and Shaghude, Y. W.: Modelling the dynamics of the Tanzanian coastal waters, J. Oceanogr. Mar. Sci., 5, 1–7, https://doi.org/10.5897/JOMS2013.0100, 2014.
Marba, N., Holmer, M., Gacia, E., and Barron, C.: Seagrass Beds and Coastal Biogeochemistry, in: Seagrasses: Biology, Ecology and Conservation, edited by: Larkum, A. W. D., Orth, R. J., and Duarte, C. M., Springer, Dordrecht, 135–157, 2006.
Mateo, M. A., Romero, J., Pereza, M., Littler, M. M., and Littler, D. S.: Dynamics of Millenary Organic Deposits Resulting from the Growth of the Mediterranean Seagrass Posidonia oceanica, Estuarine, Coast. Shelf Sci., 44, 103–110, 1997.
McClanahan, T. R.: Seasonality in East Africa's coastal waters, Mar. Ecol. Prog. Ser., 44, 197–199, 1988.
Mikutta, R., Kleber, M., Torn, M. S., and Jahn, R.: Stabilization of Soil Organic Matter: Association with Minerals or Chemical Recalcitrance?, Biogeochemistry, 77, 25–56, https://doi.org/10.1007/s10533-005-0712-6, 2006.
Miyajima, T., Hori, M., Hamaguchi, M., Shimabukuro, H., Adachi, H., Yamano, H., and Nakaoka, M.: Geographic variability in organic carbon stock and accumulation rate in sediments of East and Southeast Asian seagrass meadows, Global Biogeochem. Cy., 29, 1–19, https://doi.org/10.1002/(ISSN)1944-9224, 2015.
Miyajima, T., Hori, M., Hamaguchi, M., Shimabukuro, H., and Yoshida, G.: Geophysical constraints for organic carbon sequestration capacity of Zostera marinaseagrass meadows and surrounding habitats, Limnol. Oceanogr., 66, 865–19, https://doi.org/10.1002/lno.10478, 2017.
Mueller-Dombios, D. and Ellenberg, H.: Aims and methods of vegetation Ecology, John Wiley & Sons, New York, 2012.
Muzuka, A. N. N., Kangwe, J., Nyandwi, N., Wannas, K., Mtolera, M., and Björk, M.: Preliminary results on the sediment sources, grain size distribution and percentage cover of sand-producing Halimeda species and associated flora in Chwaka Bay, Zanzibar, Tanzania, 51–58, 2005.
Nellemann, C., Corcoran, E., Duarte, C. M., Valdes, L., De Young, C., Fonseca, L., and Grimsditch, G. (Eds.): Blue Carbon: A Rapid Response Assessment. United Nations Environment Programme, GRID-Arendal, Norway, available from: http://www.grida.no (last access: 4 January 2017), 2009.
Oksanen, J., Blanchet, F. G., Friendly, M., Kindt, R., Legendre, P., McGlinn, D., Minchin, P. R., OHare, R. B., Simpson, G. L., Solymos, P., Stevens, M. H. H. S., Szoecs, E., and Wagner, H.: vegan: Community Ecology Package, R package version, available from: https://CRAN.R-project.org/package=vegan (last access: 17 April 2017), 2014.
Orth, R. J., Carruthers, T. J. B., Dennison, W. C., Duarte, C. M., Fourqurean, J. W., Heck, K. L., Hughes, A. R., Kendrick, G. A., Kenworthy, W. J., Olyarnik, S., Short, F., Waycott, M., and Williams, S. L.: A Global Crisis for Seagrass Ecosystems, BioScience, 56, 987–996, https://doi.org/10.1641/0006-3568(2006)56{%}5B987:AGCFSE{%}5D2.0.CO;2, 2006.
Papenbrock, J.: Highlights in Seagrasses' Phylogeny, Physiology, and Metabolism: What Makes Them Special?, ISRN Botany, 2012, 1–15, https://doi.org/10.5402/2012/103892, 2012.
Peirano, A. and Bianchi, N. C.: Decline of the seagrass Posidonia oceanica in response to environmental disturbance: a simulation-like approach off Liguria (NW Mediterranean Sea), Southhampton, UK, 87–95, 1995.
Pergent, G., Romero, J., Pergent-Martini, C., Mateo, M. A., and Boudouresque, C. F.: Primary production, stocks and fluxes in the Mediterranean seagrass Posidonia oceanica, Mar. Ecol. Prog. Ser., 106, 139–146, 1994.
Peterson, C. H., Luettich Jr., R. A.,, Micheli, F., and Skilleter, G. A.: Attenuation of water flow inside seagrass canopies of differing structure, Mar. Ecol. Prog. Ser., 268, 81–92, 2004.
Phang, V., Chou, L. M., and Friess, D. A.: Ecosystem carbon stocks across a tropical intertidal habitat mosaic of mangrove forest, seagrass meadow, mudflat and sandbar, Earth Surf. Proc. Landf., 40, 1387–1400, https://doi.org/10.1002/esp.3745, 2015.
Reich, P. B.: The world-wide “fast–slow” plant economics spectrum: a traits manifesto, J. Ecol., 102, 275–301, https://doi.org/10.1111/1365-2745.12211, 2014.
Reich, P. B., Walters, M. B., and Ellsworth, D. S.: From tropics to tundra: Global convergence in plant functioning, Proc. Natl. Acad. Sci. USA, 94, 13730–13734, https://doi.org/10.1073/pnas.94.25.13730, 1997.
Ritz, C., Baty, F., Streibig, J. C., and Gerhard, D.: Dose-Response Analysis Using R, PLoS ONE, 10, e0146021, https://doi.org/10.1371/journal.pone.0146021, 2015.
Röhr, M. E., Boström, C., Canal-Vergés, P., and Holmer, M.: Blue carbon stocks in Baltic Sea eelgrass (Zostera marina) meadows, Biogeosciences, 13, 6139–6153, https://doi.org/10.5194/bg-13-6139-2016, 2016.
Romero, J., M Pdrez, M. A. M., and Sala, E.: The belowground organs of the Mediterranean scagrass Posidonia oceanica as a biogeochemical sink, Aquat. Bot., 47, 13–19, 1994.
Rozaimi, M., Fairoz, M., Hakimi, T. M., Hamdan, N. H., Omar, R., Ali, M. M., and Tahirin, S. A.: Carbon stores from a tropical seagrass meadow in the midst of anthropogenic disturbance, Mar. Pollut. Bull., 119, 253–260, https://doi.org/10.1016/j.marpolbul.2017.03.073, 2017.
Samper-Villarreal, J., Lovelock, C. E., Saunders, M. I., Roelfsema, C., and Mumby, P. J.: Organic carbon in seagrass sediments is influenced by seagrass canopy complexity, turbidity, wave height, and water depth, Limnol. Oceanogr., 61, 938–952, https://doi.org/10.1002/lno.10262, 2016.
Schile, L. M., Kauffman, J. B., Crooks, S., Fourqurean, J. W., Glavan, J., and Megonigal, J. P.: Limits on Carbon Sequestration in Arid Blue Carbon Ecosystems, Ecol. Appl., 27, 859–874, https://doi.org/10.1002/eap.1489, 2016.
Schmidt, M. W. I., Torn, M. S., Abiven, S., Dittmar, T., Guggenberger, G., Janssens, I. A., Kleber, M., Kögel-Knabner, I., Lehmann, J., Manning, D. A. C., Nannipieri, P., Rasse, D. P., Weiner, S., and Trumbore, S. E.: Persistence of soil organic matter as an ecosystem property, Nature, 478, 49–56, https://doi.org/10.1038/nature10386, 2011.
Schrumpf, M., Kaiser, K., Guggenberger, G., Persson, T., Kogel-Knabner, I., and Schulze, E. D.: Storage and stability of organic carbon in soils as related to depth, occlusion within aggregates, and attachment to minerals, Biogeosciences, 10, 1675–1691, https://doi.org/10.5194/bg-10-1675-2013, 2013.
Serrano, O., Lavery, P. S., Rozaimi, M., and Mateo, M. A.: Influence of water depth on the carbon sequestration capacity of seagrasses, Global Biogeochem. Cy., 28, 950–961, https://doi.org/10.1002/(ISSN)1944-9224, 2014.
Serrano, O., Mateo, M. A., Renom, P., and Julià, R.: Characterization of soils beneath a Posidonia oceanica meadow, Geoderma, 185/186, 26–36, https://doi.org/10.1016/j.geoderma.2012.03.020, 2012.
Serrano, O., Lavery, P. S., Duarte, C. M., Kendrick, G. A., Calafat, A., York, P. H., Steven, A., and Macreadie, P. I.: Can mud (silt and clay) concentration be used to predict soil organic carbon content within seagrass ecosystems?, Biogeosciences, 13, 4915–4926, https://doi.org/10.5194/bg-13-4915-2016, 2016a.
Serrano, O., Ricart, A. M., Lavery, P. S., Mateo, M. A., Arias-Ortiz, A., Masque, P., Rozaimi, M., Steven, A., and Duarte, C. M.: Key biogeochemical factors affecting soil carbon storage in Posidonia meadows, Biogeosciences, 13, 4581–4594, https://doi.org/10.5194/bg-13-4581-2016, 2016b.
Shaghude, Y. W., Wannäs, K. O., and Petersson, C. H.: General characteristics of the intertidal and lagoonal sediments around Unguja Island, Zanzibar, in Tanzania Marine Science Development in Tanzania and Eastern Africa, WIOMSA Book Series, Zanzibar, 95–105, 1999.
Shaghude, Y. W., Wannäs, K. O., and Mahongo, S. B.: Biogenic Assemblage and Hydrodynamic Settings of the Tidally Dominated Reef Platform Sediments of the Zanzibar Channel, Western Indian Ocean Journal of Marine Science, 1, 107–116, 2002.
Short, F., Carruthers, T., Dennison, W., and Waycott, M.: Global seagrass distribution and diversity: A bioregional model, J. Exp. Mar. Biol. Ecol., 350, 3–20, https://doi.org/10.1016/j.jembe.2007.06.012, 2007.
Sinsabaugh, R. L., Manzoni, S., Moorhead, D. L., and Richter, A.: Carbon use efficiency of microbial communities: stoichiometry, methodology and modelling, edited by: Elser, J. Ecol. Lett., 16, 930–939, https://doi.org/10.1111/ele.12113, 2013.
Six, J., Elliott, E. T., Paustian, K., and Doran, J. W.: Aggregation and Soil Organic Matter Accumulation in Cultivated and Native Grassland Soils, Soil Sci. Soc. Am. J., 62, 1367–12, https://doi.org/10.2136/sssaj1998.03615995006200050032x, 1998.
Six, J., Bossuyt, H., Degryze, S., and Denef, K.: A history of research on the link between (micro)aggregates, soil biota, and soil organic matter dynamics, Soil Till. Res., 79, 7–31, https://doi.org/10.1016/j.still.2004.03.008, 2004.
Sollins, P., Homann, P., and Caldwell, B. A.: Stabilization and destabilization of soil organic matter: Mechanisms and controls, Geoderma, 74, 1–41, 1996.
ter Braak, C. J. F.: Non-linear methods for multivariate statistical calibration and their use in palaeoecology: a comparison of inverse (k-nearest neighbors, partial least squares and weighted averaging partial least squares) and classical approaches, Chemometr. Intell. Lab., 28, 165–180, https://doi.org/10.1016/0169-7439(95)80048-E, 1995.
Tisdall, J. and Oades, M.: Organic matter and water-stable aggregates in soils, J. Soil Sci., 33, 141–163, https://doi.org/10.1111/j.1365-2389.2011.01408.x, 1982.
Trevathan-Tackett, S. M., Macreadie, P. I., Sanderman, J., Baldock, J., Howes, J. M., and Ralph, P. J.: A Global Assessment of the Chemical Recalcitrance of Seagrass Tissues: Implications for Long-Term Carbon Sequestration, Front. Plant Sci., 8, 561–18, https://doi.org/10.3389/fpls.2017.00925, 2017.
van Katwijk, M. M., van der Welle, M. E. W., Lucassen, E. C. H. E. T., Vonk, J. A., Christianen, M. J. A., Kiswara, W., al Hakim, I. I., Arifin, A., Bouma, T. J., Roelofs, J. G. M., and Lamers, L. P. M.: Early warning indicators for river nutrient and sediment loads in tropical seagrass beds: A benchmark from a near-pristine archipelago in Indonesia, Mar. Pollut. Bull., 62, 1512–1520, https://doi.org/10.1016/j.marpolbul.2011.04.007, 2011.
Venables, W. N. and Ripley, B. D.: Modern Applied Statistics with S, Springer, New York, 2002.
Wardle, D. A., Bardgett, R. D., Klironomos, J. N., Setala, H., van der Putten, W. H., and Wall, D. H.: Ecological Linkages Between Aboveground and Belowground Biota, Science, 304, 1629–1633, https://doi.org/10.1126/science.1094875, 2004.
Wentworth, C. K.: A scale of grade and class terms for clastic sediments, Geology, 30, 377–392, 1922.
Wickham, H.: Ggplot2: Elegant Graphics for Data Analysisý, Springer-Verlag, New York, 2009.
Wiesenberg, G. L. B., Schwarzbauer, J., Schmidt, M. W. I., and Schwark, L.: Source and turnover of organic matter in agricultural soils derived from n-alkane/n-carboxylic acid compositions and C-isotope signatures, Organ. Geochem., 35, 1371–1393, https://doi.org/10.1016/j.orggeochem.2004.03.009, 2004.
Wilkum, D. A. and Shanholtzer, G. F.: Application of the Braun-Blanquet cover abundance scale for vegetation analysis in land development studies, Environ. Manage., 2, 323–329, 1978.
Wright, I. J., Reich, P. B., Westoby, M., Ackerly, D. D., Baruch, Z., Bongers, F., Cavender-Bares, J., Chapin, T., Cornelissen, J. H. C., Diemer, M., Flexas, J., Garnier, E., Groom, P. K., Gulias, J., Hikosaka, K., Lamont, B. B., Lee, T., Lee, W., Lusk, C., Midgley, J. J., Marie-Laure, N., Niinemets, Ü., Oleksyn, J., Osada, N., Poorter, H., Poot, P., Prior, L., Pyankov, V. I., Roumet, C., Thomas, S. C., Tjoelker, M. G., Veneklaas, E. J., and Villar, R.: The worldwide leaf economics spectrum, Nature, 428, 821–827, https://doi.org/10.1038/nature02403, 2004.
Zavala-Garay, J., Theiss, J., Moulton, M., Walsh, C., van Woesik, R., Mayorga-Adame, C. G., García-Reyes, M., Mukaka, D. S., Whilden, K., and Shaghude, Y. W.: On the dynamics of the Zanzibar Channel, J. Geophys. Res.-Ocean., 120, 6091–6113, https://doi.org/10.1002/2015JC010879, 2015.
Zechmeister-Boltenstern, S., Keiblinger, K. M., Mooshammer, M., Penuelas, J., Richter, A., Sardans, J., and Wanek, W.: The application of ecological stoichiometry to plant–microbial–soil organic matter transformations, Ecol. Monogr., 85, 133–155, https://doi.org/10.1890/14-0777.1, 2015.
Zuur, A. F., Ieno, E. N., Walker, N. J., Saveliev, A. A., and Smith, G. M.: Mixed effect models and extension in ecology with R, Springer, New York, 2009.