the Creative Commons Attribution 4.0 License.
the Creative Commons Attribution 4.0 License.
 | 24 Aug 2018
Diffusion limitations and Michaelis–Menten kinetics as drivers of combined temperature and moisture effects on carbon fluxes of mineral soils
Fernando Esteban Moyano
Nadezda Vasilyeva
Lorenzo Menichetti
CO2 production in soils responds strongly to changes in temperature and moisture, but the magnitude of such responses at different timescales remains difficult to predict. Knowledge of the mechanisms leading to the often observed interactions in the effects of these drivers on soil CO2 emissions is especially limited. Here we test the ability of different soil carbon models to simulate responses measured in soils incubated at a range of moisture levels and cycled through 5, 20, and 35 ∘C. We applied parameter optimization methods while modifying two structural components of models: (1) the reaction kinetics of decomposition and uptake and (2) the functions relating fluxes to soil moisture. We found that the observed interactive patterns were best simulated by a model using Michaelis–Menten decomposition kinetics combined with diffusion of dissolved carbon (C) and enzymes. In contrast, conventional empirical functions that scale decomposition rates directly were unable to properly simulate the main observed interactions. Our best model was able to explain 87 % of the variation in the data. Model simulations revealed a central role of Michaelis–Menten kinetics as a driver of temperature sensitivity variations as well as a decoupling of decomposition and respiration C fluxes in the short and mid-term, with general sensitivities to temperature and moisture being more pronounced for respiration. Sensitivity to different model parameters was highest for those affecting diffusion limitations, followed by activation energies, the Michaelis–Menten constant, and carbon use efficiency. Testing against independent data strongly validated the model (R2=0.99) and highlighted the importance of initial soil C pool conditions. Our results demonstrate the importance of model structure and the central role of diffusion and reaction kinetics for simulating and understanding complex dynamics in soil C.
- Article
(5853 KB) - Full-text XML
-
Supplement
(1459 KB) - BibTeX
- EndNote


Soils are a main component of the global carbon (C) cycle, storing ca. 2200 Pg of C in the top 100 cm according to recent estimates (Batjes, 2014). This soil C pool is dynamic and often exists in a non-equilibrium state as the result of an imbalance between input and output C fluxes, in which case it will act either as a C sink or as a C source over time. Changes in the speed at which soil organisms decompose soil organic matter (SOM) and mineralize soil organic carbon (SOC) into CO2 are one way in which an imbalance can occur, producing a net sink or source of atmospheric CO2.
It is well known that SOC mineralization and resulting CO2 fluxes are highly sensitive to variations in soil temperature and moisture (Hamdi et al., 2013; Moyano et al., 2013). As a result, feedback effects, either positive or negative, are expected to occur from the interaction between climate change and global soil C stocks (Crowther et al., 2016; Davidson and Janssens, 2006; Kirschbaum, 2006). However, the direction and magnitude of such feedbacks at the global scale remain uncertain. Increased soil respiration with a resulting net loss of soil C, and thus a positive climate feedback, is expected with the warming of permafrost soils and the drying of wetland soils. But there is still large uncertainty and a lack of consensus regarding the long-term response to climate variability of soils that are non-saturated, non-frozen, and dominated by a mineral matrix (Crowther et al., 2016), i.e. soils found under most forests, grasslands, and agricultural lands.
Future predictions of soil C dynamics require the use of mathematical models. Early soil C models and most still in use are based on first-order decay of multiple C pools, with temperature and moisture having general non-interactive effects on decay rates (Rodrigo et al., 1997). When appropriately calibrated, these models do well at simulating soil respiration fluxes of soils under relatively stable conditions. They are often developed to approximate long-term steady-state conditions under specific land uses. They are also capable of fitting long-term trends of soil C loss, such as data from long-term bare fallow where all litter input has stopped (Barré et al., 2010). However, they lack a theoretical basis justifying their basic assumptions of pool partitioning and decay mechanisms. They also generally need calibration for specific soil types or land cover types and often fail to properly simulate observed short- and mid-term variability in soil respiration. Some of the most relevant observations these models have failed to reproduce include changes (typically a dampening) of temperature sensitivities of decomposition over time (Hamdi et al., 2013), non-linear responses to soil moisture content (Borken and Matzner, 2009), and changes in decomposition rates in response to variations in concentrations of organic matter (Blagodatskaya and Kuzyakov, 2008). Such model shortcomings, which reflect missing or wrongly simulated processes, create a difficult-to-quantify uncertainty in global long-term predictions of soil C and its feedback to climate change. It is therefore unclear if first-order models can predict long-term changes in C stocks under more dynamic (and therefore realistic) environmental conditions.
Second-order models have a more realistic basic structure compared to conventional first-order models, since they simulate organic matter decomposition as a reaction between SOC and decomposers (i.e. a microbial or enzyme pool). This single but fundamental change in decomposition kinetics strongly affects predicted long-term changes in soil C, largely as a result of the dynamics of the decomposer pool, which itself can respond to temperature in a number of ways (Wutzler and Reichstein, 2008). Second-order models also lead to more complex dynamics of short- to mid-term soil respiration, with apparent temperature sensitivities that vary over time, more in line with many observations.
The temporal variability in the response of decomposition to moisture is most evident in the strong respiration pulses after dry soils are re-wetted, known as the Birch effect (Birch, 1958). But studies have shown that a successful simulation of such pulses requires the incorporation of additional mechanisms, namely the explicit representation of a bio-available C pool, such as dissolved organic matter (DOC), and a moisture regulation of decomposer's access to this pool that may differ from the moisture regulation on the decomposition reaction itself (Lawrence et al., 2009; Zhang et al., 2014).
The response of soil respiration to temperature and moisture is highly dynamic, both spatially and temporally (Hamdi et al., 2013; Moyano et al., 2012). Moisture and temperature interactions have been observed in a number of experimental studies (Craine and Gelderman, 2011; Rey et al., 2005; Suseela et al., 2012; Wickland and Neff, 2008), but neither consistent trends nor general explanatory theories have been identified. Improving our understanding of these interactions is a crucial step towards increasing confidence in models and important for interpreting modelling and experimental results (Crowther et al., 2016; Tang and Riley, 2014). Identifying the model structures and parameterizations that can best represent these interactive effects has been attempted by very few studies (Sierra et al., 2015, 2017).
The objectives of this study are to compare the ability of different soil C modelling approaches to reproduce temperature and moisture interactive effects on soil carbon fluxes and thus to gain insight into mechanisms underlying the observed responses. With the hypothesis that a more mechanistic model will be better capable of simulating such interactions, we compare different model structures, testing first-order, second-order, and Michaelis–Menten reaction kinetics in combination with an explicit simulation of diffusion fluxes. We then compare the best diffusion model with versions based on common empirical moisture relationships.
Measurements of the interaction effects of temperature and moisture on soil respiration fluxes were obtained by incubating a crop field soil at several fixed levels of soil moisture and variable levels of temperature over a period of ca. 6 months, as detailed in the following.
Soils from 0 to 20 cm depth were sampled at Versailles, France, from the “Le Closeaux” experimental field plot, cultivated with wheat until 1992 and with maize since 1993. Mean annual temperature and rainfall are 10 ∘C and 640 mm, respectively. The soil is classified as Luvisol (FAO) silt loam (26 % sand, 59 % silt, 15 % clay) containing no carbonates. Organic carbon contents at the start of the incubation were 1.2 % in weight. Soil samples were prepared for elemental analysis (C, N) using a planetary ball mill (3 min at 500 rpm). C concentrations were measured using a CHN auto-analyser (NA 1500, Carlo Erba).
Sampled soils were thoroughly mixed, sieved at 2 mm, and stored moist at 4 ∘C in plastic bags with holes for aeration for 10 days. Soils were then put in small plastic cylinders containing the equivalent of 90 g dry soil. To ensure a high and equal water conductivity, all samples were compacted to a bulk density of 1.4 g cm−3. The resulting soil porosity was 0.45.
All samples were brought to a pF of 4.2, corresponding to about 12.5 % volumetric moisture. Three replicate samples were then adjusted to each of the moisture levels (2 %, 5.5 %, 12.5 %, 16 %, 20 %, 23.5 %, 27 %, 30.5 %, 34 %, 38 %, and 45 %) by adding water or air drying. These values range from air-dry to saturated. Immediately thereafter, the plastic cylinders were put in 500 mL jars containing a small amount of water on the bottom (except for the 2 % and 5.5 % moisture) to prevent soil drying and equipped with a lid and a rubber septum for gas sampling. Because of the extremely low respiration rates, samples with 2 % moisture were placed in 125 mL jars containing 170 g of soil.
To minimize post-disturbance effects, samples were pre-incubated at 4 ∘C for 10 days. The samples were then cycled through incubation temperatures following the sequence 5–20–35–5–20–35 ∘C, thus applying two temperature cycles to each sample. This was done in order to capture possible hysteresis of temperature effects and to reduce the covariance between a temperature response and substrate depletion (helping constrain model parameters). Soil respiration was calculated at every temperature step by measuring the amount of CO2 accumulated in flask headspace. For this, samples were flushed with CO2-free air and left to accumulate CO2 for 3 to 74 days. The variable accumulation time was chosen so that sufficient CO2 accumulated for the micro gas chromatographer measurements (at least 100 ppm), thus depending on the soil temperature and moisture content. After the accumulation time, an air sample was taken from each soil sample headspace, and respiration rates were calculated as the accumulated amount over the accumulation time. Samples were incubated for a total period of ca. 6 months (Fig. 1).
As shown in Fig. 1, the timing of temperature treatments was not equal for all samples, with some temperature steps missing at low moisture levels. This was partly due to the time required for CO2 concentrations in the flask headspace to reach detectable limits, the time necessary for carrying out measurements and human error. However, while important for a statistical comparison between treatments, such differences are of little consequence when looking at model performance and the fit between model and data, which is the focus of this study.
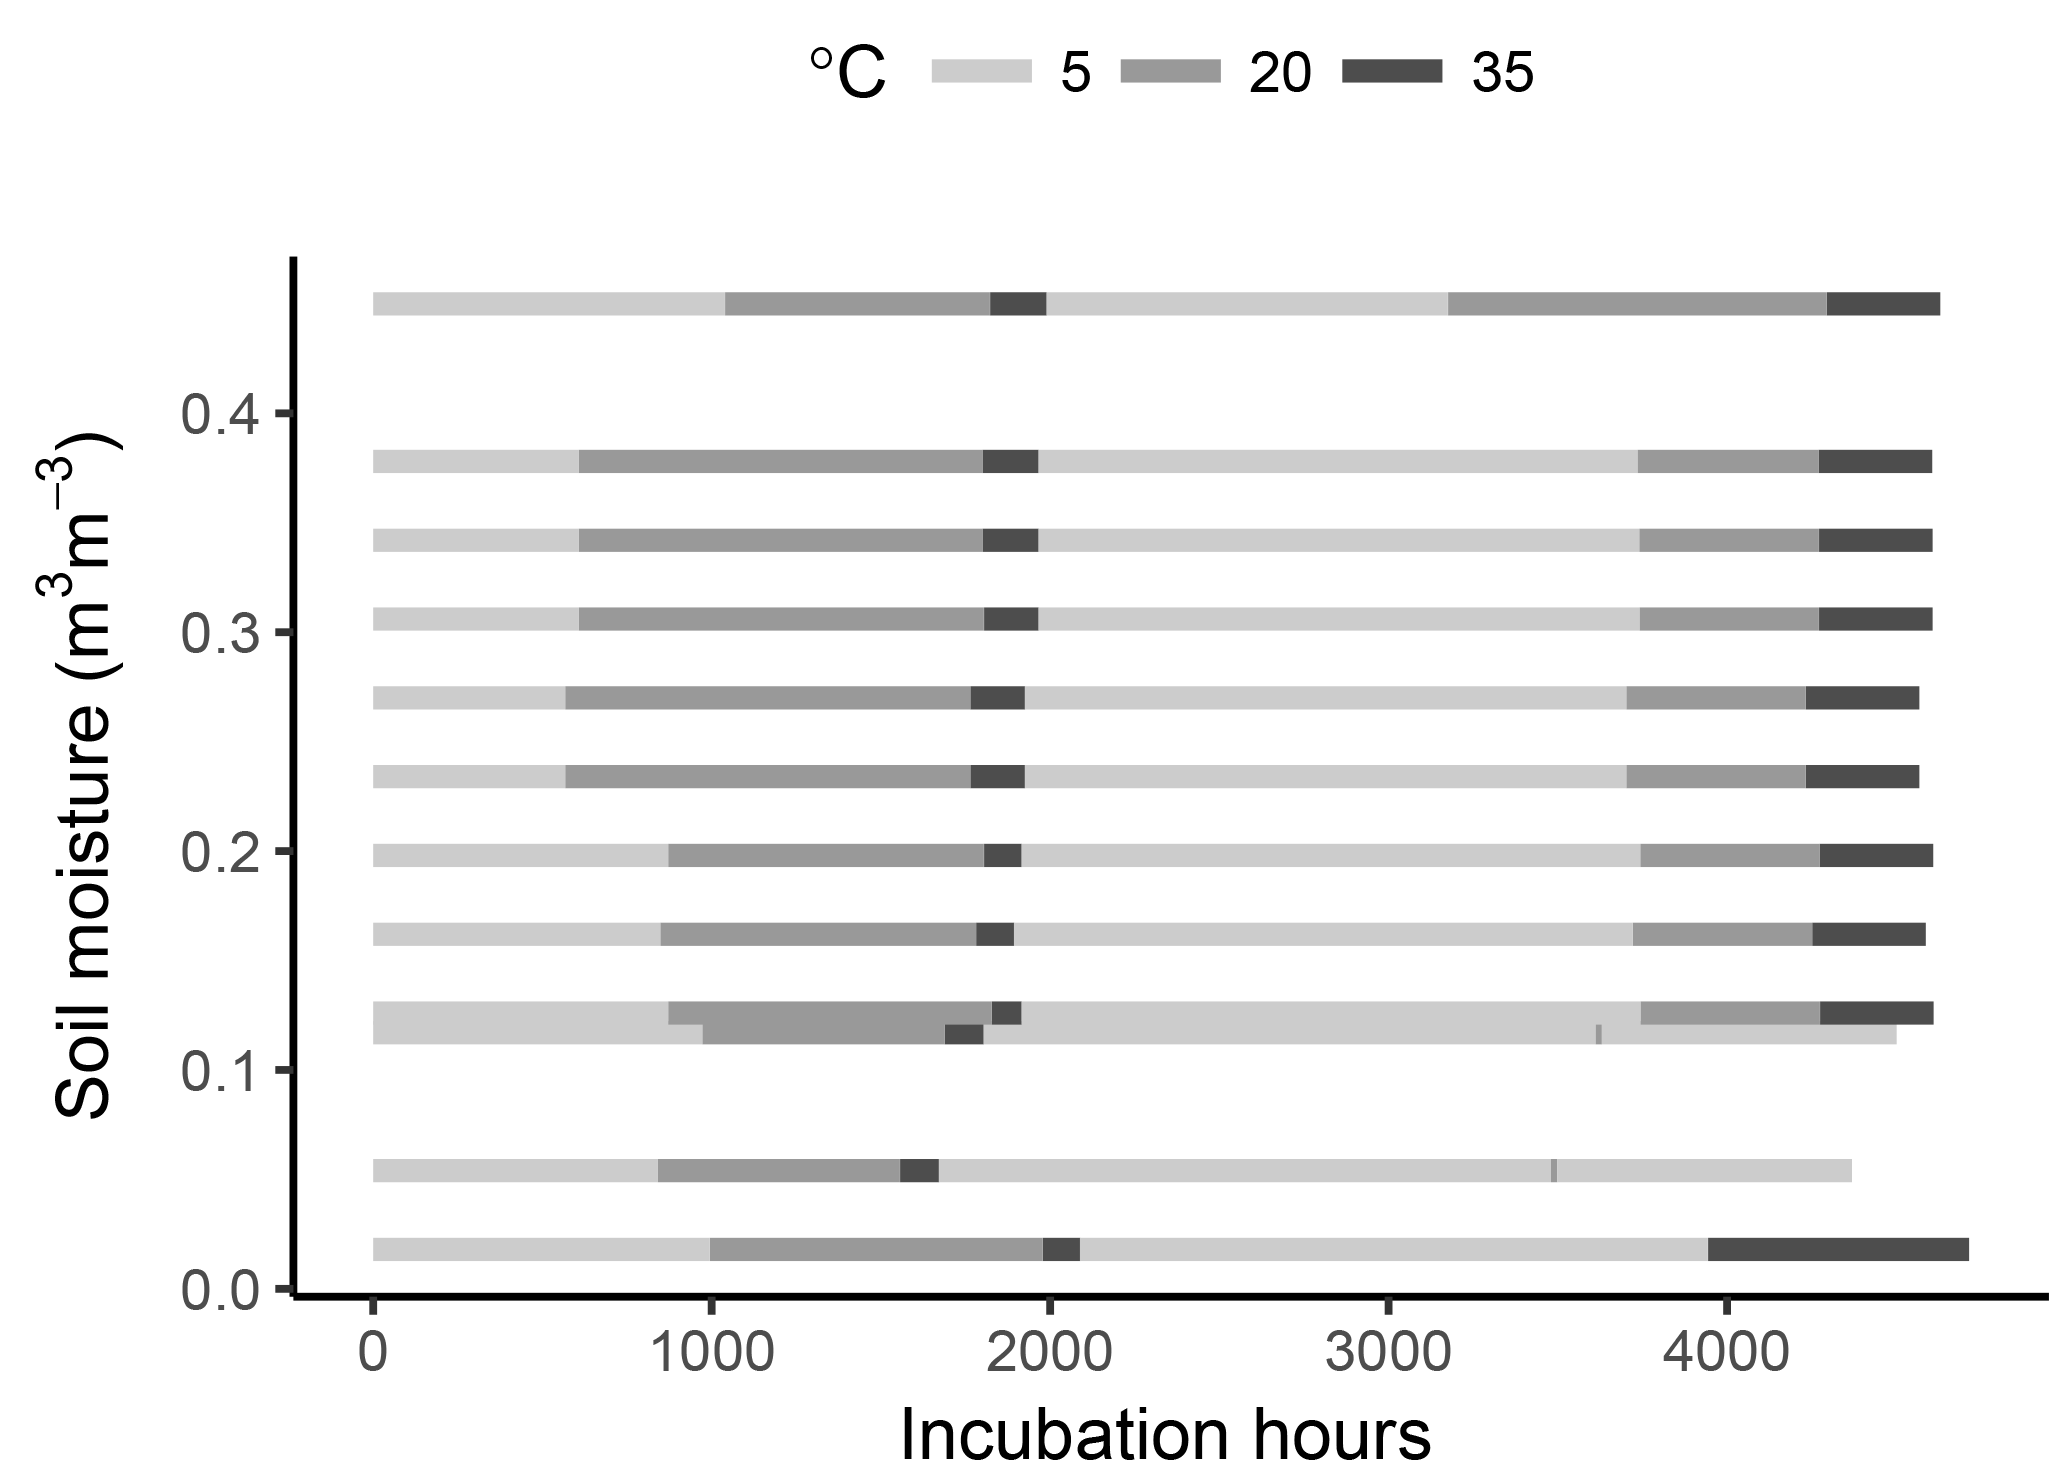
Figure 1Graphical representation of the incubated soil samples showing the fixed levels of moisture content and the times at different temperatures.
3.1 Structure and state variables
We started with a basic soil C model with the following state variables: a bio-unavailable polymeric C pool (CP); a bio-available dissolved C pool (CD); a microbial C pool (CM); and two extracellular enzyme C pools (CE), one representing the enzyme fraction at the decomposition site () and one the fraction at the microbial site (). With this model we assume two conceptual soil spaces that are separated by a diffusion barrier, one being the site of decomposition and the other the site of microbial uptake and enzyme production (Fig. 2). This model thus closely follows Manzoni et al. (2016) and otherwise builds on other published microbial models (Allison et al., 2010; Schimel and Weintraub, 2003). We refer to those studies for general assumptions and application of this type of model. Aspects specific to this study are described below.
The rates of change of the model state variable were defined as
where F represents the flux of C from one pool to another as indicated by the subscripts, so that FPD is the flux from the polymeric pool to the dissolved pool. The subscripts LS and LM denote input of structural and metabolic litter (as defined by Parton et al., 1987), which for simulating the incubated soils were set to zero, and RM and RG are microbial growth and maintenance respiration.
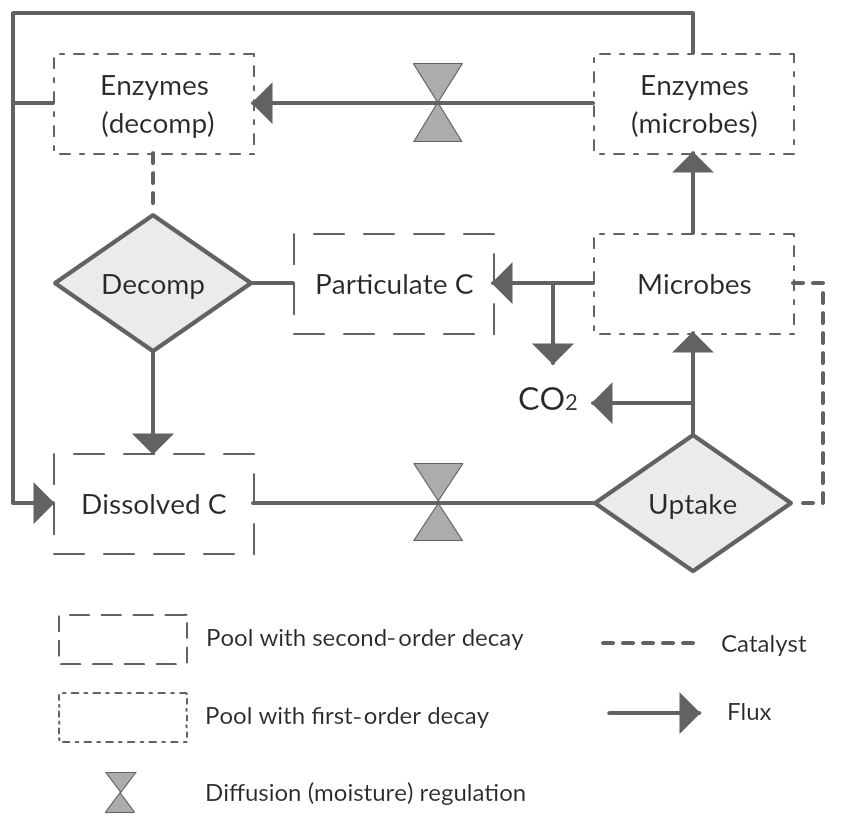
Figure 2Diagram showing C pools and fluxes, as well as the points of diffusion limitations. Second-order decay may refer also to Michaelis–Menten reaction kinetics. Variations of this scheme were tested in this study.
3.2 Decomposition and microbial uptake
The flux of CP to CD, FPD, represents decomposition of organic matter, a process that in soils is largely driven by the activity of microorganisms, which produce exo-enzymes that catalyse the decomposition reaction. UD represents the total uptake flux by microbes of the water-soluble decomposed pool CD (microbes being the reaction “catalysers”). Conventional soil C models simulate decomposition as a first-order decay reaction. However, more realistic models can be built by using either simple second-order or Michaelis–Menten reaction kinetics. Thus, optional ways of modelling both FPD and UD include
where F is the flux, V a base reaction rate, K the half-saturation constant, R the reactant, and C the catalyst. The “reverse” Michaelis–Menten (Eq. 9) was applied by Schimel and Weintraub (2003) as an alternative for improving model stability and is included here for completeness.
The value for V is not equivalent among these equations, differing by several orders of magnitude. As a result, different parameters were used for V in each case, namely VDm, VDmr, VD1, and VD2. Similarly, parameters KD and KDe were used for K in Eqs. (8) and (9), respectively. The terms [R] and [C] are concentrations of CP and . In the case of uptake, the parameters are respectively VU, KU, CD, and CM. The four approaches for reaction kinetics were tested in order to find the best fit between model and data, as described in Sect. 4.
3.3 Diffusive fluxes
Diffusion fluxes depend on a concentration difference, a diffusivity term, and the distance over which diffusion occurs (Manzoni et al., 2016). For the purpose of modelling diffusion in soils, values of diffusivity and diffusion distances are required that best average or represent the actual underlying soil complexity. For practical purposes, we combined these two values into a single calibrated parameter, a conductance (g0), representing the compound effects of diffusivity and distance. This was done because the values of the latter are unconstrained (from lack of information), and their effects are inversely correlated, so simultaneous calibration would lead to a problem of parameter identifiability. The moisture-scaled conductance (g), which in our model is assumed equal for the CD and CE pools, is then given by
where dθ is a function of soil volumetric water content (VWC or θ):
where ϕ is pore space, and n and m are calibrated parameters (Hamamoto et al., 2010; Manzoni et al., 2016), which are variable and were also calibrated in this study. θth is the percolation threshold for solute diffusion, for which Manzoni and Katul (2014) reported a value of −15 MPa. This value was not optimal in our case, so θth was also calibrated. The diffusive flux of enzyme C between the microbial and the decomposition spaces is then calculated as
Diffusion limitations also affect the amount of the dissolved pool (CD) available for microbial uptake. Instead of dividing CD into a pool for each space, the conductance, g, was used as a multiplier of the base uptake rate, VU (Eqs. 6–9). This served to reduce the number of model pools and parameters while still retaining a diffusivity limitation on this flux.
3.4 Microbial and enzyme dynamics
UD is split into FDM, , and , representing the fluxes of CD going to CM, RG, and , respectively. These fluxes are defined as
where fug represents the fraction of uptake going to growth, otherwise known as microbial growth efficiency or carbon use efficiency, and fge is the fraction of growth going to enzyme production. Enzyme production thus depends here on uptake rather than on microbial biomass. This approach follows the assumption that microbes produce enzymes only when new carbon is available and save resources otherwise. CM goes to either maintenance respiration or the CP pool according to
where rmd is the rate of microbial death and rmr is the rate of microbial maintenance respiration. The breakdown of enzymes going to the CD pool is determined by the rate of enzyme decay, red, as
3.5 Temperature effects
Reaction rates ( in Eqs. 6–9), decay and respiration rates (red, rmd, rmr) are temperature sensitive and calculated from their reference values following an Arrhenius type temperature response:
where r is the temperature-modified rate, rref the reference rate at temperature Tref, T temperature in kelvin, Ea the activation energy, and R the universal gas constant. Three parameters were used for Ea: Ea_m and Ea_e for microbial and enzyme decay rates, respectively, and Ea_V for other reaction rates. Temperature thus affects the rates of decomposition and uptake, the half-saturation constant in the Michaelis–Menten equation, and the rates of microbial and enzyme decay. Apparent activation energies – describing the observed temperature relationship, both in measurements and model data – were obtained by fitting an Arrhenius equation to the temperature–flux relationship at each level of moisture. Ea was calculated for measured respiration, modelled respiration (RG+RM), and modelled decomposition (FPD).
Calibrated and non-calibrated parameters for all models are given in the Supplement (Tables S1, S2, and S3). Whenever possible, fixed parameters as well as lower and upper bounds for calibrated parameters (Table S1) were set according to values reported in the literature (e.g. Hagerty et al., 2014; Li et al., 2014; Price and Sowers, 2004). Equilibrium conditions were not assumed at the start of the experimental procedure, as such a state is unlikely for samples that have been processed and disturbed. Therefore, initial conditions were obtained by also optimizing the fractions of initial carbon pool sizes (fP, fD, fM). Total organic C was set equal to the measured value. Models were calibrated by optimizing parameters to best fit the measured soil respiration data described in Sect. 2. Each model was calibrated by fitting a single set of parameters simultaneously to all the incubation data (Table S3). For this, the model was run to reproduce each sample treatment, i.e. the applied incubation times and temperatures for each level of moisture (Fig. 1). Accumulated soil respiration amounts were then calculated to match those from the observed data. Measured and simulated data from all samples were then combined, and an overall model cost was calculated using the root mean square error (RMSE) and a weighting term, as described below.
Parameter optimization was carried out in two steps. We first explored parameter spaces using a Latin hypercube of parameter values. For this we randomly selected unique parameter sets from a uniform distribution over each parameter range (R function randomLHS, package lhs; Stein, 1987) to obtain 30 000 parameter sets. Model costs were then obtained by running models with each set. In the second step we used the Nelder–Mead algorithm (as implemented in the function modFit in package FME of the R programming language; R Development Core Team, 2016; Soetaert and Petzoldt, 2010) with initial parameter values being the set from the previous step with the lowest model cost. For the cost calculations we used an error term (“err” argument to FME function modCost) to weight the residuals. The error was calculated as the normalized (0–1) standard deviation of measured values at each combination of temperature and moisture, with 0.1 added to avoid an unreasonable weighting of measurements with near-zero errors.
For a visual inspection of the model–data fits, we plotted both the measured and the model relationship between soil respiration and moisture, soil respiration and temperature, and apparent activation energy (Ea) and moisture content.
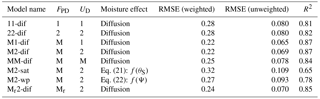
Table 1Different model versions with their weighted and unweighted root mean squared errors (RMSEs, in units mg C kg soil−1 h−1) and R2 after parameter calibration. FPD: decomposition flux; UD: dissolved C uptake flux; 1: first-order kinetics; 2: second-order kinetics; M: Michaelis–Menten kinetics; Mr: reverse Michaelis–Menten kinetics.
4.1 Comparison of reaction kinetics
Models were named according to their decomposition kinetics followed by the uptake kinetics and the moisture function, using the abbreviations: 1 for first order, 2 for second order, M for Michaelis–Menten, Mr for reverse Michaelis–Menten, dif for diffusion, psi for water potential function, and sat for water saturation function. Alternative reaction kinetics leading to fluxes FPD and UD were compared in diffusion-based models using different combinations of Eqs. (6)–(9). Specifically, we compared first order for decomposition and uptake (11-dif), second order for decomposition and uptake (22-dif), and Michaelis–Menten decomposition with all combinations of uptake (M1-dif, M2-dif, and MM-dif). In addition, we tested reverse Michaelis–Menten decomposition with second-order uptake (Mr2-dif). We then evaluated the model–data fit based on RMSE values as well as on a visual inspection of the plotted relationships. A “best” model was then selected for further analysis.
4.2 Comparison of moisture regulations: diffusion vs. empirical
A second model comparison was carried out to test the impact of different approaches for modelling moisture effects. For this we modified the model M2-dif (Table 1), removing diffusion fluxes and adding empirical moisture functions. This consisted in removing all diffusion effects (so that and were replaced by a single CE pool and the uptake rate, VU, was no longer modified by g) and adding a function to scale (i.e. multiply) the decomposition flux, FPD. This approach is equivalent to the conventional way used to model moisture effects on soil C fluxes. Two alternative moisture scaling functions were tested (Moyano et al., 2013), one based on relative water saturation (M2-sat) and the other on water potential (M2-wp):
where θS is relative water saturation; Ψ is soil water potential; and a, b, Ψopt, and Ψth are fitted parameters. The latter two represent the optimal water potential for decomposition and a threshold water potential with values of −0.03 and −15 MPa, respectively. Water potential was calculated based on Campbell (1974) and Cosby et al. (1984). a and b are empirical parameters and were calibrated.
4.3 Model steady state, sensitivity analysis, and validation
Equations for steady state were derived by setting the rate of change in the state variables to zero in Eqs. (1)–(5) (where the flux terms are replaced by their respective equations) and then solving for the state variables. This was performed in Python using the “SymPy” package (Meurer et al., 2017).
A sensitivity analysis was carried out on model parameters using the “sensFun” function from the R package FME, which perturbs each parameter individually by a small amount. We ran the model as above, i.e. simulating the incubation and using daily output. Daily sensitivities were then averaged to obtain an overall value. Sensitivity values were calculated for the CP pool alone, as this pool represents the largest fraction of soil C.
For model validation, we used soil respiration data from the study by Rey et al. (2005), where a Mediterranean oak forest soil was incubated for 1 month in a full factorial design at 100 %, 80 %, 60 %, 40 %, and 20 % of water holding capacity and at 30, 20, 10, and 4 ∘C. This soil differed from the one used for model calibration in at least three aspects: the amount of organic C (7 %), soil pore space (65 %), and texture (classified as silty clay loam). The optimized set of parameters from the model M2-dif was used with the exception of the initial fraction of C pools (fP, fD, fM) and the percolation threshold (θth), which we calibrated against the new data (Nelder–Mead calibration). The former was required since we had no information with which to estimate the microbial, dissolved, and enzyme C for this study and information regarding an initial soil steady state was also lacking. In the case of θth, we assumed that this parameter is especially sensitive to variations in soil texture and structure. Although in previous studies it has been determined to be equal to a water potential of −15 MPa (Manzoni and Katul, 2014), this value did not provide a good fit when applied to the validation data.
5.1 Reaction kinetics
The calibrated values for all models are shown in Table S3. Using different reaction kinetics resulted in variations in model performance as measured by RMSE (Table 1). Changes in RMSE were more sensitive to the kinetics of decomposition (FPD), with models using M and Mr decomposition kinetics resulting in lower RMSE values compared to first- and second-order kinetics. In terms of uptake kinetics, both first- and second-order kinetics performed better than Michaelis–Menten kinetics.
Models M1-dif, M2-dif, and Mr2-dif all showed a good fit to the data, with the first two having a slightly higher R2. Thus, selecting a “best” model necessarily remains partially subjective. A visual comparison shows some weaknesses and strengths in each case. M1-dif and Mr2-dif better captured the variability in the data along the respiration axis at 35 ∘C (Fig. S1 in the Supplement), while M2-dif more closely captured the relationship at 20 ∘C and thus the temperature sensitivities (Fig. S2). We selected the model M2-dif (R2=0.87, Fig. 3) as the “best” model, since it better represents the actual mediation of uptake by microbial biomass when compared to the model M1-dif. We also had no theoretical reason to prefer Mr to M decomposition. The decomposition and uptake equations of the model M2-dif are then
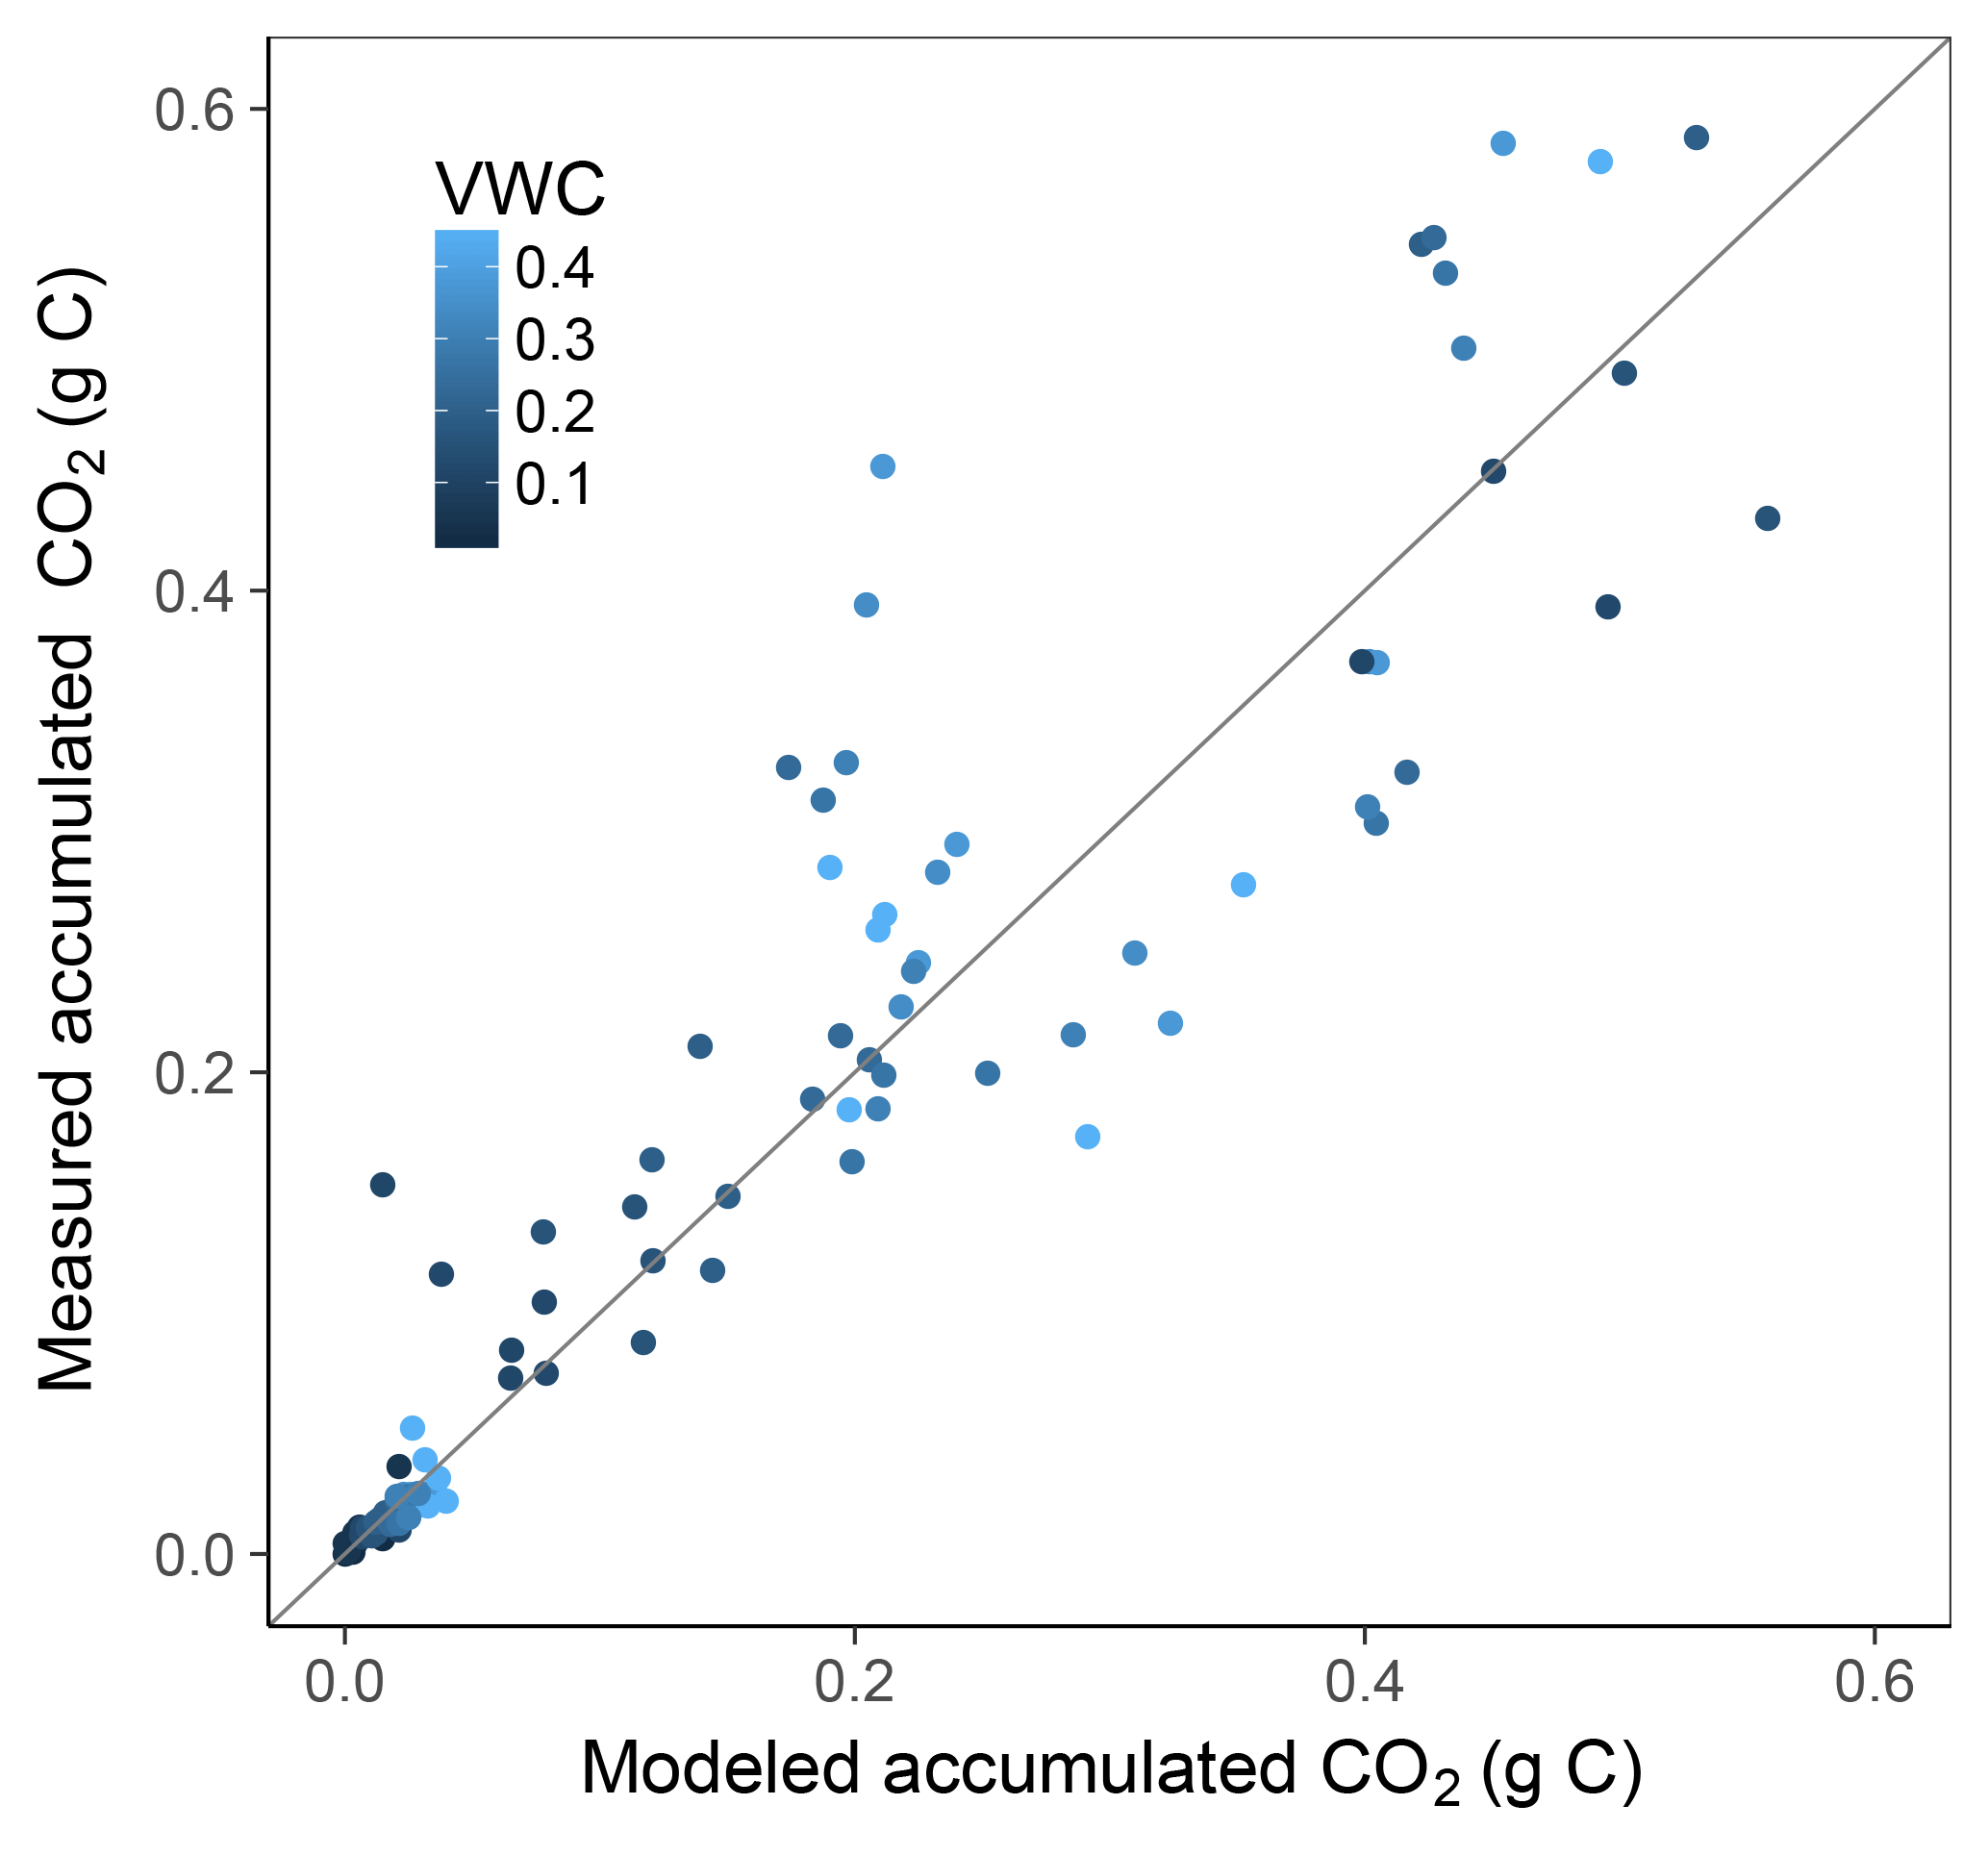
Figure 3Model vs. measured accumulated CO2 of incubated soil samples. Colour depicts the range of volumetric water content (VWC). The model R2 is 0.87.
5.2 Moisture regulation
Replacing diffusion effects with empirical moisture scalars followed by recalibration decreased model performance compared to a diffusion-based model, both when using relative water saturation (M2-sat) and when using water potential (M2-wp) functions (Table 1). Although empirical functions were able to approximate the shape of the respiration–moisture relationship at 20 ∘C, they were unable to capture the variation of this response at higher and colder temperatures, as seen in the measurements and simulated by diffusion base models (Fig. 4). Diffusion-based models more accurately simulated a linear relationship between respiration and moisture at lower temperatures and a steep increase followed by a plateau at high temperatures, with an intermediate response seen at 20 ∘C.

Figure 4Relationship of soil respiration with volumetric soil moisture. Results shown over three temperature levels (5, 20, 35 ∘C) for the observed data (obs) and three model versions (M2-dif, M2-wp, and M2-sat). Lines are smooth loess fits depicting the mean relationship.
5.3 Temperature sensitivities
Figures 5 and 6 show the apparent temperature sensitivities fitted to observations and modelled fluxes at different moisture levels and for two temperature ranges, 5–20 and 20–35 ∘C. Figure 5 compares different reaction kinetics, and Fig. 6 different moisture functions. Michaelis–Menten decomposition outperformed first- and second-order kinetics when simulating the variability in Ea observed along the moisture axis as well as the differences observed between colder (5–20 ∘C) and warmer (20–35 ∘C) temperature ranges. The model M2-dif closely followed the observed Ea values, which were near 100 kJ at colder temperatures and in the 30–70 kJ range at warmer temperatures. Models M2-sat and M2-wp captured the large differences between temperature ranges but did not simulate the variability along the moisture axis as well as diffusion-based models.
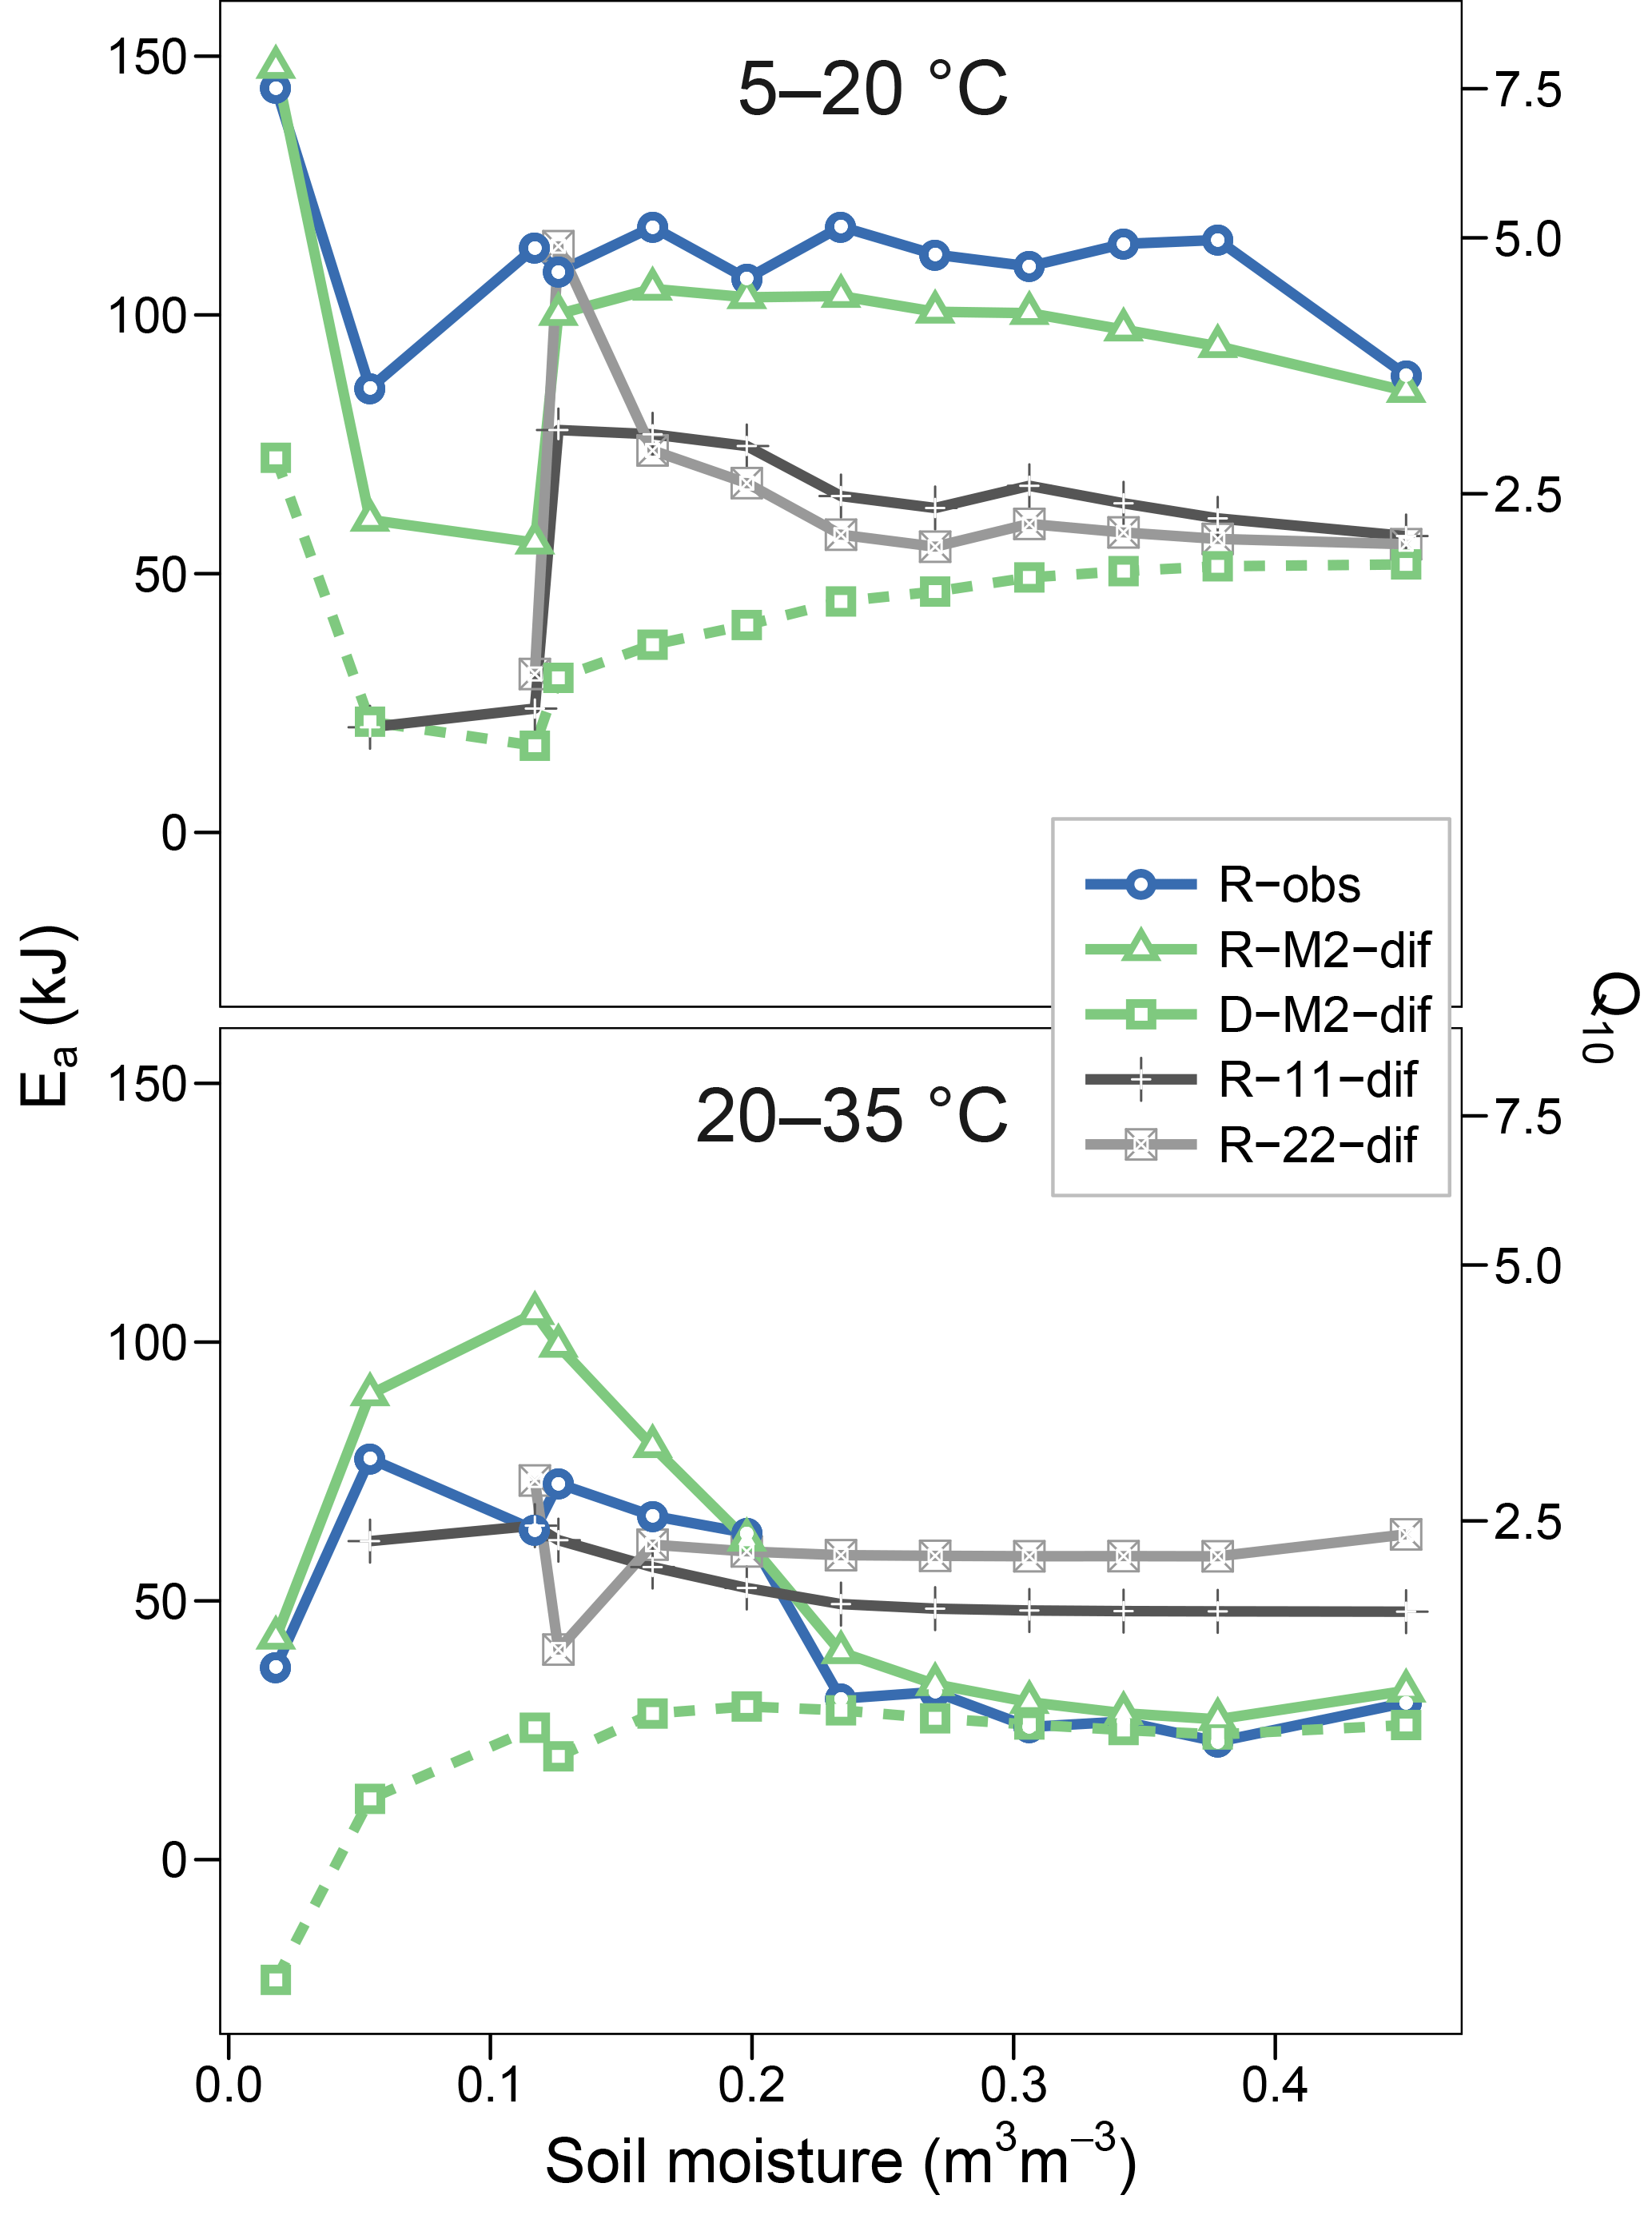
Figure 5Temperature sensitivities of respiration and decomposition fluxes, showing activation energy (Ea) fitted using two temperature ranges (5–20 and 20–35 ∘C) and the equivalent Q10 derived for a 10 ∘C range. Plotted are observed respiration data (R-obs) and three models with different reaction kinetics (R-M2-dif, R-11-dif, and R-22-dif). The sensitivities of the decomposition flux from the model M2-dif is included for comparison (D-M2-dif).
Model steady-state equations are provided in the Supplement. For 20 ∘C, 30 % VWC, 1.2 g d−1 C input, and 30 cm soil depth (z), the equilibrium sizes of the model pools are 2560, 37, 120, and 4 g C for the CP, CD, CM, and pools, respectively. These values are stable over most of the moisture range and increase exponentially only at very low soil moisture (data not shown). A similar pattern was observed for temperature, with the CP pool increasing towards high values only at temperatures near 0 ∘C. The same pool showed little sensitivity to changes in C input.
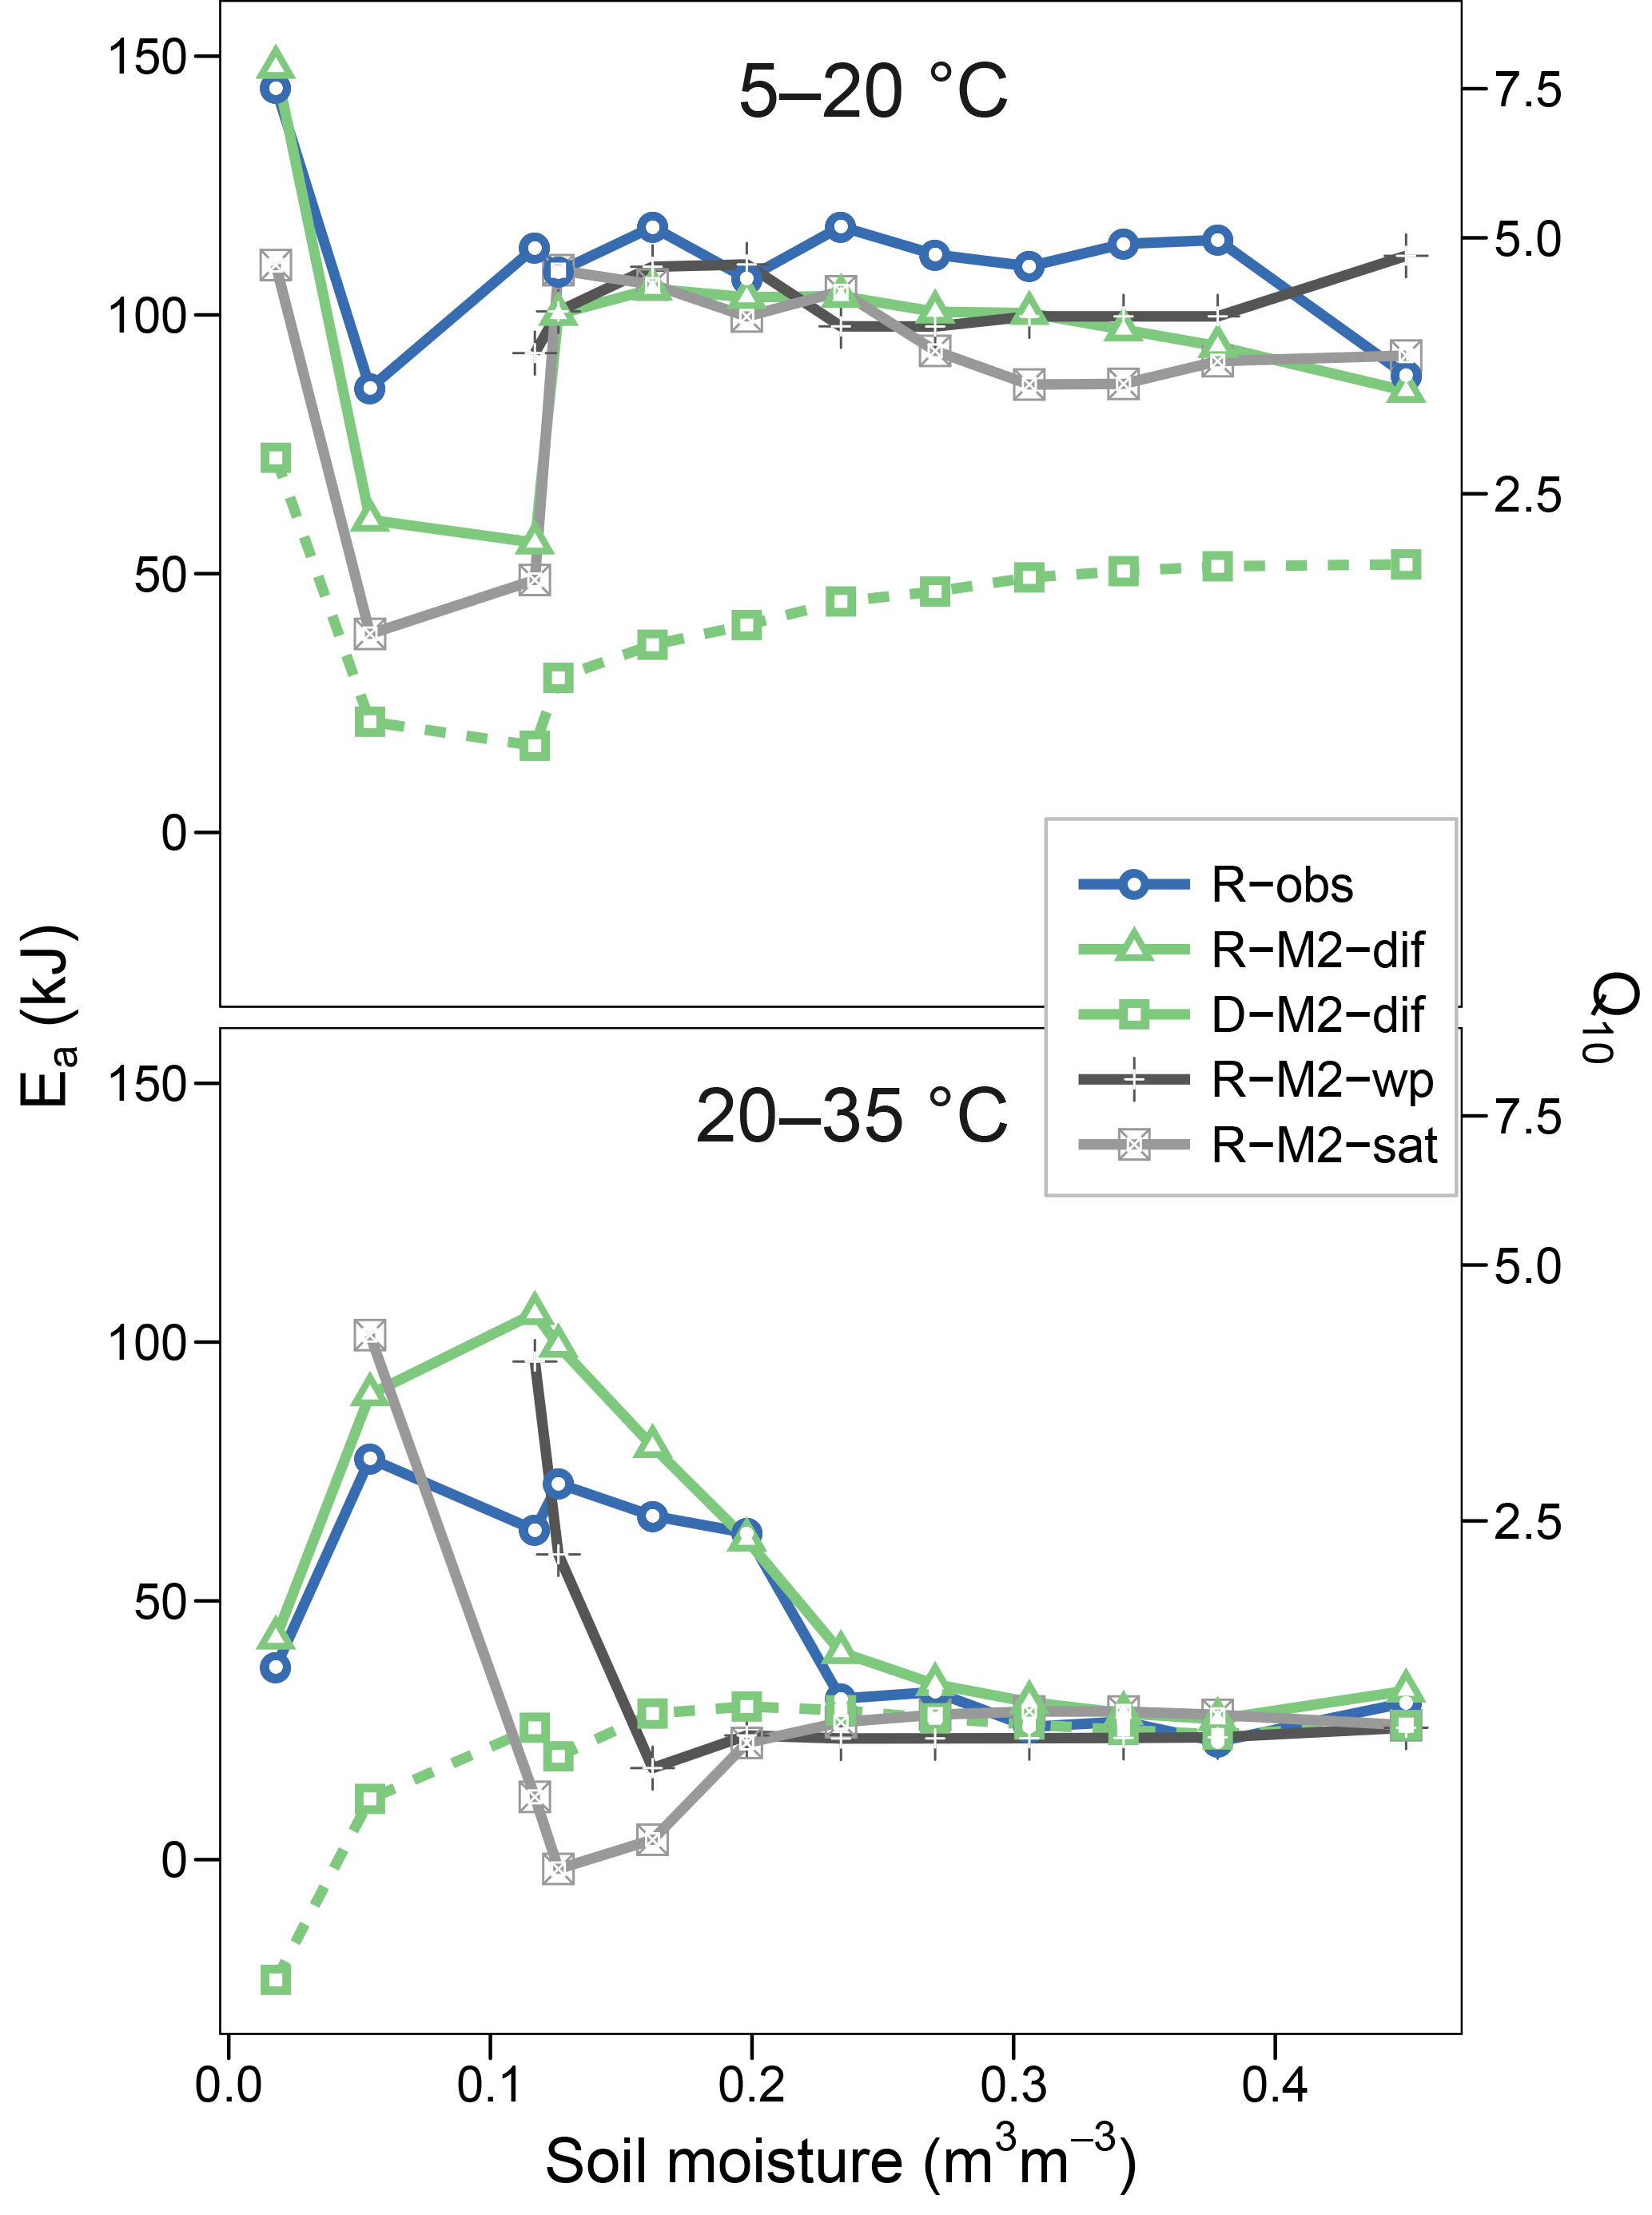
Figure 6Equivalent to Fig. 5 but showing observational data (R-obs) next to models with different moisture functions (R-M2-dif, R-M2-wp, and R-M2-sat).
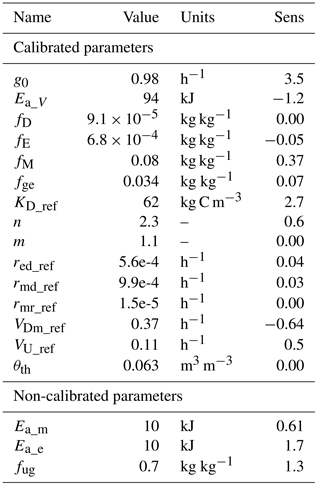
Table 2 shows the averaged values from the sensitivity analysis done on the model CP pool. High sensitivities were found for g0 and n, indicating the importance of diffusion fluxes. Large effects were also seen for the activation energy parameters, denoting a strong general effect of temperature. Also high were the sensitivities to KD and fug, reflecting the importance of Michaelis–Menten kinetics for decomposition and carbon use efficiently, respectively. Low sensitivities were found for rates of microbial and enzyme decay.
Table 2Parameters of the model M2-diff, calibrated and non-calibrated, with results of a sensitivity analysis (sens). Sens shows a relative measure of the sensitivity of the model CP pool to small perturbations in the parameter values. Values are rounded to two significant digits.
Simulation of the incubated soil from the study of Rey et al. (2005) resulted in a very high fit to the validation data after calibration of initial SOC fractions and θth, with an RMSE of 0.09 in fluxes that were almost an order of magnitude higher than those used for calibration and a model R2 of 0.99 (Fig. 7). This was reflected in a generally good agreement between the relationships of model and observations with moisture (Fig. 8) and temperature (Fig. 9).
The interaction often observed in the effects of temperature and moisture on the cycling of soil C is an indicator of the complex nature of soil systems. Such responses are often ignored, particularly by modellers trying to minimize model complexity and derive functions that are easy to parameterize, but also by experimentalists focusing on finding an invariable response to a single factor. But a careful consideration of the nature of soils suggests that interactions should be expected, something that becomes evident in multi-factorial experiments as well as in field measurements. Here we found clear interactive effects in our experimental observations, adding to the evidence that fixed empirical temperature and moisture scalars, as used in conventional soil C models, are inappropriate for simulating the variability often found in natural conditions.
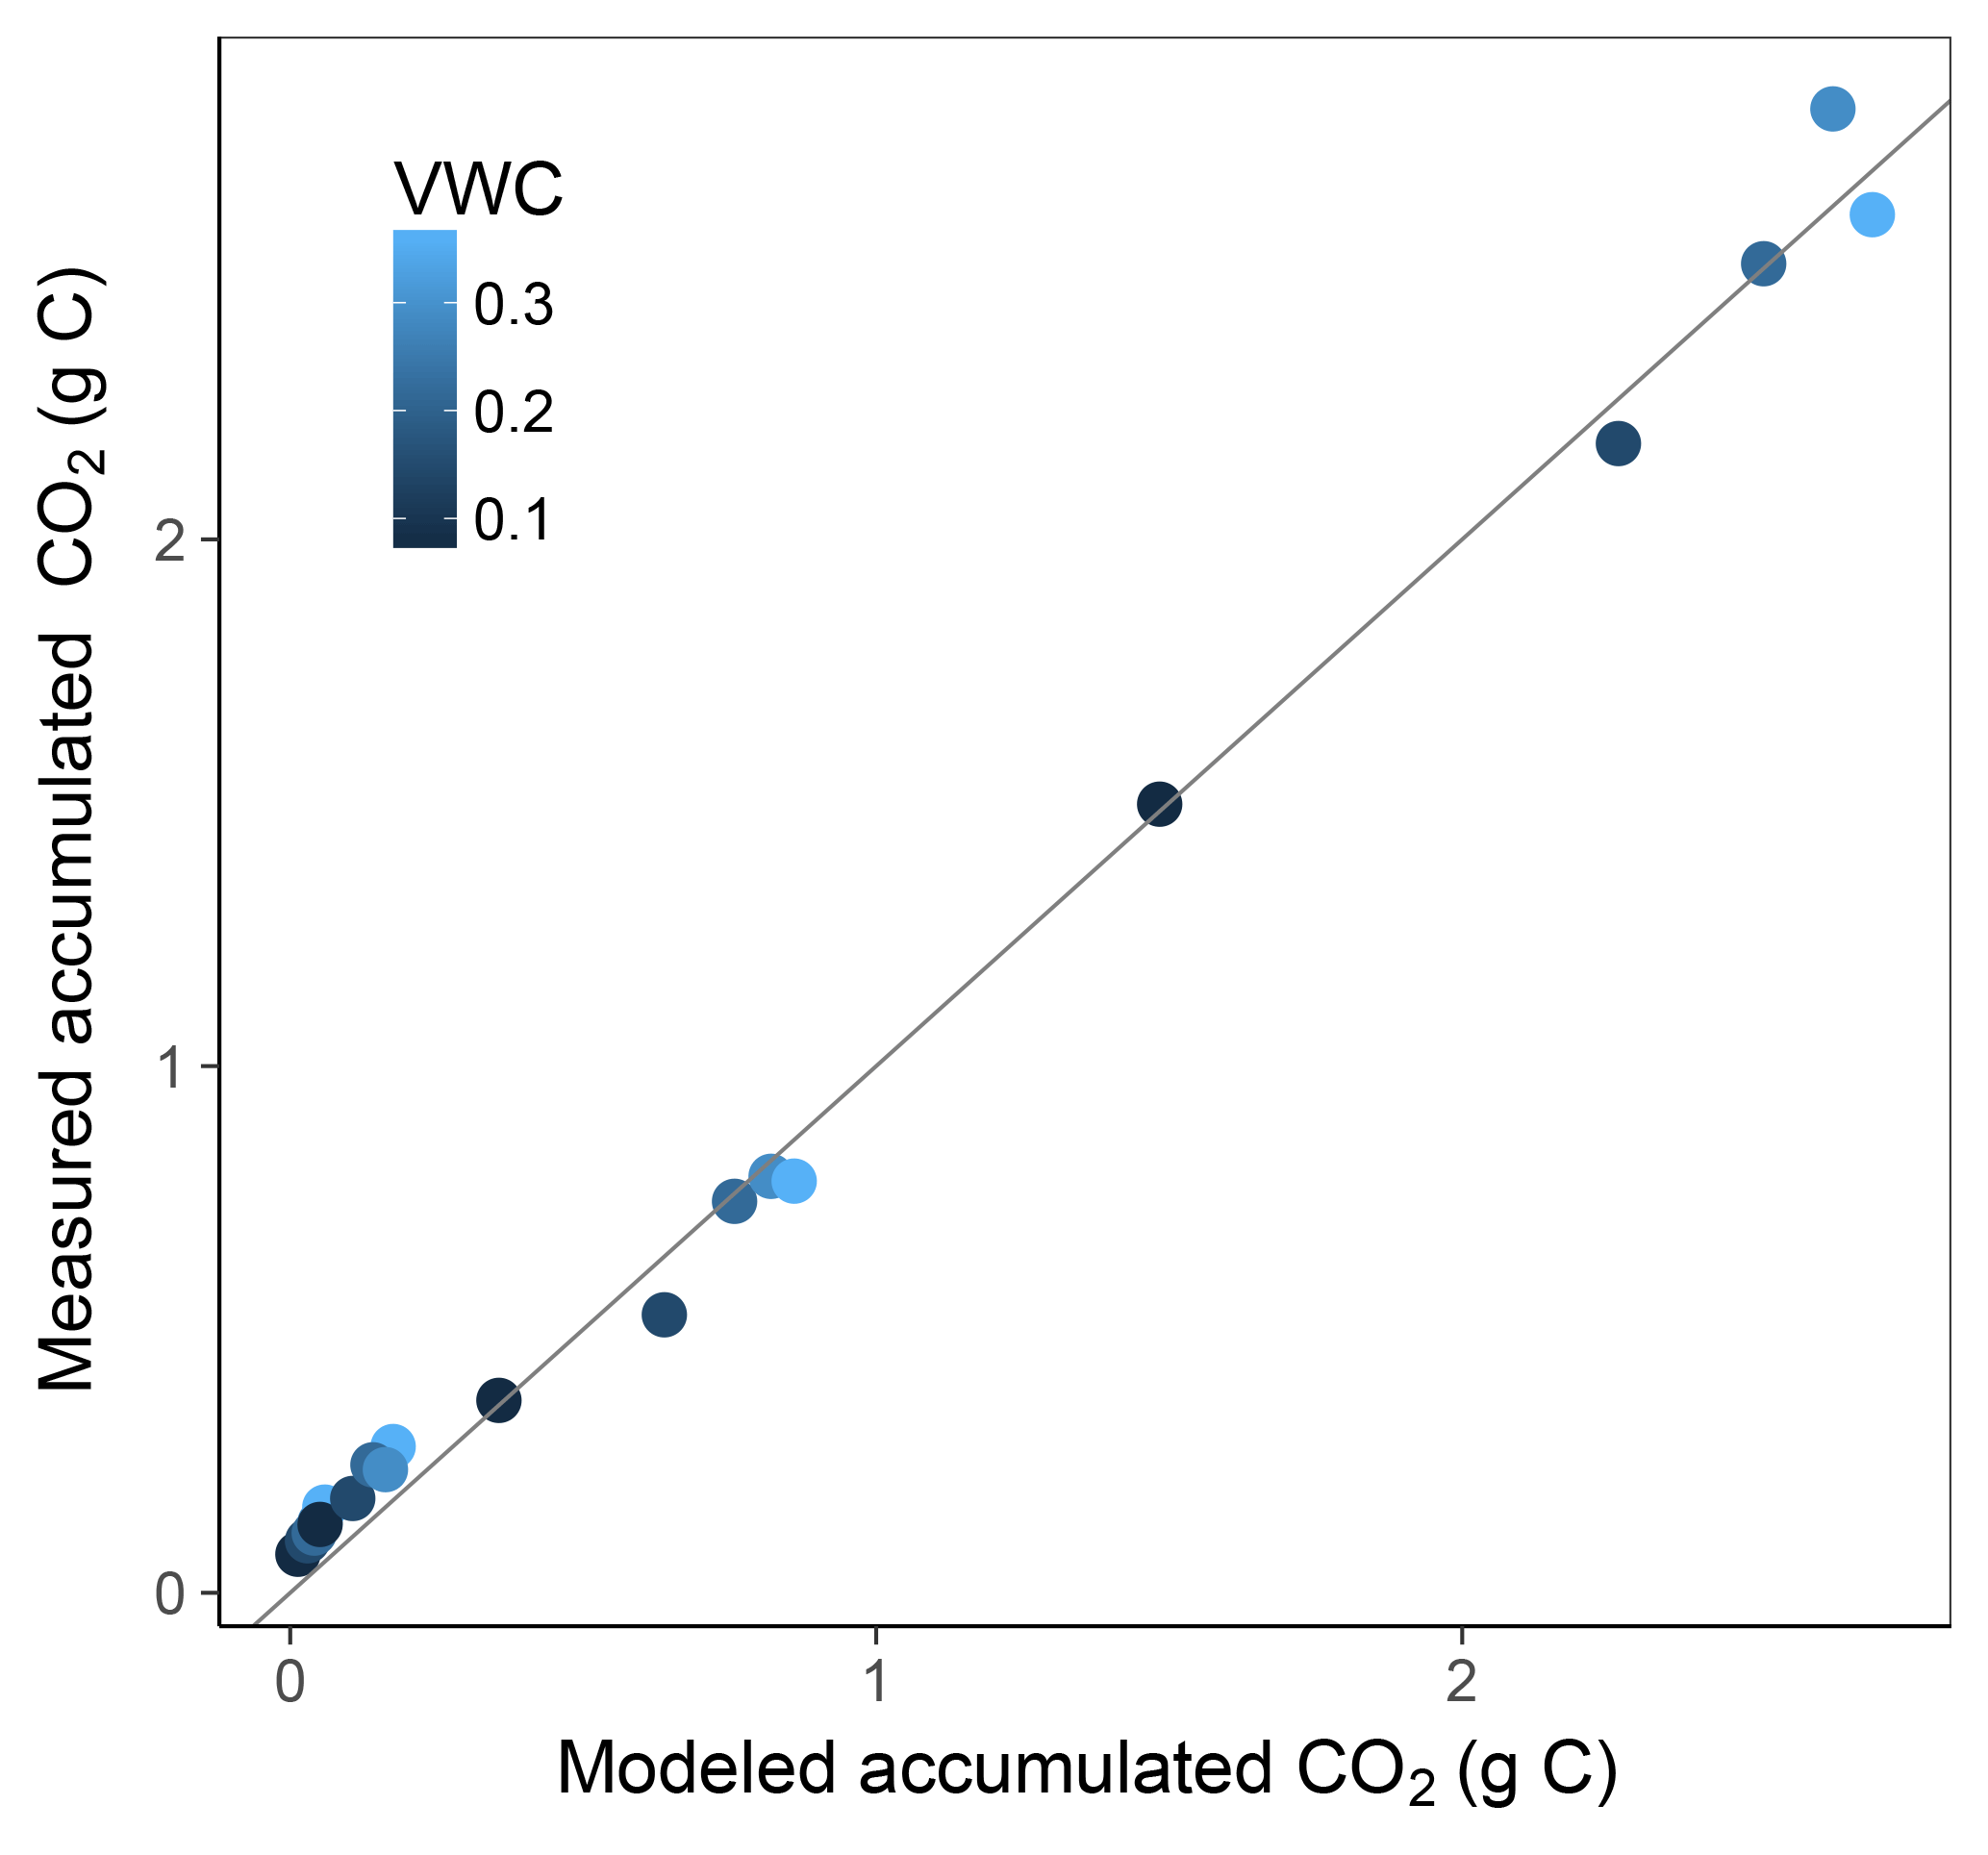
Figure 7Model vs. measured accumulated CO2 after simulating the experiment from Rey et al. (2005). Colour depicts the range of volumetric water content (VWC). The model R2 is 0.99.
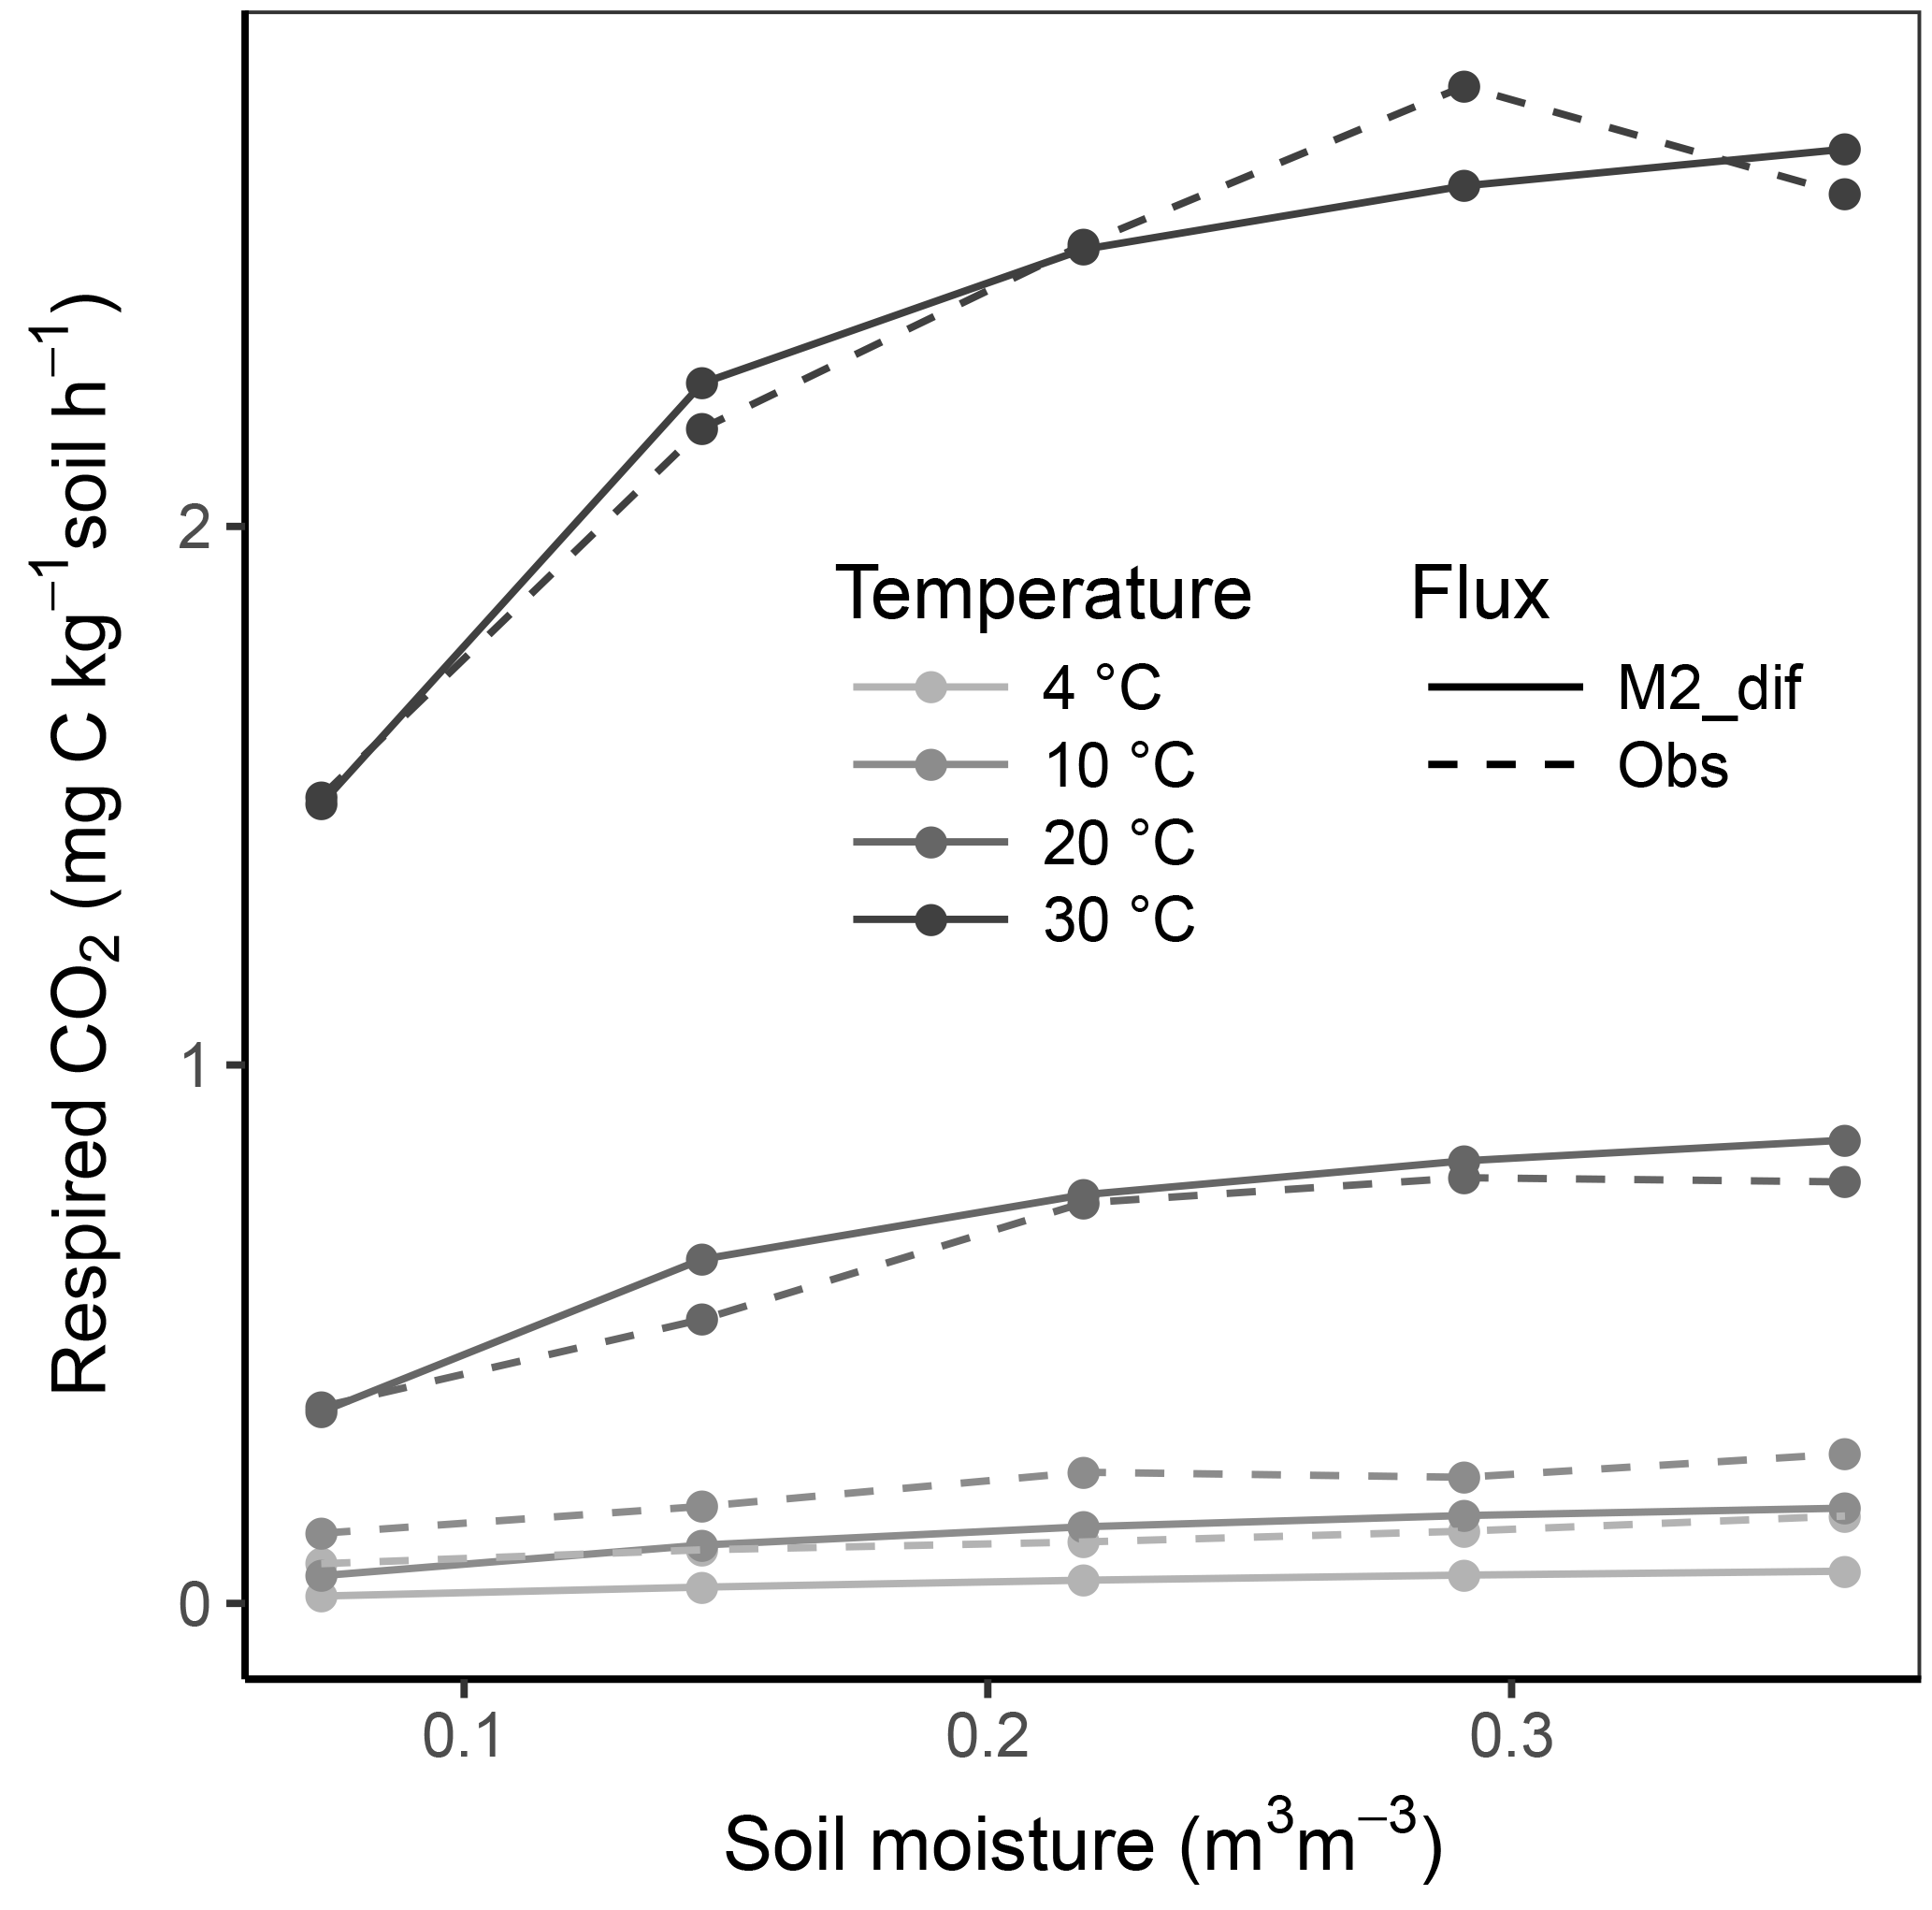
Figure 8Relationship of soil respiration with volumetric soil moisture shown for the model M2-dif and observations from the validation data (obs). Results are shown over four temperature levels.
Since the total amount of soil C was equal among samples and its relative change in the 6 months of incubation was small, we expected that second-order kinetics would do as well as Michaelis–Menten kinetics. But using Michaelis–Menten increased the R2 by ca. 5 % compared to second- and first-order kinetics. This combined with the fact that the model was highly sensitive to a change in KD, more than to VD, would indicate that Michaelis–Menten kinetics are in fact important for explaining soil C flows. Indeed, even in this case where the CP pool is relatively invariant, the outcome of a strong temperature effect modifying KD (Ea of 94 kJ) cannot be reproduced by second-order kinetics.
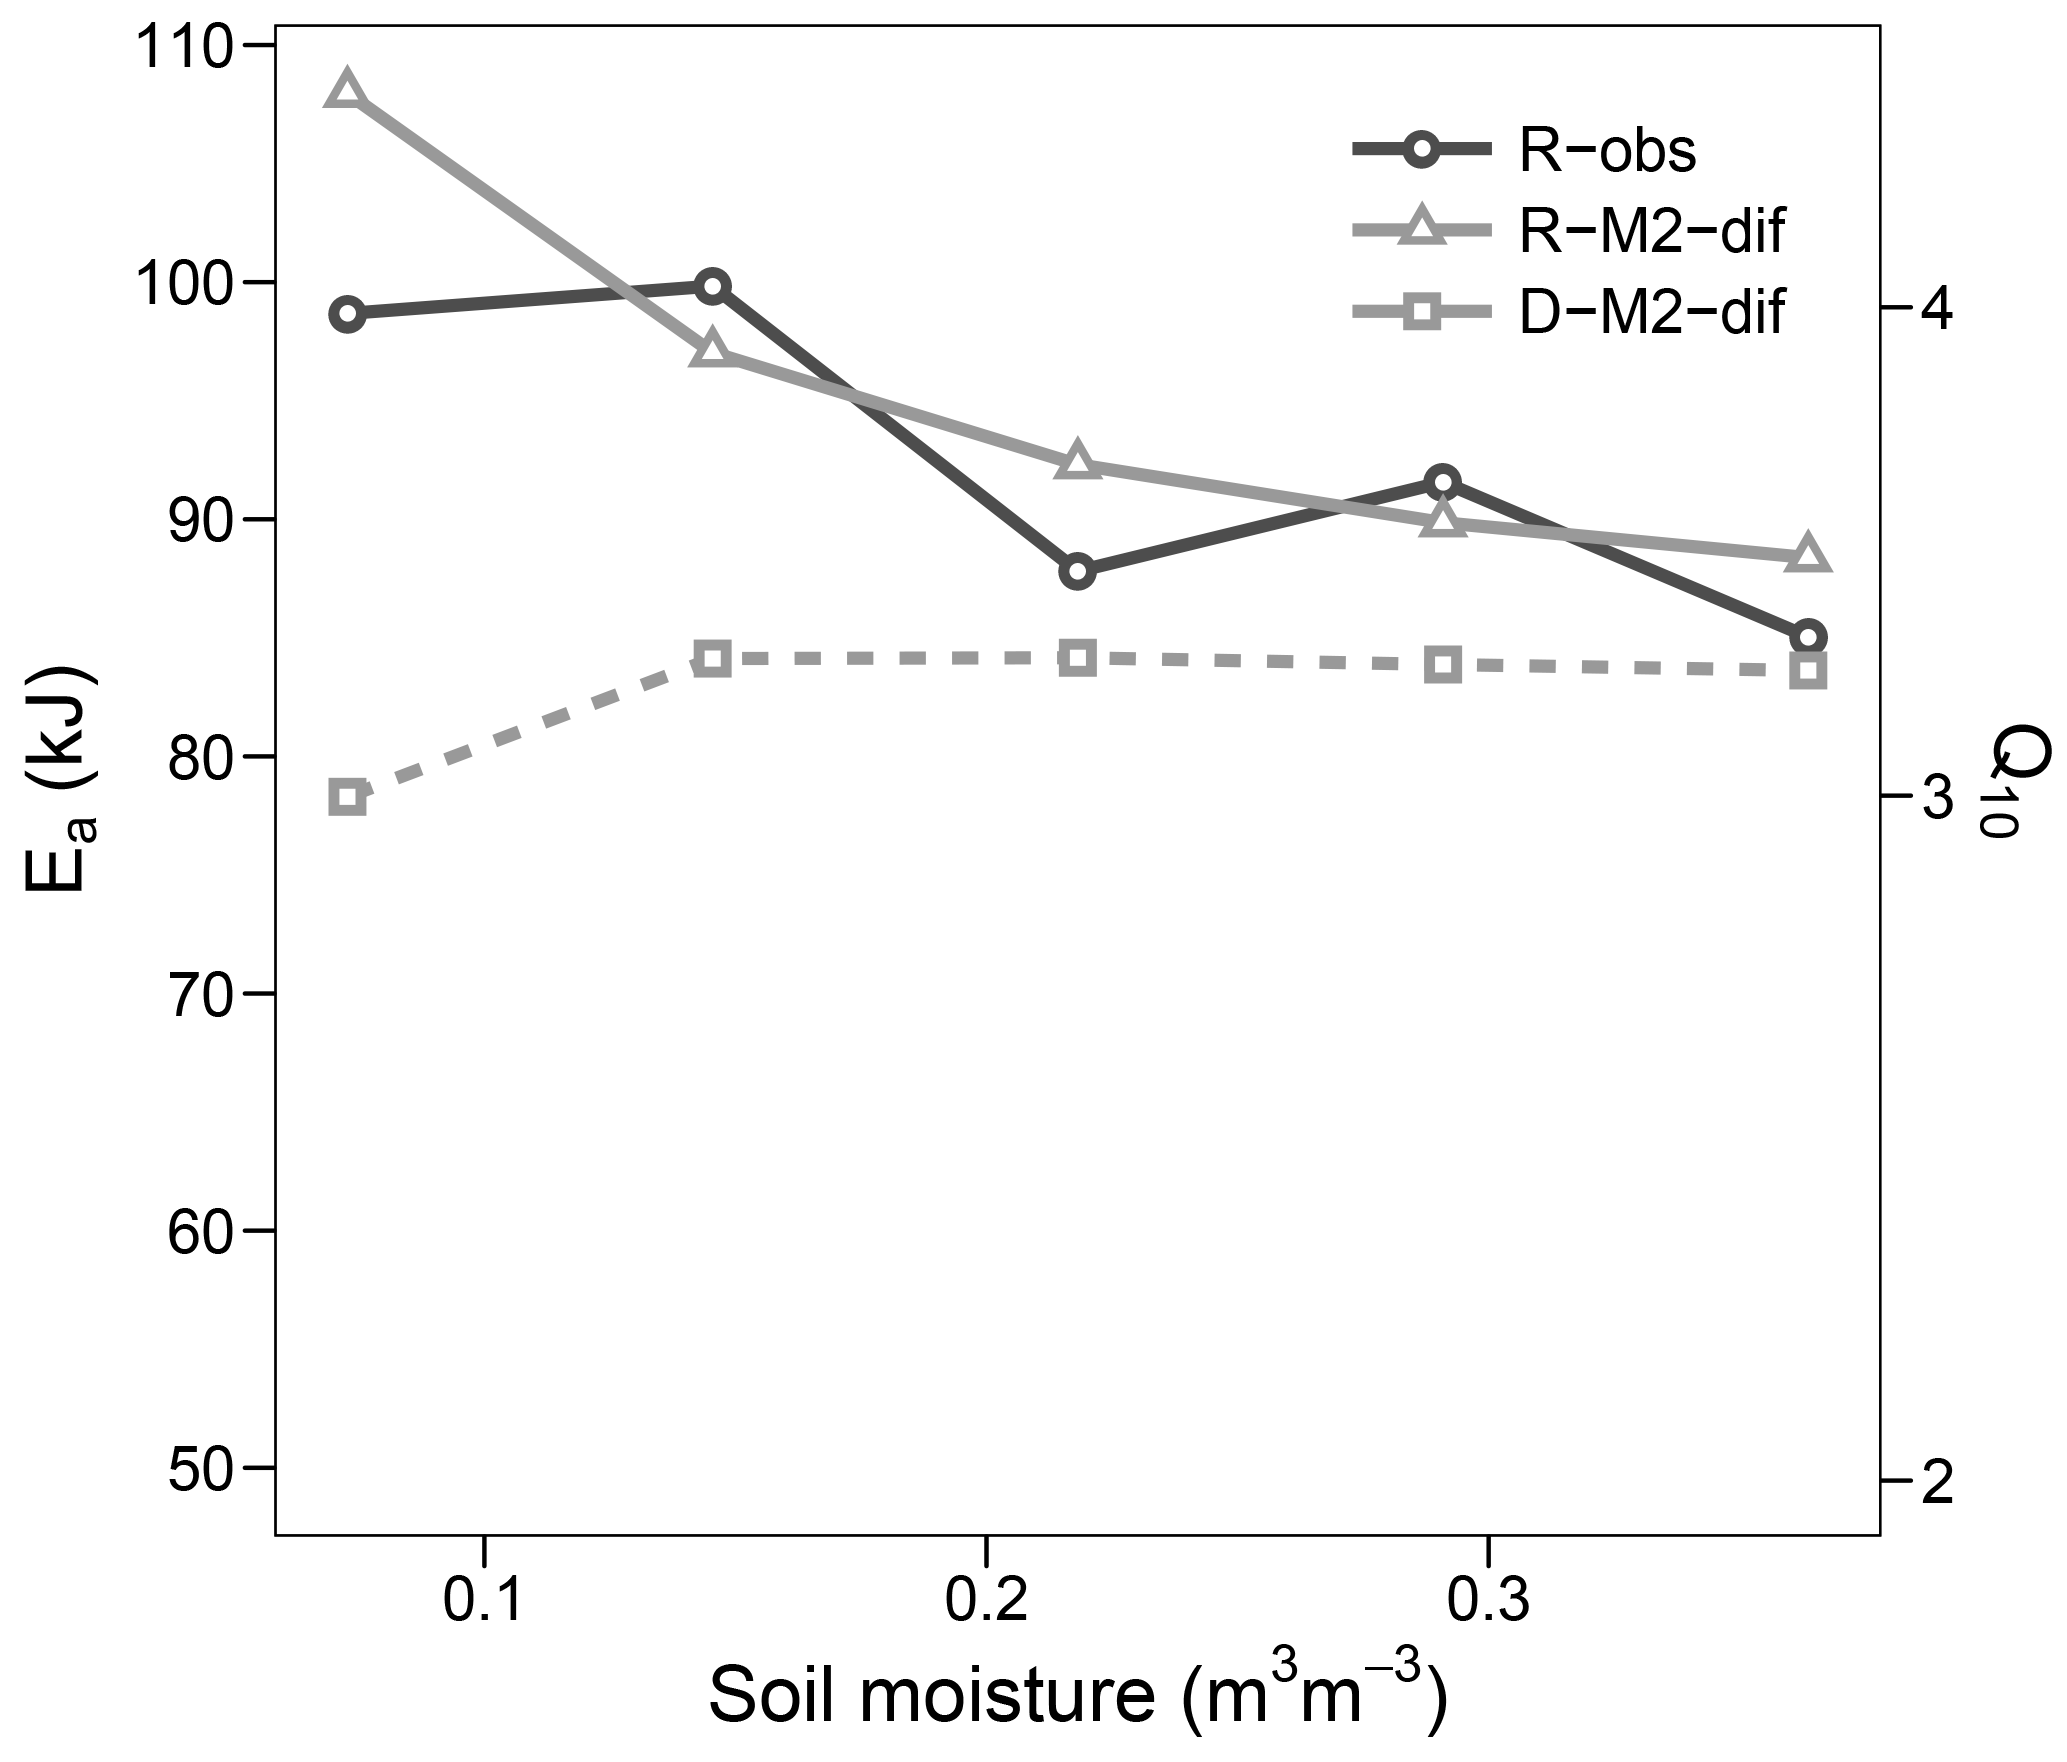
Figure 9Apparent activation energy (Ea) and equivalent Q10 (for the temperature range 15–25 ∘C) during the validation step. Values fitted to observed respiration (R-obs) as well as modelled respiration (R-M2-dif) and decomposition (D-M2-dif).
The relative importance of different processes was also shown by the model parameter sensitivity values. It is perhaps not surprising that some of the highest values were related to diffusion and temperature, since these were the two factors that varied in our experiment. However, these factors also vary considerably in natural ecosystems and largely drive changes in decomposition rates. No strong correlations between the effects of different parameters were found, with most being below 0.6 (Fig. S4), thus giving a degree of confidence in the estimated values. While we did not obtain statistical confidence intervals, kernel density estimations (Figs. S5–S12) suggest differing degrees of likelihood for different parameters. Activation energies in particular showed narrow ranges of optimal values with a strong dependence on model structure.
Since optimizing all parameters against our data resulted in an R2 of 0.87, it was surprising to obtain an R2 of 0.99 during model validation. We note that few studies were found with data on moisture and temperature interactions under controlled conditions, and this was the only validation attempt carried out. This very high R2 is partially thanks to the recalibration of initial pool sizes and may have to do with the reduced amount of data coming from a simpler experimental design compared to our study. There were only 20 data points in the validation data, one for each temperature and moisture combination. In contrast, we had 3 replicates, 11 moisture levels, and 2 temperature cycles, and therefore more data and associated variability. Despite these points and this being an initial validation step, such a close agreement using independent data and a soil that differed considerably in C content provides strong support for the model structure we used.
Model steady state or equilibrium is attained when the rate of change of all state variables equals zero, reflecting the state towards which the system will tend under invariant input and forcing conditions. Even though external drivers are in constant change in natural systems, steady-state information can indicate the approximate model behaviour under specific average conditions. Results here showed that the model M2-dif gives realistic values in the range of temperature for which it was calibrated but leads to unrealistic values under colder conditions. In addition, the CP pool shows little sensitivity to changes in C input. While the model fitted well the validation data, it may not be suitable when applied outside the conditions used for development and may need further changes for field applications. The limitations encountered are characteristic of non-linear microbial models and mark their current limitations as predictive tools. However, such limitations are most likely the result of missing processes that still need to be adequately represented. For example, recent work has shown that a density-dependent mortality rate of the microbial pool can lead to much more realistic long-term simulations (Georgiou et al., 2017).
It is important to point out that our approach was to use a simple model with few processes and C pools and modify only those components we tested. This allowed us to distinguish the effects of each modification and minimize parameter identifiability problems arising from having too many parameters with effects that may correlate. While this allowed us to focus on specific processes, it also meant that important mechanisms were left out. Some of these mechanisms are oxygen limitations in saturated conditions, leaching of CD, the coupling of the C and N cycles (introducing SOC quality and microbial stoichiometry limitations), and organo-mineral interactions. Our model thus needs further development to extend its application and general predictive capacity. In its current form, it cannot be extended to litter decomposition (Cotrufo et al., 2015) or organic soils, which will be much more dependent on substrate quality and less affected by carbon diffusion (Manzoni et al., 2012b). Also, peatlands and other saturated soils (Clymo, 1984; Frolking et al., 2001) will show different dynamics, reflecting the critical role of oxygen as a limiting factor. We did not include mineral adsorption of carbon as an active mechanism in this study. This is contrary to recent studies that used adsorption–desorption fluxes to explain the variability in temperature responses (Tang and Riley, 2014). However, some values of mineral desorption rates found in the literature (Ahrens et al., 2015) suggest that these rates, although important in the long term, are too slow to have a noticeable impact on the timescale of this or similar experiments, and thus on most estimates of soil respiration temperature sensitivities. Finally, nitrogen requirements will impose limits on the growth of microbial communities, which in models with microbial driven uptake and/or decomposition will also regulate C fluxes (Grant et al., 1993; Manzoni et al., 2012a). Despite such limitations, we demonstrated the effects and relevance of combining Michaelis–Menten kinetics with diffusion in mineral soils, with model results being well supported by the data.
7.1 Temperature effects
Unlike other calibrated parameters, the activation energy values for microbial (Ea_m) and enzyme (Ea_e) decay were fixed at 10 kJ, representing a positive but low temperature sensitivity. This value was used in order to be consistent with two main observations:
- a.
The effect of Ea_m on the amount of microbial carbon. A high Ea_m results in large changes of microbial biomass C with temperature. However, observations often show a negative but moderate effect of temperature on microbial biomass (Grisi et al., 1998; Salazar-Villegas et al., 2016).
- b.
The effect of Ea_e on carbon decomposition rates. High Ea_e values result in increasing accumulations of soil C with warming (Allison et al., 2010; Tang and Riley, 2014) as a consequence of a decrease in the enzyme pool caused by accelerated turnover. This is a critical aspect of enzyme-driven soil carbon models and largely determines simulated responses to long-term warming. Experimental evidence for Ea_e is lacking, but the latest observations of mid-term responses to warming are compatible with low values (Crowther et al., 2016).
The optimized Ea_V value of models with first- and second-order decomposition kinetics were in the range 40–50 kJ, translating to a Q10 of ca. 2. In contrast, for all but one model using M decomposition, values were above 90 kJ, translating to a Q10 of nearly 4. This high value was apparent in the modelled respiration fluxes only at lower temperatures, while at temperatures higher than 20 the apparent Q10 approximated the more commonly observed value of 2. Such results followed closely our observations and agree well with general trends in Q10 along the temperature axis reported by Hamdi et al. (2013). These values were mostly stable at high levels of soil moisture but increased sharply under drier conditions. This moisture relationship, however, is not necessarily the norm and seems to depend on initial conditions and/or pool dynamics, as demonstrated by the validation step (Fig. 9), where the apparent Ea remained close to 90 kJ and thus near the parameterized value. Also the change in Ea with moisture content followed a different trend in the validation data, although again values increased with lower moisture.
The difference between prescribed and observed temperature sensitivities may be related to two factors. First, the apparent sensitivities do not represent the instantaneous sensitivities dictated by the prescribed values but reflect also the effects of other limiting factors that change with time. Pool sizes, including CM and CE, may differ from the initial conditions as time progresses, making measurements at different temperatures not strictly comparable. The observation that Q10 values from studies using short incubation times (hours to days) are higher compared to those using longer incubation times (Hamdi et al., 2013) is consistent with this idea. The second factor is related to the temperature sensitivity of the K constant of Michaelis–Menten kinetics. Our results are well in line with the theory discussed by Davidson and Janssens (2006), who stated that “because the Km of most enzymes increases with temperature, the temperature sensitivities of Km and Vmax can neutralize each other, creating very low apparent Q10 values”. Indeed, this seems to be the most important effect of introducing Michaelis–Menten kinetics in our simulations – not, as first assumed, the effects of concentrations of either the CP or pools, since the choice of using M vs. Mr kinetics had only a small impact on the results.
The model results described above are thus emergent effects leading to apparent temperature sensitivities that vary in time but are based on constant model parameter (Ea) values. These results demonstrate how apparent sensitivities are the result of the offsetting effects of different processes (e.g. sensitivities of Michaelis–Menten parameters V vs. Km) and how different values can be measured when soil pool dynamics change (e.g. through changes in diffusion limitations) even when the underlying temperature sensitivities are the same. Much of the variability in reported temperature sensitivities of soil respiration, and in particular its relationship with soil moisture (Craine and Gelderman, 2011), may be the result of the changing dynamics in microbial, enzyme, and dissolved C pools during measurement times. Clearly, misleading conclusions regarding an intrinsic temperature sensitivity of soil C decomposition are often reached by the usual procedure of fitting a simple function to respiration vs. temperature data.
Decomposition, which was only modelled, consistently showed a lower apparent temperature sensitivity than respiration, with a Q10 between 1 and 2 for our experiment and just below 3 for the validation study. These values may be the most relevant for predicting long-term changes, since uptake and respiration ultimately depend on C made available by decomposition. These rather low sensitivities are consistent with some integrative studies at the ecosystem level (Mahecha et al., 2010) and again likely respond to the temperature sensitivities of Km and Vmax neutralizing each other. Such results raise the question of what Ea or Q10 values – i.e. those apparent for respiration, those apparent for decomposition, or those parameterized – are best suited for conventional first-order empirical soil models. Since these models will tend to have similar apparent and intrinsic behaviour, the answer is not clear and will require further research. Ultimately, the best option may be to abandon such models and develop better validated mechanistic alternatives for prediction purposes.
7.2 Moisture effects and diffusion limitations
Diffusion fluxes are a function of water content, diffusivity coefficients, and pool concentrations. Different equations have been used to calculate diffusion as a function of water content in soils (Hamamoto et al., 2010; Hu and Wang, 2003). All these equations generally predict a strong positive near-exponential effect of water content on diffusion. Following previous studies (Manzoni et al., 2016), we chose the function from Hamamoto et al. (2010). This equation allows for an adjustment of the percolation threshold (θth) in different soils. We note that when using the θth obtained during calibration (0.063) we also obtained a high fit to the validation data (R2=0.97, data not shown), so the recalibration of θth led to a noticeable but small improvement. While the value 0.063 for our soil came close to the water potential of −15 MPa found in previous studies (Manzoni and Katul, 2014), this relationship did not hold for the soil used for validation, where we assumed a higher clay and silt content from its classification. Thus, a prerequisite for applying our model to other soils is finding a relationship between θth and soil type that holds in all cases.
Diffusion regulations can be implemented either by simulating two separate pools between which diffusion takes place or by determining the available amount of a pool as a function of diffusivity (or conductance in our case) at each time step. In our model we used a combination, simulating a diffusion flux between enzyme pools and calculating how much CD is available for uptake at each time step. We did not assume a diffusion regulation of available polymeric C, an approach that is closer to empirical functions scaling the decomposition flux directly and that has been implemented in other microbial models (Davidson et al., 2012).
In our study especially, but also in the validation data, the moisture response tended to become less linear and have a larger plateau at higher temperatures. The mechanisms leading to such interactions are still unclear, but our model comparison indicates that solute diffusion limitations play a central role. The plateau behaviour, a decrease near saturation, and even near-linear responses all contrast with the near-exponential relationship between moisture and conductance given by Eq. (11) and with the fact that no oxygen limitations at high moisture levels were modelled. They may, however, result from a faster depletion of available carbon at high moisture levels and at high temperatures, driving down the accumulated fluxes over time.
While a low supply of O2 usually limits respiration rates in saturated soils under field conditions, O2 seemed to have a negligible effect in our study. At 35 ∘C, where fluxes were highest, no clear drop in respiration was observed near saturation, as is expected when O2 becomes limiting. Rather, the general behaviour was well simulated by our models using solute diffusion limitations only. Schurgers et al. (2006) found that the anaerobic fraction in soils with air O2 concentrations over 10 % is low until very close to saturation. The minimum flask air O2 concentrations (corresponding to 56 000 ppm of CO2, the maximum accumulated by a sample before changing headspace air) was over 15 % O2, which next to the small sample sizes would not indicate an O2 limitation.
In models where decomposition and respiration are separated processes, these fluxes can show different responses. This decoupling is especially evident when diffusion limitations come into play. Plots of modelled fluxes against temperature and moisture (Fig. S3) showed a different relationship when comparing respiration and decomposition. Figure 10 shows modelled decomposition against respiration (using M2-dif) as accumulated values, each line being a sample at a different water content. Without any diffusion limitation, the relationship follows a slope of ca. 0.3, determined by 1−fug, where fug is the fraction of uptake to growth (the C use efficiency). This slope, however, changes as diffusion becomes limiting, with temperature also playing a role as evidenced by the shifts in the slope occurring at various intervals. With time these fluxes will tend to equilibrate as the CD and pools adjust. But the proportionality between these fluxes is not constant and will depend on moisture, temperature, and time, even after months of incubation. These results show that, without a proper modelling framework and when assuming a constant proportionality, interpretations based only on respiration activity may lead to wrong conclusions about the dynamics of organic matter decomposition, especially at low moisture content levels and in short- and mid-term experiments.
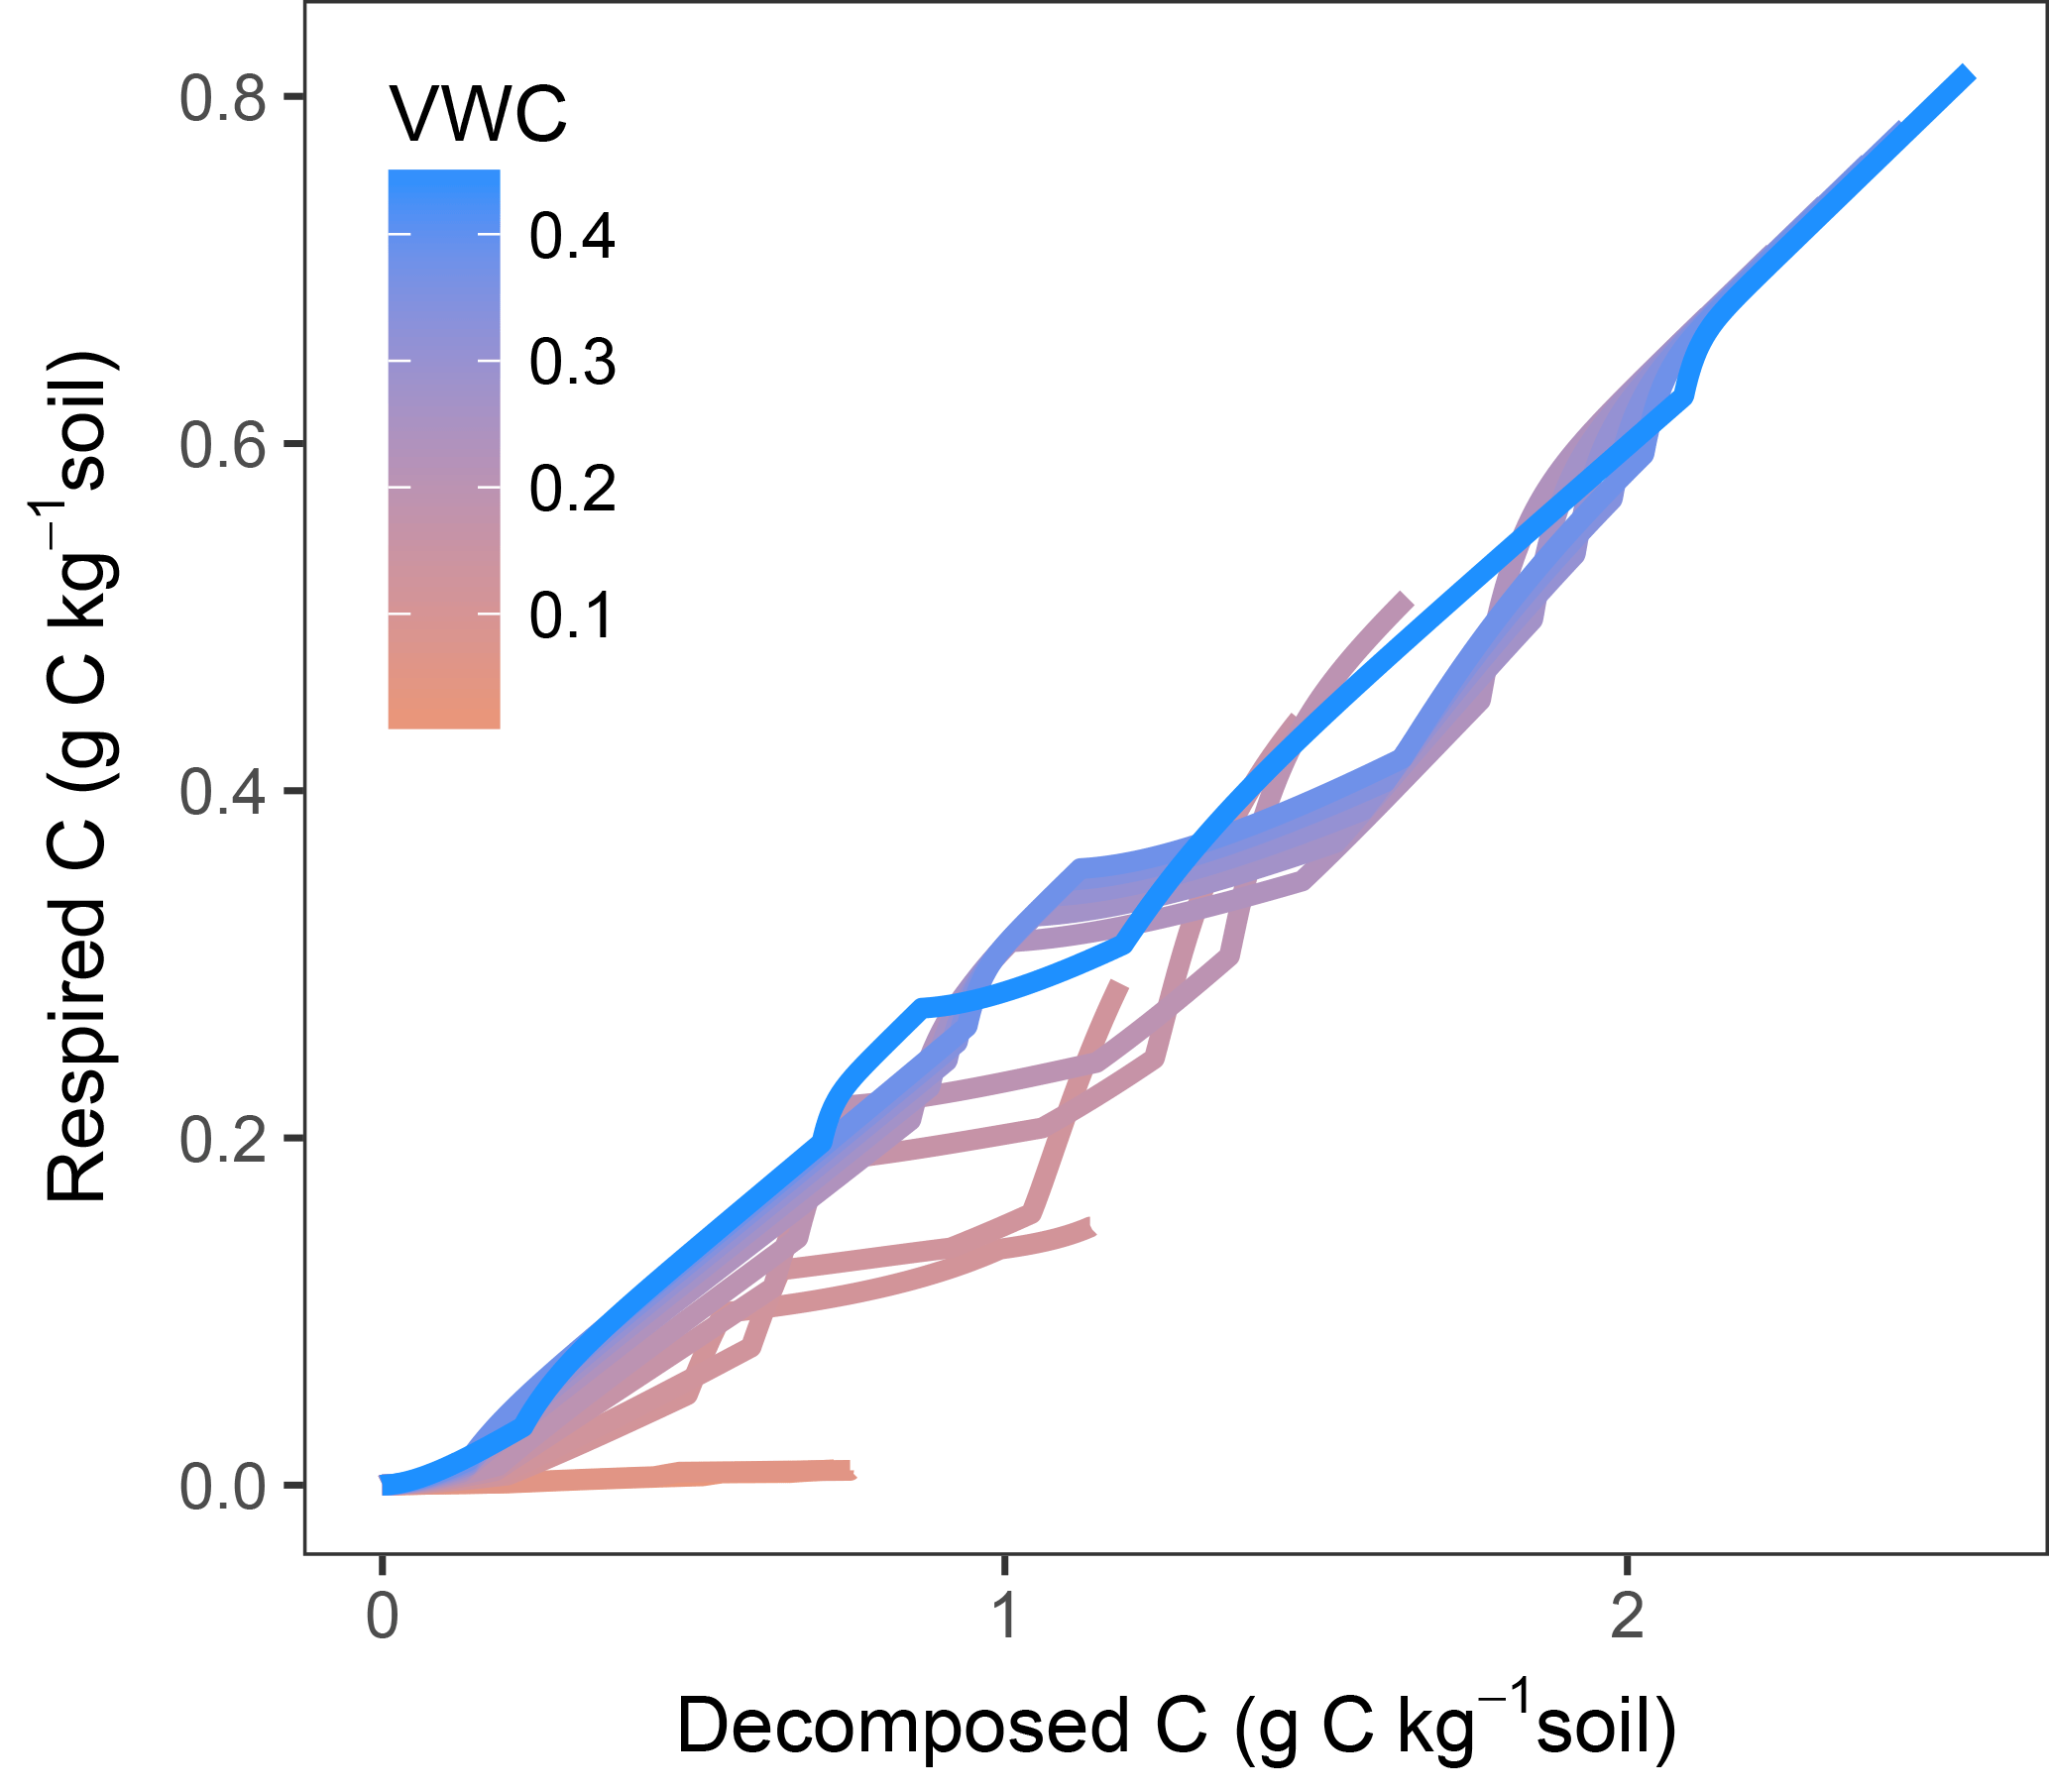
Figure 10Modelled decomposed vs. respired C shown as accumulated values over the entire simulated incubation, including temperature steps. Each line is a sample at a different moisture content level.
As the main mechanism linking water content with the movement of substrates, microbes, and enzymes, diffusion plays a central role in soil organic matter decomposition. We here showed that integrating it into models can significantly improve our understanding of soil C dynamics. Diffusion-based models were better at simulating the effects of moisture and improved the simulated temperature responses, thus allowing for a better interpretation of the observed temperature sensitivities. This and similar studies indicate that measured temperature sensitivities cannot be generalized or correctly interpreted without having a full understanding of the relevant mechanisms, their interactions, and the state of soil carbon and microbial pools.
We also found evidence that Michaelis–Menten kinetics plays an important role in soil C dynamics, explaining the strong differences in temperature sensitivities across temperature ranges. Our results are consistent with relatively high activation energies for both the V and K Michaelis–Menten parameters and generally lower apparent values.
Creating models that capture the variability in the response of C dynamics across different soils and at different levels of driving factors remains challenging. However, process-based models are of central importance for establishing confidence in C cycle predictions and soil–climate feedbacks. As seen here, the structure and process representation of models can be critical for simulating the complex response of soil C fluxes to combined changes in temperature and moisture. Diffusion as a moisture regulation of soil C fluxes has not been used in large scale predictions, which still rely on empirical scaling functions. Evidence of interactions seen in experiments and presented from a mechanistic model perspective indicates that these simpler approaches do not always hold. Further research should focus on more extensive validation and finding the relationships necessary for extending the application of models to diverse soil types.
All code and data used for this analysis are available at https://doi.org/10.5281/zenodo.1290716 (Moyano, 2018).
The supplement related to this article is available online at: https://doi.org/10.5194/bg-15-5031-2018-supplement.
FEM developed the model, analysed the data, and wrote the paper. NV carried out the lab experiments and revised the paper. LM contributed to model optimization, discussions, and revisions.
The authors declare that they have no conflict of interest.
This study was partially supported by funds from the R2DS projects “Le
carbone stable des sols: processus de stabilisation et
vulnérabilité” and “Vulnérabilité du C stable et labile du
sol aux changements climatiques: mise en évidence, facteurs explicatifs
et intégration dans un modèle de biosphère
spatialisée”.
This open-access publication
was funded
by the University of Göttingen.
Edited by: Andreas Ibrom
Reviewed by: Thomas
Wutzler and one anonymous referee
Ahrens, B., Braakhekke, M. C., Guggenberger, G., Schrumpf, M., and Reichstein, M.: Contribution of sorption, DOC transport and microbial interactions to the 14C age of a soil organic carbon profile: Insights from a calibrated process model, Soil Biol. Biochem., 88, 390–402, https://doi.org/10.1016/j.soilbio.2015.06.008, 2015.
Allison, S. D., Wallenstein, M. D., and Bradford, M. A.: Soil-carbon response to warming dependent on microbial physiology, Nat. Geosci., 3, 336–340, https://doi.org/10.1038/ngeo846, 2010.
Barré, P., Eglin, T., Christensen, B. T., Ciais, P., Houot, S., Kätterer, T., van Oort, F., Peylin, P., Poulton, P. R., Romanenkov, V., and Chenu, C.: Quantifying and isolating stable soil organic carbon using long-term bare fallow experiments, Biogeosciences, 7, 3839–3850, https://doi.org/10.5194/bg-7-3839-2010, 2010.
Batjes, N. H.: Total carbon and nitrogen in the soils of the world, Eur. J. Soil Sci., 65, 10–21, https://doi.org/10.1111/ejss.12114_2, 2014.
Birch, H. F.: The effect of soil drying on humus decomposition and nitrogen availability, Plant Soil, 10, 9–31, 1958.
Blagodatskaya, E. and Kuzyakov, Y.: Mechanisms of real and apparent priming effects and their dependence on soil microbial biomass and community structure: critical review, Biol. Fert. Soils, 45, 115–131, https://doi.org/10.1007/s00374-008-0334-y, 2008.
Borken, W. and Matzner, E.: Reappraisal of drying and wetting effects on C and N mineralization and fluxes in soils, Glob. Change Biol., 15, 808–824, https://doi.org/10.1111/j.1365-2486.2008.01681.x, 2009.
Campbell, G. S.: A simple method for determining unsaturated conductivity from moisture retention data, Soil Sci., 117, 311–314, 1974.
Clymo, R. S.: The Limits to Peat Bog Growth, Philos. T. R. Soc. B, 303, 605–654, 1984.
Cosby, B. J., Hornberger, G. M., Clapp, R. B., and Ginn, T. R.: A Statistical Exploration of the Relationships of Soil Moisture Characteristics to the Physical Properties of Soils, Water Resour. Res., 20, 682, https://doi.org/10.1029/WR020i006p00682, 1984.
Cotrufo, M. F., Soong, J. L., Horton, A. J., Campbell, E. E., Haddix, M. L., Wall, D. H., and Parton, W. J.: Formation of soil organic matter via biochemical and physical pathways of litter mass loss, Nat. Geosci., 8, 776–779, https://doi.org/10.1038/ngeo2520, 2015.
Craine, J. M. and Gelderman, T. M.: Soil moisture controls on temperature sensitivity of soil organic carbon decomposition for a mesic grassland, Soil Biol. Biochem., 43, 455–457, https://doi.org/10.1016/j.soilbio.2010.10.011, 2011.
Crowther, T. W., Todd-Brown, K. E. O., Rowe, C. W., Wieder, W. R., Carey, J. C., Machmuller, M. B., Snoek, B. L., Fang, S., Zhou, G., Allison, S. D., Blair, J. M., Bridgham, S. D., Burton, A. J., Carrillo, Y., Reich, P. B., Clark, J. S., Classen, A. T., Dijkstra, F. A., Elberling, B., Emmett, B. A., Estiarte, M., Frey, S. D., Guo, J., Harte, J., Jiang, L., Johnson, B. R., Kröel-Dulay, G., Larsen, K. S., Laudon, H., Lavallee, J. M., Luo, Y., Lupascu, M., Ma, L. N., Marhan, S., Michelsen, A., Mohan, J., Niu, S., Pendall, E., Peñuelas, J., Pfeifer-Meister, L., Poll, C., Reinsch, S., Reynolds, L. L., Schmidt, I. K., Sistla, S., Sokol, N. W., Templer, P. H., Treseder, K. K., Welker, J. M., and Bradford, M. A.: Quantifying global soil carbon losses in response to warming, Nature, 540, 104–108, https://doi.org/10.1038/nature20150, 2016.
Davidson, E. A. and Janssens, I. A.: Temperature sensitivity of soil carbon decomposition and feedbacks to climate change, Nature, 440, 165–173, 2006.
Davidson, E. A., Samanta, S., Caramori, S. S., and Savage, K.: The Dual Arrhenius and Michaelis-Menten kinetics model for decomposition of soil organic matter at hourly to seasonal time scales, Glob. Change Biol., 18, 371–384, https://doi.org/10.1111/j.1365-2486.2011.02546.x, 2012.
Frolking, S., Roulet, N. T., Moore, T. R., Richard, P. J. H., Lavoie, M., and Muller, S. D.: Modelling northern peatland decomposition and peat accumulation, Ecosystems, 4, 479–498, 2001.
Georgiou, K., Abramoff, R. Z., Harte, J., Riley, W. J., and Torn, M. S.: Microbial community-level regulation explains soil carbon responses to long-term litter manipulations, Nat. Commun., 8, 1223, https://doi.org/10.1038/s41467-017-01116-z, 2017.
Grant, R. F., Juma, N. G., and McGill, W. B.: Simulation of carbon and nitrogen transformations in soil: Mineralization, Soil Biol. Biochem., 25, 1317–1329, https://doi.org/10.1016/0038-0717(93)90046-E, 1993.
Grisi, B., Grace, C., Brookes, P. C., Benedetti, A., and Dell'abate, M. T.: Temperature effects on organic matter and microbial biomass dynamics in temperate and tropical soils, Soil Biol. Biochem., 30, 1309–1315, https://doi.org/10.1016/S0038-0717(98)00016-9, 1998.
Hagerty, S. B., van Groenigen, K. J., Allison, S. D., Hungate, B. A., Schwartz, E., Koch, G. W., Kolka, R. K., and Dijkstra, P.: Accelerated microbial turnover but constant growth efficiency with warming in soil, Nat. Clim. Change, 4, 903–906, https://doi.org/10.1038/nclimate2361, 2014.
Hamamoto, S., Moldrup, P., Kawamoto, K., and Komatsu, T.: Excluded-volume expansion of Archie's law for gas and solute diffusivities and electrical and thermal conductivities in variably saturated porous media, Water Resour. Res., 46, W06514, https://doi.org/10.1029/2009WR008424, 2010.
Hamdi, S., Moyano, F., Sall, S., Bernoux, M., and Chevallier, T.: Synthesis analysis of the temperature sensitivity of soil respiration from laboratory studies in relation to incubation methods and soil conditions, Soil Biol. Biochem., 58, 115–126, https://doi.org/10.1016/j.soilbio.2012.11.012, 2013.
Hu, Q. and Wang, J.: Aqueous-phase diffusion in unsaturated geologic media: A review, Crit. Rev. Env. Sci. Tec., 33, 275–297, 2003.
Kirschbaum, M. U.: The temperature dependence of organic-matter decomposition–still a topic of debate, Soil Biol. Biochem., 38, 2510–2518, 2006.
Lawrence, C. R., Neff, J. C., and Schimel, J. P.: Does adding microbial mechanisms of decomposition improve soil organic matter models? A comparison of four models using data from a pulsed rewetting experiment, Soil Biol. Biochem., 41, 1923–1934, 2009.
Li, J., Wang, G., Allison, S. D., Mayes, M. A., and Luo, Y.: Soil carbon sensitivity to temperature and carbon use efficiency compared across microbial-ecosystem models of varying complexity, Biogeochemistry, 119, 67–84, https://doi.org/10.1007/s10533-013-9948-8, 2014.
Mahecha, M. D., Reichstein, M., Carvalhais, N., Lasslop, G., Lange, H., Seneviratne, S. I., Vargas, R., Ammann, C., Arain, M. A., Cescatti, A., Janssens, I. A., Migliavacca, M., Montagnani, L., and Richardson, A. D.: Global Convergence in the Temperature Sensitivity of Respiration at Ecosystem Level, Science, 329, 838–840, https://doi.org/10.1126/science.1189587, 2010.
Manzoni, S. and Katul, G.: Invariant soil water potential at zero microbial respiration explained by hydrological discontinuity in dry soils, Geophys. Res. Lett., 41, 7151–7158, https://doi.org/10.1002/2014GL061467, 2014.
Manzoni, S., Tylor, P., Richter, A., Porporato, A., and Ågren, G. I.: Environmental and stoichiometric controls on microbial carbon-use efficiency in soils, New Phytol., 196, 79–91, https://doi.org/10.1111/j.1469-8137.2012.04225.x, 2012a.
Manzoni, S., Schimel, J. P., and Porporato, A.: Responses of soil microbial communities to water stress: results from a meta-analysis, Ecology, 93, 930–938, https://doi.org/10.1890/11-0026.1, 2012b.
Manzoni, S., Moyano, F., Kätterer, T., and Schimel, J.: Modeling coupled enzymatic and solute transport controls on decomposition in drying soils, Soil Biol. Biochem., 95, 275–287, https://doi.org/10.1016/j.soilbio.2016.01.006, 2016.
Meurer, A., Smith, C. P., Paprocki, M., Čertík, O., Kirpichev, S. B., Rocklin, M., Kumar, Am., Ivanov, S., Moore, J. K., Singh, S., Rathnayake, T., Vig, S., Granger, B. E., Muller, R. P., Bonazzi, F., Gupta, H., Vats, S., Johansson, F., Pedregosa, F., Curry, M. J., Terrel, A. R., Roučka, Š., Saboo, A., Fernando, I., Kulal, S., Cimrman, R., and Scopatz, A.: SymPy: symbolic computing in Python, PeerJ Comput. Sci., 3, e103, https://doi.org/10.7717/peerj-cs.103, 2017.
Moyano, F.: Modelling of temperature and moisture effects on carbon fluxes – BGS2018, https://doi.org/10.5281/zenodo.1290716, 2018.
Moyano, F. E., Vasilyeva, N., Bouckaert, L., Cook, F., Craine, J., Curiel Yuste, J., Don, A., Epron, D., Formanek, P., Franzluebbers, A., Ilstedt, U., Kätterer, T., Orchard, V., Reichstein, M., Rey, A., Ruamps, L., Subke, J.-A., Thomsen, I. K., and Chenu, C.: The moisture response of soil heterotrophic respiration: interaction with soil properties, Biogeosciences, 9, 1173–1182, https://doi.org/10.5194/bg-9-1173-2012, 2012.
Moyano, F. E., Manzoni, S., and Chenu, C.: Responses of soil heterotrophic respiration to moisture availability: An exploration of processes and models, Soil Biol. Biochem., 59, 72–85, https://doi.org/10.1016/j.soilbio.2013.01.002, 2013.
Parton, W., Schimel, D., Cole, C., and Ojima, D.: Analysis of Factors Controlling Soil Organic Matter Levels in Great Plains Grasslands, Soil Sci. Soc. Am. J., 51, 1173–1179, 1987.
Price, P. B. and Sowers, T.: Temperature dependence of metabolic rates for microbial growth, maintenance, and survival, P. Natl. Acad. Sci. USA, 101, 4631–4636, 2004.
R Development Core Team: R: A Language and Environment for Statistical Computing, R Foundation for Statistical Computing, Vienna, Austria, available at: http://www.R-project.org/ (last access: 22 August 2018), 2016.
Rey, A., Petsikos, C., Jarvis, P. G., and Grace, J.: Effect of temperature and moisture on rates of carbon mineralization in a Mediterranean oak forest soil under controlled and field conditions, Eur. J. Soil Sci., 56, 589–599, https://doi.org/10.1111/j.1365-2389.2004.00699.x, 2005.
Rodrigo, A., Recous, S., Neel, C., and Mary, B.: Modelling temperature and moisture effects on C-N transformations in soils: comparison of nine models, Ecol. Model., 102, 325–339, 1997.
Salazar-Villegas, A., Blagodatskaya, E., and Dukes, J. S.: Changes in the Size of the Active Microbial Pool Explain Short-Term Soil Respiratory Responses to Temperature and Moisture, Front. Microbiol., 7, 524, https://doi.org/10.3389/fmicb.2016.00524, 2016.
Schimel, J. P. and Weintraub, M. N.: The implications of exoenzyme activity on microbial carbon and nitrogen limitation in soil: a theoretical model, Soil Biol. Biochem., 35, 549–563, 2003.
Schurgers, G., Dorsch, P., Bakken, L., Leffelaar, P., and Haugen, L.: Modelling soil anaerobiosis from water retention characteristics and soil respiration, Soil Biol. Biochem., 38, 2637–2644, https://doi.org/10.1016/j.soilbio.2006.04.016, 2006.
Sierra, C. A., Trumbore, S. E., Davidson, E. A., Vicca, S., and Janssens, I.: Sensitivity of decomposition rates of soil organic matter with respect to simultaneous changes in temperature and moisture, J. Adv. Model. Earth Syst., 7, 335–356, https://doi.org/10.1002/2014MS000358, 2015.
Sierra, C. A., Malghani, S., and Loescher, H. W.: Interactions among temperature, moisture, and oxygen concentrations in controlling decomposition rates in a boreal forest soil, Biogeosciences, 14, 703–710, https://doi.org/10.5194/bg-14-703-2017, 2017.
Soetaert, K. and Petzoldt, T.: Inverse Modelling, Sensitivity and Monte Carlo Analysis in R Using Package FME, 2017-12-21 161648, available at: https://www.jstatsoft.org/article/view/v033i03 (last access: 10 January 2017), 2010.
Stein, M.: Large Sample Properties of Simulations Using Latin Hypercube Sampling, Technometrics, 29, 143–151, https://doi.org/10.1080/00401706.1987.10488205, 1987.
Suseela, V., Conant, R. T., Wallenstein, M. D., and Dukes, J. S.: Effects of soil moisture on the temperature sensitivity of heterotrophic respiration vary seasonally in an old-field climate change experiment, Glob. Change Biol., 18, 336–348, https://doi.org/10.1111/j.1365-2486.2011.02516.x, 2012.
Tang, J. and Riley, W. J.: Weaker soil carbon–climate feedbacks resulting from microbial and abiotic interactions, Nat. Clim. Change, 5, 56–60, https://doi.org/10.1038/nclimate2438, 2014.
Wickland, K. P. and Neff, J. C.: Decomposition of soil organic matter from boreal black spruce forest: environmental and chemical controls, Biogeochemistry, 87, 29–47, https://doi.org/10.1007/s10533-007-9166-3, 2008.
Wutzler, T. and Reichstein, M.: Colimitation of decomposition by substrate and decomposers – a comparison of model formulations, Biogeosciences, 5, 749–759, https://doi.org/10.5194/bg-5-749-2008, 2008.
Zhang, X., Niu, G.-Y., Elshall, A. S., Ye, M., Barron-Gafford, G. A., and Pavao-Zuckerman, M.: Assessing five evolving microbial enzyme models against field measurements from a semiarid savannah-What are the mechanisms of soil respiration pulses?, Geophys. Res. Lett., 41, 6428–6434, https://doi.org/10.1002/2014GL061399, 2014.