the Creative Commons Attribution 3.0 License.
the Creative Commons Attribution 3.0 License.
Interactive network configuration maintains bacterioplankton community structure under elevated CO2 in a eutrophic coastal mesocosm experiment
Xin Lin
Ruiping Huang
Yan Li
Futian Li
Yaping Wu
David A. Hutchins
Minhan Dai
There is increasing concern about the effects of ocean acidification on marine biogeochemical and ecological processes and the organisms that drive them, including marine bacteria. Here, we examine the effects of elevated CO2 on the bacterioplankton community during a mesocosm experiment using an artificial phytoplankton community in subtropical, eutrophic coastal waters of Xiamen, southern China. Through sequencing the bacterial 16S rRNA gene V3-V4 region, we found that the bacterioplankton community in this high-nutrient coastal environment was relatively resilient to changes in seawater carbonate chemistry. Based on comparative ecological network analysis, we found that elevated CO2 hardly altered the network structure of high-abundance bacterioplankton taxa but appeared to reassemble the community network of low abundance taxa. This led to relatively high resilience of the whole bacterioplankton community to the elevated CO2 level and associated chemical changes. We also observed that the Flavobacteria group, which plays an important role in the microbial carbon pump, showed higher relative abundance under the elevated CO2 condition during the early stage of the phytoplankton bloom in the mesocosms. Our results provide new insights into how elevated CO2 may influence bacterioplankton community structure.
- Article
(2198 KB) - Full-text XML
-
Supplement
(3517 KB) - BibTeX
- EndNote


It is well established that ocean acidification is being caused by increased uptake of anthropogenically derived carbon dioxide in the surface ocean. Consequently, it is predicted that under a “business-as-usual” CO2 emission scenario, the present average surface pH value will drop 0.4 units over the next century (Gattuso et al., 2015). Despite a growing interest in the importance of the roles of marine bacterioplankton in ocean ecosystems and biogeochemical cycles, our current understanding of their responses to ocean acidification is still limited. Over half of autotrophically fixed oceanic CO2 is processed by heterotrophic bacteria and archaea through the microbial loop and carbon pump (Azam, 1998; Jiao et al., 2010). Furthermore, marine bacterioplankton play an essential role in marine ecosystems and global biogeochemical cycles central to the biological chemistry of Earth (Falkowski et al., 2008). The null hypothesis is that elevated CO2 will not affect biogeochemical processes (Liu et al., 2010; Joint et al., 2011); however, more investigation is required to adequately test this. Ocean acidification mesocosm experiments provide good opportunities to explore the responses of marine bacteria to elevated CO2. Mesocosm studies conducted in the Arctic Ocean, Norway, Sweden and the coastal Mediterranean Sea using natural phytoplankton communities have often found that elevated CO2 has little direct effect on the bacterioplankton community (Zhang et al., 2013; Ray et al., 2012, 2013; Baltar et al., 2015). In contrast, phytoplankton blooms induced by high CO2 can sometimes have significant indirect effects on heterotrophic microbes, thus altering bacterioplankton community structure (Allgaier et al., 2008; Hutchins and Fu, 2017). Although most mesocosm studies have shown that elevated CO2 had an insignificant impact on bacterioplankton community structure, microcosm experiments have demonstrated that small changes in pH can have direct effects on marine bacterial community composition (Krause et al., 2012). Ocean acidification experiments using natural biofilms showed bacterial community shifts, with decreasing relative abundance of Alphaproteobacteria and increasing relative abundance of Flavobacteriales (Witt et al., 2011). Coastal microbial biofilms grown at high CO2 level also resulted in different community structures compared to those grown at ambient CO2 level in a natural carbon dioxide vent ecosystem (Lidbury et al., 2012). Ocean acidification also affects the community structure of bacteria associated with corals. It has been reported that the relative abundance of bacteria associated with diseased and stressed corals increased under decreasing pH conditions (Meron et al., 2011). A very limited number of studies focused on the effects of ocean acidification on isolated bacterial strains have also been reported. Under lab conditions, growth of Vibrio alginolyticus, a species belonging to the class Gammaproteobacteria, was suppressed at low CO2 levels (Labare et al., 2010). In contrast, stimulation of growth was observed for one Flavobacteria species under high CO2 levels (Teira et al., 2012).
Taken together, results from mesocosm, microcosm and cultured isolate experiments indicate a potentially complex interaction between different groups of marine bacteria in response to elevated CO2. One promising method to elucidate these types of complex interactions is network analysis. Ecological network approaches have been successfully applied to investigate the complexity of interactions among zooplankton and phytoplankton from different trophic levels during the Tara Oceans Expedition project (Lima-Mendez et al., 2015; Guidi et al., 2016). Elucidating the complex interactions between bacterioplankton and other marine organisms under anthropogenic perturbations will increase our understanding of their impact in a holistic way. Previous studies using ecological network analysis showed that elevated CO2 significantly impacted soil bacterial/archaeal community networks by decreasing the connections for dominant fungal species and reassembling unrelated fungal species in a grassland ecosystem (Tu et al., 2015). It was also reported using ecological network analysis that elevated pCO2 did not significantly affect microbial community structure and succession in the Arctic Ocean, suggesting bacterioplankton community resilience to elevated pCO2 (Wang et al., 2016).
It has been reported that eutrophication problems in coastal regions lead to complex cross-linkages between ocean acidification and eutrophication (Cai et al., 2011). The occurrence of ocean acidification combined with other environmental stressors such as eutrophication can potentially produce synergistic or antagonistic effects on bacterioplankton that differ from those caused by ocean acidification alone. Although there are some reports from mesocosm experiments describing the response of bacteria to elevated CO2, there are very few studies on how the bacterial community responds to ocean acidification in eutrophic marine environments. In this study, Illumina sequencing of the V3-V4 region of the bacterial 16S rRNA gene was used to explore the effects of ocean acidification on bacterioplankton community composition and ecological network structure in a eutrophic coastal mesocosm experiment.
2.1 Mesocosm setup and carbonate system manipulation
The mesocosm experiment was conducted in the FOANIC-XMU (Facility for the Study of Ocean Acidification Impacts of Xiamen University) mesocosm platform located in Wuyuan Bay, Xiamen, Fujian Province, East China Sea (24∘31′48 N, 118∘10′47 E), during the months of December 2014 and January 2015 (Fig. S1 in the Supplement). Each transparent thermoplastic polyurethane (TPU) cylindrical mesocosm bag was 3 m deep and 1.5 m wide (∼ 4000 L total volume). After setting up the mesocosm bags within steel frames, in situ seawater from Wuyuan Bay was filtered through a 0.01 µm water purifying system and used to simultaneously fill eight bags within 24 h. The initial in situ seawater pCO2 in Wuyuan Bay was ∼ 650 µatm, due to the active decomposition of land-sourced organic compounds. In order to reach the target low pCO2 value associated with ambient air (400 ppm), Na2CO3 was added to each mesocosm to increase dissolved inorganic carbon (DIC) and total alkalinity (TA) by 100 and 200 µmol L−1, respectively, based on carbonate system calculations (Lewis et al., 1998). To adjust seawater to projected end of this century air conditions of ∼ 1000 ppm CO2, about 5 L of CO2 saturated filtered seawater was added to four mesocosms (#2, #4, #7, #9), collectively considered to be the HC treatment, while the other four mesocosms (#1, #3, #6, #8) were considered to be the LC treatment. Throughout the experiment, HC mesocosms and LC mesocosms were bubbled with air containing 1000 and 400 ppm CO2, respectively, supplied by CO2 Enrichlors (CE-100B, Wuhan Ruihua Instrument & Equipment Ltd, China) at a flow rate of 4.8 L min−1. pHNBS was determined on the scene with a pH/mV/ORP meter (LEAN) calibrated with National Bureau of Standards (NBS) buffers. Samples for DIC measurement were collected into 250 mL brown borosilicate glass bottles and poisoned with 250 µL of saturated HgCl2 solution. DIC was determined by acidification of 0.5 mL samples and subsequently infrared quantification of CO2 with an Apollo® DIC Analyzer. pHtotal was determined using a Orion 3 Star pH benchtop analyzer and an Orion Ross combined pH electrode, which was calibrated against three NIST-traceable pH buffers (pH 4.01, 7.00 and 10.01; Cao et al., 2011). The pCO2 and TA values in this study were calculated from DIC and pHtotal by the CO2SYS Program (Lewis and Wallace, 1998).
Two diatoms, Phaeodactylum tricornutum CCMA 106 from the Centre for Collections of Marine Bacteria and Phytoplankton of the State Key Laboratory of Marine Environmental Science (Xiamen University, China) and Thalassiosira weissflogii CCMP 102 from the Provasoli-Guillard National Center for Culture of Marine Phytoplankton (CCMP, USA), as well as the coccolithophorid Emiliania huxleyi CS-369 from the Commonwealth Scientific and Industrial Research Organisation (CSIRO, Australia), were used as inoculum to construct a model phytoplankton community. The effects of ocean acidification on these three phytoplankton species have been intensively studied in the lab at the physiological, biochemical and molecular levels. However, it is difficult to extrapolate the responses of these species to ocean acidification in natural complex environments based on laboratory single-species experiments (Busch et al., 2015). Our experiment was designed as an intermediary step between laboratory and natural community field experiments, with isolates of non-axenic phytoplankton being added to filtered natural waters. In this way, we were able to investigate the effect of ocean acidification on phytoplankton and bacterioplankton in naturally eutrophic waters while minimizing the complexity of shifting compositions of natural phytoplankton communities. Correlated data about the effects of ocean acidification on the artificial phytoplankton community using the same mesocosm system are available in Jin et al. (2015) and Liu et al. (2017).
The initial concentration of both P. tricornutum and T. weissflogii was 10 cells mL−1, and E. huxleyi was added at 20 cells mL−1. The phytoplankton cultures were not axenic. The bacteria community composition in the inoculated phytoplankton culture is shown in Fig. S2. Bacteria were not detectable by flow cytometry in the filtered seawater used to fill the mesocosms just before inoculation. The three species of non-axenic phytoplankton with bacterioplankton were mixed and then inoculated into each mesocosm bag. Thus, we considered the initial bacterioplankton community to be the same or similar in each mesocosm bag because the phytoplankton cultures with their associated bacterioplankton were evenly distributed into each mesocosm bag for inoculation. The mesocosm and the CO2 bubbling system were not sterile and not completely closed during the experiment. Therefore, natural bacterioplankton were undoubtedly introduced into the mesocosm system through aeration and air–sea exchange, and the bacterioplankton community in this mesocosm experiment was derived from both the bacteria added with the inoculated phytoplankton culture and the natural local prokaryotic assemblage.
The use of the natural phytoplankton and bacterioplankton communities in this mesocosm experiment would better represent the effects of ocean acidification on natural phytoplankton and bacterioplankton communities. However, considering the highly eutrophic in situ seawater in Wuyuan Bay, it was impractical to use the ambient seawater with the in situ natural community (bacterioplankton, phytoplankton, zooplankton) directly without filtration, because of the dense phytoplankton bloom that would be induced within several days, making the pCO2 very difficult to keep under control. Alternatively, we would have had to dilute 4 t of seawater in the mesocosm bags at least every 2 days to maintain the cell density and CO2 concentration. Furthermore, considering a number of studies on the typical phytoplankton responses to ocean acidification that have been carried out in laboratory, it was indeed a natural progression for us to use typical model phytoplankton species to initiate the mesocosm studies before using natural communities. Therefore, using the filtered seawater with inoculated isolates was reasonable and logistically practical for our experiment.
2.2 Bacteria sampling, filtration and sample selection
A total of 500 mL to 2 L of water, depending on bacterial concentration, was sampled from the mesocosms. Six of the mesocosms (HC: #2, #4, #7; LC: #1, #6, #8) were chosen for further study. The inter-replicate variation in mesocosm experiments is usually more significant than in lab experiments, because mesocosm experiments are conducted in open environments. Initially we had four replicates for each treatment; however, mesocosm bag 9 had a hole and mesocosm bag 3 was contaminated by other phytoplankton in the beginning. Therefore, we did not consider the data from these two compromised bags. Furthermore, three replicates of each treatment in our experiment to some extent balanced out the bacteria introduction contingency, although the inter-replicate variation was significant. Samples from days 4, 6, 8, 10, 13, 19, and 29 were collected in this study due to time, personnel and equipment constraints. Sequential size fractionated filtration (2 and 0.2 µm polycarbonate filters) by peristaltic pump was used to filter seawater collected from the mesocosm bags. We tried unsuccessfully to sample on day 2, probably due to very high concentration of TEP (transparent exopolymer particles), which easily blocked the polycarbonate filter. Some replicates were missing at day 4 because we were able to successfully extract enough DNA for sequencing only from bag 1, bag 7 and bag 6, also probably due to high TEP at day 4. It has been reported that high TEP concentration is typically associated with high bacteria biomass (Sugimoto et al., 2007; Ramaiah et al., 2000). Bacterioplankton abundance data (Fig. S3) indicated that the average abundance of prokaryotes was 6.69 × 10⁹ and 9.71 × 10⁹ cells mL−1 at day 2 and day 4, respectively.
2.3 DNA extraction, 16S rDNA V3-V4 region amplification and Illumina MiSeq sequencing
Samples collected by 0.2 µm polycarbonate filters as described above were washed with PBS buffer and then centrifuged at 9600 g to obtain a cell pellet. A previously described DNA extraction protocol (Francis et al., 2005) was utilized with some modifications, using the columns for DNA purification from a bacteria DNA extraction kit (Tiangen DP302, China). Amplification, library construction and sequencing were performed offsite at ANNOROAD using the DNA samples isolated as described above. Primers were 341F (5′-CCTACGGGNGGCWGCAG-3′) and 805R (5′-GACTACHVGGGTATCTAATCC-3′), targeting the V3-V4 hypervariable regions of the bacterial 16S rRNA gene. The PCR amplification condition was as follows: initial denaturation at 95 ∘C for 3 min, 25 cycles of denaturation at 95 ∘C for 30 s, annealing at 55 ∘C for 30 s and extension at 72 ∘C for 30 s, then final extension at 72 ∘C for 5 min. DNA library construction and sequencing followed the MiSeq Reagent Kit Preparation Guide (Illumina, USA).
2.4 Sequence assignment and sequence statistics analysis
Clean paired-end reads were merged using PEAR (Zhang et al., 2014). The remaining raw sequences were distinguished and sorted by unique sample tags. Unique operational taxonomic units (OTUs) were picked against the Greengenes database (http://greengenes.lbl.gov/Download/Sequence_Data; McDonald et al., 2012) at 97 % identity. OTUs with fewer than two reads were not considered. According to the reference database, the representative sequences for each OTU were aligned using PyNAST (Caporaso et al., 2010a). Finally, the phylogenetic tree was generated from the Graphlan (Langille et al., 2013) using information on both the relative abundance and phylogenetic relationship of observed species. QIIME 1.8.0 was used for sequence analysis including OTUs extraction for bacterioplankton community structure analysis, OTUs overlapping analysis, species diversity, species richness analysis and principal components analysis (PCA; Caporaso et al., 2010b). Bacterioplankton community composition differences were assessed by Unweighted UniFrac distance using QIIME 1.8.0 as well. Dissimilarity tests were based on the Bray–Curtis dissimilarity index using analysis of similarities (ANOSIM; Clarke, 1993), non-parametric multivariate analysis of variance (ADONIS; Anderson, 2001), and multi-response permutation procedures (MRPP; Mielke et al., 1981). Observed species, Chao index, Shannon index and Simpson index were used to estimate the community diversity. Analysis of variance (ANOVA) followed by a t test was performed to test for any significant differences between HC and LC treatments.
Table 1Topological properties of the bacterioplankton communities as represented by molecular networks under HC and LC treatments, as well as their rewired random networks.
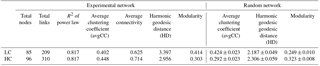
2.5 Ecological network construction and analysis
As previously described, ecological network construction and analyses were performed based on the relative abundance of OTUs in HC and LC treatments with three biological replicates (http://129.15.40.240/mena/; Wang et al., 2016). The sequencing data from each mesocosm bag with time series throughout the experiment were considered as different replicates. First, the similarity matrices of the relative abundance of OTUs in LC and HC conditions were created, respectively, using Pearson correlation coefficient across time points with biological replicates by a random matrix theory (RMT)-based approach. Cut-off values were determined according to R2 of power law larger than 0.8 and equal between two manipulations to construct network structure. In order to ensure that the constructed networks were not random, biologically meaningless networks, 100 networks from the same matrix were constructed and randomized. This resulted in the experimental networks being different from random networks judging by significantly higher modularity, clustering coefficient and geodesic distance (Table 1). Then, module separation was produced using greedy modularity optimization, and Z−P values for all nodes were calculated. In addition, to compare networks, the network connection was randomly rewired and network topological properties were calculated. Finally, the bacteria network interaction was visualized by Cytoscape v.3.3.0. The Z−P plots were constructed based on within-module (Z) and among-module (P) values of each node derived from ecological network analysis. Ecological network analysis is a novel RMT-based framework for studying microbial interactions. A node in ecological network analysis shows an OTU, and a link demonstrates a connection between two OTUs. The shortest path between nodes is indicated by geodesic distance. Since the network constructed by OTUs can be separated into several sub-communities, or modules, the modularity value indicates how well a network can be divided into different sub-communities. Clustering coefficients demonstrate how well an OTU is connected with other OTUs, while average clustering coefficients indicate the extent of connection in a network.
3.1 Environmental parameters and experimental timeline
The initial inorganic nitrogen, PO, and SiO concentrations were 70–75, 2.5–2.6, and 38–39 µmol L−1, respectively. Except for SiO, nutrient concentrations decreased with rapid growth of the phytoplankton and reached low concentrations by day 15. The dissolved total inorganic nitrogen dropped from an initial concentration of 74.72 ± 2.80 to 57.17 ± 4.37 µmol L−1 in the HC condition and 72.01 ± 5.90 to 53.57 ± 5.60 µmol L−1 in the LC condition by day 8, and reached low concentrations by day 15 (average 3 µmol L−1 in LC and average 6 µmol L−1 in HC).
The carbonate chemistry data at different time points are shown in Table S1 in the Supplement. A comprehensive description of carbonate chemistry measurements and analysis during this mesocosm experiment is given in Yan Li et al. (unpublished). The initial pCO2 of 373.0 ± 43.9 µatm (pHNBS: 8.18 ± 0.02) in the LC treatment and 1296.0 ± 159.6 µatm (pHNBS: 7.75 ± 0.04) in the HC treatment increased and reached a peak value of 922.5 ± 142.0 µatm (pHNBS: 7.74 ± 0.08) in the LC treatment at day 8 and 1879.6 ± 145.4 µatm (pHNBS: 7.49 ± 0.05) in the HC treatment at day 4. After reaching the peak, the pCO2 values of both treatments decreased and were no longer statistically different from day 13 onwards due to rapid CO2 uptake by the phytoplankton, despite air containing 1000 ppm CO2 being continuously bubbled into the HC treatments (Fig. 1a, b). The bacterioplankton biomass was very high on day 2 and day 4 (Fig. S3). However, the large amount of DIC (dissolved inorganic carbon) produced by this high biomass of bacterioplankton could not be consumed by the phytoplankton, which were still at very low biomass, thus explaining the significant DIC production in the beginning. The continuous rise of pCO2 until the phytoplankton reached a certain concentration in the beginning was also due to the high concentration of bacteria and the low concentration of phytoplankton, even though the seawater was being aerated at target pCO2.

Figure 1Temporal variations of pCO2 (a), pHNBS (b) and Chl a (c) during the whole experiment. The pCO2 was calculated from DIC and pH using the CO2SYS program. Data are the means ±SD, n= 3.
P. tricornutum and T. weissflogii were the dominant species throughout the whole phytoplankton bloom in both the HC and LC conditions. Chlorophyll a (Chl a) concentrations and diatom cell densities were used to identify changes in the diatom bloom following inoculation (Fig. 1c, Liu et al., 2017). Chl a concentration increased from 0.23 ± 0.12 to 5.33 ± 1.82 µg L−1 in the LC conditions, and from 0.19 ± 0.07 to 5.75 ± 1.17 µg L−1 in the HC conditions from day 4 to day 9. Thereafter, Chl a concentration increased significantly and peaked at 109.86 ± 38.04 in the LC treatment and 108.57 ± 46.07 µg L−1 in the HC treatment at day 15. Subsequently, Chl a concentrations in both treatments were maintained at high concentrations until day 25 and decreased progressively afterward. The bloom process identified by elevated cell concentrations of P. tricornutum and T. weissflogii was similar to that illustrated by Chl a concentration. The growth of these two diatom species entered logarithmic phase from day 2. Cell density reached highest concentration at day 15 and day 19 for T. weissflogii and P. tricornutum, respectively, and then dropped down slowly. The coccolithophore Emiliania huxleyi largely disappeared from the experimental mesocosms. A comprehensive description of phytoplankton cell density, Chl a concentration, particle organic carbon (POC) and particle organic nitrogen (PON) during the experiment is given in Liu et al. (2017).
3.2 Overview of sequencing analysis
Following sequencing, 828 524 high-quality sequences were kept after processing (Table S2), and 39.3 % of assembled reads were successfully aligned with the database. As a result, a total of 557 unique OTUs were generated after clustering at a 97 % similarity level; 49.1 % of OTUs were classified to genus level with high taxonomic resolution (Table S3). The phylogenetic tree was constructed based on the sequences derived from all of the samples (Fig. S4). The bacterioplankton from all of the samples in this study were identified as members of Bacteroidetes or Proteobacteria phyla. The most dominant OTUs were Alphaproteobacteria, Rhodobacterales, Rhodobacteraceae and Sediminicola at the class, order, family and genus levels, respectively (Fig. S5). The most abundant sequences at the class, order, family and genus levels accounted for 43.4, 42.6, 41.7 and 32.8 % of all sequences, respectively.
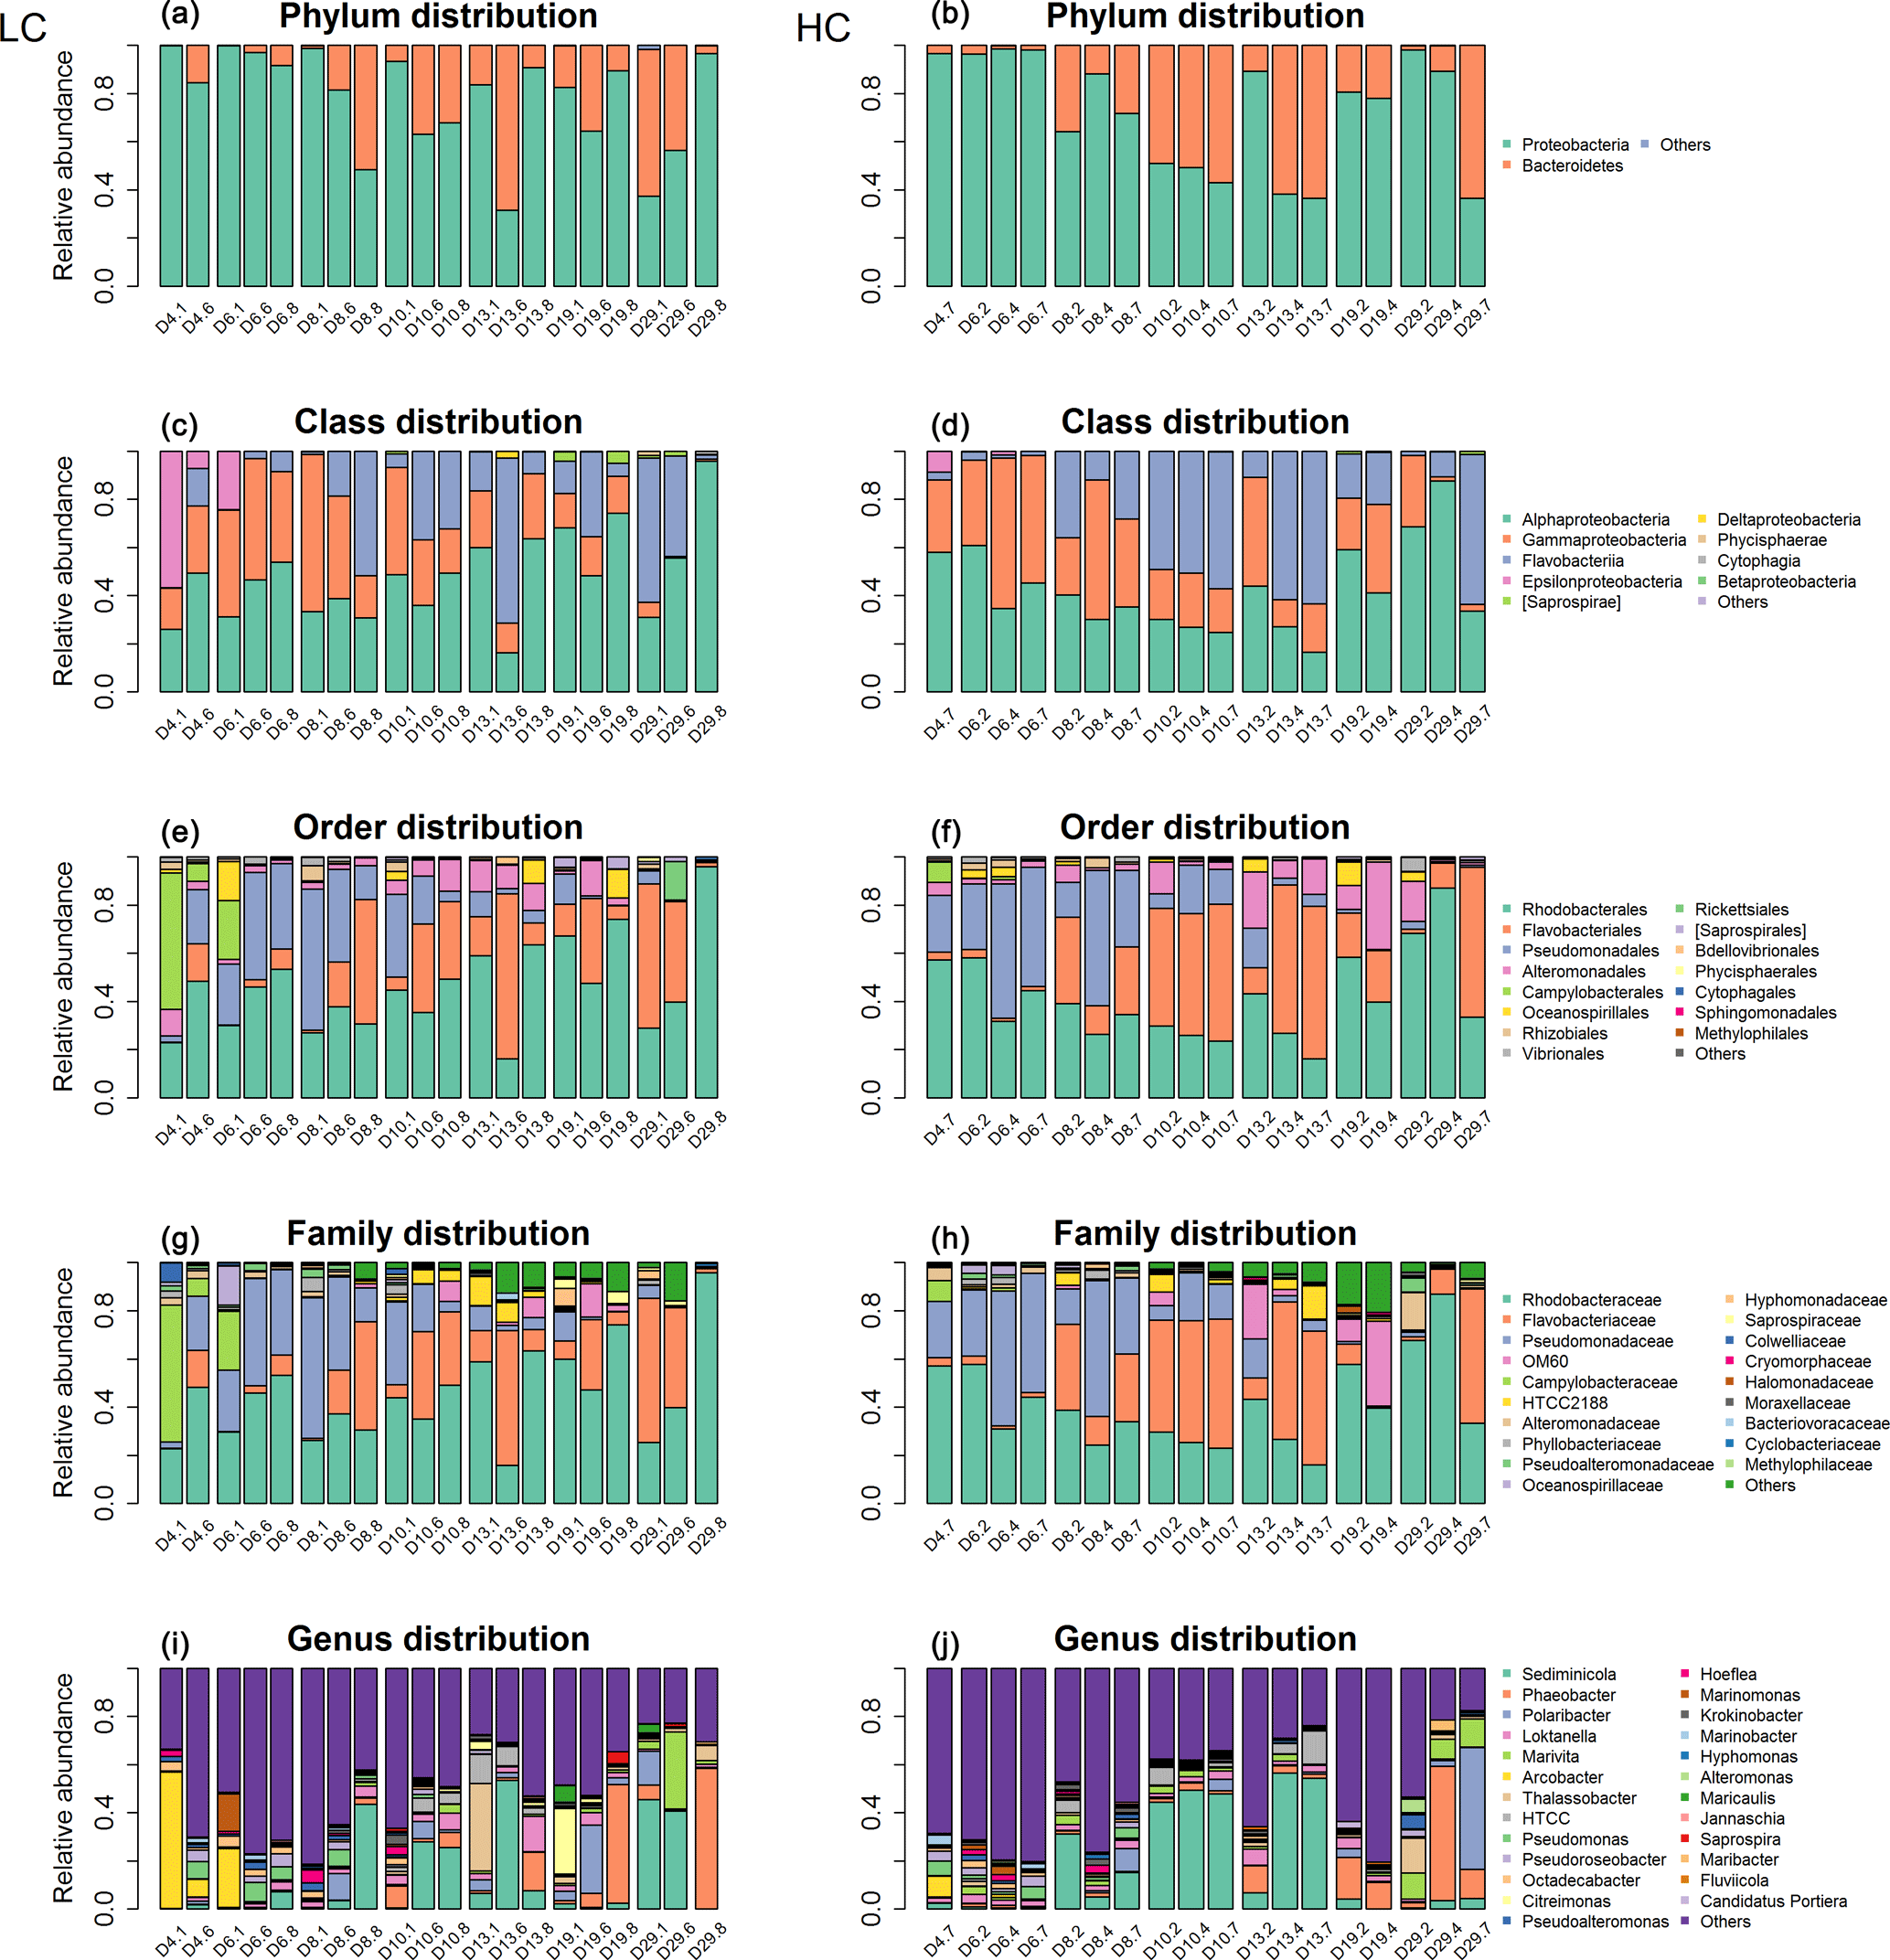
Figure 2Bacterioplankton community structure overview at different taxonomic levels during days 4, 6, 8, 10, 13, 19 and 29 (#1, #6, #8) under LC and HC (#2, #4, #7). The x axis represents sample name (for example, D4.1 refers to bacterioplankton in mesocosm bag 1 collected at day 4) and the y axis represents the relative abundance of different groups of bacterioplankton.
3.3 Bacterioplankton community structure throughout the phytoplankton bloom
The bacterioplankton community structure in the mesocosm bags was very different from that in the originally inoculated phytoplankton cultures by day 4. For instance, some bacterioplankton phyla not detected in the original phytoplankton culture were observed in the samples collected on day 4. This may indicate that the bacterioplankton from the natural environment gradually became dominant in the mesocosm bags from day 0 to day 4. For example, Epsilonproteobacteria appeared in the mesocosms on day 4, while no Epsilonbacteria were detected in the coccolithophore or diatom cultures. Nearly 50 % of the bacterioplankton in the mesocosms were composed of Epsilonbacteria in mesocosm 1 at day 4 (D4.1; Figs. S2, 2).
Bacterioplankton community structure underwent dynamic changes during the diatom bloom in both the HC and LC treatments, varying significantly at different stages of the phytoplankton bloom (Fig. 2). At the phylum level, the bacterioplankton were dominated by Proteobacteria, while the relative abundance of Bacteroidetes was very low when nutrients were replete and diatom biomass was not high. However, Bacteroidetes increased dramatically as diatom biomass increased, and began to drop down after reaching a peak at day 10 (Figs. 2 and 3). In contrast, Proteobacteria began to increase after reaching their lowest concentration at day 10.
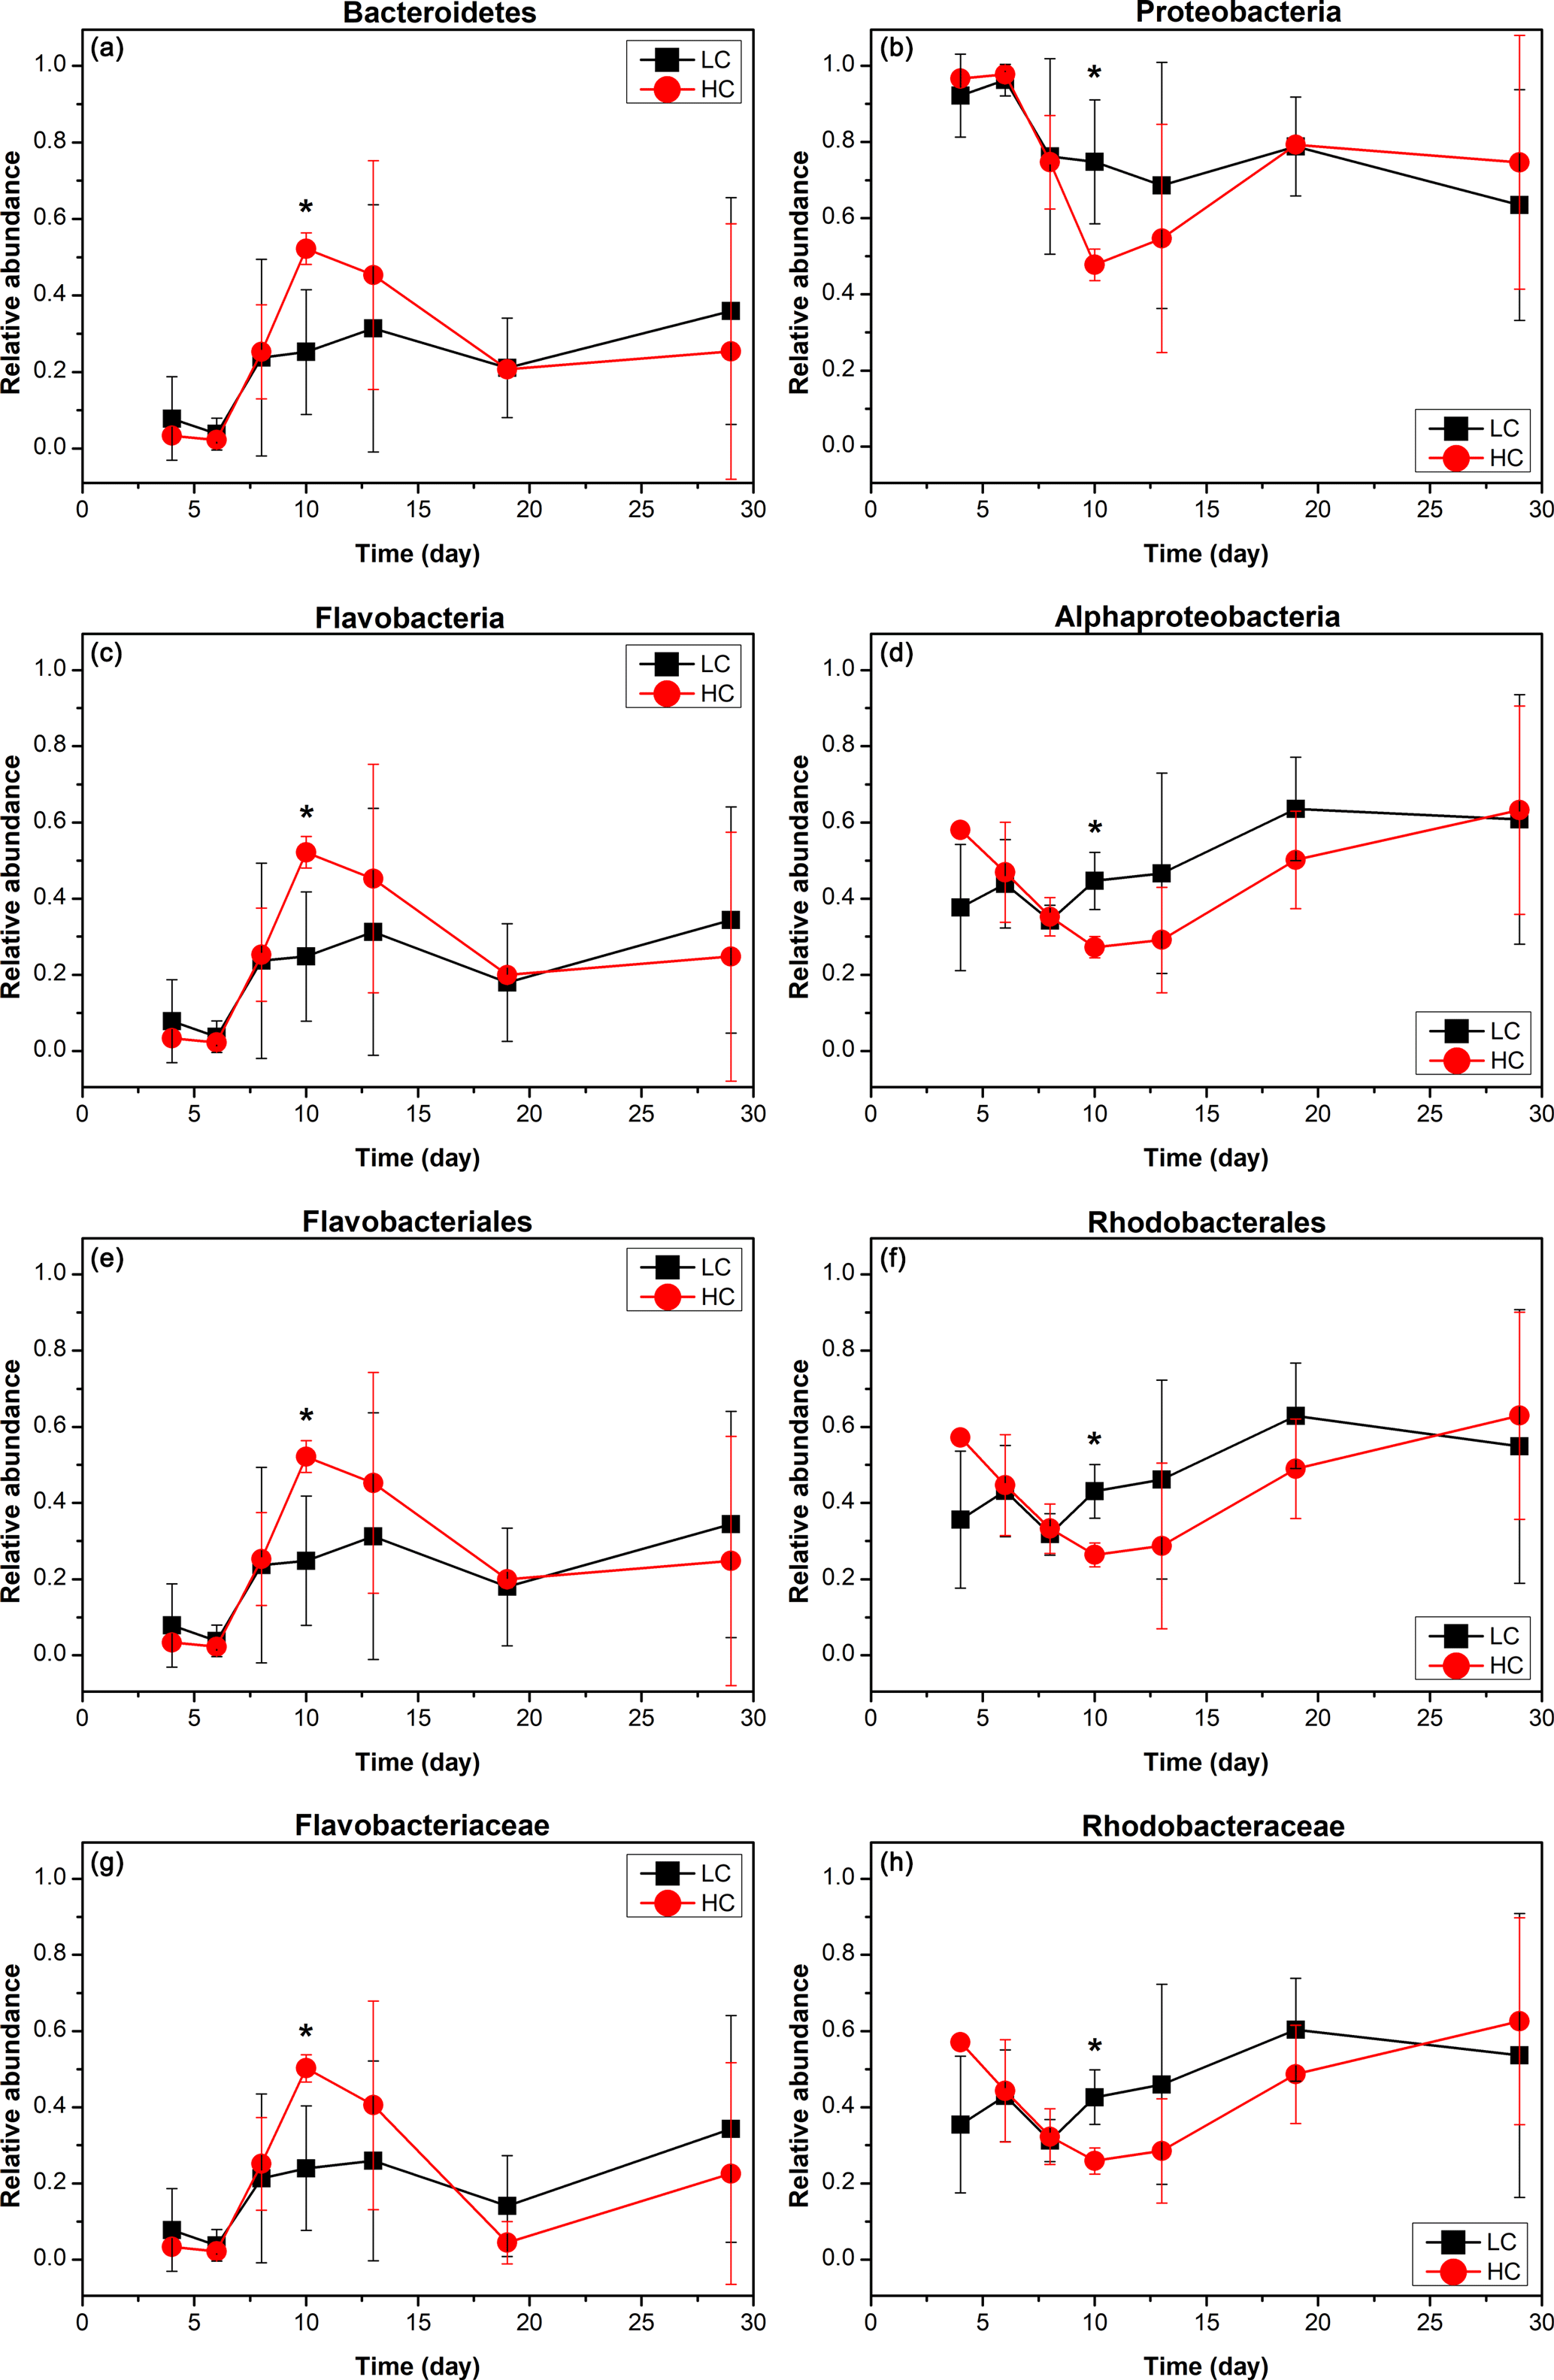
Figure 3The relative abundance over time of primary taxa of the bacterioplankton community; HC in red and LC in black. Bacteroidetes (a) and Proteobacteria (b) are phylum level; Flavobacteria (c) and Alphaproteobacteria (d) are class level; Flavobacteriales (e) and Rhodobacterales (f) are order level; Flavobacteriaceae (g) and Rhodobacteraceae (h) are family level. Data are the means ±SD (n= 3), and the asterisk represents a difference at p < 0.05.
The Alphaproteobacteria, Flavobacteria, and Gammaproteobacteria classes with high abundance in all samples were selected for further analysis. The proportion of the Gammaproteobacteria class from the Proteobacteria phylum was very high at the beginning of the experiment (50.2 ± 13.8 % in the HC treatment and 44.1 ± 6.4 % in the LC treatment at day 6) and decreased throughout the duration of the experiment. On the other hand, the Alphaproteobacteria class, also from the Proteobacteria phylum, decreased from initially high proportions (46.9 ± 13.2 % in the HC treatment and 43.9 ± 11.6 % in the LC treatment) at day 6 to low proportions at day 10 (27.2 ± 2.8 %) in the HC treatment, but remained almost unchanged (44.6 ± 7.5 %) in the LC treatment and increased to 63.2 ± 27.3 % in the HC treatment and 60.8 ± 32.7 % in the LC treatment at day 29 (Figs. 2 and 3). The relative abundance of the Flavobacteria class from the Bacteroidetes increased from the beginning and reached a peak at day 10 (52.2 ± 4.2 % in the HC treatment and 24.8 ± 16.9 % in the LC treatment), then dropped down until day 19 (19.9 ± 2.2 % in the HC treatment and 18.0 ± 15.4 % in the LC treatment; Figs. 2 and 3). The proportional variation of the Flavobacteriales order and the Rhodobacterales order showed similar trends with the Flavobacteria class and the Alphaproteobacteria class, respectively, as shown in Figs. 2 and 3.
3.4 The effects of elevated CO2 on bacterioplankton community structure
Bacterial community structures of the HC and LC treatments were compared at different sampling time points (Fig. 2), and a dissimilarity test based on ANOSIM, MRPP and ADONIS methods showed no statistically significant differences (Table 2). PCA also agreed with the dissimilarity test (Fig. S8). The bacterioplankton community diversity in all samples was estimated by observed species, Chao index, Shannon index and Simpson index. Rarefaction curves showed no remarkable differences in community diversity between HC and LC, regardless of the time point (Fig. S6). In general, bacterioplankton community diversity in both HC and LC treatments followed the same trend, in that it peaked at day 10 and declined for the remainder of the experiment (Fig. S7).
Table 2Dissimilarity tests of bacterial communities in the HC and LC treatments at various time points.
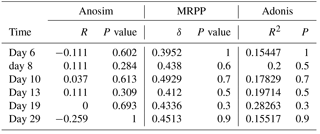
Although the general trend of bacterioplankton community structure variation was similar in both the HC and LC treatments as described above, some groups of bacterioplankton showed different responses to elevated CO2 at some time points. Notably, Bacteroidetes (predominantly Flavobacteria) had a higher average proportion in the HC treatment (52.2 % of Bacteroidetes and 52.2 % of Flavobacteria) than in the LC treatment (25.2 % Bacteroidetes and 24.8 % Flavobacteria) at the early stage of the diatom bloom at day 10 (p= 0.049 and 0.053, respectively). In contrast Proteobacteria, especially the Alphaproteobacteria, were observed to have lower relative abundance in the HC treatment (47.8 % of Proteobacteria and 27.2 % of Alphaproteobacteria) than in the LC treatment (74.8 % of Proteobacteria and 44.6 % of Alphaproteobacteria) at day 10 (p= 0.049 and 0.019, respectively, Fig. 3). At a higher taxonomic level, Flavobacteriales demonstrated higher relative abundance in the HC treatment (52.2 %) compared to the LC treatment (24.8 %) at day 10 (p= 0.053), while for Rhodobacterales the inverse pattern was observed (p= 0.020). Moreover, Flavobacteriaceae had a relatively higher ratio in the HC treatment (50.3 %) compared to the LC treatment (24.0 %) at day 10 (p= 0.053), whereas Rhodobacteraceae demonstrated the opposite pattern (p= 0.021, Fig. 3). It is notable that Alteromonadales, belonging to the Gammaproteobacteria, had a higher ratio in the HC treatment compared to the LC treatment at day 19 and day 29, although this was not statistically significant (p= 0.24 and 0.34 at day 19 and 29, respectively).
3.5 The effects of elevated CO2 on bacterioplankton community interactions
Both HC and LC networks were dominated by Alphaproteobacteria, Gammaproteobacteria and Flavobacteria, suggesting their vital roles in maintaining the stability of microbial ecosystems under both HC and LC conditions. The observation of more negative links compared to positive links indicates the dominant relationship among bacterioplankton is competitive rather than mutualistic under both the HC and LC treatments. The average connectivity and clustering coefficients of the network were higher in the HC treatment than in the LC treatment, while geodesic distance and modularity values were higher in the LC treatment. Bacterioplankton formed more modules under the LC treatment but were densely connected in less modules under the HC treatment (Table 1, Fig. 4). However, as shown in Fig. 4, the links among the OTUs with high abundance – 558 885 (Rhodobacteraceae), 572 670 (Rhodobacteraceae), 190 052 (Flavobacteriaceae), 107 130 (Flavobacteriaceae) and 4 331 023 (Rhodobacteraceae) – were positive in both HC and LC.
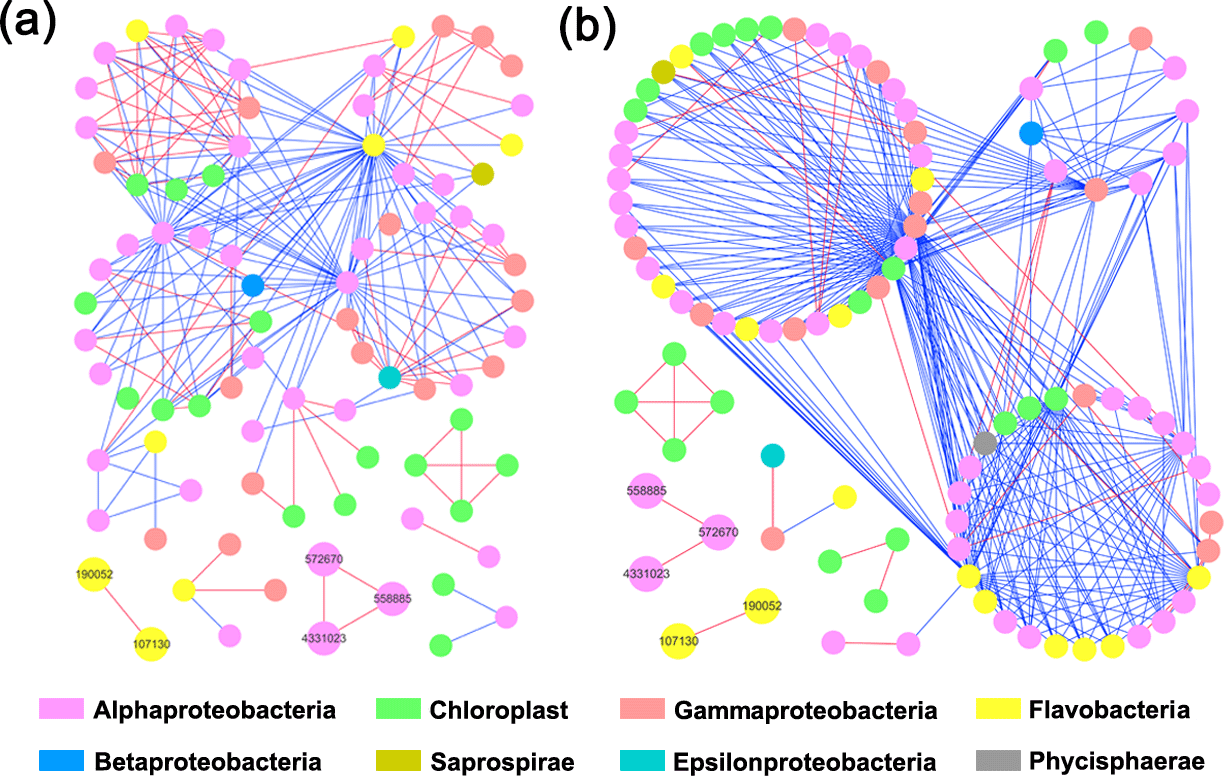
Figure 4Bacterioplankton network interactions under LC (a) and HC (b) conditions. Each node represents an OTU. Node colors denote different taxa. Each line connects two OTUs. A blue line indicates a negative interaction between nodes, suggesting predation or competition, while a red line indicates a positive interaction suggesting mutualism or cooperation. Important OTUs are marked with OTU identification numbers.
Interestingly, some nodes that were sparsely distributed in independent modules in the LC network formed dense modules with high connectivity in the HC network (Fig. 4). As the OTUs connected within a module, they could be considered as a putative bacterioplankton ecological niche (Zhou et al., 2010). It is plausible that elevated CO2 disrupted the connection between different bacterioplankton community niches, but enhanced alternative connections among species within certain ecological niches. Within module connectivity (Zi) and among-module connectivity (Pi) indexes were used to identify key module members (Olesen et al., 1999, Fig. 5). In an ecological context, the peripherals may represent specialists, while module hubs and connectors may be considered more as intra-module and inter-module generalists, respectively. Network hubs are usually considered as super-generalists (Deng et al., 2012). It is interesting that the numbers of connectors that are considered as generalists were reduced, whereas module hubs were increased under the HC treatment. However, two network hubs, the super-generalists that are more important than module hubs and connecters, were detected in the LC network but not in the HC network (Fig. 5).
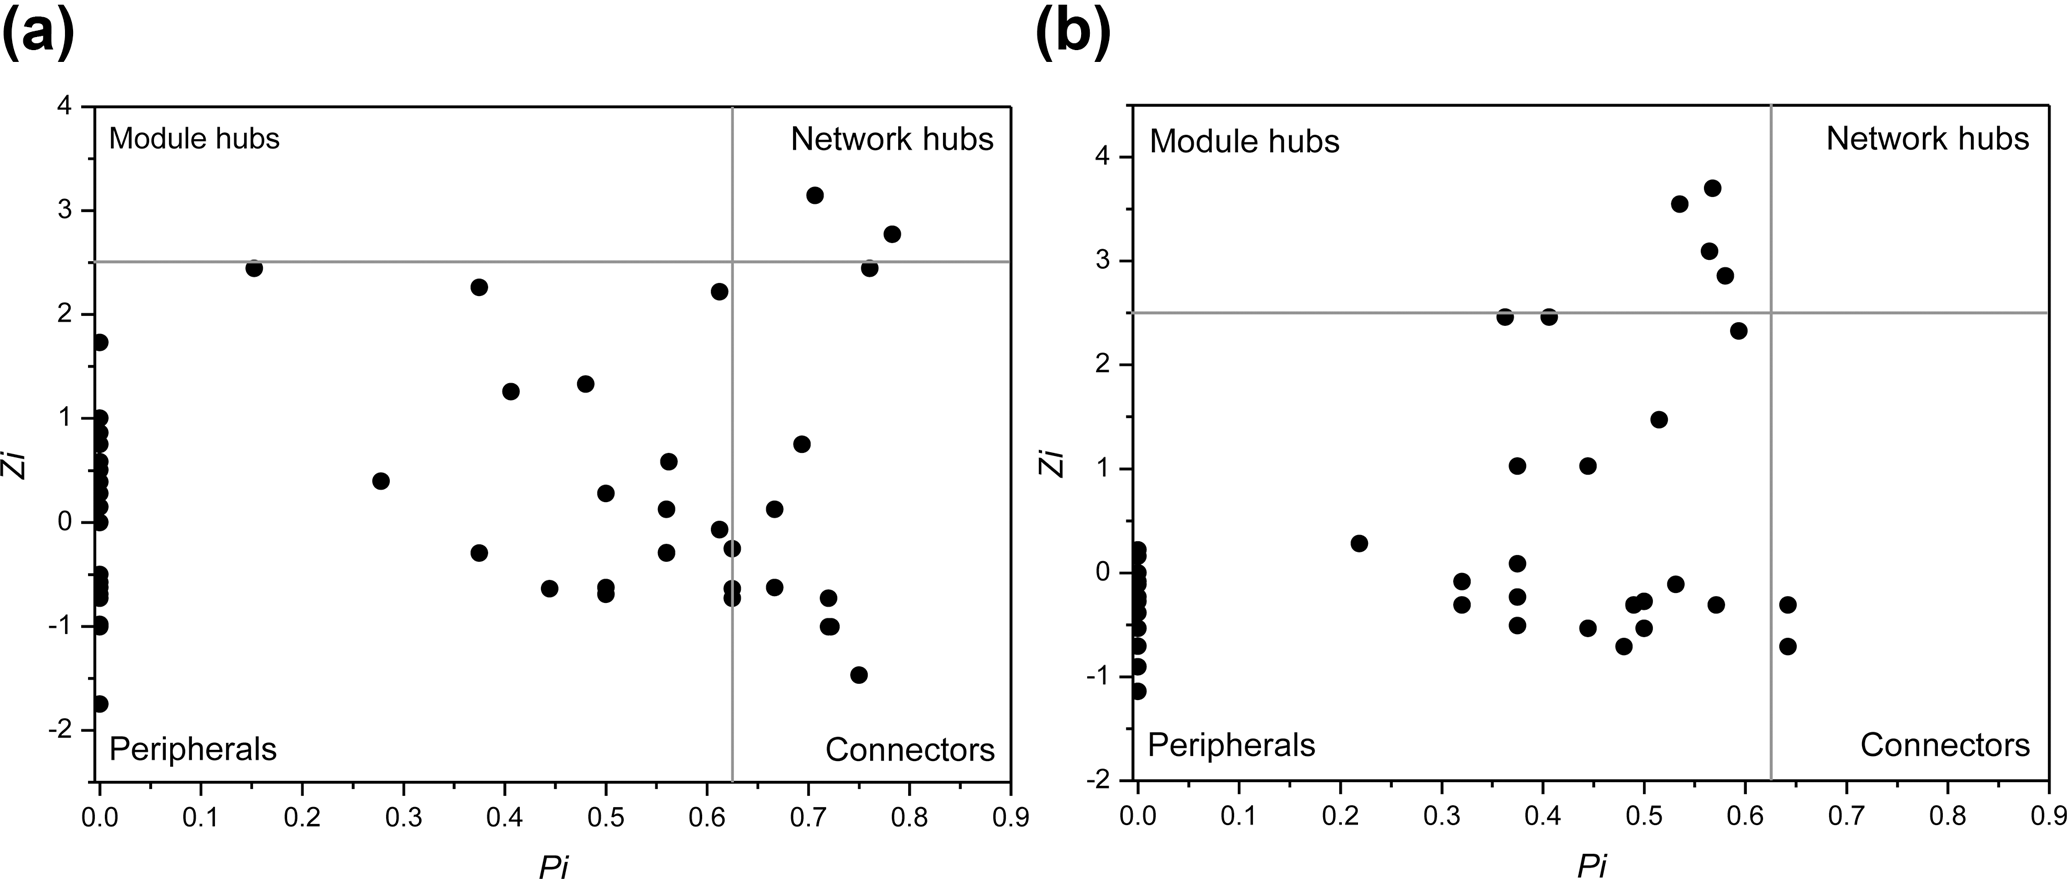
Figure 5Sub-modules in ecological network analysis under LC (a) and HC (b) conditions. Each dot represents an OTU. The Z−P plot shows OTU distribution based on their module-based topological role according to within-module (Z) and among-module (P) connectivity. The nodes were defined as module hubs with Zi > 2.5 and Pi < 0.625, which were more closely connected within the module, while the connectors with nodes Zi < 2.5 and Pi > 0.625 were more closely connected to nodes in other modules. Network hubs are super-generalist with a Zi > 2.5 and Pi > 0.625. The other nodes were considered peripheral.
This study was designed to bridge the gap between lab cultures and field studies, with isolates of non-axenic phytoplankton being added to filtered natural waters. The lab conditions could possibly have selected for a fast-growing bacterial community adapted to live with semi-continuous phytoplankton cultures. Therefore, the inoculated bacterioplankton were likely preconditioned to lab conditions in semi-continuous phytoplankton cultures prior to the experiment. However, the bacterioplankton from the natural environment gradually became dominant in the mesocosm bags from day 0 to day 4, based on the comparison of the community at day 4 and the original community in the phytoplankton cultures. For instance, during these 4 days members of the Arcobacter genus (OTU 553 961) and Pseudomonadaceae family (OTU 543 958) were introduced from surrounding seawater into the mesocosm bags. The average marine bacterial growth rates, mainly in oligotrophic seawaters, have been reported to be 1.1 day−1 ± 0.83 (Kirchman, 2016). However, the bacterial growth rates under eutrophic conditions are much higher than under oligotrophic conditions, and it has been reported to be on the order of per hour (White et al., 1991). The bacterial growth rate reached 16.2 day−1 (0.675 h−1) during a diatom bloom in a mesocosm experiment using seawater from Santa Barbara Channel amended with nutrients (Smith et al., 1995). Under simulated eutrophic conditions, the growth rates of bacteria from the Mediterranean Sea ranged from 0.245 to 0.853 h−1 based on the data measured roughly every 24 h in batch mesocosms (Philippe et al., 1999). Assuming the daily bacterioplankton introduction from outside was less than 0.1 % of the standing stocks (the average bacterioplankton biomass on day 2, 6.693 × 10⁹ cells mL−1), the minimum bacterial growth rate can be calculated. The calculated minimum bacterial growth rate was 0.14 h−1, which is reasonable in comparison to observed bacterial growth rates in eutrophic and oligotrophic communities. Furthermore, our experiments were conducted in eutrophic coastal seawaters with reduced predatory grazing pressure due to seawater filtration, which could stimulate the net bacterial growth rate. Therefore, the ratio of bacteria being continuously introduced to actual standing stocks in the mesocosms was low, allowing us to detect potential CO2 effects in this mesocosm experiment.
The seawater used in this mesocosm experiment was filtered natural seawater (through 0.01 µm filter) in Wuyuan Bay. Although no bacteria or phytoplankton were detected in the filtered seawater by flow cytometry, high concentrations of DOM (dissolved organic matter) and other nutrients in the seawater could not be filtered out. According to Yan Li et al. (unpublished), the dissolved organic carbon (DOC) concentration was 258.9 µmol L−1 on average at day 2. It was not surprising that bacterioplankton were able to grow very quickly with such high concentrations of DOC. Because the phytoplankton-associated bacterioplankton were presumably adapted to the phytoplankton cultures, they were used to living in the artificial seawater, not the local seawater in Wuyuan Bay. As the local bacterioplankton were presumably well adapted to local conditions (such as high DOC concentration) in Wuyuan Bay, it is perhaps not surprising that they could easily outcompete the phytoplankton culture-derived bacterioplankton. Although bacterioplankton from the phytoplankton cultures were inoculated into the mesocosm system at the beginning of the experiment, they were mostly replaced by the natural bacterioplankton community within several days. Therefore, the natural bacterioplankton, not the original bacterioplankton from the phytoplankton culture, mainly determined the final responses of the community to different CO2 concentrations.
In this mesocosm experiment, significant variation in community structure was observed through the whole diatom bloom process, suggesting that the diatom bloom was a major driver for bacterioplankton community structure dynamics in both the HC and LC treatments. This finding is in line with previous mesocosm experiments and field observations (Allgaier et al., 2008; Teeling et al., 2012). Along with the phytoplankton bloom process, the inter-replicate variation of the bacterioplankton community became more apparent, which was inevitable for an outdoor mesocosm experiment. For example, the bacterioplankton community in mesocosm bag 8 was dominated by Phaeobacter sp. at day 29, which was distinct from the other mesocosm bags. According to the phytoplankton data mesocosm bag 8 was probably contaminated with dinoflagellates at a late stage of the algal bloom, likely resulting in a different bacterioplankton community structure compared to the others. Other than these two compromised divergent replicates, in general no statistically significant differences were detected in this study, probably due to high variability among replicates. At day 10 the inter-replicate variability in the relative abundance of some groups of bacterioplankton was relatively low, especially for the HC treatment. Indeed, statistically significant differences between the HC and LC treatments in the abundances of certain groups of bacterioplankton were detected at day 10. Therefore, only when the variability among replicates was smaller than the variability between different treatments could significant differences between treatments be detected.
Although effects of elevated CO2 on bacterioplankton communities have been reported (Allgaier et al., 2008; Tanaka et al., 2008; Wang et al., 2016; Zhang et al., 2013; Ray et al., 2012; Roy et al., 2013; Baltar et al., 2015; reviewed in Hutchins and Fu, 2017), how marine bacteria communities react to the occurrence of elevated CO2 in eutrophic seawater is still uncertain. This mesocosm study comprehensively investigated the effects of elevated CO2 on bacterioplankton community structure and networks using Illumina sequencing and ecological network analysis in the context of eutrophication. Compared to the effects of the phytoplankton bloom, ocean acidification did not strongly influence the bacterioplankton community structure. The results indicate that bacterial abundance and community structure at different taxonomic levels were generally similar between the HC and LC treatments at the different diatom bloom stages, in line with many previous ocean acidification mesocosm bacterioplankton community studies (Tanaka et al., 2008; Wang et al., 2016; Zhang et al., 2013; Ray et al., 2012, 2013; Baltar et al., 2015). Differences in bacterioplankton community diversity between the HC and LC treatments were also not remarkable. These results suggest the possibility that the whole bacterioplankton community has a certain degree of resilience to elevated CO2, which is consistent with a previous stated hypothesis (Joint et al., 2011).
It has previously been proposed that the observed insignificant effects of ocean acidification on coastal bacterioplankton may be due to their adaptation to strong natural variability in pH in coastal ecosystems, where amplitudes of > 0.3 units from diel fluctuations and seasonal dynamics are commonly seen (Hofmann et al., 2011). The comparative ecological network analysis in this study to some extent explains the resilience of the bacterioplankton community to elevated CO2 levels. According to the present study, substantial numbers of OTUs that were sparsely distributed in different and small modules in the LC network became connected with each other and formed fewer modules in the HC network, implying elevated CO2 has the potential to reassemble the bacterioplankton community (Fig. 4). The positive relationships among these principal components were almost unaltered in the network analysis, suggesting that the positive relationships among them were robust in the face of CO2 changes, thus contributing to whole community stability (Fig. 4). It has also been reported that sparsely distributed fungal species were reassembled into highly connected dense modules under long-term elevated CO2 conditions (Tu et al., 2015).
It is noteworthy that the OTUs involved in possible community reassembly were not very abundant, whereas the relationship between the abundant OTUs was virtually unaltered by elevated CO2 in this study. Although elevated CO2 promoted the reassembly of the bacterioplankton community, the network constructed by abundant OTUs which are usually considered as the foundation of the whole bacterioplankton community was still stable in response to elevated CO2. This to some extent led to maintenance of bacterioplankton community structure under the ocean acidification stimuli in the context of eutrophic conditions. Additionally, these data indicate that more negative than positive relationships between OTUs were observed in both HC and LC treatments, which is consistent with a previous ocean acidification mesocosm study conducted in the Arctic Ocean (Wang et al., 2016). It was proposed that a community with more competitors would be more stable and yield less variation under environmental fluctuations (Gonzalez and Loreau, 2009). Therefore, it could be speculated that the dominant competitive relationship between bacterioplankton species in this mesocosm experiment helped the whole bacterioplankton community to adapt to pH perturbations, with less variation in total biomass and diversity.
Although the effects of elevated CO2 on bacterioplankton community structure were not significant, the proportion of some groups of bacterioplankton varied between the HC and LC treatments in the early stages of the diatom bloom. Elevated CO2 significantly increased the proportion of Flavobacteria (dominated by Flavobacteriales) in the HC treatment at day 10, when the diatoms cells began to grow rapidly. In contrast, the HC treatment had negative effects on the growth of Alphaproteobacteria compared to the LC treatment. The results reported here are in line with previous reports about the response of Flavobacteria to ocean acidification in biofilm and single species experiments (Witt et al., 2011; Teira et al., 2012). Flavobacteria are considered as the “first responders” to phytoplankton blooms, because they specialize in attacking algal cells and further degrading biopolymers and organic matter derived from algal detrital particles (Kirchman, 2002; Teeling et al., 2012). Flavobacteria are especially good at converting high-molecular-weight (HMW) DOM to low-molecular-weight (LMW) DOM using the highly efficient, extracellular, multi-protein complex TonB-dependent transporter (TBDT) system, based on previous in situ proteomics and metatranscriptomics data (Teeling et al., 2012). Higher abundance of Flavobacteria under elevated CO2 means more HMW DOM could be degraded and so enter into the carbon cycle (Buchan et al., 2014). Based on the results reported here, it can be speculated that increased amounts of Flavobacteria under the elevated CO2 treatment in eutrophic seawater could promote the TBDT system to break down HMW DOM and lead to improved efficiency of the microbial carbon pump (MCP), and possibly further influence carbon storage in the ocean (Jiao et al., 2010). It has also been postulated that the Flavobacteria-originated, light-driven proton pump proteorhodopsin could be involved in dealing with ocean acidification and pH perturbation (Fuhrman et al., 2008). Recent metatranscriptomic data further emphasize the role of proteorhodopsin in pH homeostasis in bacterioplankton under elevated CO2 (Bunse et al., 2016; Gómez-Consarnau et al., 2007). The underlying mechanisms underlying the enhanced growth of Flavobacteria under elevated CO2 need further investigation in the future.
Interestingly, Flavobacteria in our study showed higher abundance in the HC treatment in the early phytoplankton bloom stage. However, a negative relationship between CO2 level and relative abundance of Bacteroidetes based on terminal restriction fragment length polymorphism (T-RFLP) method was observed in a mesocosm experiment conducted in the Arctic region with low nutrient levels (Roy et al., 2013). Moreover, the effects of elevated CO2 on bacterioplankton community interaction webs in this study were not observed in previous mesocosm work in the Arctic Ocean (Wang et al., 2016; Roy et al., 2013). The results of the current study showed that the effects of elevated CO2 in the context of eutrophication were different compared to elevated CO2 on bacterioplankton community networks in a mesocosm study carried out in the oligotrophic Arctic Ocean. The seemingly contradictory results highlight the importance of the combined effects of ocean acidification and other environmental factors to interpret and predict the impact of global change on marine life.
In this study, the majority of the particle-attached and algae-attached bacteria were filtered out by sequential filtering. Additionally, the archaea were not included in our data because we used the primers 341F/805R, which do not target archaea. Therefore, the community structure of particle-associated bacteria and all archaea were not investigated in our study. Furthermore, a simplified model phytoplankton community was used in this study, composed of the two diatom species P. tricornutum and T. weissflogii in both LC and HC treatments. It is possible that the similarity of the two bacterial communities in the two treatments was due to the similar composition and quality of DOM produced by these two diatoms. With a more diverse natural phytoplankton community experimental system, perhaps different phytoplankton taxa would have dominated in the HC and LC treatments, leading to different bacterial communities. In future studies, it would also be worthwhile to sample over a diel cycle in order to understand the cyclic variability in pH, and whether this affects short-term changes in bacterioplankton community structure.
Elevated CO2 was not a strong influence on bacterioplankton community structure compared to the diatom bloom process, based on 16S V3-V4 region Illumina sequencing. Ecological network analysis showed that elevated CO2 appeared to reassemble the community network of taxa present with low abundance, but barely altered the network structure of the bacterioplankton taxa present with high abundance. It is this differential sensitivity of common and rare groups to carbonate chemistry changes that may largely explain the resilience of the bacterioplankton community to elevated CO2.
The sequencing data using in this study have been deposited in the NCBI (PRJNA429551).
The supplement related to this article is available online at: https://doi.org/10.5194/bg-15-551-2018-supplement.
KG, XL, and MD conceived and designed the experiments; RH, XL, YW, YL and FL performed the experiments; RH and XL analyzed data; XL wrote the paper; and DH and KG revised the paper. All authors reviewed the manuscript.
The authors declare that they have no conflict of interest.
This article is part of the special issue “The Ocean in a High-CO2 World IV”. It is a result of the 4th International Symposium on the Ocean in a High-CO2 World, Hobart, Australia, 3–6 May 2016.
This study was supported by the National Key Research and Development
Program of China (grant no. 2016YFA0601302), the National Natural Science
Foundation of China (no. 41306096 to Xin Lin, no. 41430967 and no. 41120164007 to Kunshan Gao), the State Oceanic Administration of China
(SOA,GASI-03-01-02-04), the Open Fund of Key Laboratory of Marine Ecology
and Environmental Sciences, Institute of Oceanology, Chinese Academy of
Sciences, and Laboratory of Marine Ecology and Environmental Science,
Qingdao National Laboratory for Marine Science and Technology
(KLMEES201608), the joint project of NSFC and Shandong Province (grant no. U1406403), and the Strategic Priority Research Program of Chinese Academy of
Sciences (grant no. XDA11020302). D. A. Hutchins' contributions were supported by U.S.
NSF OCE 1260490 and 1538525, and his visits to Xiamen were supported by the
“111” project from the Ministry of Education. We thank Xin Liu, Tao Xing, Xiaoni Cai, Nana Liu, Shanying Tong, Xiangqi Yi, Tifeng Wang,
Hangbin Miao, Zhenzhen Li, Dong Yan, Wenyan Zhao and Xianglan Zeng for their kind assistance in operations of the mesocosm experiment.
Edited by: Kai G. Schulz
Reviewed by: two anonymous referees
Allgaier, M., Riebesell, U., Vogt, M., Thyrhaug, R., and Grossart, H.-P.: Coupling of heterotrophic bacteria to phytoplankton bloom development at different pCO2 levels: a mesocosm study, Biogeosciences, 5, 1007–1022, https://doi.org/10.5194/bg-5-1007-2008, 2008.
Anderson, M. J.: A new method for non-parametric multivariate analysis of variance, Austral Ecol., 26, 32–46, https://doi.org/10.1046/j.1442-9993.2001.01070.x, 2001.
Azam, F.: Microbial control of oceanic carbon flux: the plot thickens, Science, 280, 694–696, https://doi.org/10.1126/science.280.5364.694, 1998.
Baltar, F., Palovaara, J., Vila-Costa, M., Salazar, G., Calvo, E., Pelejero, C., Marrasé, C., Gasol, J. M., and Pinhassil, J.: Response of rare, common and abundant bacterioplankton to anthropogenic perturbations in a Mediterranean coastal site, FEMS Microbiol. Ecol., 91, 1–12, https://doi.org/10.1093/femsec/fiv058, 2015.
Buchan, A., LeCleir, G. R., Gulvik, C. A., and González, J. M.: Master recyclers: features and functions of bacteria associated with phytoplankton blooms, Nat. Rev. Microbiol., 12, 686–698, https://doi.org/10.1038/nrmicro3326, 2014.
Bunse, C., Lundin, D., Karlsson, C. M. G., Vila-Costa, M., Palovaara, J., Akram, N., Svensson, L., Holmfeldt, K., González, J. M., Calvo, E., Pelejero, C., Marrasé, C., Dopson, M., Gasol, J. M., and Pinhassi, J.: Response of marine bacterioplankton pH homeostasis gene expression to elevated CO2, Nature Climate Change, 6, 483–487, https://doi.org/10.1038/nclimate2914, 2016.
Busch, D. S., O'Donnell, M. J., Hauri, C., Mach, K. J., Poach, M., Doney, S. C., and Signorini, S. R.: Understanding, characterizing, and communicating responses to ocean acidification: Challenges and uncertainties, Ocenaography, 28, 30–39, https://doi.org/10.5670/oceanog.2015.29, 2015.
Cai, W.-J., Hu, X., Huang, W.-J., Murrell, M. C., Lehrter, J. C., Lohrenz, S. E., Chou, W.-C., Zhai, W., Hollibaugh, J. T., Wang, Y., Zhao, P., Guo, X., Gundersen, K., Dai, M., and Gong, G.-C.: Acidification of subsurface coastal waters enhanced by eutrophication, Nat. Geosci., 4, 766–770, https://doi.org/10.1038/ngeo1297, 2011.
Cao, Z., Dai, M., Zheng, N., Wang, D., Li, Q., Zhai, W., Meng, F., and Gan, J.: Dynamics of the carbonate system in a large continental shelf system under the influence of both a river plume and coastal upwelling, J. Geophys. Res.-Biogeo., 116, 582–593, https://doi.org/10.1029/2010jg001596, 2011.
Caporaso, J. G., Kuczynski, J., Stombaugh, J., Bittinger, K., Bushman, F. D., Costello, E. K., Fierer, N., Peña, A. G., Goodrich, J. K., Gordon, J. I., Huttley, G. A., Kelley, S. T., Knights, D., Koenig, J. E., Ley, R. E., Lozupone, C. A., Mcdonald, D., Muegge, B. D., Pirrung, M., Reeder, J., Sevinsky, J. R., Turnbaugh, P. J., Walters, W. A., Widmann, J., Yatsunenko, T., Zaneveld, J., and Knight, R.: QIIME allows analysis of high- throughput community sequencing data, Nat. Methods, 7, 335–336, https://doi.org/10.1038/NMETH.F.303, 2010a.
Caporaso, J. G., Bittinger, K., Bushman, F. D., Desantis, T. Z., Andersen, G. L., and Knight, R.: PyNAST: A flexible tool for aligning sequences to a template alignment, Bioinformatics, 26, 266–267, https://doi.org/10.1093/bioinformatics/btp636, 2010b.
Clarke, K. R.: Non-parametric multivariate analyses of changes in community, Aust. J. Ecol., 18, 117–143, https://doi.org/10.1111/j.1442-9993.1993.tb00438.x, 1993.
Deng, Y., Jiang, Y.-H., Yang, Y., He, Z., Luo, F., and Zhou, J.: Molecular ecological network analyses, BMC Bioinformatics, 13, 113, https://doi.org/10.1186/1471-2105-13-113, 2012.
Falkowski, P. G., Fenchel, T., and Delong, E. F.: The Microbial Engines That Drive Earth's Biogeochemical Cycles, Science, 320, 1034–1039, https://doi.org/10.1126/science.1153213, 2008.
Francis, C. A., Roberts, K. J., Beman, J. M., Santoro, A. E., and Oakley, B. B.: Ubiquity and diversity of ammonia-oxidizing archaea in water columns and sediments of the ocean, P. Natl. Acad. Sci. USA, 102, 14683–14688, https://doi.org/10.1073/pnas.0506625102, 2005.
Fuhrman, J. A., Schwalbach, M. S., and Stingl, U.: Proteorhodopsins: an array of physiological roles?, Nat. Rev. Microbiol., 6, 488–494, https://doi.org/10.1038/nrmicro1893, 2008.
Gattuso, J.-P., Magnan, A., Bille, R., Cheung, W. W. L., Howes, E. L., Joos, F., Allemand, D., Bopp, L., Cooley, S. R., Eakin, C. M., Hoegh-Guldberg, O., Kelly, R. P., Portner, H.-O., Rogers, A. D., Baxter, J. M., Laffoley, D., Osborn, D., Rankovic, A., Rochette, J., Sumaila, U. R., Treyer, S., and Turley, C.: Contrasting futures for ocean and society from different anthropogenic CO2 emissions scenarios, Science, 349, aac4722-1–aac4722-10, https://doi.org/10.1126/science.aac4722, 2015.
Gómez-Consarnau, L., González, J. M., Coll-Lladó, M., Gourdon, P., Pascher, T., Neutze, R., Pedrós-Alió, C., and Pinhassi, J.: Light stimulates growth of proteorhodopsin-containing marine Flavobacteria, Nature, 445, 210–213, https://doi.org/10.1038/nature05381, 2007.
Gonzalez, A. and Loreau, M.: The Causes and Consequences of Compensatory Dynamics in Ecological Communities, Annu. Rev. Ecol. Evol. Syst., 40, 393–414, https://doi.org/10.1146/annurev.ecolsys.39.110707.173349, 2009.
Guidi, L., Chaffron, S., Bittner, L., Eveillard, D., Larhlimi, A., Roux, S., Darzi, Y., Audic, S., Berline, L., Brum, J., Coelho, L. P., Espinoza, J. C. I., Malviya, S., Sunagawa, S., Dimier, C., Kandels-Lewis, S., Picheral, M., Poulain, J., Searson, S., Coordinators, T. O., Stemmann, L., Not, F., Hingamp, P., Speich, S., Follows, M., Karp-Boss, L., Boss, E., Ogata, H., Pesant, S., Weissenbach, J., Wincker, P., Acinas, S. G., Bork, P., de Vargas, C., Iudicone, D., Sullivan, M. B., Raes, J., Karsenti, E., Bowler, C., and Gorsky, G.: Plankton networks driving carbon export in the oligotrophic ocean, Nature, 532, 465–470, https://doi.org/10.1038/nature16942, 2016.
Hofmann, G. E., Smith, J. E., Johnson, K. S., Send, U., Levin, L. A., Micheli, F., Paytan, A., Price, N. N., Peterson, B., Takeshita, Y., Matson, P. G., Crook, E. D., Kroeker, K. J., Gambi, M. C., Rivest, E. B., Frieder, C. A., Yu, P. C., and Martz, T. R.: High-Frequency Dynamics of Ocean pH: A Multi-Ecosystem Comparison, PLoS One, 6, e28983, https://doi.org/10.1371/journal.pone.0028983, 2011.
Hutchins, D. A. and Fu, F.: Microorganisms and ocean global change, Nat. Microbiol., 2, 17058, https://doi.org/10.1038/nmicrobiol.2017.58, 2017.
Jiao, N., Herndl, G. J., Hansell, D. A., Benner, R., Kattner, G., Wilhelm, S. W., Kirchman, D. L., Weinbauer, M. G., Luo, T., Chen, F., and Azam, F.: Microbial production of recalcitrant dissolved organic matter: long-term carbon storage in the global ocean, Nat. Rev. Microbiol., 8, 593–599, https://doi.org/10.1038/nrmicro2386, 2010.
Jin, P., Wang, T., Liu, N., Dupont, S., Beardall, J., Boyd, P. W., Riebesell, U., and Gao, K.: Ocean acidification increases the accumulation of toxic phenolic compounds across trophic levels, Nat. Commun., 6, 8714, https://doi.org/10.1038/ncomms9714, 2015.
Joint, I., Doney, S. C., and Karl, D. M.: Will ocean acidification affect marine microbes?, ISME J., 5, 1–7, https://doi.org/10.1038/ismej.2010.79, 2011.
Kirchman, D. L.: The ecology of Cytophaga-Flavobacteria in aquatic environments, FEMS Microbiol. Ecol., 39, 91–100, https://doi.org/10.1016/S0168-6496(01)00206-9, 2002.
Kirchman, D. L.: Growth Rates of Microbes in the Oceans, Annu. Rev. Mar. Sci., 8, 285–309, https://doi.org/10.1146/annurev-marine-122414-033938, 2016.
Krause, E., Wichels, A., Giménez, L., Lunau, M., Schilhabel, M. B., and Gerdts, G.: Small Changes in pH Have Direct Effects on Marine Bacterial Community Composition: A Microcosm Approach, PLoS One, 7, e47035, https://doi.org/10.1371/journal.pone.0047035, 2012.
Labare, M. P., Bays, J. T., Butkus, M. A., Snyder-Leiby, T., Smith, A., Goldstein, A., Schwartz, J. D., Wilson, K. C., Ginter, M. R., Bare, E. A., Watts, R. E., Michealson, E., Miller, N., and LaBranche, R.: The effects of elevated carbon dioxide levels on a Vibrio sp. isolated from the deep-sea, Environ. Sci. Pollut. Res., 17, 1009–1015, https://doi.org/10.1007/s11356-010-0297-z, 2010.
Langille, M., Zaneveld, J., Caporaso, J. G., McDonald, D., Knights, D., Reyes, J., Clemente, J., Burkepile, D., Vega Thurber, R., Knight, R., Beiko, R., and Huttenhower, C.: Predictive functional profiling of microbial communities using 16S rRNA marker gene sequences, Nat. Biotechnol., 31, 814–821, https://doi.org/10.1038/nbt.2676, 2013.
Lidbury, I., Johnson, V., Hall-spencer, J. M., Munn, C. B., and Cunliffe, M.: Community-level response of coastal microbial biofilms to ocean acidification in a natural carbon dioxide vent ecosystem, Mar. Pollut. Bull., 64, 1063–1066, https://doi.org/10.1016/j.marpolbul.2012.02.011, 2012.
Lima-Mendez, G., Faust, K., Henry, N., Decelle, J., Colin, S., Carcillo, F., Chaffron, S., Ignacio-Espinosa, J. C., Roux, S., Vincent, F., Bittner, L., Darzi, Y., Wang, J., Audic, S., Berline, L., Bontempi, G., Cabello, A. M., Coppola, L., Cornejo-Castillo, F. M., D'Ovidio, F., De Meester, L., Ferrera, I., Garet-Delmas, M.-J., Guidi, L., Lara, E., Pesant, S., Royo-Llonch, M., Salazar, G., Sanchez, P., Sebastian, M., Souffreau, C., Dimier, C., Picheral, M., Searson, S., Kandels-Lewis, S., Gorsky, G., Not, F., Ogata, H., Speich, S., Stemmann, L., Weissenbach, J., Wincker, P., Acinas, S. G., Sunagawa, S., Bork, P., Sullivan, M. B., Karsenti, E., Bowler, C., de Vargas, C., and Raes, J.: Determinants of community structure in the global plankton interactome, Science, 348, 1262073–1262073, https://doi.org/10.1126/science.1262073, 2015.
Liu, J., Weinbauer, M., Maier, C., Dai, M., and Gattuso, J.: Effect of ocean acidification on microbial diversity and on microbe-driven biogeochemistry and ecosystem functioning, Aquat. Microb. Ecol., 61, 291–305, https://doi.org/10.3354/ame01446, 2010.
Liu, N., Tong, S., Yi, X., Li, Y., Li, Z., Miao, H., Wang, T., Li, F., Yan, D., Huang, R., Wu, Y., Hutchins, D. A., Beardall, J., Dai, M., and Gao, K.: Carbon assimilation and losses during an ocean acidification mesocosm experiment, with special reference to algal blooms, Mar. Environ. Res., 129, 229–235, https://doi.org/10.1016/j.marenvres.2017.05.003, 2017.
McDonald, D., Price, M. N., Goodrich, J., Nawrocki, E. P., DeSantis, T. Z., Probst, A., Andersen, G. L., Knight, R., and Hugenholtz, P.: An improved Greengenes taxonomy with explicit ranks for ecological and evolutionary analyses of bacteria and archaea, ISME J., 6, 610–618, https://doi.org/10.1038/ismej.2011.139, 2012.
Meron, D., Atias, E., Iasur Kruh, L., Elifantz, H., Minz, D., Fine, M., and Banin, E.: The impact of reduced pH on the microbial community of the coral Acropora eurystoma, ISME J., 5, 51–60, https://doi.org/10.1038/ismej.2010.102, 2011.
Mielke, P. W., Berry, K. J., Brockwell, P. J., and Williams, J. S.: A class of nonparametric tests based on multiresponse permutation procedures, Biometrika, 68, 720–724, 1981.
Olesen, J. M., Bascompte, J., Dupont, Y. L., and Jordano, P.: The modularity of pollination networks, P. Natl. Acad. Sci. USA, 104, 19891–19896, https://doi.org/10.1073/pnas.0706375104, 2007.
Philippe L., Pierre S., Marc T., Claude C., Josep V., Gerard M., Laetitia B., Teresa G., and Hendrik S. E. S.: Changes in bacterial community structure in seawater mesocosm differing in their nutrient status, Aquat. Microb. Ecol., 19, 255–267, https://doi.org/10.3354/ame019255, 1999.
Ramaiah, N., Sarma, V. V. S. S., Gauns, M., Dileep Kumar, M., and Madhupratap, M.: Abundance and relationship of bacteria with transparent exopolymer particles during the 1996 summer monsoon in the Arabian Sea, P. Indian AS-Earth, 109, 443–451, https://doi.org/10.1007/bf02708332, 2000.
Ray, J. L., Töpper, B., An, S., Silyakova, A., Spindelböck, J., Thyrhaug, R., Dubow, M. S., Thingstad, T. F., and Sandaa, R. A.: Effect of increased pCO2 on bacterial assemblage shifts in response to glucose addition in Fram Strait seawater mesocosms, FEMS Microbiol. Ecol., 82, 713–723, https://doi.org/10.1111/j.1574-6941.2012.01443.x, 2012.
Roy, A.-S., Gibbons, S. M., Schunck, H., Owens, S., Caporaso, J. G., Sperling, M., Nissimov, J. I., Romac, S., Bittner, L., Mühling, M., Riebesell, U., LaRoche, J., and Gilbert, J. A.: Ocean acidification shows negligible impacts on high-latitude bacterial community structure in coastal pelagic mesocosms, Biogeosciences, 10, 555–566, https://doi.org/10.5194/bg-10-555-2013, 2013.
Smith, D. C., Steward, G. F., Long, R. A., and Azam, F.: Bacterial mediation of carbon fluxes during a diatom bloom in a mesocosm, Deep-Sea Res. Pt. II, 42, 75–97, https://doi.org/10.1016/0967-0645(95)00005-B, 1995.
Sugimoto, K., Fukuda, H., Baki, M. A., and Koike, I.: Bacterial contributions to formation of transparent exopolymer particles (TEP) and seasonal trends in coastal waters of Sagami Bay, Japan, Aquat. Microb. Ecol., 46, 31–41, https://doi.org/10.3354/ame046031, 2007.
Tanaka, T., Thingstad, T. F., Lødal, T., Grossart, H.-P., Larsen, A., Allgaier, M., Meyerhöfer, M., Schulz, K. G., Wohlers, J., Zöllner, E., and Riebesell, U.: Availability of phosphate for phytoplankton and bacteria and of glucose for bacteria at different pCO2 levels in a mesocosm study, Biogeosciences, 5, 669–678, https://doi.org/10.5194/bg-5-669-2008, 2008.
Teeling, H., Fuchs, B. M., Becher, D., Klockow, C., Gardebrecht, A., Bennke, C. M., Kassabgy, M., Huang, S., Mann, A. J., Waldmann, J., Weber, M., Klindworth, A., Otto, A., Lange, J., Bernhardt, J., Reinsch, C., Hecker, M., Peplies, J., Bockelmann, F. D., Callies, U., Gerdts, G., Wichels, A., Wiltshire, K. H., Glockner, F. O., Schweder, T., and Amann, R.: Substrate-Controlled Succession of Marine Bacterioplankton Populations Induced by a Phytoplankton Bloom, Science, 336, 608–611, https://doi.org/10.1126/science.1218344, 2012.
Teira, E., Fernández, A., Álvarez-Salgado, X. A., García-Martín, E. E., Serret, P., and Sobrino, C.: Response of two marine bacterial isolates to high CO2 concentration, Mar. Ecol.-Prog. Ser., 453, 27–36, https://doi.org/10.3354/meps09644, 2012.
Tu, Q., Yuan, M., He, Z., Deng, Y., Xue, K., Wu, L., Hobbie, S. E., Reich, P. B., and Zhou, J.: Fungal Communities Respond to Long-Term CO2 Elevation by Community Reassembly, Appl. Environ. Microbiol., 81, 2445–2454, https://doi.org/10.1128/AEM.04040-14, 2015.
Wang, Y., Zhang, R., Zheng, Q., Deng, Y., Van Nostrand, J. D., Zhou, J., and Jiao, N.: Bacterioplantkon community resilience to ocean acidification: evidence from microbial network analysis, ICES J. Mar. Sci., 73, 865–875, https://doi.org/10.1093/icesjms/fst176, 2016.
White, P. A., Kalff, J., Rasmussen, J. B., and Gasol, J. M.: The Effect of Temperature and Algal Biomass on Bacterial Production and Specific Growth Rate in Freshwater and Marine, Microb. Ecol., 21, 99–118, 1991.
Witt, V., Wild, C., Anthony, K. R. N., Diaz-Pulido, G., and Uthicke, S.: Effects of ocean acidification on microbial community composition of, and oxygen fluxes through, biofilms from the Great Barrier Reef, Environ. Microbiol., 13, 2976–2989, https://doi.org/10.1111/j.1462-2920.2011.02571.x, 2011.
Zhang, J., Kobert, K., Flouri, T., and Stamatakis, A.: PEAR: a fast and accurate Illumina Paired-End reAd mergeR, Bioinformatics, 30, 614–620, https://doi.org/10.1093/bioinformatics/btt593, 2014.
Zhang, R., Xia, X., Lau, S. C. K., Motegi, C., Weinbauer, M. G., and Jiao, N.: Response of bacterioplankton community structure to an artificial gradient of pCO2 in the Arctic Ocean, Biogeosciences, 10, 3679–3689, https://doi.org/10.5194/bg-10-3679-2013, 2013.
Zhou, J., Deng, Y., Luo, F., He, Z., Tu, Q., and Zhi, X.: Functional molecular ecological networks, MBio, 1, e00169-10, https://doi.org/10.1128/mBio.00169-10, 2010.