the Creative Commons Attribution 4.0 License.
the Creative Commons Attribution 4.0 License.
 | 24 Sep 2018
Controls of terrestrial ecosystem nitrogen loss on simulated productivity responses to elevated CO2
Johannes Meyerholt
Sönke Zaehle
The availability of nitrogen is one of the primary controls on plant growth. Terrestrial ecosystem nitrogen availability is not only determined by inputs from fixation, deposition, or weathering, but is also regulated by the rates with which nitrogen is lost through various pathways. Estimates of large-scale nitrogen loss rates have been associated with considerable uncertainty, as process rates and controlling factors of the different loss pathways have been difficult to characterize in the field. Therefore, the nitrogen loss representations in terrestrial biosphere models vary substantially, adding to nitrogen cycle-related uncertainty and resulting in varying predictions of how the biospheric carbon sink will evolve under future scenarios of elevated atmospheric CO2. Here, we test three commonly applied approaches to represent ecosystem-level nitrogen loss in a common carbon–nitrogen terrestrial biosphere model with respect to their impact on projections of the effect of elevated CO2. We find that despite differences in predicted responses of nitrogen loss rates to elevated CO2 and climate forcing, the variety of nitrogen loss representation between models only leads to small variety in carbon sink predictions. The nitrogen loss responses are particularly uncertain in the boreal and tropical regions, where plant growth is strongly nitrogen-limited or nitrogen turnover rates are usually high, respectively. This highlights the need for better representation of nitrogen loss fluxes through global measurements to inform models.
- Article
(1643 KB) - Full-text XML
- BibTeX
- EndNote


Given the negative implications of increasing global atmospheric carbon (C) dioxide (CO2) concentrations for global climate, research on the terrestrial biosphere has focused on the future potential of the biosphere to sequester atmospheric CO2 (Bonan, 2008). One important constraint to the terrestrial ecosystem C sequestration potential may be the availability of plant nutrients, primarily nitrogen (N) (Hungate et al., 2003; Thornton et al., 2007; Gruber and Galloway, 2008; Zaehle et al., 2010a; Fernández-Martinez et al., 2014).
Natural terrestrial ecosystems are subject to N inputs from the atmosphere through deposition of reactive N species (formed by lightning, biomass burning, or fossil-fuel combustion), as well as through biological N fixation (BNF) or rock weathering. Inorganic soil N is taken up by plants, eventually returned as organic litter, and is incorporated into the soil organic matter or becomes mineralized, meaning that microbial activity converts organic N back to inorganic plant nutrients, namely ammonium (), which can then be converted to nitrate () during nitrification, and both can be taken up by plants again. This loop of plant N uptake from the soil and mineralization of organic N can be regarded as the internal N cycle. However, soil N may also be lost from the ecosystem through gaseous and leaching loss processes. Thereby, the loop of N entering ecosystems from the atmosphere or rocks and leaving them through loss processes and eventually ending up back in the atmosphere can be regarded as the external N cycle.
Numerous studies have demonstrated the effects of including N cycle dynamics when using terrestrial biosphere models (TBMs) to examine terrestrial C cycle responses to elevated atmospheric CO2 concentrations (eCO2) and climate change (Thornton et al., 2007; Sokolov et al., 2008; Zaehle et al., 2010a; Goll et al., 2012; Wania et al., 2012; Smith et al., 2014). Additional plant C assimilation under increased atmospheric CO2 concentrations may be limited by N availability (Zaehle et al., 2010a). Increased global temperatures may not only increase ecosystem respiration and load the atmosphere with more CO2, but also stimulate N mineralization and provide more N to support plant C assimilation (Sokolov et al., 2008; Thornton et al., 2009).
The magnitude of N effects on model predictions varies between studies, in part due to differences in how N cycle processes are formulated and included in the models (Zaehle and Dalmonech, 2011). Consequently, TBMs vary in their ability to reproduce the results of eCO2 field experiments (Zaehle et al., 2014; Walker et al., 2015). To gain understanding of the mechanics underlying this uncertainty, new studies have emerged that assess the influence of variety in the representation of individual N cycle processes in model perturbation experiments (Meyerholt and Zaehle, 2015; Wieder et al., 2015; Meyerholt et al., 2016). However, a similar comparative study of N loss representation in TBMs is still lacking, although differences in N loss representation have been suspected in the past as a driving factor of model divergence in response to perturbation when different TBMs were compared (Thomas et al., 2013, 2015; Zaehle et al., 2014; Walker et al., 2015).
In nature, the pathways for gaseous N loss from ecosystems are manifold (Firestone and Davidson, 1989). The aerobic process of nitrification is the oxidation of to nitrite () and then to . It is associated with the emission of nitric oxide (NO) and nitrous oxide (N2O) during the reduction of when oxygen is limiting (Li et al., 2000). Denitrification is carried out by denitrifying soil bacteria that are able to sequentially reduce oxidized forms of N ( (N2)) in the presence of organic matter to produce molecular N2 that is emitted to the atmosphere. Anaerobic conditions are a prerequisite, as oxygen depletion causes oxidized N to act as a substitute electron acceptor to denitrifying bacteria. In the process of denitrification, NO and N2O may also be emitted, which makes this mechanism particularly climate-relevant. Denitrification is considered the most important terrestrial N loss flux with 110 Tg N yr−1 estimated for the year 2000 (Bouwman et al., 2013). Volatilization of ammonia (NH3) is of special importance in agriculture and may take place when N added from manure or fertilizers cannot react to form in the soil due to alkaline conditions or high soil temperatures and is lost to the atmosphere in its gaseous form (Freney et al., 1983).
As for the mechanisms of leaching N loss, ions are readily adsorbed to soil particles, especially in clay soils, leading to the possible leaching of bound in this manner (Kowalenko and Cameron, 1976; Matschonat and Matzner, 1996). Therefore, a large part of leaching will occur in the clay-fixed phase rather than the liquid phase. In contrast to , in soils is prone to leaching losses due to its negative charge and low sorption to soil particles. In scenarios of high precipitation or irrigation and high concentrations, can be lost to groundwater through vertical transport and thus cause pollution and reduced ecosystem productivity (Di and Cameron, 2002). This hydrological export of N can also affect dissolved organic N, a flux that has been shown to be of sizable magnitude at some sites (Perakis and Hedin, 2002; Gerber et al., 2010).
Despite such general understanding of the pertinent processes, the reason for the variety of N loss representations in TBMs is the difficulty in properly characterizing N loss fluxes at large spatio-temporal scales in nature, given the strong variability in space and time of the associated trace gas and water fluxes (Boyer et al., 2006). In addition, the relevant fluxes are also very difficult to measure in the field, especially in the abundance needed to constrain global models. Therefore, modellers need to resort to educated guesses on how to represent this poorly constrained ecosystem flux. Model implementations vary between the application of generic loss terms (e.g. Thornton and Rosenbloom, 2005; Wang et al., 2010) and the explicit formulation of the constituting loss fluxes by simulating the environmental conditions that are assumed to influence specific loss processes (nitrification, denitrification, leaching, fire; e.g. Xu-Ri and Prentice, 2008; Huang and Gerber, 2015). In the latter case, explicit treatment of gaseous N loss may even enable detailed estimates of the ecosystem emissions of the greenhouse gas N2O (e.g. Zaehle et al., 2011; Tian et al., 2018). Between these cases of simplified and complex formulations lie a number of TBMs that represent N loss fluxes at “intermediate” complexity (Yang et al., 2009; Goll et al., 2012; Smith et al., 2014). Models also differ with respect to the N cycle component from which the respective loss flux is derived. Some models focus their simulation of gaseous N loss processes on soil N turnover, i.e. N mineralization (Thornton et al., 2007; Wang et al., 2010), while others base their calculations on the size of the soil inorganic N pool (Xu-Ri and Prentice, 2008; Zaehle and Friend, 2010). Some TBMs include leaching of dissolved organic N (DON) directly from the soil organic matter (SOM) N pool (Gerber et al., 2010; Smith et al., 2014). Such heterogeneous representation of ecosystem-level N losses is a particular limitation when attempting to estimate the effect of N limitation on terrestrial C sequestration, both at present and under future scenarios.
The aim of this study was to determine the extent to which variation between different N loss algorithms would influence simulated C sequestration responses to eCO2. We expected that the different paradigms of concentration-based and turnover-based N losses would lead to different predicted N loss magnitudes, especially under N stress. With simulated depletion of the inorganic soil N pool under eCO2, modelled N loss should decrease more strongly when it is concentration-based than when it is turnover-based. Assuming largely N-limited vegetation growth and fixed ecosystem N inputs, such differences in N loss rates could lead to different C sequestration responses, demonstrating that the choice of N loss formulation plays a notable role in shaping the predictions of C–N TBMs in simulated perturbation scenarios.
To examine the impact of different N loss algorithms in a TBM, we added two new alternative N loss modules to the O–CN TBM (Zaehle and Friend, 2010). The original O–CN N loss formulation was in part adopted from Xu-Ri and Prentice (2008) and largely bases gaseous N losses on the concentration of reactive N in the soil compartment. As alternatives, we added two more N loss algorithms that base the largest gaseous N loss flux on the N mineralization flux from soil organic matter to the soil pool of reactive N, inspired by the formulations presented by Thornton and Rosenbloom (2005) and Wang et al. (2010). Thereby, our selection of N loss formulations encompassed the cases of complex and simplified algorithms mentioned above.
As a simple base scenario, we performed eCO2 experiments with these three O–CN versions that only differed in their N loss algorithms at three temperate test sites that only differed in their climate forcing. This was done to examine how model functioning was affected in quasi-equilibrium and under eCO2 regarding the calculated N loss fluxes and the effect on C sequestration, and to illustrate the approximate climate sensitivity of these patterns. Next, we performed long-term simulations at a temperate site to gain insight into the centennial-scale effect of the three loss algorithms on the evolution of ecosystem N limitation under eCO2. We then performed eCO2 simulations on a global grid using the three model versions to examine the effects of N loss variety in different ecosystem types that exhibited inherently different degrees of N limitation and climate regimes.
In Sect. 2.1, we describe the three modular N loss algorithms. In Sect. 2.2, we describe the different eCO2 experiments we performed.
2.1 O–CN terrestrial biosphere model and nitrogen loss formulations
As a TBM framework, we used the O–CN model that was fully described in Zaehle and Friend (2010) and Zaehle et al. (2011). We used the standard O–CN N loss formulation (NL1) and added two more formulations as alternatives (NL2, NL3), based on formulations used in other TBMs (Fig. 1). Here, we describe the three N loss formulations in detail, supplemented by Appendix B in the case of the more complex NL1 formulation. In addition, we provide the O–CN formulation for N uptake in Appendix C.
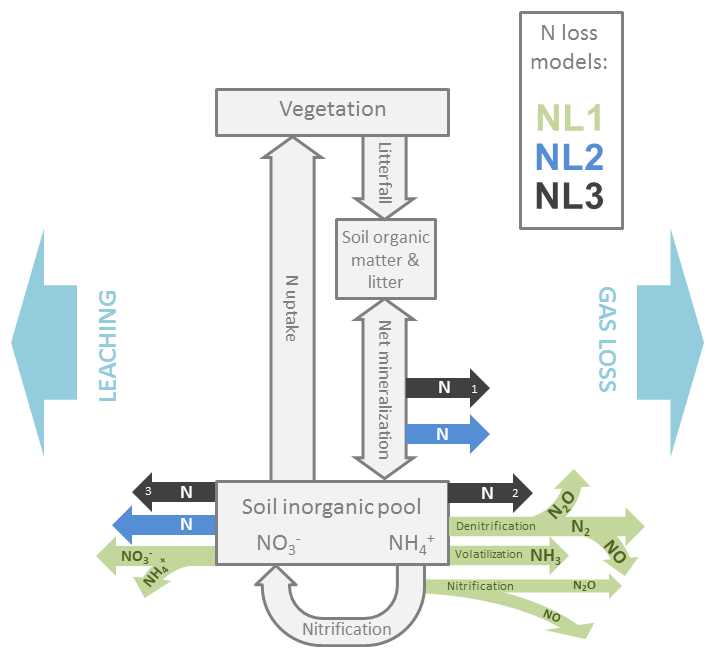
Figure 1Simplified representation of the modelled internal nitrogen (N) cycle and the three employed N loss algorithms. External input fluxes from deposition, biological fixation, and weathering are not shown. Grey boxes and arrows indicate N pools (vegetation, soil organic matter, litter, soil inorganic pools) and fluxes (litterfall, net mineralization, nitrification, uptake). Coloured arrows indicate N loss fluxes as they are calculated from different pool sizes and flux magnitudes according to the three algorithms NL1, NL2, and NL3. Numbers in the black arrows indicate the sequential nature of the NL3 approach. N: generic nitrogen species; N2: dinitrogen; NO: nitric oxide; N2O: nitrous oxide; NH3: ammonia; : nitrate; : ammonium. Arrow orientation to the left/right indicates leaching/gaseous loss.
2.1.1 NL1
The original O–CN representation of ecosystem N loss (Zaehle et al., 2011) follows the representation in the Lund-Potsdam-Jena-Dynamic-Nitrogen (LPJ-DyN) TBM (Xu-Ri and Prentice, 2008) with additions from the DNDC denitrification and decomposition model (Li et al., 2000). O–CN treats the nitrification and denitrification processes explicitly to determine gaseous losses of NO, NO2, N2O, and N2. In addition, NH3 is subject to volatilization based on soil pH. Leaching of solute and occurs in proportion to the soil water lost by soil drainage. A full description can be found in Appendix B.
The NL1 algorithm determines total ecosystem N loss (NL; Eq. 1) as the sum of gaseous N losses from nitrification (Nnit), denitrification (Ndenit), and volatilization (Nvol), as well as leaching (Nlea):
2.1.2 NL2
The NL2 approach, inspired by Wang et al. (2010), includes N loss fluxes based on soil N turnover and soil inorganic N concentration. A fixed fraction of the instantaneous net N mineralization flux is lost to the atmosphere to represent gaseous N losses associated with microbial soil processes of nitrification and denitrification (NL,gas; Eq. 2). Gaseous N loss only occurs when net N mineralization is positive:
where fgl is the fraction (0.05) of the net N mineralization flux (Nnm) that is lost in gaseous form. To account for leaching losses (NL,lea; Eq. 3), the total soil inorganic N pool (Nmin) is reduced at every time step:
where fll is the fraction (0.5) of the soil inorganic N pool lost to leaching. The total ecosystem N loss per time step (NL; Eq. 4) is then given by the sum of gaseous and leaching losses:
2.1.3 NL3
The N loss formulation NL3, inspired by Thornton and Rosenbloom (2005), describes sequential processes of gaseous loss during net N mineralization, gaseous loss from the soil inorganic N pool, and lastly leaching loss from the remaining soil inorganic N reservoir. Similar to NL2, the net N mineralization flux (Nmn) is accompanied by a fractional denitrification flux (NL,g1; Eq. 5):
where fg1 is the fraction (0.01) of the net N mineralization flux that is lost in gaseous form. Next, excess inorganic N remaining in the soil after immobilization and plant N uptake (Nmin) is subject to further gaseous loss representing volatilization and denitrification (NL,g2; Eq. 6):
where fg2 is the fraction (0.002) of the soil inorganic N pool lost in gaseous form. Any remaining inorganic N in the soil is then subject to fractional leaching loss in constant proportion (NL,l; Eq. 7):
where fl is the fraction (0.1) of soil inorganic N lost to leaching. The total ecosystem N loss per time step (NL; Eq. 8) is then given by the sum of gaseous and leaching losses:
2.2 Forcing and simulation protocol
We conducted three separate sets of eCO2 simulation experiments, two at the local and one at the global scale.
2.2.1 Local simulations I
The first set of local simulations was carried out at a representative temperate forest site (“S0”) at the coordinates 6∘ E, 48∘ N. We included two more sites that were identical to S0, with the exception that we increased air temperatures by 5 K (“ST”) or doubled precipitation (“SP”) relative to the climate forcing at S0, thereby creating an ensemble of three “pseudosites”. This was done to include the effect of climate variation, but without further confounding the results with influences from e.g. different soil and vegetation histories, keeping the effect of the N loss formulation as isolated as possible. For each model version and each pseudosite, the vegetation and soil C and N pools were spun up to equilibrium over 900 simulation years until the year 1700, using 1901–1930 climate forcing from the merged product of the Climate Research Unit observed climatology and the National Centers for Environmental Prediction reanalysis, CRU-NCEP (Viovy, 2016), as used in Le Quéré et al. (2016). Model spin-up used atmospheric CO2 concentrations from the year 1860 (Le Quéré et al., 2016), 1850 N deposition rates according to Lamarque et al. (2010), BNF according to the “FOR” approach described by Meyerholt et al. (2016), and vegetation cover from the SYNMAP product (Jung et al., 2006). To limit the driving factors in this theoretical study, we disregarded crop vegetation and subsequently N fertilizer application, as well as land-use change.
The models were then run on a half-hourly time step for 313 simulation years using the climate forcing described above from 1901 onward, ambient CO2 concentrations (after 1860) and transient N deposition (after 1850) to generate unperturbed control model output. For our eCO2 treatment, we added 200 ppm CO2 to ambient concentrations every year from 1950 onward until the simulations ended after the year 2013.
2.2.2 Local simulations II
The second set of local simulations was carried out only at the temperate S0 site from Sect. 2.2.1, with the following modifications to the first set. Instead of 63 years as above, a different eCO2 experiment was conducted over 300 simulation years. After spin-up, atmospheric CO2 concentrations were kept constant at the 1860 level (286 ppm) between 1700 and 1860. Between 1860 and 2006, atmospheric CO2 increased according to ambient concentrations. Next, the 2006 concentration (380 ppm) was kept constant for the following 300 years to create the experiment control runs. For the treatment runs, atmospheric CO2 was set to 580 ppm between the years 2006 and 2306.
Instead of the recorded climate data, randomly selected climate years for the S0 site were used from the years 1901–1930 throughout all simulations. After the year 2006, atmospheric N deposition rates were kept constant to the 2006 level.

Figure 2Average fate of ecosystem nitrogen (N) input at the three pseudosites “S0”, “ST”, and “SP” for the 1700–1750 quasi-equilibrium simulation period without perturbation (a, e, i; g N m−2 yr−1). Average N loss rate responses (g N m−2 yr−1) to 10 years of simulated elevated atmospheric CO2 (eCO2, +200 ppm) (b, f, j). Net primary productivity (NPP) responses (%) after 10 years of eCO2, relative to control simulations (c, g, k). Change (%) in total ecosystem carbon (C) after 10 years of eCO2, relative to the start of the experiment (d, h, l). Colours indicate the applied N loss algorithm (NL1, NL2, NL3). For (a), (b), (e), (f), (i), and (j), shading lines indicate leaching, and unshaded colour indicates gaseous loss. Numbers on the bars indicate the standard deviation (g N m−2 yr−1) of the leaching and gas loss components over the 1700–1750 quasi-equilibrium period. For (a), (e), and (i), the sums of N allocation to organic pools (vegetation biomass and soil organic matter) were in the range of −0.07 to 0.01 g N m−2 yr−1 and were omitted here. External inputs of reactive N (biological N fixation + N deposition) were fixed at 1.631 g N m−2 yr−1. For (b), (f), and (j), black bars indicate the total N loss responses (gaseous loss + leaching).
2.2.3 Global simulations
Global simulations were carried out on a global grid of resolution. The ecosystem C and N pools were spun up to equilibrium for 1291 years until 1850, using 2000 vegetation cover (Hurtt et al., 2006), 1850 N deposition rates (Lamarque et al., 2010), 1850 ambient CO2 concentrations, and 1901–1930 global climate data. In contrast to the local simulations, we also applied a representation of crop vegetation and associated fertilizer use derived for the year 2000 (Zaehle et al., 2010b) throughout all global simulations to account for the importance of fertilization regimes for the N balance in some regions. The climate data were taken from the Fifth Phase of the Coupled Model Intercomparison Project (CMIP5) projection of the Institute Pierre Simon Laplace (IPSL) general circulation model IPSL-CM5A-LR (Dufresne et al., 2013), bias-corrected according to the Inter-Sectoral Impact Model Intercomparison Project (ISI-MIP; Hempel et al., 2013). We then performed global simulation runs from 1850 to 2100. None of the forcing was transient after spin-up, except for the atmospheric CO2 concentrations that increased according to representative concentration pathway 8.5 (RCP 8.5; Meinshausen et al., 2011).
3.1 Local simulations I
3.1.1 Temperate forest site (S0)
Since N input rates of deposition and fixation were fixed, the total N loss rates predicted by the models for the quasi-equilibrium simulation period (1700–1750) barely differed between pseudosites (Fig. 2a, e, i). At S0, NL3 calculated the lowest fraction of N loss through leaching because leaching was assumed to take place after plant N uptake and two gaseous loss pathways were accounted for, leaving less N in the inorganic soil pool for leaching (Fig. 2a). Despite the differences in concept and detail of N loss representation, the proportions between gaseous loss and leaching for NL1 and NL2 were predicted to be more even. The simulations that employed the NL1 loss algorithm, however, generated more year-to-year variability than the other simulations, which generally applied across pseudosites. This was because losses in NL1 are mostly dependent on the N concentration in the inorganic soil pool, which undergoes pronounced fluctuations from plant N uptake, losses, and inputs, and generally does not accumulate N over substantial periods of time. In contrast, NL2 and NL3 base a large portion of the calculated N losses on the mineralization flux (Fig. 1), which is derived from the pool of soil organic matter (SOM). This pool is far larger in terms of absolute N mass than the inorganic pool, making N loss a rather consistent flux in comparison, as long as vegetation, i.e. substrate for N mineralization, is present.
Subjected to 10 years of eCO2, the simulated ecosystems showed considerable variation in how N loss rates were predicted to evolve, depending on the applied loss algorithm (Fig. 2b). While NL1 and NL3 predicted decreases in total loss rates, NL2 predicted increased gaseous N loss and a slight reduction of leaching rates, resulting in an overall increase in total N loss. The NL1 response was dominated by a decrease in gaseous loss. In the O–CN TBM, eCO2 leads to increased plant growth, accompanied by increased plant N demand. When this demand is met through increased plant N uptake, the soil inorganic N pool becomes more strongly depleted than it would under ambient CO2 concentrations. Gaseous N losses in NL1 decreased because they were mostly based on the soil inorganic N concentration.
In contrast, applying the NL2 model under eCO2 at S0 resulted in an increase in gaseous N losses. This was a direct reflection of the exclusive dependence of gaseous loss on net N mineralization in NL2 (Fig. 1). In the O–CN TBM, the depletion of the soil inorganic N pool under eCO2 leads to an increased C : N ratio of SOM, which in turn leads to increased N release from the mineralization of organic material to steer SOM C : N back towards a target ratio (Zaehle et al., 2014). Thus, when NL2 was applied, the effect on gaseous N loss was an increase. Depletion of soil N also caused a decrease in (concentration-dependent) N leaching; however, the net effect (total N loss) was positive (Fig. 2b).
The NL3 algorithm produced reduced total N loss under eCO2 through reduced gaseous loss, albeit at a smaller magnitude than NL1. Although NL3 features a similar mineralization dependence of gaseous N loss as NL2, we found that most gaseous loss change in NL3 occurred independently of net N mineralization change under eCO2. This means that any gaseous loss increase that occurred with increased net N mineralization was superseded here by the secondary, soil N concentration-based loss pathway that reduced gaseous N loss with soil N depletion (Fig. 1). As with the NL1 formulation, the eCO2 effect on leaching was negligible for NL3 at S0.
Despite these major model differences in predicted N loss changes under eCO2 at S0, the model differences in predicted C sequestration changes (NPP; Fig. 2c) and ecosystem C accumulation during the experiment (Fig. 2d) were small. All model versions predicted NPP increases around 25 % and growth of the total ecosystem C pool between 4 % and 5 %. Interestingly, the NL2 loss model predicted the largest increase in ecosystem C despite also predicting the only increase in ecosystem N loss, indicating a lesser degree of N limitation for NL2 than when the other loss algorithms were applied.
3.1.2 ST site
For the quasi-equilibrium loss partitioning at the ST pseudosite (Fig. 2e), the most prominent difference compared to the S0 site was that the +5 K change in air temperature caused a smaller leaching portion predicted by the NL1 algorithm. At higher temperatures, soil evaporation increased and soil drainage decreased, which for NL1 led to a reduction of leaching loss as a consequence of the coupling of drainage and leaching in this algorithm (see Appendix B). As this coupling was not applied in the NL2 and NL3 formulations, they predicted barely any effect of higher air temperatures on the partitioning between gaseous loss and leaching.
Notable effects of higher temperatures on the eCO2 responses of N loss rates (Fig. 2f) included a reduction in leaching for NL1 and a stronger gaseous loss reduction for NL3. With the reduced baseline leaching for NL1, the reduction of soil inorganic N concentrations under eCO2 resulted in now notable reduction of leaching loss. For NL3, the gaseous loss reduction was dominated by the secondary, N concentration-based pathway. Given the high temperatures at the ST site, N mineralization rates were already at a high level and increased under eCO2 at a lower rate than at the S0 site. The rather small fraction (0.01; see Sect. 2.1.3) of the N mineralization flux that was lost in gaseous form in NL3 did not make for substantial loss through the primary, flux-based pathway. Instead, gaseous losses were reduced more strongly than at S0 because more inorganic N was left in the soil to be lost through the secondary loss pathway.
Compared to the S0 site, the temperature increase at ST resulted in higher NPP responses (over 30 %; Fig. 2g) and more ecosystem C accumulation under eCO2 (over 5 %; Fig. 2h). Higher temperatures led to higher gross primary productivity (GPP) responses to eCO2 due to the sensitivity of modelled photosynthesis, which subsequently propagated to the NPP and C accumulation responses.
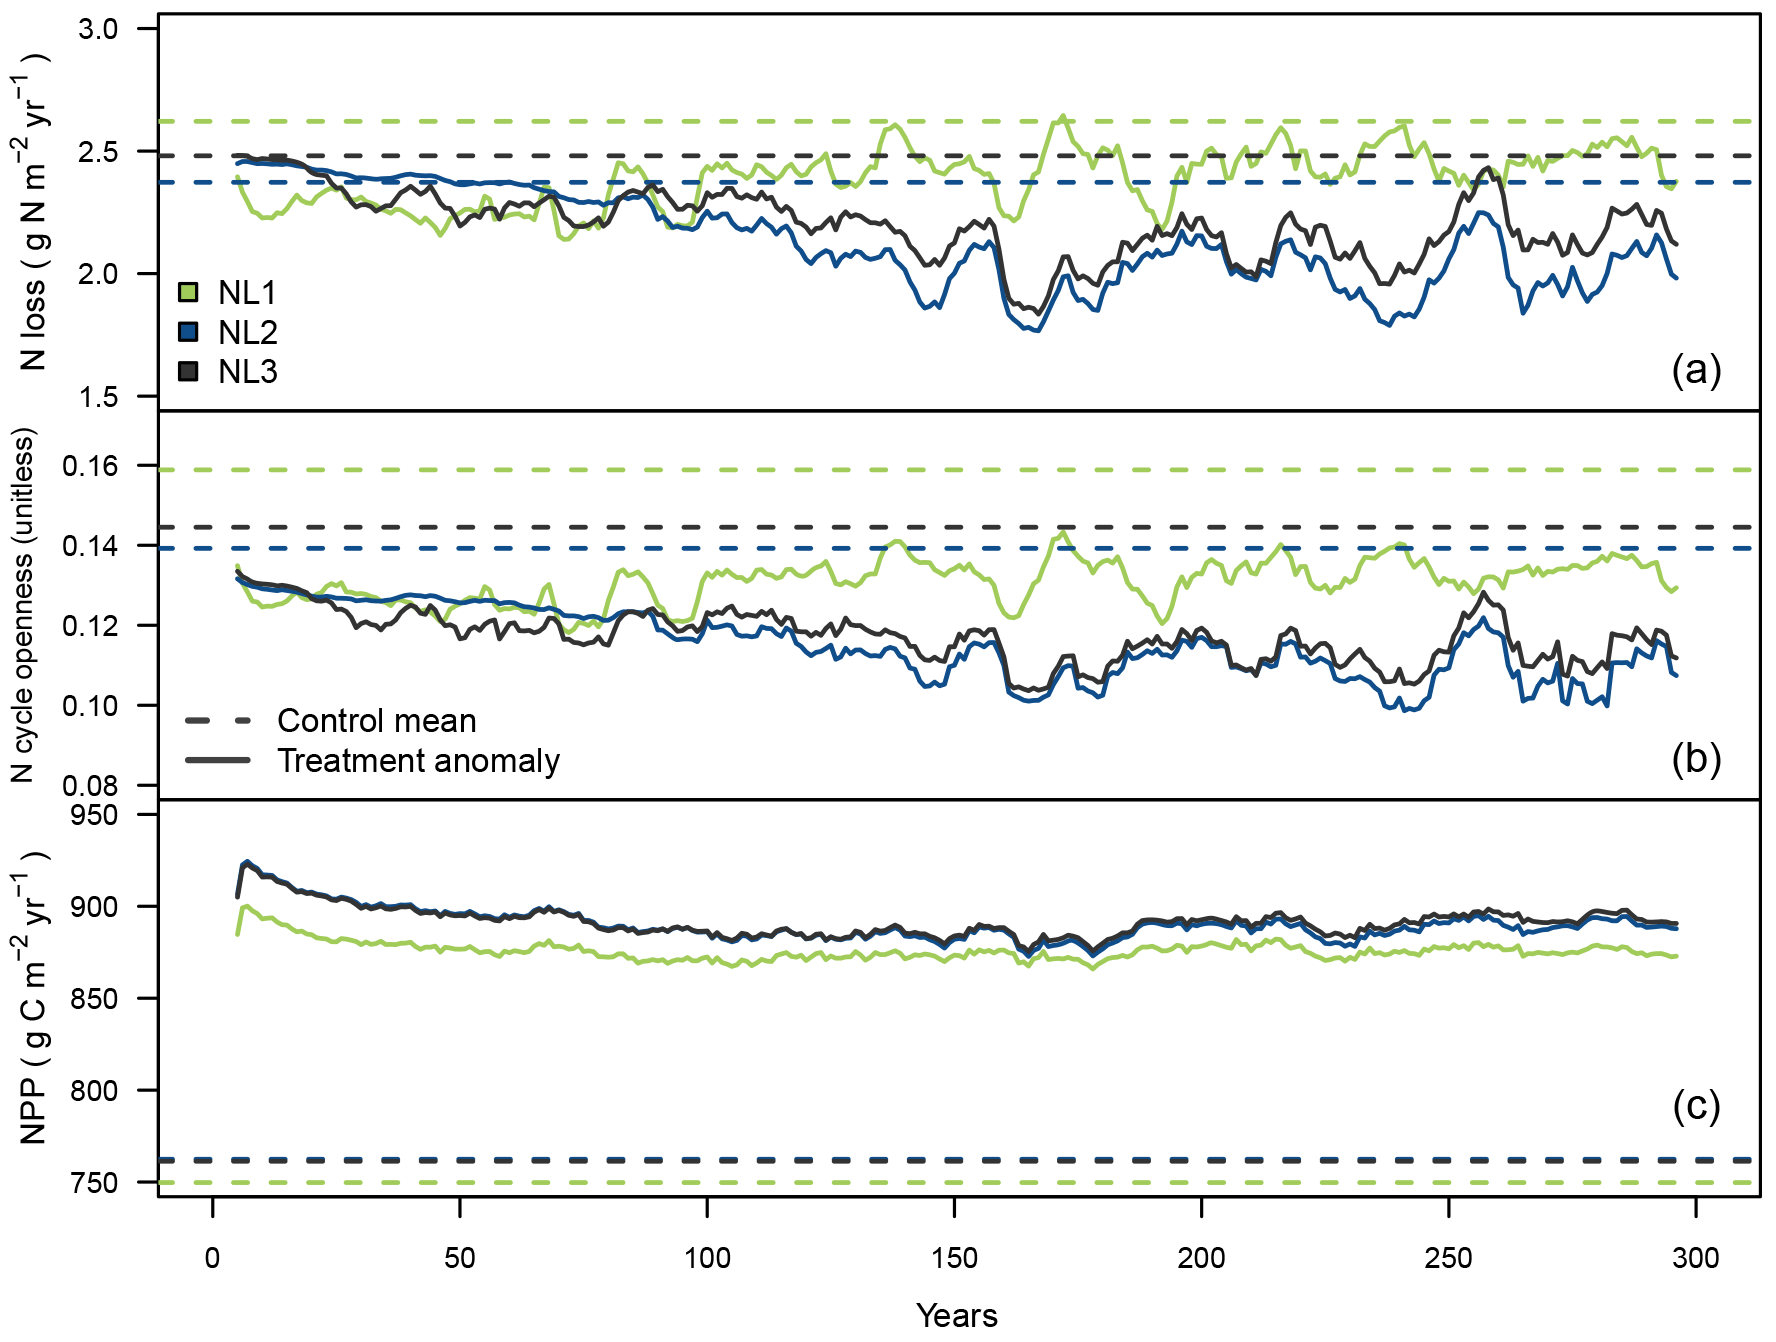
Figure 3Ten-year moving average responses of total nitrogen (N) loss (a; g N m−2 yr−1), N cycle openness (N loss/net N mineralization; b; unitless) and net primary productivity (NPP; c; g C m−2 yr−1) during the local 300-year eCO2 simulation (380 ppm control + 200 ppm treatment) at the temperate “S0” site using the three N loss models; 300-year mean from the control runs and anomaly (treatment − control + control mean) from treatment simulations.
3.1.3 SP site
When precipitation was doubled, the leaching portion of N loss for the NL1 formulation in quasi-equilibrium increased dramatically (Fig. 2i), owing to the dependence of leaching on drainage. Since in this state the total ecosystem N loss was essentially prescribed by the fixed rates of ecosystem N input, the gaseous loss portion was minimized. This was further aided by a decreased nitrification rate in NL1 at SP due to a decreased aerobic soil fraction (see Appendix B), which reduced the associated gaseous losses. While there was no effect of precipitation increase for NL2, the proportions of loss pathways changed for NL3 towards more leaching and less gaseous loss.
The precipitation increase brought about a number of changes to the sensitivity of N loss under eCO2 (Fig. 2j). For NL1, most of the N loss reduction was now simulated as reduced leaching, a consequence of most NL1 N loss now occurring as leaching (Fig. 2i). For NL2, the prediction of total N loss change switched from an increase to a decrease, on account of the leaching decrease now being of greater magnitude than the gaseous N loss increase. For NL3, precipitation increase led to strongly increased leaching and gaseous N loss reduction, approximately quadrupling the total N loss reduction compared to S0.
All models predicted NPP responses to eCO2 of approximately 20 % (Fig. 2k) with even predictions between N loss models when precipitation was increased. Model differences were also minimal regarding ecosystem C accumulation (Fig. 2l); however, all models predicted higher accumulation at SP compared to S0 (approximately 5 %).
3.2 Local simulations II
While the previous section dealt with the short-term effects of a 10-year step increase in atmospheric CO2 concentrations, the second set of local experiments was designed to investigate long-term effects of eCO2 on N limitation of vegetation growth and how sensitive such effects were to the applied N loss formulation. During the 300-year eCO2 simulation at the temperate S0 site (300-year step increase from constant control CO2 by 200 ppm), all loss models predicted the total N loss rate to decrease (Fig. 3a). In the long term, the NL1 response was less pronounced than the NL2 and NL3 predictions. Note that the NL2 model calculated increased N loss early on in the simulation (see also Sect. 3.1), but eventually calculated decreased N loss close to the NL3 model prediction.
The ratio of total ecosystem N loss and net N mineralization (termed “N cycle openness”) was predicted to decline by all models (Fig. 3b). This means that in all simulations, relative to the control runs, less N was lost from the system compared to new N becoming available from mineralization, i.e. the internal ecosystem N cycle became more “closed”. As mentioned in Sect. 3.1.1, net N mineralization generally increases in the O–CN TBM under eCO2. For the models that predicted reduction of N loss at S0 in the shorter term (NL1, NL3; Fig. 2b), reduced N cycle openness was therefore an expected result, notwithstanding the slightly different experimental designs. However, using the NL2 model that calculated ecosystem N loss increase early on resulted in reduced N cycle openness as well, meaning that early N mineralization increased at a higher rate than N loss did.
Model predictions of N cycle openness responses differed in that NL1 predicted an initial sharper decline relative to the control runs than NL2 and NL3 did (Fig. 3b). This was a consequence of NL1 N loss being largely dependent on the soil inorganic N concentration that declined quickly in response to the step increase in the atmospheric CO2 concentration (Fig. 3a). In contrast, the dependencies of NL2 and NL3 on the N mineralization flux made for a more gradual decline of N loss (and N cycle openness), owing to the dependence of N mineralization on the slower dynamics of the SOM N pool. Over the 300 simulation years, all loss models approached the same approximate absolute magnitude of N cycle openness reduction.
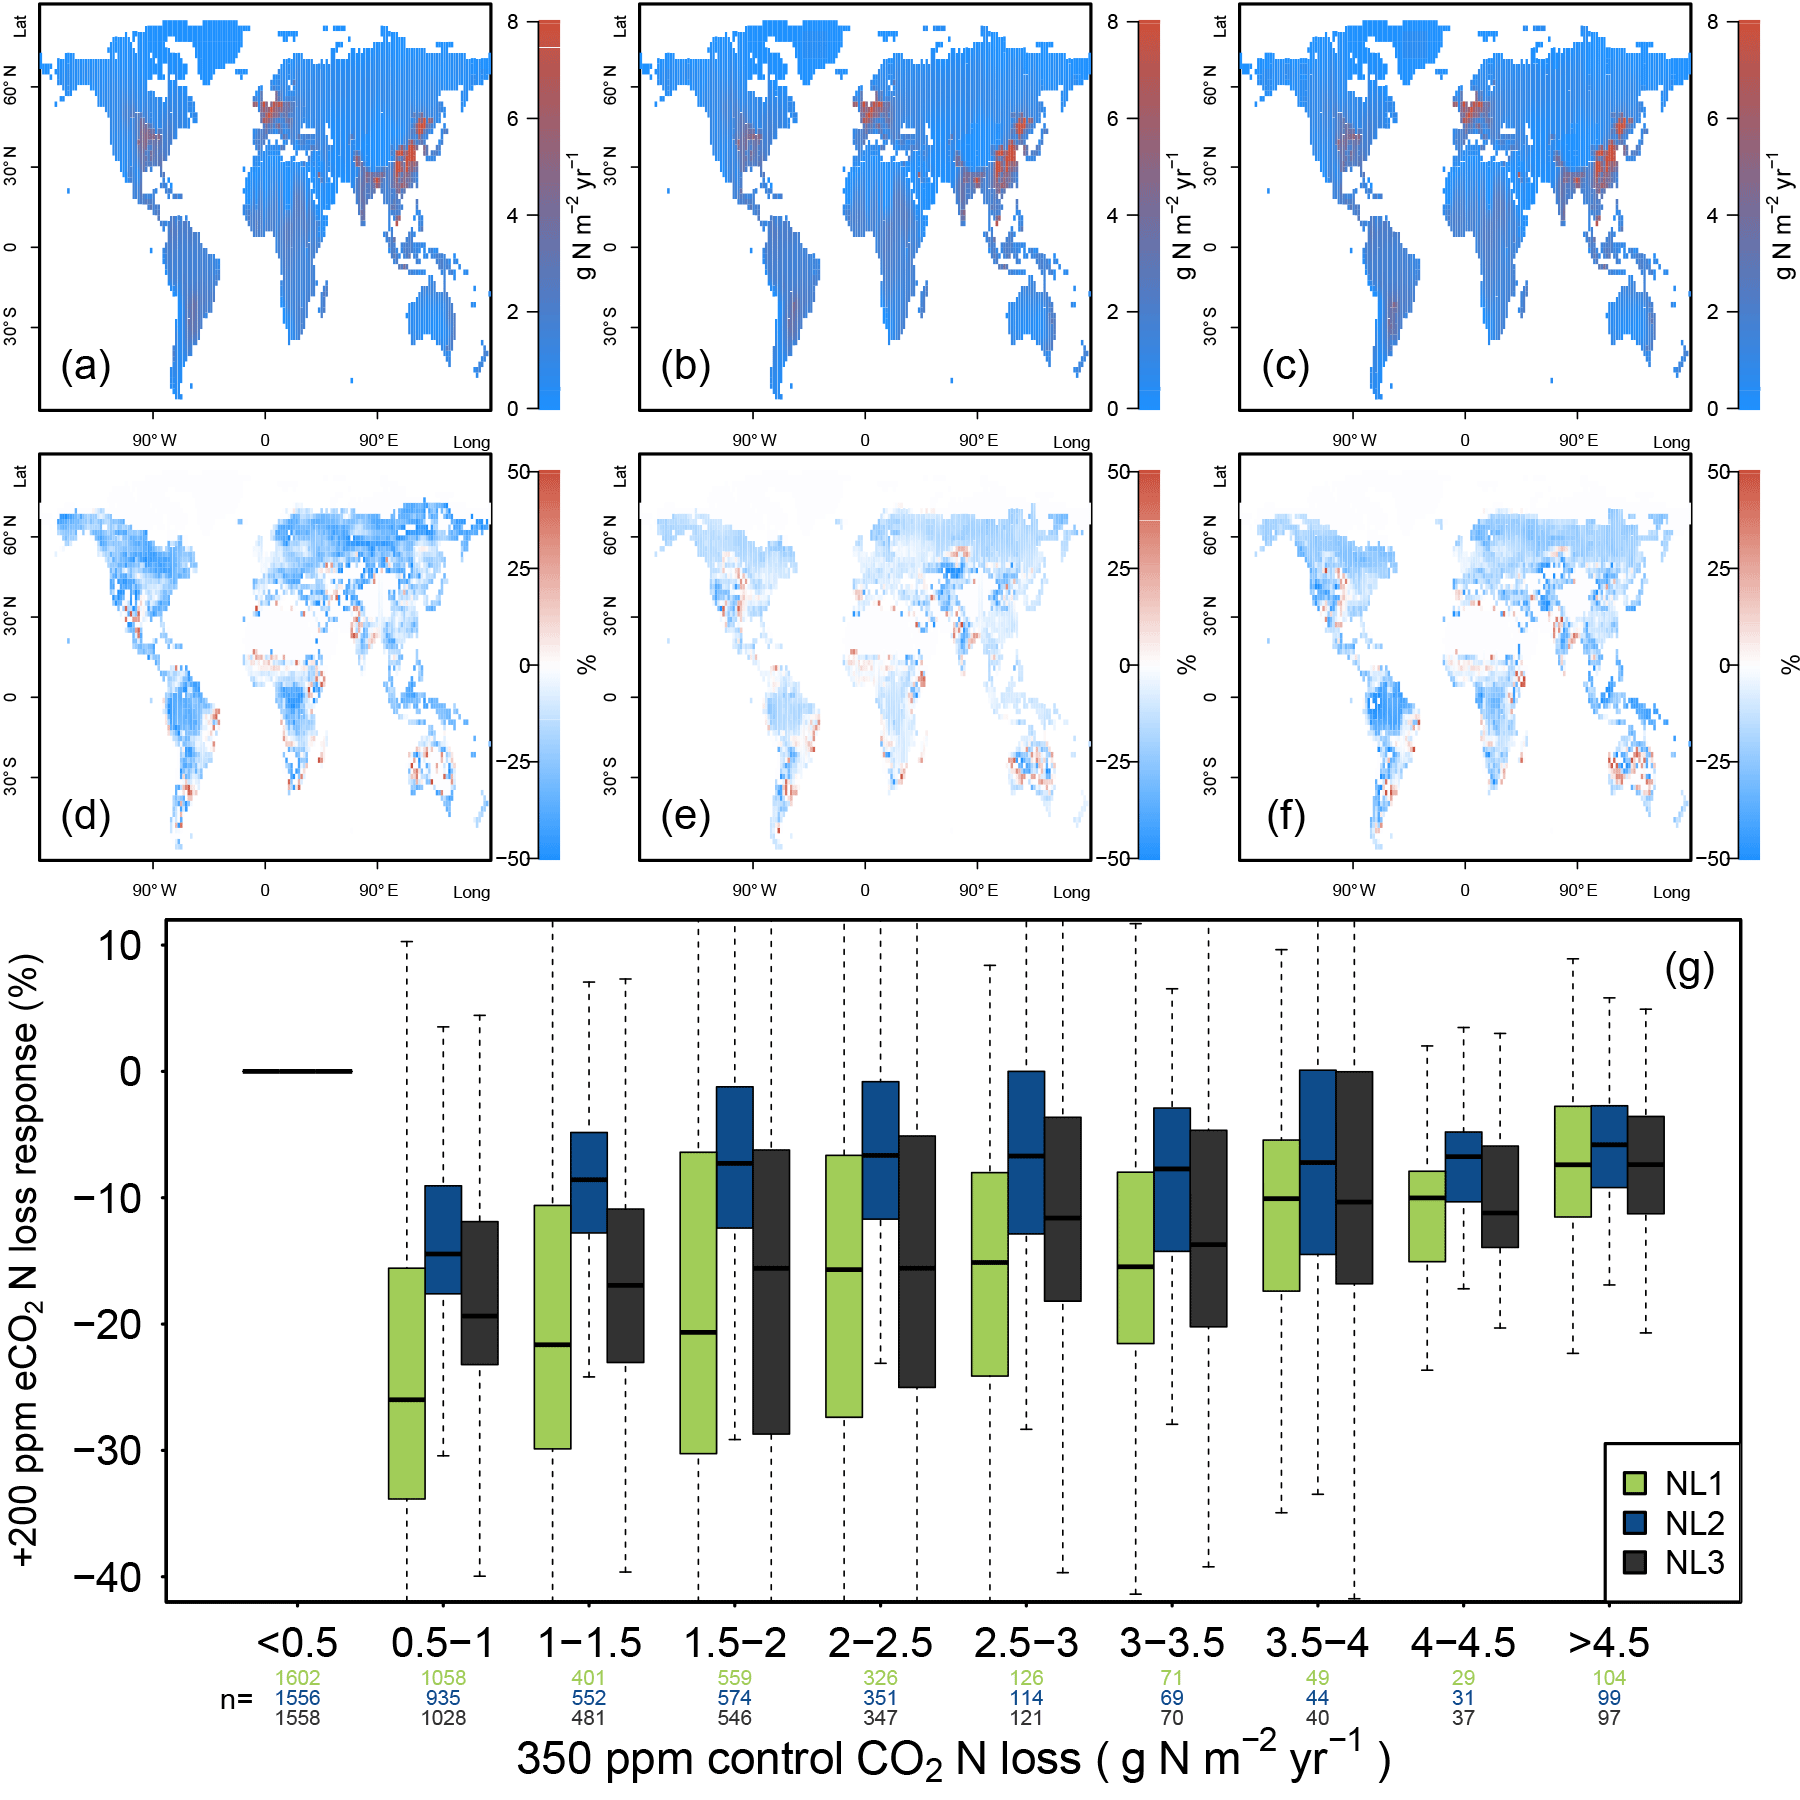
Figure 4(a, b, c) Global nitrogen (N) loss rates (g N m−2 yr−1) for the control state (350 ppm atmospheric CO2 concentration), using the N loss algorithms NL1 (a), NL2 (b), and NL3 (c). (d, e, f) Global N loss responses (%) to elevated atmospheric CO2 concentrations (eCO2, +200 ppm gradual increase). (g) Global response ratios (%) plotted against the corresponding control N loss rates, binned in intervals of 0.5 g N m−2 yr−1. Boxes show median and quartiles; whiskers show the largest/smallest outliers that lie below/above 1.5 times the interquartile range. Further outliers were omitted. Coloured numbers indicate the number of grid cells that fell into the respective N loss range. The 350–550 ppm difference in atmospheric CO2 concentrations approximately corresponded to the 1988–2052 time span in our global simulations.
The magnitudes of NPP responses (Fig. 3c) were again largely unaffected by N loss differences, which was expected considering the findings in Sect. 3.1.1 (Fig. 2c). There was a trend of NL1 sustaining a larger NPP response than the other models until simulation year 175; however, this trend dissolved over the following decades of simulation until the end of the experiment.
3.3 Global simulations
Having examined the eCO2 effects of N loss variety in detail at a temperate site, we next applied the three loss algorithms in global simulations to observe the dynamics between eCO2, N loss and ecosystem C accumulation for different vegetation types and climate regimes. Notably, only the atmospheric CO2 concentration was varied in time, whereas climate and N forcing was kept constant (see Sect. 2.2.3).
The three model versions were spun up to equilibrium for the soil and vegetation C and N pools using 1850 atmospheric CO2 levels according to the RCP 8.5 scenario (285 ppm; Meinshausen et al., 2011). However, after 138 simulation years and having gradually reached atmospheric CO2 levels of 350 ppm in 1988, global N loss rates were still predicted to be similar between the models (Fig. 4a, b, c). This shows that the models did not differ much when responses to gradual, low-magnitude eCO2 were calculated. The hotspots of N loss were regions with high density of agricultural land use (associated with large N fertilizer inputs) and, to a lesser extent, the tropical zone with high natural N turnover.
In comparison to the 1988 state (corresponding to an atmospheric CO2 level of 350 ppm), all loss models predicted more or less pronounced reductions of total ecosystem N loss in global simulations under eCO2 by 2052 (550 ppm), i.e. after 64 more years of simulation (Fig. 4d, e, f). However, model predictions differed in the magnitudes of N loss reductions with some notable regional disagreement. Some of the regions for which all models consistently predicted sizable reductions of loss rates were arid parts of the Canadian Prairies, most northern temperate and boreal regions of Russia, as well as regions surrounding the Central Asian deserts, where vegetation cover and baseline N turnover was low, therefore not contributing much to the total global N loss flux in absolute terms. The models also predicted N loss reduction for tropical rainforests, regions with some of the highest global N stocks and turnover rates.
The most notable model differences could be found between the NL1 and NL2 loss models, with NL1 predicting generally large (often greater than 30 %) negative N loss responses, and NL2 predicting generally smaller (mostly lower than 20 %) negative responses (Fig. 4d, e, g). In general terms, the responses predicted by NL3 could be classified as close to NL2 in the temperate and boreal regions, and close to NL1 in the tropics. The large negative response for NL1 in the boreal regions was a manifestation of the soil N concentration-based N loss fluxes. The boreal regions are usually considered strongly N-limited in their vegetation growth, i.e. low in soil N availability for plant uptake. This is generally represented in the O–CN model as well. Therefore, a small absolute decrease in soil N concentration due to plant uptake increase under eCO2 was enough to result in a high relative reduction of total N loss in NL1. As shown in Sect. 3.1, this mechanism did not apply as strictly in the NL2 and NL3 models, which resulted in less pronounced responses in the boreal regions. NL2 predicted the smallest decrease in tropical N loss rates because its loss pathways were the least affected by the soil inorganic N concentration decreasing under eCO2, as NL2 used this dependence only to determine leaching.
The model differences regarding N loss responses were most prominent in highly N-limited regions (Fig. 4g), resulting from the strong dependence of NL1 N loss on the soil inorganic N concentration. While this effect was not as clear for NL2 and NL3, the N loss reduction under eCO2 in NL1 was essentially a function of inorganic soil N availability, resulting in the strongest relative N loss reductions occurring in the regions that have the most pronounced N limitation on growth. Some ecosystems in these regions, e.g. boreal forests, are also known to store large amounts of C. This raises the question whether model differences in global N loss responses, including in highly N-limited regions, also resulted in appreciable model differences with respect to predicted C accumulation under eCO2.
As the N loss algorithms predicted different rates of N loss change in response to global atmospheric CO2 increase (Fig. 4), there was also disagreement in the amounts of N that would accumulate in the terrestrial biosphere over the entire simulation period (1850–2100) when atmospheric CO2 concentrations increased from 285 to 936 ppm (Fig. 5). The predicted N accumulation varied between 5600 Tg N (NL1; corresponds to 22.4 Tg N yr−1), 3964 Tg N (NL2; 15.9 Tg N yr−1), and 4947 Tg N (NL3; 19.8 Tg N yr−1). Ecosystem N accumulation differed in particular in northern temperate and boreal regions, where the NL1 loss model led to the most N accumulation, as well as in tropical ecosystems, where the NL2 loss model led to the least N accumulation. Most of the variety in these predictions of ecosystem N accumulation stemmed from variety in predicted accumulation in SOM (Fig. A1 in Appendix A), with the exception that in the tropics, NL1 predicted notably less N storage in vegetation than the other models.
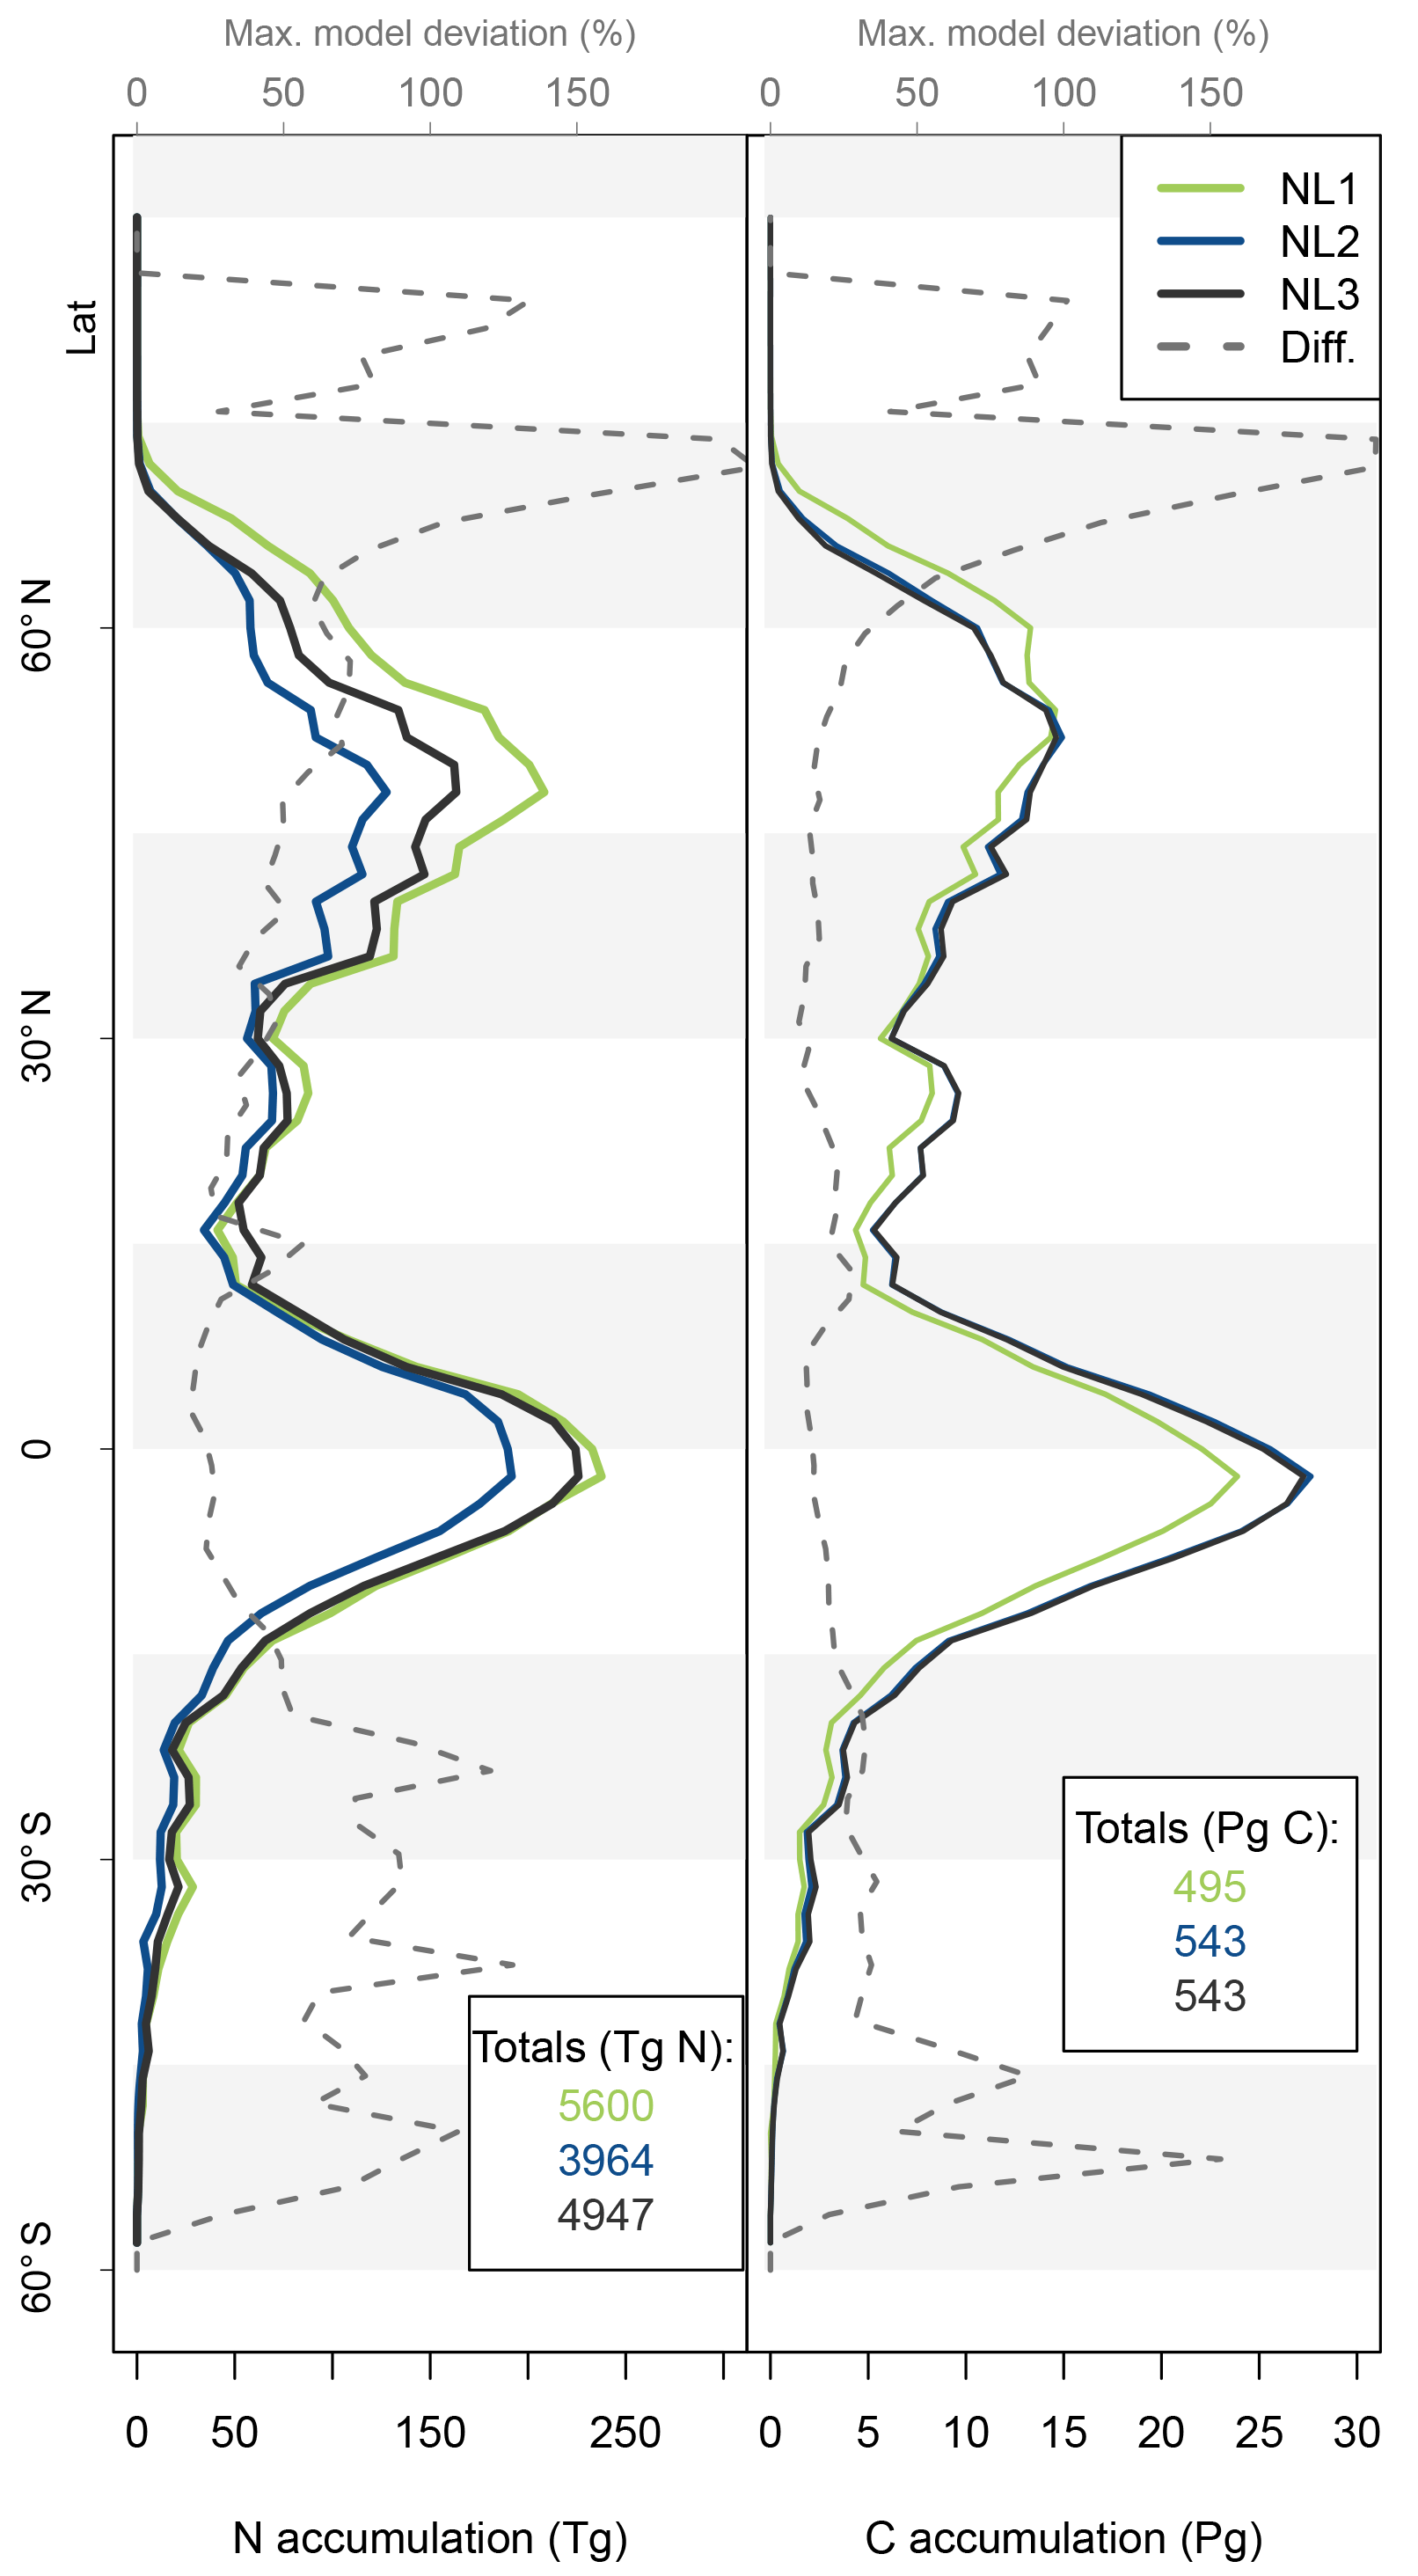
Figure 5Nitrogen (N, left) and carbon (C, right) accumulation during global simulations of elevated atmospheric CO2 concentrations (eCO2) using three different N loss algorithms between 1850 (285 ppm CO2) and 2100 (936 ppm CO2), depicted per 2∘ latitudinal band and as global totals (coloured numbers). “Diff.” shows the respective maximum deviation between the three models as the percentage of the three-model mean. The global total values corresponded to average yearly accumulations of 22.4, 15.9, and 19.8 Tg N yr−1 (NL1, NL2, and NL3) and 2.0, 2.2, and 2.2 Pg C yr−1.
The resulting model disagreement regarding the additional C accumulation under eCO2 was small (Fig. 5). Using the three N loss algorithms led to calculated cumulative terrestrial C uptake of 495 Pg C (NL1; corresponds to 2.0 Pg C yr−1), 543 Pg C (NL2; 2.2 Pg C yr−1), and 543 Pg C (NL3; 2.2 Pg C yr−1) in the RCP 8.5 eCO2 scenario. In particular, there were only small model differences simulated for tropical or boreal forests, where the variety in N accumulation was highest. This low sensitivity of new C accumulation to model differences in new N accumulation is explained by model differences in the fate of newly accumulated N (Fig. A2). While NL1, in comparison with NL2 and NL3, led to higher N accumulation in total, this loss algorithm was also associated with a relatively higher allocation of accumulated N to the relatively low C : N soil pools. Thus, the higher N accumulation was buffered through association with low C : N pools, resulting in total C accumulation relatively similar to loss algorithms that resulted in less N accumulation but higher allocation to high C : N vegetation pools. In addition, the response of ecosystem stoichiometry to varying N loss rates contributed to this insensitivity (Fig. A3). However, attribution of this effect is far from trivial because of diverging local effects confounding any clear global signal.
The variability between N loss algorithms in predicted C accumulation for the RCP 8.5 eCO2 scenario between 1850 and 2100 (Fig. 5) was low compared to the large variability in predictions of different TBMs for a similar scenario (Jones et al., 2013). This indicates that uncertainty in N loss representation was not a major driver for variability in future C sink predictions. This result was obtained in spite of some non-negligible variety in predicted ecosystem N accumulation during the global eCO2 experiment (Fig. 5). The tendency of global results to indicate that variety in predictions of N loss change (Fig. 4) and N accumulation (Fig. 5) under eCO2 did not have a large impact on corresponding predictions of responses in C sequestration was in principle also found at the site level (Figs. 2 and 3). We expected that the effect would be limited, because it was shown before that in the O–CN TBM, the magnitude of N loss is about 20 % of the magnitude of plant N uptake (Meyerholt et al., 2016). However, the small margin in C predictions between the N loss algorithms is still remarkable, considering the different levels of complexity with which the loss fluxes were determined.
The lack of direct connection regarding model variety between N predictions and C predictions appears plausible for the tropical zone, where vegetation growth is typically not considered N-limited. Therefore, N variety in loss rates and accumulation were not expected to affect C predictions strongly. The main reason for the small C effect outside the tropics is the model heterogeneity regarding the above-/below-ground allocation of accumulated N. Differences in total N accumulation were counteracted by differences in N allocation to ecosystem pools with different C : N ratios, largely attenuating the effect on global C accumulation. Another explanation might be found in the concept of flexible C : N stoichiometry in organic soil and plant tissues employed in the O–CN TBM (Zaehle and Friend, 2010; Meyerholt and Zaehle, 2015). The buffering capacity of flexible ecosystem C : N ratios could indeed attenuate the variety in N loss responses to eCO2 and render the effect on C accumulation minimal, as seen in our results (Fig. 5). We found that when we employed fixed ecosystem C : N ratios in organic soil and vegetation pools following Meyerholt and Zaehle (2015), predicted C accumulation became more variable in far northern latitudes due to variable productivity under strong N limitation, whereas model differences remained small in other regions (Fig. A3). Thus, the generally low sensitivity of global C accumulation under eCO2 to model differences in N accumulation was caused by model differences in the above-/below-ground allocation of accumulated N, aided by stoichiometric buffering in the boreal zone.
The model variety in predicted N accumulation was a consequence of the different algorithms predicting diverging N loss rate responses to eCO2, albeit for the most part reductions of N loss. Aside from the short-term (10-year) predictions of the NL2 loss algorithm, this reduction effect (Figs. 2, 3, and 4) is in line with the expected mechanisms in play for C–N TBMs under eCO2 (Zaehle et al., 2014; Walker et al., 2015), with increased plant N demand causing more N uptake from the soil, leaving less residual N to be lost. However, although denitrification is considered the dominant mechanism of ecosystem loss (Fang et al., 2015), most field experiments have not found decreases in N2O emissions under eCO2. Positive or neutral responses have been common, primarily obtained in temperate or boreal forests or grasslands (Van Groeningen et al., 2011; Dijkstra et al., 2012). It should be noted that none of these field experiments were conducted in the tropics, which may hamper comparisons (Huang and Gerber, 2015), also seeing how a substantial portion of our obtained N loss decrease was observed at these latitudes (Fig. 4). Nevertheless, a number of mechanisms have been proposed that would explain increased denitrification under eCO2 (Butterbach-Bahl and Dannenmann, 2011), some of them on the level of abstraction with which the N cycle is commonly represented in TBMs. For example, eCO2 could change the plant's water use efficiency through decreased plant transpiration, leading to higher soil water content and a higher likelihood of anaerobic soil conditions that would benefit denitrification. Further, eCO2 could stimulate the rhizodeposition of labile C compounds such as amino acids and sugars, increasing soil microbial activity and thereby providing beneficial conditions for denitrification through oxygen depletion and provision of organic C. While such processes are heuristically accounted for in the NL1 formulation (see Appendix B), the predicted result was still the reduction of N loss under eCO2, because the trends were more strongly determined by the increased plant N uptake and soil mineral N depletion. It might be that these main mechanisms proposed by models to reduce N loss under eCO2 just do not apply as generally, especially in very N-rich soils. This leads to the challenge for models to treat the actual size and distribution of global soil N inventories, if modellers hope to draw connections between soil N content and soil N emissions on large spatial scales.
As for other model studies, Huang and Gerber (2015) only found initial reduction of soil N2O emissions in the tropical biome in a long-term eCO2 simulation using a TBM, followed by a substantial increase, with the responses in other ecosystems being neutral or positive throughout. Aber et al. (2002) demonstrated that in a stand-scale ecosystem model, the N loss (leaching only) response was only negative under simulated eCO2 when the experiment was not confounded by other perturbations such as increased N deposition and climatic change. In that model setting, other perturbations of N input and accelerated N turnover would eventually increase N losses, a result that we also largely obtained globally, when we added increased N deposition and transient climate to the eCO2 experiment (Fig. A4). While there is still discrepancy between the mechanisms that likely control the N loss response to eCO2 in nature and the mechanisms that shape model responses, the most immediate notion here is that this effect needs to be studied in actual tropical ecosystems that are N-rich and will be crucial for the global climate under future change. Also, the above comparisons are limited by differences in the typical durations of field campaigns and model simulation runs. Timescale may well be pivotal here, since the functioning of the N cycle and its sensitivity to changing climate and biogeochemistry has long been hypothesized to change over longer (decadal and onwards) timescales (Aber et al., 1989; Vitousek and Howarth, 1991; Luo et al., 2004).
Performing a local temperate 300-year eCO2 experiment, we found that initial model differences in N loss rate responses over time approximately converged to a similar level that remained negative, i.e. N loss reduction (Fig. 3). The persistent N loss reduction over time means that using our array of N loss algorithms within the framework of the O–CN TBM never resulted in a prediction of long-term progressive N limitation (Luo et al., 2004) at the temperate site. Instead, the vegetation response to eCO2 determined the long-term evolution of the N cycle. Walker et al. (2015) conducted similar local model experiments at temperate sites, but instead of comparing N loss algorithms they compared entire TBMs. They found a variety of N loss responses, from negligible responses to initial reductions that would over time subside and approach zero or even positive responses, which suggested that some TBMs predicted the onset of progressive N limitation under a long-term eCO2 regime. The different N loss algorithms applied in these TBMs (some of which were represented in our study) were likely influential in producing the variety of eCO2 responses presented in Walker et al. (2015). However, we showed here that variety in N loss formulations alone is not enough to produce such heterogeneous responses in the long term. Rather, the results produced by different TBMs were confounded by many other assumptions about the C and N cycles that were inherent to each model.
We have shown that the different loss algorithms simulated variable partitioning of N losses between gaseous and leaching losses, both in quasi-equilibrium and under eCO2 (Fig. 2). In reality, the partitioning of the two N loss pathways means nothing less than the difference between predicted air pollution or water pollution if N-enriched ecosystems are considered (Aber et al., 1989). Consequently, adequate N cycle representation still mandates a better grasp of this partitioning issue, for which major model discrepancies have been shown before (Thomas et al., 2013). Some of the model differences highlighted in our study are clearly the consequence of the respective formulations, such as a very high leaching portion in a high precipitation environment when leaching was a function of drainage (NL1) or the virtual elimination of leaching in the hierarchical structure of NL3 when gaseous N loss was already substantial (Fig. 2). These examples show that in TBMs that include both gaseous and leaching pathways, there has not been a consensus on the proper partitioning between N loss components. The reason for this is the lack of field evidence of simultaneous measurements of both pathways to inform models.
Further, deriving gaseous N loss from the N mineralization flux as described e.g. by Thornton and Rosenbloom (2005) and Wang et al. (2010) may be too coarse of an approximation. The “Hole-in-the-pipe” model (Firestone and Davidson, 1989), frequently cited as inspiration, highlighted that the fluxes of nitrification and denitrification are the important processes from which NO and N2O emissions are derived. At best, mineralization could be considered a “distal” indicator of nitrification activity, since it provides the substrate, one of the controlling factors of nitrification. From the ecosystem modelling perspective, denitrification is usually assumed to be controlled by the presence of , organic C, and anaerobic conditions, which are only loosely connected to N mineralization but depend on the distribution of soil moisture, temperature, roots, and microbial activity. Likely, the relatively simple algorithms we implemented as NL2 and NL3 are in part the result of the respective N cycle model not discriminating between and and rather calculating a generic N species for convenience. However, such a discrimination will likely be necessary if N cycle modelling and N loss algorithms in particular are to be advanced across terrestrial biosphere models.
The above example illustrates that regional-scale modelling of N loss fluxes in TBMs is still developing, as current research continues to e.g. investigate the sensitivity of leaching to global change in a TBM (Braakhekke et al., 2017). Importantly, one of the most climate-relevant aspects of N loss fluxes, N2O emission, has become the focus of a model intercomparison project aiming to understand past and present N2O fluxes by utilizing state-of-the-art models along with available data (Tian et al., 2018). We contend that such efforts to consolidate the representation of ecosystem N loss processes could best be aided by field experiments that investigate N loss rates (and their partitioning between gaseous and leaching components) under perturbation in the regions that we identified as crucial with respect to modelled N loss uncertainty. Our global simulations showed consistent model disagreement in northern temperate and boreal latitudes in terms of the magnitude of N loss rate changes under eCO2 but only a small effect on C sequestration. Vegetation growth in these regions is usually thought to be strongly N-limited, which is largely controlled by the ecosystem N budgets, including N loss rates. For future C sink predictions, it might be important to describe how N cycling affects the large C reserves in these latitudes that are often considered undersampled with respect to many ecosystem variables. On the other hand, we found large N loss rate changes in the tropics, but also faced a lack of appropriate field experiments to evaluate these results. While tropical vegetation growth is usually not considered N-limited, the flipside is that many of these regions are N-rich, with large potential of water eutrophication or the outgassing of NO and N2O, all environmental issues of note where new experiments are urgently needed to inform models.
The used model code is available from the authors upon request.
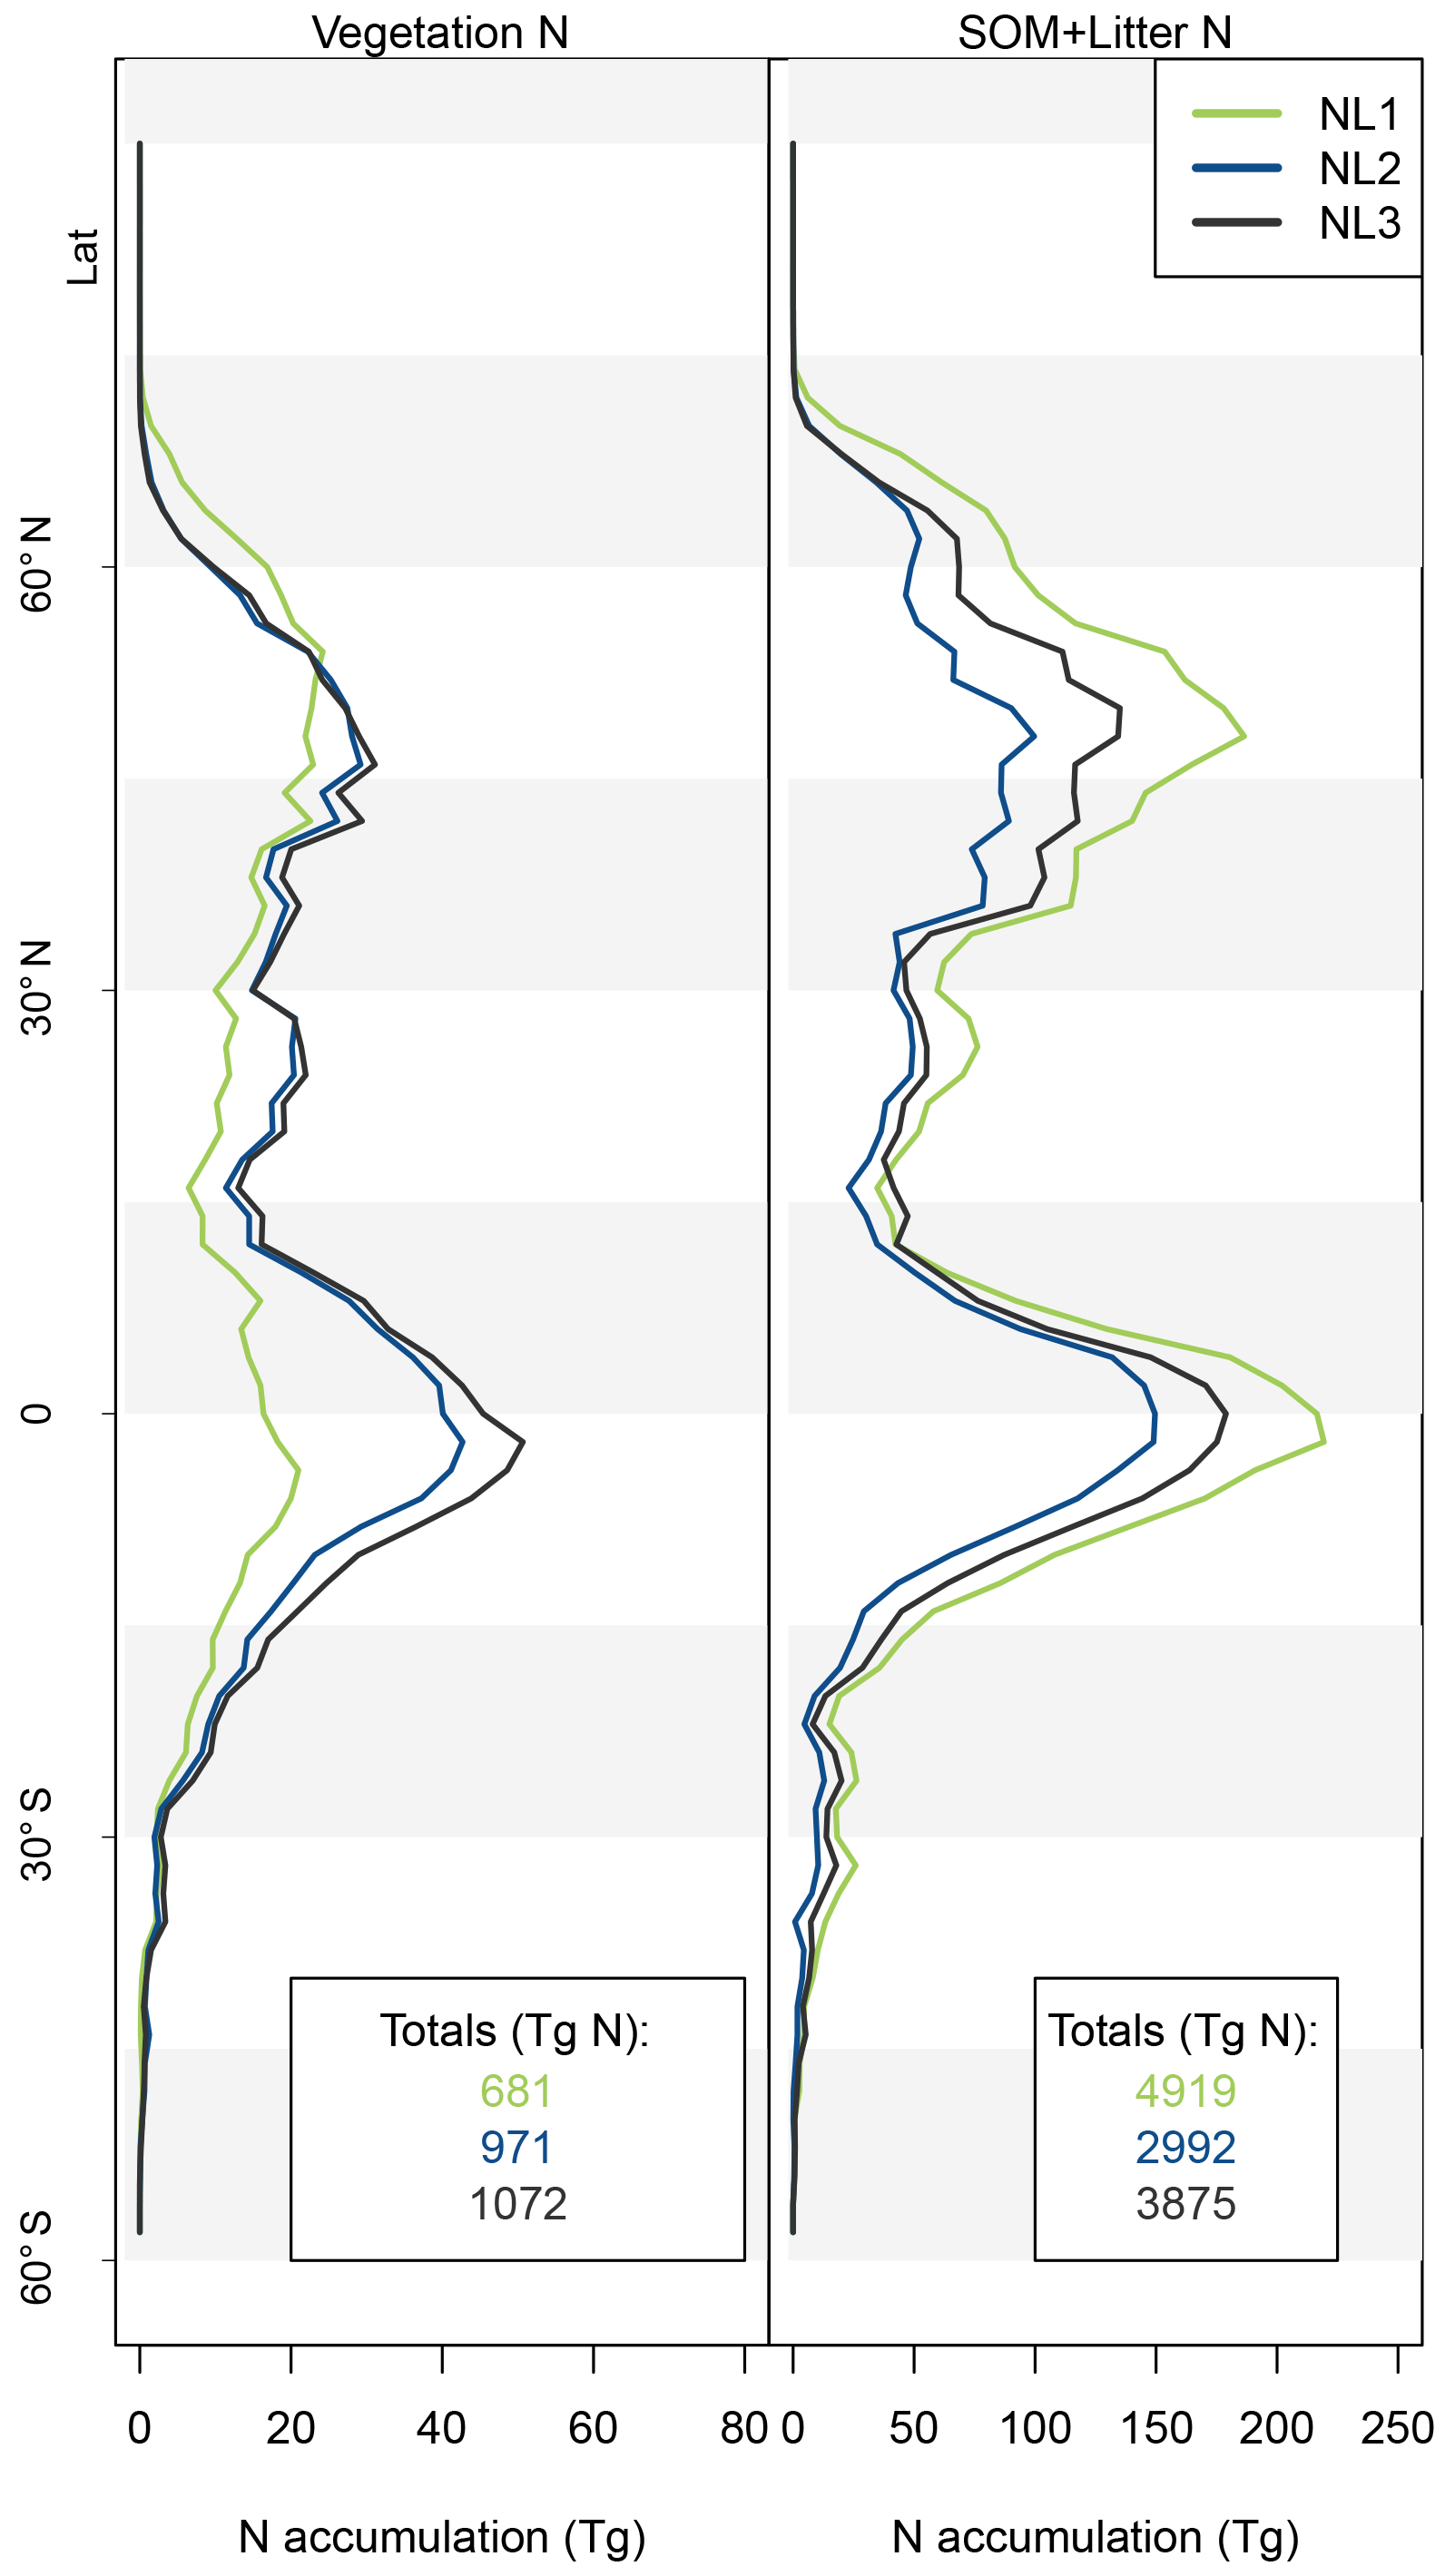
Figure A1Latitudinal accumulation of nitrogen (N) in the vegetation (left) or soil organic matter + litter (right) compartments during global simulations of elevated atmospheric CO2 concentrations (eCO2) using three different N loss algorithms between 1850 (285 ppm CO2) and 2100 (936 ppm CO2), depicted per 2∘ latitudinal band and as global totals (coloured numbers).

Figure A2Latitudinal vegetation fractions of accumulated nitrogen (N, left) and carbon (C, right) during global simulations of elevated atmospheric CO2 concentrations (eCO2) using three different N loss algorithms between 1850 (285 ppm CO2) and 2100 (936 ppm CO2), depicted per 2∘ latitudinal band. The inverse of the vegetation fraction corresponds to material accumulated in soil organic matter or litter pools.
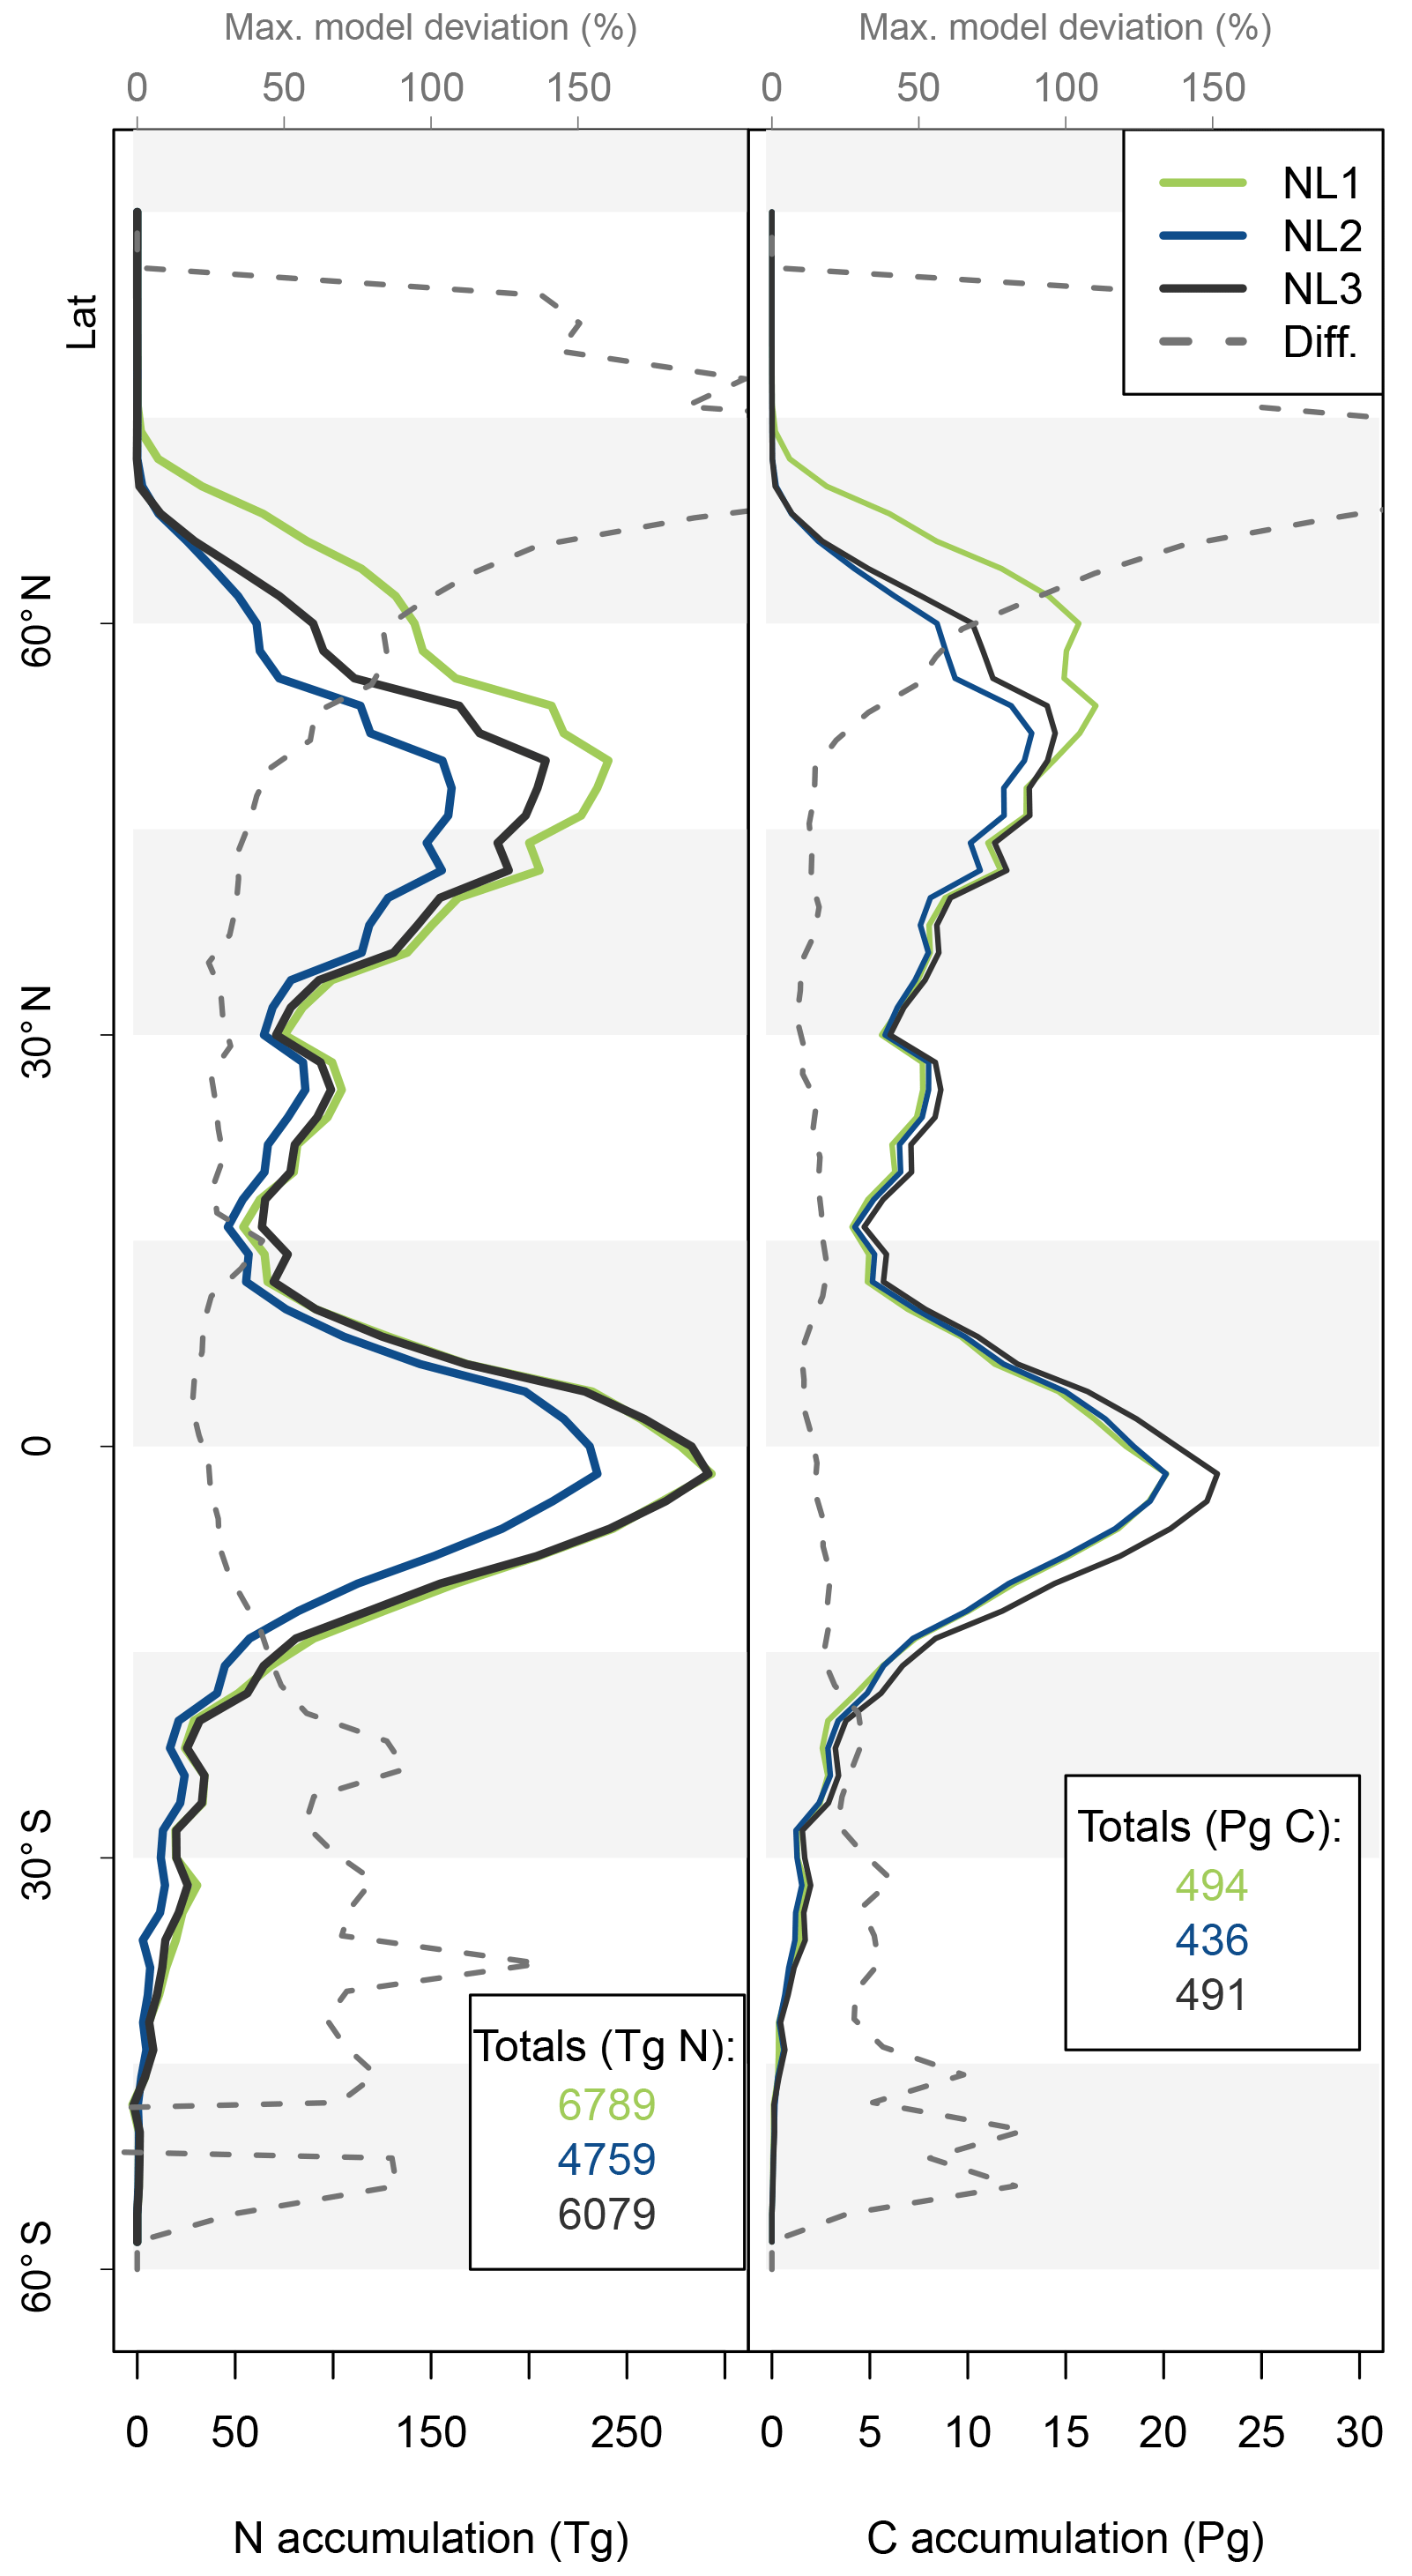
Figure A3Nitrogen (N, left) and carbon (C, right) accumulation during global simulations of elevated atmospheric CO2 concentrations (eCO2) using three different N loss algorithms between 1850 (285 ppm CO2) and 2100 (936 ppm CO2), depicted per 2∘ latitudinal band and as global totals (coloured numbers). “Diff.” shows the respective maximum deviation between the three models as the percentage of the three-model mean. The global total values corresponded to average yearly accumulations of 27.2, 19.0, and 24.3 Tg N yr−1 (NL1, NL2, and NL3) and 2.0, 1.7, and 2.0 Pg C yr−1. The difference to Fig. 5 is the usage of an O–CN terrestrial biosphere model version that employed fixed C : N stoichiometry in all soil and vegetation pools (Meyerholt and Zaehle, 2015).
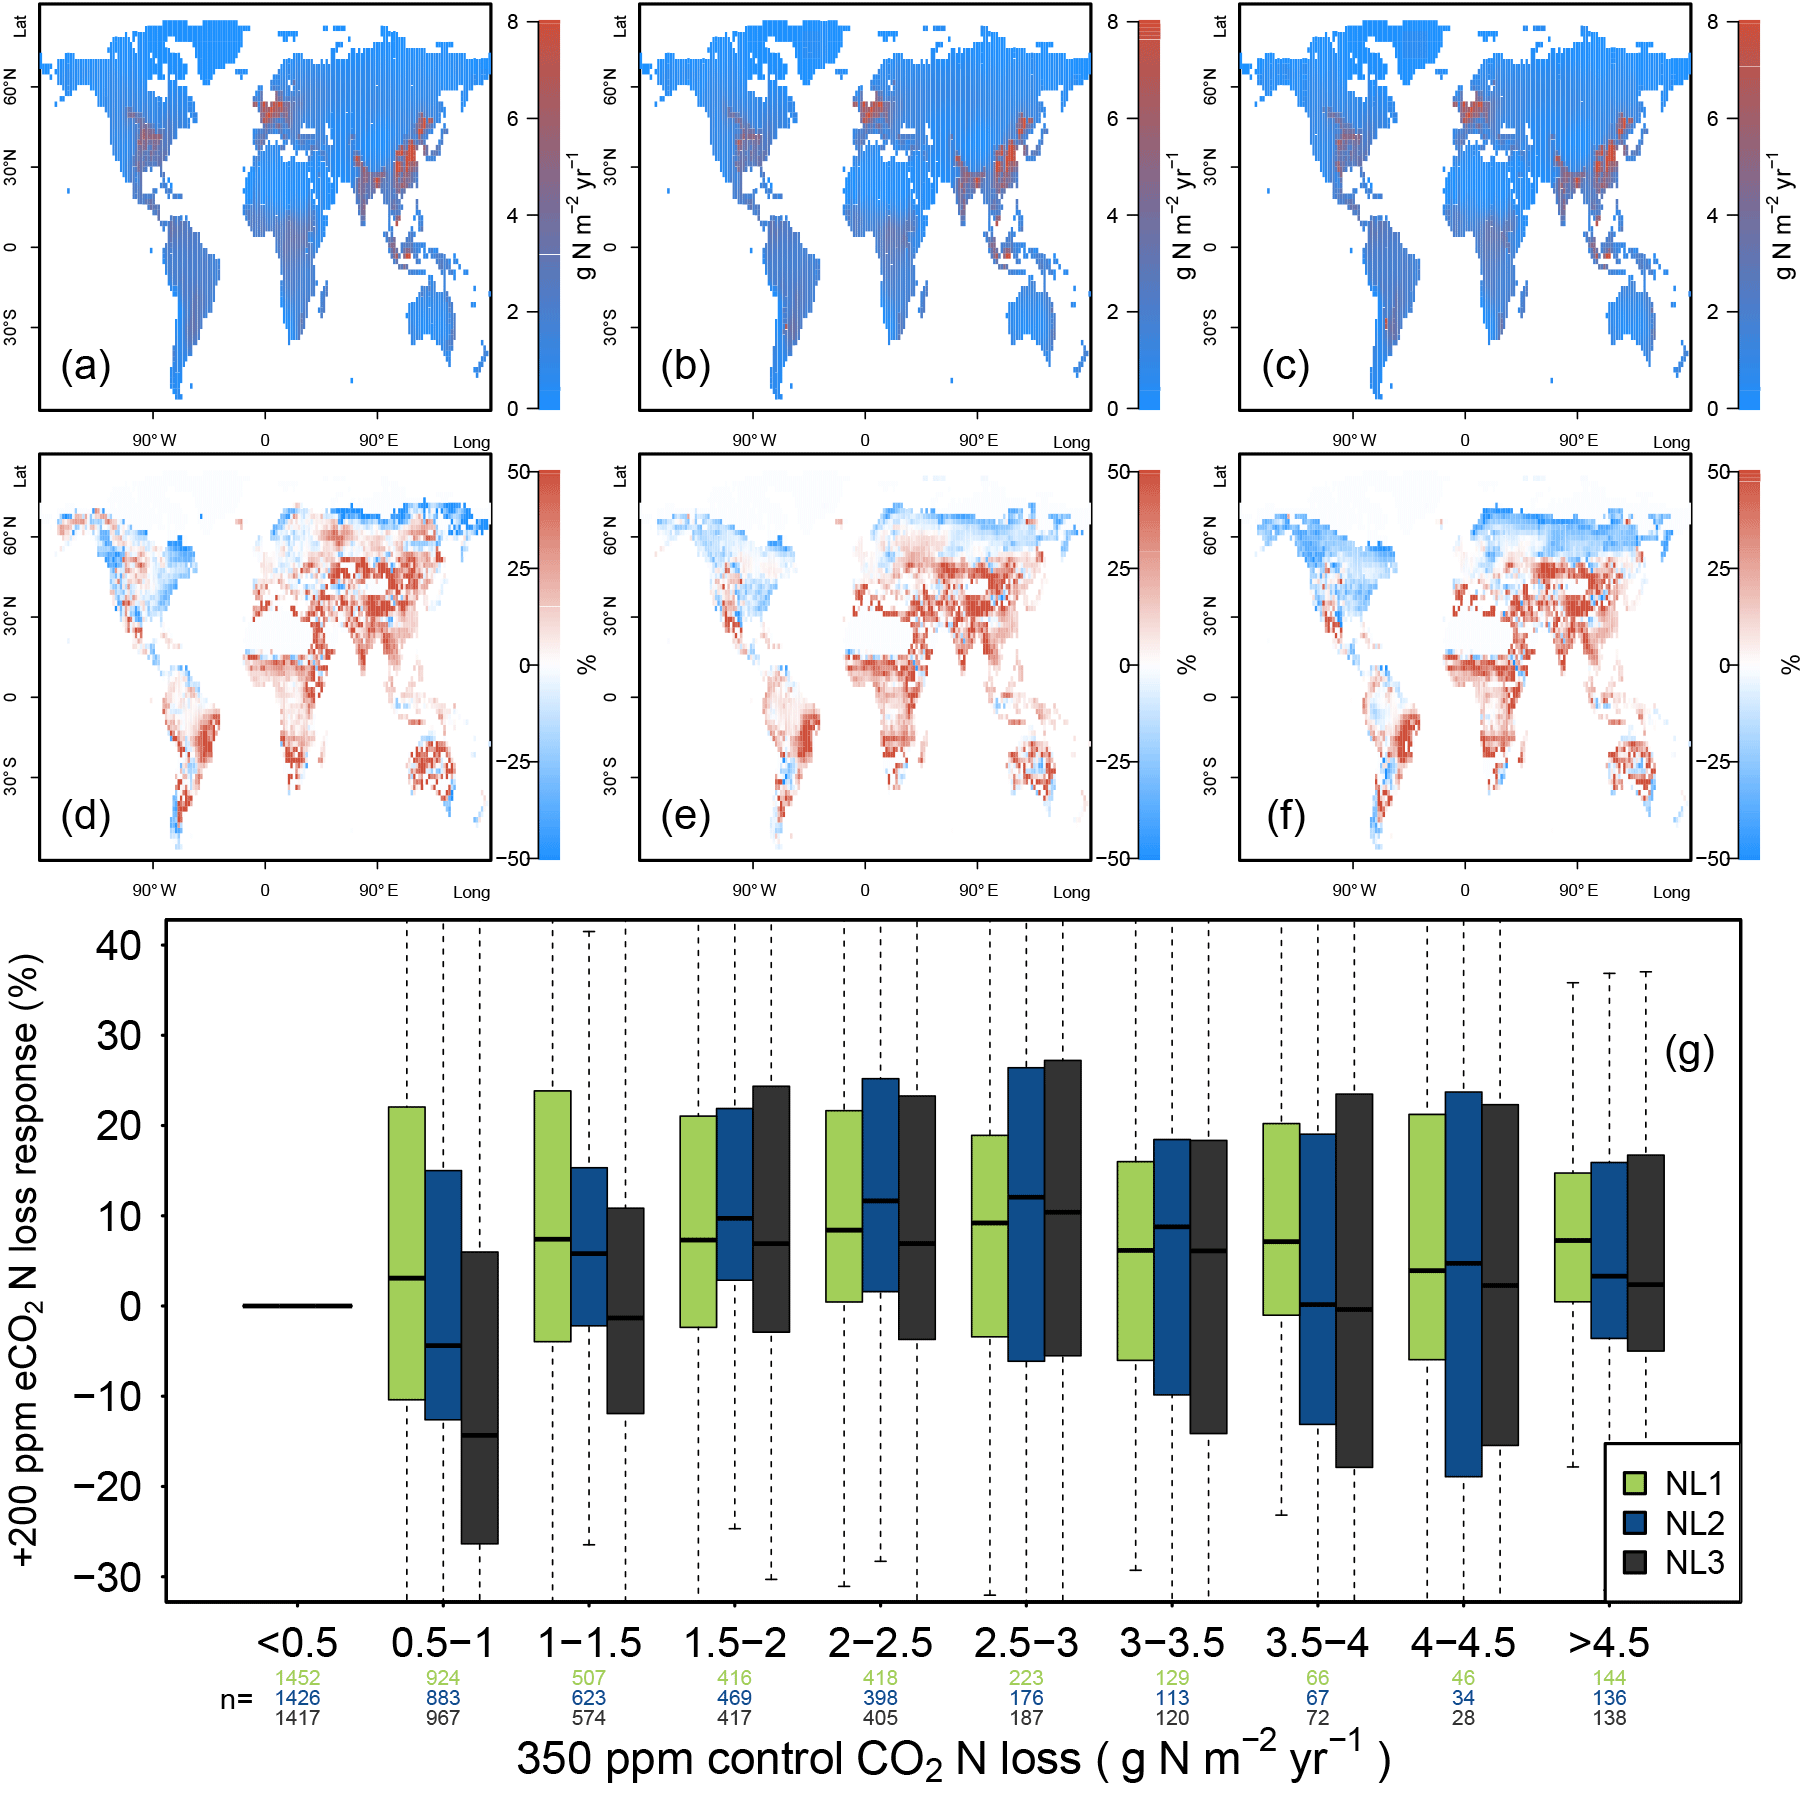
Figure A4(a, b, c) Global nitrogen (N) loss rates (g N m−2 yr−1) for the control runs (350 ppm atmospheric CO2 concentration), using the N loss algorithms NL1 (a), NL2 (b), and NL3 (c). (d, e, f) Global N loss responses (%) to elevated atmospheric CO2 concentrations (eCO2, +200 ppm). (g) Global response ratios (%) plotted against the corresponding control N loss rates, binned in intervals of 0.5 g N m−2 yr−1. Boxes show median and quartiles; whiskers show the largest/smallest outliers that lie below/above 1.5 times the interquartile range. Further outliers were omitted. Coloured numbers indicate the number of grid cells that fell into the respective N loss range. The 350–550 ppm difference in atmospheric CO2 concentrations approximately corresponded to the 1988–2052 time span in our global simulations. The difference to Fig. 4 was that these simulations also included transient climate and N deposition rates according to the RCP 8.5 scenario.
B1 Gaseous nitrogen losses
NL1 includes the adsorption of ammonium () ions to clay particles, following Li et al. (1992). Thereby, the fraction of the soil pool of available inorganic nitrogen (N) is first reduced according to the soil clay content. The anaerobic volume fraction of the soil (anvf; Eq. B1) is estimated from the fractional soil moisture content (θ) by an empirical function:
In the aerobic part of the soil (1−anvf), the fraction of ammonium (NH4, aerob) is subject to nitrification, with the gross rate (Nnit; Eq. B2) depending on concentrations, as well as response functions for temperature (fnit(T)) and soil pH (gnit(pH)):
where α is chosen such that at 20 ∘C and favourable pH conditions, 10 % of the ammonium is nitrified per day. The temperature function (Eq. B3) is taken from Xu-Ri and Prentice (2008):
where Tsoil is the soil temperature in ∘C. The soil pH function (Eq. B4) is taken from Zhang et al. (2002):
N2O loss from nitrification (N2Onit; Eq. B5) is estimated from the gross nitrification rate (Li et al., 2000):
where fT (Eq. B6) is another temperature function:
Loss of NO from nitrification (Eq. B7) follows the formulation by Li et al. (2000) with an additional component representing chemonitrification following Kesik et al. (2005):
with functions representing the temperature (Eq. B8) and pH (Eq. B9) sensitivity of chemonitrification:
Gross denitrification (Ndenit; Eq. B10) of the fraction of under anaerobic conditions (NO3,anaerob) is modelled as a function of the concentration, microbial respiration, temperature and pH:
where β (Eq. B11) is a function that describes the regulatory influence of soil microbial activity and concentrations on gross denitrification (Li et al., 2000):
where Rmb is the microbial respiration rate, NO3 is the soil concentration (aerobic and anaerobic), and KR and are half-saturation constants. The temperature sensitivity of denitrification (fdenit(T); Eq. B12) is taken from Xu-Ri and Prentice (2008):
The sensitivity of denitrification to soil pH is described by gdenit(pH) (Eq. B13):
Gaseous N losses from denitrification (NOdenit, Eq. B14; N2Odenit, Eq. B15; N2,denit, Eq. B16) are then estimated from the gross denitrification rate, taking into account the different sensitivities to soil pH for the respective proportions of emissions of NO, N2O, and N2 (Li et al., 2000):
where βNO and are constants and gdenit,NO (Eq. B17) and (Eq. B18) are functions that scale emission of different gaseous N compounds with soil pH:
with the NO- and N2O-specific functions hNO (Eq. B19) and (Eq. B20):
The volatilization of dissolved to NH3 (NH3,vol; Eq. B21) depends on soil pH:
with the diffusion coefficient dox that depends on soil moisture and also determines volatilization losses from the soil N pool of other N gases:
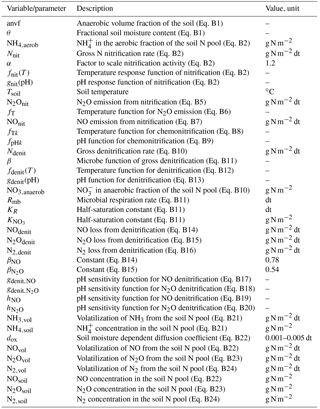
Table B1List of variables and parameters used in nitrogen (N) loss algorithm NL1. : ammonium; N2O: nitrous oxide; NO: nitric oxide; : nitrate; NH3: ammonia; N2: dinitrogen; dt: time step.
B2 Nitrogen leaching
Leaching of and occurs in proportion to the water lost from soil drainage, calculated as described by De Rosnay and Polcher (1998).
The implementation of plant N uptake in O–CN (Zaehle and Friend, 2010) considers N uptake per root mass via a low and high affinity transporter system that responds to temperature and inorganic N availability. Plant N uptake (Nup, g N m−2 dt) is assumed to be proportional to fine root mass (Croot, g C m−2; increases with N limitation), plant N status (f(NCplant)) to represent the effect of inducible N uptake, soil mineral N availability (Nmin, g N m−2), and soil temperature (f(T)):
The parameters vmax (µg N g−1 C dt), (m2 g−1 N), and (g N m−2) characterize N uptake as saturating, although this effect is attenuated at high soil N concentrations by a linear dependency on Nmin. The linear dependency on the plants' mobile N concentration (f(NCplant)) is included to represent increased N uptake in N-starved roots. NCplant is the mean N fraction of foliage, fine roots, and labile pools, representing the active and easily translocatable portion of plant N,
and the functional dependency of N uptake on NCplant is
where the minimum (ncleaf,min) and maximum (ncleaf,max) foliage N concentrations are specific to the simulated plant type, derived from the TRY database (Kattge et al., 2011). Eq. (C3) was formulated to range from zero to one as NCplant approaches minimum and maximum foliage N concentrations.
JM and SZ designed the study. JM and SZ set up the simulations. JM ran the local experiments and SZ ran the global experiments. JM and SZ analyzed the results. JM wrote the manuscript.
Sönke Zaehle is an associate editor for Biogeosciences.
This work was supported by Microsoft Research through its PhD Scholarship
Programme and the European Research Council (ERC) under the European Union's
Horizon 2020 research and innovation programme (QUINCY; grant no.
647204).
The article processing charges for
this open-access
publication were covered by the Max Planck
Society.
Edited by: Fortunat
Joos
Reviewed by: three anonymous referees
Aber, J. D., Nadelhoffer, K. J., Steudler, P., and Melillo, J. M.: Nitrogen saturation in northern forest ecosystems, Bioscience, 39, 378–386, https://doi.org/10.2307/1311067, 1989.
Aber, J. D., Ollinger, S. V., Driscoll, C. T., Likens, G. E., Holmes, R. T., Freuder, R. J., and Goodale, C. L.: Inorganic nitrogen losses from a forested ecosystem in response to physical, chemical, biotic, and climatic perturbations, Ecosystems, 5, 648–658, https://doi.org/10.1007/s10021-002-0203-2, 2002.
Bonan, G. B.: Forests and climate change: forcings, feedbacks, and the climate benefits of forests, Science, 320, 1444–1449, https://doi.org/10.1126/science.1155121, 2008.
Bouwman, A. F., Beusen, A. H., Griffioen, J., Van Groenigen, J. W., Hefting, M. M., Oenema, O., Van Puijenbroek, P. J., Seitzinger, S., Slomp, C. P., and Stehfest, E.: Global trends and uncertainties in terrestrial denitrification and N2O emissions, Philos. T. R. Soc. B, 368, 20130112, https://doi.org/10.1098/rstb.2013.0112, 2013.
Boyer, E. W., Alexander, R. B., Parton, W. J., Li, C., Butterbach-Bahl, K., Donner, S. D., Skaggs, R. W., and Del Grosso, S. J.: Modeling Denitrification in Terrestrial and Aquatic Ecosystems at Regional Scales, Ecol. Appl., 16, 2123–2142, https://doi.org/10.1890/1051-0761(2006)016[2123:MDITAA]2.0.CO;2, 2006.
Braakhekke, M. C., Rebel, K. T., Dekker, S. C., Smith, B., Beusen, A. H. W., and Wassen, M. J.: Nitrogen leaching from natural ecosystems under global change: a modelling study, Earth Syst. Dynam., 8, 1121–1139, https://doi.org/10.5194/esd-8-1121-2017, 2017.
Butterbach-Bahl, K. and Dannenmann, M.: Denitrification and associated soil N2O emissions due to agricultural activities in a changing climate, Curr. Opin. Env. Sust., 3, 389–395, https://doi.org/10.1016/j.cosust.2011.08.004, 2011.
de Rosnay, P. and Polcher, J.: Modelling root water uptake in a complex land surface scheme coupled to a GCM, Hydrol. Earth Syst. Sci., 2, 239-255, https://doi.org/10.5194/hess-2-239-1998, 1998.
Di, H. J. and Cameron, K. C.: Nitrate leaching in temperate agroecosystems: sources, factors and mitigating strategies, Nutr. Cycl. Agroecosys., 46, 237–256, https://doi.org/10.1023/A:1021471531188, 2002.
Dijkstra, F. A., Prior, S. A., Runion, G. B., Torbert, H. A., Tian, H., Lu, C., and Venterea, R. T.: Effects of elevated carbon dioxide and increased temperature on methane and nitrous oxide fluxes: evidence from field experiments, Front. Ecol. Environ., 10, 520–527, https://doi.org/10.1890/120059, 2012.
Dufresne, J. L., Foujols, M. A., Denvil, S., Caubel, A., Marti, O., Aumont, O., Balkanski, Y., Bekki, S., Bellenger, H., Benshila, R., Bony, S., Bopp, L., Braconnot, P., Brockmann, P., Cadule, P., Cheruy, F., Codron, F., Cozic, A., Cugnet, D., Noblet, N., Duvel, J. P., Ethé, C., Fairhead, L., Fichefet, T., Flavoni, S., Friedlingstein, P., Grandpeix, J. Y., Guez, L., Guilyardi, E., Hauglustaine, D., Hourdin, F., Idelkadi, A., Ghattas, J., Joussaume, S., Kageyama, M., Krinner, G., Labetoulle, S., Lahellec, A., Lefebvre, M. P., Lefevre, F., Levy, C., Li, Z. X., Lloyd, J., Lott, F., Madec, G., Mancip, M., Marchand, M., Masson, S., Meurdesoif, Y., Mignot, J., Musat, I., Parouty, S., Polcher, J., Rio, C., Schulz, M., Swingedouw, D., Szopa, S., Talandier, C., Terray, P., Viovy, N., and Vuichard, N.: Climate change projections using the IPSL-CM5 Earth system model: from CMIP3 to CMIP5, Clim. Dynam., 40, 2123–2165, https://doi.org/10.1007/s00382-012-1636-1, 2013.
Fang, Y., Koba, K., Makabe, A., Takahashi, C., Zhu, W., Hayashi, T., Hokari, A. A., Urakawa, R., Bai, E., Houlton, B. Z., Xi, D., Zhang, S., Matsushita, K., Tu, Y., Liu, D., Zhu, F., Wang, Z., Zhou, G., Chen, D., Makita, T., Toda, H., Liu, X., Chen, Q., Zhang, D., Li, Y., and Yoh, M.: Microbial denitrification dominates nitrate losses from forest ecosystems, P. Natl. Acad. Sci. USA, 112, 1470–1474, https://doi.org/10.1073/pnas.1416776112, 2015.
Fernández-Martinez, M., Vicca, S., Janssens, I. A., Sardans, J., Luyssaert, S., Campioli, M., Chapin III, F. S., Ciais, P., Malhi, Y., Obersteiner, M., Papale, D., Piao, S. L., Reichstein, M., Rodà, F., and Penuelas, J.: Nutrient availability as the key regulator of global forest carbon balance, Nat. Clim. Change, 4, 471–476, https://doi.org/10.1038/nclimate2177, 2014.
Firestone, M. and Davidson, E.: Microbial basis of NO and N2O production and consumption, in: Exchange of trace gases between terrestrial ecosystems and the atmosphere, edited by: Andreae, M. O. and Schimel, D. S., John Wiley, New York, 1989.
Freney, J. R., Simpson, J. R., and Denmead, O. T.: Volatilization of ammonia, in: Gaseous loss of nitrogen from plant-soil systems, edited by: Freney, J. R. and Simpson, J. R., Springer, Dordrecht, 1983.
Gerber, S., Hedin, L. O., Oppenheimer, M., Pacala, S. W., and Shevliakova, E.: Nitrogen cycling and feedbacks in a global dynamic land model, Global Biogeochem. Cy., 24, GB1001, https://doi.org/10.1029/2008gb003336, 2010.
Goll, D. S., Brovkin, V., Parida, B. R., Reick, C. H., Kattge, J., Reich, P. B., van Bodegom, P. M., and Niinemets, Ü.: Nutrient limitation reduces land carbon uptake in simulations with a model of combined carbon, nitrogen and phosphorus cycling, Biogeosciences, 9, 3547–3569, https://doi.org/10.5194/bg-9-3547-2012, 2012.
Gruber, N. and Galloway, J. N.: An Earth-system perspective of the global nitrogen cycle, Nature, 451, 293–296, https://doi.org/10.1038/nature06592, 2008.
Hempel, S., Frieler, K., Warszawski, L., Schewe, J., and Piontek, F.: A trend-preserving bias correction – the ISI-MIP approach, Earth Syst. Dynam., 4, 219–236, https://doi.org/10.5194/esd-4-219-2013, 2013.
Huang, Y. and Gerber, S.: Global soil nitrous oxide emissions in a dynamic carbon-nitrogen model, Biogeosciences, 12, 6405–6427, https://doi.org/10.5194/bg-12-6405-2015, 2015.
Hungate, B., Dukes, J. S., Shaw, M. R., Luo, Y. Q., and Field, C. B.: Nitrogen and Climate Change, Science, 302, 1512–1513, https://doi.org/10.1126/science.1091390, 2003.
Hurtt, G. C., Frolking, S., Fearon, M. G., Moore, B., Shevliakova, E., Malyshev, S., Pacala, S. W., and Houghton, R. A.: The underpinnings of land-use history: three centuries of global gridded land-use transitions, wood-harvest activity, and resulting secondary lands, Glob. Change Biol., 12, 1208–1229, https://doi.org/10.1111/j.1365-2486.2006.01150.x, 2006.
Kattge, J., Díaz, S., Lavorel, S., Prentice, I. C., Leadley, P., Bönisch, G., Garnier, E., Westoby, M., Reich, P. B., Wright, I. J., Cornelissen, J. H. C., Violle, C., Harrison, S. P., Van Bodegom, P. M., Reichstein, M., Enquist, B. J., Soudzilovskaia, N. A., Ackerly, D. D., Anand, M., Atkin, O., Bahn, M., Baker, T. R., Baldocchi, D., Bekker, R., Blanco, C. C., Blonder, B., Bond, W. J., Bradstock, R., Bunker, D. E., Casanoves, F., Cavender-Bares, J., Chambers, J. Q., Chapin III, F. S., Chave, J., Coomes, D., Cornwell, W. K., Craine, J. M., Dobrin, B. H., Duarte, L., Durka, W., Elser, J., Esser, G., Estiarte, M., Fagan, W. F., Fang, J., Fernández-Méndez, F., Fidelis, A., Finegan, B., Flores, O., Ford, H., Frank, D., Freschet, G. T., Fyllas, N. M., Gallagher, R. V., Green, W. A., Gutierrez, A. G., Hickler, T., Higgins, S. I., Hodgson, J. G., Jalili, A., Jansen, S., Joly, C. A., Kerkhoff, A. J., Kirkup, D., Kitajima, K., Kleyer, M., Klotz, S., Knops, J. M. H., Kramer, K., Kühn, I., Kurokawa, H., Laughlin, D., Lee, T. D., Leishman, M., Lens, F., Lenz, T., Lewis, S. L., Lloyd, J., Llusià, J., Louault, F., Ma, S., Mahecha, M. D., Manning, P., Massad, T., Medlyn, B. E., Messier, J., Moles, A. T., Müller, S. C., Nadrowski, K., Naeem, S., Niinemets, Ü., Nöllert, S., Nüske, A., Ogaya, R., Oleksyn, J., Onipchenko, V. G., Onoda, Y., Ordoñez, J., Overbeck, G., Ozinga, W. A., Patiño, S., Paula, S., Pausas, J. G., Peñuelas, J., Phillips, O. L., Pillar, V., Poorter, H., Poorter, L., Poschlod, P., Prinzing, A., Proulx, R., Rammig, A., Reinsch, S., Reu, B., Sack, L., Salgado-Negret, B., Sardans, J., Shiodera, S., Shipley, B., Siefert, A., Sosinski, E., Soussana, J. F., Swaine, E., Swenson, N., Thompson, K., Thornton, P., Waldram, M., Weiher, E., White, M., White, S., Wright, S. J., Yguel, B., Zaehle, S., Zanne, A. E., and Wirth, C.: TRY – a global database of plant traits, Glob. Change Biol., 17, 2905–2935, https://doi.org/10.1111/j.1365-2486.2011.02451.x, 2011.
Kesik, M., Ambus, P., Baritz, R., Brüggemann, N., Butterbach-Bahl, K., Damm, M., Duyzer, J., Horváth, L., Kiese, R., Kitzler, B., Leip, A., Li, C., Pihlatie, M., Pilegaard, K., Seufert, S., Simpson, D., Skiba, U., Smiatek, G., Vesala, T., and Zechmeister-Boltenstern, S.: Inventories of N2O and NO emissions from European forest soils, Biogeosciences, 2, 353–375, https://doi.org/10.5194/bg-2-353-2005, 2005.
Kowalenko, C. G. and Cameron, D. R.: Nitrogen transformations in an incubated soil as affected by combinations of moisture content and temperature and adsorption-fixation of ammonium, Can. J. Soil Sci., 56, 63–70, https://doi.org/10.4141/cjss76-010, 1976.
Jones, C., Robertson, E., Arora, V., Friedlingstein, P., Shevliakova, E., Bopp, L., Brovkin, V., Hajima, T., Kato, E., Kawamiya, M., Liddicoat, S., Lindsay, K., Reick, C. H., Roelandt, C., Segschneider, J., and Tjiputra, J.: Twenty-first-century compatible CO2 emissions and airborne fraction simulated by CMIP5 Earth system models under four representative concentration pathways, J. Climate, 26, 4398–4413, https://doi.org/10.1175/jcli-d-12-00554.1, 2013.
Jung, M., Henkel, K., Herold, M., and Churkina, G.: Exploiting synergies of global land cover products for carbon cycle modeling, Remote Sens. Environ., 101, 534–553, https://doi.org/10.1016/j.rse.2006.01.020, 2006.
Lamarque, J.-F., Bond, T. C., Eyring, V., Granier, C., Heil, A., Klimont, Z., Lee, D., Liousse, C., Mieville, A., Owen, B., Schultz, M. G., Shindell, D., Smith, S. J., Stehfest, E., Van Aardenne, J., Cooper, O. R., Kainuma, M., Mahowald, N., McConnell, J. R., Naik, V., Riahi, K., and van Vuuren, D. P.: Historical (1850–2000) gridded anthropogenic and biomass burning emissions of reactive gases and aerosols: methodology and application, Atmos. Chem. Phys., 10, 7017–7039, https://doi.org/10.5194/acp-10-7017-2010, 2010.
Le Quéré, C., Andrew, R. M., Canadell, J. G., Sitch, S., Korsbakken, J. I., Peters, G. P., Manning, A. C., Boden, T. A., Tans, P. P., Houghton, R. A., Keeling, R. F., Alin, S., Andrews, O. D., Anthoni, P., Barbero, L., Bopp, L., Chevallier, F., Chini, L. P., Ciais, P., Currie, K., Delire, C., Doney, S. C., Friedlingstein, P., Gkritzalis, T., Harris, I., Hauck, J., Haverd, V., Hoppema, M., Klein Goldewijk, K., Jain, A. K., Kato, E., Körtzinger, A., Landschützer, P., Lefèvre, N., Lenton, A., Lienert, S., Lombardozzi, D., Melton, J. R., Metzl, N., Millero, F., Monteiro, P. M. S., Munro, D. R., Nabel, J. E. M. S., Nakaoka, S.-I., O'Brien, K., Olsen, A., Omar, A. M., Ono, T., Pierrot, D., Poulter, B., Rödenbeck, C., Salisbury, J., Schuster, U., Schwinger, J., Séférian, R., Skjelvan, I., Stocker, B. D., Sutton, A. J., Takahashi, T., Tian, H., Tilbrook, B., van der Laan-Luijkx, I. T., van der Werf, G. R., Viovy, N., Walker, A. P., Wiltshire, A. J., and Zaehle, S.: Global Carbon Budget 2016, Earth Syst. Sci. Data, 8, 605–649, https://doi.org/10.5194/essd-8-605-2016, 2016.
Li, C., Frolking, S., and Frolking, T. A.: A model of nitrous oxide evolution from soil driven by rainfall events: 1. Model structure and sensitivity, J. Geophys. Res., 97, 9759–9776, https://doi.org/10.1029/92JD00509, 1992.
Li, C., Aber, J., Stange, F., Butterbach-Bahl, K., and Papen, H.: A process-oriented model of N2O and NO emissions from forest soils: 1. Model development, J. Geophys. Res., 105, 4369–4384, https://doi.org/10.1029/1999jd900949, 2000.
Luo, Y., Su, B. O., Currie, W. S., Dukes, J. S., Finzi, A., Hartwig, U., Hungate, B., Murtrie, R. E. M., Oren, R. A. M., Parton, W. J., Pataki, D. E., Shaw, M. R., Zak, D. R., and Field, C. B.: Progressive Nitrogen Limitation of Ecosystem Responses to Rising Atmospheric Carbon Dioxide, Bioscience, 54, 731–739, https://doi.org/10.1641/0006-3568(2004)054[0731:PNLOER]2.0.CO;2, 2004.
Matschonat, G. and Matzner, E.: Soil chemical properties affecting sorption in forest soils, Z. Pflanz. Bodenkunde, 159, 505–511, https://doi.org/10.1002/jpln.1996.3581590514, 1996.
Meinshausen, M., Smith, S. J., Calvin, K., Daniel, J. S., Kainuma, M. L. T., Lamarque, J. F., Matsumoto, K., Montzka, S. A., Raper, S. C. B., Riahi, K., Thomson, A., Velders, G. J. M., and van Vuuren, D. P. P.: The RCP greenhouse gas concentrations and their extensions from 1765 to 2300, Climatic Change, 109, 213–241, https://doi.org/10.1007/s10584-011-0156-z, 2011.
Meyerholt, J. and Zaehle, S.: The role of stoichiometric flexibility in modelling forest ecosystem responses to nitrogen fertilization, New Phytol., 208, 1042–1055, https://doi.org/10.1111/nph.13547, 2015.
Meyerholt, J., Zaehle, S., and Smith, M. J.: Variability of projected terrestrial biosphere responses to elevated levels of atmospheric CO2 due to uncertainty in biological nitrogen fixation, Biogeosciences, 13, 1491–1518, https://doi.org/10.5194/bg-13-1491-2016, 2016.
Perakis, S. S. and Hedin, L. O.: Nitrogen loss from unpolluted South American forests mainly via dissolved organic compounds, Nature, 415, 416–419, https://doi.org/10.1038/415416a, 2002.
Smith, B., Wårlind, D., Arneth, A., Hickler, T., Leadley, P., Siltberg, J., and Zaehle, S.: Implications of incorporating N cycling and N limitations on primary production in an individual-based dynamic vegetation model, Biogeosciences, 11, 2027–2054, https://doi.org/10.5194/bg-11-2027-2014, 2014.
Sokolov, A. P., Kicklighter, D. W., Melillo, J. M., Felzer, B. S., Schlosser, C. A., and Cronin, T. W.: Consequences of Considering Carbon–Nitrogen Interactions on the Feedbacks between Climate and the Terrestrial Carbon Cycle, J. Climate, 21, 3776–3796, https://doi.org/10.1175/2008jcli2038.1, 2008.
Thomas, R. Q., Zaehle, S., Templer, P. H., and Goodale, C. L.: Global patterns of nitrogen limitation: confronting two global biogeochemical models with observations, Glob. Change Biol., 19, 2986–2998, https://doi.org/10.1111/gcb.12281, 2013.
Thomas, R. Q., Brookshire, E. N., and Gerber, S.: Nitrogen limitation on land: how can it occur in Earth system models?, Glob. Change Biol., 21, 1777–1793, https://doi.org/10.1111/gcb.12813, 2015.
Thornton, P. E. and Rosenbloom, N. A.: Ecosystem model spin-up: Estimating steady state conditions in a coupled terrestrial carbon and nitrogen cycle model, Ecol. Model., 189, 25–48, https://doi.org/10.1016/j.ecolmodel.2005.04.008, 2005.
Thornton, P. E., Lamarque, J.-F., Rosenbloom, N. A., and Mahowald, N. M.: Influence of carbon-nitrogen cycle coupling on land model response to CO2 fertilization and climate variability, Global Biogeochem. Cy., 21, GB4018, https://doi.org/10.1029/2006gb002868, 2007.
Thornton, P. E., Doney, S. C., Lindsay, K., Moore, J. K., Mahowald, N., Randerson, J. T., Fung, I., Lamarque, J.-F., Feddema, J. J., and Lee, Y.-H.: Carbon-nitrogen interactions regulate climate-carbon cycle feedbacks: results from an atmosphere-ocean general circulation model, Biogeosciences, 6, 2099–2120, https://doi.org/10.5194/bg-6-2099-2009, 2009.
Tian, H., Yang, J., Lu, C., Xu, R., Canadell, J. G., Jackson, R., Arneth, A., Chang, J., Chen, G., Ciais, P., Gerber, S., Ito, A., Huang, Y., Joos, F., Lienert, S., Messina, P., Olin, S., Pan, S., Peng, C., Saikawa, E., Thompson, R. L., Vuichard, N., Winiwarter, W., Zaehle, S., Zhang, B., Zhang, K., and Zhu, Q.: The global N2O Model Intercomparison Project (NMIP): Objectives, Simulation Protocol and Expected Products, B. Am. Meteorol. Soc., 99, 1231–1251, https://doi.org/10.1175/bams-d-17-0212.1, 2018.
van Groenigen, K. J., Osenberg, C. W., and Hungate, B. A.: Increased soil emissions of potent greenhouse gases under increased atmospheric CO2, Nature, 475, 214–216, https://doi.org/10.1038/nature10176, 2011.
Vitousek, P. M. and Howarth, R. W.: Nitrogen limitation on land and in the sea: How can it occur?, Biogeochemistry, 13, 87–115, https://doi.org/10.1007/bf00002772, 1991.
Viovy, N.: CRUNCEP data set, available at: ftp://nacp.ornl.gov/synthesis/2009/frescati/temp/land_use_change/original/readme.htm (last access: June 2016), 2016.
Walker, A. P., Zaehle, S., Medlyn, B. E., De Kauwe, M. G., Asao, S., Hickler, T., Parton, W., Ricciuto, D. M., Wang, Y.-P., Wårlind, D., and Norby, R. J.: Predicting long-term carbon sequestration in response to CO2 enrichment: How and why do current ecosystem models differ?, Global Biogeochem. Cy., 29, 476–495, https://doi.org/10.1002/2014gb004995, 2015.
Wang, Y. P., Law, R. M., and Pak, B.: A global model of carbon, nitrogen and phosphorus cycles for the terrestrial biosphere, Biogeosciences, 7, 2261–2282, https://doi.org/10.5194/bg-7-2261-2010, 2010.
Wania, R., Meissner, K. J., Eby, M., Arora, V. K., Ross, I., and Weaver, A. J.: Carbon-nitrogen feedbacks in the UVic ESCM, Geosci. Model Dev., 5, 1137–1160, https://doi.org/10.5194/gmd-5-1137-2012, 2012.
Wieder, W. R., Cleveland, C. C., Lawrence, D. M., and Bonan, G. B.: Effects of model structural uncertainty on carbon cycle projections: biological nitrogen fixation as a case study, Environ. Res. Lett., 10, 044016, https://doi.org/10.1088/1748-9326/10/4/044016, 2015.
Xu-Ri and Prentice, I. C.: Terrestrial nitrogen cycle simulation with a dynamic global vegetation model, Glob. Change Biol., 14, 1745–1764, https://doi.org/10.1111/j.1365-2486.2008.01625.x, 2008.
Yang, X., Wittig, V., Jain, A. K., and Post, W.: Integration of nitrogen cycle dynamics into the Integrated Science Assessment Model for the study of terrestrial ecosystem responses to global change, Global Biogeochem. Cy., 23, GB4029, https://doi.org/10.1029/2009gb003474, 2009.
Zaehle, S. and Friend, A. D.: Carbon and nitrogen cycle dynamics in the O-CN land surface model: 1. Model description, site-scale evaluation, and sensitivity to parameter estimates, Global Biogeochem. Cy., 24, GB1005, https://doi.org/10.1029/2009gb003521, 2010.
Zaehle, S. and Dalmonech, D.: Carbon–nitrogen interactions on land at global scales: current understanding in modelling climate biosphere feedbacks, Curr. Opin. Env. Sust., 3, 311–320, https://doi.org/10.1016/j.cosust.2011.08.008, 2011.
Zaehle, S., Friedlingstein, P., and Friend, A. D.: Terrestrial nitrogen feedbacks may accelerate future climate change, Geophys. Res. Lett., 37, L01401, https://doi.org/10.1029/2009gl041345, 2010a.
Zaehle, S., Friend, A. D., Friedlingstein, P., Dentener, F., Peylin, P., and Schulz, M.: Carbon and nitrogen cycle dynamics in the O-CN land surface model: 2. Role of the nitrogen cycle in the historical terrestrial carbon balance, Global Biogeochem. Cy., 24, GB1006, https://doi.org/10.1029/2009gb003522, 2010b.
Zaehle, S., Ciais, P., Friend, A. D., and Prieur, V.: Carbon benefits of anthropogenic reactive nitrogen offset by nitrous oxide emissions, Nat. Geosci., 4, 601–605, https://doi.org/10.1038/ngeo1207, 2011.
Zaehle, S., Medlyn, B. E., De Kauwe, M. G., Walker, A. P., Dietze, M. C., Hickler, T., Luo, Y., Wang, Y. P., El-Masri, B., Thornton, P., Jain, A., Wang, S., Warlind, D., Weng, E., Parton, W., Iversen, C. M., Gallet-Budynek, A., McCarthy, H., Finzi, A., Hanson, P. J., Prentice, I. C., Oren, R., and Norby, R. J.: Evaluation of 11 terrestrial carbon-nitrogen cycle models against observations from two temperate Free-Air CO2 Enrichment studies, New Phytol., 202, 803–822, https://doi.org/10.1111/nph.12697, 2014.
Zhang, Y., Li, C., Zhou, X., and Moore III, B.: A simulation model linking crop growth and soil biogeochemistry for sustainable agriculture, Ecol. Model., 151, 75–108, https://doi.org/10.1016/S0304-3800(01)00527-0, 2002.