the Creative Commons Attribution 4.0 License.
the Creative Commons Attribution 4.0 License.
 | 18 Oct 2018
Nitrogen and oxygen availabilities control water column nitrous oxide production during seasonal anoxia in the Chesapeake Bay
Claudia Frey
Xin Sun
Melanie Jackson
Yea-Shine Lee
Amal Jayakumar
Jeffrey C. Cornwell
Bess B. Ward
Nitrous oxide (N2O) is a greenhouse gas and an ozone depletion agent. Estuaries that are subject to seasonal anoxia are generally regarded as N2O sources. However, insufficient understanding of the environmental controls on N2O production results in large uncertainty about the estuarine contribution to the global N2O budget. Incubation experiments with nitrogen stable isotope tracer were used to investigate the geochemical factors controlling N2O production from denitrification in the Chesapeake Bay, the largest estuary in North America. The highest potential rates of water column N2O production via denitrification (7.5±1.2 nmol-N L−1 h−1) were detected during summer anoxia, during which oxidized nitrogen species (nitrate and nitrite) were absent from the water column. At the top of the anoxic layer, N2O production from denitrification was stimulated by addition of nitrate and nitrite. The relative contribution of nitrate and nitrite to N2O production was positively correlated with the ratio of nitrate to nitrite concentrations. Increased oxygen availability, up to 7 µmol L−1 oxygen, inhibited both N2O production and the reduction of nitrate to nitrite. In spring, high oxygen and low abundance of denitrifying microbes resulted in undetectable N2O production from denitrification. Thus, decreasing the nitrogen input into the Chesapeake Bay has two potential impacts on the N2O production: a lower availability of nitrogen substrates may mitigate short-term N2O emissions during summer anoxia; and, in the long-run (timescale of years), eutrophication will be alleviated and subsequent reoxygenation of the bay will further inhibit N2O production.
- Article
(3868 KB) - Full-text XML
-
Supplement
(53 KB) - BibTeX
- EndNote


Nitrous oxide (N2O) is a strong greenhouse gas with 298-fold higher global warming potential per mole than that of carbon dioxide. N2O is also a catalyst of ozone depletion in the stratosphere. Since the Industrial Revolution, the N2O atmospheric concentration has been increasing at an unprecedented rate, and the current concentration is the highest in the last 800 000 years of Earth's history (Schilt et al., 2010). The contribution of N2O emissions to global warming and ozone depletion will increase because N2O is not as strictly regulated as are CO2 and halocarbon compounds. With the successful mitigation of halocarbon compounds accomplished by the Montreal Protocol, N2O is likely to be the single most important anthropogenically emitted ozone-depleting agent in the 21st century (Ravishankara et al., 2009).
Microbial processes are responsible for the majority of N2O production, both in natural and anthropogenically impacted environments. These pathways include oxidative and reductive processes occurring at the full range of environmental oxygen concentrations. In the presence of oxygen, N2O can be produced as a byproduct during autotrophic aerobic ammonium () oxidation to nitrite () by bacteria (Arp and Stein, 2003) and archaea (Santoro et al., 2011). The production of N2O can also occur via reduction by nitrifying organisms, termed nitrifier denitrification. This process was demonstrated in cultures (Poth and Focht, 1985; Frame and Casciotti, 2010) and in the water column of the subtropical North Pacific Ocean (Wilson et al., 2014). Under low-oxygen and anoxic conditions, denitrifying bacteria produce N2O via enzyme-mediated heterotrophic denitrification, which consists of the stepwise reduction of nitrate (), and nitric oxide (NO), with organic matter as the electron donor. The nirS gene that encodes the genetic material for nitrite reductase (the enzyme mediating reduction to NO) is often used as a proxy for abundance and diversity of denitrifying bacteria and is the gene in the denitrification sequence that is most reliably associated with a complete denitrification pathway (Graf et al., 2014). N2O is not produced via anaerobic ammonium oxidation (anammox), another important nitrogen removal process in the natural environment (Kartal et al., 2011).
The increase in atmospheric N2O is attributed to intensification of human activities (e.g., fossil fuel combustion, fertilizer application, human and animal waste disposal), which alter the microbial nitrogen cycle in the biosphere. Increased nitrogen supply from fertilizer and atmospheric deposition causes increased N2O emission not only from agricultural land, but also in rivers, streams and coastal waters (Ciais et al., 2013; Thompson et al., 2014). Among these aquatic environments, intense N2O efflux originates from estuaries and associated river networks, which occupy 0.3 % of global waters (Dürr et al., 2011) but could contribute up to 10 % of anthropogenic fluxes (Seitzinger and Kroeze, 1998; Ciais et al., 2013). Being the largest estuary in North America, the Chesapeake Bay and its tributaries have experienced eutrophication and expansion of summertime anoxia due to increased population, expansion of industrialization and land use changes since the 18th century (Cooper and Brush, 1993; Boesch et al., 2001). The Chesapeake tributary is a source of N2O (indicated by surface N2O oversaturation) in the summertime between June and September (Elkins et al., 1978; Kaplan et al., 1978; McElroy et al., 1978). The summertime water column is characterized by strong oxygen gradients (equilibrium with atmosphere at the surface and complete anoxia below ∼10 m), depletion of and , and accumulation of in the deep water (Lee et al., 2015b). Increased microbial activities driving carbon assimilation and respiration have been demonstrated in the vicinity of the oxic–anoxic interface in the water column (Lee et al., 2015a). However, the N2O production pathway and the associated environmental controlling factors have not been investigated in the Chesapeake Bay.
Here we report a pilot study using nitrogen stable isotope (15N) incubation experiments to quantify N2O production rates and their dependence on the availabilities of oxygen, and in the Chesapeake Bay. Because seasonal anoxia occurs at the study site in the central region of the Chesapeake Bay, reductive pathways of N2O production (i.e., reduction of and ) are the main focus. Further understanding of the environmental controls on N2O production in estuaries will facilitate the design of effective environmental engineering projects to mitigate N2O emission.
2.1 Sample acquisition and processing
Sampling and incubation experiments were carried out on 19 July 2016, 17 November 2016 and 3 May 2017, corresponding to typical conditions of summer, autumn and spring, respectively. Samples were collected at 38.55∘ N, 76.43∘ W (bottom depth 26.5 m) close to the mouth of the Choptank River in the central region of the Chesapeake Bay. Conductivity–temperature–depth and dissolved oxygen ([O2]) were measured with a YSI sonde package (Model 600XLM with a 650 MDS display logger) equipped with a diaphragm pump which was deployed for water sampling. The oxygen sensor had a detection limit of ∼5 µmol L−1. Samples for and concentration measurements were filtered (0.22 µm pore size, Sterivex-GP, EMD Millipore) and frozen at −80 ∘C until analysis. Discrete samples for N2O concentration were collected directly from the pump outlet into the bottom of acid-washed, 60 mL glass serum bottles (catalog no. 223745, Wheaton, Millville, NJ, USA). Bottles were sealed with butyl rubber stoppers (catalog no. W224100-202, Wheaton, Millville, NJ, USA) and aluminium rings while submerged under water pumped from depth to avoid atmospheric N2O and oxygen contamination. Samples for characterizing the N2O concentration profile were preserved immediately after filling by injecting 0.1 mL saturated HgCl2. Samples for N2O incubation experiments (Sect. 2.2) were acquired from 12, 17 and 19.5 m during July 2016, November 2016 and May 2017, respectively; sealed the same way as described above for discrete N2O concentration samples; and stored in the dark at 4 ∘C without adding HgCl2. Samples for denitrifying nirS gene abundance were collected at 14, 17 and 19.5 m by filtering 600–2000 mL of water through a 0.22 µm filter (Sterivex-GP, EMD Millipore) and frozen at −80 ∘C until DNA extraction and analysis.
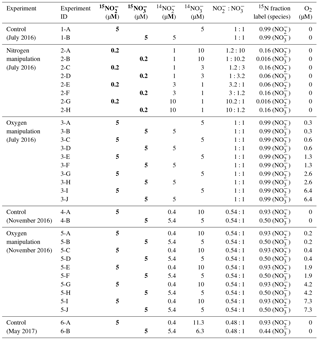
Table 1Parameters for control, nitrogen manipulation and oxygen manipulation incubation experiments in July 2016, November 2016 and May 2017 sampling. In May 2017, only the control experiment was conducted. The unit “µmol L−1” is represented by “µM”. Bold columns highlight the concentrations for 15N tracers. In situ nitrate and nitrite concentrations in July 2016 were <0.02 µmol L−1; in November 2016 the concentrations were 5.0 and 0.4 µmol L−1, respectively; in May 2017 the concentrations were 6.3 and 0.4 µmol L−1, respectively.
Samples for total dissolved inorganic carbon () and community respiration rates were collected only in July 2016. The DIC samples were preserved with mercuric chloride (HgCl2) for initial conditions, while biochemical oxygen demand (BOD) bottles were incubated in a temperature-controlled environmental chamber (±1 ∘C of in situ water temperatures). After 24 h, samples were siphoned from the vials, preserved with HgCl2, and respiration rates were determined as the difference in DIC between initial and final samples divided by 24 h (Lee et al., 2015b).
2.2 15N incubation experiments for N2O production
Within 3 h of sampling, incubation experiments were initiated at the Horn Point Laboratory, Cambridge, Maryland. Samples were divided into three sets for control, nitrogen manipulation and oxygen manipulation experiments.
Control experiment. The control experiment was conducted in July 2016, November 2016 and May 2017. A small (3 mL) headspace was created in the serum bottles, which were subsequently flushed with helium for 10 min to minimize oxygen contamination from sampling and transportation. Two suites of 15N tracer solutions ( plus , plus , 0.1 mL) were injected to achieve final concentrations of 5 µmol L−1 and (see conditions for experiment 1-A and 1-B, 4-A and 4-B, and 6-A and 6-B in Table 1). Tracer solutions were made from deionized water and were flushed with helium prior to addition to incubation experiments. In order to have enough mass to detect N2O production, ∼1.2 nmol of natural abundance N2O was injected to each bottle, reaching a concentration of ∼20 nmol L−1 in the water phase (calculated equilibrium concentration according to Weiss and Price, 1980, with 3 mL headspace and 57 mL water). Initial conditions (one bottle for each time course) were sampled within 30 min of tracer addition by injecting 0.1 mL saturated HgCl2. Incubations lasted ∼2 h at in situ temperature (±0.5 ∘C), during which duplicate bottles were preserved with a saturated HgCl2 solution every 40 to 60 min, totalling seven bottles over four time points, including the initial for a time course analysis.
Dissolved inorganic nitrogen (DIN) manipulation. The DIN manipulation experiment was conducted only in July 2016 because and were absent from the water column (see Sect. 3.1). A 3 mL headspace was created before flushing with helium for 10 min to establish anoxic condition. Then, ∼1.2 nmol N2O was injected to reach a concentration of ∼20 nmol L−1 in the water phase. Two suites of 15N tracer solutions ( plus , plus , 0.1 mL of total volume of tracer addition) were injected to designated bottles to achieve ratios of , 1:3, 3:1 and 10:1, with 15N fraction labeled between 0.016 and 0.16 (Table 1, experiment 2-A to 2-H). This allowed simultaneous detection of N2O production from and at different ratios of to concentration. Incubations lasted ∼2 h with the same sampling strategy as the control experiment.
Oxygen manipulation. The oxygen manipulation experiment was conducted in July 2016 and November 2016. Headspace (3–8 mL) was created before flushing with helium for 10 min. Oxygen-saturated site water was made by air equilibration at in situ temperature. To achieve different oxygen levels, 0.2, 0.5, 1.0, 2.0 or 5.0 mL of oxygen-saturated site water was injected. With a final volume of ∼3 mL of headspace during the course of the incubation, the oxygen concentrations in the water phase were 0.3 to 6.4 µmol L−1 in July 2016 (Table 1, experiment 3-A–3-J) and were 0.2 to 7.3 µmol L−1 in November 2016 (Table 1, experiment 5-A–5-J) after the calculated equilibration between headspace and water (Garcia and Gordon, 1992). In addition, an optical sensor was used to measure oxygen concentrations directly in a parallel experimental setup and the agreement between calculated target concentration and measured concentration was excellent (data not shown). After oxygen adjustment, ∼1.2 nmol N2O was injected into each bottle, and two suites of 15N tracer solutions ( plus , plus , 0.1 mL) were injected to achieve a final concentration of 5 µmol L−1 and . The 15N fraction for or during the incubation experiments is shown in Table 1. Incubations lasted ∼2 h with the same sampling strategy as the control experiment.
2.3 Analytical procedures
For water column nutrients, dissolved was measured using a colorimetric method (Hansen and Koroleff, 2007) and was measured using a hot (90 ∘C) acidified vanadium(III) reduction column coupled to a chemiluminescence NO∕NOx analyzer (Teledyne API, San Diego, CA, USA) (Garside, 1982; Braman and Hendrix, 1989). DIC was measured with an automated infrared analyzer (Apollo SciTech, Newark, DE, USA) as previously reported (Lee et al., 2015b). Preserved N2O samples were stored in the dark at room temperature (∼22 ∘C) for less than 3 weeks before analysis. Dissolved N2O was extracted by flushing with helium for 40 min at a rate of 37 mL min−1 (extraction efficiency 99±2 %) and subsequently cryo-trapped by liquid nitrogen and isolated from interfering compounds (H2O, CO2) by gas chromatography (Weigand et al., 2016). Pulses of purified N2O were injected into an isotope ratio mass spectrometer (Delta VPlus, Thermo Fisher Scientific, Waltham, MA) for mass (, 45, 46) and isotope ratio (, 46∕44) measurements. The amount of N2O was calibrated with standard N2O vials, which were made by injecting 1, 2 or 5 nmol N2O-N into 20 mL glass vials (catalog no. C4020-25, Thermo Fisher Scientific, Waltham, MA).
After N2O analysis, samples incubated with were also assayed for to determine rates of reduction. Two milliliters of each sample were transferred from the 60 mL serum bottle to a 20 mL glass vial and then flushed with helium for 10 min. Dissolved was converted to N2O using the acetic-acid-treated sodium azide solution for quantitative conversion (McIlvin and Altabet, 2005). Resulting N2O was measured for nitrogen isotope ratio (15N∕14N) so as to determine the 15N enrichment of .
For the analysis of nirS gene abundance, DNA extraction and qPCR for the nirS gene using SYBR Green were performed as previously described (Jayakumar et al., 2009, 2013). Extracted DNA was quantified using PicoGreen fluorescence (Molecular Probes, Eugene, OR) prior to the qPCR assay. Samples for qPCR were run in triplicates including a no-template control, a no-primer control and five different dilutions of a nirS standard. Threshold cycle (Ct) values were obtained using automatic analysis settings of the quantitative PCR and further used to calculate the gene copy numbers as described in Jayakumar et al. (2013).

Figure 1Depth profiles on three sampling dates – 19 July 2016 (filled square), 17 November 2016 (cross), 3 May 2017 (grey circle) – of (a) salinity, (b) temperature, (c) oxygen, (d) nitrous oxide, (e) nitrate and (f) nitrite. Analysis of nirS gene abundance (g) was only conducted at one depth, at which incubations were also performed, during each trip.
2.4 Data analysis
N2O concentration was calculated from the amount of N2O detected by mass spectrometry divided by the volume of water in the serum bottles. N2O production (R) was calculated from the progressive increase in 45N2O and 46N2O concentrations in each serum bottle over the time course experiments.
where d45N2O∕dt and d46N2O∕dt represent the production rates (nmol-N L−1 h−1) of mass 45 and 46 N2O during incubation. F represents the 15N fraction in the initial substrate ( or ). Rates were considered significant based on the linear regression of the time course data having p<0.05 (n=7, Student's t test). The detection limit for N2O production was 0.002 nmol-N L−1 h−1. The 15N incubation experiments can identify the pathway but cannot distinguish the relative contributions of two or more functioning microbial groups to a single N2O production pathway (i.e., N2O production via reduction by nitrifier denitrification and/or heterotrophic denitrification).
The rate of reduction to was calculated as
where represents the production rate of 15 (nmol-N L−1 h−1). F represents initial 15N enrichment of substrate . Rates were considered significant based on linear regression of the time course data having p<0.05 (Student's t test). The detection limit for production was 0.05 nmol-N L−1 h−1.
3.1 Water column features
The physical and chemical properties of the water column in the central Chesapeake Bay showed seasonal variation (Fig. 1). Temperature and salinity differed among the three seasons but were essentially constant in the top 7 m of the water column on the three sampling dates. In July, the water column was stratified because of lower salinity (∼16 PSU) and higher temperature (∼28.5 ∘C) in the top ∼10 m, resulting in a pronounced halocline and thermocline (Fig. 1a and b). Less pronounced stratification in May and November was due to a weaker temperature difference between the top 10 m and below. The July oxygen profile showed a significant concentration decrease between 3 and 10 m (Fig. 1c), with a sharp oxycline (∼30 µmol L−1 m−1). Below 10 m, the oxygen concentration was below detection of the sensor (∼5 µmol L−1) and was likely anoxic. The water samples were free of any hydrogen sulfide odor, so we conclude that sulfide was either absent or was present at a very low level (<1 µmol L−1). No anoxic layer was observed in May and November (Fig. 1c), and previous studies showed that the water column of the Chesapeake Bay was reoxygenated following summertime anoxia during winter and spring (Lee et al., 2015a).
The surface N2O saturation concentrations in July, November and May were 6.6, 10.4 and 12.0 nmol L−1, respectively. In July, N2O concentration was close to air-saturation level (6.6 nmol L−1) at the surface layer. In the low oxygen layer (below 12 m), N2O was apparently undersaturated (2.0–3.7 nmol L−1, 20 %–50 % air saturation, Fig. 1d). In November, the surface N2O concentration was slightly oversaturated (11.3 nmol L−1, 108 % air saturation). N2O concentrations at depth were oversaturated; the concentrations varied between 11.0 and 11.5 nmol L−1, corresponding to 109 %–115 % air saturation. In May, both the surface and water column N2O concentrations were air undersaturated; the surface concentration was 9.1 nmol L−1, 76 % air saturation; concentrations between 8 and 17 m ranged from 9.4 to 11.0 nmol L−1, corresponding to 82 %–97 % air saturation. As the surface and water column N2O saturation levels vary greatly between seasons, the assessment of the N2O dynamics of the Chesapeake Bay requires expanding the temporal and spatial coverage of the field sampling. In the following, we focus on N2O production and its environmental controlling factors.
The concentrations of and (Fig. 1e and f) in July were below 0.02 µmol L−1 within the sampling depth interval (top 17 m of water column). Measurable levels of and species were found in May and November. The surface concentrations of and in May were 20 and 0.5 µmol L−1, respectively; and the concentrations decreased with depth. In November, and were depleted at the surface (∼3 m) and their concentrations increased with depth; at 17 m the concentrations of and were 5.0 and 0.4 µmol L−1, respectively. The increase in water column and concentrations in May and November can be attributed to increased runoff from the anthropogenically influenced watershed. Water column depletion of and in the summer is the result of denitrification (Baird et al., 1995; Boynton et al., 1995), which indicates potential water column N2O production via denitrification (discussed in Sect. 3.2).
As a proxy for the size of the denitrifying community, the abundance of the nirS gene was (5.91±0.1) × 104 copy mL−1 at 14 m in July, which was the highest among the three sampling trips (Fig. 1g). The lowest nirS gene abundance (9.1±1.3) × 103 copy mL−1 was observed in May at 19.5 m. The abundance of nirS was measured only at the depths at which incubations were performed, and the nirS abundance increased with increasing rates of N2O production (see Sect. 3.2). In July 2016, water column DIC concentrations ranged from 1377 to 1831 µmol L−1, with the highest concentrations below 10 m. Average community respiration rates at 3 and 14 m depth were 2.01 and 0.63 µmol L−1 h−1, respectively.
3.2 Active water column N2O production
The anoxic control experiment (anoxic condition with 5 µmol L−1 or ) was used to demonstrate active N2O production: in July 2016, at the top of the anoxic layer (∼12.3 m), rates of N2O production from and reduction were 5.42±0.35 and 2.04±0.86 nmol-N L−1 h−1, respectively (Fig. 2). In November 2016, at 17 m within the oxygenated water column ([O2] >180 µmol L−1), rates of N2O production were 0.33±0.01 and 0.95±0.35 nmol-N L−1 h−1, respectively. In May 2017, no N2O production was detected at 19.5 m.
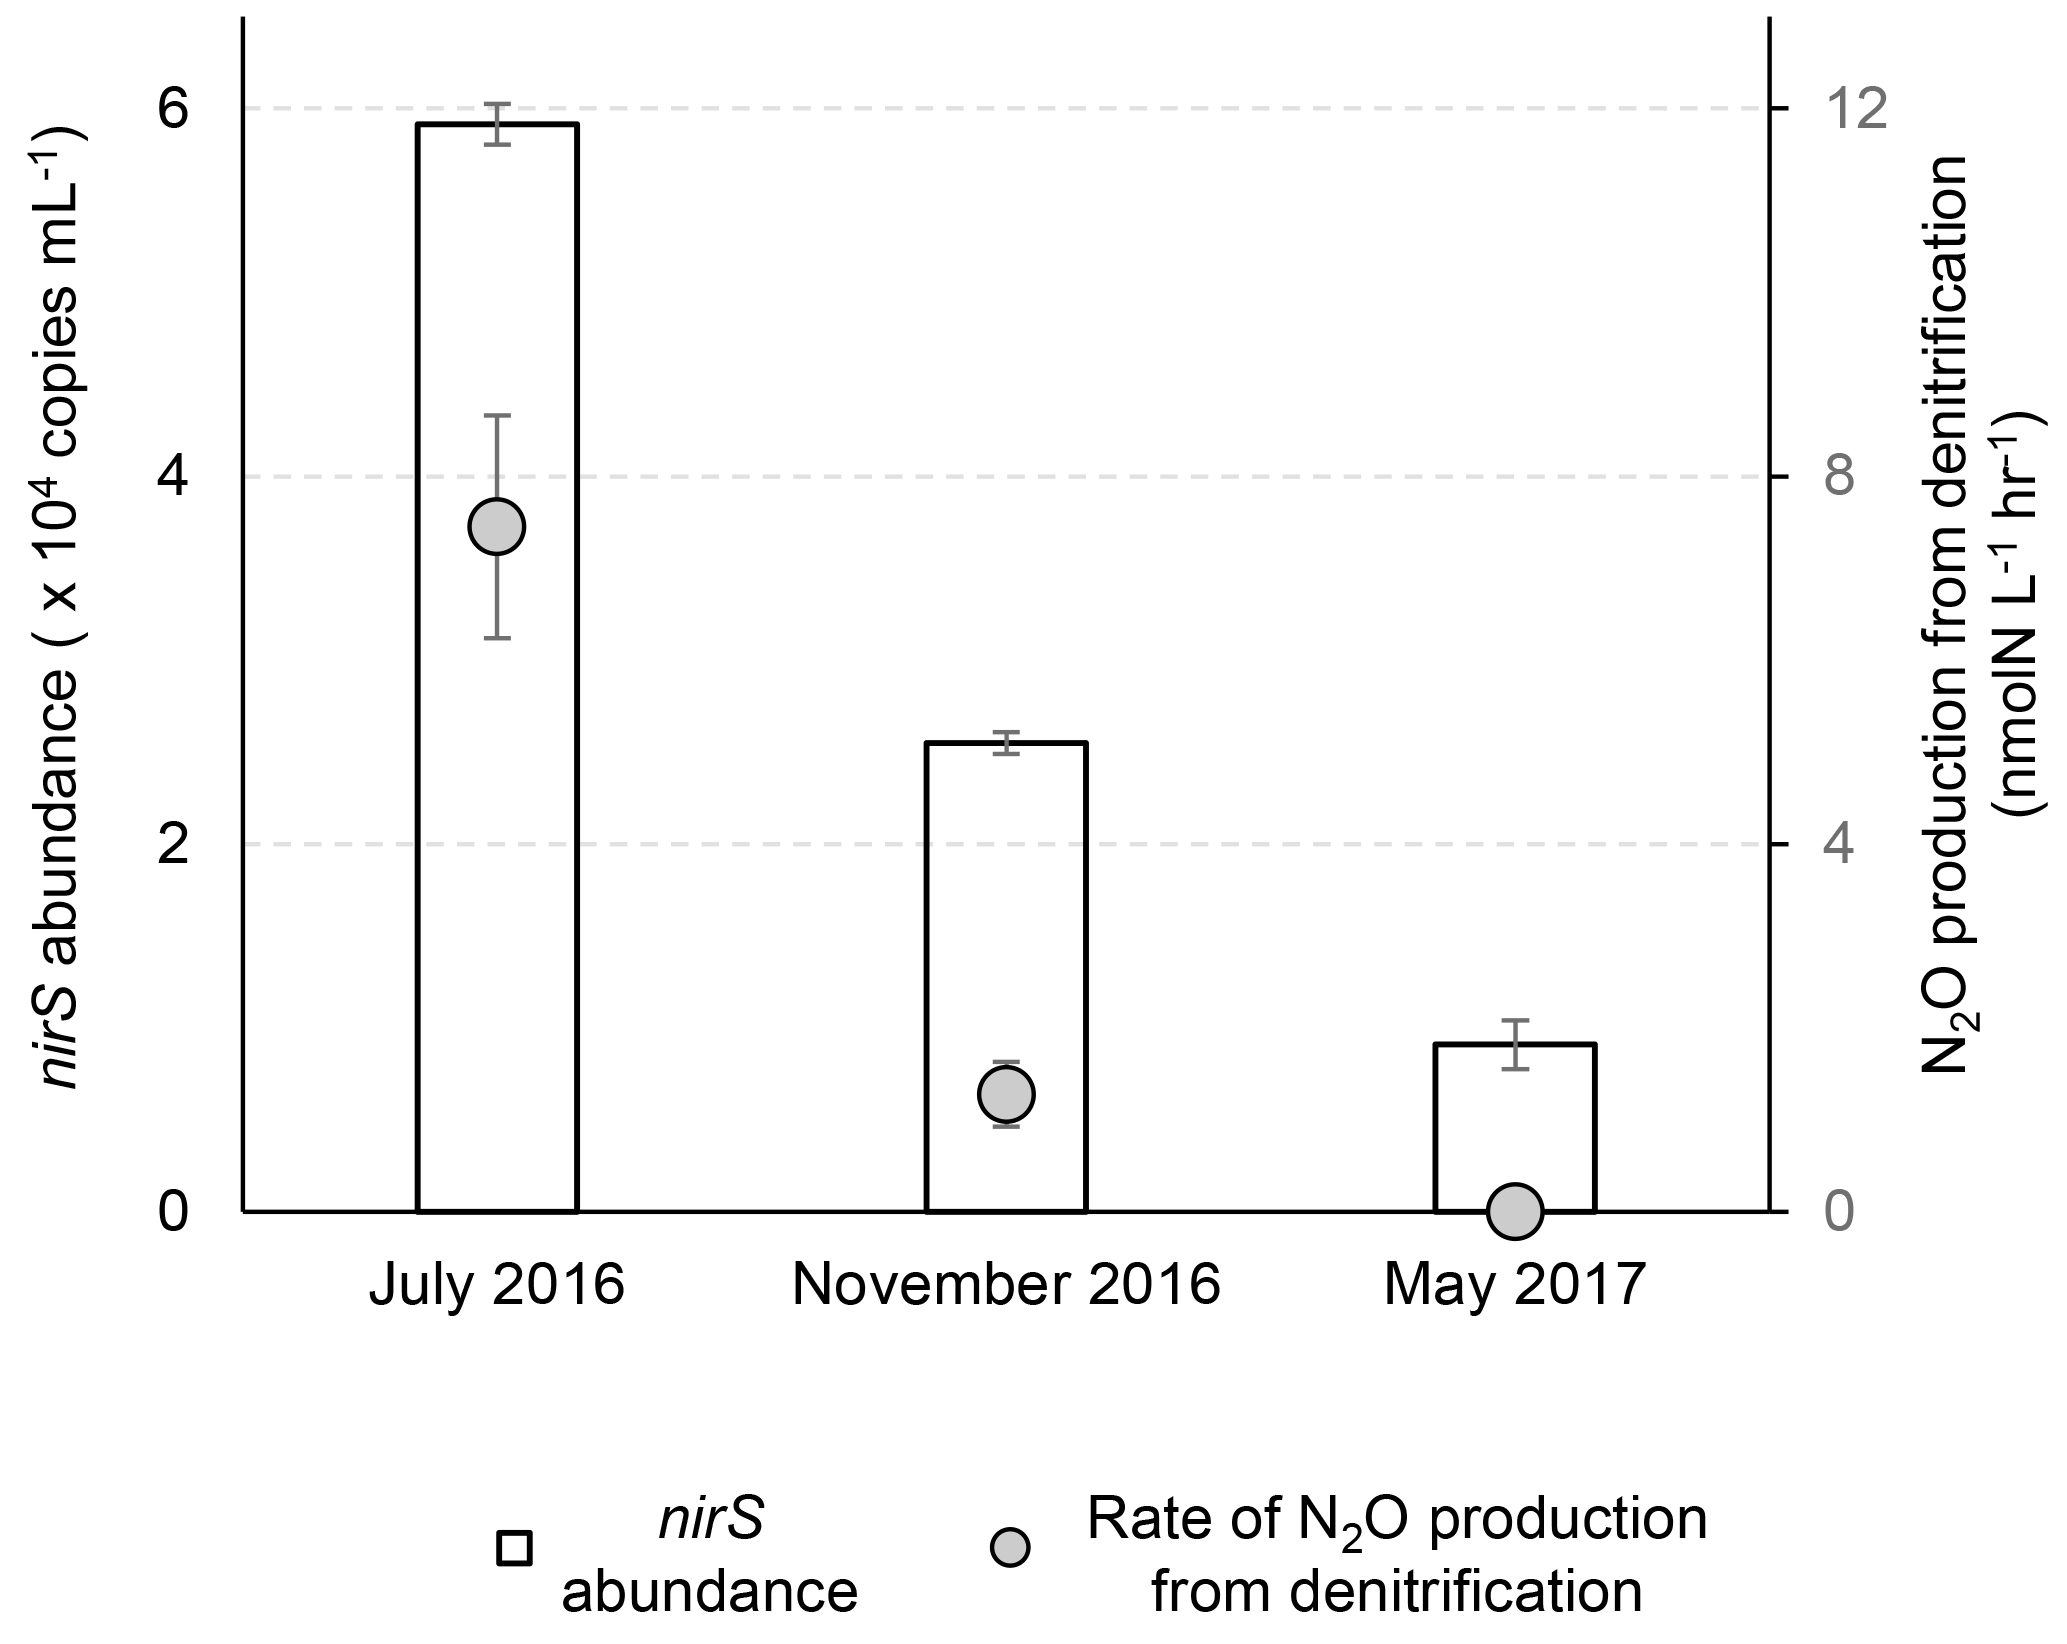
Figure 2Abundances of nirS gene and rates of N2O production from nitrate plus nitrite reduction at three sampling times. The nirS gene abundances were analyzed at 14.1, 17.0 and 19.5 m during July 2016, November 2016 and May 2017, respectively. The N2O production rates were measured in the control experiment (helium-flushed anoxic incubation) at 12.3, 17.0 and 19.5 m during July 2016, November 2016 and May 2017, respectively.
The total N2O production rate of 7.5±1.2 nmol-N L−1 h−1 in July 2016 is lower than the measurements (18–77 nmol-N L−1 h−1) made 40 years ago in the Potomac River (McElroy et al., 1978), a tributary to the Chesapeake Bay. This difference could be due to much higher water column nutrients in the Potomac River ( plus concentration >30 µmol L−1) at that time and presumably denser microbial populations because of sediment resuspension (4–10 m water depth). With added substrates ( and ) being more than an order of magnitude higher than in situ levels in July 2016, and the anoxic conditions being used in the November 2016 experiments (in situ [O2]>180 µmol L−1), N2O production rates reported here are potential rates, which nevertheless highlight the potential for N2O production in anoxic waters responding rapidly (within hours) to pulses of or .
Based on the nirS gene abundance, the denitrifying population was more abundant in July than in November and was the smallest in May in the lower water column (14–19.5 m) of the Chesapeake Bay (Fig. 1g). In July the highest N2O production rates from denitrification co-occurred with the highest nirS abundances (Fig. 2). While the water column oxygen in November was >180 µmol L−1, the nirS gene abundance supported potential denitrification at a N2O production rate of 1.28±0.35 nmol-N L−1 h−1 in anoxic incubation experiments. In May when hypoxic conditions had not yet developed, reduction of or to N2O did not occur, and the nirS abundance (9.1×10³ copies mL−1) was the lowest among three seasons. It is likely that the denitrifying community did not recover from oxygen inhibition during the 2 h anoxic incubation. A metatranscriptome analysis showed that the transcript ratios for denitrification were the lowest in June before the onset of hypoxia, and the highest ratios were in August when anoxia was most pronounced (Eggleston et al., 2015).
3.3 N2O production pathways regulated by availability of nitrogen substrate
The ratio of the rates of N2O production from reduction vs. N2O production from reduction positively correlates with the ratio of concentrations (Fig. 3). This suggests increasing or availability favors N2O production from the reduction of the respective substrate. At concentration ratios of , the ratios of rates were similar to the concentration ratio, 0.3±0.2. At a concentration ratio of , the ratio of rates of N2O production from respective substrates measured from replicate experiments varied from 0.6 to 2.6. At , the ratio of rates was greater than 10. Therefore, the primary nitrogen source of N2O production via denitrification depends in part on the relative availability of the substrate ( or ).
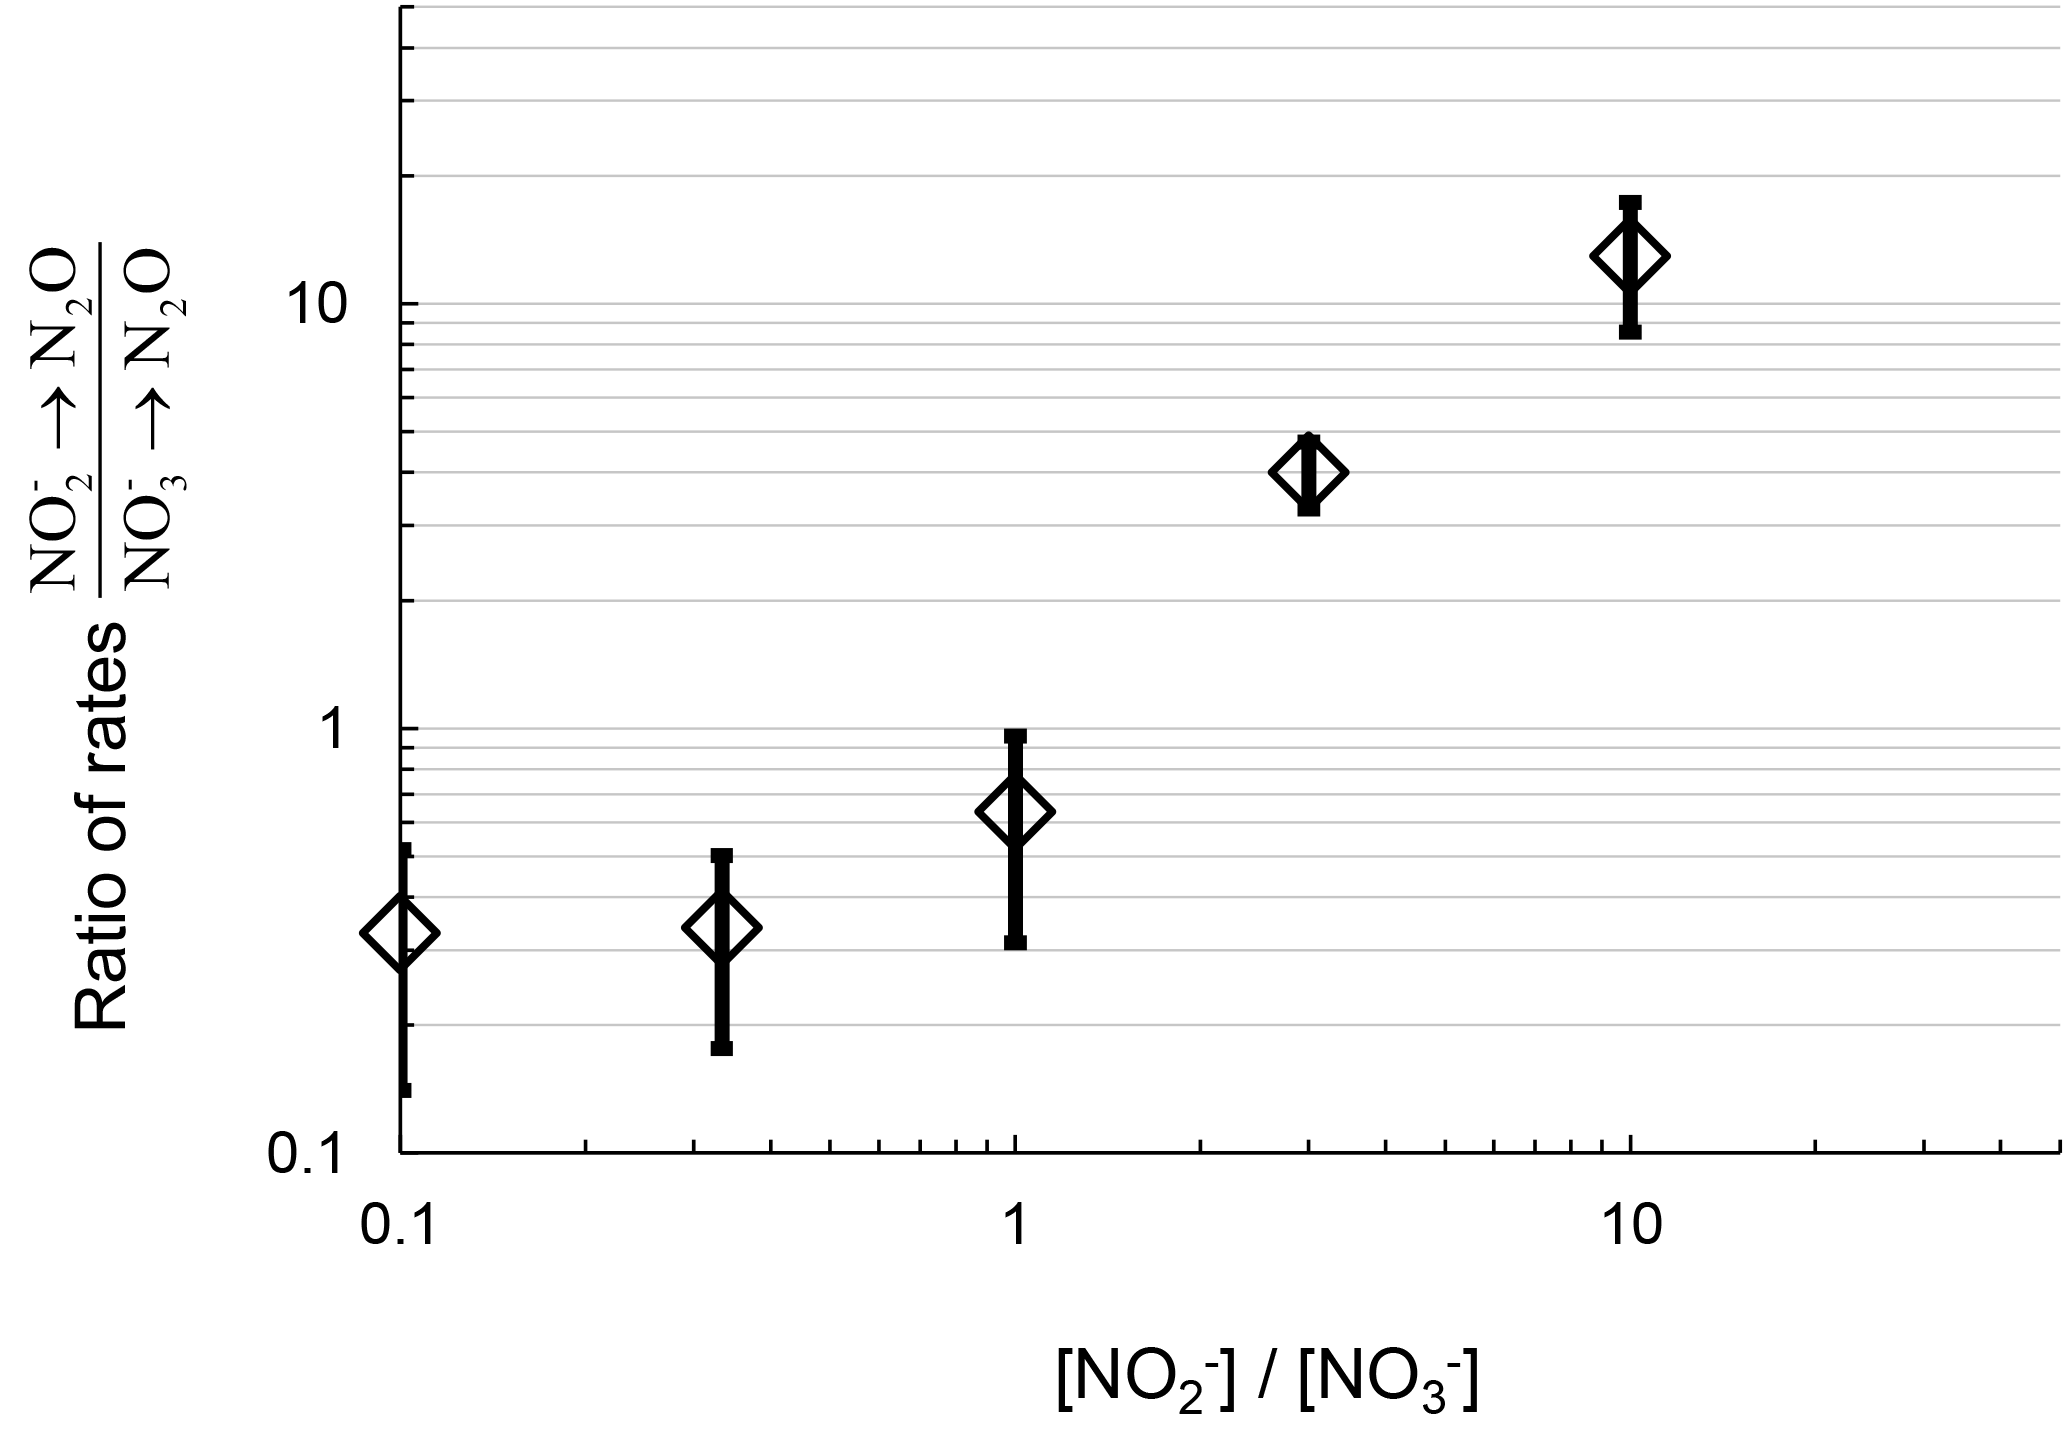
Figure 3Ratio of rates of N2O production from reduction and reduction plotted with the respective ratio of to concentration in the DIN manipulation experiment from July 2016 sampling. Log scale on both axes is for clarity at the low values.
As denitrification is a stepwise enzymatic reduction from , , NO, N2O to N2, the pathway can be somewhat modular (Graf et al., 2014); i.e., many organisms possess only one or a few steps, rather than the complete pathway. In complete denitrifiers (organisms capable of reducing to N2), the degree to which intermediates (i.e., ) exchange across cellular membranes with the ambient environment is unknown (Moir and Wood, 2001). We use data from the DIN manipulation experiment (conducted in July 2016) to show that full exchange between intracellular and ambient during reduction to N2O is unlikely, as explained below.
The conditions and results from experiment 2-H (Table 1) were used because this experiment had the highest ambient pool; an exchange between the pools could be easily detected. During reduction to N2O, if denitrifiers reduce (total 1.2 µmol L−1, 15N fraction labeled 0.16) to at the maximal rate (0.2 µmol-N L−1 h−1; see Sect. 3.4) and the product fully exchanges with the ambient (10 µmol L−1, 15N fraction labeled 0.0037), after 2 h, the 15N addition to the total pool will be 0.064 µmol L−1:
and the resulting 15N fraction (unitless) of will be 0.01:
Assuming 6 nmol-N L−1 h−1 as the rate of N2O production from reduction (the rate shown in Fig. 3; 15N fraction of ), and the initial N2O concentration as 20 nmol L−1 (described in Sect. 2.2; 15N fraction of N2O=0.0037), after 2 h, the resulting 15N fraction of N2O will be 0.0052:
The calculated 15N fraction of N2O (0.0052) is much lower than the measured 15N fraction of N2O (>0.02) in experiment 2H. This means that full exchange of during reduction to N2O, at maximum possible rates of reduction to and N2O, would yield a rate of N2O production from much lower than observed in the experimental results. Thus, we concluded that the intracellular exchange of during reduction to N2O by the denitrifying community in the Chesapeake Bay is limited. Such a tight coupling among nitrate reduction, nitrite reduction and nitric oxide reduction suggests the co-occurrence of the respective functional genes and enzymes in the cell of nitrate reducers. Both dissimilatory nitrate and nitrite reducers are able to produce N2O independently, so total N2O production can be quantified accurately by separate measurement of and reduction.
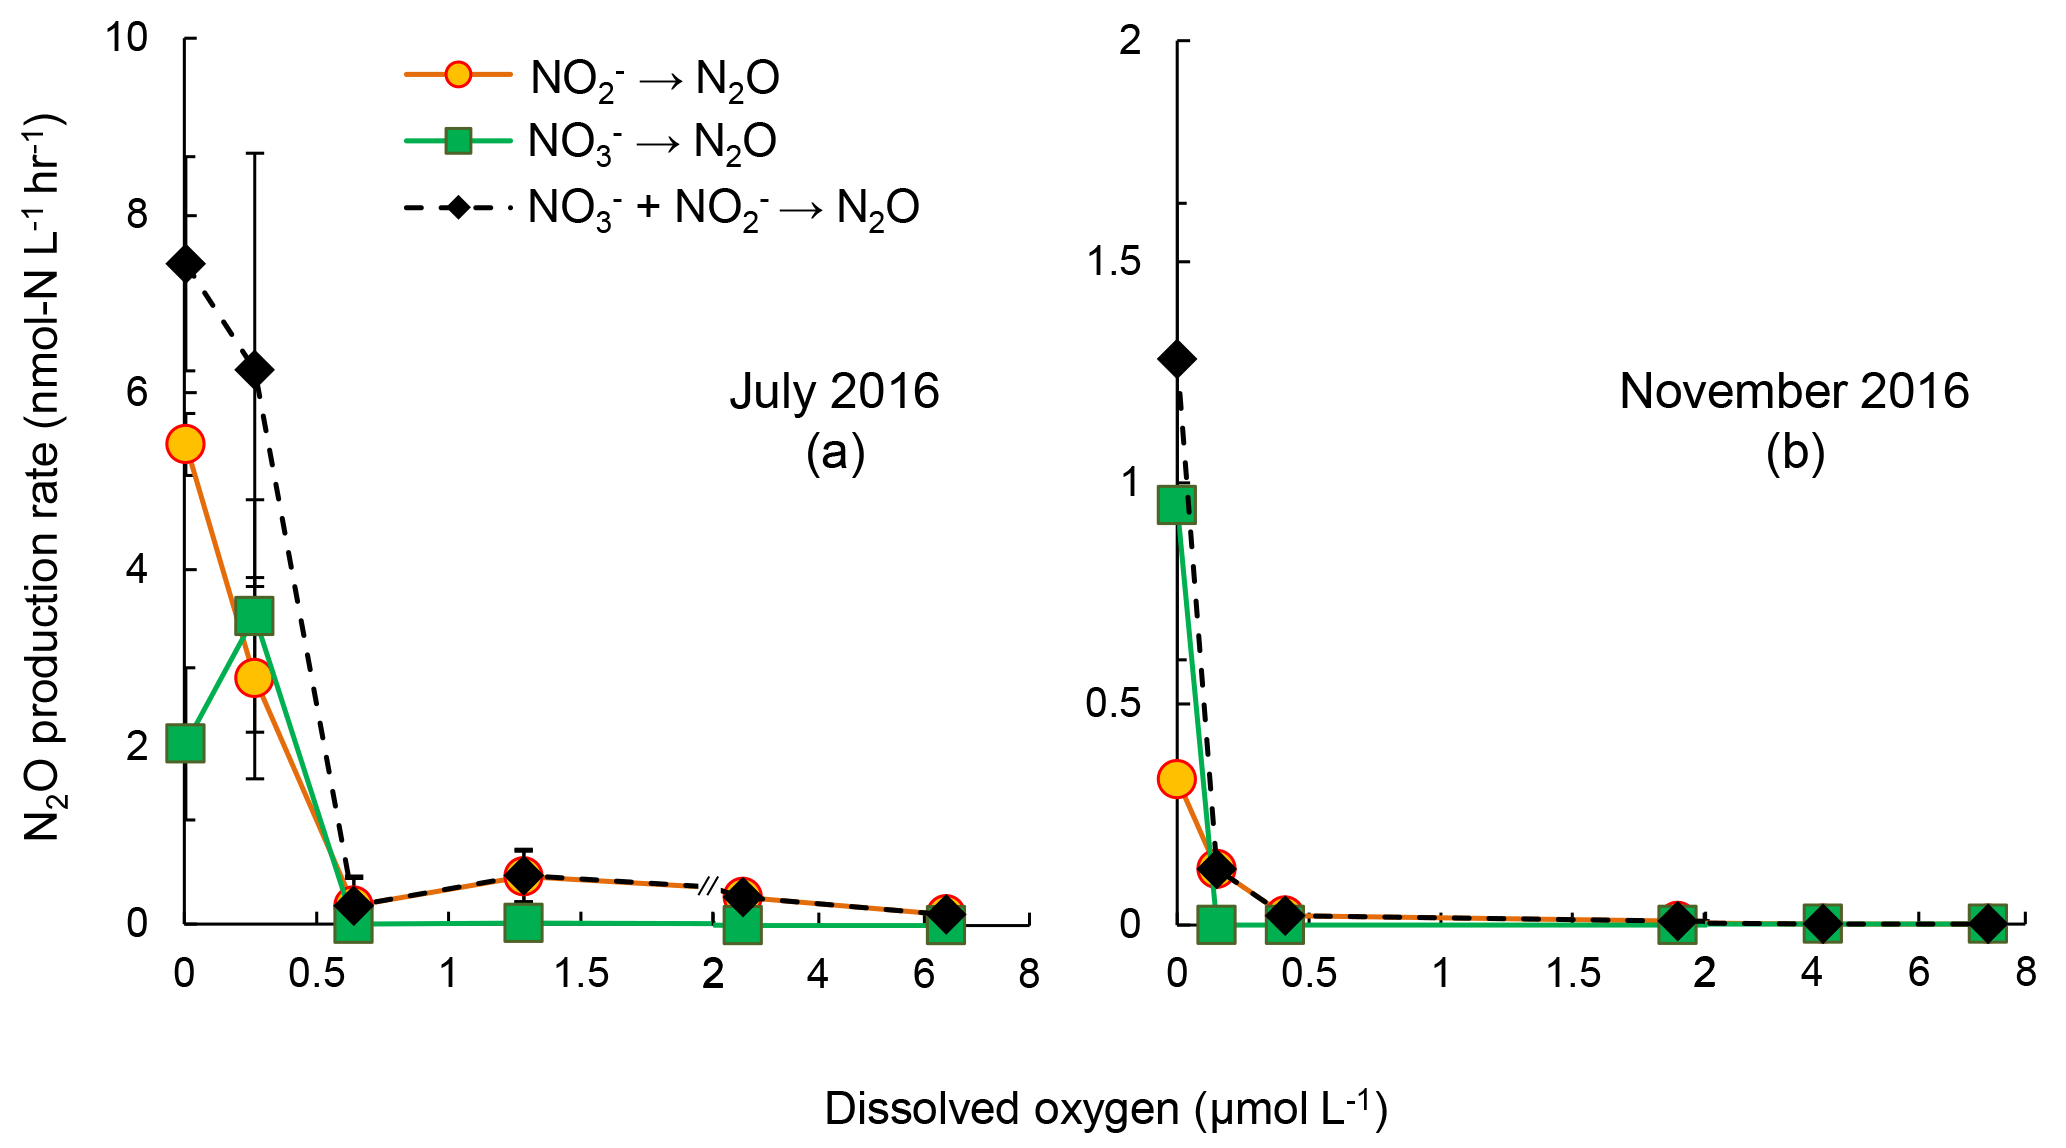
Figure 4Rates of N2O production from reduction (orange circles), reduction (green squares), and combined and reduction (black diamonds) under increasing oxygen concentrations in July 2016 (a) and November 2016 (b). The standard deviation of rates in most of the samples were small so that error bars are not visible. Note the scale break at 2 µmol L−1 [O2] on x axis.
3.4 Oxygen inhibits N2O production by denitrification
The sensitivities to increasing [O2] of reduction and reduction to N2O were evaluated in samples from July and November 2016 (Fig. 4). The control experiments (anoxic incubation; see Sect. 3.2) in July 2016 and November 2016 showed rates of N2O production from denitrification of 7.5±1.2 and 1.28±0.35 nmol-N L−1 h−1, respectively. Increasing [O2] generally decreased N2O production rates from denitrification. In July 2016, under [O2] = 0.3 µmol L−1, N2O production from reduction decreased from 5.4 to 2.5 nmol-N L−1 h−1, whereas the rate of reduction to N2O increased from 2.0 to 3.5 nmol-N L−1 h−1. Further increase in [O2], up to 6.4 µmol L−1, did not fully inhibit N2O production from reduction, the rate of which was 0.08 nmol-N L−1 h−1. However, N2O production from reduction was completely inhibited when [O2] >0.6 µmol L−1 (Fig. 4a). In November 2016, increasing [O2] gradually decreased rates of reduction to N2O; no rates were detected when [O2]>2 µmol L−1. Rates of reduction to N2O were not detected at [O2]>0 µmol L−1 (Fig. 4b).
Rates of reduction to under increasing [O2] were also measured in July 2016 to supplement the sensitivity analysis of denitrification to oxygen. The rate of reduction to was 100 nmol-N L−1 h−1 under anoxic condition. At [O2]=0.3 µmol L−1, the rate doubled to 200 nmol-N L−1 h−1 (Fig. 4). Further increase in [O2] significantly decreased the rate of reduction to . However, at [O2]=6.4 µmol L−1 reduction to was still detectable at 0.82±0.06 nmol-N L−1 h−1 (Fig. 5).
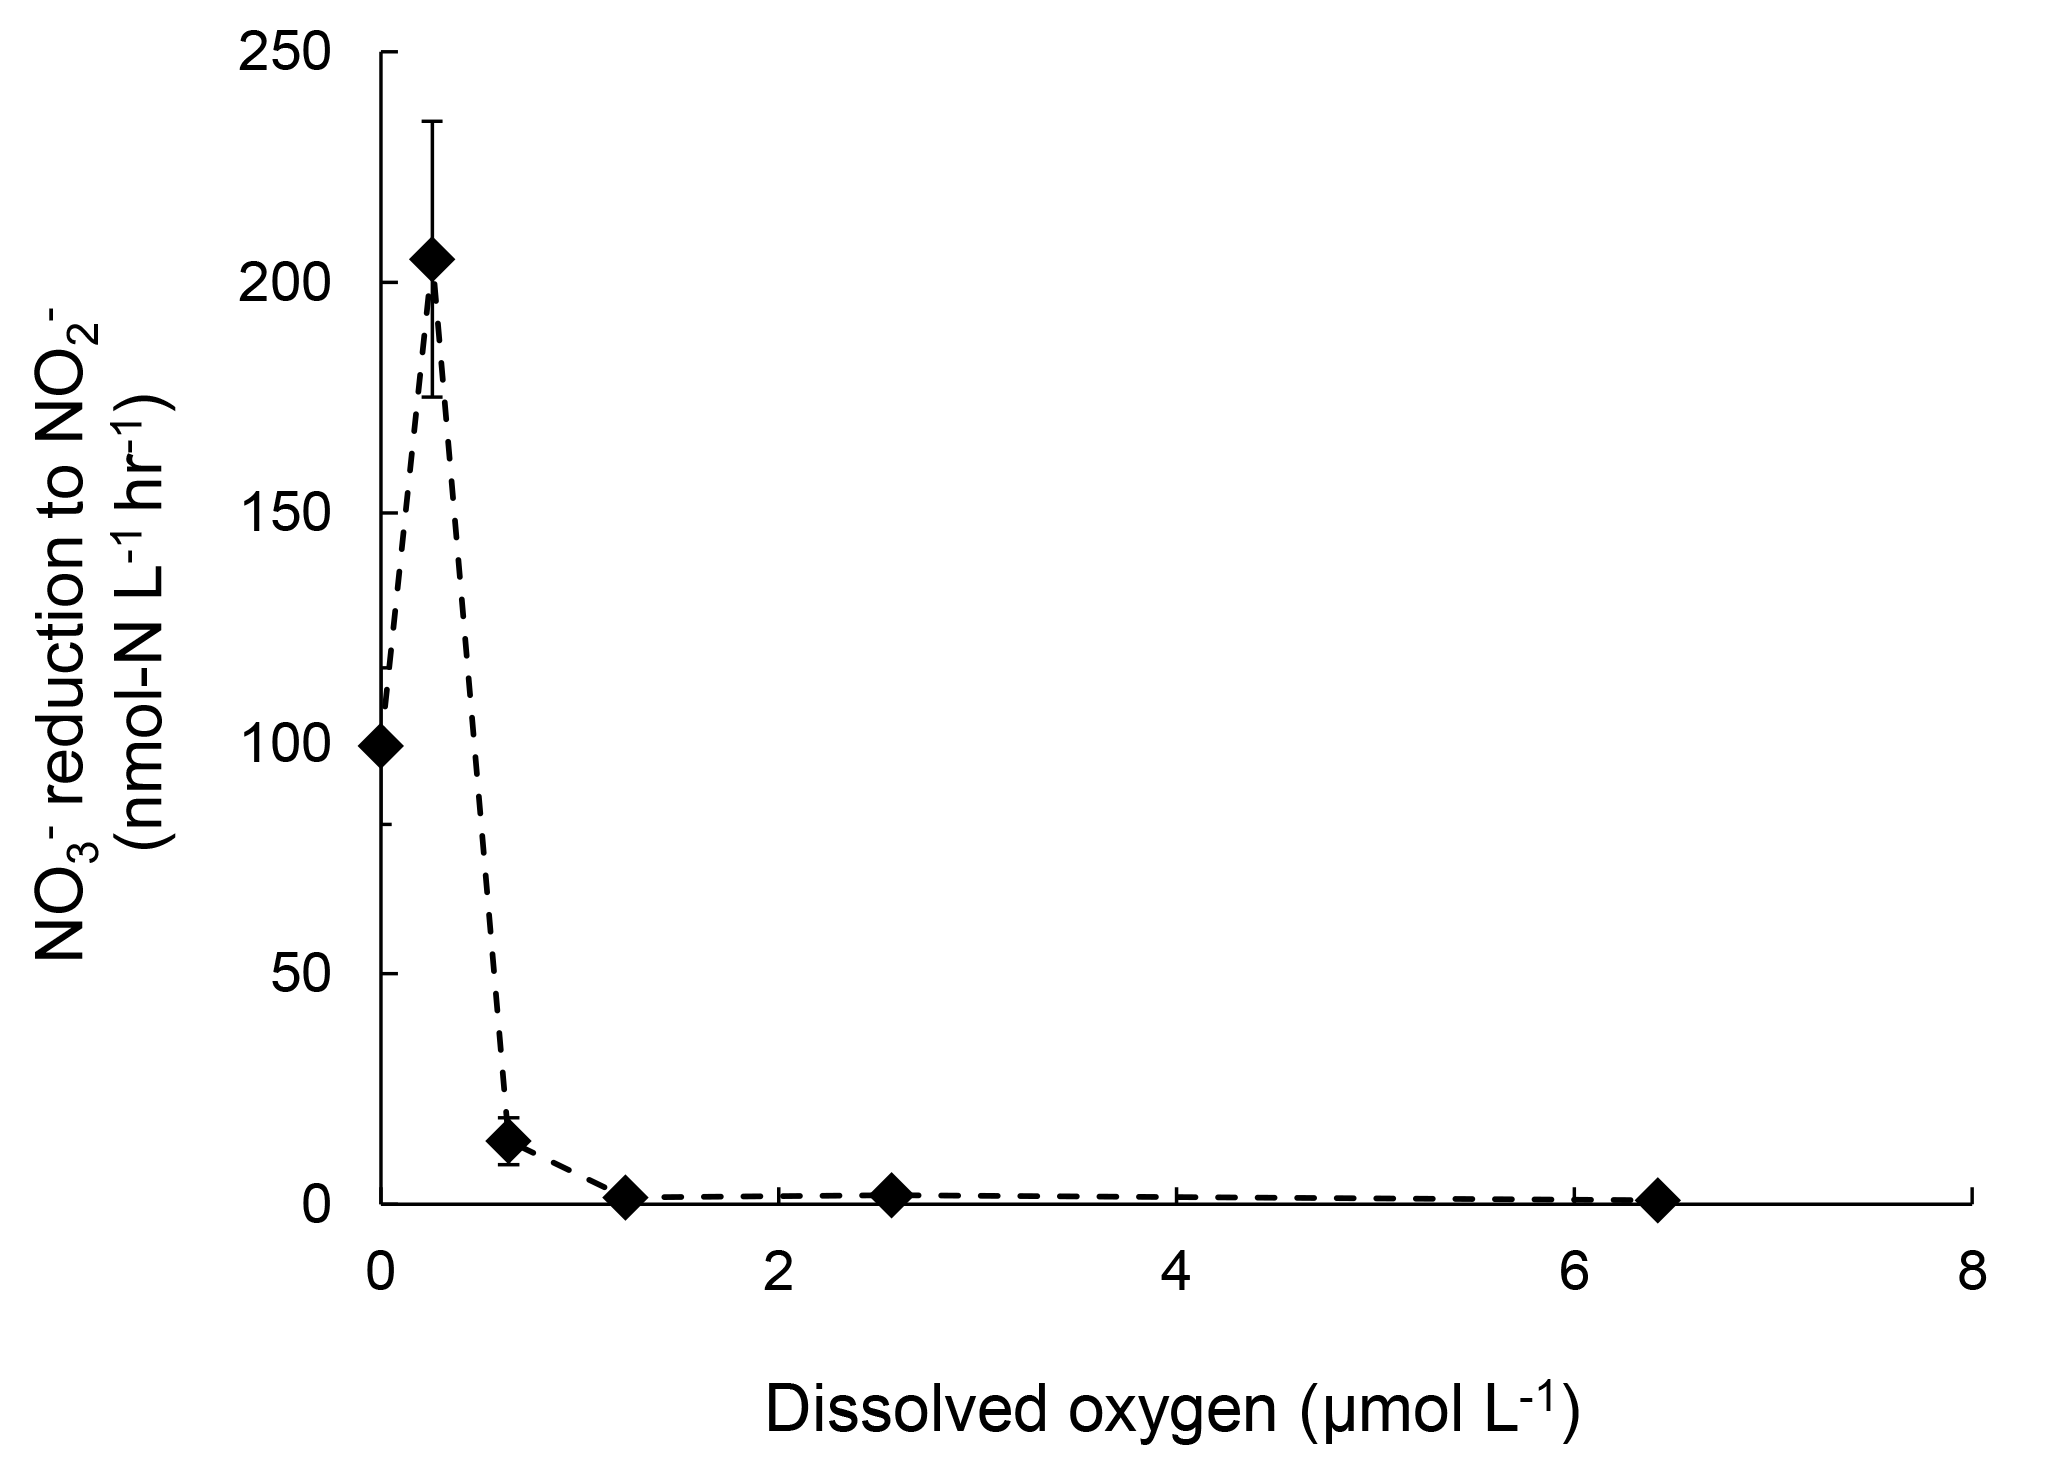
Figure 5Rates of production from reduction under increasing oxygen concentrations. Error bar indicates the standard deviation of rates from linear regression of three time points (n=7).
These results suggest that oxygenation of the water column in the Chesapeake Bay, even micro-molar level oxygen, would significantly mitigate N2O production from denitrification. Both July 2016 and November 2016 data showed the difference in the effect of oxygen on N2O production from vs. reduction. Samples from July 2016 showed 98 % and complete inhibition on N2O production from and reduction at [O2]=6 µmol L−1, respectively. The November 2016 samples showed 94 % and complete inhibition on N2O production from and reduction at [O2]=0.4 µmol L−1, respectively. Furthermore, N2O production in the Chesapeake Bay was likely attributed to both heterotrophic denitrification and nitrifier denitrification. Studies have shown that both nitrifiers and denitrifiers are present in the Chesapeake Bay (Bouskill et al., 2012; Hong et al., 2014) and they are capable of reduction to N2O, whereas reduction to N2O is solely mediated by heterotrophic denitrifiers. N2O production via nitrifier denitrification occurs under the full range of oxygen environments in agricultural soil (Zhu et al., 2013) and the open ocean (Wilson et al., 2014). Partial denitrification ( reduction to N2O), however, is moderately oxygen sensitive. Thus, increasing oxygen inhibits the activities of denitrifiers, as demonstrated in decreasing rates of reduction to N2O (Fig. 3) and reduction to (Fig. 5). Increasing oxygen does not completely inhibit N2O production activity of nitrifiers but probably lowers the N2O production rates by nitrifier denitrification.
The Chesapeake Bay is a potential N2O source via denitrification when and are present under anoxic conditions. Relative rates of and reduction to N2O were positively correlated with relative concentrations of and . Increased oxygen, either by natural water column oxygenation or by experimental manipulation, decreased N2O production rates via denitrification. The size of the denitrifying community increased with increasing rates of N2O production via denitrification. The potential N2O production in the summertime suggests that intermittent N2O efflux to the atmosphere could occur when a shallow oxic–anoxic interface (typically 10–15 m) is present (Taft et al., 1980; Kemp et al., 1992; Lee et al., 2015a), as well as frequent disturbance of water column stratification by storm events, boat traffic and surface cooling. The seasonal variation of surface and water column N2O saturation levels (air undersaturated in May and air oversaturated in November) and the detection of significant N2O production in July (summer) when N2O concentrations were the lowest imply that N2O consumption was also occurring in the Chesapeake Bay and probably minimizing N2O efflux to the atmosphere. A long-term, comprehensive survey with wide spatial coverage will help (i) assess if the Chesapeake Bay is a net N2O source or sink on an annual scale and (ii) to investigate the physical, chemical and biological controls of N2O emission in the Chesapeake Bay.
Denitrification is critical for complete removal of fixed nitrogen so as to mitigate eutrophication in natural waters. The N2O production rates could serve as a proxy for estimating nitrogen loss. It is estimated that 1 % of total denitrified nitrogen is converted to N2O in river networks (Beaulieu et al., 2011) so the ratio of N2O:N2 during denitrification is 1:100. Assuming that N2O production occurs at a rate of 7 nmol-N L−1 h−1 within 0.2 m of the oxic–anoxic interface in summertime (based on the July 2016 control data, N2O production from plus ), denitrification yields a potential water column nitrogen removal rate of 140 µmol-N m−2 h−1, or 0.24 mg-N m−2 d−1. In addition, the sediment in the bay is capable of anaerobic ammonia oxidation (Rich et al., 2008) and denitrification (Kemp et al., 1990; Kana et al., 2006). Total sedimentary N2 production, measured by the acetylene block reduction method (Kemp et al., 1990) and N2 accumulation method (Kana et al., 2006), recorded areal rates of 50–70 µmol-N m−2 h−1. Therefore, expansion of anoxia in the Chesapeake Bay could increase the potential of biological nitrogen removal by the sediment–water system that counteracts the increase in nitrogen loading from anthropogenic activities.
The oxidation of , although not the focus of this study, is a possible pathway for N2O production under low-oxygen conditions (Anderson, 1964). The yield of N2O (molar ratio of N2O production to oxidation) increases with decreasing oxygen (Goreau et al., 1980). Culture (Qin et al., 2017) and field studies (Bristow et al., 2016; Peng et al., 2016) have shown high affinity of oxygen (<5 µmol L−1) during oxidation. The main sources of in the Chesapeake Bay include remineralization of organic matter in the oxygenated water column and sediments (Kemp et al., 1990) and atmospheric deposition (Larsen et al., 2001). Onset of oxidation is viable at concentration <100 nmol L−1 by the natural ammonia-oxidizing community (Horak et al., 2013). Thus, N2O production from oxidation might be stimulated under low-oxygen condition by influx of ammonium near the oxic–anoxic interface, which deserves future research efforts.
The inhibition of N2O production by oxygen highlights the positive outcomes of reoxygenation of the Chesapeake Bay. Since the late 20th century, the Chesapeake Bay has received increased anthropogenic nitrogen loading from various sources including fertilizer (Groffman et al., 2009), untreated sewage (Kaplan et al., 1978) and atmospheric deposition (Russell et al., 1998; Loughner et al., 2016). Fueled by increased nitrogen input, elevated primary production in the surface layer stimulates aerobic remineralization at depth, which consumes oxygen rapidly. In summertime, water column stratification restricts influx of oxygen to depth, creating seasonal anoxia/hypoxia in the bay. The documented eutrophication and expansion of anoxia/hypoxia in the Chesapeake Bay in the late 20th century attracted public attention because of increasing mortality of organisms with high commercial and recreational value (Cooper and Brush, 1993). Moreover, expansion of the volume of low-oxygen waters will result in more “hot spots” for N2O production. The key factor for mitigating anoxia is to control the nitrogen input to the bay (Hagy et al., 2004; Zhou et al., 2014). Effective fertilizer application, sewage treatment, natural nitrogen removal by denitrification and anammox and plant uptake have been successfully enforced to control the nitrogen runoff into the bay from the tributaries (Boesch et al., 2001). The near absence of summertime water column concentrations close to the central Chesapeake Bay as shown in this study and others (Lee et al., 2015a) could prevent N2O production. Reducing the nitrogen input into the Chesapeake Bay will help mitigate N2O efflux: In the short term (timescale of days to months), nitrogen sources (, and ) for N2O production will be decreased. In the long run (inter-annual timescale), eutrophication will be alleviated, which will reoxygenate the water column, and inhibit N2O production.
All data presented in this manuscript can be found in the Supplement.
The supplement related to this article is available online at: https://doi.org/10.5194/bg-15-6127-2018-supplement.
QJ, CF, AJ, JCC and BBW developed the experimental design. QJ, CF, XS, MJ, YSL, AJ and JCC conducted the field experiments. QJ, CF, XS, MJ and AJ conducted the sample analysis. QJ, CF, XS, MJ, AJ, JCC and BBW wrote the paper.
The authors declare that they have no conflict of interest.
This work is supported by the following funding sources. The PEI Grand
Challenges – Control of Microbial Nitrous Oxide Production in Coastal Waters
supported Bess B. Ward. The National Science Foundation (OCE 1427019)
supported Jeffrey C. Cornwell. The German Academic Exchange Service
Postdoctoral Researchers International Mobility Experience fellowship
supported Claudia Frey. The authors would like to thank Michael Owens at Horn
Point Laboratory for his assistance with field research equipment. We thank
Sergey Oleynik for technical assistance during laboratory
analysis.
Edited by: Tina
Treude
Reviewed by: four anonymous referees
Anderson, J. H.: The metabolism of hydroxylamine to nitrite by Nitrosomonas, Biochem. J., 91, 8–17, 1964.
Arp, D. J. and Stein, L. Y.: Metabolism of inorganic N compounds by ammonia-oxidizing bacteria, Crit. Rev. Biochem. Mol., 38, 471–495, https://doi.org/10.1080/10409230390267446, 2003.
Baird, D., Ulanowicz, R. E., and Boynton, W. R.: Seasonal Nitrogen Dynamics in Chesapeake Bay: a Network Approach, Estuar. Coast. Shelf S., 41, 137–162, https://doi.org/10.1006/ecss.1995.0058, 1995.
Beaulieu, J. J., Tank, J. L., Hamilton, S. K., Wollheim, W. M., Hall, R. O., Mulholland, P. J., Peterson, B. J., Ashkenas, L. R., Cooper, L. W., Dahm, C. N., Dodds, W. K., Grimm, N. B., Johnson, S. L., McDowell, W. H., Poole, G. C., Valett, H. M., Arango, C. P., Bernot, M. J., Burgin, A. J., Crenshaw, C. L., Helton, A. M., Johnson, L. T., O'Brien, J. M., Potter, J. D., Sheibley, R. W., Sobota, D. J., and Thomas, S. M.: Nitrous oxide emission from denitrification in stream and river networks, P. Natl. Acad. Sci. USA, 108, 214–219, https://doi.org/10.1073/pnas.1011464108, 2011.
Boesch, D. F., Brinsfield, R. B., and Magnien, R. E.: Chesapeake Bay Eutrophication, J. Environ. Qual., 30, 303–320, https://doi.org/10.2134/jeq2001.302303x, 2001.
Bouskill, N. J., Eveillard, D., Chien, D., Jayakumar, A., and Ward, B. B.: Environmental factors determining ammonia-oxidizing organism distribution and diversity in marine environments, Environ. Microbiol., 14, 714–729, https://doi.org/10.1111/j.1462-2920.2011.02623.x, 2012.
Boynton, W. R., Garber, J. H., Summers, R., and Kemp, W. M.: Inputs, transformations, and transport of nitrogen and phosphorus in Chesapeake Bay and selected tributaries, Estuaries, 18, 285–314, https://doi.org/10.2307/1352640, 1995.
Braman, R. S. and Hendrix, S. A.: Nanogram nitrite and nitrate determination in environmental and biological materials by vanadium(III) reduction with chemiluminescence detection, Anal. Chem., 61, 2715–2718, https://doi.org/10.1021/ac00199a007, 1989.
Bristow, L. A., Dalsgaard, T., Tiano, L., Mills, D. B., Bertagnolli, A. D., Wright, J. J., Hallam, S. J., Ulloa, O., Canfield, D. E., and Revsbech, N. P.: Ammonium and nitrite oxidation at nanomolar oxygen concentrations in oxygen minimum zone waters, P. Natl. Acad. Sci. USA, 113, 10601–10606, https://doi.org/10.1073/pnas.1600359113, 2016.
Ciais, P., Sabine, C., Bala, G., Bopp, L., Brovkin, V., Canadell, J., Chhabra, A., DeFries, R., Galloway, J., Heimann, M., Jones, C., Le Quéré, C., Myneni, R. B., Piao, S., and Thornton, P.: Carbon and Other Biogeochemical Cycles, Cambridge, UK and New York, NY, USA, 465–570, 2013.
Cooper, S. R. and Brush, G. S.: A 2,500-Year History of Anoxia and Eutrophication in Chesapeake Bay, Estuaries, 16, 617–626, https://doi.org/10.2307/1352799, 1993.
Dürr, H. H., Laruelle, G. G., van Kempen, C. M., Slomp, C. P., Meybeck, M., and Middelkoop, H.: Worldwide Typology of Nearshore Coastal Systems: Defining the Estuarine Filter of River Inputs to the Oceans, Estuar. Coast., 34, 441–458, https://doi.org/10.1007/s12237-011-9381-y, 2011.
Eggleston, E. M., Lee, D. Y., Owens, M. S., Cornwell, J. C., Crump, B. C., and Hewson, I.: Key respiratory genes elucidate bacterial community respiration in a seasonally anoxic estuary, Environ. Microbiol., 17, 2306–2318, https://doi.org/10.1111/1462-2920.12690, 2015.
Elkins, J. W., Wofsy, S. C., Mcelroy, M. B., Kolb, C. E., and Kaplan, W. A.: Aquatic sources and sinks for nitrous oxide, Nature, 275, 602–606, https://doi.org/10.1038/275602a0, 1978.
Frame, C. H. and Casciotti, K. L.: Biogeochemical controls and isotopic signatures of nitrous oxide production by a marine ammonia-oxidizing bacterium, Biogeosciences, 7, 2695–2709, https://doi.org/10.5194/bg-7-2695-2010, 2010.
Garcia, H. E. and Gordon, L. I.: Oxygen solubility in seawater: Better fitting equations, Limnol. Oceanogr., 37, 1307–1312, https://doi.org/10.4319/lo.1992.37.6.1307, 1992.
Garside, C.: A chemiluminescent technique for the determination of nanomolar concentrations of nitrate and nitrite in seawater, Mar. Chem., 11, 159–167, https://doi.org/10.1016/0304-4203(82)90039-1, 1982.
Goreau, T. J., Kaplan, W. A., Wofsy, S. C., McElroy, M. B., Valois, F. W., and Watson, S. W.: Production of and N2O by nitrifying bacteria at reduced concentrations of oxygen, Appl. Environ. Microbiol., 40, 526–532, 1980.
Graf, D. R. H., Jones, C. M., and Hallin, S.: Intergenomic Comparisons Highlight Modularity of the Denitrification Pathway and Underpin the Importance of Community Structure for N2O Emissions, PLOS ONE, 9, e114118, https://doi.org/10.1371/journal.pone.0114118, 2014.
Groffman, P. M., Williams, C. O., Pouyat, R. V., Band, L. E., and Yesilonis, I. D.: Nitrate leaching and nitrous oxide flux in urban forests and grasslands, J. Environ. Qual., 38, 1848–1860, https://doi.org/10.2134/jeq2008.0521, 2009.
Hagy, J. D., Boynton, W. R., Keefe, C. W., and Wood, K. V.: Hypoxia in Chesapeake Bay, 1950–2001: Long-term change in relation to nutrient loading and river flow, Estuaries, 27, 634–658, https://doi.org/10.1007/BF02907650, 2004.
Hansen, H. P. and Koroleff, F.: Determination of nutrients, in: Methods of Seawater Analysis, Wiley-VCH Verlag GmbH, 159–228, 2007.
Hong, Y., Xu, X., Kan, J., and Chen, F.: Linking seasonal inorganic nitrogen shift to the dynamics of microbial communities in the Chesapeake Bay, Appl. Microbiol. Biot., 98, 3219, https://doi.org/10.1007/s00253-013-5337-4, 2014.
Horak, R. E. A., Qin, W., Schauer, A. J., Armbrust, E. V., Ingalls, A. E., Moffett, J. W., Stahl, D. A., and Devol, A. H.: Ammonia oxidation kinetics and temperature sensitivity of a natural marine community dominated by Archaea, ISME J., 7, 2023–2033, https://doi.org/10.1038/ismej.2013.75, 2013.
Jayakumar, A., O'Mullan, G. D., Naqvi, S. W. A., and Ward, B. B.: Denitrifying Bacterial Community Composition Changes Associated with Stages of Denitrification in Oxygen Minimum Zones, Microb. Ecol., 58, 350–362, https://doi.org/10.1007/s00248-009-9487-y, 2009.
Jayakumar, A., Peng, X., and Ward, B. B.: Community composition of bacteria involved in fixed nitrogen loss in the water column of two major oxygen minimum zones in the ocean, Aquat. Microb. Ecol., 70, 245–259, https://doi.org/10.3354/ame01654, 2013.
Kana, T. M., Cornwell, J. C., and Zhong, L.: Determination of Denitrification in the Chesapeake Bay from Measurements of N2 Accumulation in Bottom Water, Estuar. Coast., 29, 222–231, 2006.
Kaplan, W. A., Elkins, J. W., Kolb, C. E., McElroy, M. B., Wofsy, S. C., and Durán, A. P.: Nitrous oxide in fresh water systems: An estimate for the yield of atmospheric N2O associated with disposal of human waste, Pure Appl. Geophys., 116, 423–438, https://doi.org/10.1007/bf01636897, 1978.
Kartal, B., Maalcke, W. J., de Almeida, N. M., Cirpus, I., Gloerich, J., Geerts, W., Op den Camp, H. J. M., Harhangi, H. R., Janssen-Megens, E. M., Francoijs, K.-J., Stunnenberg, H. G., Keltjens, J. T., Jetten, M. S. M., and Strous, M.: Molecular mechanism of anaerobic ammonium oxidation, Nature, 479, 127–130, https://doi.org/10.1038/nature10453, 2011.
Kemp, W., Sampou, P., Caffrey, J., Mayer, M., Henriksen, K., and Boynton, W. R.: Ammonium recycling versus denitrification in Chesapeake Bay sediments, Limnol. Oceanogr., 35, 1545–1563, 1990.
Kemp, W. M., Sampou, P. A., Garber, J., Tuttle, J., and Boynton, W. R.: Seasonal depletion of oxygen from bottom waters of Chesapeake Bay: roles of benthic and planktonic respiration and physical exchange processes, Mar. Ecol.-Prog. Ser., 85, 137–152, 1992.
Larsen, R. K., Steinbacher, J. C., and Baker, J. E.: Ammonia exchange between the atmosphere and the surface waters at two locations in the Chesapeake Bay, Environ. Sci. Technol., 35, 4731–4738, https://doi.org/10.1021/es010755l, 2001.
Lee, D. Y., Owens, M. S., Crump, B. C., and Cornwell, J. C.: Elevated microbial CO2 production and fixation in the oxic/anoxic interface of estuarine water columns during seasonal anoxia, Estuar. Coast. Shelf S., 164, 65–76, https://doi.org/10.1016/j.ecss.2015.07.015, 2015a.
Lee, D. Y., Owens, M. S., Doherty, M., Eggleston, E. M., Hewson, I., Crump, B. C., and Cornwell, J. C.: The Effects of Oxygen Transition on Community Respiration and Potential Chemoautotrophic Production in a Seasonally Stratified Anoxic Estuary, Estuar. Coast., 38, 104–117, https://doi.org/10.1007/s12237-014-9803-8, 2015b.
Loughner, C. P., Tzortziou, M., Shroder, S., and Pickering, K. E.: Enhanced dry deposition of nitrogen pollution near coastlines: A case study covering the Chesapeake Bay estuary and Atlantic Ocean coastline, J. Geophys. Res.-Atmos., 121, 14221–14238, https://doi.org/10.1002/2016JD025571, 2016.
McElroy, M. B., Elkins, J. W., Wofsy, S. C., Kolb, C. E., Durán, A. P., and Kaplan, W. A.: Production and release of N2O from the Potomac Estuary 1, Limnol. Oceanogr., 23, 1168–1182, https://doi.org/10.4319/lo.1978.23.6.1168, 1978.
McIlvin, M. R. and Altabet, M. A.: Chemical conversion of nitrate and nitrite to nitrous oxide for nitrogen and oxygen isotopic analysis in freshwater and seawater, Anal. Chem., 77, 5589–5595, https://doi.org/10.1021/ac050528s, 2005.
Moir, J. W. B. and Wood, N. J.: Nitrate and nitrite transport in bacteria, Cell. Mol. Life Sci., 58, 215–224, https://doi.org/10.1007/PL00000849, 2001.
Peng, X., Fuchsman, C. A., Jayakumar, A., Warner, M. J., Devol, A. H., and Ward, B. B.: Revisiting nitrification in the Eastern Tropical South Pacific: A focus on controls, J. Geophys. Res.-Oceans, 121, 1667–1684, https://doi.org/10.1002/2015JC011455, 2016.
Poth, M. and Focht, D. D.: (15)N Kinetic Analysis of N(2)O Production by Nitrosomonas europaea: an Examination of Nitrifier Denitrification, Appl. Environ. Microbiol., 49, 1134–1141, 1985.
Qin, W., Meinhardt, K. A., Moffett, J. W., Devol, A. H., Virginia Armbrust, E., Ingalls, A. E., and Stahl, D. A.: Influence of oxygen availability on the activities of ammonia-oxidizing archaea, Env. Microbiol. Rep., 9, 250–256, https://doi.org/10.1111/1758-2229.12525, 2017.
Ravishankara, A., Daniel, J. S., and Portmann, R. W.: Nitrous oxide (N2O): the dominant ozone-depleting substance emitted in the 21st century, Science, 326, 123–125, 2009.
Rich, J. J., Dale, O. R., Song, B., and Ward, B. B.: Anaerobic ammonium oxidation (anammox) in Chesapeake Bay sediments, Microb. Ecol., 55, 311–320, https://doi.org/10.1007/s00248-007-9277-3, 2008.
Russell, K. M., Galloway, J. N., Macko, S. A., Moody, J. L., and Scudlark, J. R.: Sources of nitrogen in wet deposition to the Chesapeake Bay region, Atmos. Environ., 32, 2453–2465, https://doi.org/10.1016/S1352-2310(98)00044-2, 1998.
Santoro, A. E., Buchwald, C., McIlvin, M. R., and Casciotti, K. L.: Isotopic Signature of N2O Produced by Marine Ammonia-Oxidizing Archaea, Science, 333, 1282–1285, https://doi.org/10.1126/science.1208239, 2011.
Schilt, A., Baumgartner, M., Blunier, T., Schwander, J., Spahni, R., Fischer, H., and Stocker, T. F.: Glacial–interglacial and millennial-scale variations in the atmospheric nitrous oxide concentration during the last 800,000 years, Quat. Sci. Rev., 29, 182-192, https://doi.org/10.1016/j.quascirev.2009.03.011, 2010.
Seitzinger, S. P. and Kroeze, C.: Global distribution of nitrous oxide production and N inputs in freshwater and coastal marine ecosystems, Global Biogeochem. Cy., 12, 93–113, https://doi.org/10.1029/97GB03657, 1998.
Taft, J. L., Taylor, W. R., Hartwig, E. O., and Loftus, R.: Seasonal oxygen depletion in Chesapeake Bay, Estuaries, 3, 242–247, https://doi.org/10.2307/1352079, 1980.
Thompson, R. L., Chevallier, F., Crotwell, A. M., Dutton, G., Langenfelds, R. L., Prinn, R. G., Weiss, R. F., Tohjima, Y., Nakazawa, T., Krummel, P. B., Steele, L. P., Fraser, P., O'Doherty, S., Ishijima, K., and Aoki, S.: Nitrous oxide emissions 1999 to 2009 from a global atmospheric inversion, Atmos. Chem. Phys., 14, 1801–1817, https://doi.org/10.5194/acp-14-1801-2014, 2014.
Weigand, M. A., Foriel, J., Barnett, B., Oleynik, S., and Sigman, D. M.: Updates to instrumentation and protocols for isotopic analysis of nitrate by the denitrifier method, Rapid Commun. Mass Sp., 30, 1365–1383, https://doi.org/10.1002/rcm.7570, 2016.
Weiss, R. F. and Price, B. A.: Nitrous oxide solubility in water and seawater, Mar. Chem., 8, 347–359, https://doi.org/10.1016/0304-4203(80)90024-9, 1980.
Wilson, S. T., del Valle, D. A., Segura-Noguera, M., and Karl, D. M.: A role for nitrite in the production of nitrous oxide in the lower euphotic zone of the oligotrophic North Pacific Ocean, Deep-Sea Res. Pt. I, 85, 47–55, https://doi.org/10.1016/j.dsr.2013.11.008, 2014.
Zhou, Y., Scavia, D., and Michalak, A. M.: Nutrient loading and meteorological conditions explain interannual variability of hypoxia in Chesapeake Bay, Limnol. Oceanogr., 59, 373–384, https://doi.org/10.4319/lo.2014.59.2.0373, 2014.
Zhu, X., Burger, M., Doane, T. A., and Horwath, W. R.: Ammonia oxidation pathways and nitrifier denitrification are significant sources of N2O and NO under low oxygen availability, P. Natl. Acad. Sci. USA, 110, 6328–6333, https://doi.org/10.1073/pnas.1219993110, 2013.