the Creative Commons Attribution 4.0 License.
the Creative Commons Attribution 4.0 License.
 | 26 Oct 2018
Factors controlling the community structure of picoplankton in contrasting marine environments
Jose Luis Otero-Ferrer
Pedro Cermeño
Antonio Bode
Bieito Fernández-Castro
Josep M. Gasol
Xosé Anxelu G. Morán
Emilio Marañon
Victor Moreira-Coello
Marta M. Varela
Marina Villamaña
Beatriz Mouriño-Carballido
The effect of inorganic nutrients on planktonic assemblages has traditionally relied on concentrations rather than estimates of nutrient supply. We combined a novel dataset of hydrographic properties, turbulent mixing, nutrient concentration, and picoplankton community composition with the aims of (i) quantifying the role of temperature, light, and nitrate fluxes as factors controlling the distribution of autotrophic and heterotrophic picoplankton subgroups, as determined by flow cytometry, and (ii) describing the ecological niches of the various components of the picoplankton community. Data were collected at 97 stations in the Atlantic Ocean, including tropical and subtropical open-ocean waters, the northwestern Mediterranean Sea, and the Galician coastal upwelling system of the northwest Iberian Peninsula. A generalized additive model (GAM) approach was used to predict depth-integrated biomass of each picoplankton subgroup based on three niche predictors: sea surface temperature, averaged daily surface irradiance, and the transport of nitrate into the euphotic zone, through both diffusion and advection. In addition, niche overlap among different picoplankton subgroups was computed using nonparametric kernel density functions. Temperature and nitrate supply were more relevant than light in predicting the biomass of most picoplankton subgroups, except for Prochlorococcus and low-nucleic-acid (LNA) prokaryotes, for which irradiance also played a significant role. Nitrate supply was the only factor that allowed the distinction among the ecological niches of all autotrophic and heterotrophic picoplankton subgroups. Prochlorococcus and LNA prokaryotes were more abundant in warmer waters (>20 ∘C) where the nitrate fluxes were low, whereas Synechococcus and high-nucleic-acid (HNA) prokaryotes prevailed mainly in cooler environments characterized by intermediate or high levels of nitrate supply. Finally, the niche of picoeukaryotes was defined by low temperatures and high nitrate supply. These results support the key role of nitrate supply, as it not only promotes the growth of large phytoplankton, but it also controls the structure of marine picoplankton communities.
- Article
(4068 KB) - Full-text XML
-
Supplement
(110 KB) - BibTeX
- EndNote


Picoplankton, including archaea, bacteria, and picoeukaryotes are the smallest (cell diameter <2 µm) and most abundant organisms in marine ecosystems. Photosynthetic picoplankton often dominate marine phytoplankton biomass and primary production in oligotrophic tropical and subtropical regions (Chisholm, 1992), whereas they are typically a minor component in nutrient-replete coastal environments, usually dominated by large-sized plankton species (Finkel et al., 2010; Marañón, 2015). However, due to the large temporal and spatial variability in the structure and composition of the microbial community in shelf seas (Sherr et al., 2005), picoplankton, together with nanoplankton, can dominate the microbial community under certain conditions (Espinoza-González et al., 2012; Morán, 2007). In addition, picoplankton contributes overwhelmingly to the recycling of organic matter (Azam et al., 1983; Fenchel, 2008), and previous studies suggest that photosynthetic picoplankton could also play a role in the export of carbon to the deep ocean (Guidi et al., 2015; Lomas and Moran, 2011; Richardson and Jackson, 2007). As a result, picoplankton is considered a key component of the current carbon cycle and likely more important in future climate warming scenarios (Laufkötter et al., 2016). When analyzed using flow cytometric techniques, two genera of picocyanobacteria (Prochlorococcus and Synechococcus), one or two subgroups of autotrophic picoeukaryotes of different sizes (small and large), and two subgroups of heterotrophic prokaryotes, based on their high (HNA) or low nucleic acid (LNA) content, can be distinguished (Gasol and del Giorgio, 2000; Marie and Partensky, 2006). Although closely related phylogenetically, Synechococcus and Prochlorococcus exhibit distinct physiological traits (Moore et al., 1995), divergent evolutionary strategies (Scanlan and West, 2002), and disparate geographic distributions (Zubkov et al., 2000). Prochlorococcus tend to be restricted to relatively warm (above 15 ∘C) and nutrient-poor waters, extending from the surface down to 150 m, along the 40∘ N–40∘ S latitudinal band (Johnson et al., 2006; Partensky et al., 1999b). Synechococcus exhibit a wider geographic and thermal distribution, including high-nutrient waters and occasionally reaching polar latitudes (Paulsen et al., 2016); their vertical distribution is shallower than that of Prochlorococcus (Li, 2002; Partensky et al., 1999a). The contribution of picoeukaryotes to picoplankton biomass is generally smaller than the contribution of picocyanobacteria (Buitenhuis et al., 2012; Zubkov et al., 2000), except in coastal regions where their contribution usually increases (Grob et al., 2007). In general, LNA prokaryotes dominate heterotrophic prokaryotic biomass in the oligotrophic open ocean, whereas HNA cells dominate in coastal regions (Bouvier et al., 2007; Li et al., 1995). These contrasting spatial distributions suggest that the picoplankton subgroups occupy differential ecological niches or, according to the classical definition proposed by Hutchinson (1957), distinct multidimensional hyper-volumes of environmental factors in which viable populations develop. By describing the overlaps of environmental factors, realized niche partitioning can be defined, and the factors controlling the distribution of picoplankton subgroups can be identified. However, despite decades of experimental and field observations, the relative importance of the factors driving the variability in the growth and the spatial distribution of picoplankton subgroups remains largely unknown.
Aside from the effect of trophic controls, the distribution of microbial plankton is primarily determined by seawater temperature, light, and nutrients (Barton et al., 2015; Li, 2007, 2009). Quantifying their relative influence on the spatial and temporal distribution of the different picoplankton subgroups is complicated by the fact that the abovementioned factors are often correlated in the ocean (Finkel et al., 2010). This shortcoming can be circumvented by using experimental approaches in the laboratory, where the influence of each independent factor is isolated. Alternatively, it can be approached by combining large datasets of hydrographic and biological observations collected from contrasting marine environments, which allow us to characterize the suite of variables that best define the organism's ecological niches.
In order to study the significance of temperature and nutrient concentrations in determining the contribution of picophytoplankton to total phytoplankton biomass and production, Agawin et al. (2000) reviewed the available literature from oceanic and coastal estuarine areas. Although the number of observations for which both temperature and nutrient concentration were available was too small to statistically separate their effects, these authors hypothesized that the dominance of picoplankton in warm, oligotrophic waters was due to differences between picophytoplankton and larger cells in their capacity to use nutrients and in their intrinsic growth rate. Bouman et al. (2011) investigated how vertical stratification controls the community structure of picophytoplankton in subtropical regions. According to their results, photosynthetic picoeukaryotes dominate in weakly stratified waters, whereas in strongly stratified waters, Prochlorococcus cyanobacteria are prevalent. More recently, Flombaum et al. (2013), using a compilation of flow cytometry data from all major ocean regions, concluded that Prochlorococcus and Synechococcus abundance distributions were controlled by temperature and photosynthetically active radiation (PAR, 400–700 nm), discarding the role of nitrate concentration. However, in tropical and subtropical domains, the most well-represented regions in the study of Flombaum et al. (2013), surface nitrate is almost depleted and the variability in its concentration can be widely disconnected from changes in its availability for phytoplankton, which depends more on the supply from deeper waters by turbulent diffusion (Mouriño-Carballido et al., 2016). It is also believed that fine-scale turbulence can enhance the nutrient uptake and subsequent growth of larger phytoplankton (Guasto et al., 2012; Karp-Boss et al., 1996; Lazier and Mann, 1989), especially in regions with low nutrient levels and strong grazing pressure (Barton et al., 2014).

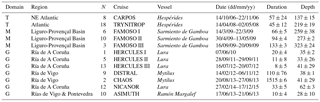
Figure 1Location of the stations sampled in the tropical and subtropical Atlantic Ocean (T), the Mediterranean Sea (M), and the Galician coastal upwelling (G). Small panels provide details about those stations sampled in M (green) and G (blue).
As far as we know, only one study has previously used estimates of nitrate availability, derived from observations of microstructure turbulence, to investigate the role of nutrient availability in controlling the composition of picoplankton communities (Mouriño-Carballido et al., 2016). These authors, using local data from the northwestern Mediterranean Sea, found that different autotrophic picophytoplankton subgroups exhibit contrasting responses to nitrate supply and that as a result the ratio of prokaryotic to picoeukaryotic photoautotrophic biomass decreased with increasing nitrate supply. However, whether these patterns are general and widespread in the ocean remains largely uncertain, given that no concomitant datasets including measurements of turbulent diffusion nutrient flux and picoplankton subgroup structure have been available to date.
Table 1Details of the data included in this study. Domain refers to the tropical and subtropical Atlantic Ocean (T), the Mediterranean Sea (M), and the Galician coastal upwelling (G). N indicates the number of stations sampled during each cruise. Duration (mean ± standard deviation, in minutes) is the time used for the turbulence profiler deployment in each station. Depth (mean ± standard deviation, in meters) is the maximum depth reached by the microstructure profiler.
Here we extend the analysis described in Mouriño-Carballido et al. (2016) by combining a dataset of picoplankton community composition, hydrographic properties, turbulent mixing, and inorganic nutrient concentrations collected at a total of 97 stations. Observations were made in contrasting environments of the Atlantic Ocean in order to quantify the role of temperature, light, and nitrate availability in the composition of the picoplankton community and to describe the ecological niches of each picoplankton subgroup.
This study includes data collected at 97 stations from three contrasting environments covering the tropical and subtropical Atlantic Ocean (T), the northwestern Mediterranean Sea (M), and the Galician coastal upwelling ecosystem (G), between October 2006 and December 2015 (Table 1 and Fig. 1). Two cruises (CARPOS October–November 2006 and TRYNITROP April–May 2008) sampled 26 stations located in the tropical and subtropical Atlantic Ocean. Three other cruises carried out in the Mediterranean Sea (FAMOSO1 March 2009, FAMOSO2 April–May 2009, and FAMOSO3 September 2009) sampled 19 stations during three contrasting hydrographic conditions, covering from winter mixing to summer stratification. Finally, 52 stations were sampled in the Galician coastal upwelling ecosystem during the HERCULES1 July 2010, HERCULES2 September 2011, HERCULES3 July 2012, DISTRAL February–November 2012, ASIMUTH June 2013, CHAOS August 2013, and NICANOR February 2014–December 2015 cruises. Additional information about the sampling design of these cruises is presented in Aranguren-Gassis et al. (2011), Mouriño-Carballido et al. (2011), Mouriño-Carballido et al. (2016), Cermeño et al. (2016), Villamaña et al. (2017), and Moreira-Coello et al. (2017).
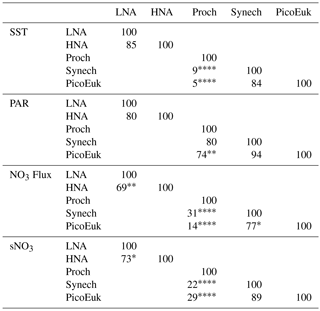
At each station, information about hydrographic properties, turbulent mixing, nitrate concentration, and picoplankton community composition was collected. Light conditions for each sampling station were considered to be the 5-day averaged daily surface PAR obtained from satellite data (http://globcolour.info; last access: 18 October 2018). Light attenuation coefficients were obtained from vertical profiles of PAR estimated with LI-COR sensors using the Beer–Lambert law equation (Kirk, 1994). Depth of the euphotic layer was calculated as the depth at which PAR was 1 % of its surface value. For those cruises for which PAR profiles were not available (ASIMUTH, CHAOS, and NICANOR), which sampled stations in the outer part of the Galician rias, the depth of the photic layer was calculated by considering light attenuation coefficients derived from surface chlorophyll a data, following the algorithms proposed by Morel et al. (2007) for Case-1 waters (log). A comparison of the estimation of the base of the euphotic zone by using the Morel et al. (2007) equation and the data collected by a radiometer during the HERCULES cruise is shown in Fig. A1a.
2.1 Hydrography and turbulent mixing
Hydrographic properties and turbulent mixing were derived from a microstructure turbulent profiler (Prandke and Stips, 1998) equipped with a high-precision conductivity–temperature–depth (CTD) probe, two microstructure shear sensors (type PNS06), and also a sensor to measure the horizontal acceleration of the profiler. Measurements of dissipation rates of turbulent kinetic energy (ε) were conducted to the bottom, or to 137–323 m over deep waters (Table 1). The number of microstructure turbulence profiles used for computing nitrate fluxes at each station were always deployed successively. Sets include 2–11 in the tropical and subtropical Atlantic (37±18 min), 6–7 in the Mediterranean (76±22 min), and 3–402 in the Galician coastal upwelling (65±246 min) (Fig. A1b in Appendix). Episodic bursts of turbulence can induce episodic inputs of nutrient supply, which can be easily missed in sets of a low number of profiles. In coastal regions where short-term variability in mixing processes is expected to be higher, our dataset includes two high-frequency samplings carried out in the outer part of Ría de Vigo (Galician upwelling ecosystem) in August 2013 (CHAOS cruises). During these cruises two 25 h series of turbulent microstructure and current observations were carried out during spring and neap tides. Turbulent kinetic energy dissipation at the interface between upwelled and surface waters was enhanced by 2 orders of magnitude during the ebbs, as the result of the interplay of the bidirectional upwelling circulation and the tidal current shear (Fernández-Castro et al., 2018). Diffusive nitrate fluxes due to the enhanced dissipation observed during spring tide could be responsible for about half of the phytoplankton primary production estimated in this system during periods of upwelling relaxation–stratification (Villamaña et al., 2017).
The profiler was balanced to have negative buoyancy and a sinking velocity of 0.4 to 0.7 m s−1. The frequency of data sampling was 1024 Hz. The sensitivity of the shear sensors was checked after each use. Due to significant turbulence generation close to the ship, only the data below 5 (HERCULES1, HERCULES2, HERCULES3, DISTRAL, ASIMUTH, CHAOS, and NICANOR) and 10 m (CARPOS, TRYNITROP, FAMOSO1, FAMOSO2, FAMOSO3) were considered reliable. Data processing and calculation of dissipation rates of (ε) were carried out with the commercial software MSSpro. The squared Brunt–Väisälä frequency (N2) was computed from the CTD profiles according to the equation
where g is the acceleration due to gravity (9.8 m s−2), ρw is seawater density (1025 kg m−3), and is the vertical potential density gradient. Vertical diffusivity (Kz) was estimated as
where Γ is the mixing efficiency, here considered to be 0.2 (Osborn, 1980).
2.2 Nutrient supply
Samples for the determination of nitrate (NO3) + nitrite (NO2) were collected from 5±2 (Galician coastal upwelling), 7±1 (Mediterranean), and 11±2 (tropical and subtropical Atlantic Ocean) different depths in rinsed polyethylene tubes and stored frozen at −20 ∘C until analysis on land, according to standard methods using the automated colorimetric technique (Hansen and Koroleff., 1999). The frequency histogram of sampling depths collected for nitrate concentration in each region is indicated in Fig. A1c, whereas the maximum sampling depth at which the microstructure turbulence profiler was deployed is indicated in Table 1. At one station carried out during the NICANOR cruises, where nitrate concentrations were not available, concentration values were obtained by using a nitrate–density relationship built by using all samples (n=52) collected during the NICANOR sampling period. The relationship showed a linear behavior (NO3 ; Adj-r2=0.87; p<0.001) for density ranging between 26.1 and 27.1 kg m−3 (Fig. A1d).
Vertical diffusive fluxes of nitrate into the euphotic zone were calculated following Fick's law as
where ΔNO3 is the nitrate vertical gradient obtained by linear fitting of nitrate concentrations in the nitracline, determined as a region of approximately maximum and constant gradient, and () is the averaged turbulent mixing over the same depth interval. In the Galician coastal upwelling, nitrate diffusive fluxes were estimated over a fixed depth interval using the same procedure (10–40 m) except at the shallowest stations at which we compute the surface–bottom flux.
Most stations carried out in the Galician coastal upwelling were conducted inside three different rias (Ría de Vigo, Ría de Pontevedra, and Ría de A Coruña). The rias are coastal embayments affected by seasonal wind-driven coastal upwelling of cold, nutrient-rich North Atlantic Central Water (Fraga, 1981; Wooster et al., 1976; Álvarez-Salgado et al., 1993). The Galician rias, despite being, in general, longer and narrower than many open bays in upwelling areas, they resemble them in that its primary hydrographic and circulation features are determined by the extension of wind-driven flow on the external continental shelf throughout the bay (Alvarez-Salgado et al., 2010). Fertilization in the rias occurs essentially by coastal upwelling, with fresh and rain water inputs being residual (2 %) (Fernández et al., 2016). The total nitrate supply in the Galician rias was computed as the sum of nitrate vertical diffusion plus nitrate vertical advection due to coastal upwelling. A simplified estimate of nitrate supply through vertical advection due to upwelling was computed considering the Galician rias as single boxes divided into two layers (Álvarez-Salgado et al., 1993), the deeper one influenced by upwelled inflowing waters and the surface layer dominated by the outgoing flow. Assuming that the bottom layer volume is conservative and stationary, the vertical advective flux (QZ, m3 s−1) would be equivalent to the incoming bottom flux (QB, m3 s−1), computed as the product of the upwelling index (IW, m3 s−1 km−1) and the lengths of the mouth of the rias (ca. 10–11.5 km). IW was averaged over the 3-day period before each cruise from wind data recorded by meteorological buoys located in Cabo Vilán (HERCULES, NICANOR) and Cabo Silleiro (DISTRAL, ASIMUTH, CHAOS, ASIMUTH), or modeled by the Fleet Numerical Meteorology and Oceanography Center (FNMOC) model when buoy data were not available (http://www.indicedeafloramiento.ieo.es; last access: 18 October 2018). Finally, the transport of nitrate into the euphotic zone through vertical advection was computed as
where Abasin is the surface area of the Galician rias, QZ is the vertical advective flux, and [NO3]D is the averaged nitrate concentration at the base of the euphotic layer. Abasin is 141 km2 for Ría de Pontevedra (ASIMUTH), 174 km2 for Ría de Vigo (CHAOS, ASIMUTH, DISTRAL), and 145 km2 for Ría de A Coruña (HERCULES, NICANOR) (see Villamaña et al., 2017; Villamaña et al., 2017; Moreira-Coello et al., 2017; Moreira-Coello et al., 2017, for details).
2.3 Flow cytometry
Picoplankton samples (1.8 mL) for the determination of picoplankton abundance and cell properties were taken from three to nine depths and measured immediately onboard (TRYNITROP), or preserved with paraformaldehyde plus glutaraldehyde (P+G) and frozen at −80 ∘C until analysis in the laboratory (the other cruises). Unfortunately, due to problems with sample preservation, only heterotrophic or autotrophic picoplankton subgroup data were available for the DISTRAL and ASIMUTH cruises, respectively. Two aliquots from the same sample were used for the study of picophytoplankton (0.6 mL) and heterotrophic prokaryotes (0.4 mL), analyzed at high (mean 60 µL min−1) and low (mean 18 µL min−1) flow rates for 4 and 2 min, respectively. Before the analysis, the DNA of heterotrophic prokaryotes was stained with nucleic-acid-specific fluorescent dye (SYTO-13 or SYBR1). A FACSCalibur flow cytometer (Becton, Dickinson and Company) equipped with a laser emitting at 488 nm was used to measure and count picoplankton. Autotrophic cells were separated into two groups of cyanobacteria (Synechococcus and Prochlorococcus) and one group of small picoeukaryotes, based on their fluorescence and light scatter signals (size scatter, SSC), as explained in Calvo-Díaz and Morán (2006). Two groups of heterotrophic prokaryotes (LNA and HNA) were distinguished based on their relative green fluorescence, which was used as a proxy for nucleic acid content (Bouvier et al., 2007; Gasol and del Giorgio, 2000).
In order to estimate biovolume (BV), we used an empirical calibration between SSC and cell diameter (Calvo-Díaz and Morán, 2006), assuming spherical shape for all groups. The following volume-to-carbon conversion factors were used for picoautotrophic groups: 230 fg C BV for Synechococcus, 240 fg C BV for Prochlorococcus, and 237 fg C BV for picoeukaryotes (Worden et al., 2004). For bacteria, BV was converted into carbon biomass by using the allometric relationship: 108.8 fg C BV0.898 (Gundersen et al., 2002). More details about the processing and analysis of flow cytometry samples are provided in Calvo-Díaz and Morán (2006) (Calvo-Díaz and Morán, 2006, TRYNITROP), Gomes et al. (2015) (Gomes et al., 2015, FAMOSO), Villamaña et al. (2017) (Villamaña et al., 2017, CHAOS), and Moreira-Coello et al. (2017) (Moreira-Coello et al., 2017, NICANOR). Abundance data obtained at different depths for each station were combined to compute depth-integrated biomass for the photic layer.
2.4 Generalized additive models
A generalized additive model (GAM) approach was used to predict depth-integrated biomass of each picoplankton subgroup, the contribution of LNA prokaryotes to heterotrophic picoplankton, the cyanobacteria-to-picoeukaryote ratio, and the autotrophic-to-heterotrophic ratio based on observations and estimates of three environmental factors: sea surface temperature (SST), daily surface PAR, and the transport of nitrate into the euphotic zone (NO3 flux), including both diffusive and advective processes. GAMs assume that the effect of each predictor on the response variable can be described by smoothed functions whose effects are additive. Due to the large number of zero observations, data overdispersion, and the need for a single parsimonious model to make predictions for a large number of groups, we assumed that the depth-integrated biomass of each picoplankton subgroup, relative contribution values, and biomass ratios all followed negative binomial distributions. Those niche descriptors that did not follow normal distributions were log transformed. The complete model structure for the biomass of each picoplankton subgroup was
where yj represents the depth-integrated biomass for each picoplankton subgroup j, and s a cubic regression spline used for fitting the observations to the model (Wood, 2006).
Generalized models include a function linking the mean value of yj and the predictors. For those response variables that followed a negative binomial distribution, the used link function was the natural logarithm. The LNA contribution to total heterotrophic prokaryotes was adjusted using a Gaussian distribution and an identify link (Wood et al., 2016). The inclusion of the different predictors to explain the response variable (the biomass of each picoplankton subgroup, its relative contribution, and biomass ratios) was assessed via stepwise model selection using the minimum Akaike information criterion (Hastie and Tibshirani, 1993).
Smooth terms were tested using a Bayesian test (Marra and Wood, 2012) to prevent overfitting. GAMs were evaluated based on explanatory power (explained variance) and goodness of fit (GOF). GOF was assessed via quantile–quantile (QQ) plots of Pearson residuals (provided in SM Fig. A2). All calculations were carried out using the mgcv package (Wood, 2011) in R (R Core Team, 2015).
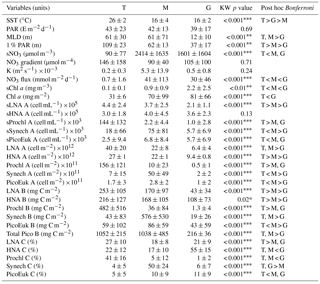
Table 2Mean ± standard deviation of sea surface temperature (SST), surface photosynthetic active radiation (PAR), mixed-layer depth (MLD), photic layer depth (1 % PAR), surface nitrate concentration (sNO3), nitrate gradient, vertical diffusivity (K), nitrate supply (NO3 flux), surface chlorophyll (sChl a), photic layer depth-integrated chlorophyll a (Chl a); biomass (B), abundance (A), and contribution (C) to total picoplankton biomass (Total Pico B); and surface abundance (s) of LNA and HNA bacteria, Prochlorococcus, Synechococcus and picoeukaryotes computed for the tropical and subtropical Atlantic Ocean (T), the Mediterranean (M), and the Galician coastal upwelling (G). MLD was estimated from an increase in water column density of 0.125 Kg m−3 relative to surface values. A nonparametric one-way ANOVA (Kruskal–Wallis) was performed to test the null hypothesis that independent groups come from the same distribution. The Bonferroni multiple comparison test was applied a posteriori to analyze the differences between every pair of groups (; ; ).
2.5 Niche overlap analysis
The estimation of niche overlap among different picoplankton subgroups based on nonparametric kernel density functions (NOK) was calculated following Mouillot et al. (2005):
where NO is the niche overlap between picoplankton subgroups i and j for the environmental factor t, and fit and fjt are the kernel population density functions of factor t for species i and j, respectively. In order to correct the correlation among niche predictors, we used the estimator in a dependent sample (EDS) proposed by Kark et al. (2002).

Figure 2Box-and-whisker plots of sea surface temperature (SST), surface photosynthetic active radiation (PAR), nitrate supply (NO3 Flux), surface chlorophyll a concentration (sChl a), and contribution to total picoplankton biomass of low (LNA) and high (HNA) nucleic acid content bacteria, Prochlorococcus (Proch), Synechococcus (Synech), and small picoeukaryotes (PicoEuk) computed for the tropical and subtropical Atlantic Ocean (T), the Mediterranean (M), and the Galician coastal upwelling (G). In each box, the central mark indicates the median, the notches the 95 % confidence interval for the median, and the bottom and top edges of the box the 25th and 75th percentiles, respectively. The whiskers extend to the most extreme data points not considered outliers, and the outliers are plotted individually using white circles.
To assess the statistical niche differences between subgroups, null model permutation tests were performed to verify whether the niche overlaps were significantly lower than 100 % (Geange et al., 2011). When the contribution of depth-integrated biomass for each picoplankton subgroup exceeded that expected by chance (one-third for autotrophic and one-half for heterotrophic picoplankton), niche predictors for each station were selected. Statistical null distributions (the distribution of the statistic test under the null hypothesis of no niche differentiation) were generated by calculating pseudo-values through randomly permuting group labels in the corresponding dataset over 10 000 runs. The distributions of the average niche overlaps for the null model were then computed. Niche overlap calculations and associated null model tests were performed using the density function and the source code provided as supporting information in Geange et al. (2011). All calculations were performed using R (R Core Team, 2015).
3.1 Environmental variables and picoplankton biomass
Our database covered a wide environmental gradient from oligotrophic to eutrophic conditions. Stations sampled in the tropical and subtropical Atlantic Ocean (T) were, on average, characterized by warm surface waters (26±2 ∘C, mean ± SD) where the supply of nitrate through vertical diffusion from deeper waters (0.7±1.6 mmol N m−2 d−1) and surface chlorophyll a were low (0.1±0.1 mg m−3) (Table 2 and Fig. 2). The Mediterranean Sea, sampled from March to September, was characterized by cooler surface waters (16±4 ∘C) and intermediate values of both nitrate vertical diffusive supply (41±113 mmol N m−2 d−1) and also surface chlorophyll a (0.9±0.9 mg m−3). Finally, the stations sampled in the Galician coastal upwelling system, which included year-round samples, were characterized by relatively cold surface waters (16±2 ∘C), enhanced rates of nitrate supply (30±46 mmol N m−2 d−1), and high values of surface chlorophyll a (2.2±2.5 mg m−3). No statistically significant differences were observed in averaged surface PAR among the three regions.
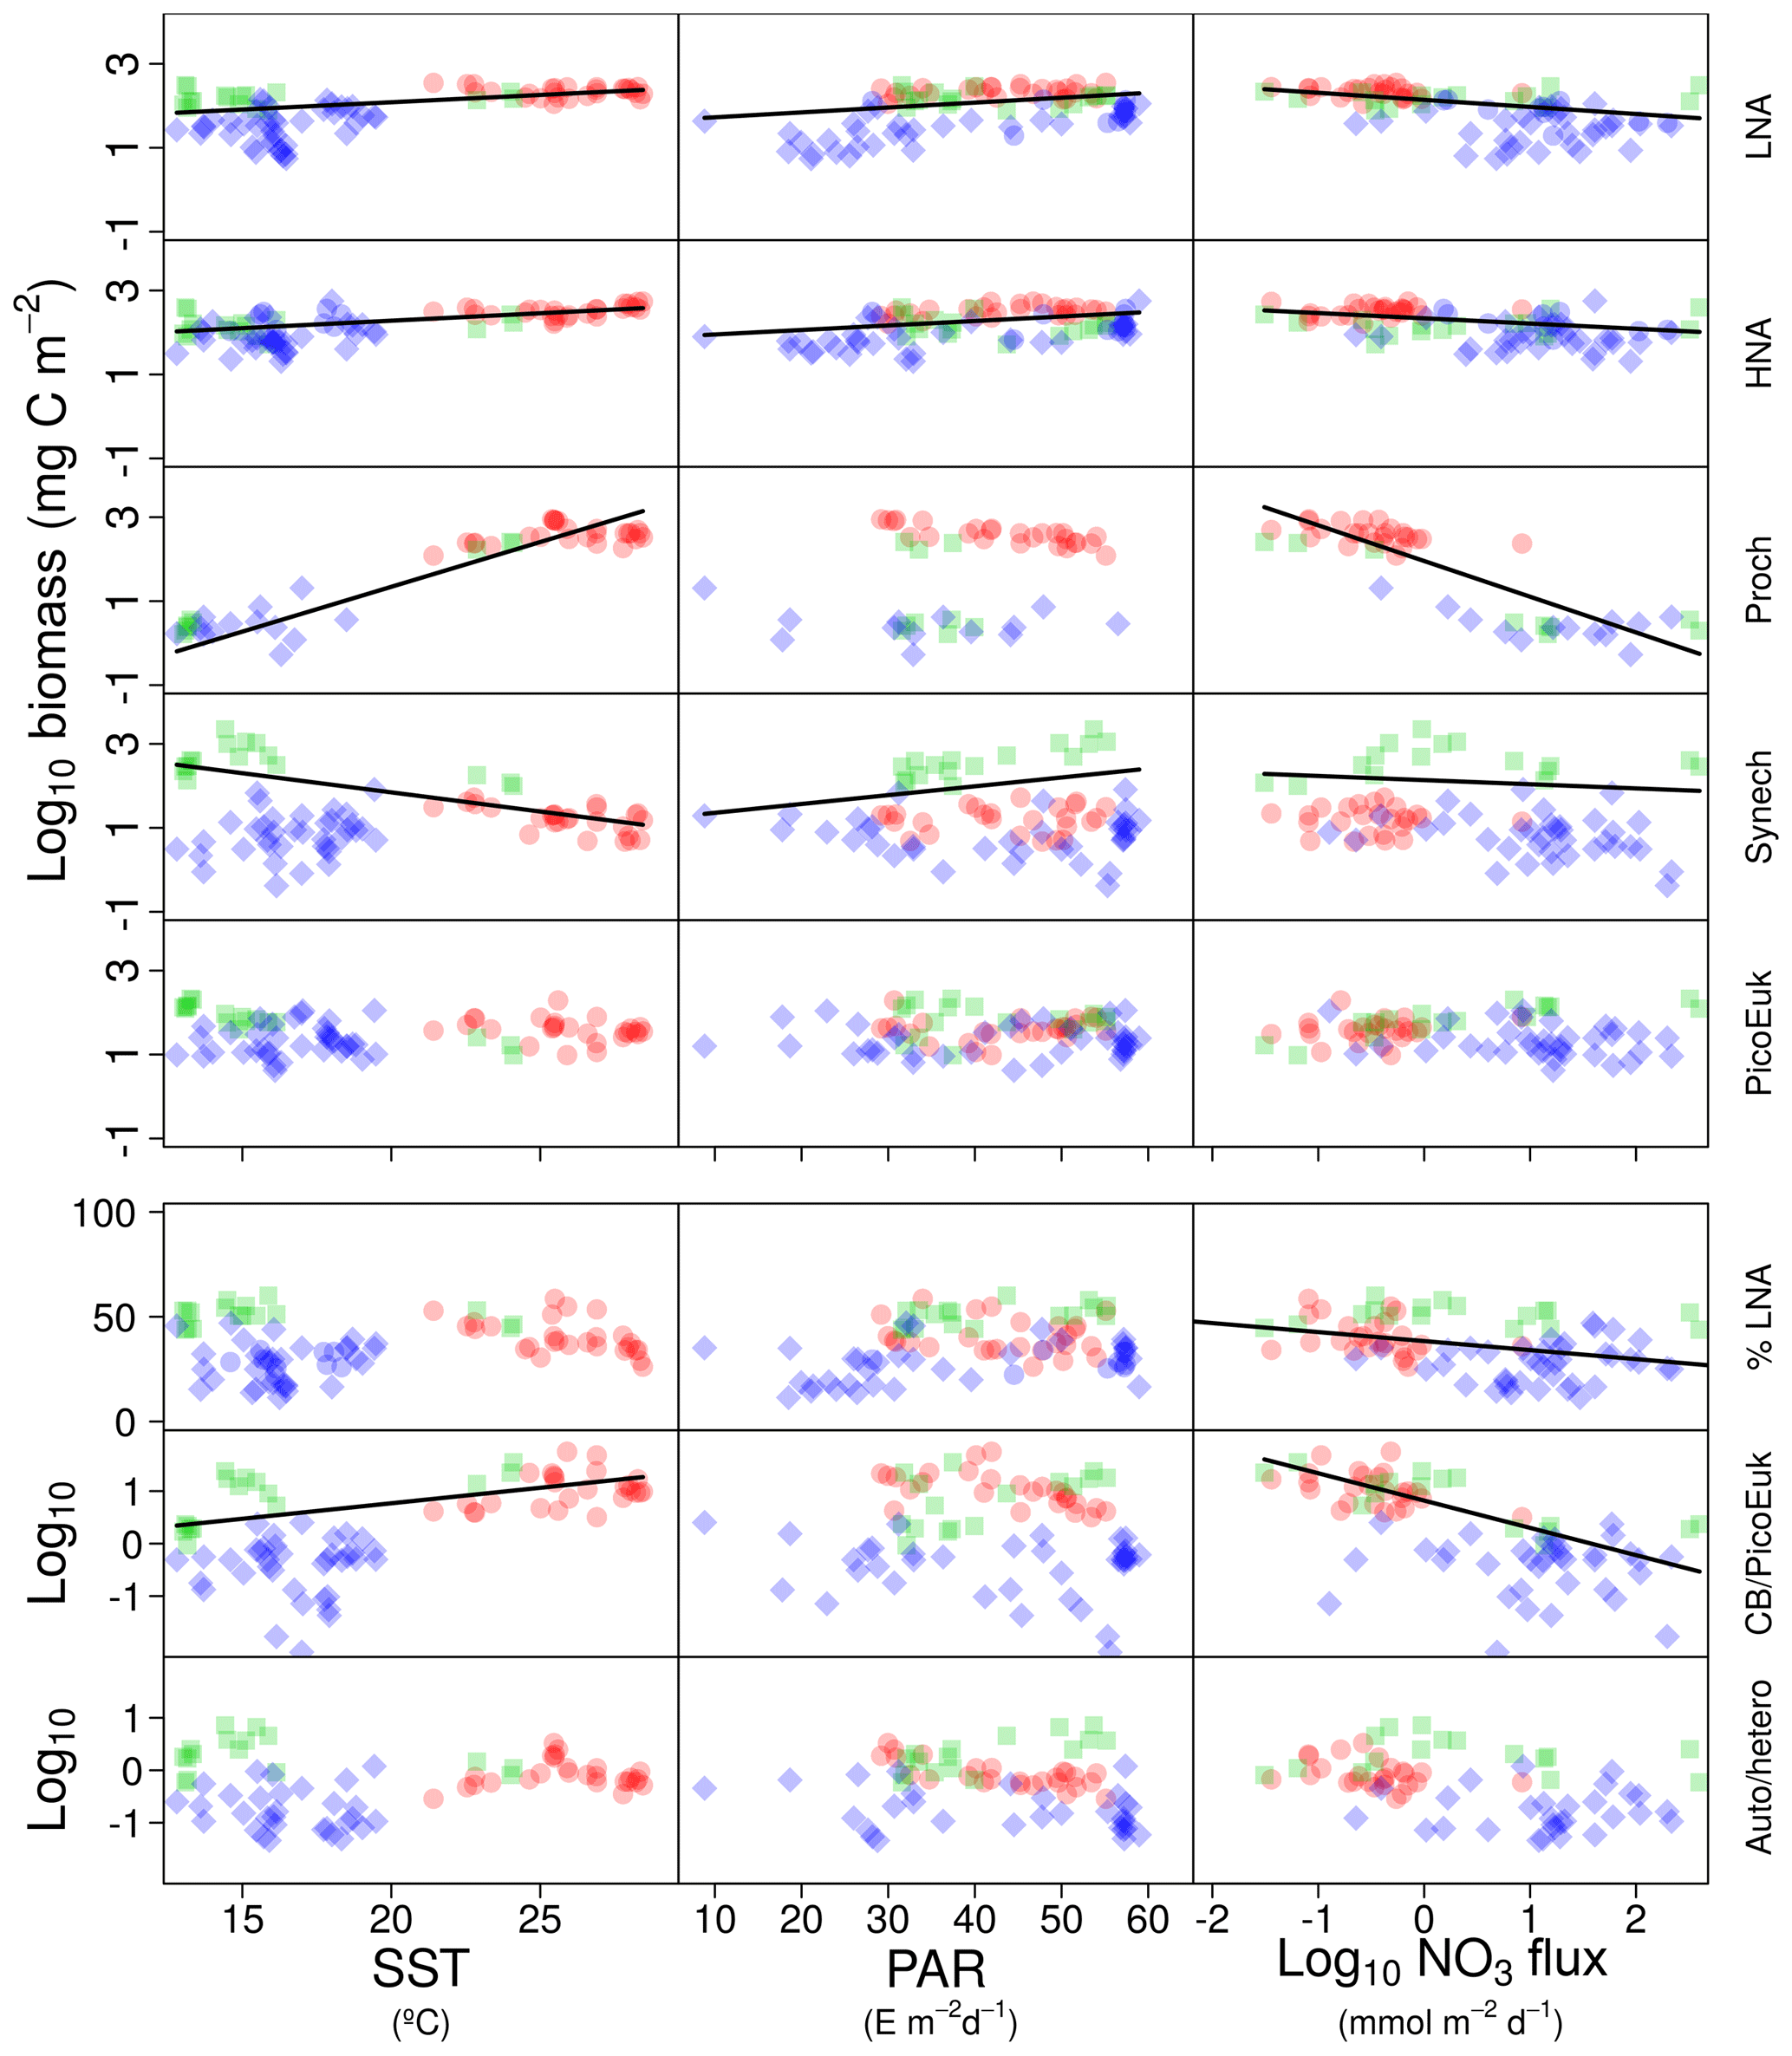
Figure 3Pair scatter plots representing the relationship among log-transformed depth-integrated biomass for each picoplankton subgroup, the contribution of bacteria with a low nucleic acid content to heterotrophic picoplankton biomass (%LNA), the ratio of cyanobacteria (Prochlorococcus + Synechococcus) to picoeukaryote depth-integrated biomass (CB ∕ PicoEuK), and the ratio of autotrophic to heterotrophic picoplankton biomass (Auto ∕ hetero) versus sea surface temperature (SST), surface photosynthetically active radiation (PAR), and nitrate flux (NO3 flux). Significant linear relationships are indicated as solid (p value <0.01) black lines. Samples collected at different regions are indicated as red dots (tropical and subtropical Atlantic Ocean), green squares (Mediterranean), and blue diamonds (Galician coastal upwelling).
Differences in picoplankton biomass and composition were also observed among the three domains. Averaged photic layer depth-integrated total picoplankton biomass (including both LNA and HNA prokaryotes, Prochlorococcus, Synechococcus, and picoeukaryotes) was higher in the tropical and subtropical Atlantic (1052±215 mg C m−2) and the Mediterranean (1038±485 mg C m−2), compared to the Galician coastal upwelling (216±36 mg C m−2) (Table 2). In the tropical and subtropical Atlantic, the contribution of Prochlorococcus to total picoplankton biomass was 41 %, followed by LNA (27 %) and HNA (22 %) prokaryotes, with smaller contributions of Synechococcus and picoeukaryotes (<5 % each). In the Mediterranean, picoplankton biomass was on average dominated by Synechococcus (50 %), followed by LNA and HNA prokaryotes (∼17 % for each group), picoeukaryotes (10 %), and Prochlorococcus (5 %). Finally, HNA (55 %) and LNA (21 %) prokaryotes dominated in the Galician coastal upwelling system, followed by picoeukaryotes (11 %), Synechococcus (6 %), and Prochlorococcus (1 %).
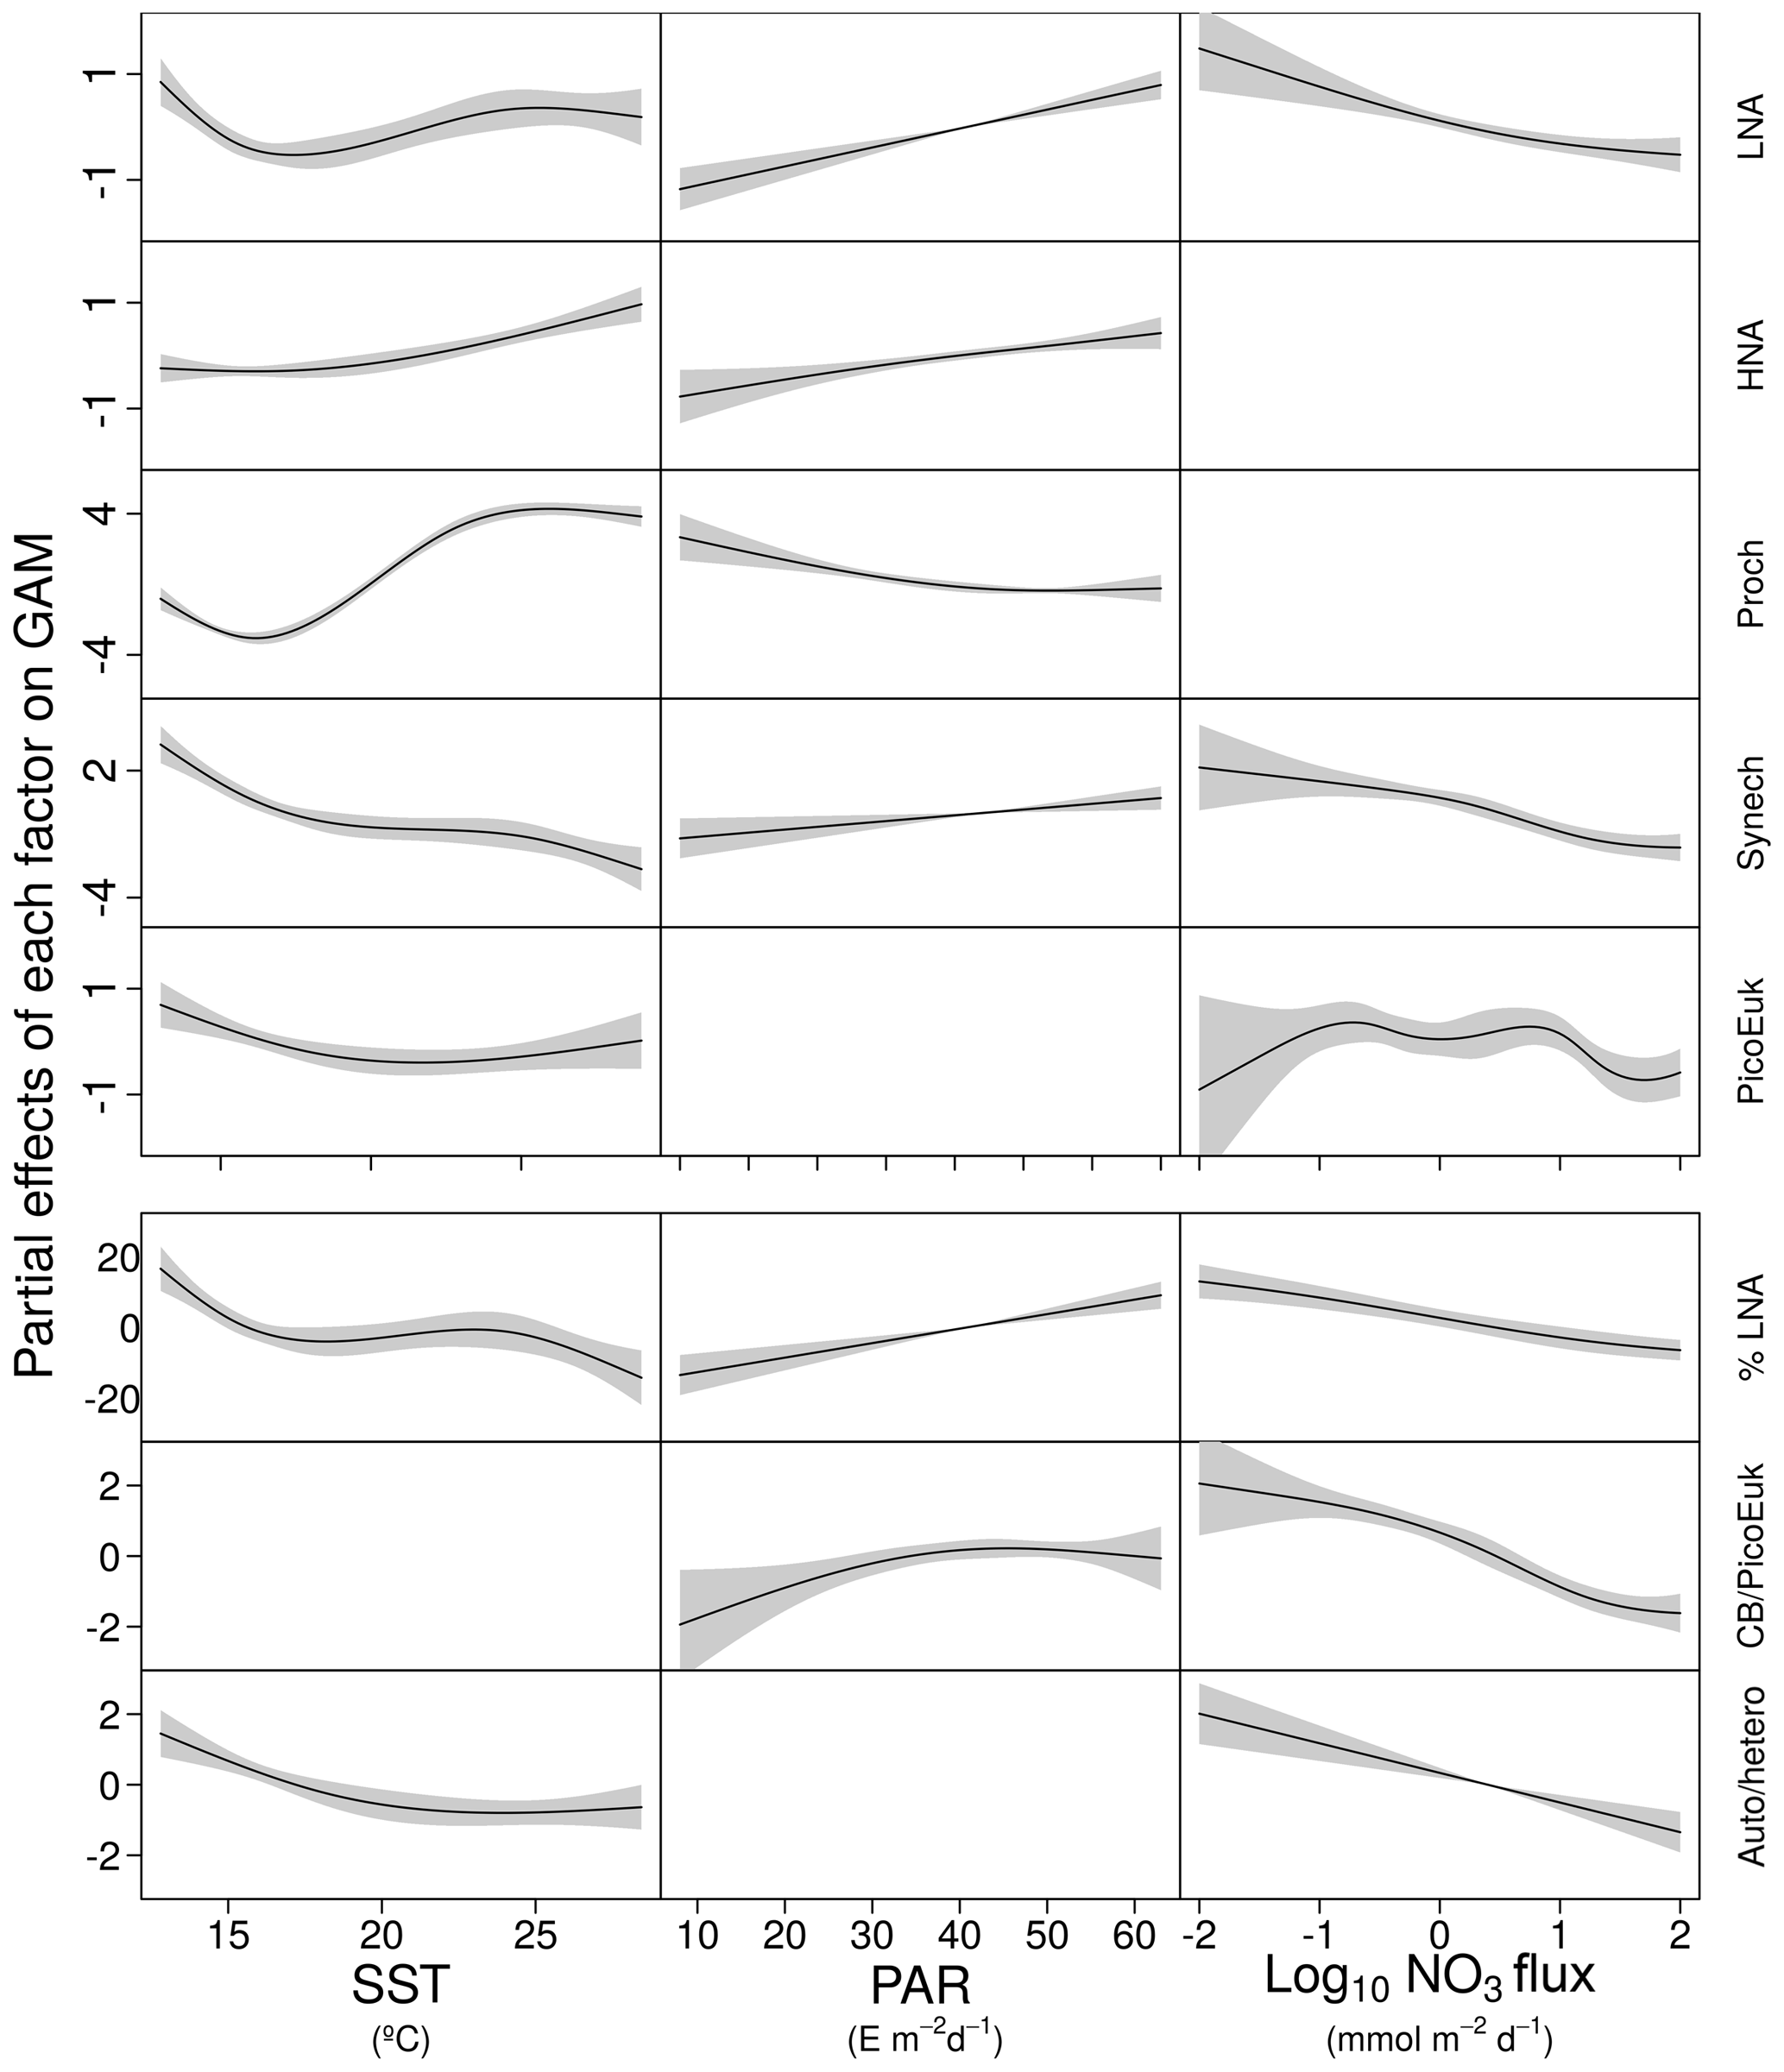
Figure 4GAM-predicted effects of the response variables (biomass and contribution of picoplankton subgroups) as a smooth function of sea surface temperature (SST), photosynthetically active radiation (PAR), and nitrate flux (NO3 flux). All terms were centered at zero. Significant linear relationships are indicated as solid (p value <0.01) black lines. Shaded regions represent the 95 % confidence intervals of the smooth spline functions. Intercept values were 4.6 (LNA), 5.1 (HNA), 2.1 (Prochlorococcus), 3.6 (Synechococcus), 3.7 (picoeukaryotes), 36.4 (contribution of LNA to heterotrophic picoplankton, %LNA), 1.4 (cyanobacteria-to-picoeukaryote ratio, CB/PicoEuk), and −0.1 (autotrophic-to-heterotrophic biomass ratio, Auto ∕ hetero).
Vertical distributions of temperature, nitrate concentration, and the biomass of autotrophic and heterotrophic picoplankton groups for each domain are shown in Fig. A3.
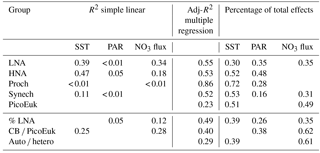
Table 3Simple (R2) and adjusted squared correlation coefficients (Adj-R2) for simple linear regression and multiple generalized additive models (GAMs) built to predict depth-integrated biomass for each picoplankton subgroup, the contribution of LNA bacteria to total heterotrophic picoplankton biomass (% LNA), the ratio of cyanobacteria (Prochlorococcus + Synechococcus) to picoeukaryote depth-integrated biomass (CB ∕ PicoEuK), and the ratio of autotrophic (CB + PicoEuk) to heterotrophic bacteria (LNA + HNA) biomass based on sea surface temperature (SST), surface photosynthetically active radiation (PAR), and nitrate supply (NO3 flux). Negative binomial distribution was assumed. Multiple model selection was based on stepwise regression and the Akaike information criterion (see Sect. 2). Only significant (p value < 0.05) results are shown. Percentage of total effects represents the contribution of each environmental factor to the variability explained by each GAM model (see Sect. 2).
3.2 The role of environmental factors in picoplankton composition
In order to explore the role of temperature, light, and nitrate supply in the composition of the picoplankton community, we first used generalized linear models to investigate simple linear relationships among each of these factors and the depth-integrated biomass of each picoplankton subgroup, the contribution of LNA prokaryotes to heterotrophic picoplankton biomass, the ratio of cyanobacteria (Prochlorococcus and Synechococcus) to picoeukaryote, and the autotrophic-to-heterotrophic picoplankton ratio (Fig. 3 and Table 3). All picoplankton groups except picoeukaryotes exhibited statistically significant relationships with SST. This relationship was negative for Synechococcus and positive for all the other subgroups (Fig. 3). Only LNA and HNA prokaryotes and Synechococcus exhibited significant, positive relationships with surface radiation. All groups except the picoeukaryotes were negatively correlated with nitrate fluxes. The contribution of LNA prokaryotes to heterotrophic picoplankton biomass only exhibited a significant negative relationship with nitrate fluxes, whereas the cyanobacteria-to-picoeukaryote ratio was positively correlated with surface temperature and negatively correlated with nitrate fluxes. Finally, the ratio of autotrophic to heterotrophic biomass was not linearly correlated with any of the studied environmental factors. In order to exclude cross correlation among the three environmental factors and consider the possibility of nonlinear relationships, we subsequently fitted the data to GAMs (Fig. 4 and Table 3). Temperature was the only factor included in the models built for predicting the depth-integrated biomass of all picoplankton subgroups. HNA prokaryotes exhibited a positive relationship with temperature above 19 ∘C, whereas Prochlorococcus and LNA prokaryotes showed a nearly sigmoid curve relationship with a transition between ca. 16 and 25 ∘C (Fig. 4). The relationship between the biomass of both Synechococcus and picoeukaryotes and temperature showed a negative trend until ∼20 ∘C and remained relatively constant above this temperature. PAR was included in the models of all picoplankton groups except picoeukaryotes. Whereas the biomass of Prochlorococcus exhibited a saturation-type relationship with PAR, heterotrophic prokaryotes and Synechococcus showed a linear positive relationship. Finally, only LNA prokaryotes, Synechococcus, and picoeukaryotes exhibited statistically significant relationships with nitrate supply. This relationship was negative for LNA prokaryotes and Synechococcus, whereas picoeukaryotes showed a unimodal function, peaking at ∼1 mmol NO3 m−2 d−1. Nitrate flux was the only factor selected in the models to predict the contribution of LNA prokaryotes to heterotrophic picoplankton biomass and both the cyanobacteria-to-picoeukaryote biomass ratio and the autotrophic-to-heterotrophic biomass ratio. This relationship was negative in the three models. Temperature was also negatively correlated with the contribution of LNA prokaryotes to heterotrophic biomass and the ratio of autotrophic to heterotrophic biomass. Finally, PAR showed a positive correlation with the contribution of LNA prokaryotes to heterotrophic biomass and the cyanobacteria-to-picoeukaryote biomass ratio.
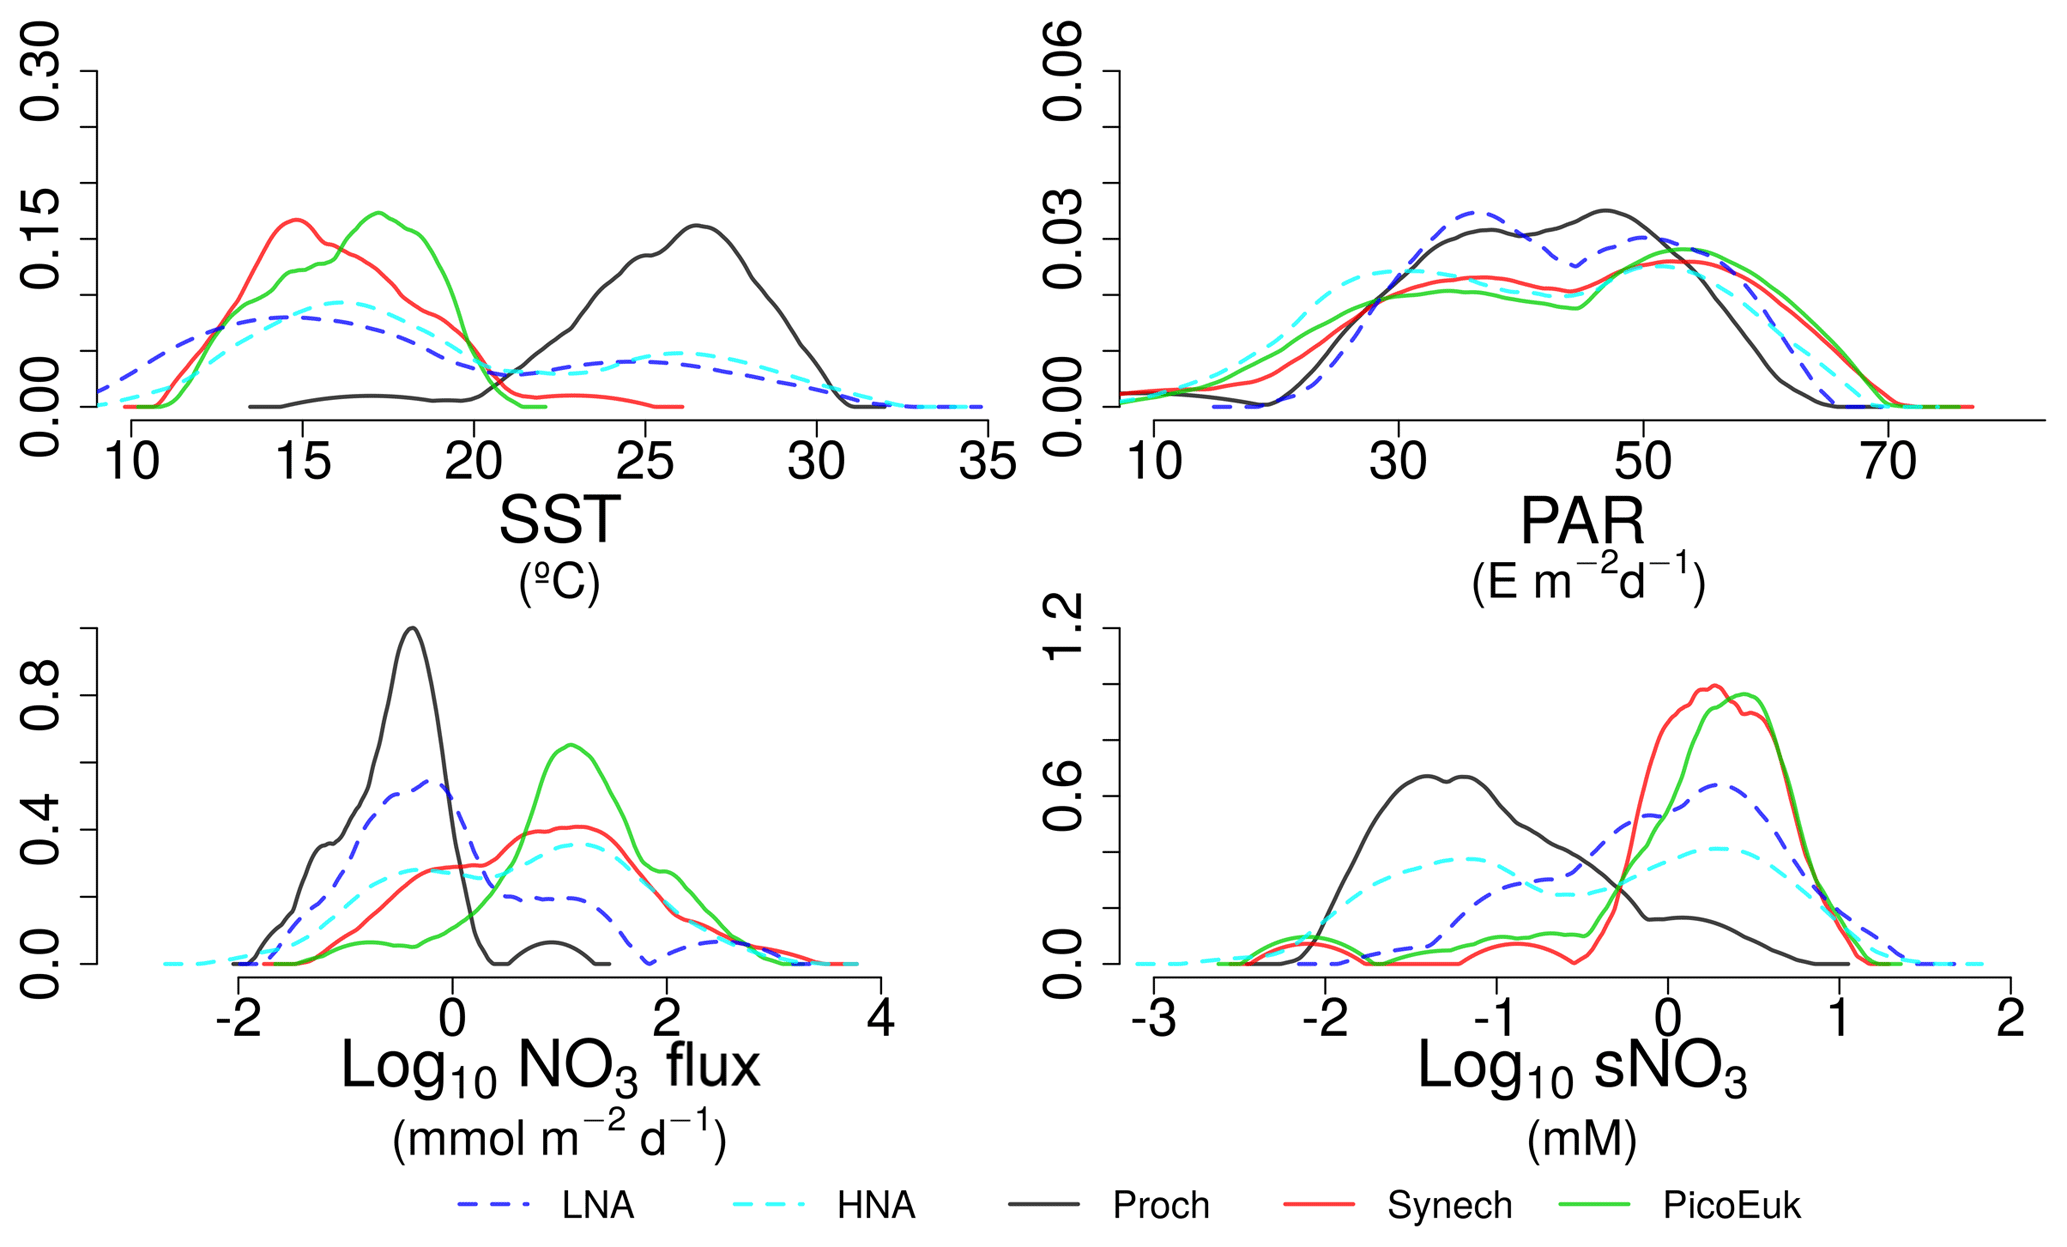
Figure 5Kernel density estimates of LNA and HNA bacteria, Prochlorococcus, Synechococcus, and picoeukaryotes based on the considered niche descriptors: sea surface temperature (SST), surface photosynthetically active radiation (PAR), nitrate flux (NO3 flux), and surface concentration (sNO3).
3.3 Ecological niches for picoplankton groups
By using nonparametric kernel density functions, we investigated the overlapping in the ecological niches of the autotrophic and heterotrophic picoplankton subgroups defined by using the three variables previously considered together with surface nitrate concentration (Fig. 5). Photic layer depth-integrated biomass of each picoplankton group was used for this analysis. These results revealed three ecological niches in the distribution of picoplankton subgroups. Prochlorococcus and LNA prokaryotes were more abundant in warm waters, where nitrate supply was low. HNA prokaryotes and Synechococcus dominated in cooler regions with medium to high nitrate supply, and picoeukaryotes were more abundant in cold waters with high nitrate supply. A large degree of overlapping of the ecological niches for all picoplankton subgroups was observed when only surface light was considered. For each picoplankton subgroup Table 4 shows the partial weighted overlap of the ecological niches defined by the four factors: SST, PAR, nitrate flux, and surface nitrate concentration. According to these data only nitrate supply enabled a statistically significant separation of the niches of both heterotrophic (HNA and LNA prokaryotes) and autotrophic (Prochlorococcus, Synechococcus, and picoeukaryotes) picoplankton subgroups. Although the minimum overlap between Prochlorococcus and the other autotrophic picoplankton subgroups was also well defined by temperature, only nitrate supply could statistically distinguish the niche partitioning between the two groups of heterotrophic prokaryotes (p<0.05) and between Synechococcus and picoeukaryotes (p<0.1).
Table 4Partial weighted niche overlap (%) for each environmental factor and picoplankton subgroup. sNO3 represents surface nitrate concentration. Asterisks denote the existence of significant differences among niches (* p<0.1, p<0.05, p<0.01, p<0.001).
4.1 Environmental factors and ecological niches
Picoplankton community composition and concurrent estimates of nitrate supply into the euphotic zone from highly contrasting marine environments allowed us to conclude that SST and nitrate supply are the main factors controlling the variability in the biomass of different subgroups, whereas surface light generally played a minor role. As far as we know, only one study had previously investigated the role of these environmental factors in the distribution of, in this case, the two major groups of cyanobacteria. By using a large flow cytometry dataset from all major ocean regions, Flombaum et al. (2013) concluded that temperature and light were the most important predictors of the abundances of Prochlorococcus and Synechococcus, with nitrate availability exerting a negligible effect. Although this conclusion seems to be contradictory with the results presented here, some important differences between these studies should be noted. Firstly, Flombaum et al. (2013) used bulk estimates of seawater nitrate concentration as a proxy for nitrate availability in the euphotic zone. However, in near-steady-state systems such as the subtropical gyres, where diffusive nutrient supply into the euphotic zone is slow, nitrate concentrations are kept close to the detection limit due to phytoplankton uptake. For this reason, nitrate concentrations and actual nitrate supply into the euphotic zone in the vast oligotrophic regions are often largely disconnected (Mouriño-Carballido et al., 2011, 2016). Moreover, whereas Flombaum et al. (2013) used Prochlorococcus and Synechococcus abundances determined at several depths in the upper 200 m, we used depth-integrated biomass of both autotrophic and heterotrophic picoplankton subgroups in the photic layer.
Although our results point to both temperature and nitrate supply as important factors controlling the distribution of the picoplankton subgroups (Fig. 4 and Table 3), nitrate supply was the only factor that allowed the distinction among the ecological niches of autotrophic and heterotrophic picoplankton subgroups (Fig. 5 and Table 4). Our attempt to sort out the ecological niches of picoplankton subgroups gave rise to three distinct categories. Prochlorococcus and LNA prokaryotes were more abundant in warmer waters (above 20 ∘C) where the availability of nitrate was low. Synechococcus and HNA prokaryotes prevailed mainly in cooler (below 20 ∘C) marine environments characterized by intermediate and high levels of nitrate supply, and finally, the niche for picoeukaryotes was characterized by low temperatures and high nitrate supply. These results underline the physiological and ecological features of the distinct picoplankton functional subgroups. Our results confirm the previously reported ecological differences between the two major groups of unicellular cyanobacteria (Li, 2009; Partensky and Garczarek, 2010; Scanlan and West, 2002).
Moreover, the ecological niche alignment of the two cyanobacteria genera with the two heterotrophic prokaryotes subgroups is consistent with taxa that prevail in oligotrophic regions (e.g., SAR11) being included in the LNA prokaryotes, whereas copiotrophic and more diverse taxa (Gammaproteobacteria, Bacteroidetes/Flavobacteria, etc.) are generally grouped under HNA (Schattenhofer et al., 2011; Vila-Costa et al., 2012). Although the relationship among stratification, mixing, and nutrient supply is not obvious (Mouriño-Carballido et al., 2016), our results are in general consistent with the patterns described by Bouman et al. (2011). These authors, by using vertical density stratification as a proxy for the three main environmental factors influencing phytoplankton growth (temperature, light, and nutrients) in subtropical regions of the Pacific, Atlantic, and Indian oceans, described the dominance of photosynthetic picoeukaryotes in well-mixed waters and the prevalence of cyanobacteria in strongly stratified conditions.
4.2 Physiological traits of picoplankton subgroups
Although previous studies have revealed that Prochlorococcus may have acquired the ability to use nitrate by horizontal gene transfer, their photosynthetic activity primarily relies on regenerated forms of nitrogen (Malmstrom et al., 2013; Moore et al., 2002). Our results support this view and substantiate that, after controlling for the concurrent effects of light and seawater temperature, Prochlorococcus biomass was uncorrelated with nitrate fluxes. However, it is important to note that we could not discriminate between high-light (HL) and low-light (LL) ecotypes and that the presence of nitrate reductase seems to be more relevant in LL (Berube et al., 2014; Martiny et al., 2009). Evolutionary adaptation to light-limiting conditions makes Prochlorococcus the most efficient light harvesters among Earth's photosynthetic organisms (Morel et al., 1993). Their competitive ability under light-limiting conditions could explain the negative effect of light as a predictor for Prochlorococcus biomass. Ultimately, the photo-physiological strategy of Prochlorococcus leads to (i) thermal sensitivity of photosystem II (Mackey et al., 2013), which limits its fundamental niche to temperatures greater than 15 ∘C (Moore et al., 1995), and (ii) high sensitivity to ultraviolet (UV) radiation in surface waters (Llabrés et al., 2010; Mackey et al., 2013; Sommaruga et al., 2005). This could explain that, after removing the effect of light, our data analysis revealed that the effect of temperature on Prochlorococcus biomass showed a sigmoid relationship as temperature increased.
Synechococcus is able to use both new and regenerated forms of nitrogen (Moore et al., 2002; Mulholland and Lomas, 2008), which largely explains its wider geographical distribution range (Flombaum et al., 2013). The fact that it is more abundant at intermediate levels of nitrate supply is consistent with the lower intracellular nitrogen quota of Synechococcus relative to Prochlorococcus and hence their higher growth rate under saturating nutrient conditions (Marañón et al., 2013). Conversely, the large affinity of Prochlorococcus to acquire nutrients (Partensky and Garczarek, 2010) and absorb light under severe nutrient- and light-limiting conditions (Mella-Flores et al., 2012) precludes the supremacy of Synechococcus in warm and stratified oligotrophic systems (Moore et al., 2007). Although Prochlorococcus and Synechococcus are not very different in cell size and they usually coexist in oligotrophic regions, differences in adaptation to light conditions and UV stress lead to segregate their maximal distributions across space (vertical segregation) and through time (Chisholm, 1992; Mella-Flores et al., 2012).
Picoeukaryotes, like Synechococcus, also exhibited a negative relationship with seawater temperature, again reflecting the superior competitive ability of Prochlorococcus under severe nutrient-limiting conditions (Moore et al., 2007). The relative dominance of cyanobacteria in oligotrophic systems results from the fact that cyanobacteria are less negatively affected by nutrient diffusion limitation than picoeukaryotes (Chisholm, 1992). It is widely accepted that small cells are at an advantage over large cells in stratified open-ocean environments, where nutrient recycling dominates biogeochemical fluxes (Raven, 1998). First, the surface-to-volume ratio increases with decreasing cell size, which narrows the nutrient diffusion boundary layer around the cell and facilitates the acquisition of nutrients in nutrient impoverished environments. Second, small-sized cells have lower sinking rates than their larger counterparts, which allow them to extend their chances of survival in the euphotic layer (Chisholm, 1992; Kiørboe, 1993; Smayda, 1980).
Our analysis indicates that among the picophytoplankton, picoeukaryotes were the most responsive to nutrient fluxes. This is consistent with experimental observations under laboratory-controlled conditions revealing that, within the picoplankton size range, the maximum attainable growth rate increases with increasing cell size (Marañón et al., 2013; Raven, 1994). This positive relationship between maximum growth rate and cell size in the picophytoplankton to small nanophytoplankton size range has been explained as a trade-off between intracellular nitrogen quotas (N requirements) and mass-specific nitrate uptake rates (N uptake) (Marañón et al., 2013). Whereas nitrogen uptake rate exhibits an isometric relationship with cell size, smaller picoplankton cells have substantially larger intracellular nitrogen quotas, which reduce their capability to maximize carbon-specific growth rates. Conversely, high maximum growth rates represent an advantage for picoeukaryotes, compared to any other organism, as they attenuate the effect of loss processes such as predation or the washout of plankton communities in highly dynamic, turbulent systems (Echevarría et al., 2009; Sherr et al., 2005). For instance, microzooplankton is thought to maintain the biomass of their prey under tight control, and thus slight variations in picophytoplankton growth rate may substantially alter the resulting biomass of the different picophytoplankton subgroups (Chen et al., 2009).
The unimodal relationship observed between the biomass of picoeukaryotes and nitrate supply (Fig. 4) could seem at first contradictory with the rising hypothesis proposed by Barber and Hiscock (2006), which describes that improved growth conditions benefit all phytoplankton size classes, including picoplankton. In this regard, Brewin et al. (2014) by using data collected along the Atlantic Meridional Transect cruises showed that <2 µm size-fractionated chlorophyll was positively correlated with total chlorophyll only until a value of 1 mg m−3, and then it did not show any positive relationship with total chlorophyll. It is also important to note that surface abundance of picoplankton subgroups reported in our study, which are consistent with previous observations (Frojan et al., 2014; Teira et al., 2015; Zubkov et al., 2000), did show higher surface abundance of picoeukaryotes in the Galician coastal upwelling and the Mediterranean compared to the tropical and subtropical Atlantic (Table 2 and Fig. A3). However, this pattern was diluted when depth-integrated biomasses were computed since the lower limit for the integration (the base of the photic zone) was much shallower in the coastal upwelling domain (ca. 37 m) compared to the Mediterranean (ca. 62 m) and the tropical and subtropical regions (ca. 109 m).
Heterotrophic prokaryotes also use dissolved inorganic nutrients, including nitrate, for growth (Kirchman, 2000). Consistent with this, Gasol et al. (2009) showed a positive relationship between prokaryotic abundance and a proxy for nutrient supply in a latitudinal gradient across the Atlantic. They did not partition this effect on the two subgroups that can universally be differentiated among bacteria and archaea. Our results suggest that LNA prokaryotes respond less markedly to nutrient fluxes than HNA prokaryotes. The effect of nitrate supply on the biomass of LNA prokaryotes showed a linear negative relationship as nitrate supply increases, perhaps associated with their ability to survive under nutrient starving conditions (Mary et al., 2008). Under such conditions, proteorhodopsin-containing LNA prokaryotes (e.g., example SAR11) can use energy from light (Mary et al., 2008; Pinhassi et al., 2016), improving their competitiveness against non-proteorhodopsin-containing prokaryotes. Consistent with this idea, our results showed a positive relationship between the biomass of LNA prokaryotes and PAR. Li et al. (2004) already proposed the ubiquity of this bottom-up control of prokaryotic abundance in oligotrophic environments (<1 mg Chl m3). Therefore, we believe that that the underlying cause for the clear niche difference between LNA and HNA prokaryotes is more the difference in the suite of genes (Schattenhofer et al., 2011) than in cell size (Morán et al., 2015).
Picoplankton often dominate marine phytoplankton biomass and primary production in oligotrophic regions (Agawin et al., 2000; Chisholm, 1992), contribute overwhelmingly to the recycling of organic matter (Azam et al., 1983; Fenchel, 2008), and could have a substantial contribution to the export of carbon to the deep ocean (Richardson and Jackson, 2007). However, our limited understanding about the factors that control picoplankton community composition constrains our ability to include them in ocean biogeochemical models and predict the consequences of future global change scenarios. For the first time, by combining observations that allowed us to estimate vertical nutrient fluxes, instead of nitrate concentrations, we investigated the role of temperature, light, and nitrate supply in the distribution of the major autotrophic and heterotrophic picoplankton subgroups. Our results highlight the role of nitrate supply in the distribution of picoplankton subgroups, as it was the only factor that allowed the statistically significant distinction of the ecological niches between the autotrophic and heterotrophic picoplankton subgroups. In general, autotrophic picoplankton biomass was dominated by Prochlorococcus in warmer waters where the availability of nitrate was low and by Synechococcus and picoeukaryotes in cooler waters with medium to high nitrate availability. Similarly, LNA prokaryotes dominated heterotrophic picoplankton biomass in regions of weak nitrate supply, whereas HNA prokaryotes dominated the heterotrophic community in regions of enhanced nutrient supply. Although our study included 97 stations sampled in contrasting environments, a larger dataset, including a broader range of environmental conditions, will be needed to accurately discern the role of temperature and nitrate supply in the field, as both factors are strongly correlated in the ocean. In this regard, by growing three phytoplankton species (the diatom Skeletonema costatum, the coccolithophore Emiliania huxleyi, and the picocyanobacteria Synechococcus spp.) in the lab, Marañón et al. (2018) showed a reduced sensitivity of metabolic rates to temperature variability under nutrient-depleted conditions, suggesting that nutrient availability controls the temperature dependence of metabolism. Consistent with these results, our statistical analyses stress the relevance of nitrate supply in the distinction of the ecological niches of heterotrophic and autotrophic picoplankton subgroups. Other mechanisms of nutrient supply, such as mesoscale and sub-mesoscale turbulence, atmospheric deposition, nitrogen fixation, and more complex three-dimensional dynamics (Bonnet et al., 2005; Estrada et al., 2014; Fernández-Castro et al., 2015; Jenkins and Doney, 2003) as well as the influence of trophic interactions (Baudoux et al., 2007; Chen et al., 2009; Rusch et al., 2010; Van Mooy et al., 2006) deserve further investigation.
According to our results, in a future ocean in which global change scenarios predict an increase in surface temperature and stratification (Howes et al., 2015), the resulting decrease in nitrate supply into the euphotic zone (Lewandowska et al., 2014) would lead to the dominance of autotrophic picoplankton by cyanobacteria, whereas the picoeukaryotes would decrease their contribution. Due to the smaller contribution of cyanobacteria to the transfer of carbon to the deep ocean compared to picoeukaryotes, this pattern could have important implications in the efficiency of the biological carbon pump (Corno et al., 2007).
The complete dataset used in this study is provided in the Supplement.
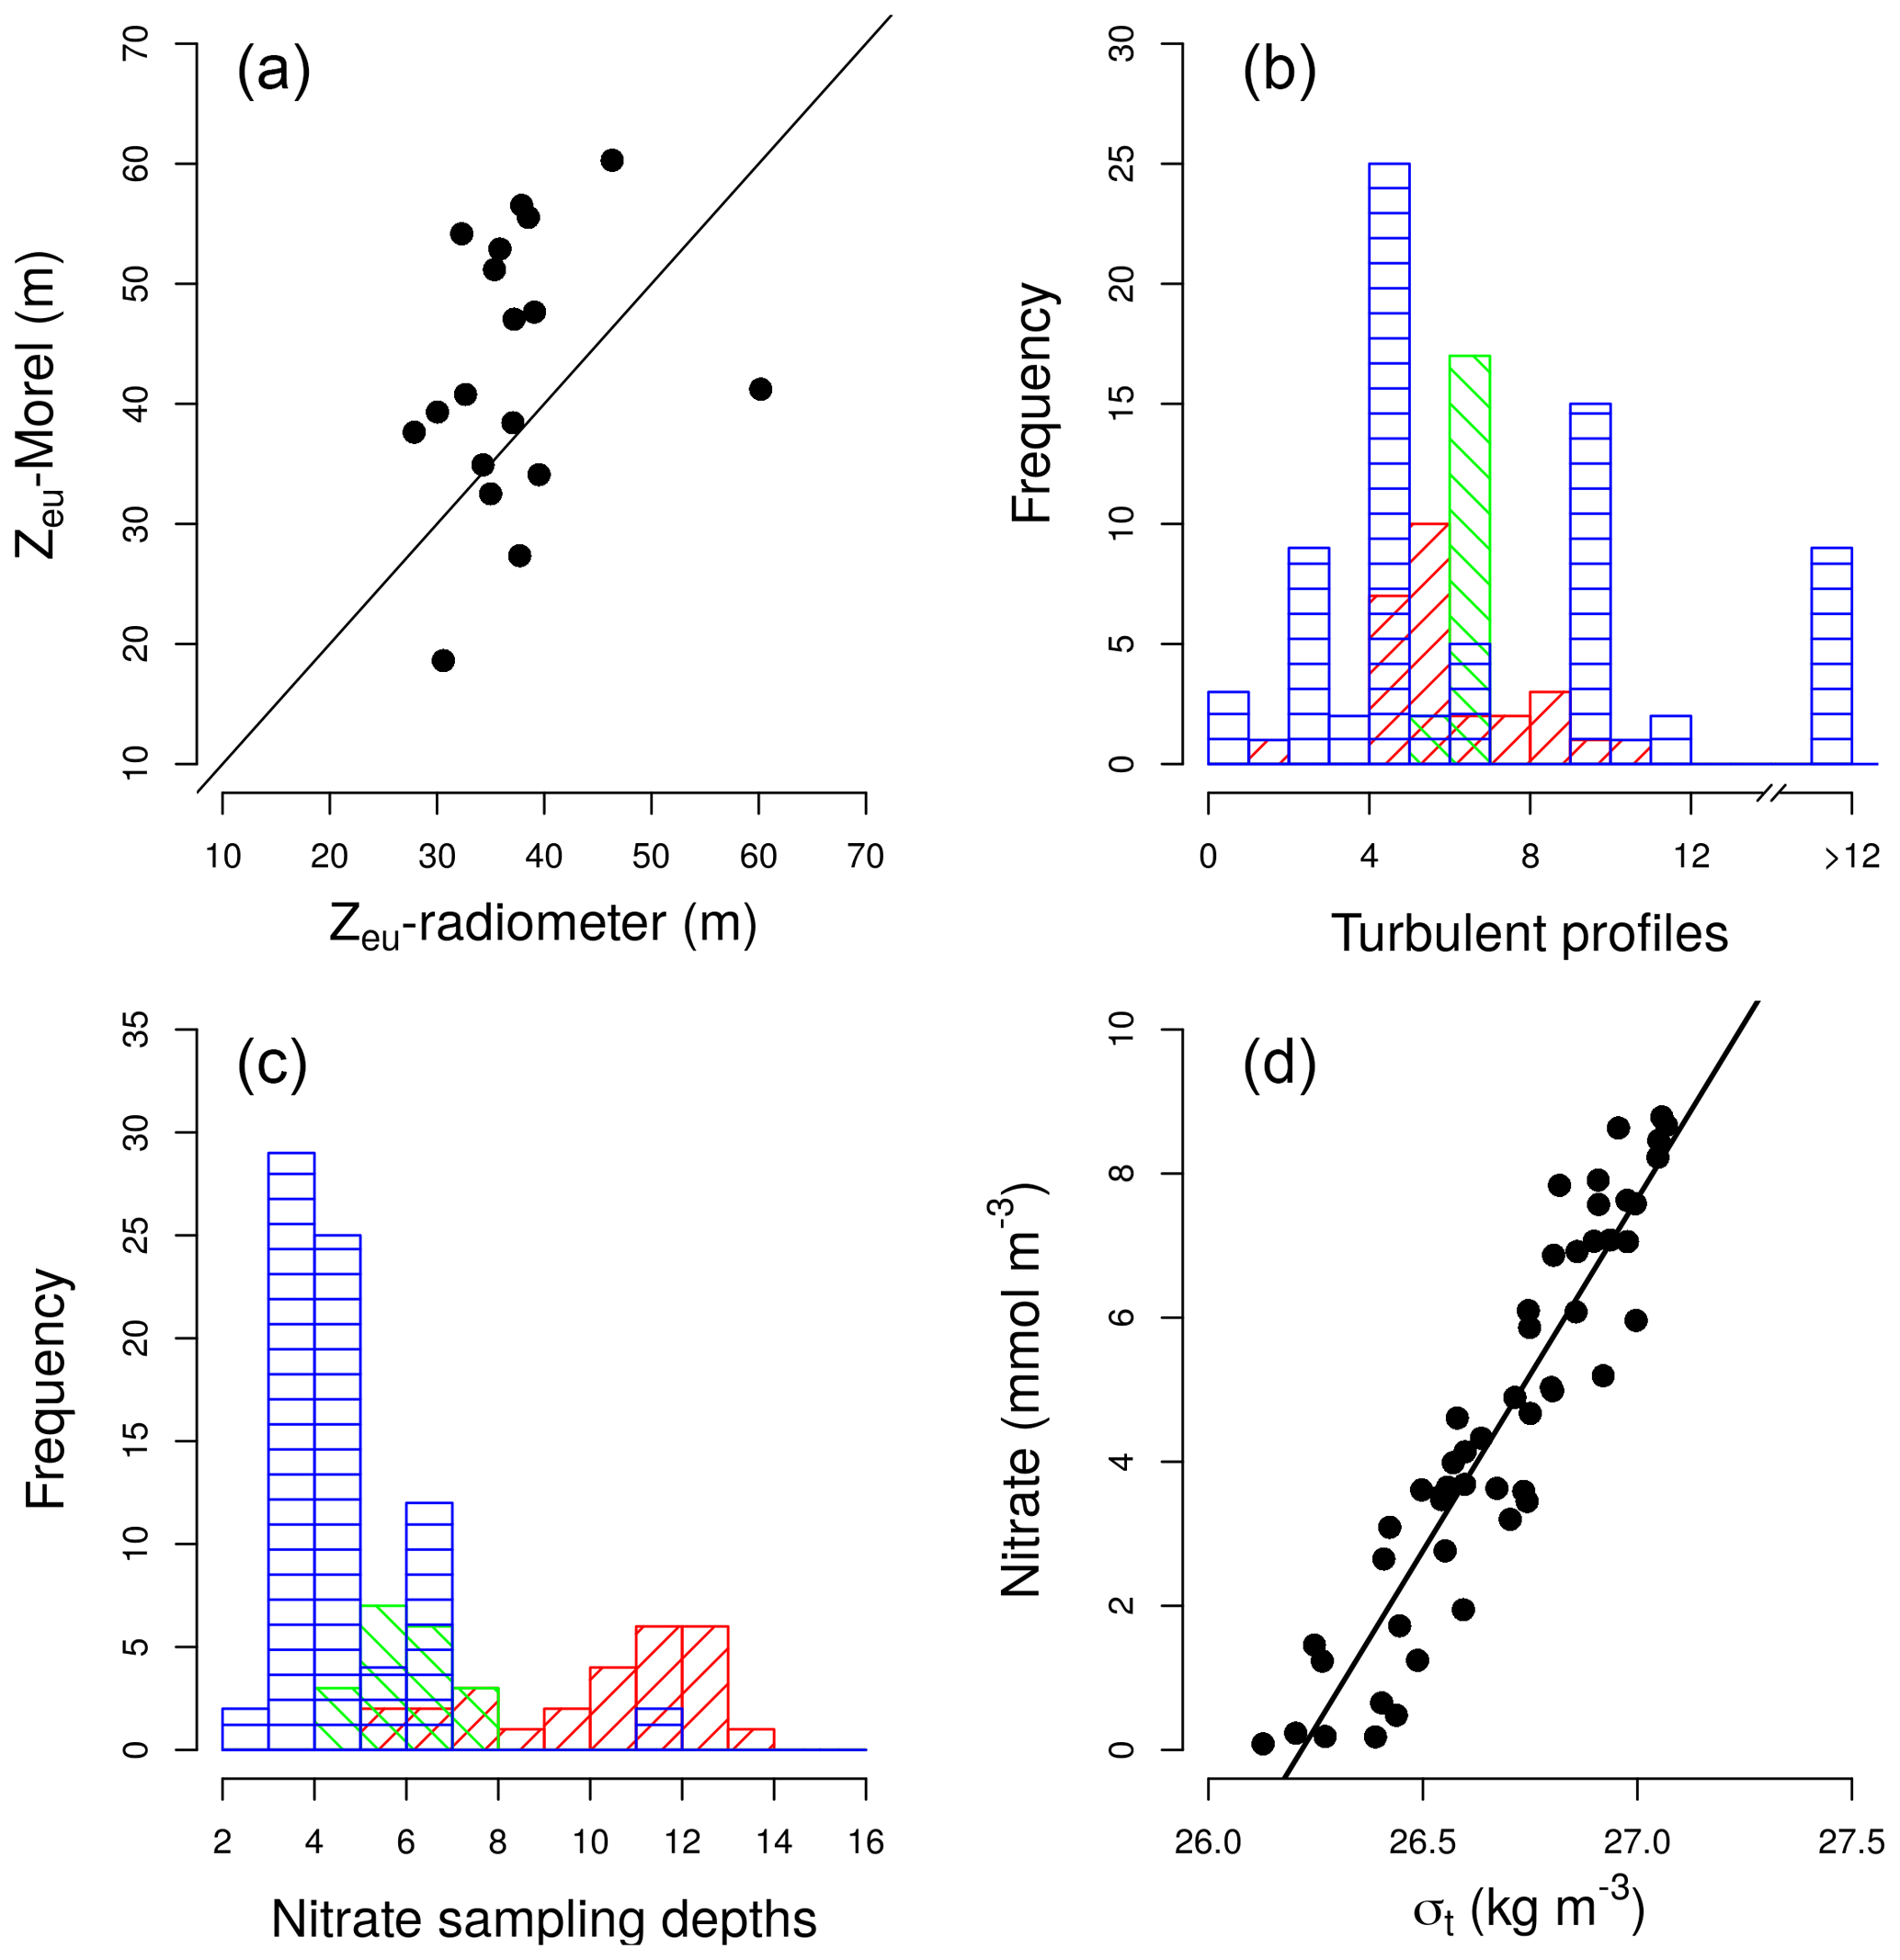
Figure A1(a) Pair scatter plot representing the relationship between the euphotic zone depth (Zeu) computed using the Morel et al. (2007) equation and the data collected by a radiometer during the HERCULES cruises; the solid line represents 1:1 relationship. (b) Frequency histogram of the number of turbulence profiles deployed at each station and domain. (c) Frequency histograms of the number of samples collected for the determination of nitrate concentration at each station and domain: tropical and subtropical Atlantic Ocean (red), the Mediterranean (green), and the Galician coastal upwelling (blue). (d) Pair scatter plot representing the relationship between nitrate concentration and density built by using all samples collected during the NICANOR sampling period.
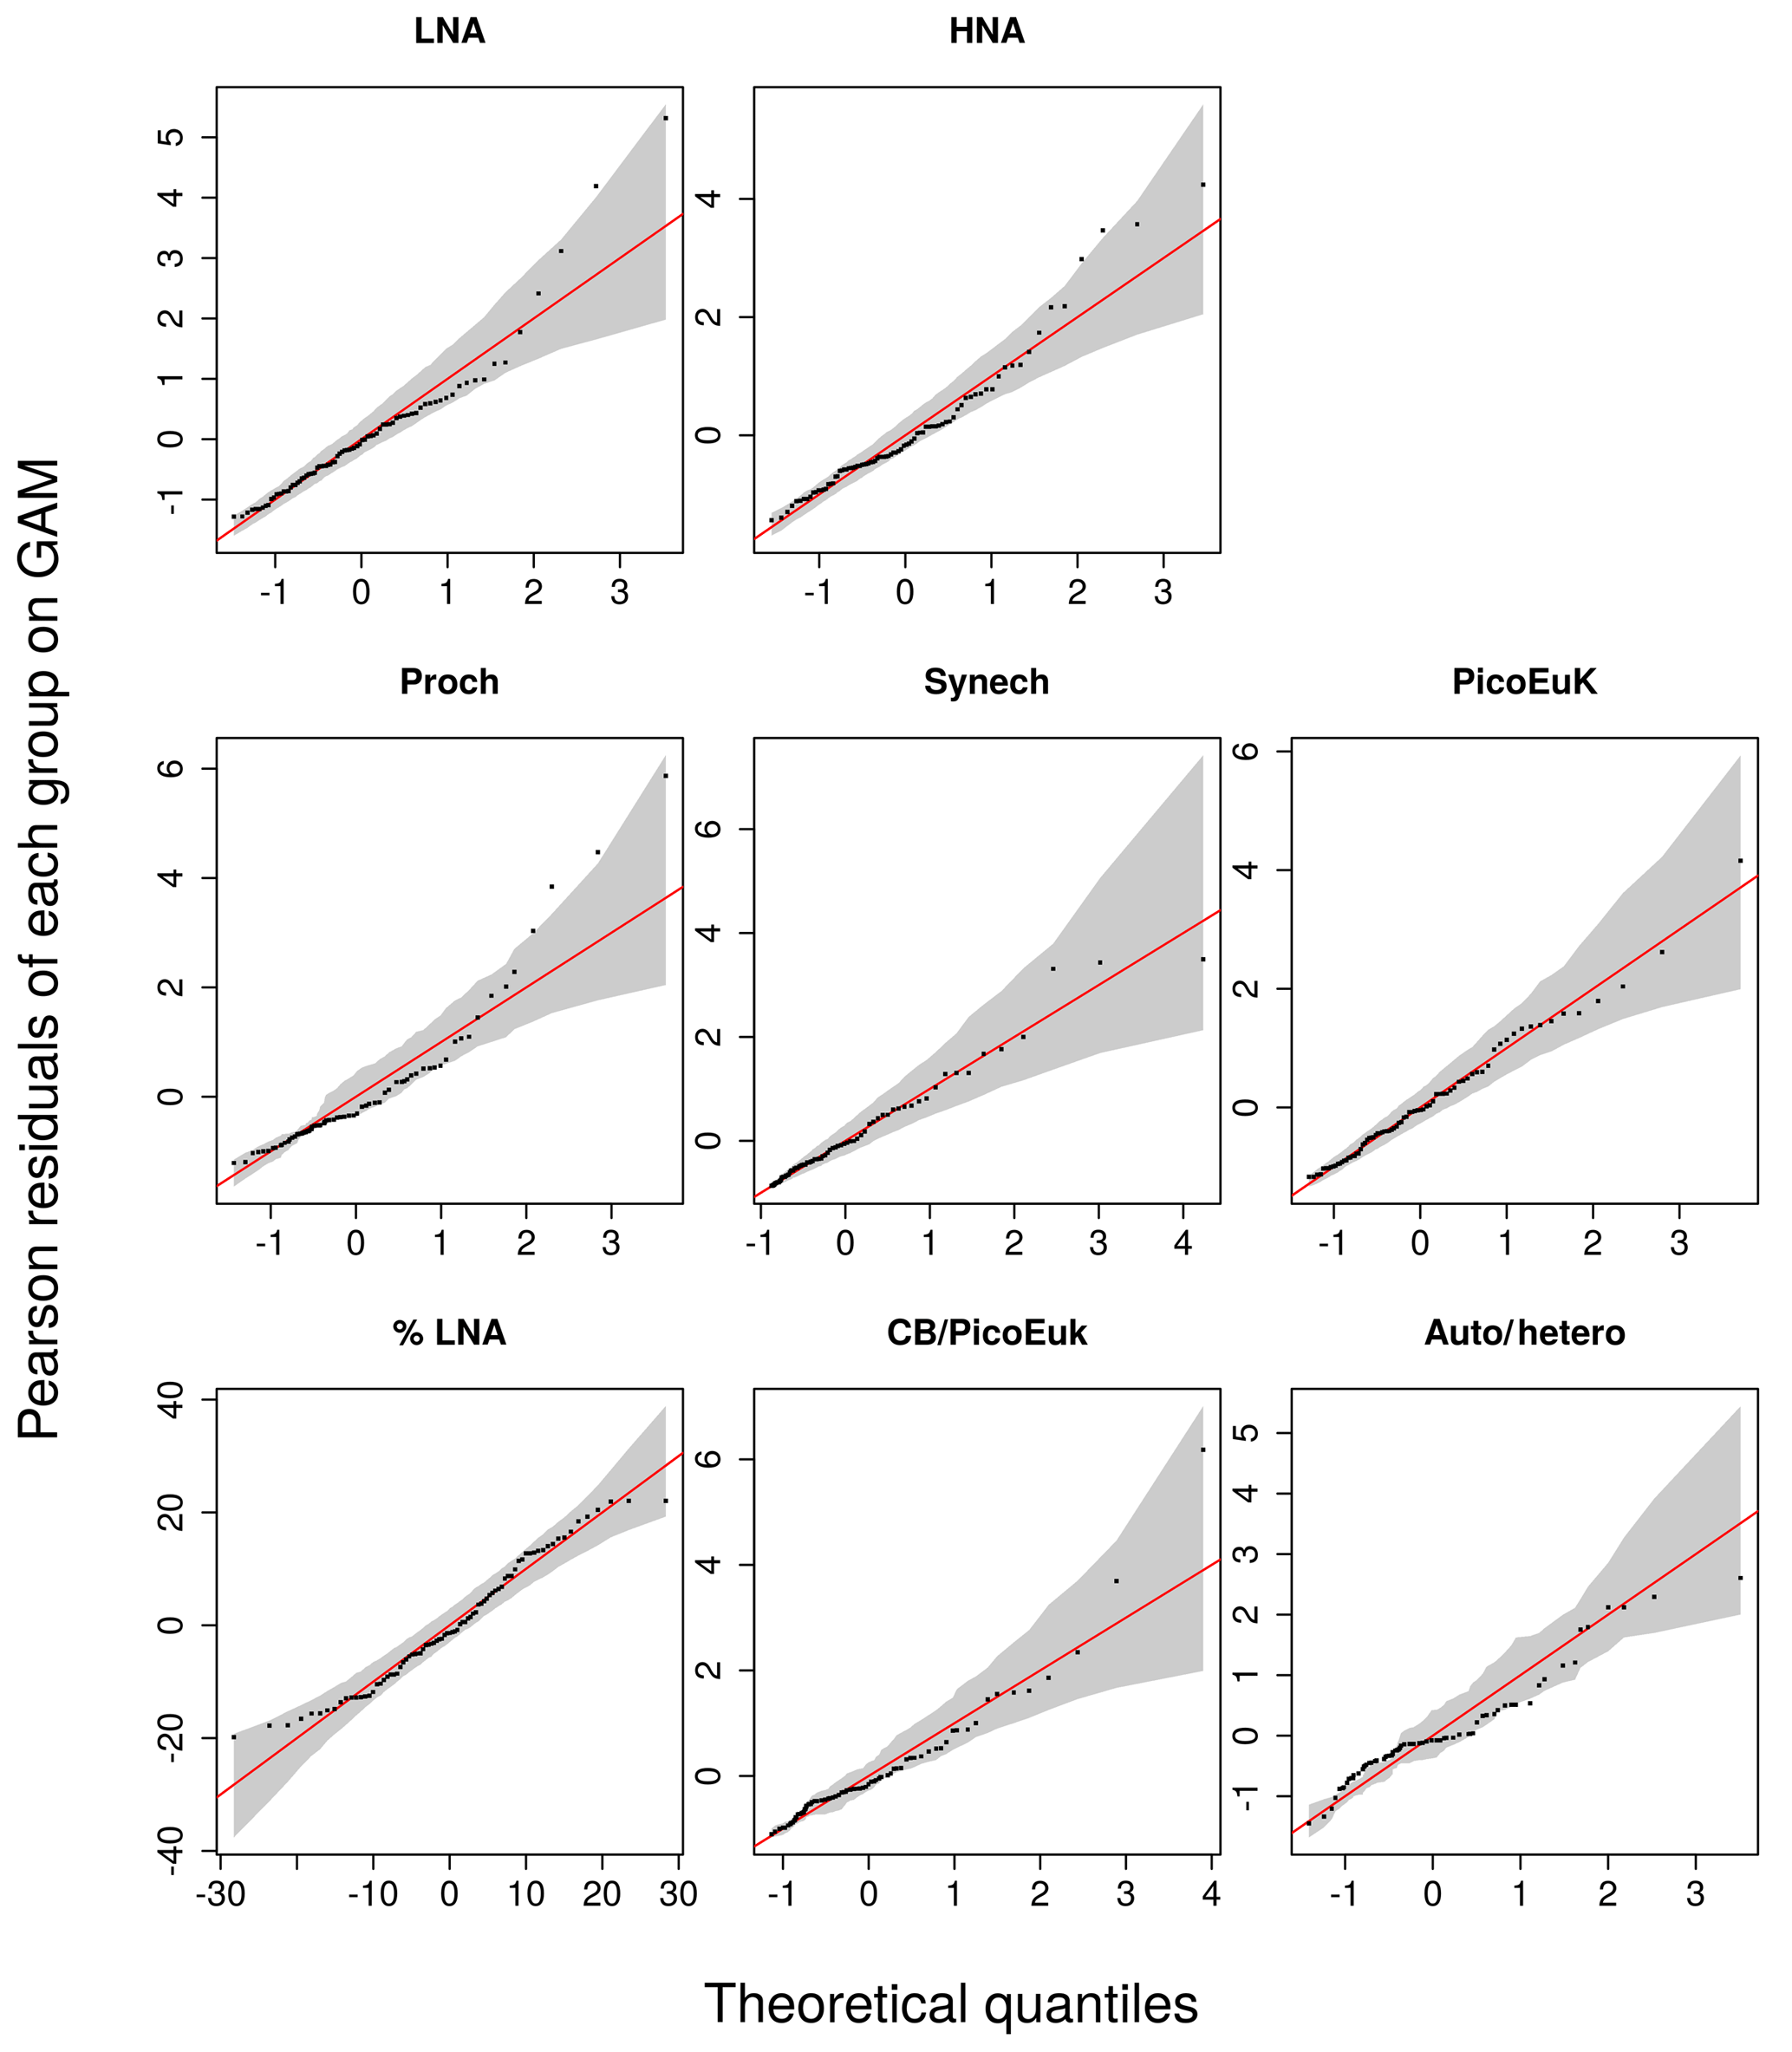
Figure A2Quantile–quantile (QQ) plots between the observations and the selected GAM models for each picoplankton subgroup, the contribution of LNA to heterotrophic picoplankton (%LNA), the cyanobacteria-to-picoeukaryote ratio (CB ∕ PicoEuk), and the autotrophic-to-heterotrophic biomass ratio (Auto ∕ hetero). The y axes represent the Pearson residuals and the x axes the negative binomial theoretical quantiles. Solid red lines indicate the theoretical quantile of the models and grey shadows the 95 % confidence intervals.
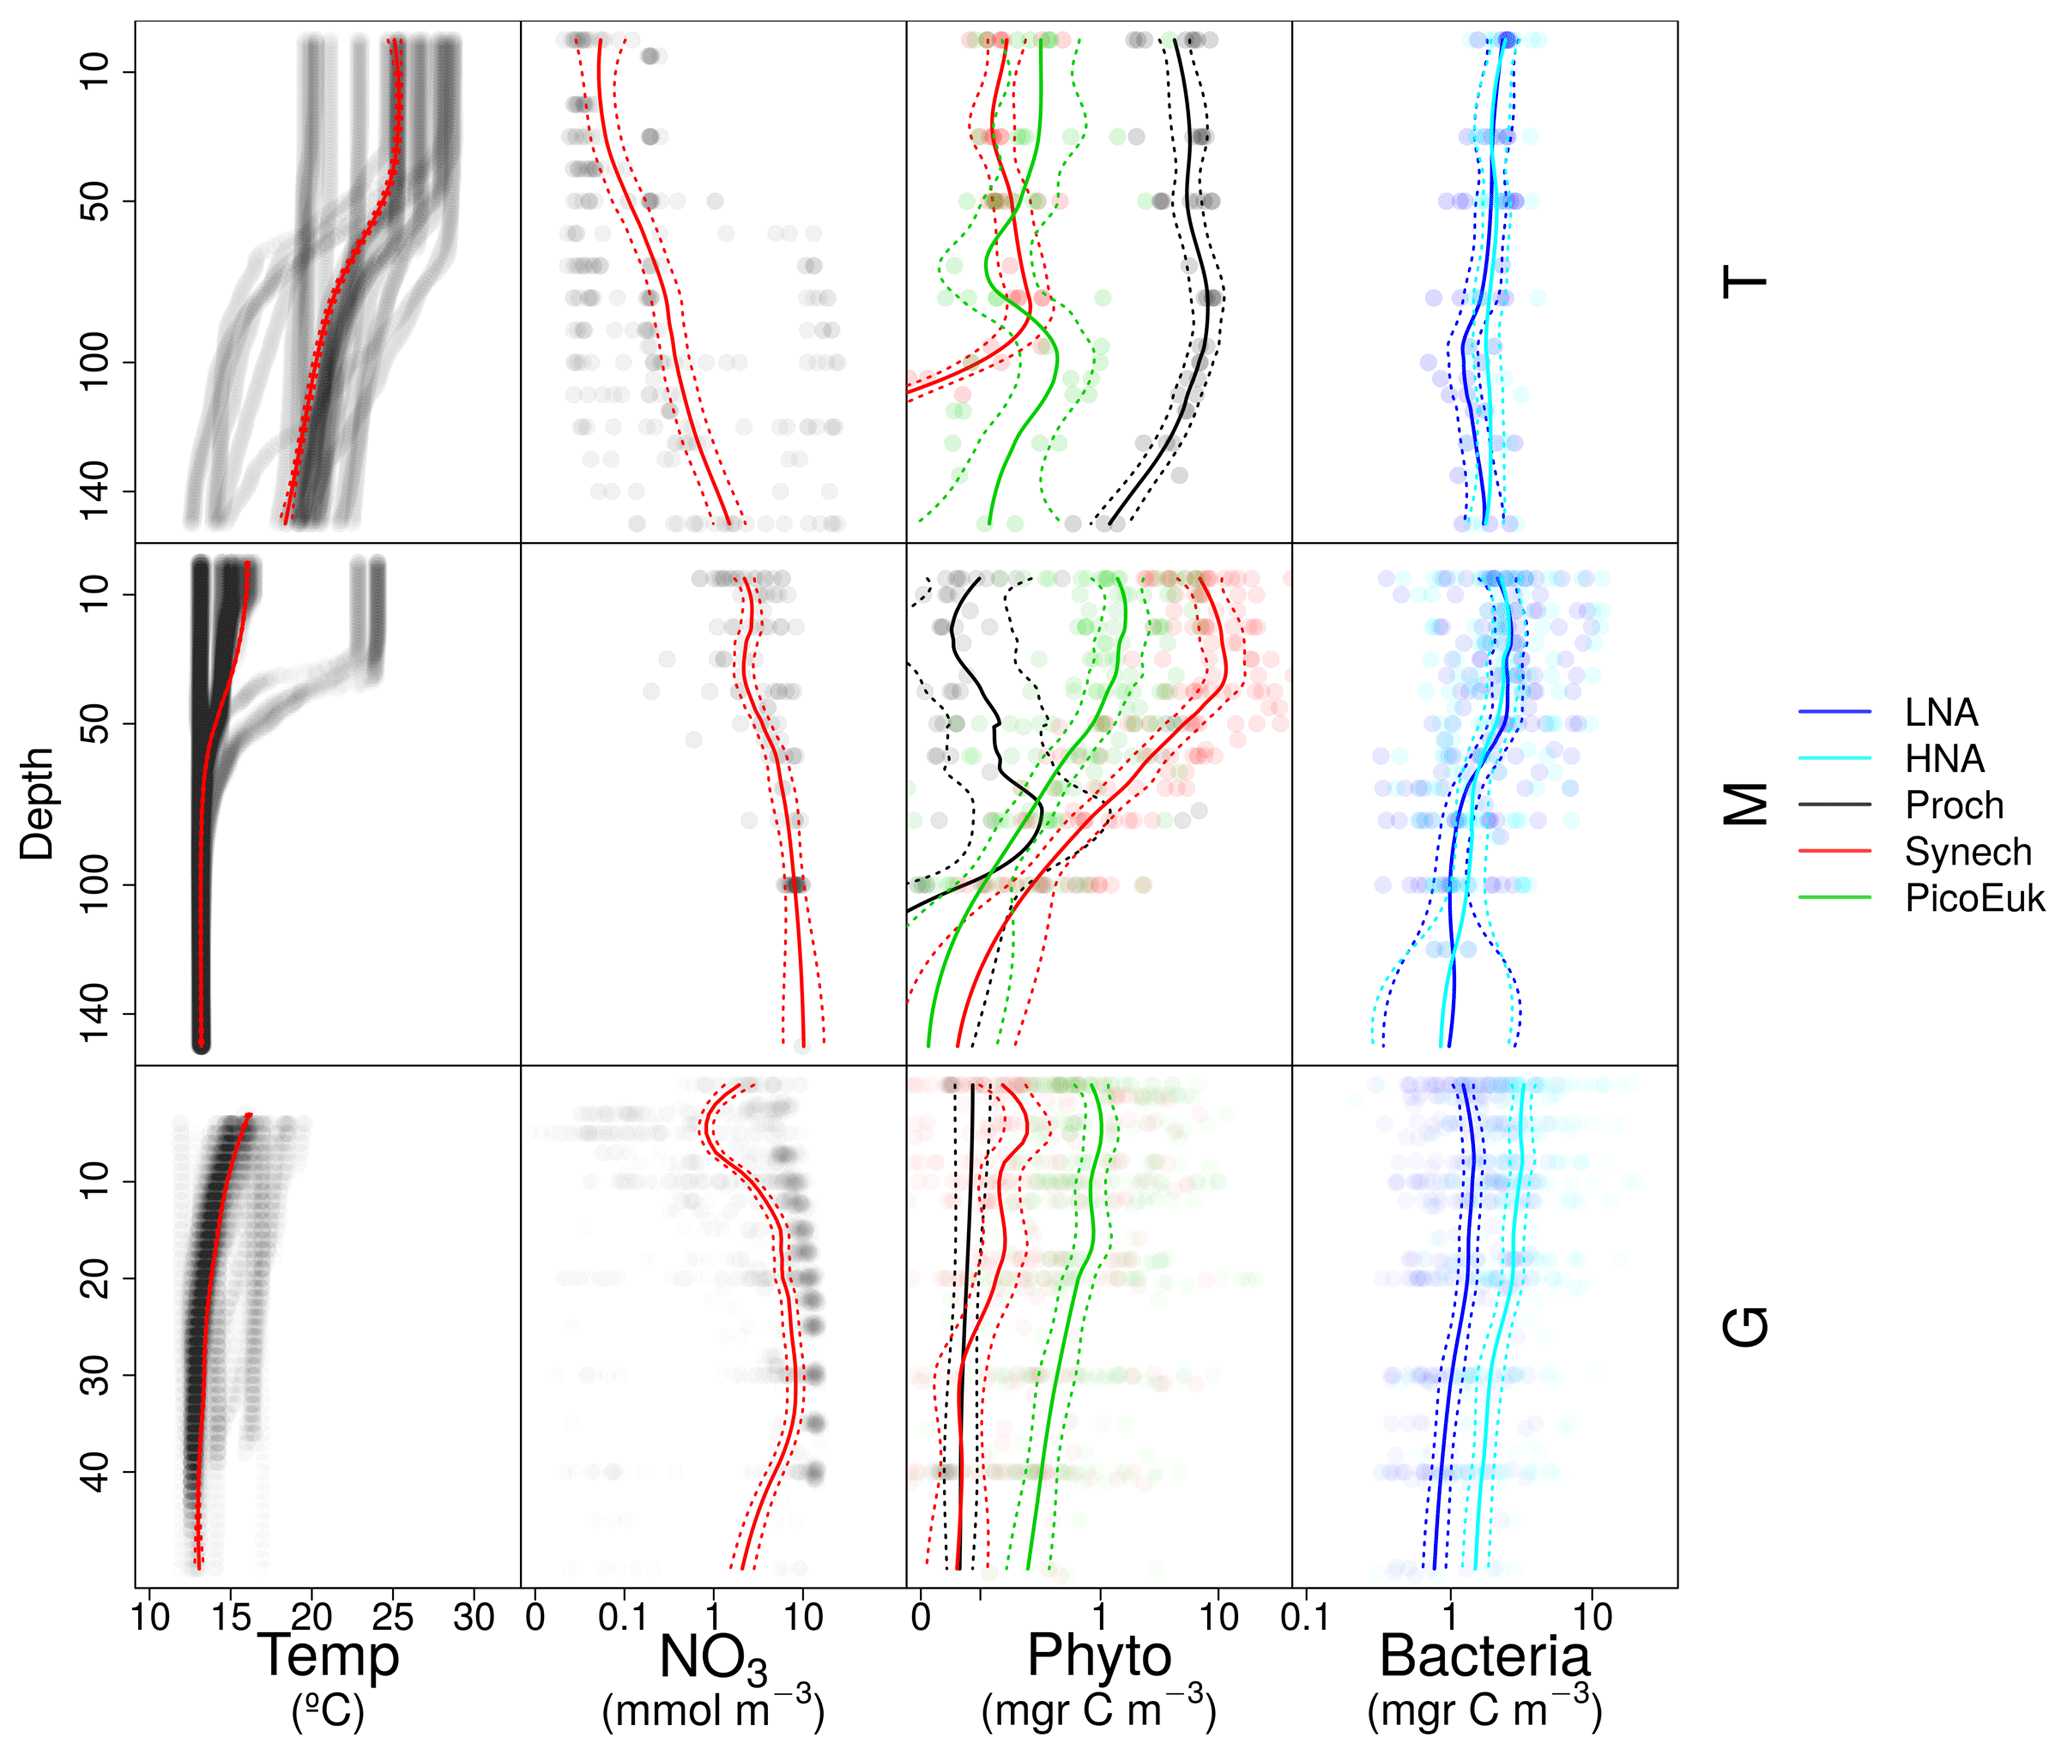
Figure A3Vertical distribution of temperature (Temp), nitrate (NO3), and picoplankton biomass of autotrophic (Phyto) and heterotrophic (Bacteria) groups for each domain: tropical and subtropical Atlantic Ocean (T), the Mediterranean (M), and the Galician coastal upwelling (G). Points represent raw data and the solid line the locally weighted scatter plot smoothing (LOESS). Dashed lines indicate 95 % confidence intervals. Dot and line color intensity indicates the number of overlapping observations.
The supplement related to this article is available online at: https://doi.org/10.5194/bg-15-6199-2018-supplement.
JO, PC, and BM designed the research. JO analyzed the data, and JO and BM prepared the paper with contributions from all the co-authors.
The authors declare that they have no conflict of interest.
We thank the officers and crew of the research vessels Hespérides, Sarmiento de Gamboa, Mytilus, Ramon Margalef and Lura for their help during the cruises. We are also very grateful to Fátima Eiroa for the flow cytometry analysis in the NICANOR, HERCULES1, HERCULES2, HERCULES3, and ASIMUTH cruises. Finally, we would like to thank Julia Uitz and the two anonymous reviewers for their valuable comments on the paper.
This research was supported by the Spanish Ministry of Economy and
Competitiveness (MINECO) through projects CTM2012-30680 to
Beatriz Mouriño, CTM2008-0626I-C03-01 to Mikel Latasa,
REN2003-09532-C03-01 to Ramiro Varela Benvenuto, CTM2004-05174-C02 to
Emilio Marañón, and CTM2011-25035 to Pedro Cermeño; by the Galician
government through grants 09MMA027604PR to Manuel Ruiz Villareal and
EM2013/021 to Beatriz Mouriño; by the Instituto Español de
Oceanografia (IEO) through the time series project RADIALES coordinated by
Antonio Bode and by the 7th Framework Programme of the European Commission
through grant FP7 SPACE.2010.1.1-01 261860 to Manuel Ruiz Villareal.
Jose Luis Otero Ferrer acknowledges the receipt of a FPI contract from MINECO
(CTM2012-30680) and Bieito Fernádez Castro a Juan de La Cierva
Formación fellowship (FJCI-641 2015-25712, Ministerio de Economía y
Competitividad, Spanish government).
Edited
by: Julia Uitz
Reviewed by: two anonymous referees
Agawin, N. S., Duarte, C. M., and Agustí, S.: Nutrient and temperature control of the contribution of picoplankton to phytoplankton biomass and production, Limnol. Oceanogr., 45, 591–600, 2000. a, b
Álvarez-Salgado, X. A., Roson, G., Perez, F. F., and Pazos, Y.: Hydrographic variability off the R as Baixas (NW Spain) during the upwelling season, J. Geophys. Res., 98, 14447–14455, https://doi.org/10.1029/93JC00458, 1993. a, b
Alvarez-Salgado, X. A., Borges, A. V., Figueiras, F. G., and Chou, L.: Iberian margin: the Rías, in: Carbon and Nutrient Fluxes in Continental Margins, A Global Synthesis, IGBP, 103–120, 2010. a
Aranguren-Gassis, M., Serret, P., Fernández, E., Herrera, J. L., Domínguez-Yanes, J. F., Pérez, V., and Escánez, J.: Production and respiration control the marine microbial metabolic balance in the eastern North Atlantic subtropical gyre, Deep-Sea Res. Pt. I, 58, 768–775, https://doi.org/10.1016/j.dsr.2011.05.003, 2011. a
Azam, F., Fenchel, T., Field, J. G., Gray, J. C. S., Meyer-Reil, L. A., and Thingstad, F.: The ecological role of water-column microbes in the sea, Mar. Ecol. Prog. Ser., 10, 257–263, https://doi.org/10.3354/meps010257, 1983. a, b
Barber, R. T. and Hiscock, M. R.: A rising tide lifts all phytoplankton: Growth response of other phytoplankton taxa in diatom-dominated blooms, Global Biogeochem. Cy., 20, GB4S03, https://doi.org/10.1029/2006GB002726, 2006. a
Barton, A. D., Ward, B. A., Williams, R. G., and Follows, M. J.: The impact of fine-scale turbulence on phytoplankton community structure, Limnol. Oceanogr. Fluid. Environ., 4, 34–49, 2014. a
Barton, A. D., Lozier, M. S., and Williams, R. G.: Physical controls of variability in north Atlantic phytoplankton communities, Limnol. Oceanogr., 60, 181–197, https://doi.org/10.1002/lno.10011, 2015. a
Baudoux, A.-C., Veldhuis, M. J. W., Witte, H. J., and Brussaard, C. P. D.: Viruses as mortality agents of picophytoplankton in the deep chlorophyll maximum layer during IRONAGES III, Limnol. Oceanogr., 52, 2519–2529, https://doi.org/10.4319/lo.2007.52.6.2519, 2007. a
Berube, P. M., Biller, S. J., Kent, A. G., Berta-Thompson, J. W., Roggensack, S. E., Roache-Johnson, K. H., Ackerman, M., Moore, L. R., Meisel, J. D., Sher, D., Thompson, L. R., Campbell, L., Martiny, A. C., and Chisholm, S. W.: Physiology and evolution of nitrate acquisition in Prochlorococcus, ISME J., https://doi.org/10.1038/ismej.2014.211, 1–13, 2014. a
Bonnet, S., Guieu, C., Chiaverini, J., Ras, J., and Stock, A.: Effect of atmospheric nutrients on the autotrophic communities in a low nutrient, low chlorophyll system, Limnol. Oceanogr., 50, 1810–1819, https://doi.org/10.4319/lo.2005.50.6.1810, 2005. a
Bouman, H. a., Ulloa, O., Barlow, R., Li, W. K., Platt, T., Zwirglmaier, K., Scanlan, D. J., and Sathyendranath, S.: Water-column stratification governs the community structure of subtropical marine picophytoplankton, Environ. Microbiol. Rep., 3, 473–82, https://doi.org/10.1111/j.1758-2229.2011.00241.x, 2011. a, b
Bouvier, T., Del Giorgio, P. A., and Gasol, J. M.: A comparative study of the cytometric characteristics of High and Low nucleic-acid bacterioplankton cells from different aquatic ecosystems, Environ. Microbiol., 9, 2050–2066, https://doi.org/10.1111/j.1462-2920.2007.01321.x, 2007. a, b
Brewin, R. J. W., Sathyendranath, S., Tilstone, G., Lange, P. K., and Platt, T.: Amulticomponent model of phytoplankton size structure, J. Geophys. Res.-Ocean., 119, 1–19, https://doi.org/10.1002/2014JC009859, 2014. a
Buitenhuis, E. T., Li, W. K. W., Vaulot, D., Lomas, M. W., Landry, M. R., Partensky, F., Karl, D. M., Ulloa, O., Campbell, L., Jacquet, S., Lantoine, F., Chavez, F., Macias, D., Gosselin, M., and McManus, G. B.: Picophytoplankton biomass distribution in the global ocean, Earth Syst. Sci. Data, 4, 37–46, https://doi.org/10.5194/essd-4-37-2012, 2012. a
Calvo-Díaz, A. and Morán, X. A. G.: Seasonal dynamics of picoplankton in shelf waters of the southern Bay of Biscay, Aquat. Microb. Ecol., 42, 159–174, https://doi.org/10.3354/ame042159, 2006. a, b, c, d
Cermeño, P., Chouciño, P., Fernández-Castro, B., Figueiras, F. G., Marañón, E., Marrasé, C., Mouriño-Carballido, B., Pérez-Lorenzo, M., Rodríguez-Ramos, T., Teixeira, I. G., and Vallina, S. M.: Marine Primary Productivity Is Driven by a Selection Effect, Front. Mar. Sci., 3, 1–10, https://doi.org/10.3389/fmars.2016.00173, 2016. a
Chen, B., Liu, H., Landry, M. R., Chen, M., Sun, J., Shek, L., Chen, X., and Harrison, P. J.: Estuarine nutrient loading affects phytoplankton growth and microzooplankton grazing at two contrasting sites in Hong Kong coastal waters, Mar. Ecol. Prog. Ser., 379, 77–90, https://doi.org/10.3354/meps07888, 2009. a, b
Chisholm, S. W.: Phytoplankton Size, in: Primary Productivity and Biogeochemical Cycles in the Sea, edited by: Falkowski, P. G., Woodhead, A. D., and Vivirito, K., Springer US, Boston, MA, https://doi.org/10.1007/978-1-4899-0762-2_12, 213–237, 1992. a, b, c, d, e
Corno, G., Karl, D. M., Church, M. J., Letelier, R. M., Lukas, R., Bidigare, R. R., and Abbott, M. R.: Impact of climate forcing on ecosystem processes in the North Pacific Subtropical Gyre, J. Geophys. Res., 112, C04021, https://doi.org/10.1029/2006JC003730, 2007. a
Echevarría, F., Zabala, L., Corzo, A., Navarro, G., Prieto, L., and Macías, D.: Spatial distribution of autotrophic picoplankton in relation to physical forcings: The Gulf of Cádiz, Strait of Gibraltar and Alborán Sea case study, J. Plankton Res., 31, 1339–1351, https://doi.org/10.1093/plankt/fbp070, 2009. a
Espinoza-González, O., Figueiras, F. G., Crespo, B. G., Teixeira, I. G., and Castro, C. G.: Autotrophic and heterotrophic microbial plankton biomass in the NW Iberian upwelling: seasonal assessment of metabolic balance, Aquat. Microb. Ecol., 67, 77–89, https://doi.org/10.3354/ame01584, 2012. a
Estrada, M., Latasa, M., Emelianov, M., Gutiérrez-Rodríguez, A., Fernández-Castro, B., Isern-Fontanet, J., Mouriño-Carballido, B., Salat, J., and Vidal, M.: Seasonal and mesoscale variability of primary production in the deep winter-mixing region of the NW Mediterranean, Deep-Sea Res. Pt. I, 94, 45–61, https://doi.org/10.1016/j.dsr.2014.08.003, 2014. a
Fenchel, T.: The microbial loop – 25-years later, J. Exp. Mar. Biol. Ecol., 366, 99–103, https://doi.org/10.1016/j.jembe.2008.07.013, 2008. a, b
Fernández, E., Álvarez-Salgado, X. A., Beiras, R., Ovejero, A., and Méndez, G.: Coexistence of urban uses and shellfish production in an upwelling-driven, highly productive marine environment: The case of the Ría de Vigo (Galicia, Spain), Regional Studies in Marine Science, 8, 362–370, https://doi.org/10.1016/j.rsma.2016.04.002, 2016. a
Fernández-Castro, B., Mouriño-Carballido, B., Marañón, E., Chouciño, P., Gago, J., Ramírez, T., Vidal, M., Bode, A., Blasco, D., Royer, S.-J., Estrada, M., and Simó, R.: Importance of salt fingering for new nitrogen supply in the oligotrophic ocean, Nat. Commun., 6, 8002, https://doi.org/10.1038/ncomms9002, 2015. a
Fernández-Castro, B., Gilcoto, M., Naveira-Garabato, A. C., Villamaña, M., Graña, R., and Mouriño-Carballido, B.: Modulation of the Semidiurnal Cycle of Turbulent Dissipation by Wind-Driven Upwelling in a Coastal Embayment, J. Geophys. Res.-Ocean., 123, 4034–4054, https://doi.org/10.1002/2017JC013582, 2018. a
Finkel, Z. V., Beardall, J., Flynn, K. J., Quigg, A., Rees, T. A. V., and Raven, J. A.: Phytoplankton in a changing world: Cell size and elemental stoichiometry, J. Plankton Res., 32, 119–137, https://doi.org/10.1093/plankt/fbp098, 2010. a, b
Flombaum, P., Gordillo, R. A., Zabala, L. L., Jiao, N., Karl, D. M., Li, W. K., Lomas, M. W., Veneziano, D., Vera, C. S., Vrugt, J. A., and Martiny, A. C.: Present and future global distributions of the marine Cyanobacteria Prochlorococcus and Synechococcus, P. Natl. Acad. Sci. USA, 110, 1–12, 2013. a, b, c, d, e, f
Fraga, F.: Upwelling off the Galician coast, northwest Spain, Coast. Estuar. Sci., 1, 176–182, https://doi.org/10.1029/CO001p0176, 1981. a
Frojan, M., Arbones, B., Zuniga, D., Castro, C. G., and Figueiras, F. G.: Microbial plankton community in the Ria de Vigo (NW Iberian upwelling system): impact of the culture of Mytilus galloprovincialis, Mar. Ecol. Prog. Ser., 498, 43–54, https://doi.org/10.3354/meps10612, 2014. a
Gasol, J. M. and del Giorgio, P. A.: Using flow cytometry for counting natural planktonic bacteria and understanding the structure of planktonic bacterial communities, Sci. Mar., 64, 197–224, https://doi.org/10.3989/scimar.2000.64n2197, 2000. a, b
Gasol, J. M., Vázquez-Domínguez, E., Vaqué, D., Agustí, S., and Duarte, C. M.: Bacterial activity and diffusive nutrient supply in the oligotrophic Central Atlantic Ocean, Aquat. Microb. Ecol., 56, 1–12, https://doi.org/10.3354/ame01310, 2009. a
Geange, S. W., Pledger, S., Burns, K. C., and Shima, J. S.: A unified analysis of niche overlap incorporating data of different types, Methods Ecol. Evol., 2, 175–184, https://doi.org/10.1111/j.2041-210X.2010.00070.x, 2011. a, b
Gomes, A., Gasol, J. M., Estrada, M., Franco-Vidal, L., Díaz-Pérez, L., Ferrera, I., and Morán, X. A. G.: Heterotrophic bacterial responses to the winter-spring phytoplankton bloom in open waters of the NW Mediterranean, Deep-Sea Res. Pt. I, 96, 59–68, https://doi.org/10.1016/j.dsr.2014.11.007, 2015. a, b
Hansen, H. and Koroleff, F.: Determination of nutrients, in: Methods of Seawater Analysis, edited by: Grasshoff, K., Kremling, K., and Ehrhardt, M., Wiley-VCH Verlag GmbH, Weinheim, Germany, 3rd Edn., chap. 10, 159–228, https://doi.org/10.1002/9783527613984, 1999. a
Grob, C., Ulloa, O., Li, W. K., Alarcón, G., Fukasawa, M., and Watanabe, S.: Picoplankton abundance and biomass across the eastern South Pacific Ocean along latitude 32.5∘S, Mar. Ecol. Prog. Ser., 332, 53–62, https://doi.org/10.3354/meps332053, 2007. a
Guasto, J. S., Rusconi, R., and Stocker, R.: Fluid Mechanics of Planktonic Microorganisms, Annu. Rev. Fluid Mech., 44, 373–400, https://doi.org/10.1146/annurev-fluid-120710-101156, 2012. a
Guidi, L., Chaffron, S., Bittner, L., Eveillard, D., Larhlimi, A., Roux, S., Darzi, Y., Audic, S., Berline, L., Brum, J., Coelho, L. P., Espinoza, J. C. I., Malviya, S., Sunagawa, S., Dimier, C., Kandels-Lewis, S., Picheral, M., Poulain, J., Searson, S., Coordinators, T. O., Stemmann, L., Not, F., Hingamp, P., Speich, S., Follows, M. J., Karp-Boss, L., Boss, E., Ogata, H., Pesant, S., Weissenbach, J., Wincker, P., Acinas, S. G., Bork, P., de Vargas, C., Iudicone, D., Sullivan, M. B., Raes, J., Karsenti, E., Bowler, C., and Gorsky, G.: Plankton networks driving carbon export in the oligotrophic ocean, Nature, 532, 465–470, https://doi.org/10.1038/nature16942, 2015. a
Gundersen, K., Heldal, M., Norland, S., Purpie, D. A., and Knap, A. N.: Elemental C, N, and P cell content of individual bacteria collected at the Bermuda Atlantic Time-series Study (BATS) site, Limnol. Oceanogr., 47, 1525–1530, 2002. a
Hastie, T. J. and Tibshirani, R.: Varying-coefficient Models, J. R. Stat. Soc., 55, 757–796, https://doi.org/10.2307/2345993, 1993. a
Howes, E. L., Joos, F., Eakin, C. M., and Gattuso, J.-P.: An updated synthesis of the observed and projected impacts of climate change on the chemical, physical and biological processes in the oceans, Front. Mar. Sci., 2, 1–27, https://doi.org/10.3389/fmars.2015.00036, 2015. a
Hutchinson, G.: Concludig remarks, Cold Spring Harbor Symposia on Quantitative Biology, 22, 415–427, 1957. a
Jenkins, W. J. and Doney, S. C.: The subtropical nutrient spiral, Global Biogeochem. Cy., 17, 1110, https://doi.org/10.1029/2003GB002085, 2003. a
Johnson, Z. I., Zinser, E. R., Coe, A., McNulty, N. P., Woodward, E. M. S., and Chisholm, S. W.: Niche partitioning among Prochlorococcus ecotypes along ocean-scale environmental gradients, Science, 311, 1737–1740, https://doi.org/10.1126/science.1118052, 2006. a
Kark, S., Mukerji, T., Safriel, U. N., Noy-Meir, I., Nissani, R., and Darvasi, A.: Peak morphological diversity in an ecotone unveiled in the chukar partridge by a novel Estimator in a Dependent Sample (EDS), J. Anim. Ecol., 71, 1015–1029, https://doi.org/10.1046/j.1365-2656.2002.00665.x, 2002. a
Karp-Boss, L., Boss, E., and Jumars, P.: Nutrient fluxes to planktonic osmotrophs in the presence of fluid motion, Oceanogr. Mar. Biol., 34, 71–107, 1996. a
Kiørboe, T.: Turbulence, Phytoplankton Cell Size, and the Structure of Pelagic Food Webs, Adv. Mar. Biol., 29, 1–72, https://doi.org/10.1016/S0065-2881(08)60129-7, 1993. a
Kirchman, D. L.: Uptake and regeneration of inorganic nutrients by marine heterotrophic bacteria, Microb. Ecol., 28, 255–271, 2000. a
Kirk, J. T.: Light and photosynthesis in aquatic ecosystems, Cambridge University Press, 1994. a
Laufkötter, C., Vogt, M., Gruber, N., Aumont, O., Bopp, L., Doney, S. C., Dunne, J. P., Hauck, J., John, J. G., Lima, I. D., Seferian, R., and Völker, C.: Projected decreases in future marine export production: The role of the carbon flux through the upper ocean ecosystem, Biogeosciences, 13, 4023–4047, https://doi.org/10.5194/bg-13-4023-2016, 2016. a
Lazier, J. R. and Mann, K. H.: Turbulence and the diffusive layers around small organisms, Deep-Sea Res. Pt. A, 36, 1721–1733, https://doi.org/10.1016/0198-0149(89)90068-X, 1989. a
Lewandowska, A. M., Boyce, D. G., Hofmann, M., Matthiessen, B., Sommer, U., and Worm, B.: Effects of sea surface warming on marine plankton, Ecol. Lett., 17, 614–623, https://doi.org/10.1111/ele.12265, 2014. a
Li, W.: Macroscopic patterns in marine plankton, in: Encyclopedia of biodiversity, edited by: Levin, S. A., Academic Press, 667–680, https://doi.org/10.1016/B978-0-12-384719-5.00291-4, 2007. a
Li, W. K.: Macroecological patterns of phytoplankton in the northwestern North Atlantic Ocean, Nature, 419, 154–157, https://doi.org/10.1038/nature00983.1, 2002. a
Li, W. K.: Plankton populations and communities, Mar. Macroecol., edited by: Witman, J. D. and Roy, K., University of Chicago Press, Chicago, 29–64, 2009. a, b
Li, W. K., Jellett, J. F., and Dickie, P. M.: DNA distributions in planktonic bacteria stained with TOTO or TO-PRO, Limnol. Oceanogr., 40, 1485–1495, https://doi.org/10.4319/lo.1995.40.8.1485, 1995. a
Li, W. K., Head, E. J. H., and Harrison, W. G.: Macroecological limits of heterotrophic bacterial abundance inthe ocean, Deep-Sea Res. Pt. I, 51, 1529–1540, 2004. a
Llabrés, M., Agustí, S., Alonso-Laita, P., and Herndl, G. J.: Synechococcus and Prochlorococcus cell death induced by UV radiation and the penetration of lethal UVR in the Mediterranean Sea, Mar. Ecol. Prog. Ser., 399, 27–37, https://doi.org/10.3354/meps08332, 2010. a
Lomas, M. W. and Moran, S. B.: Evidence for aggregation and export of cyanobacteria and nano-eukaryotes from the Sargasso Sea euphotic zone, Biogeosciences, 8, 203–216, https://doi.org/10.5194/bg-8-203-2011, 2011. a
Mackey, K. R. M., Paytan, A., Caldeira, K., Grossman, A. R., Moran, D., McIlvin, M., and Saito, M. A.: Effect of temperature on photosynthesis and growth in marine Synechococcus spp., Plant Physiol., 163, 815–29, https://doi.org/10.1104/pp.113.221937, 2013. a, b
Malmstrom, R. R., Rodrigue, S., Huang, K. H., Kelly, L., Kern, S. E., Thompson, A., Roggensack, S. E., Berube, P. M., Henn, M. R., and Chisholm, S. W.: Ecology of uncultured Prochlorococcus clades revealed through single-cell genomics and biogeographic analysis, ISME J., 7, 184–198, https://doi.org/10.1038/ismej.2012.89, 2013. a
Marañón, E.: Cell Size as a Key Determinant of Phytoplankton Metabolism and Community Structure, Annu. Rev. Mar. Sci., 7, 241–264, https://doi.org/10.1146/annurev-marine-010814-015955, 2015. a
Marañón, E., Cermeño, P., López-Sandoval, D. C., Rodríguez-Ramos, T., Sobrino, C., Huete-Ortega, M., Blanco, J. M., and Rodríguez, J.: Unimodal size scaling of phytoplankton growth and the size dependence of nutrient uptake and use, Ecol. Lett., 16, 371–379, https://doi.org/10.1111/ele.12052, 2013. a, b, c
Marañón, E., Lorenzo, M. P., Cermeño, P., and Mouriño-carballido, B.: Nutrient limitation suppresses the temperature dependence of phytoplankton metabolic rates, ISME J., 12, 1836–1845, https://doi.org/10.1038/s41396-018-0105-1, 2018. a
Marie, D. and Partensky, F.: Analyse de micro-organismes marins, in: La cytométrie en flux, edited by: Ronot, X., Grunwald, D., Mayol, J.-F., and Boutonnat, J., Lavoisier, chap. 11, 211–233, 2006. a
Marra, G. and Wood, S. N.: Coverage Properties of Confidence Intervals for Generalized Additive Model Components, Scand. J. Stat., 39, 53–74, https://doi.org/10.1111/j.1467-9469.2011.00760.x, 2012. a
Martiny, A. C., Kathuria, S., and Berube, P. M.: Widespread metabolic potential for nitrite and nitrate assimilation among Prochlorococcus ecotypes, P. Natl. Acad. Sci. USA, 106, 10787–10792, https://doi.org/10.1073/pnas.0902532106, 2009. a
Mary, I., Tarran, G. A., Warwick, P. E., Terry, M. J., Scanlan, D. J., Burkill, P. H., and Zubkov, M. V.: Light enhanced amino acid uptake by dominant bacterioplankton groups in surface waters of the Atlantic Ocean, FEMS Microbiol. Ecol., 63, 36–45, https://doi.org/10.1111/j.1574-6941.2007.00414.x, 2008. a, b
Mella-Flores, D., Six, C., Ratin, M., Partensky, F., Boutte, C., Le Corguillé, G., Marie, D., Blot, N., Gourvil, P., Kolowrat, C., and Garczarek, L.: Prochlorococcus and Synechococcus have Evolved Different Adaptive Mechanisms to Cope with Light and UV Stress, Front. Microbiol., 285, 1–20, https://doi.org/10.3389/fmicb.2012.00285, 2012. a, b
Moore, L. R., Goericke, R., and Chisholm, S. W.: Comparative physiology of Synechococcus and Prochlorococcus: influence of light and temperature on growth, pigments, fluorescence and absorptive, Mar. Ecol. Prog. Ser., 116, 259–275, 1995. a, b
Moore, L. R., Post, A. F., Rocap, G., and Chisholm, S. W.: Utilization of different nitrogen sources by the marine cyanobacteria Prochlorococcus and Synechococcus, Limnol. Oceanogr., 47, 989–996, https://doi.org/10.4319/lo.2002.47.4.0989, 2002. a, b
Moore, L. R., Coe, A., Zinser, E. R., Saito, M. A., Sullivan, M. B., Lindell, D., Frois-Moniz, K., Waterbury, J. B., and Chisholm, S. W.: Culturing the marine cyanobacterium Prochlorococcus, Limnol. Oceanogr.-Method., 5, 353–362, https://doi.org/10.4319/lom.2007.5.353,2007. a, b
Morán, X. A. G.: Annual cycle of picophytoplankton photosynthesis and growth rates in a temperate coastal ecosystem: A major contribution to carbon fluxes, Aquat. Microb. Ecol., 49, 267–279, https://doi.org/10.3354/ame01151, 2007. a
Morán, X. A. G., Alonso-Sáez, L., Nogueira, E., Ducklow, H. W., González, N., López-Urrutia, A., Díaz-Pérez, L., Calvo-Díaz, A., Arandia-Gorostidi, N., and Huete-Stauffer, T. M.: More, smaller bacteria in response to ocean's warming?, P. Roy. Soc. B, 282, 1–9, https://doi.org/10.1098/rspb.2015.0371, 2015. a
Moreira-Coello, V., Mouriño-Carballido, B., Marañón, E., Chouciño, P., Fernández, A., Varela, M., and Bode, A.: Biological N2 fixation in the upwelling region off NW Iberia: magnitude, relevance and main players, Front. Mar. Sci., 4, 1–16, 2017. a, b, c, d, e
Morel, A., Ahn, Y.-H., Partensky, F., Vaulot, D., and Claustre, H.: Prochlorococcus and Synechococcus: A comparative study of their optical properties in relation to their size and pigmentation, J. Mar. Res., 51, 617–649, 1993. a
Morel, A., Huot, Y., Gentili, B., Werdell, P. J., Hooker, S. B., and Franz, B. a.: Examining the consistency of products derived from various ocean color sensors in open ocean (Case 1) waters in the perspective of a multi-sensor approach, Remote Sens. Environ., 111, 69–88, https://doi.org/10.1016/j.rse.2007.03.012, 2007. a, b, c
Mouillot, D., Stubbs, W., Faure, M., Dumay, O., Tomasini, J. A., Wilson, J. B., and Chi, T. D.: Niche overlap estimates based on quantitative functional traits: A new family of non-parametric indices, Oecologia, 145, 345–353, https://doi.org/10.1007/s00442-005-0151-z, 2005. a
Mouriño-Carballido, B., Graña, R., Fernández, A., Bode, A., Varela, M., Domínguez-Yanes, J. F., Escánez, J., de Armas, D., and Marañón, E.: Importance of N2 fixation vs. nitrate eddy diffusion along a latitudinal transect in the Atlantic Ocean, Limnol. Oceanogr., 56, 999–1007, https://doi.org/10.4319/lo.2011.56.3.0999, 2011. a, b
Mouriño-Carballido, B., Hojas, E., Cermeño, P., Chouciño, P., Fernández-Castro, B., Latasa, M., Marañón, E., Morán, X. A. G., and Vidal, M.: Nutrient supply controls picoplankton community structure during three contrasting seasons in the northwestern Mediterranean Sea, Mar. Ecol. Prog. Ser., 543, 1–19, https://doi.org/10.3354/meps11558, 2016. a, b, c, d, e, f
Mulholland, M. R. and Lomas, M. W.: Nitrogen uptake and assimilation, in: Nitrogen in the Marine Environment, edited by: Capone, D., Bronk, D., Mulholl, M., and Carpenter, E., Elsevier, 2 Edn., 303–384, https://doi.org/10.1016/B978-0-12-372522-6.00007-4, 2008. a
Osborn, T. R.: Estimates of the local rate of vertical diffusion from dissipation measurements, J. Phys. Oceanogr., 10, 83–89, 1980. a
Partensky, F. and Garczarek, L.: Prochlorococcus: advantages and limits of minimalism, Annu. Rev. Mar. Sci., 2, 305–331, https://doi.org/10.1146/annurev-marine-120308-081034, 2010. a, b
Partensky, F., Blanchot, J., and Vaulot, D.: Differential distribution and ecology of Prochlorococcus and Synechococcus in oceanic waters : a review, Bulletin de l'Institut océanographique, 19, 457–475, 1999a. a
Partensky, F., Hess, W., and Vaulot, D.: Prochlorococcus, a marine photosynthetic prokaryote of global significance, Microbiol. Mol. Biol. R., 63, 106–127, 1999b. a
Paulsen, M. L., Doré, H., Garczarek, L., Seuthe, L., Müller, O., Sandaa, R.-A., Bratbak, G., and Larsen, A.: Synechococcus in the Atlantic Gateway to the Arctic Ocean, Front. Mar. Sci., 3, 1–14, https://doi.org/10.3389/fmars.2016.00191,2016. a
Pinhassi, J., DeLong, E. F., Béjà, O., González, J. M., and Pedrós-Alió, C.: Marine Bacterial and Archaeal Ion-Pumping Rhodopsins: Genetic Diversity, Physiology, and Ecology, Microbiol. Mol. Biol. R., 80, 929–54, https://doi.org/10.1128/MMBR.00003-16, 2016. a
Prandke, H. and Stips, A.: Test measurements with an operational microstructure-turbulence profiler: Detection limit of dissipation rates, Aquat. Sci., 60, 191–209, https://doi.org/10.1007/s000270050036, 1998. a
R Core Team: R: A Language and Environment for Statistical Computing, avaialble at: http://www.r-project.org/ (last access: 23 October 2018), 2015. a, b
Raven, J. A.: Why are there no picoplanktonic O 2 evolvers with volumes less than 10–19 m3?, J. Plankt. Res., 16, 565–580, https://doi.org/10.1093/plankt/16.5.565, 1994. a
Raven, J. A.: The twelfth Tansley Lecture. Small is beautiful: the picophytoplankton, Funct. Ecol., 12, 503–513, https://doi.org/10.1046/j.1365-2435.1998.00233.x, 1998. a
Richardson, T. L. and Jackson, G. A.: Small phytoplankton and carbon export from the surface ocean, Science, 315, 838–840, https://doi.org/10.1126/science.1133471, 2007. a, b
Rusch, D. B., Martiny, A. C., Dupont, C. L., Halpern, A. L., and Venter, J. C.: Characterization of Prochlorococcus clades from iron-depleted oceanic regions, P. Natl. Acad. Sci. USA, 107, 16184–16189, https://doi.org/10.1073/pnas.1009513107, 2010. a
Scanlan, D. J. and West, N. J.: Molecular ecology of the marine cyanobacterial genera Prochlorococcus and Synechococcus, FEMS Microbiol. Ecol., 40, 1–12, https://doi.org/10.1111/j.1574-6941.2002.tb00930.x, 2002. a, b
Schattenhofer, M., Wulf, J., Kostadinov, I., Glöckner, F. O., Zubkov, M. V., and Fuchs, B. M.: Phylogenetic characterisation of picoplanktonic populations with high and low nucleic acid content in the North Atlantic Ocean, Syst. Appl. Microbiol., 34, 470–475, https://doi.org/10.1016/j.syapm.2011.01.008, 2011. a, b
Sherr, E. B., Sherr, B. F., and Wheeler, P. A.: Distribution of coccoid cyanobacteria and small eukaryotic phytoplankton in the upwelling ecosystem off the Oregon coast during 2001 and 2002, Deep-Sea Res. Pt. II, 52, 317–330, https://doi.org/10.1016/j.dsr2.2004.09.020, 2005. a, b
Smayda, T. J.: Phytoplankton species succession, in: The physiological ecology of phytoplankton, edited by: Morris, I., Black-well Scientific Publications, Oxford, 493–570, http://ci.nii.ac.jp/naid/10003672033/en/ (last access: 23 October 2018), 1980. a
Sommaruga, R., Hofer, J. S., Alonso-Sáez, L., and Gasol, J. M.: Differential sunlight sensitivity of picophytoplankton from surface Mediterranean coastal waters, Appl. Environ. Microbiol., 71, 2154–2157, https://doi.org/10.1128/AEM.71.4.2154-2157.2005, 2005. a
Teira, E., Hernando-Morales, V., Fernández, A., Martínez-García, S., Álvarez-Salgado, X. A., Bode, A., and Varela, M.: Local differences in phytoplankton-bacterioplankton coupling in the coastal upwelling off Galicia (NW Spain), Mar. Ecol. Prog. Ser., 528, 53–69, https://doi.org/10.3354/meps11228, 2015. a
Van Mooy, B., Rocap, G., Fredricks, H. F., Evans, C. T., and Devol, A. H.: Sulfolipids dramatically decrease phosphorus demand by picocyanobacteria in oligotrophic marine environments, P. Natl. Acad. Sci. USA, 103, 8607–8612, https://doi.org/10.1073/pnas.0600540103, 2006. a
Vila-Costa, M., Gasol, J. M., Sharma, S., and Moran, M. A.: Community analysis of high- and low-nucleic acid-containing bacteria in NW Mediterranean coastal waters using 16S rDNA pyrosequencing, Environ. Microbiol., 14, 1390–1402, https://doi.org/10.1111/j.1462-2920.2012.02720.x, 2012. a
Villamaña, M., Mouriño-Carballido, B., Cermeño, P., Chouciño, P., da Silva, J., Fernández-Castro, B., Gilcoto, M., Graña, R., Latasa, M., Marañón, E., and Otero-Ferrer, J. L., and Scharek, R.: Role of internal waves on mixing, nutrient supply and phytoplankton composition during spring and neap tides in the Ría de Vigo (NW Iberian Peninsula), Limnol. Oceanogr., 62, 1014–1030, https://doi.org/10.1002/lno.10482, 2017. a, b, c, d, e, f
Wood, S. N.: Generalized additive models: an introduction with R, CRC press, 2006. a
Wood, S. N.: Fast stable restricted maximum likelihood and marginal likelihood estimation of semiparametric generalized linear models, J. Roy. Stat. Soc. B, 73, 3–36, 2011. a
Wood, S. N., Pya, N., and Säfken, B.: Smoothing Parameter and Model Selection for General Smooth Models, J. Am. Stat. Assoc., 111, 1548–1563, https://doi.org/10.1080/01621459.2016.1180986, 2016. a
Wooster, W. S., Bakun, A., and McLain, R. M.: Seasonal upwelling cycle along the Eastern boundary of the North Atlantic, J. Mar. Res., 34, 131–141, 1976. a
Worden, A. Z., Nolan, J. K., and Palenik, B.: Assessing the dynamics and ecology of marine picophytoplankton: The importance of the eukaryotic component, Limnol. Oceanogr., 49, 168–179, 2004. a
Zubkov, M. V., Sleigh, M. A., Burkill, P. H., and Leakey, R. J. G.: Picoplankton community structure on the Atlantic Meridional Transect: A comparison between seasons, Prog. Oceanogr., 45, 369–386, https://doi.org/10.1016/S0079-6611(00)00008-2, 2000. a, b, c