the Creative Commons Attribution 4.0 License.
the Creative Commons Attribution 4.0 License.
 | 26 Oct 2018
Ecophysiological characteristics of red, green, and brown strains of the Baltic picocyanobacterium Synechococcus sp. – a laboratory study
Sylwia Śliwińska-Wilczewska
Agata Cieszyńska
Jakub Maculewicz
Adam Latała
The contribution of picocyanobacteria (PCY) to summer phytoplankton blooms, accompanied by an ecological crisis is a new phenomenon in Europe. This issue requires careful investigation. The present study examined the response of Synechococcus sp. physiology to different environmental conditions. Three strains of Synechococcus sp. (red BA-120, green BA-124, and brown BA-132) were cultivated in a laboratory under previously determined environmental conditions. These conditions were as follows: temperature (T) from 10 by 5 to 25 ∘C, salinity from 3 by 5 to 18 PSU, and photosynthetically active radiation (PAR) from 10 by 90 to 280 µmol photons m−2 s−1, which gave 64 combinations of synthetic, though realistic, environmental scenarios. Scenarios reflecting all possible combinations were applied in the laboratory experiments. Results pointed to differences in final numbers of cells among strains. However, there was also a similar tendency for BA-124 and BA-132, which demonstrated the highest concentrations of PCY cells at elevated T and PAR. This was also the case for BA-120 but only to a certain degree as the number of cells started to decrease above 190 µmol photons m−2 s−1 PAR. Pigmentation, chlorophyll a (Chl a), fluorescence, and rate of photosynthesis presented both similarities and differences among strains. In this context, more consistent features were observed between brown and red strains when compared to the green. In this paper, the ecophysiological responses of PCY are defined.
- Article
(9451 KB) - Full-text XML
-
Supplement
(2005 KB) - BibTeX
- EndNote


The presence of picoplankton and its contribution to marine biomass were ignored in environmental studies conducted before 1970. This was related to the poor accuracy of research equipment, which did not enable the recording and recognition of such small organisms. Before the discovery of picocyanobacteria (PCY) in the oceans by Johnson and Sieburth (1979) and Waterbury et al. (1979), there only existed incidental reports of this fraction of cyanobacteria occurrence in aquatic ecosystems. Since then, the number of PCY observations has rapidly increased, and currently they are known to be present in many marine, brackish, and freshwater ecosystems of the world (e.g., Callieri, 2010; Sorokin and Zakuskina, 2010; Flombaum et al., 2013; Jodłowska and Śliwińska, 2014; Jasser and Callieri, 2017). Additionally, recent works showed that many aquatic ecosystems have been experiencing super-dense, long-term blooms of picocyanobacteria (Sorokin et al., 2004; Sorokin and Zakuskina, 2010), whilst in the past PCY were often described as a non-blooming group (Stockner et al., 1988). Sorokin and Zakuskina (2010) found that the picocyanobacteria blooms were accompanied by great changes in the benthic habitats.
Picocyanobacteria of the Synechococcus genus are extremely important organisms in the world's oceans. This is the smallest fraction of plankton ranked by the size of cells, which ranges from 0.2 to 2.0 µm (Sieburth et al., 1978). Chrococcoid genus of the Synechococcus is an ubiquitous component of the natural plankton communities in aquatic environments. Picocyanobacteria of the Synechococcus group span a range of different colors, depending on their pigments composition (Stomp et al., 2007; Haverkamp et al., 2008). Synechococcus sp. ranged by the pigment content are divided into two main groups: strains rich in the pigment phycoerythrin (PE), rendering the representatives a variety of orange, brown, reddish, pink, and purple colors, and strains rich in phycocyanin (PC), coloring the organism in various shades of blue–green (Haverkamp et al., 2009). Baltic strains of Synechococcus sp. are classified as three main groups: red and brown strains rich in PE, and green strains rich in PC (Mazur-Marzec et al., 2013; Jodłowska and Śliwińska, 2014). The difference between red and brown strains is a proportion of two different bilin pigments known as phycoerythrobilin (PEB) and phycourobilin (PUB), which both bind to the PE apoprotein (Everroad and Wood, 2006; Stomp et al., 2007; Six et al., 2007a, b; Haverkamp et al., 2008, 2009). The three strains of Synechococcus sp.: BA-120 (red), BA-124 (green), and BA-132 (brown) examined in this work (Fig. 1) are different phenotype representatives. Coexistence of PE and PC-rich picocyanobacteria can be found in waters of intermediate turbidity, such as many freshwater lakes and coastal seas including Baltic Sea (Andersson et al., 1996; Hajdu et al., 2007; Stomp et al., 2007; Haverkamp et al., 2008, 2009; Mazur-Marzec et al., 2013; Larsson et al., 2014; Paczkowska et al., 2017).
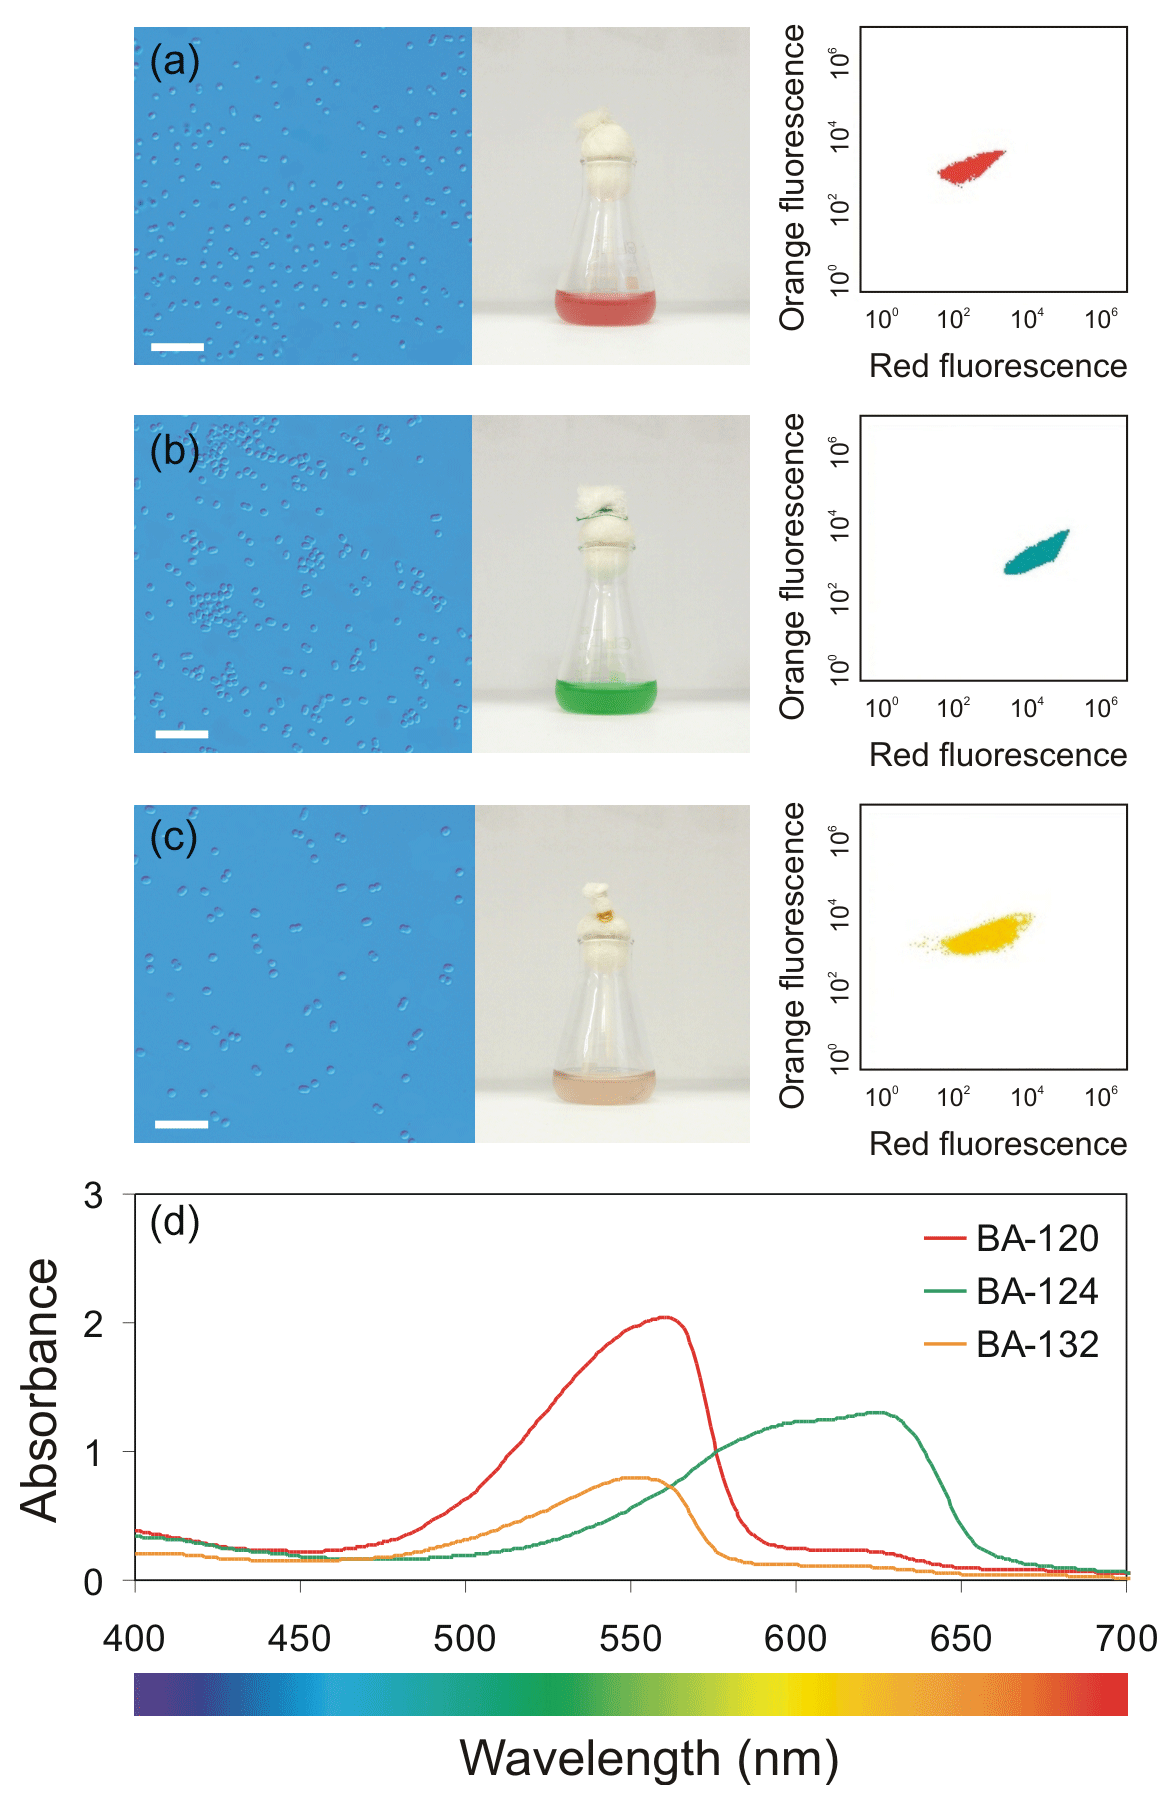
Figure 1Left-side top panel (a, b, c) – light microscope photographs of three Synechococcus sp. strains (scale bar of 10 µm) along with the photographs of the cultures in 25 mL glass Erlenmeyer flasks; right-side top panel – scatter plots of orange fluorescence vs. red fluorescence analyzed using a BD Accuri™ C6 Plus flow cytometer; and bottom panel (d) – PAR absorption spectra determined for the mixture of phycobilin pigments for each Synechococcus sp. strain.
Picocyanobacterial species are phylogenetically divided into several major clusters. These clusters have been identified based on photosynthetic pigmentation, nitrogen requirements, motility, and salinity preferences (Herdman et al., 2001). Picocyanobacteria that are often found and isolated from marine, brackish and freshwater environments are related to Synechococcus cluster 5 (Herdman et al., 2001). Synechococcus cluster 5 is divided into two subclusters: 5.1 and 5.2. The members of cluster 5.1 typically produce PE as their main photosynthetic pigment. In contrast, members of cluster 5.2 have a green coloration because they produce PC (Herdman et al., 2001; Larsson et al., 2014). The diversity of picocyanobacteria has been investigated mainly by analysis of the 16S rRNA gene. However, the phylogenetic tree of Synechococcus sp. is not always consistent with their phenotype (Haverkamp et al., 2008). Thus, the actual taxonomic position may be incorrectly defined due to the morphological plasticity of these organisms (Callieri, 2010).
Despite its association with open ocean systems, it has become increasingly evident in recent years that Synechococcus sp. is a significant contributor to cyanobacterial blooms (Beardall, 2008). Surprisingly, this species may also comprise 80 % or more of the total cyanobacterial biomass during cyanobacterial blooms in the Baltic Sea (Stal et al., 2003; Mazur-Marzec et al., 2013).
Recently, it has been confirmed that PCY are able to excrete harmful and allelopathic substances (e.g., Jakubowska and Szeląg-Wasilewska, 2015; Jasser and Callieri, 2017; Śliwińska-Wilczewska et al., 2017; Barreiro Felpeto et al., 2018). Many different factors, including physical parameters, availability and competition for resources, selective grazing, and allelopathic interactions can affect the occurrence of harmful blooms in aquatic ecosystems. The development of massive algal blooming is a consequence of the interaction between many favorable factors. Synechococcus sp. greatly contributes to these massive blooms, but so far the characteristics of the life cycle of Baltic PCY have not been sufficiently studied. This knowledge needs to be expanded and improved, especially because of bloom toxicity and negative impacts on ecosystems (Jasser and Callieri, 2017; Śliwińska-Wilczewska et al., 2018a).
According to all the above information, phytoplankton is of great interest to scientists in terms of understanding its life cycles and impact on the ecosystem in different parts of the world's oceans and within diverse environmental conditions. In order to investigate it, scientists use various types of research methodology: in situ measurements, laboratory experiments, and numerical estimations. All of these approaches are necessary and essential in marine phytoplankton research. Some laboratory and field studies of ecophysiological responses of picocyanobacteria to different growth conditions have already been completed for typical oceanic mediums, semi-closed seas, and lakes (e.g., Glover et al., 1986; Kuosa, 1988; Stal et al., 1999; Agawin et al., 2000; Callieri and Stockner, 2002; Hajdu et al., 2007; Sánchez-Baracaldo et al., 2008; Cai and Kong, 2013; Motwani and Gorokhova, 2013; Jodłowska and Śliwińska, 2014; Stawiarski et al., 2016). However, there is still a need to provide more systematic information about these organisms. What is more, the need is amplified by the fact that there are only a few research papers on the brown strain of Baltic Synechococcus sp. (Stal et al., 2003; Haverkamp et al., 2008, 2009; Jodłowska and Śliwińska, 2014). This gives limited knowledge of PCY and their life cycle in the Baltic Sea, as brown form also contributes to total pico- and phytoplankton biomass in the area of interest (Stal et al., 2003). The above strengthens the motivation to conduct studies on the brown strain of Synechococcus sp.
The overall goal of this paper is to determine the most favorable and unfavorable environmental conditions for PCY to grow on the basis of three different strains of Synechococcus sp. ecophysiological analysis. What is more, this study aims at describing pigmentation, Chl a fluorescence parameters, and photosynthesis performance of PCY cells grown in different environmental conditions. The goal is also to demonstrate how the increasing abundance of PCY in the Baltic Sea may impact the marine ecosystem functioning. The initial step of these works was to carry out laboratory experiments with Synechococcus sp. cultures. In order to create different environmental conditions in the Baltic Sea range, combinations of physical quantities were determined. In total, 64 combinations (environmental scenarios) were generated. The second step was to plot and analyze all results after 7 days of incubations. For the results, the number of cells, pigmentation, Chl a fluorescence parameters, and the rate of photosynthesis were collected. The third step was to extract any significant relations between the results and specific physical factors by using a statistical analysis, which included the variance method analysis (two-way ANOVA) and Tukey's honestly significant difference (HSD) post-hoc test. Derived laboratory results will help to develop the knowledge of the picocyanobacteria life cycle. Moreover, the PCY experiments underlie the improved numerical approach to phytoplankton modeling development. On the basis of derived results, the algorithm for picocyanobacterium growth will be created in a separate study.
2.1 Material and culture conditions
Three different phenotypes of picocyanobacteria strains from the genus Synechococcus were examined: BA-120 (red), BA-124 (green), and BA-132 (brown). The Synechococcus sp. strains were isolated from the coastal zone of the Gulf of Gdańsk (southern Baltic Sea) and maintained as unialgal cultures in the Culture Collection of Baltic Algae (CCBA) at the Institute of Oceanography, University of Gdańsk, Poland (Latała et al., 2006).
The experiments on the “batch cultures” were carried out in 25 mL glass Erlenmeyer flasks containing sterilized f∕2 medium (Guillard, 1975). Culture media was prepared with artificial seawater filtered through a 0.45 µm filter (Macherey–Nagel MN GF-5) using a vacuum pump (600 mbar) and autoclaved. The cultures were incubated in 35 mL Erlenmeyer glass flasks. The salinity of the media was prepared by dissolving tropic marine synthetic sea salt in distilled water. The major nutrients, micro-elements, and vitamin concentrations were added according to a method proposed by Guillard (1975) (any of the components in f∕2 media were not replaced by Tropic Marine Synthetic Sea Salt).
The picocyanobacteria cultures were adapted to the various synthetic environmental conditions for 2 days. The conditions were the combinations of different values of scalar irradiance in photosynthetically active radiation (PAR) spectrum (10, 100, 190, and 280 µmol photons m−2 s−1), temperature (T) (10, 15, 20, and 25 ∘C), and salinity (3, 8, 13, and 18 PSU). The strains were incubated under a 16 : 8 h light : dark cycle. The measurements of all strains were taken when the experiment incubations completed (after the full 7 days) at the same time during the light : dark cycle (in the light phase). The salinity was verified by salinometer (inoLab Cond Level 1, Weilheim in Oberbayern, Germany). The intensity of PAR was measured using a LI-COR spherical quantum meter (LI-189, LI-COR Inc., Nebraska, USA). Fluorescent lamps (cool white 40 W, Sylvania, USA) were used as a source of irradiance and were combined with halogen lamps (100 W, Sylvania, USA) to obtain more intensive light. Both light sources give PAR spectrum. This was proved by Jodłowska and Latała (2010) and Jodłowska and Śliwińska (2014). What is more, LI-COR manual with technical specification therein says that the sensor first checks the light spectrum and if it responds PAR spectrum, the intensity of radiation is measured. This implies that all the results given by LI-COR refer to PAR. Values of quantities representing each environmental condition were applied at the fixed intervals, i.e., PAR, interval 90; T, interval 5; salinity, interval 5.
The synthetic environmental conditions of salinity and T applied in the laboratory are representative of the Baltic Sea area (Feistel et al., 2008, 2010; Siegel and Gerth, 2017). Moreover, the values of environmental conditions variables (salinity, temperature, PAR) were also specified in certain ranges to make this study comparable with other laboratory culture experiments available in the literature. The combination of the quantities of environmental variables is called a scenario in the present paper. After acclimation time (2 days), the picocyanobacteria cells served as inoculum for the right test cultures with the initial number of cells equal to 106 cells mL−1. During the acclimation time, cell division rate for the strains was about 1 day−1 on average. It was enough to enable the cells to acclimate to environmental conditions without the risk of stress severity. The acclimation cultures used for inoculation were isolated from the logarithmic growth phase. The flasks with picocyanobacteria were shaken (once a day) during the experiment. In order to achieve the most reliable results, test cultures were grown in three replicas and were incubated for 1 week at each combination of light, temperature, and salinity. The initial cell number, i.e., the culture density just after inoculation, was the same for all replicas. On the last day of incubation, the number of cells, pigment content, Chl a fluorescence, and rate of photosynthesis were measured in each replica. Results were reported as mean values ± standard deviation (SD). Additionally, to broaden the understanding and comparison possibilities, the number of generations (number of generations is equal to elapsed time (t)∕doubling time (d)) for each strain was demonstrated in the Supplement (Fig. S1).
2.2 Determination of the number of cells
The flow cytometry was used to establish the initial number of picocyanobacteria cells and to measure the final cell concentrations after the incubation period. The number of cells (N) in cultures was counted with flow cytometer BD Accuri™ C6 Plus (BD Biosciences, San Jose, CA, USA) according to the procedure proposed by Śliwińska-Wilczewska et al. (2018b). Events were recorded in list form. Samples were run at a flow rate of approximately 14 µL min−1. Selection of this flow rate was based on previous introductory experiments to determine the most relevant effectiveness. Choosing an adequate discriminator and thresholds plays a key role in recording the cells correctly. The most reasonable solution to record chlorophyll fluorescing cyanobacteria and microalgae is to choose the red fluorescence as the discriminator (Fig. S1) and to select a high threshold, enough to eliminate optical and electronic noise (Marie et al., 2005). Concerning this, the discriminator was set on the red (chlorophyll) fluorescence with a standard threshold of 80 000 on forward scatter height (FSC-H). The flow was calibrated daily with Spherotech six- and eight-peak validation beads (BD, San Jose, USA). This ensures that the cytometer is working properly before running experimental samples. FITC, PE, and PE-Cy5 detectors were daily calibrated with SPHERO™ rainbow calibration particles (BD, San Jose, USA), and the APC channel was calibrated with SPHERO six-peak allophycocyanin calibration particles (APC). Detectors FL1, FL2, and FL3 read fluorescence emissions excited by the blue laser (480 nm), while detector FL4 reads emissions excited by the red laser (640 nm).
2.3 Determination of the pigments' content
The concentration of photosynthetic pigments of analyzed picocyanobacteria was measured by the spectrophotometric method (Strickland and Parsons, 1972). The analysis of mL-specific (pigment content per mL) and cell-specific (pigment content per cell) pigmentation was conducted. Note that “mL-specific” means “volume-specific”, whereas the volume is fixed to 1 mL. After 7 days of incubation, 4 mL of culture was filtered in order to separate the picocyanobacteria cells from the medium. Chl a and carotenoids (Car) were extracted from the picocyanobacteria cells with cold 90 % acetone (5 mL). To improve extraction, the cells were disintegrated for 2 min by ultrasonication. Then, the test tube with the extract was held in the dark for 3 h at −60 ∘C. To remove cell debris and filter out the particles, the extracts were centrifuged at 10 000 rpm (8496×g) for 5 min (Sigma 2-16P, Osterode am Harz, Germany). The absorbance of pigments was estimated on the basis of Beckman spectrophotometer UV-VIS DU 530 measurements at specific wavelengths (750, 665, and 480 nm), using a 1 cm quartz cuvette. Pigment concentration was calculated according to Strickland and Parsons (1972). The following formulas have been used: Chl a (µg mL−1) = , Car (µg mL−1) = , where Va – extract volume (in this study 5 mL), Vb – sample volume (in this study 4 mL), and Ax – absorbance estimated at wavelength x in a 1 cm cuvette.
2.4 Chlorophyll fluorescence analyses
Chl a fluorescence was measured with a pulse amplitude modulation (PAM) fluorometer (FMS1, Hansatech, King's Lynn, Norfolk, UK). The FMS1 uses a 594 nm amber modulating beam with four-step frequency control as a measuring light and is equipped with a dual-purpose halogen light source providing actinic light (0–3000 µmol photons m−2 s−1 in 50 steps) and a saturating pulse (0–20 000 µmol photons m−2 s−1 in 100 steps). FMS1 also has a 735 nm far-red LED source for preferential PSI excitation allowing accurate determination of the parameter. Samples were filtered onto 13 mm glass fiber filters (Whatman GF/C, pore size of 1.2 µm). Before measurement, the filtered sample was kept in the dark for 10 min. The maximum photochemical efficiency of photosystem II (PSII) at the dark-adapted state (Fv∕Fm) and the photochemical efficiency of PSII under actinic light intensity (ΦPSII) were estimated. The actinic light was different for different cultures, the same as the PAR level was for each incubation. The above is similar to the method used by Campbell et al. (1998).
2.5 Measurements of photosynthesis rate
The measurements of oxygen evolution were carried out on the seventh day of the experiment using a Clark-type oxygen electrode (Chlorolab 2, Hansatech). The temperature was controlled with a cooling system (LAUDA, E100, Germany). Illumination was provided by a high-intensity probe-type light array with 11 red LEDs centered on 650 nm. Irradiance was measured with a quantum sensor (Quantitherm, Hansatech, King's Lynn, Norfolk, UK). Dark respiration was estimated from O2 uptake by cells incubated in the dark. Experimental data were fitted to the photosynthesis–irradiance response (P−E) curves using equation of Jassby and Platt (1976) and photosynthetic parameters, i.e., the photosynthetic capacity (Pm) and the initial slope of P−E curve (α) (Sakshaug et al., 1997). The calculations were done in Statistica® 13.1 software.
2.6 Statistical analyses
The effect of light and temperature separately and then their combined impact on growth, pigments' content, fluorescence, and photosynthesis performance of examined strains were analyzed using two-way variance analysis (ANOVA). A post-hoc test (Tukey's HSD) was used to show which results differed under varied conditions over the experimental period (Sheskin, 2000). The confidence levels in the statistical analysis were 95 % (), 99 % (), and 99.9 % (). The statistical analyses were performed using Statistica® 13.1 and Matlab 2012b software. According to the literature, light and temperature are major factors controlling the growth and distribution of picocyanobacteria (e.g., Jasser and Arvola, 2003), and they may have considerable influence on the abundance of the Synechococcus community (Glover, 1985; Glover et al., 1985, 1986; Joint and Pomroy, 1986; Jasser and Arvola, 2003; Jasser, 2006; Jodłowska and Śliwińska, 2014); as a result, it was decided that light and temperature would be the independent variables in ANOVA and post-hoc test analysis. The dependent variable was always the parameter which had been measured.
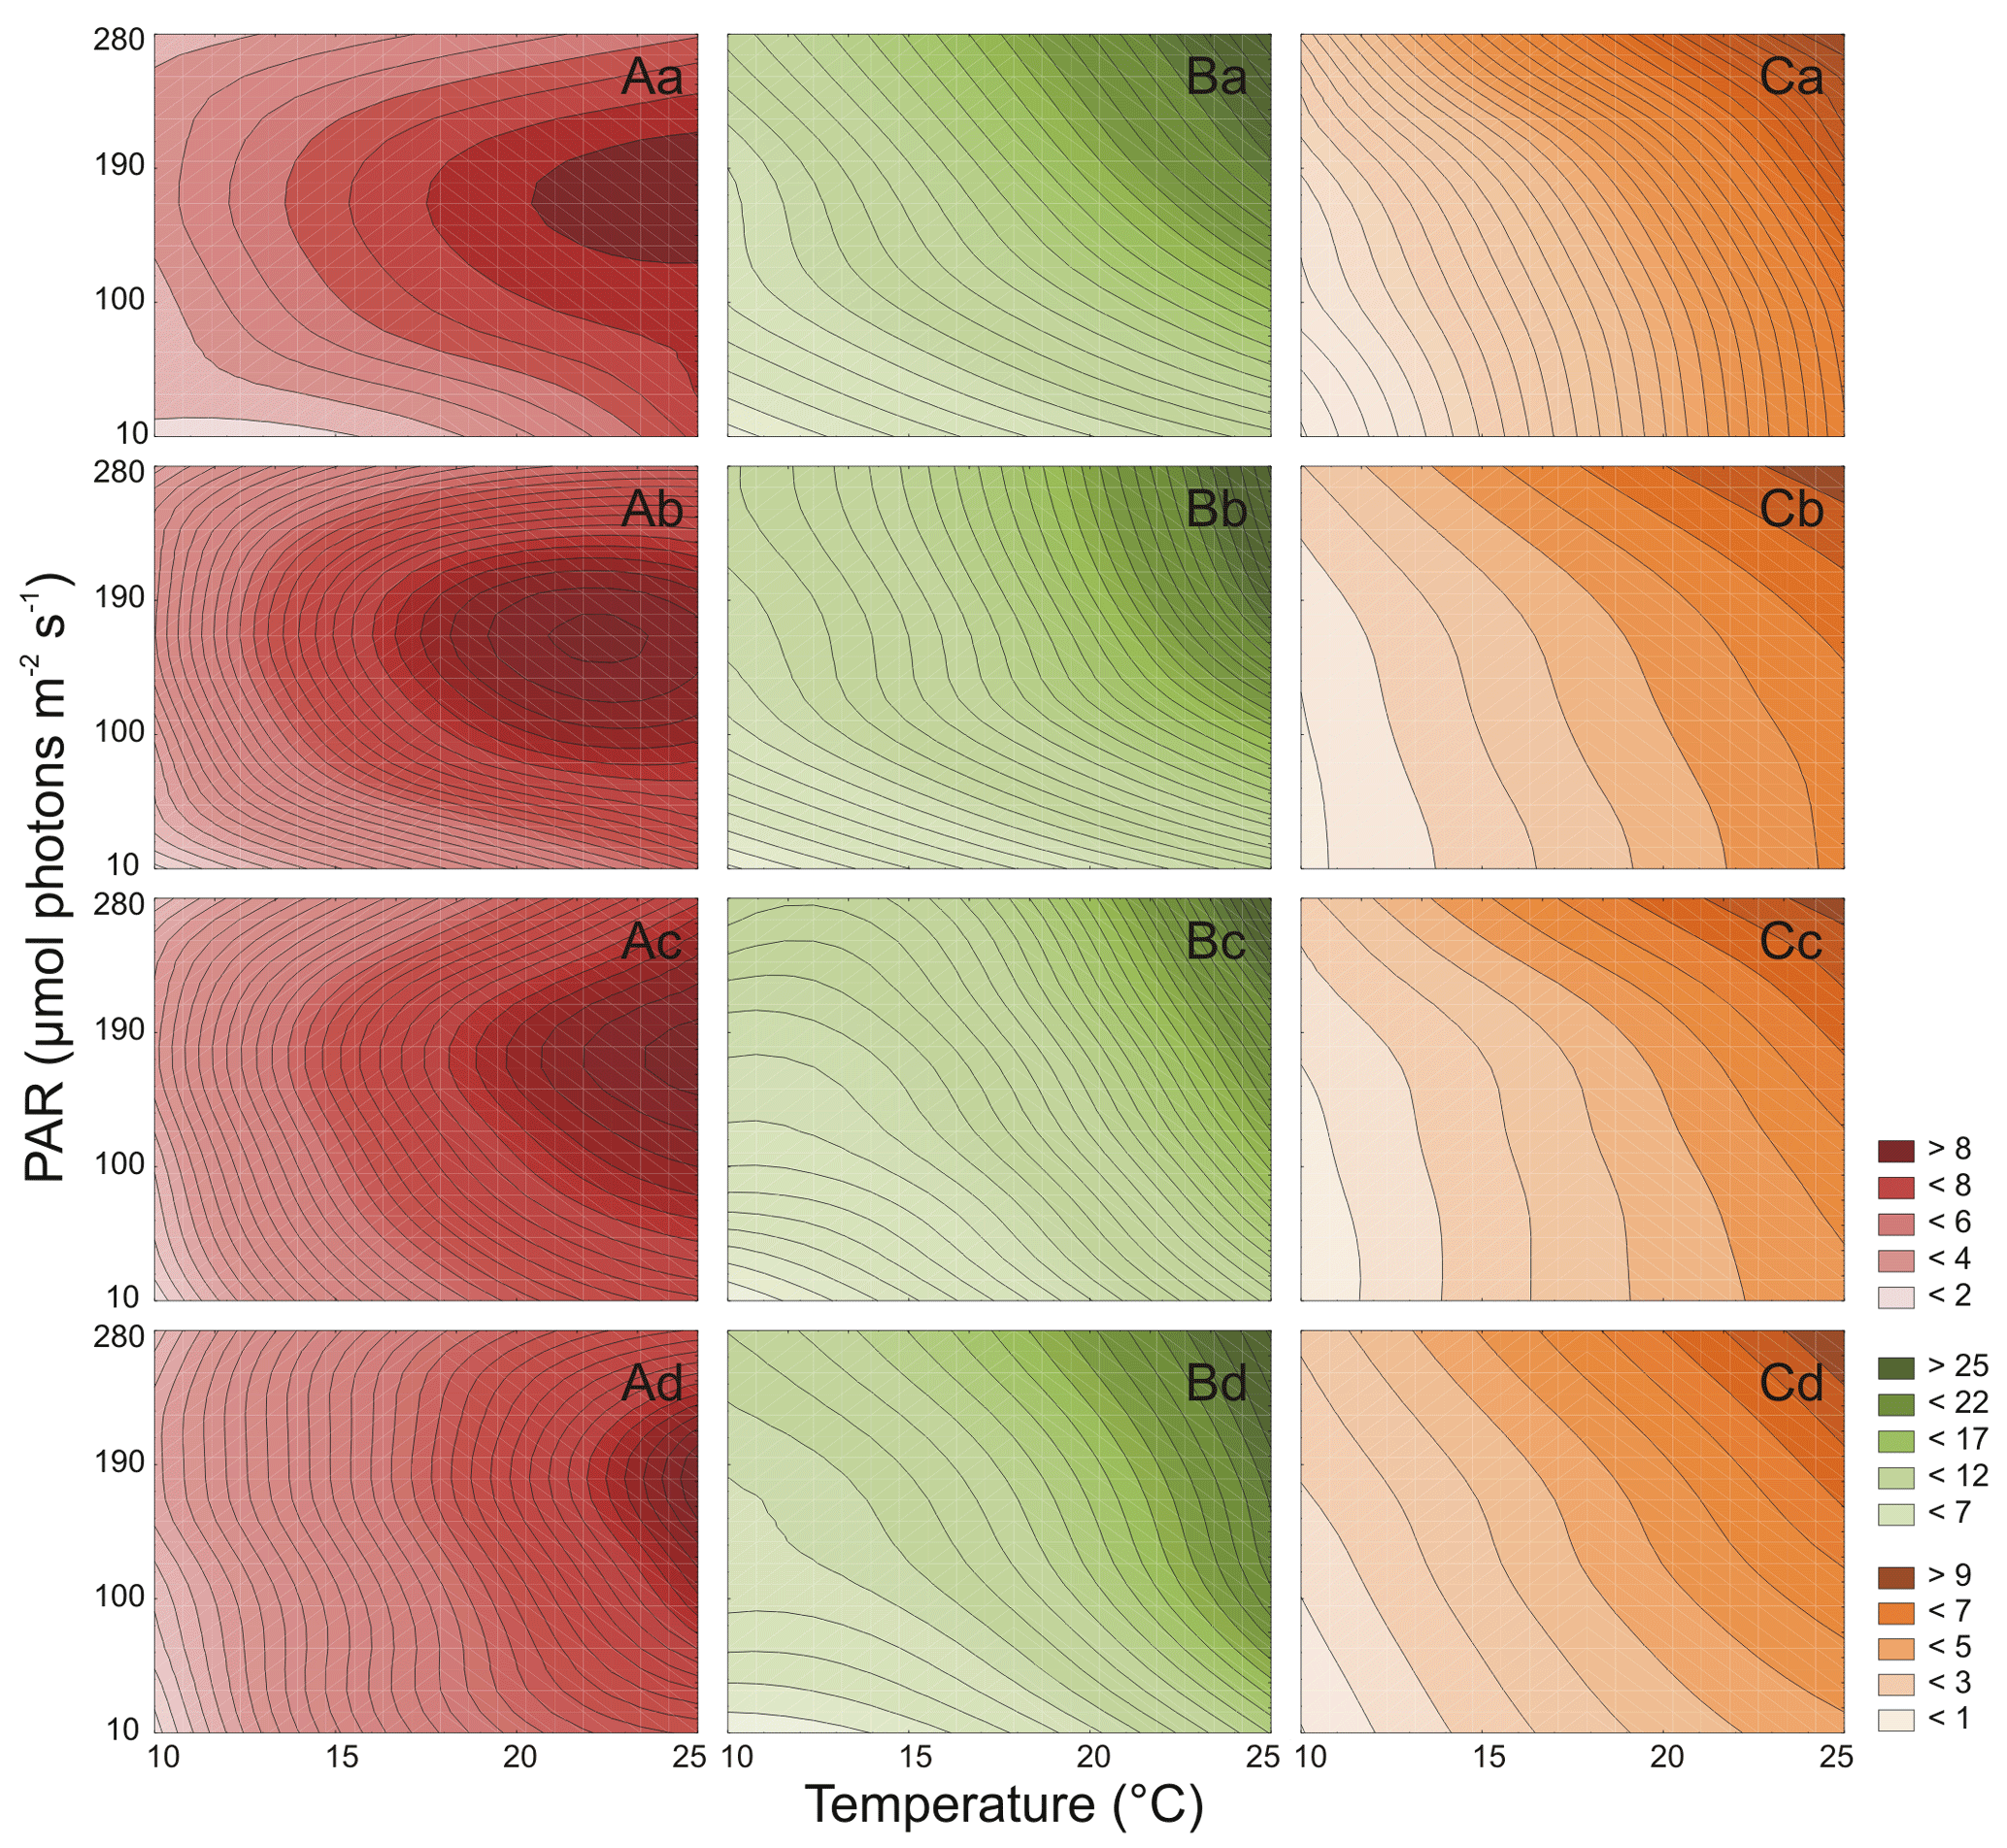
Figure 2Cell number (106 cell mL−1) for three Synechococcus sp. strains: BA-120 (A), BA-124 (B), and BA-132 (C) under different PAR and temperature conditions in four salinity mediums: 3 PSU (a), 8 PSU (b), 13 PSU (c), and 18 PSU (d).
3.1 Number of cells
For all three picoplankton strains, ANOVA analysis indicated that in each scenario the independent variable (temperature or PAR) significantly influenced the dependent variable. What is more, post-hoc tests indicated that multiple factors (T and PAR together) had an impact on the PCY growth.
According to post-hoc tests, 2008 multiple comparisons (70 %) out of all 2880 completed for three strains indicated the highest statistical significance (Tukey's HSD, ), 160 multiple comparisons (6 %) pointed to the statistical significance of , and 114 (4 %) indicated the significance of . The rest of the multiple comparisons (598, 20 %) indicated no statistically significant differences (Tukey's HSD, p≥0.05).
Both PAR and T affected the number of Synechococcus sp. BA-120 cells significantly (Table S1 in the Supplement). For BA-120, the number of cells increased with T in each medium (salinities 3, 8, 13, and 18 PSU) (Fig. 2A.a–d). The minimum number of cells was estimated in salinity 3 PSU, T 10 ∘C, and PAR 10 µmol photons m−2 s−1 (1.6×10⁶ cell mL−1, Fig. 2A.a), whilst the maximum in salinity 18 PSU, T 25 ∘C, and PAR 190 µmol photons m−2 s−1 (11.5×10⁶ cell mL−1, Fig. 2A.d). The decrease in the number of cells was observed from PAR 190 µmol photons m−2 s−1 onwards. This can likely be related to the photo-inhibition of PSII. The above was the case in each salinity (Fig. 2A.a–d). Additionally, the results analysis (Fig. 2A.a–d) showed that the most important environmental factor influencing BA-120 number of cells was T, with PAR playing an additional role, for instance, in the context of photo-inhibition. This was pronounced the most within lower temperatures (10 and 15 ∘C), where the change in BA-120 abundance along with PAR increase was barely observed, being plainly visible along with T increase at once. Multiple comparison tests pointed to the strong significance of PAR and T combined in influencing the number of Synechococcus sp. BA-120 cells. According to the statistics, 82 % of multiple comparisons were statistically significant (Tukey's HSD, ), with 91 % of them having the highest significance level (Tukey's HSD, ).
Both PAR and T also significantly affected the number of Synechococcus sp. BA-124 cells (Table S1 in the Supplement). For BA-124, the number of cells increased with T and PAR in all salinities (Fig. 2B.a–d). The lowest number of cells was calculated in salinity 3 PSU, T 10 ∘C, and PAR 10 µmol photons m−2 s−1 (2.0×10⁶ cell mL−1, Fig. 2B.a), and the highest number of cells was reached in salinity 18 PSU, T 25 ∘C, and PAR 280 µmol photons m−2 s−1 (43.6×10⁶ cell mL−1, Fig. 2B.d). High abundances were estimated also under the highest T and PAR conditions in salinity 13 PSU, where a number of cells equaled 41.1×10⁶ cell mL−1 (Fig. 2B.c). Generally, the number of cells was the highest in BA-124 cultures when compared to BA-120 and BA-132 cultures in respective scenarios. One of the observations was the difference in BA-124 number of cells between lower and higher PAR and T conditions (scenarios with lower PAR and T and scenarios with higher PAR and T). BA-124 seemed to be more sensitive to changes in PAR and T in their lower rather than in higher ranges. Regarding salinity, the highest number of BA-124 cells was noted in moderate- and high-salinity mediums. Optimum salinities for strain BA-124 were 8 and 13 PSU. Due to post-hoc analysis, salinity 13 PSU differentiated the conditions for cell abundances under different PAR and T at a lower degree when compared to other salinities under respective PAR and T (the least statistically significant differences observed in medium 13 PSU), which is also noticeable in Fig. 2B.c. Another feature of BA-124 was that the number of cells in low T and high PAR scenarios was nearly equal to cell abundances in high T and low PAR scenarios. This was not the case for BA-120 and BA-132 strains. The observation was supported by Tukey's tests, where only few statistically significant differences in number of cells were observed between scenarios with elevated PAR (280 µmol photons m−2 s−1) and low T (10, 15 ∘C) and those with high T (25 ∘C) and low PAR (10 µmol photons m−2 s−1). These differences were observed between 15 ∘C and 280 µmol photons m−2 s−1 and 25 ∘C and 10 µmol photons m−2 s−1 in salinities 3 and 8 PSU (Tukey's HSD, in both cases, Fig. 2B.a–b). Multiple comparison tests showed the high significance of PAR and T combinations in affecting the number of cells. According to Tukey's HSD tests, 72 % of multiple comparisons were statistically significant (), with 82 % of them with the highest significance level ().
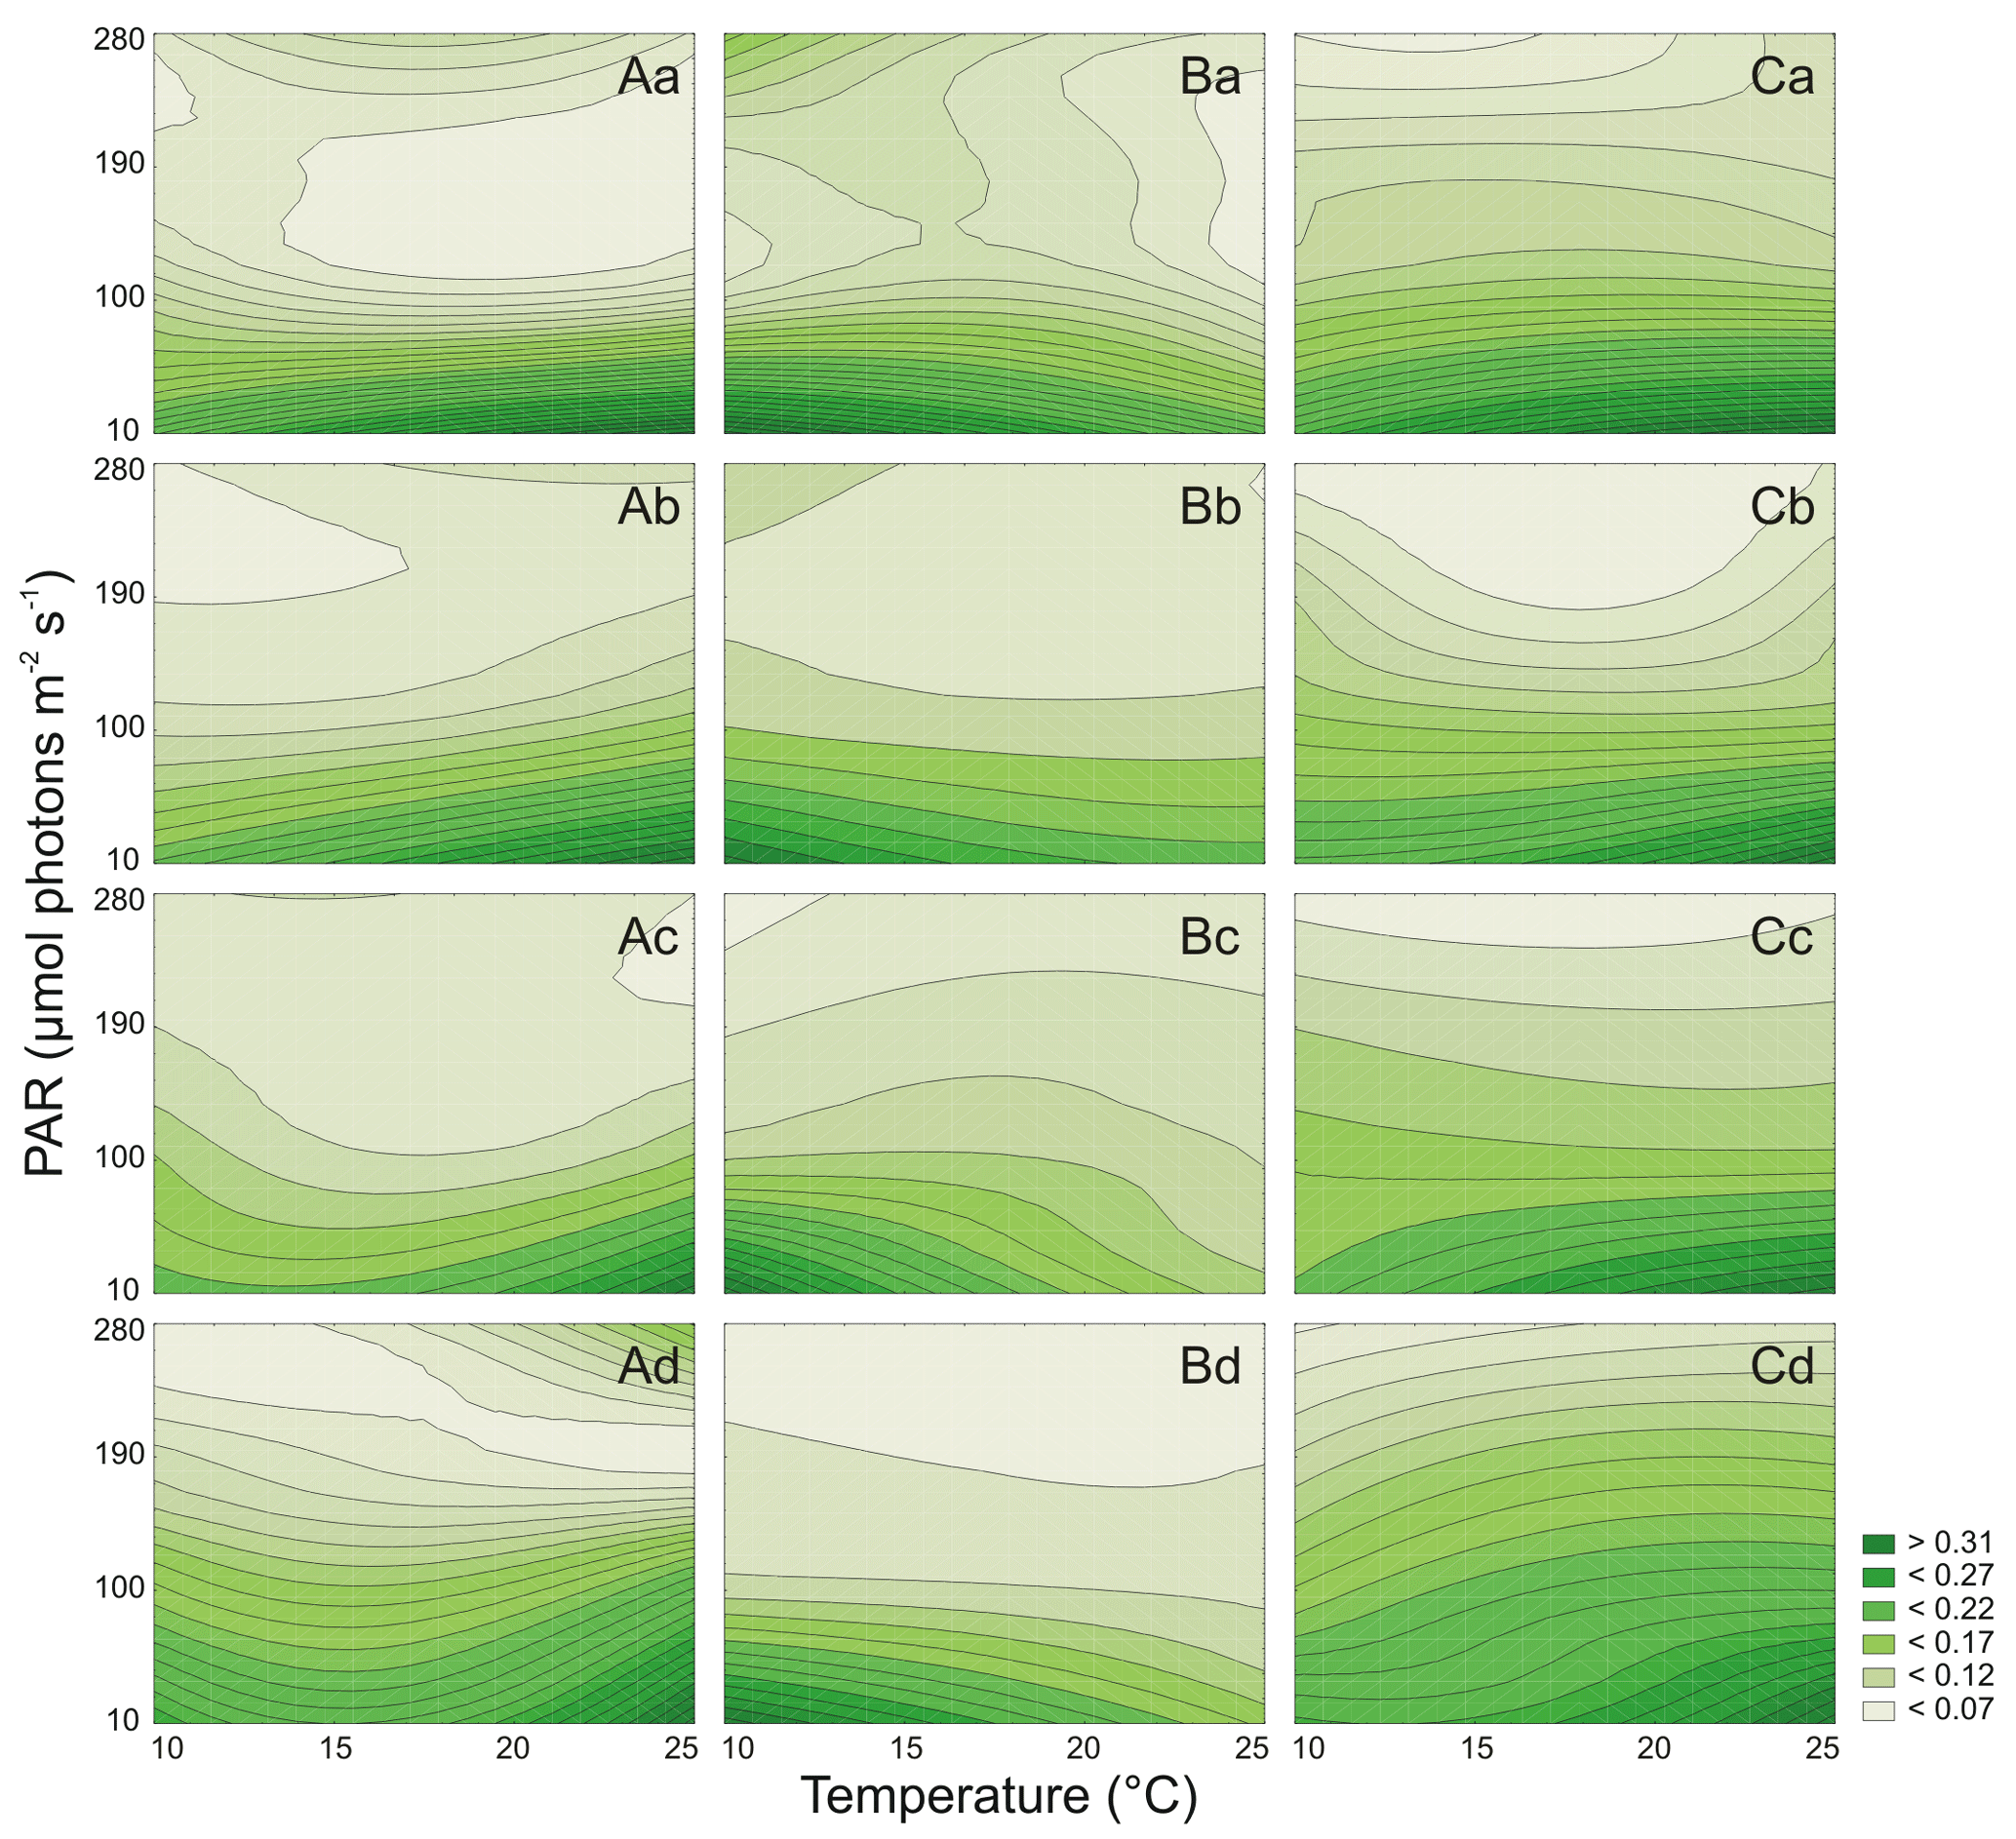
Figure 3Cell-specific Chl a (pg cell−1) changes for three Synechococcus sp. strains: BA-120 (A), BA-124 (B), and BA-132 (C) under different PAR and temperature conditions in four salinity mediums: 3 PSU (a), 8 PSU (b), 13 PSU (c), and 18 PSU (d).
Similarly to BA-120 and BA-124, it was found that PAR and T significantly affected the number of Synechococcus sp. BA-132 cells (Table S1). For BA-132, the positive impact of T and PAR on the number of cells (Fig. 2C.a–d) was observed in each medium. Note that positive impact means the increasing (positive) dependency, whilst negative impact means decreasing (negative) dependency between the independent and dependent variables, e.g., between T and abundance. Salinity played a more significant role here than when compared to BA-124. It was found that the higher the salinity, the higher the number of cells of BA-132. What is more, according to the statistical analysis, salinity 18 PSU differentiated the number of cells the most (Fig. 2C.d). In salinity 18 PSU, the cell abundances could be described as an increasing linear function of ambient T and PAR. This was also observed in other salinities but not as intensively pronounced as in the highest-saline medium. Moreover, in high salinity, the sensitivity of the number of cells to T changes was much lower than in low salinities. PAR did not determine the number of cells as strongly as T, which was quite consistent with the observation noted for BA-120. The minimum number of cells was observed in 3 PSU, 10 ∘C and 10 µmol photons m−2 s−1 (1.4×10⁶ cell mL−1, Fig. 2C.a), whilst the maximum in 18 PSU, 25 ∘C, and 280 µmol photons m−2 s−1 (16.1×10⁶ cell mL−1, Fig. 2C.d). In addition, the lowest values of BA-132 number of cells were calculated for the lowest T and PAR condition in each salinity. Tukey's HSD post-hoc tests indicated the high significance of PAR and T combinations in affecting the cell abundances. According to those tests, 84 % of multiple comparisons were statistically significant (), with 90 % of them with the highest significance ().
Regarding all three strains, high salinity generally had a positive impact on the number of Synechococcus sp. cells. What is more, the relations between salinity and the number of cells for all strains, especially red and brown, were increasing almost linearly, with the highest average increase for BA-132.
3.2 Pigment content
The results showed that, for all strains, cell-specific pigment composition (pigment content per cell) was environmentally driven (Figs. 3, 4). The analysis of mL-specific pigmentation (pigment content per mL) was also done (Figs. S2–S3 and Tables S4–S5 in the Supplement); however, the mL-specific pigment content is another way to illustrate the biomass and that is why it is not described in this section in detail.
It was estimated that PAR and T significantly affected the Chl a cell-specific content of Synechococcus sp. BA-120 (Table S2). Both PAR and T also affected the Car content in the BA-120 strain cells significantly (Table S3). It was found that cell-specific Chl a and Car concentrations decreased with the increase of salinity (Figs. 2A, 3A). On average, the cell content of pigments for BA-120 was the highest when compared to the other strains. Chl a concentration dominated over Car concentration in each scenario. What is more, there were very high cell-specific concentrations of Chl a observed for the whole T domain at low PAR. Maximum Chl a content was measured under T 25 ∘C, and PAR 10 µmol photons m−2 s−1. This was the case in each salinity. The highest Chl a concentration within all scenarios was reached in BA-120 cells in salinity 3 PSU and was equal to 0.339 pg cell−1 (Fig. 3A.a). For other salinities, these maximums were as follows: 0.233 pg cell−1 (8 PSU, Fig. 3A.b), 0.164 pg cell−1 (13 PSU, Fig. 3A.c), and 0.100 pg cell−1 (18 PSU, Fig. 3A.d). The highest Car content was measured in salinity 3 PSU under T of 20 ∘C and PAR 10 µmol photons m−2 s−1 and reached 0.160 pg cell−1 (Fig. 4A.a). The lowest concentrations of Chl a (0.038 pg cell−1) and Car (0.031 pg cell−1) were measured in salinity 18 PSU, T 25 ∘C, and PAR 190 µmol photons m−2 s−1 (Fig. 3A.d) and salinity 18 PSU, T 15 ∘C, and PAR 280 µmol photons m−2 s−1 (Fig. 4A.d), respectively. Multiple comparison tests indicated the significance of PAR and T combined in shaping the pigmentation. Due to those tests, 52 % and 55 % of multiple comparisons in Chl a and Car content analyses, respectively, were statistically significant (Tukey's HSD, ), with 80 % (for Chl a) and 74 % (for Car) of them with the highest significance (Tukey's HSD, ).
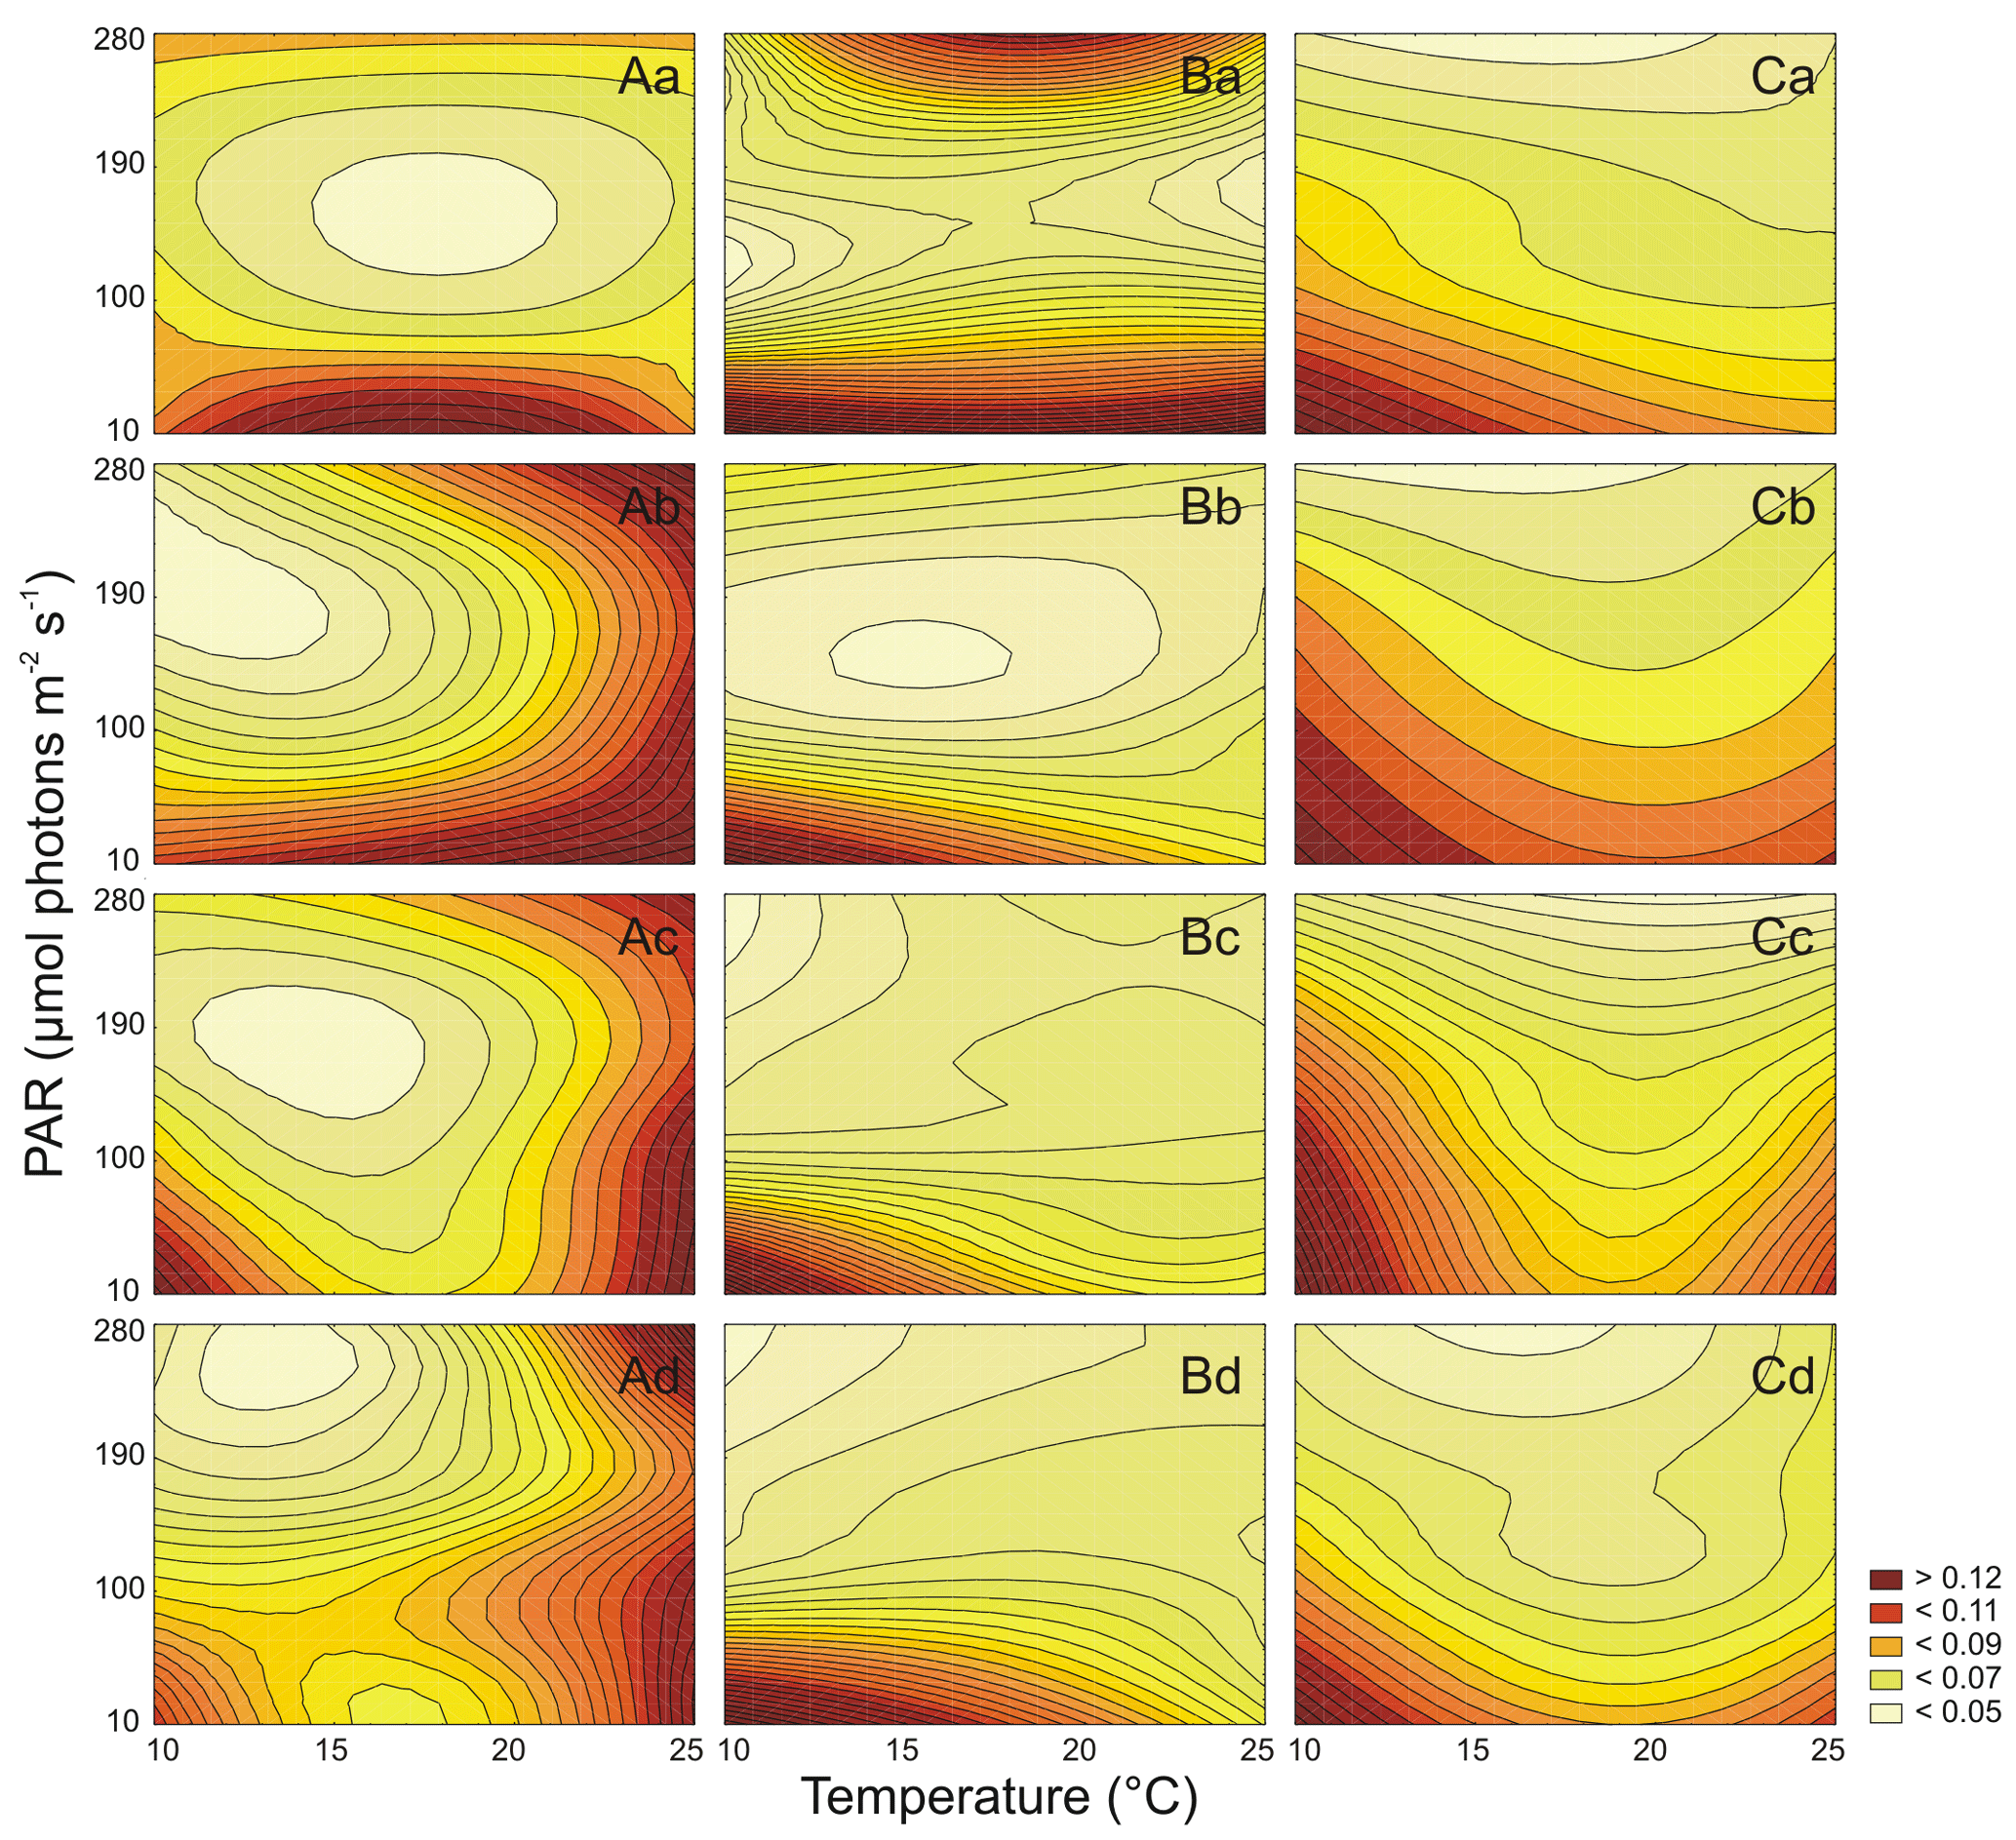
Figure 4Cell-specific Car (pg cell−1) changes for three Synechococcus sp. strains: BA-120 (A), BA-124 (B), and BA-132 (C) under different PAR and temperature conditions in four salinity mediums: 3 PSU (a), 8 PSU (b), 13 PSU (c), and 18 PSU (d).
Both PAR and T affected the Chl a cell-specific content (Table S2) and Car cell-specific content (Table S3) of Synechococcus sp. BA-124 significantly. Generally, PAR and high T increase had a negative impact on pigmentation (Figs. 3B, 4B). Maximum values of cell-specific Chl a and Car concentrations were measured under 10 ∘C and 10 µmol photons m−2 s−1 in each salinity medium. These values, concerning salinities from the lowest to the highest, were as follows: 0.095, 0.102. 0.176, and 0.148 pg cell−1 for Chl a (Fig. 3B.a–d) and 0.051, 0.067, 0.087, and 0.079 pg cell−1 for Car (Fig. 4B.a–d). Nonetheless, there were also some exceptions. In salinity 3 PSU, high Car content was calculated under 280 µmol photons m−2 s−1 and T of 15, 20 ∘C, and equaled 0.042 and 0.041 pg cell−1, respectively (Fig. 4B.a). On average, salinity increase had a negative impact on pigmentation. The lowest cell-specific concentrations of Chl a and Car in BA-124 cells were estimated in the same scenario: salinity 18 PSU, T 10 ∘C, and PAR 280 µmol photons m−2 s−1 and were equal to 0.013 pg cell−1 (Fig. 3B.d) and 0.009 pg cell−1 (Fig. 4B.d), for Chl a and Car, respectively. Multiple comparison tests pointed to the significance of PAR and T combined in influencing the pigmentation. According to the statistics, 47 % and 54 % of multiple comparisons in Chl a and Car content analysis, were statistically significant (Tukey's HSD, ), with 83 % (for Chl a) and 79 % (for Car) of them with the highest significance level (Tukey's HSD, ).
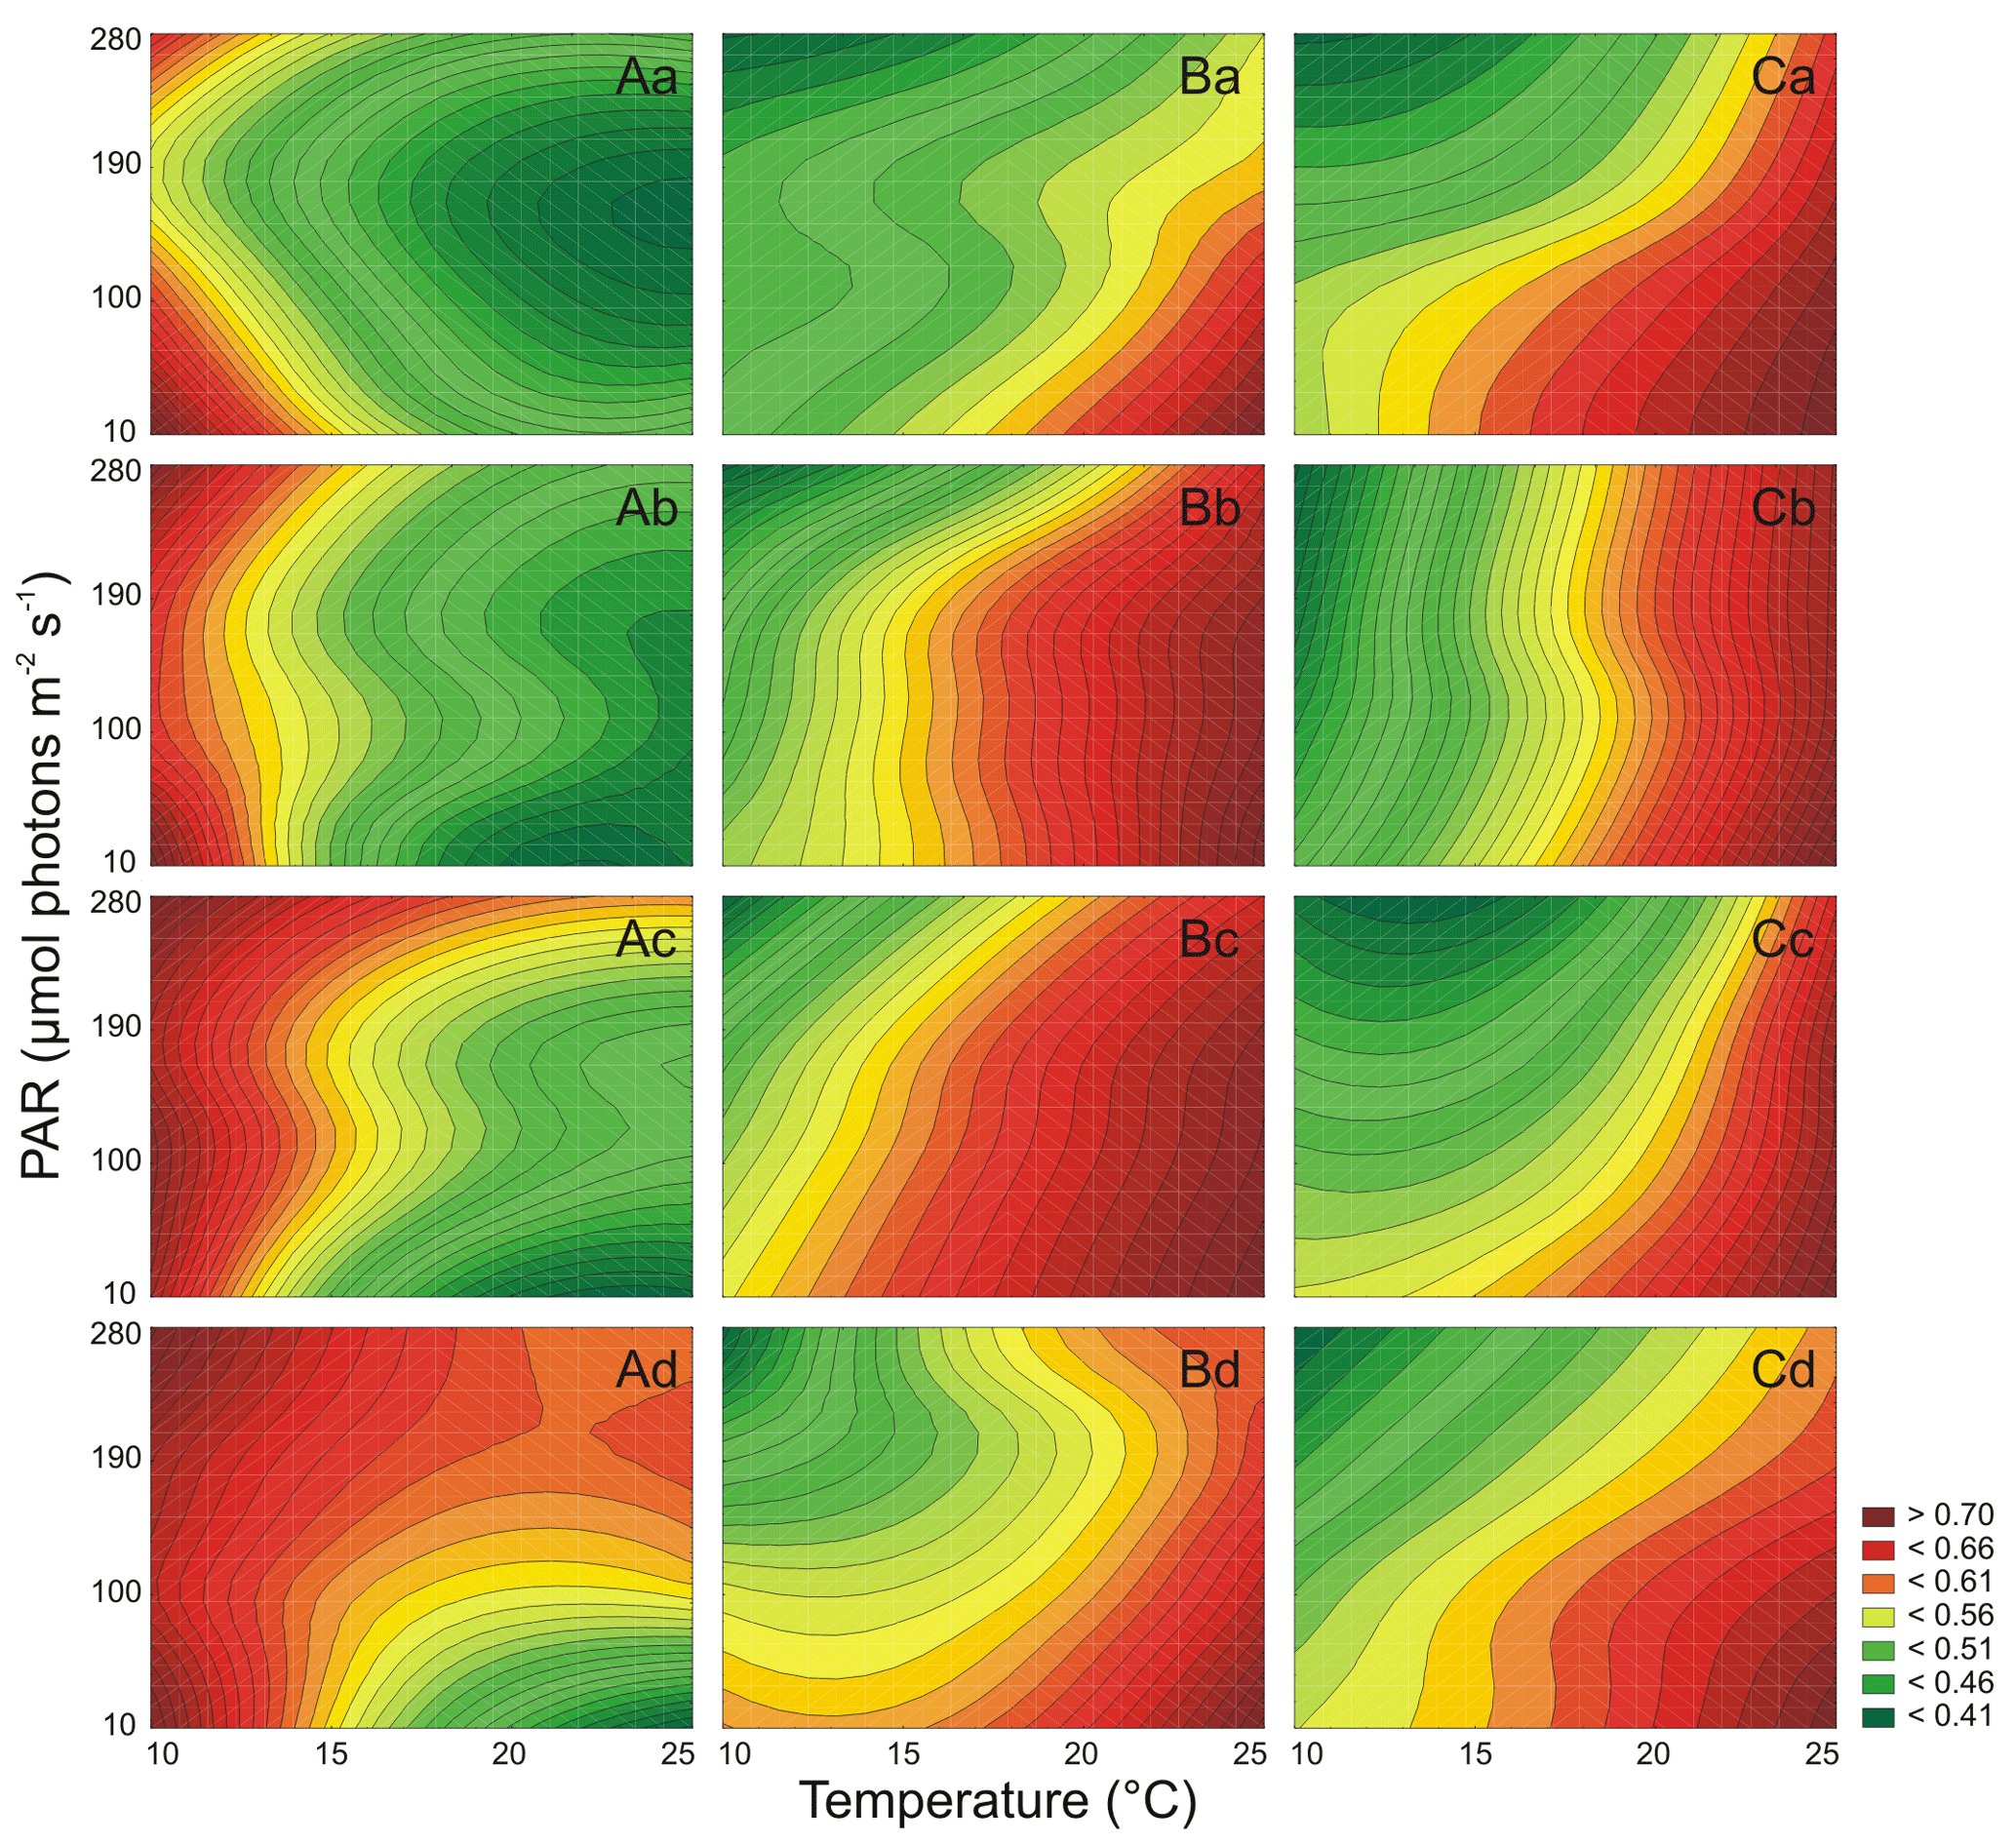
Figure 5The maximum photochemical efficiency of PSII in the dark-adapted state (Fv∕Fm) for three Synechococcus sp. strains: BA-120 (A), BA-124 (B), and BA-132 (C) under different PAR and temperature conditions in four salinity mediums: 3 PSU (a), 8 PSU (b), 13 PSU (c), and 18 PSU (d).
It was also examined that PAR and T affected the Chl a cell-specific content (Table S2) and Car cell-specific content (Table S3) of Synechococcus sp. BA-132 significantly. It was found that salinity increase had a negative impact on cell-specific Chl a and Car concentrations. BA-132 was richer in cell-specific pigments than BA-124 (Figs. 3C, 4C). Along with PAR increase, the Chl a concentration decreased significantly. The maximum Chl a cell-specific content was measured in moderate or high T (20 ∘C in salinity 13 PSU and 25 ∘C in salinities 3, 8, and 18 PSU) under the lowest PAR (10 µmol photons m−2 s−1). These maximums were 0.299 pg cell−1 in salinity 3 PSU (Fig. 3C.a), 0.248 pg cell−1 in salinity 8 PSU (Fig. 3C.b), 0.151 pg cell−1 in salinity 13 PSU (Fig. 3C.c) and 0.073 pg cell−1 in salinity 18 PSU (Fig. 3C.d). Consistently with Chl a, Car cell-specific content maximums were also measured under the lowest PAR (10 µmol photons m−2 s−1) but contrary to Chl a, at the lowest T (10 ∘C). These maximums were 0.194 pg cell−1 in salinity 3 PSU (Fig. 4C.a), 0.131 pg cell−1 in salinity 8 PSU (Fig. 4C.b), 0.097 pg cell−1 in salinity 13 PSU (Fig. 4C.c), and 0.062 pg cell−1 in salinity 18 PSU (Fig. 4C.d). Minimums of Chl a and Car cell-specific content within all scenarios were estimated in salinity 18 PSU, T 15 ∘C, and PAR 280 µmol photons m−2 s−1 and equaled 0.020 pg cell−1 (Fig. 3C.d) and 0.19 pg cell−1 (Fig. 4C.d), for Chl a and Car, respectively. Regarding Chl a for minimum content per cell, the same concentration as above mentioned (0.020 pg cell−1) was also estimated in salinity 13 PSU for the same conditions of T and PAR (Fig. 3C.c). Tukey's HSD tests pointed to the significance of PAR and T combined in impacting the pigmentation. According to those tests, 66 % and 61 % of multiple comparisons in Chl a and Car content analysis, respectively, were statistically significant (Tukey's HSD, ), with 81 % (for Chl a) and 75 % (for Car) of them with the highest significance (Tukey's HSD, ).

Figure 6The photochemical efficiency of PSII under actinic light intensity (ΦPSII) for three Synechococcus sp. strains: BA-120 (A), BA-124 (B), and BA-132 (C) under different PAR and temperature conditions in four salinity mediums: 3 PSU (a), 8 PSU (b), 13 PSU (c), and 18 PSU (d).
3.3 Chl a fluorescence
The parameters of Chl a fluorescence were depicted as two-factor-dependent graphs, where the values in between the specific measurements were interpolated (Figs. 5, 6). For all strains, Chl a fluorescence parameters were measured and examined. These parameters were the maximum photochemical efficiency of photosystem II (PSII) at the dark-adapted state (Fv∕Fm) and the photochemical efficiency of PSII under actinic light intensity (ΦPSII).
The results showed that PAR and T affected Fv∕Fm (Table S6) and ΦPSII (Table S7) of Synechococcus sp. BA-120 significantly. For this strain, especially in low T scenarios and in all scenarios with the lowest salinity, higher Fv/Fm was observed for 280 µmol photons m−2 s−1 when compared to 190 µmol photons m−2 s−1 (Fig. 5A.a). Generally, strong fluctuations were noticeable in Fv∕Fm values, which disabled the fixed environmentally driven pattern determination. However, there was a constant relation noted between T and PAR and ΦPSII. PAR and T increase had a negative impact on ΦPSII. The impact was the strongest in low salinity (Fig. 6A.a–b). Nonetheless, in each salinity, the lowest ΦPSII values were observed under the highest T and elevated PAR (190 or 280 µmol photons m−2 s−1). On the contrary, the highest ΦPSII values were calculated in the lowest T and PAR conditions in every salinity. The highest Fv∕Fm, for all BA-120 experiments, equaled 0.804 and was estimated for the scenario of salinity 18 PSU, T 10 ∘C, and PAR 280 µmol photons m−2 s−1 (Fig. 5A.d). Generally, maximum values of Fv∕Fm in each medium were associated with the lowest temperature. Minimum Fv∕Fm within all scenarios was estimated for salinity 3 PSU, T 25 ∘C, and PAR 190 µmol photons m−2 s−1 (0.409, Fig. 5A.a). Concerning ΦPSII, the greatest value was 0.768 estimated in salinity 18 PSU, T 10 ∘C, and PAR 10 µmol photons m−2 s−1 (Fig. 6A.d). Minimum ΦPSII was measured in salinity 3 PSU, T 25 ∘C, and PAR 280 µmol photons m−2 s−1 (0.241, Fig. 6A.a). Multiple comparison tests pointed to a strong environmental influence on Chl a fluorescence parameters. Regarding Fv∕Fm, 65 % of all comparisons were statistically significant (Tukey's HSD, ), with 78 % of them having the highest significance (Tukey's HSD, ). For ΦPSII, the percentages were as follows: 80 % of all comparisons were statistically significant (Tukey's HSD, ) and 87 % of them had the highest significance ().
Both PAR and T significantly affected Fv∕Fm (Table S6) and ΦPSII (Table S7) of Synechococcus sp. BA-124. For this strain, Fv∕Fm reached the lowest values when compared to the respective incubations of other strains. The values of Fv∕Fm generally decreased along with PAR and T increases but with some exceptions. Generally, ΦPSII environmentally driven characteristics were similar to Fv∕Fm characteristics. The Fv∕Fm minimums were measured under the lowest T and highest PAR in each salinity (Fig. 5B.a–d). The lowest value within all scenarios was 0.124 and was observed in salinity 3 PSU, T 10 ∘C, and PAR 280 µmol photons m−2 s−1 (Fig. 5B.a). The Fv∕Fm maximums were estimated for the highest T and the lowest PAR in each salinity. The highest Fv∕Fm equaled 0.560 for salinity 3 PSU, T 25 ∘C, and PAR 10 µmol photons m−2 s−1 (Fig. 5B.a). Minimums of ΦPSII, consistently with Fv∕Fm, were noted under the lowest T and highest PAR. The lowest ΦPSII within all BA-124 experiments was 0.114 (followed by the minimum in salinity 3 PSU equal to 0.116, Fig. 6B.a) and was measured in salinity 13 PSU (Fig. 6B.c). Maximums of ΦPSII were observed in the highest T and lowest PAR in each medium, similarly to Fv∕Fm. The greatest value of ΦPSII was 0.542 and was measured in salinity 3 PSU, T 25 ∘C, and PAR 10 µmol photons m−2 s−1 (Fig. 6B.a). Tukey's HSD post-hoc test showed that PAR and T combined influenced Chl a fluorescence parameters significantly. Concerning Fv∕Fm, 77 % of all comparisons were statistically significant (), with 88 % of them having the highest significance (). For ΦPSII, the percentages were as follows: 79 % of all comparisons were statistically significant () and 89 % of them had the highest significance ().
It was found that both PAR and T affected Fv∕Fm (Table S6) and ΦPSII (Table S7) of Synechococcus sp. BA-132 significantly. For this strain, Fv∕Fm decreased along with the PAR increase but was positively affected by T in each salinity (Fig. 5C.a–d). Minimum values of Fv∕Fm were measured in the highest PAR and the lowest T in each salinity. The lowest Fv∕Fm within all experiments on BA-132 indicated salinity 13 PSU (, Fig. 5C.c). In salinity 3 PSU, under aforementioned conditions of T and PAR, the Fv∕Fm value was also low compared to the others and equaled 0.160 (Fig. 5C.a). The maximums of Fv∕Fm were measured in T 25 ∘C and PAR 10 µmol photons m−2 s−1. This was the case for all mediums. The highest Fv∕Fm values were noted in salinities 13 and 18 PSU and equaled 0.742 (Fig. 5C.c) and 0.733 (Fig. 5C.d), respectively. The lowest ΦPSII values were noted under the highest PAR and T conditions in every salinity (Fig. 6C.a–d). The minimum ΦPSII, within all gathered results, was obtained in salinity 3 PSU and equaled 0.281 (Fig. 6C.a). Maximums of ΦPSII were measured under completely opposite conditions to the ones stating for minimums, i.e., the lowest PAR and T. The highest ΦPSII, 0.786, was noted in salinity 8 PSU, T 10 ∘C, and PAR 10 µmol photons m−2 s−1 (Fig. 6C.b). The ΦPSII reached generally higher values than Fv∕Fm in BA-132 experiments. ΦPSII reached lower values than ΦPSII measured under respective conditions for two other strains. Multiple comparison tests point to a strong environmental influence on Chl a fluorescence parameters. For Fv∕Fm, 78 % of all comparisons were statistically significant (Tukey's HSD, ), with 89 % of them with the highest significance (Tukey's HSD, ). For ΦPSII, 82 % of all comparisons were statistically significant (Tukey's HSD, ), with 89 % of them having the highest significance level (Tukey's HSD, ).
Generally, for the BA-120 strain, Fv∕Fm was affected negatively by T increase, while BA-124 and BA-132 strains were affected positively. T increase had a positive impact on ΦPSII for BA-124 and a negative impact for BA-120 and BA-132. On average, ΦPSII decreased along with PAR increase in all cultures.
3.4 Photosynthesis
Net photosynthetic light-response curves for three PCY strains were analyzed. For all cultures, the photosynthesis parameters were maximum of photosynthesis and photosynthesis efficiency at low irradiance (Pm and α, respectively) and these were estimated for Chl a-specific and cell-specific domains (Figs. S4–S5 in the Supplement).
For BA-120, the statistical study showed a significant dependence of PAR and T on Chl a-specific Pm in salinities 3, 8, and 18 PSU and pointed to no statistically significant dependence of ecological conditions on Pm in salinity 13 PSU (Table S8). Regarding cell-specific Pm, there was no statistically significant influence of PAR and T on this parameter in salinity 18 PSU but was in salinities 3, 8, and 13 PSU (Table S9). For Chl a-specific α, the statistical study indicated no environmental impacts in salinities 3, 8, and 13 PSU but an impact of PAR and T in salinity 18 PSU (Table S10), while for cell-specific α statistical significance of PAR and T influence was obtained for all salinities (Table S11). Tukey's HSD tests pointed to some statistically significant multiple comparisons but showed a weak influence of PAR and T combined on Chl a-specific parameters. Regarding α, only 3 % of all multiple comparisons were statistically significant (), with 7 % of them at the highest statistical significance level (). For Pm, 36 % of all multiple comparisons were statistically significant (), with 64 % of them with the highest significance (). Note that, in this section, to make it more concise, the notation for all statistically significance multiple comparison percentages () and the percentage of the multiple comparisons of the highest significance within the significant ones () were written in parenthesis, one by one, separated with commas. Similarly to Chl a-specific calculations, Tukey's HSD test pointed to a selective influence of PAR and T combined on cell-specific parameters. However, this dependence was stronger when compared to Chl a-specific estimations (Pm (16 %, 52 %), α (19 %, 43 %)). Nonetheless, there were also some fixed relations noted for both calculation domains. For Chl a-specific photosynthesis, Pm increased along with PAR up to PAR of 190 µmol photons m−2 s−1 (Fig. S4a, c). Above this level, the Pm value started to decrease slightly. This was the case in all salinities. Minimum Pm was measured for cells grown in a scenario of salinity 3 PSU, T 15 ∘C, and PAR 10 µmol photons m−2 s−1, and it was 0.12 µmol O2 (µg Chl a)−1 h−1 (Fig. S4a), whilst the maximum equaled 1.31 µmol O2 (µg Chl a)−1 h−1 and was reached in salinity 18 PSU, T 25 ∘C, and 190 µmol photons m−2 s−1 (Fig. S4c). On the contrary, it was more difficult to determine a fixed pattern of α changes unequivocally. The most fixed tendency of α changes was observed in all temperature-differenced scenarios in 18 PSU salinity medium (Fig. S5a, c). Under those conditions, it was noticeable that α decreased with PAR and T increase until it reached a PAR level of 190 µmol photons m−2 s−1. Then, α started to rise slowly. Regarding all gathered results (all mediums together), α minimum was measured in salinity 3 PSU, T 25 ∘C, and PAR 10 µmol photons m−2 s−1 and equaled 0.002 µmol O2 (µg Chl a)−1 h−1 [µmol photons m−2 s−1]−1 (Fig. S5a), whilst maximum was 0.013 µmol O2 (µg Chl a)−1 h−1 [µmol photons m−2 s−1]−1 in salinity 13 PSU, T 10 ∘C, and PAR 10 µmol photons m−2 s−1. On the other hand, for the cell-specific domain, Pm increased along with T and it was more pronounced in higher salinities. Concerning all results, minimum Pm was 28.58 µmol O2 cell 10−9 h−1 and, similarly to Chl a-specific Pm, was measured in scenario of salinity 13 PSU, T 10 ∘C, and PAR 10 µmol photons m−2 s−1, whilst maximum Pm equaled 55.16 µmol O2 cell 10−9 h−1 and was reached in salinity 8 PSU, T 25 ∘C, and 190 µmol photons m−2 s−1 (data not shown). Regarding α, this parameter was generally negatively affected by PAR and T up to PAR of 190 µmol photons m−2 s−1. However, minimum value was obtained for cells growing in moderate T (salinity 8 PSU, T 20 ∘C, and PAR 10 µmol photons m−2 s−1) and equaled 0.81 µmol O2 cell 10−9 h−1 [µmol photons m−2 s−1]−1. Maximum α equaled 1.57 µmol O2 cell 10−9 h−1 [µmol photons m−2 s−1]−1 and was measured in salinity 18 PSU, T 10 ∘C, and PAR 10 µmol photons m−2 s−1 (Fig. S5d).
For BA-124, the statistical study showed the significant dependence of ecological conditions on photosynthesis parameters, excluding Chl a-specific α and cell-specific Pm (Tables S8–S11). Post-hoc tests showed there must have been other factors which affected the whole process of photosynthesis, as there were many not statistically significant multiple comparisons defined. Generally, Tukey's HSD tests pointed to only few statistically significant multiple comparisons, in both Chl a-specific, especially for Pm (Pm (60 %, 76 %), α (9 %, 29 %), and cell-specific (Pm (22 %, 56 %), α (34 %, 63 %)) estimations. Nonetheless, for Pm, there was a tendency noted, which suggested that, on average, the maximum of photosynthesis was higher at elevated PAR. This was the case in both Chl a-specific and cell-specific estimations. Maximum Chl a-specific Pm was 3.0 and minimum 0.16 µmol O2 (µg Chl a)−1 h−1. These values were measured in salinity 18 PSU in T 25 ∘C, and PAR 280 µmol photons m−2 s−1 and T 10 ∘C, and PAR 10 µmol photons m−2 s−1, respectively (Fig. S4g). Maximum cell-specific Pm was obtained in salinity 8 PSU, T 25 ∘C, and PAR 280 µmol photons m−2 s−1 and minimum in salinity 13 PSU, T 20 ∘C, and PAR 10 µmol photons m−2 s−1 (data not shown here). These extreme values were 53.41 and 19.17 µmol O2 cell 10−9 h−1, respectively. It was difficult to determine a fixed relation between ecological state and α changes in both domains, which was supported by the post-hoc test (more than 91 % of multiple comparisons were not statistically significant (p≥0.05) in Chl a-specific and more than 35 % in cell-specific estimations). Maximum Chl a-specific α was 0.02 µmol O2 (µg Chl a)−1 h−1 [µmol photons m−2 s−1]−1 and was measured in salinity 3 PSU, T 15 ∘C, and PAR 100 µmol photons m−2 s−1 (Fig. S5e), while maximum cell-specific α (1.77 µmol O2 cell 10−9 h−1 [µmol photons m−2 s−1]−1) was obtained in salinity 13 PSU, T 10 ∘C, and PAR 10 µmol photons m−2 s−1. Minimum Chl a-specific α was 0.003 µmol O2 (µg Chl a)−1 h−1 [µmol photons m−2 s−1]−1 and was measured in two scenarios: salinity 3 PSU, T 10 ∘C, and PAR 280 µmol photons m−2 s−1 (Fig. S5e), and salinity 18 PSU, T 15 ∘C, and PAR 10 µmol photons m−2 s−1 (Fig. S5g). Minimum cell-specific α equaled 0.08 µmol O2 cell 10−9 h−1 [µ mol photons m−2 s−1]−1 and was measured in salinity 18 PSU, T 15 ∘C, and PAR 190 µmol photons m−2 s−1 (Fig. S5h).
Generally, for BA-132, the statistical study showed the significant dependence of PAR and T on Chl a- and cell-specific parameters (Tables S8–S11). It was observed that, in cell-specific estimations, Pm increased along with PAR increase, while α decreased at elevated PAR. Maximum cell-specific Pm was 158.94 µmol O2 cell 10−9 h−1 and was reached in salinity 8 PSU, T 25 ∘C, and PAR 280 µmol photons m−2 s−1, whilst minimum equaled 28.04 µmol O2 cell 10−9 h−1 in salinity 18 PSU, T 15 ∘C, and PAR 10 µmol photons m−2 s−1 (Fig. S4l). Maximum cell-specific α was 1.78 µmol O2 cell 10−9 h−1 [µmol photons m−2 s−1]−1 and was measured in salinity 13 PSU, T 20 ∘C, and PAR 10 µmol photons m−2 s−1, while minimum was reached in salinity 18 PSU, T 20 ∘C, and PAR 100 µmol photons m−2 s−1 and equaled 0.19 µmol O2 cell 10−9 h−1 [µmol photons m−2 s−1]−1 (Fig. S5l). For Chl a-specific Pm, the increases along with T and salinity were observed, whilst α presented strong changing characteristics between scenarios. The fixed influence of PAR and T on α values was difficult to determine, which was supported by statistics (Tables S10–S11). Maximum Chl a-specific Pm was 6.22 µmol O2 (µg Chl a)−1 h−1 and was reached in salinity 18 PSU, T 25 ∘C, and PAR 280 µmol photons m−2 s−1 (Fig. S4k), whilst minimum equaled 0.12 µmol O2 (µg Chl a)−1 h−1 in salinity 3 PSU, T 25 ∘C, and PAR 10 µmol photons m−2 s−1 (Fig. S4i). Maximum Chl a-specific α was 0.02 µmol O2 (µg Chl a)−1 h−1 [µmol photons m−2 s−1]−1 and was measured in salinity 18 PSU, T 15 ∘C, and PAR 10 µmol photons m−2 s−1 (Fig. S5k), while minimum was reached in salinity 3 PSU, T 15 ∘C, and PAR 10 µmol photons m−2 s−1 and equaled 0.003 µmol O2 (µg Chl a)−1 h−1 [µmol photons m−2 s−1]−1 (Fig. S5i). Generally, in both domains, photosynthesis parameters were the highest for BA-132 when compared to other strains.
Table 1Photoacclimation types (mechanisms) for three Synechococcus sp. strains: BA-120, BA-124, and BA-132 at different ecological conditions. OTHER indicates altering of accessory pigments' activity or changes in enzymatic reactions; PSUsize indicates the change in PSU sizes; PSUno. indicates the change in PSU number. The symbols of labels indicate the strain for which the mechanism is observed and are as follows: red for BA-120, green for BA-124, and brown for BA-132.
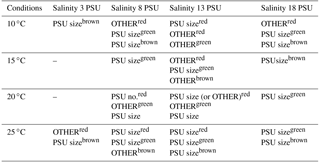

Figure 7Selected Chl a-specific and cell-specific (right and left panels, respectively) net photosynthetic–light response curves for three Synechococcus sp. strains: BA-120 (a, b), BA-124 (c, d), and BA-132 (e, f) strains. Curves present examples of three types of photoacclimation observed for Synechococcus sp. and these are as follows: change in number of photosynthesis units (PSU) (a, b), change in size of PSU (c, d), and change in accessory pigments' activity (e, f).
The analysis of photosynthesis characteristics enabled examining and defining the photoacclimation process of all three strains of Synechococcus sp. This was done on the basis of the photosynthetic parameters (Figs. S4–S5) and photosynthesis–irradiance (P−E) curves (exemplification was shown in Fig. 7). The curves were plotted on the basis of laboratory results (Clark oxygen electrode measurements) using the equation of Jassby and Platt (1976). According to a photoacclimation model description (Prezelin, 1981; Prezelin and Sweeney, 1979; Ramus, 1981; Richardson et al., 1983; Pniewski et al., 2015), the results of the present study indicated changes in photosynthetic unit (PSU) sizes as the photoacclimation mechanism, which occurred most frequently (Table 1). There were also P−E curves pointing to some changes in enzymatic reactions and the altering of accessory pigments' activity. Changes in PSU numbers were noted as well, but these observations were episodic. In this paper, the term “OTHER” indicates changes in enzymatic reactions and the altering of accessory pigments' activity and concerns photoacclimation mechanisms other than changes in PSU sizes (PSUsize) or changes in PSU number (PSUno.). In general, photoacclimation did not occur in low-saline medium (salinity 3). According to our results, the process was observed in only four cases in low salinity: BA-120 25 ∘C salinity 3 PSU, BA-124 25 ∘C salinity 3 PSU, BA-132 10 ∘C salinity 3 PSU, and BA-132 25 ∘C salinity 3 PSU. For BA-120, photoacclimation occurred more frequently at higher T (20 and 25 ∘C) than at lower T (10 and 15 ∘C). However, if it had been observed in low T conditions, it usually indicated OTHER, not PSU size or PSUno. For BA-124 and BA-132, photoacclimation was noted in the whole T range. All photoacclimation mechanisms observed for different strains are listed in Table 1.
Picoplanktonic organisms show a lot of adaptations which enable them to spread in aquatic environments (e.g., Stomp et al., 2007; Jodłowska and Śliwińska, 2014; Larsson et al., 2014; Jasser and Callieri, 2017). What is more, picocyanobacteria often dominate and occupy the niches which are inaccessible to other photoautotrophs. Due to the fact that PCY are small-sized cells and consequently possess an advantageous surface area to volume ratio, they can assimilate trace amounts of nutrients and effectively absorb light. Therefore, in oligotrophic regions of seas and oceans, PCY compete with other cyanobacteria and microalgae, and they can determine the primary production of the whole marine ecosystem (Six et al., 2007a; Richardson and Jackson, 2007; Worden and Wilken, 2016). This is also true for eutrophic basins (Stal et al., 2003; Haverkamp et al., 2008, 2009; Callieri, 2010; Mazur-Marzec et al., 2013).
The distribution of PCY is determined by their optimal ecological requirements for light and temperature. Due to the presented results, PAR and T had positive effects on the number of cells for two out of the three studied strains of Synechococcus sp. The highest cell concentrations were noted at the highest T (25 ∘C) and the highest PAR level (280 µmol photons m−2 s−1) for BA-124 and BA-132. The BA-120 strain behaved differently when compared to the other two in high PAR conditions. The decrease in the number of cells appeared then; i.e., cell abundances for cultures grown under the most elevated PAR were lower than the number of cells measured for Synechococcus sp. BA-120 cells grown under 190 µmol photons m−2 s−1. According to the results derived from pigmentation, Chl a fluorescence, and photosynthesis sections of the present study, the decrease in the number of cells under the elevated PAR could have likely been associated with PSII photo-inhibition. This was a result of a few observations, which are described as follows. Firstly, there was a higher cell-specific Car content observed for 280 µmol photons m−2 s−1 when compared to 190 µmol photons m−2 s−1. Secondly, higher Fv∕Fm values were observed for 280 µmol photons m−2 s−1 when compared to 190 µmol photons m−2 s−1, especially for low T scenarios and for all scenarios in the lowest salinity medium. Thirdly, for Chl a-specific photosynthesis, Pm increased along with PAR until 190 µmol photons m−2 s−1, above which the values started to decrease slightly in all salinity mediums. According to the above, a PAR level of 190 µmol photons m−2 s−1 could be defined as the PSII photo-inhibition point for the red strain. This implies BA-120 did not lead as effective photosynthesis being grown in PAR of more than 190 µmol photons m−2 s−1 as the cells grown in PAR levels equal to or below the abovementioned value. The results showed that, in all synthetically created environmental scenarios, BA-124 was the strain of the highest cell abundance. This is consistent with the Baltic Sea field studies (Mazur-Marzec et al., 2013).
Cyanobacteria are generally recognized to prefer low light intensity for growth (Fogg and Thake, 1987; Ibelings, 1996). Some picoplanktonic organisms demonstrated the ability to survive and resume growth after periods of total darkness. Such a pronounced capacity for survival in the dark would enable these organisms to outlive the seasonal rhythm of winter darkness and sinking into the aphotic zone (Antia, 1976). The investigated strains of Synechococcus sp. were found to be well adapted to relatively low and high PAR levels. The latter was especially evident at the high treatment T. This conclusion is consistent with the observations of picocyanobacteria maximum abundance at the euphotic zone in coastal and offshore marine waters (Stal et al., 2003; Callieri, 2010). Moreover, Kana and Gilbert (1987a, b) showed that Synechococcus sp. could grow at irradiance as high as 2000 µmol photon m−2 s−1.
Surface and near-surface populations experience extremely variable light and temperature conditions (Millie et al., 1990), and these factors are the ones that affect the composition of photosynthetic pigments and photosynthesis performance of picocyanobacteria (Jodłowska and Śliwińska, 2014). Picocyanobacteria with a high concentration of PC are chromatically better adapted to harvest longer wavelengths of PAR than those with PE as a dominating pigment. Therefore, such picocyanobacteria, such as the BA-124 strain, usually dominate in surface euphotic waters (Stal et al., 2003; Haverkamp et al., 2008, 2009). On the other hand, the strains rich in PE (BA-120 and BA-132) usually occurred deeper (Fahnenstiel et al., 1991; Hauschild et al., 1991; Vörös et al., 1991). Nonetheless, generally PCY, thanks to their high concentration of photosynthetic pigments, may occur in waters under low light intensity (Stal et al., 2003). Furthermore, carotenoids play an important role in the cells as they provide protection against photooxidation (Siefermann-Harms, 1987; Kana and Glibert, 1988; Jodłowska and Latała, 2010). This feature additionally explains why picoplanktonic Synechococcus is able to grow successfully both in the surface layer of the sea and also in deeper waters (Stal and Walsby, 2000; Stal et al., 2003). This research showed that for BA-120 cell-specific pigments' content, there were very high concentrations of Chl a observed in the whole T domain under low PAR. This could have implied the photoacclimation type, which was the change in PSU number. This mechanism was also observed in P−E curves for the scenario with salinity 8 PSU and 20 ∘C temperature.
In this study, the pigment content was generally the highest under the low PAR treatment for all strains. This was a striking observation, however, with some exceptions. For instance, concerning Cars, BA-120 cell-specific Car reached high concentrations in the whole light range for high T. This was pronounced in mediums of moderate and high salinity (8, 13, 18). Moreover, in medium 3, BA-124 demonstrated high cell-specific Car concentration under the highest analyzed light level. The cell-specific Car peaking in the lowest light was pronounced the most in BA-132 cultures. This is consistent with the literature (Jodłowska and Latała, 2010). Regarding cell-specific Chl a peaks, they were noticeable in the low PAR range for all strains with no exceptions. The differences between the strains were various effects of temperature. For BA-120 and BA-132, the highest cell-specific Chl a concentrations were estimated in the highest T, while for BA-124 oppositely, i.e., for the lowest T. This has not been observed before (according to the authors' best knowledge, not reported in the literature yet). Moreover, the Car∕Chl a ratio increase along the PAR increase was observed. This, together with low pigment content under high PAR, is a very interesting observation, which makes the motivation for further studies on Synechococcus sp. stronger. The authors plan to extend their research on picocyanobacteria in the future (the pigment content composition analysis, proportion of Chl a and carotenoids – zeaxanthin, β-carotene – and phycobilins).
PAR and T were the main factors also in terms of influencing the changes in Chl a fluorescence in three strains of Synechococcus sp. This may likely be linked with a great importance of PCY domination in many aquatic ecosystems during the summer period. Due to Chl a fluorescence parameter results, it should be noted that PAR increase always had a negative impact on ΦPSII, which implied that cells, previously acclimated to high light conditions, had lower PSII photosystem efficiency under actinic light.
The results showed that T, PAR, and salinity influenced the photosynthesis parameters only to a certain degree. There were many not statistically significant multiple comparisons pointed out by post-hoc tests. However, it was found that generally, in cell-specific estimations, elevated PAR had a negative effect on α and PAR increase influenced the respiration negatively. For each of the studied strains of Synechococcus sp., the highest α was noted for the cells grown under the lowest PAR (10 µmol photons m−2 s−1). On the other hand, the highest values of Pm were noted at the highest PAR. It pointed to the inability for the cells incubated in low PAR conditions to be as effective in photosynthesis as the cells grown under high irradiance. Due to our results, on the basis of P−E curves, three types of photoacclimation mechanisms of Synechococcus sp. were observed: change in PSU size, change in PSU number, and altering accessory pigments' activity and changes in enzymatic reactions. This was a striking observation because in the literature results predominantly derive the two first aforementioned types of recognition (Stal et al., 2003; Jodłowska and Śliwińska, 2014). The present study showed that changes in PSU size occur most frequently (Table 1). The second, ranked by frequency of occurrence, was the altering of accessory pigment activity. PSU number changes in Synechococcus sp. rarely occurred, which is consistent with the literature (Jodłowska and Śliwińska, 2014). Moreover, in our study, photoacclimation mechanisms occurred less frequently in the scenarios with salinity 3 PSU. The photosynthesis parameter (Pm, α) changes under different environmental conditions explain the occurrence of different photoacclimation mechanisms. According to our results, Synechococcus strains present different ecophysiological characteristics; however, they all demonstrate their tolerance to elevated PAR (for BA-120 to a certain degree) and T levels and could have effectively acclimated to varied water conditions. These strains were able to change the composition of photosynthetic pigments in order to use light quanta better. The ability of Synechococcus to sustain their growth in low light conditions and their low photoinhibition in exposure to high light intensities could give picocyanobacteria an advantage in optically changeable waters (Jasser, 2006).
Due to the occurrence of extremes in salinity and other environmental conditions in the Baltic Sea area, the Baltic inhabitants are highly adapted to different regions and often reach their physiological limits (Snoeijs-Leijonmalm and Andrén, 2017). The changing environmental conditions the cultures were grown in during the experiments were salinity, T, and PAR. Daily mean sea surface temperature (Leppäranta and Myrberg, 2009) presents strongly pronounced annual cycles in the Baltic Sea area. A sea surface temperature (SST) range between about 10 and 20 ∘C may be timed in the Baltic between June and September with some interannual changes (Siegel and Gerth, 2017). SSTs reaching and exceeding 20 ∘C are also observed in the Baltic basin. For instance, according to Siegel and Gerth (2017), SSTs higher than 20 ∘C were recorded in almost the whole Baltic area beyond Danish Straits, Bothnian Bay, and northern Bothnian Basin in the warmest week of 2016, in July. According to the above, the temperatures under which the picocyanobacterium cultures were grown in the present study (10–25 ∘C) can be defined as representative of the Baltic Sea. Furthermore, the salinity ranges applied in the experiment are also the Baltic's representatives. The Baltic Sea horizontal salinity gradient is high and different sub-basins are characterized by different mean salinity values. The gradient decreases towards the north. The highest salinity is observed in the Baltic Sea boundary to the North Sea (Skagerrak, mean salinity ranges between 28.34 and 32.71), while the lowest mean salinity is observed in the Baltic northernmost regions (around 2.35–3.96 in Bothnian Basin). These numbers were determined on the basis of climatological data from the Baltic Atlas of Long-Term Inventory and Climatology (Feistel et al., 2008, 2010). Thus, the presented analysis may derive accurate assumptions regarding the regional distribution of Synechococcus sp. strains in the Baltic Sea. For instance, a salinity horizontal gradient can be one of the factors determining the abundance of a certain strain in the basin. More saline waters are most preferred by BA-132. On that basis, one can assume the concentration of this strain will be higher near the Baltic Sea entrance (Danish Straits) than in Bothnian Bay. Additionally, it was observed that despite elevated PAR conditions being more suitable for BA-124 and BA-132 to grow intensively, all analyzed strains were able to survive and grow in low PAR conditions. This is consistent with other previously published Baltic studies (Stal et al., 2003; Jodłowska and Śliwińska, 2014) stating that this is caused by phycobilisomes, which are structural components of the picocyanobacteria PSII. The presence of PCY cells throughout the whole euphotic water column was also reported in limnological studies (Becker et al., 2004; Callieri, 2007).
The discrepancies between the strains' ecophysiology derived in this study amplified the need for in-depth investigation of three strains separately. What is more, according to the authors' best knowledge, Baltic brown strain (BA-132) is the least recognized strain out of three analyzed Synechococcus sp. strains so far. Stal et al. (2003) and Haverkamp et al. (2008) pointed to its inhabitation in the Baltic Sea but did not give its characteristics in detail. In more recent research, new information has appeared, which has provided a more detailed examination of BA-132 (Jodłowska and Śliwińska, 2014). Nonetheless, this strain still required careful studies. The present paper derives the new knowledge on the BA-132 responses to changing ecological conditions. What is more, the study places BA-132 among the other Synechococcus sp. strains and compares their ecophysiology, pointing to significant differences between these organisms.
The study of Baltic picoplankton ecophysiology is also of a great importance in the context of climate change. According to Belkin (2009), the Baltic Sea is among the large marine ecosystems (LMEs), where the most rapid warming is being observed (the increase in SST between 1982 and 2006 >0.9 ∘C). Moreover, there are studies pointing to an increase of average winter temperatures in northern Europe by several degrees by the year 2100 (Meier, 2002). These, along with the presented results, which suggest that all analyzed strains of Synechococcus sp. were positively affected by T, can be a strong argument for further numerical research on examining the effect of long-term positive temperature trend on the abundance of PCY in the Baltic Sea (the need for picoplankton model representation). What is more, the feedback relation, which is the surface most layer being warmed up by irradiance trapped in the cells of phytoplankton, may derive interesting conclusions on the functioning of the ecosystem and the living organisms being the internal source of heat in the marine medium.
The observed feature that T increase had a positive impact on all strains' number of cells is also consistent with field studies, which indicate the seasonal cycle of PCY maximal abundances (Flombaum et al., 2013; Dutkiewicz et al., 2015; Worden and Wilken, 2016). Hajdu et al. (2007) showed that during the decline phase of Baltic cyanobacterial blooms in late summer, unicellular and colony-forming picocyanobacteria increased in abundance. Mazur-Marzec et al. (2013) indicated that in summer cyanobacterial biomass was usually high and ranged from 20 % at the beginning of July to 97 % in late July and August. Moreover, Paczkowska et al. (2017) pointed to the abundance of 40 %–90 % in the summertime in the Baltic Sea and to PCY being a dominant size group in all Baltic basins. Stal et al. (1999) reported that 65 % of the phytoplankton-associated Chl a concentration in the Baltic Proper during late summer belonged to picoplankton, while the second most dominant group was nitrogen-fixing cyanobacteria (Aphanizomenon sp., Dolichospermum sp., and Nodularia sp.). Contrary to that, there were also some reports regarding high PCY abundance in the wintertime. For instance, during the winter–spring period, picocyanobacteria was the second most dominant fraction in the Baltic Sea (Paczkowska et al., 2017). The present study showed that PCY can survive and grow also in low T and PAR conditions, which is consistent with the above-cited field research of Paczkowska et al. (2017).
The studies of autecology of the PCY community and an understanding of its response to main environmental factors could be an important step in recognizing the phenomenon of PCY blooms in marine environments. Additionally, the laboratory experiments became a foundation in developing a new approach to Baltic Sea phytoplankton modeling–development of a pico-bioalgorithm describing PCY growth, which will enable long-term numerical studies on the response of PCY to changes in environmental conditions.
Discrepancies in the number of cells, pigmentation changes, Chl a fluorescence, and photosynthesis characteristics implied that BA-120, BA-124, and BA-132 should be studied and examined separately.
Nonetheless, there were also fixed features referring to all analyzed strains. This reasoned the association of these features with Synechococcus sp. in general, as a species. For instance, according to the derived results, PAR and T played a key role in the life cycle of all three strains. Additionally, the positive impact of salinity on the number of cells was observed in each culture. Another similarity was the prevalence of the change in PSU size among the mechanisms of photoacclimation. The second most dominant similarity was the altering of accessory pigments, whilst the least frequent was the change in PSU number.
Contrary to that, the main differences were different responses of the number of cells to different environmental conditions in different cultures, various photoacclimation mechanisms observed, and changes in pigmentation. According to the latest research, PCY are a great contributor to total primary production in the Baltic Sea and may contribute to summer cyanobacteria bloom to a high degree. This explains the authors' motivation to lead an in-depth investigation on Baltic PCY response to a changing environment. The present research is a first step on the way to deriving new knowledge on Synechococcus sp. ecophysiology and is a foundation for further studies.
The data are not published anywhere in online repositories. All the results are given and discussed precisely within the paper and the Supplement. The authors are still using the data in terms of numerical studies they conduct on the Baltic picoplankton.
The supplement related to this article is available online at: https://doi.org/10.5194/bg-15-6257-2018-supplement.
The laboratory experiments' procedure was based on the Laboratory of Marine Plants Ecophysiology “know-how”. SSW and AC designed the whole study. SSW and JM conducted the laboratory experiments. SSW and AC collected the literature and performed the results' analyses. All authors contributed to the overall paper development, with the most significant contribution of SSW in figures' creation and AC in writing of the text. AL supervised the study and helped in the photoacclimation mechanisms' analysis. AC, SSW, and AL participated actively in the revision process.
The authors declare that they have no conflict of interest.
The authors would like to thank the associate editor Koji Suzuki, and the
reviewers Cristiana Callieri, Douglas Campbell, and two anonymous reviewers for
their valuable comments and suggestions, which enabled the authors to improve
the quality of the paper. The authors would like to thank Simon Bretherton
for the English language support and the proofreading service company for
professional proofreading. Sylwia Śliwińska-Wilczewska was financially supported by BMN grants,
Poland, no. 538-G245-B116-18. This work has been funded by the Polish
National Science Centre project (contract no. 2012/07/N/ST10/03485)
titled “Improved understanding of phytoplankton blooms in the Baltic Sea
based on numerical models and existing data sets”. Agata Cieszyńska received funding from Polish National Science Centre in
a doctoral scholarship program (contract no. 2016/20/T/ST10/00214).
Agata Cieszyńska's contribution was also supported by the statutory funding
of IO PAS.
Edited by: Koji
Suzuki
Reviewed by: Cristiana Callieri, Douglas
Campbell,
and two anonymous referees
Agawin, N. S., Duarte, C. M., and Agustí, S.: Nutrient and temperature control of the contribution of picoplankton to phytoplankton biomass and production, Limnol. Oceanogr., 45, 591–600, https://doi.org/10.4319/lo.2000.45.3.0591, 2000.
Andersson, A., Hajdu, S., Haecky, P., Kuparinen, J., and Wikner, J.: Succession and growth limitation of phytoplankton in the Gulf of Bothnia (Baltic Sea), Mar. Biol., 126, 791–801, 1996.
Antia, N. J.: Effects of temperature on the darkness survival of marine microplanktonic algae, Microbiol. Ecol., 3, 41–54, 1976.
Barreiro Felpeto, A., Śliwińska-Wilczewska, S., Złoch, I., and Vasconcelos, V.: Light-dependent cytolysis in the allelopathic interaction between picoplanktic and filamentous cyanobacteria, J. Plankton Res., 40, 165–177, https://doi.org/10.1093/plankt/fby004, 2018.
Beardall, J.: Blooms of Synechococcus: An analysis of the problem worldwide and possible causative factors in relation to nuisance blooms in the Gippsland Lakes, Monash University, Clayton, VIC, Australia, 1–8, 2008.
Becker, S., Singh, A. K., Postius, C., Böger, P., and Ernst, A.: Genetic diversity and distribution of periphytic Synechococcus spp. in biofilms and picoplankton of Lake Constance, FEMS Microbiol. Ecol., 49, 181–190, 2004.
Belkin, I. M.: Rapid warming of large marine ecosystems, Prog. Oceanogr., 81, 207–213, https://doi.org/10.1016/j.pocean.2009.04.011, 2009.
Cai, Y. and Kong, F.: Diversity and dynamics of picocyanobacteria and bloom-forming cyanobacteria in a large shallow eutrophic lake (lake Chaohu, China), J. Limnol., 72, 473–484, https://doi.org/10.4081/jlimnol.2013.e38, 2013.
Callieri, C.: Picophytoplankton in freshwater ecosystems: The importance of small-sized phototrophs, Freshw. Rev., 1, 1–28, https://doi.org/10.1608/FRJ-1.1.1, 2007.
Callieri, C.: Single cells and microcolonies of freshwater picocyanobacteria: A common ecology, J. Limnol., 69, 257–277, https://doi.org/10.4081/jlimnol.2010.257, 2010.
Callieri, C. and Stockner, J. G.: Freshwater autotrophic picoplankton: A review, J. Limnol., 61, 1–14, https://doi.org/10.4081/jlimnol.2002.1, 2002.
Campbell, D., Hurry, V., Clarke, A. K., Gustafsson, P., and Öquist, G.: Chlorophyll fluorescence analysis of cyanobacterial photosynthesis and acclimation, Microbiol. Mol. Biol. R., 62, 667–683, 1998.
Dutkiewicz, S., Morris, J. J., Follows, M. J., Scott, J., Levitan, O., Dyhrman, S. T., and Berman-Frank, I.: Impact of ocean acidification on the structure of future phytoplankton communities, Nat. Clim. Change., 5, 1002–1006, https://doi.org/10.1038/nclimate2722, 2015.
Everroad, R. C. and Wood, A. M.: Comparative molecular evolution of newly discovered picocyanobacterial strains reveals a phylogenetically informative variable region of beta-phycoerythrin, J. Phycol., 42, 1300–1311, 2006.
Fahnenstiel, G. L., Carrick, H. J., Rogers, C. E., and Sicko-Goad, L.: Red fluorescing phototrophic picoplankton in the Laurentian Great Lakes: What are they and what are they doing?, Int. Rev. Ges. Hydrobio., 76, 603–616, https://doi.org/10.1002/iroh.19910760411, 1991.
Feistel, R., Feistel, S., Nausch, G., Szaron, J., Lysiak-Pastuszak, E., and Ærtebjerg, G.: BALTIC: Monthly time series 1900–2005, in: State and Evolution of the Baltic Sea, 1952–2005, A Detailed 50-Year Survey of Meteorology and Climate, Physics, Chemistry, Biology, and Marine Environment, edited by: Feistel, R., Nausch, G., and Wasmund, N., John Wiley & Sons, Inc., Hoboken, 311–336, 2008.
Feistel, R., Weinreben, S., Wolf, H., Seitz, S., Spitzer, P., Adel, B., Nausch, G., Schneider, B., and Wright, D. G.: Density and Absolute Salinity of the Baltic Sea 2006–2009, Ocean Sci., 6, 3–24, https://doi.org/10.5194/os-6-3-2010, 2010.
Flombaum, P., Gallegos, J. L., Gordillo, R. A., Rincón, J., Zabala, L. L., Jiao, N., Karl, D. M., Li, W. K. W., Lomas, M. W., Veneziano, D., Vera, C. S., Vrugt J. A., and Martiny A. C.: Present and future global distributions of the marine Cyanobacteria Prochlorococcus and Synechococcus, P. Natl. Acad. Sci. USA, 110, 9824–9829, https://doi.org/10.1073/pnas.1307701110, 2013.
Fogg, G. E. and Thake, B. (Eds.): Algal Cultures and Phytoplankton Ecology, University of Wisconsin Press, Madison and Milwaukee, 1987.
Glover, H. E.: The physiology and ecology of marine Cyanobacteria, Synechococcus spp., in: Advances in Aquatic Microbiology, edited by: Jannasch, H. W. and Williams Leb, P. J., Vol. 3, New York, Academic Press, 49–107, 1985.
Glover, H. E., Phinney, D. A., and Yentsch, C. S.: Photosynthetic characteristics of picoplankton compared with those of larger phytoplankton populations, in various water masses in the Gulf of Maine, Biol. Oceanogr., 3, 223–248, 1985.
Glover, H. E., Campbell, L., and Prézelin, B. B.: Contribution of Synechococcus spp. to size-fraction primary productivity in three waters masses in the Northwest Atlantic Ocean, Mar. Biol., 91, 193–203, 1986.
Guillard, R. R. L.: Culture of phytoplankton for feeding marine invertebrates, in: Culture of Marine Invertebrate Animals, edited by: Smith, W. L. and Chanley, M. H., Plenum Press, New York, USA, 26–60, 1975.
Hajdu, S., Höglander, H., and Larsson, U.: Phytoplankton vertical distributions and composition in Baltic Sea cyanobacterial blooms, Harmful Algae, 6, 189–205, https://doi.org/10.1016/j.hal.2006.07.006, 2007.
Hauschild, C. A., McMurter, H. J. G., and Pick, F. R.: Effect of spectral quality on growth and pigmentation of picocyanobacteria, J. Phycol., 27, 698–702, https://doi.org/10.1111/j.0022-3646.1991.00698.x, 1991.
Haverkamp, T., Acinas, S. G., Doeleman, M., Stomp, M., Huisman, J., and Stal, L. J.: Diversity and phylogeny of Baltic Sea picocyanobacteria inferred from their ITS and phycobiliprotein operons, Environ. Microbiol., 10, 174–188, https://doi.org/10.1111/j.1462-2920.2007.01442.x, 2008.
Haverkamp, T. H., Schouten, D., Doeleman, M., Wollenzien, U., Huisman, J., and Stal, L. J.: Colorful microdiversity of Synechococcus strains (picocyanobacteria) isolated from the Baltic Sea, ISME J., 3, 397–408, 2009.
Herdman, M., Castenholz, R. W., Iteman, I., Waterbury, J. B., and Rippka, R.: The Archaea and the deeply branching and phototrophic bacteria, in: Bergey's Manual of Systematic Bacteriology, edited by: Boone, D. R. and Castenholz, R. W., 2nd Edn., Springer Verlag, Heidelberg, 493–514, 2001.
Ibelings, B. W.: Changes in photosynthesis in response to combined irradiance and temperature stress in cyanobacterial surface waterblooms, J. Phycol., 32, 549–557, https://doi.org/10.1111/j.0022-3646.1996.00549.x, 1996.
Jakubowska, N. and Szeląg-Wasilewska, E.: Toxic Picoplanktonic Cyanobacteria – Review, Mar. Drugs, 13, 1497–1518, https://doi.org/10.3390/md13031497, 2015.
Jassby, A. D. and Platt, T.: Mathematical formulation of the relationship between photosynthesis and light for phytoplankton, Limnol. Oceanogr., 21, 540–547, https://doi.org/10.4319/lo.1976.21.4.0540, 1976.
Jasser, I.: The relationship between autotrophic picoplankton (APP) – The smallest autotrophic component of food web and the trophic status and depth of lakes, Ecohydrol. Hydrobiol., 6, 69–77, https://doi.org/10.1016/S1642-3593(06)70128-8, 2006.
Jasser, I. and Arvola, L.: Potential effects of abiotic factors on the abundance of autotrophic picoplankton in four boreal lakes, J. Plankton Res., 25, 873–883, https://doi.org/10.1093/plankt/25.8.873, 2003.
Jasser, I. and Callieri, C.: Picocyanobacteria: The smallest cell-size cyanobacteria, in: Handbook on Cyanobacterial Monitoring and Cyanotoxin Analysis, edited by: Meriluoto, J., Spoof, L., and Codd, G. A., John Wiley & Sons, Ltd, Chichester, UK, 19–27, https://doi.org/10.1002/9781119068761.ch3, 2017.
Jodłowska, S. and Latała, A.: Photoacclimation strategies in the toxic cyanobacterium Nodularia spumigena (Nostocales, Cyanobacteria), Phycologia, 49, 203–211, https://doi.org/10.2216/PH08-14.1, 2010.
Jodłowska, S. and Śliwińska, S.: Effects of light intensity and temperature on the photosynthetic irradiance response curves and chlorophyll fluorescence in three picocyanobacterial strains of Synechococcus, Photosynthetica, 52, 223–232, https://doi.org/10.1007/s11099-014-0024-y, 2014.
Johnson, P. W. and Sieburth, J. M.: Chroococcoid cyanobacteria in the sea: A ubiquitous and diverse phototrophic biomass, Limnol. Oceanogr., 24, 928–935, https://doi.org/10.4319/lo.1979.24.5.0928, 1979.
Joint, I. R. and Pomroy, A. J.: Photosynthetic characteristics of nanoplankton and picoplankton from the surface mixed layer, Mar. Biol., 92, 465–474, 1986.
Kana, T. M. and Glibert, P. M.: Effect of irradiances up to 2000 µmol E m−2 s−1 on marine Synechococcus WH7803-I. Growth, pigmentation, and cell composition, Deep-Sea Res., 34, 479–495, https://doi.org/10.1016/0198-0149(87)90001-X, 1987a.
Kana, T. M. and Glibert, P. M.: Effect of irradiances up to 2000 µmol E m−2 s−1 on marine Synechococcus WH7803-II. Photosynthetic responses and mechanisms, Deep-Sea Res., 34, 497–516, https://doi.org/10.1016/0198-0149(87)90002-1, 1987b.
Kana, T. M. and Glibert, P. M.: Zeaxanthin and β-carotene in Synechococcus WH7803 respond differently to irradiance, Limnol. Oceanogr., 33, 1623–1627, 1988.
Kuosa, H.: Occurrence of autotrophic picoplankton along an open sea-inner archipelago gradient in the Gulf of Finland, Baltic Sea, Ophelia, 28, 85–93, 1988.
Larsson, J., Celepli, N., Ininbergs, K., Dupont, C. L., Yooseph, S., Bergman, B., and Ekman, M.: Picocyanobacteria containing a novel pigment gene cluster dominate the brackish water Baltic Sea, ISME J., 8, 1892–1903, https://doi.org/10.1038/ismej.2014.35, 2014.
Latała, A., Jodłowska, S., and Pniewski, F.: Culture collection of Baltic Algae (CCBA) and characteristic of some strains by factorial experiment approach, Algol. Stud., 122, 137–154, https://doi.org/10.1127/1864-1318/2006/0122-0137, 2006.
Leppäranta, M. and Myrberg, K.: Physical Oceanography of the Baltic Sea, Springer, Berlin, 378 pp., 2009.
Marie, D., Simon, N., and Vaulot, D.: Phytoplankton cell counting by flow cytometry, Algal Culturing Techniques, 1, 253–267, 2005.
Mazur-Marzec, H., Sutryk, K., Kobos, J., Hebel, A., Hohlfeld, N., Błaszczyk, A., Toruńska, A., Kaczkowska, M. J., Łysiak-Pastuszak, E., Kraśniewski, W., and Jasser, I.: Occurrence of cyanobacteria and cyanotoxins in the Southern Baltic Proper. Filamentous cyanobacteria vs. single-celled picocyanobacteria, Hydrobiologia, 701, 235–252, https://doi.org/10.1007/s10750-012-1278-7, 2013.
Meier, H. E.: Regional ocean climate simulations with a 3-D ice-ocean model for the Baltic Sea. Part 2: Results for sea ice, Clim. Dynam., 19, 255–266, 2002.
Millie, D. F., Ingram, D. A., and Dionigi, C. P.: Pigment and photosynthetic responses of Oscillatoria agardhii (Cyanophyta) to photon flux density and spectral quality, J. Phycol., 26, 660–666, https://doi.org/10.1111/j.0022-3646.1990.00660.x, 1990.
Motwani, N. H. and Gorokhova, E.: Mesozooplankton grazing on picocyanobacteria in the Baltic Sea as inferred from molecular diet analysis, PLoS One, 8, e79230, https://doi.org/10.1371/journal.pone.0079230, 2013.
Paczkowska, J., Rowe, O., Schlüter, L., Legrand, C., Karlson, B., and Andersson, A.: Allochthonous matter: An important factor shaping the phytoplankton community in the Baltic Sea, J. Plankton Res., 39, 23–34, https://doi.org/10.1093/plankt/fbw081, 2017.
Pniewski, F. F., Biskup, P., Bubak, I., Richard, P., Latała, A., and Blanchard, G.: Photo-regulation in microphytobenthos from intertidal mudflats and non-tidal coastal shallows, Estuar. Coast. Shelf S., 152, 153–161, https://doi.org/10.1016/j.ecss.2014.11.022, 2015.
Prezelin, B. B.: Light reactions in photosynthesis, in: Physiological Bases of phytoplankton Ecology, edited by: Platt, T., Ottawa, Canadian Bulletin of Fisheries and Aquatic Sciences, No. 210, 1–46, 1981.
Prezelin, B. B. and Sweeney, B. M.: Photoadaptation of photosynthesis in two bloom-forming dinoflagellates, in: Toxic Dinoflagellate Blooms, edited by: Taylor, D. and Seliger, H., Elsevier North Holland, Inc., 101–106, 1979.
Ramus, J.: The capture and transduction of light energy, in: The Biology of Seaweeds, edited by: Lobban, C. S. and Wynne, M. J., Botanical Monographs, Vol. 17, Oxford, Blackwell Scientific Publications, 458–492, 1981.
Richardson, K., Beardall, J., and Raven, J. A.: Adaptation of unicellular algae to irradaince: An analysis of strategies, New Phytol., 93, 157–191, https://doi.org/10.1111/j.1469-8137.1983.tb03422.x, 1983.
Richardson, T. L. and Jackson, G. A.: Small phytoplankton and carbon export from the surface ocean, Science, 315, 838–840, https://doi.org/10.1126/science.1133471, 2007.
Sakshaug, E., Bricaud, A., Dandonneau, Y., Falkowski, P. G., Kiefer, D. A., Legendre, L. L., Morel, A., Parslow, J., and Takahashi, M.: Parameters of photosynthesis: Definitions, theory and interpretation of results, J. Plankton Res., 19, 1637–1670, https://doi.org/10.1093/plankt/19.11.1637, 1997.
Sánchez-Baracaldo, P., Handley, B. A., and Hayes, P. K.: Picocyanobacterial community structure of freshwater lakes and the Baltic Sea revealed by phylogenetic analyses and clade-specific quantitative PCR, Microbiology, 154, 3347–3357, https://doi.org/10.1099/mic.0.2008/019836-0, 2008.
Sheskin, D. J.: Handbook of Parametric and Nonparametric Statistical Procedures, 3rd Edn., CRC Press Company, London and New York, 867–980, 2000.
Sieburth, J. M. N., Smatacek, V., and Lenz, J.: Pelagic ecosystem structure: Heterotrophic compartments of the plankton and their relationship to plankton size fractions, Limnol. Oceanogr., 23, 1256–1263, https://doi.org/10.4319/lo.1978.23.6.1256, 1978.
Siefermann-Harms, D.: The light-harvesting and protective functions of carotenoids in photosynthetic membranes, Physiol. Plant., 69, 561–568, https://doi.org/10.1111/j.1399-3054.1987.tb09240.x, 1987.
Siegel, H. and Gerth, M.: Sea surface temperature in the Baltic Sea in 2016, HELCOM Baltic Sea Environment Fact Sheets 2017, available at: http://www.helcom.fi/baltic-sea-trends/environment-fact-sheets/ (last access: 25 June 2018), 2017.
Six, C., Finkel, Z. V., Irwin, A. J., and Campbell, D. A.: Light variability illuminates niche-partitioning among marine picocyanobacteria, PLoS One, 2, e1341, https://doi.org/10.1371/journal.pone.0001341, 2007a.
Six, C., Thomas, J. C., Garczarek, L., Ostrowski, M., Dufresne, A., Blot, N., Scanlan, D. J., and Partensky, F.: Diversity and evolution of phycobilisomes in marine Synechococcus spp.: a comparative genomics study, Genome Biol., 8, R259, https://doi.org/10.1186/gb-2007-8-12-r259, 2007b.
Śliwińska-Wilczewska, S., Maculewicz, J., Barreiro Felpeto, A., Vasconcelos, V., and Latała, A.: Allelopathic activity of the picocyanobacterium Synechococcus sp. on filamentous cyanobacteria, J. Exp. Mar. Biol. Ecol., 496, 16–21, https://doi.org/10.1016/j.jembe.2017.07.008, 2017.
Śliwińska-Wilczewska, S., Maculewicz, J., Barreiro Felpeto, A., and Latała, A.: Allelopathic and bloom-forming picocyanobacteria in a changing world, Toxins, 10, 48, https://doi.org/10.3390/toxins10010048, 2018a.
Śliwińska-Wilczewska, S., Barreiro Felpeto, A., Maculewicz, J., Sobczyk, A., Vasconcelos, V., and Latała, A.: Allelopathic activity of the picocyanobacterium Synechococcus sp. on unicellular eukaryote planktonic microalgae, Mar. Freshwater Res., 69, 1472–1479, https://doi.org/10.1071/MF18024, 2018b.
Snoeijs-Leijonmalm, P. and Andrén, E.: Why is the Baltic Sea so special to live in?, in: Biological Oceanography of the Baltic Sea, edited by: Snoeijs-Leijonmalm, P., Schubert, H., and Radziejewska, T., Springer, Dordrecht, 23–84, 2017.
Sorokin, P. Y., Sorokin, Y. I., Boscolo, R., and Giovanardi, O.: Bloom of picocyanobacteria in the Venice lagoon during summer–autumn 2001: ecological sequences, Hydrobiologia, 523, 71–85, 2004.
Sorokin, Y. I. and Zakuskina, O. Y.: Features of the Comacchio ecosystem transformed during persistent bloom of picocyanobacteria, J. Oceanogr., 66, 373–387, 2010.
Stal, L. J. and Walsby, A. E.: Photosynthesis and nitrogen fixation in a cyanobacterial bloom in the Baltic Sea, Eur. J. Phycol., 35, 97–108, https://doi.org/10.1080/09670260010001735681, 2000.
Stal, L. J., Staal, M., and Villbrandt, M.: Nutrient control of cyanobacterial blooms in the Baltic Sea, Aquat. Microb. Ecol., 18, 165–173, 1999.
Stal, L. J., Albertano, P., Bergman, B., Bröckel, K., Gallon, J. R., Hayes, P. K., Sivonen, K., and Walsby, A. E.: BASIC: Baltic Sea cyanobacteria. An investigation of the structure and dynamics of water blooms of cyanobacteria in the Baltic Sea – Responses to a changing environment, Cont. Shelf Res., 23, 1695–1714, https://doi.org/10.1016/j.csr.2003.06.001, 2003.
Stawiarski, B., Buitenhuis, E. T., and Le Quéré, C.: The physiological response of picophytoplankton to temperature and its model representation, Front. Mar. Sci., 3, 164, https://doi.org/10.3389/fmars.2016.00164, 2016.
Stockner, J. G.: Phototrophic picoplankton: An overview from marine and freshwater ecosystems, Limnol. Oceanogr., 33, 765–775, https://doi.org/10.4319/lo.1988.33.4part2.0765, 1988.
Stomp, M., Huisman, J., Vörös, L., Pick, F. R., Laamanen, M., Haverkamp, T., and Stal, L. J.: Colourful coexistence of red and green picocyanobacteria in lakes and seas, Ecol. Lett., 10, 290–298, https://doi.org/10.1111/j.1461-0248.2007.01026.x, 2007.
Strickland, I. D. H. and Parsons T. R.: A practical handbook of seawater analysis, J. Fish Res. Board Can., 167, 1–310, 1972.
Vörös, L., Gulyas, P., and Nemeth, J.: Occurrence, dynamics and production of picoplankton in Hungarian shallow lakes, Int. Rev. Ges. Hydrobio., 76, 617–629, https://doi.org/10.1002/iroh.19910760412, 1991.
Waterbury, J. B., Watson, S. W., Guillard, R. R., and Brand, L. E.: Widespread occurrence of a unicellular, marine, planktonic, cyanobacterium, Nature, 277, 293–294, https://doi.org/10.1038/277293a0, 1979.
Worden, A. Z. and Wilken, S.: A plankton bloom shifts as the ocean warms, Science, 354, 287–288, https://doi.org/10.1126/science.aaj1751, 2016.