the Creative Commons Attribution 4.0 License.
the Creative Commons Attribution 4.0 License.
 | 07 Nov 2018
Factors influencing test porosity in planktonic foraminifera
Janet E. Burke
Willem Renema
Michael J. Henehan
Leanne E. Elder
Catherine V. Davis
Amy E. Maas
Gavin L. Foster
Ralf Schiebel
Pincelli M. Hull
The clustering of mitochondria near pores in the test walls of foraminifera suggests that these perforations play a critical role in metabolic gas exchange. As such, pore measurements could provide a novel means of tracking changes in metabolic rate in the fossil record. However, in planktonic foraminifera, variation in average pore area, density, and porosity (the total percentage of a test wall that is open pore space) have been variously attributed to environmental, biological, and taxonomic drivers, complicating such an interpretation. Here we examine the environmental, biological, and evolutionary determinants of pore characteristics in 718 individuals, representing 17 morphospecies of planktonic foraminifera from 6 core tops in the North Atlantic. Using random forest models, we find that porosity is primarily correlated to test surface area, test volume, and habitat temperature, key factors in determining metabolic rates. In order to test if this correlation arose spuriously through the association of cryptic species with distinct biomes, we cultured Globigerinoides ruber in three different temperature conditions, and found that porosity increased with temperature. Crucially, these results show that porosity can be plastic: changing in response to environmental drivers within the lifetime of an individual foraminifer. This demonstrates the potential of porosity as a proxy for foraminiferal metabolic rates, with significance for interpreting geochemical data and the physiology of foraminifera in non-analog environments. It also highlights the importance of phenotypic plasticity (i.e., ecophenotypy) in accounting for some aspects of morphological variation in the modern and fossil record.
- Article
(13691 KB) - Full-text XML
-
Supplement
(10284 KB) - BibTeX
- EndNote


Geochemical data from foraminiferal calcite often differ among species living in the same habitat due to biological factors collectively known as “vital effects” (Erez, 1983; Spero et al., 1991; Ezard et al., 2015). Vital effects are often attributed, at least in part, to differences in metabolic processes such as respiration and photosynthesis (e.g., Wolf-Gladrow et al., 1999). Importantly though, these factors have not been directly measured in the vast majority of species, leaving this idea largely untested (e.g., Ravelo and Fairbanks, 1995). A robust metabolic proxy could provide an independent constraint on the impact of vital effects on geochemical proxy signals such as δ13C and δ11B recorded in fossil foraminifera, thus impacting estimates of past atmospheric CO2 concentrations (e.g., Anagnostou et al., 2016) and carbon cycling processes (e.g., Birch et al., 2016). Various aspects of foraminiferal test morphology have been observed to respond directly and measurably to metabolically relevant conditions in laboratory culture. For example, food quality and abundance can affect the terminal test size of an adult foraminifer and the shape of its final chambers (Bé, 1982; Hemleben et al., 1989), and varying light levels have been related to changes in the size and shape of foraminiferal chambers in species that house photosynthetic symbionts (Bé, 1982; Spero, 1988; Bijma et al., 1992; Hemleben et al., 1989).
A particularly promising morphological characteristic that could provide insights into metabolic processes is porosity. Porosity is the total percent area of the test that is occupied by pores – small perforations in the tests of all planktonic foraminifera. The exact function of pores in foraminifera is not fully understood. Photosynthetic symbionts and mitochondria have been observed clustering near pores of benthic foraminifera (Hottinger and Dreher, 1974), and dissolved substances can be absorbed through pores (Berthold, 1978). These observations suggest that pores may be involved in the physiological processes of osmoregulation and gas exchange. Porosity increases with the overall size of the test during ontogenetic development, potentially as a result of changes in depth ecology accompanying maturation, to accommodate increased movement of gas and solutes with increasing size, or to regulate buoyancy as the shell size increases (Bolli et al., 1994; Bé, 1968; Bé et al., 1973; Brummer et al., 1986; Marszalek, 1982; Huber et al., 1997; Schmidt et al., 2013).
Regardless of the exact function of pores, variation in porosity within and across species has frequently been attributed to environmental factors. A linear relationship exists between porosity and latitude, with higher porosities of >10 % of the measured test wall associated with low latitudes and low porosities of <5 % associated with high latitudes (Bé, 1968; Frerichs et al., 1972). This pattern is commonly attributed to habitat temperature and has been used to track water masses during glacial–interglacial cycles in fossil and subfossil foraminiferal assemblages (Wiles, 1965; Bé, 1968; Frerichs et al., 1972; Bé and Duplessy, 1976; Malmgren and Healy-Williams, 1978; Colombo and Cita, 1988; Fisher et al., 2003). Other environmental factors have also been hypothesized as drivers of morphological variation in porosity, including water density, salinity, oxygenation, and nitrogen concentration (Bé, 1968; Bé et al., 1973, 1980; Hottinger and Dreher, 1975; Berthold, 1978; Leutenegger and Hansen, 1979; Caron, 1987a, b; Hemleben et al., 1989; Bijma et al., 1990; Moodley and Hess, 1992; Gupta and Machain-Castillo, 1993; Fisher et al., 2003; Glock, 2011; Kuroyanagi et al., 2013; Kuhnt et al., 2014).
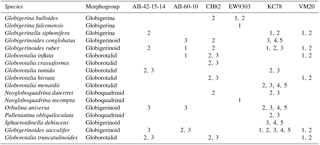
Table 1Locality and sieve size fraction for all core-top species sampled. Marker sizes correspond with sieve size fractions (1=250–300 µm, 2=300–425 µm, 3=425–600 µm, 4=600–710 µm, 5=710–850 µm).
Pore variation across species and populations is also associated with evolutionary history. Average pore area is the basis for a fundamental taxonomic division that distinguishes two major groups of planktonic foraminifera: the macroperforate (pores larger than 1 µm in diameter) and microperforate (pores of 1 µm or less) planktonic foraminifera (Bé et al., 1980; Kennett and Srinivasan, 1983; Qianyu and Radford, 1991). Within macroperforate planktonic foraminifera, there is a wide range of pore sizes and distribution patterns, some of which are characteristic of particular lineages. Globorotalid foraminifera, such as Globorotalia tumida and Globorotalia menardii, can be distinguished from globigerinoid foraminifera like Globigerinoides ruber based on the shape, size, and distribution of their pores (Bé et al., 1980). Porosity has also been used to distinguish between pseudo-cryptic species in modern foraminifera (Huber et al., 1997; Morard et al., 2009; Marshall et al., 2015; Weiner et al., 2015; Schiebel and Hemleben, 2017).
In summary, previous studies generally identify three different categories of factors influencing porosity: biological, environmental, and phylogenetic. However, these factors are not independent of one another, and no previous study has attempted to detangle these various potential influences on porosity. Here we use core-top samples from across the Atlantic Ocean to explore how porosity varies within and between populations, species, communities, size classes, and environments in order to identify the major determinants of porosity in modern macroperforate planktonic foraminifera. As an independent test of the findings based on core tops, we also present cultured Globigerinoides ruber specimens grown in different temperature conditions. These analyses are used together to consider the relationship between planktonic foraminiferal porosity and metabolic processes including respiration and photosynthesis.
2.1 Core-top sample selection and processing
Planktonic foraminifera from six Atlantic core-top localities spanning the major planktonic foraminifera biomes were sampled from six sieve size fractions ranging from 150 to 850 µm (Fig. 1, Table 1; biomes from Darling and Wade, 2008). At four sites (KC78, CH82-21, VM20-248, and EW93-03-04; Fig. 1), a random split of 50–100 individuals from each size fraction was picked. At two additional sites, AII-60-10 and AII-42-15-14, target species were specifically picked to increase the taxonomic and environmental range of our analyses (Table 1; Fig. 1). Species were identified on the basis of the naming conventions in Schiebel and Hemleben (2017). Specimens were mounted on microfossil slides and imaged at multiple focal heights (z stacks) from the spiral and umbilical side at a 10× magnification using a 5 megapixel Leica DFC450 digital camera mounted on a Leica Microsystems DM6000M compound transmitted-light microscope with an automated x−y stepping stage and drive focus. Umbilical views were used in the analysis of test size (see Figs. S1 and S2 and supplemental text in the Supplement). Using AutoMorph (Hsiang et al., 2016, 2017), two- and three-dimensional shape and size information was extracted from the z-stacked photographs of each individual, including surface area and volume (Fig. S1). Two-dimensional measurements included cross-sectional area, major axis length, minor axis length, and perimeter length (Fig. S1). Three-dimensional measurements included multiple estimates of volume and surface area using the top (i.e., visible) half and a combination of visible top halves with hypothetical backsides (see Hsiang et al., 2016; Fig. S1).
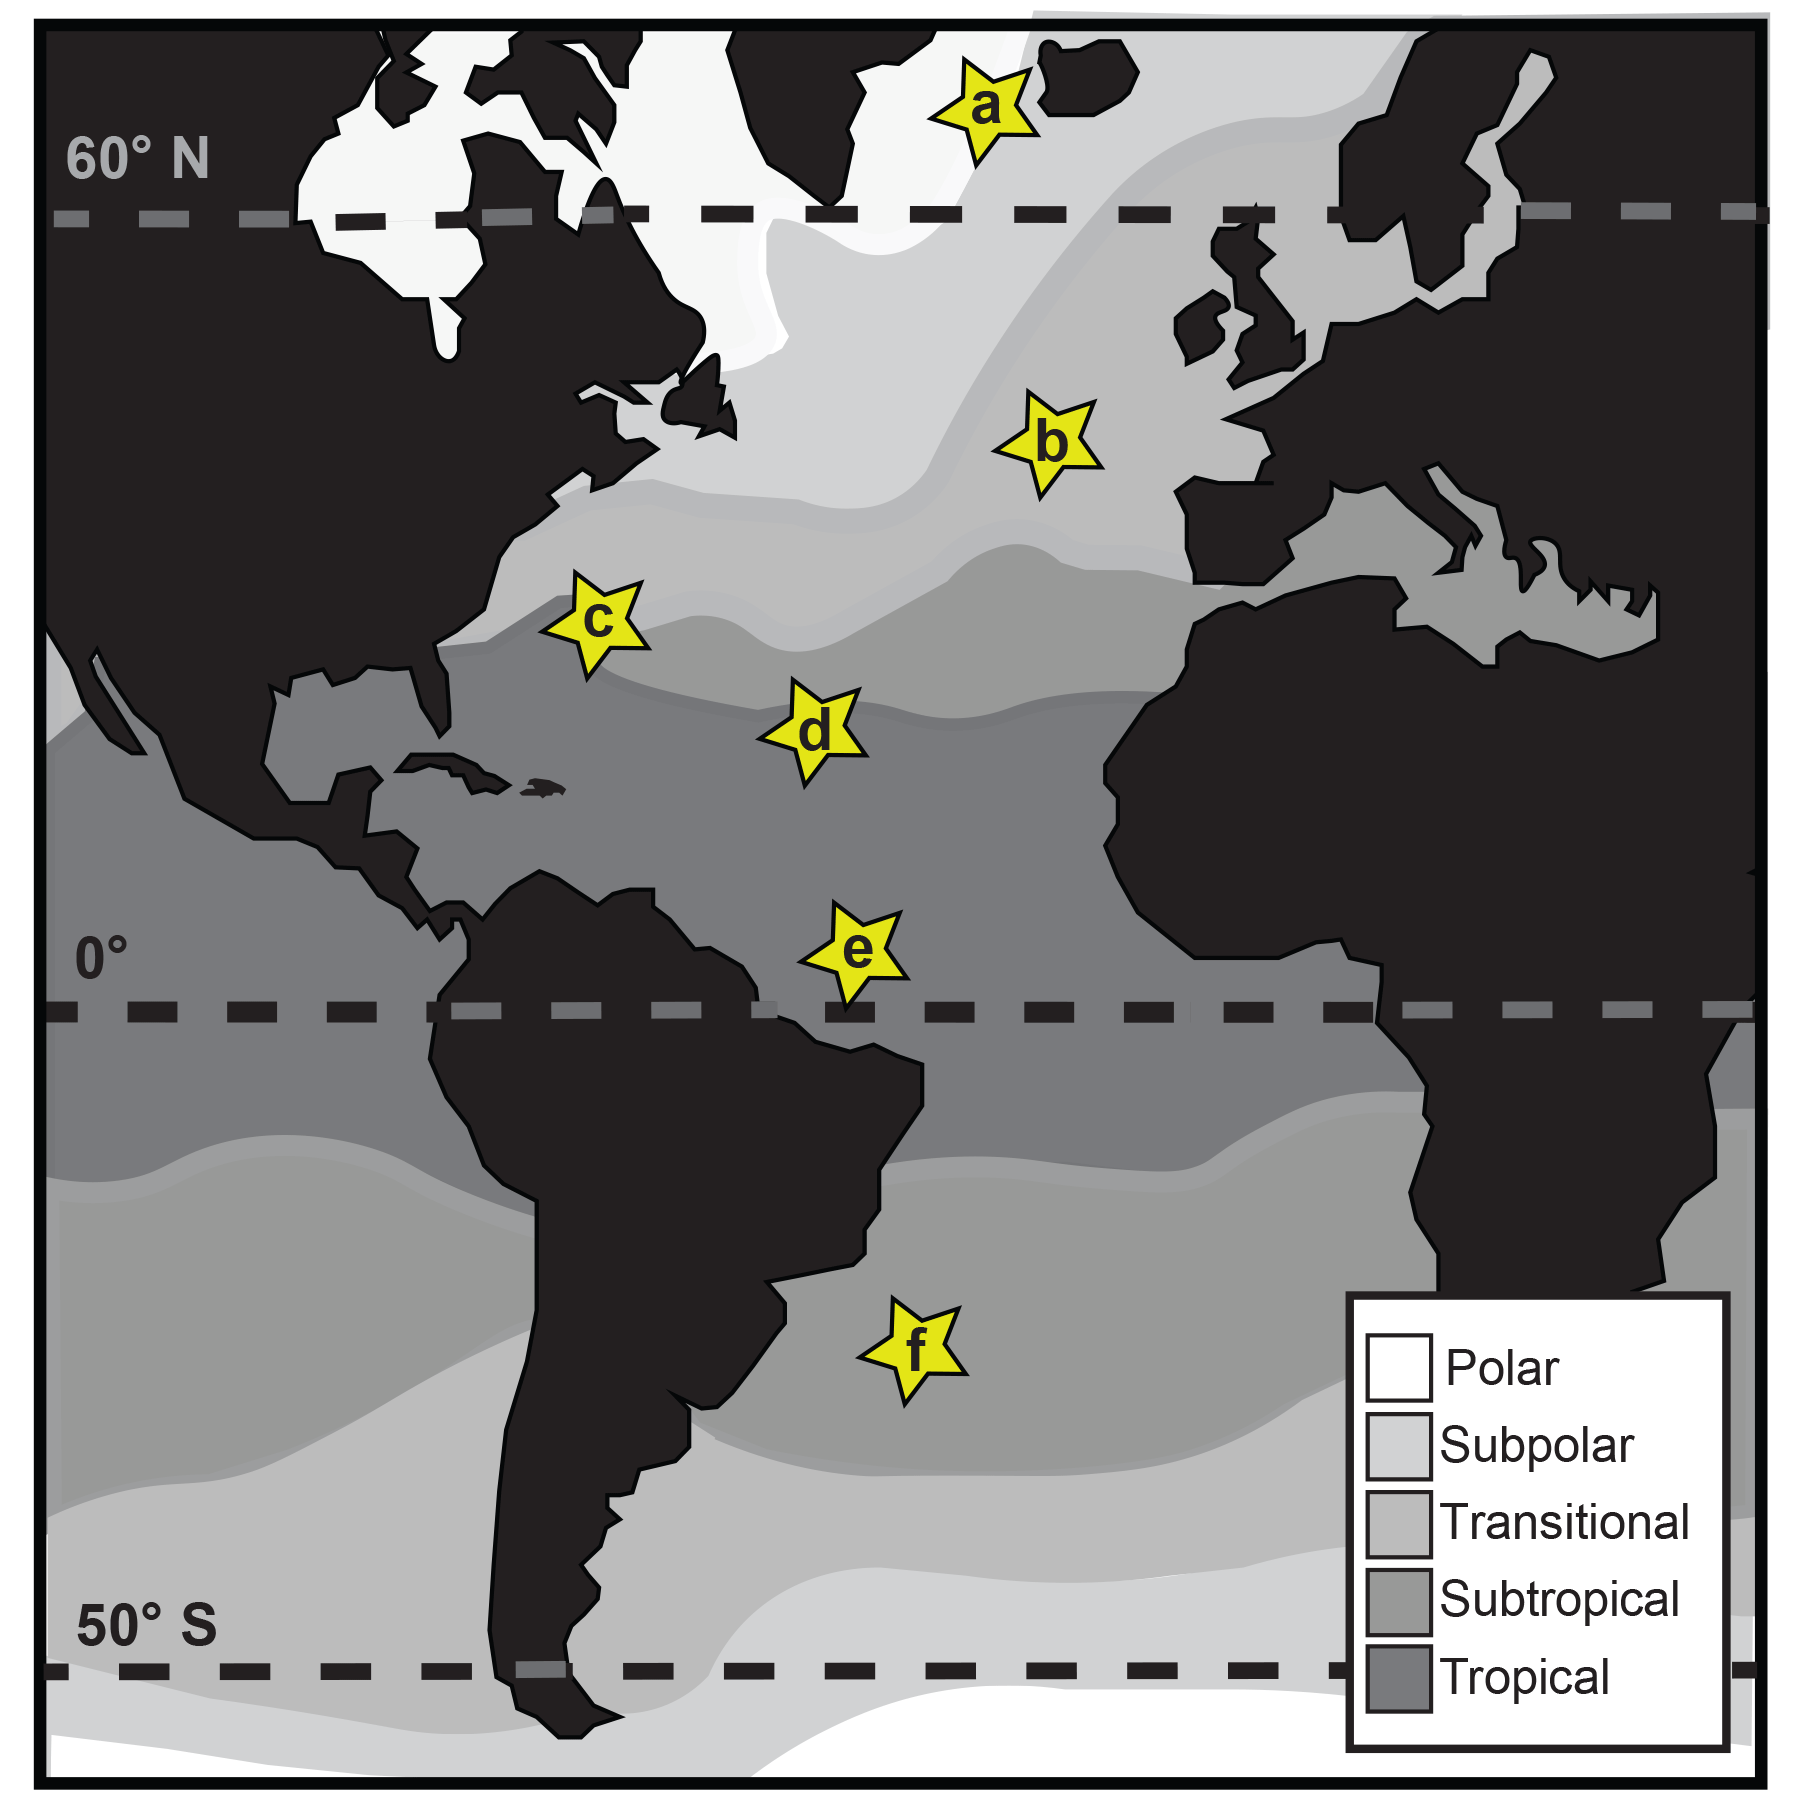
Figure 1Map of core-top sample localities (modified from Darling and Wade, 2008): (a) EW9303-04: 64.71∘ N, −28.91∘ E, sub-polar; (b) CH82-21: 43.288∘ N, −29.83∘ E, transitional; (c) VM20-248: 33.5∘ N, −64.4∘ E, subtropical/tropical; (d) AII-42-15-14: 19.567∘ N, −44.95∘ E, tropical; (e) KC78: 5.267∘ N, −44.133∘ E, tropical; (f) AII-60-10: −29.6∘ N, −34.667∘ E, subtropical.
Size is an important factor in studies of planktonic foraminiferal ecology and biology, but it can refer to many different test parameters, like major axis length, aspect ratio, sieve size class, or three-dimensional volume and surface area measurements. Here, we included two-dimensional area, major axis length, top-half surface area, top-half volume, elliptical estimate surface area, and elliptical estimate volume in the initial analyses to determine which set of size parameters was the most highly correlated with porosity. We include measures of both surface area and volume in our analysis due to their interactive effect on potential gas exchange. Planktonic foraminifera with a flattened test shape (such as Globorotalia menardii) have a high surface area to volume ratio, essentially maximizing the diffusive surface for their overall size. Conversely, spherical morphologies, like the adult form of Orbulina universa, have the lowest possible surface area to volume ratio for a given diameter, minimizing the diffusive surface for their overall size. We focused on top-half estimates for this study because they are directly measured and correlated with other estimates of surface area and volume (see Fig. S2). We were also interested in elliptical estimates, as it has been suggested that, in vivo, spines and/or pseudopods would extend radially, making elliptical estimates more representative of where respiration and photosynthesis take place (Zeebe et al., 1999). Elliptical estimates of surface area and volume were calculated using height, length, and width measurements assuming an elliptical solid. Because the two measurements (top half and elliptical) potentially represent different diffusive states that may be experienced by the living organism, both were considered for the final analysis. Additionally, size-normalized porosity was used in several analyses for which the aim was to explore the relationship between environmental variables and porosity regardless of the organism's size. To do this, residual porosity values from a regression of porosity and surface area (for core-top specimens) or two-dimensional area (for cultured specimens) were used in lieu of direct porosity measurements.
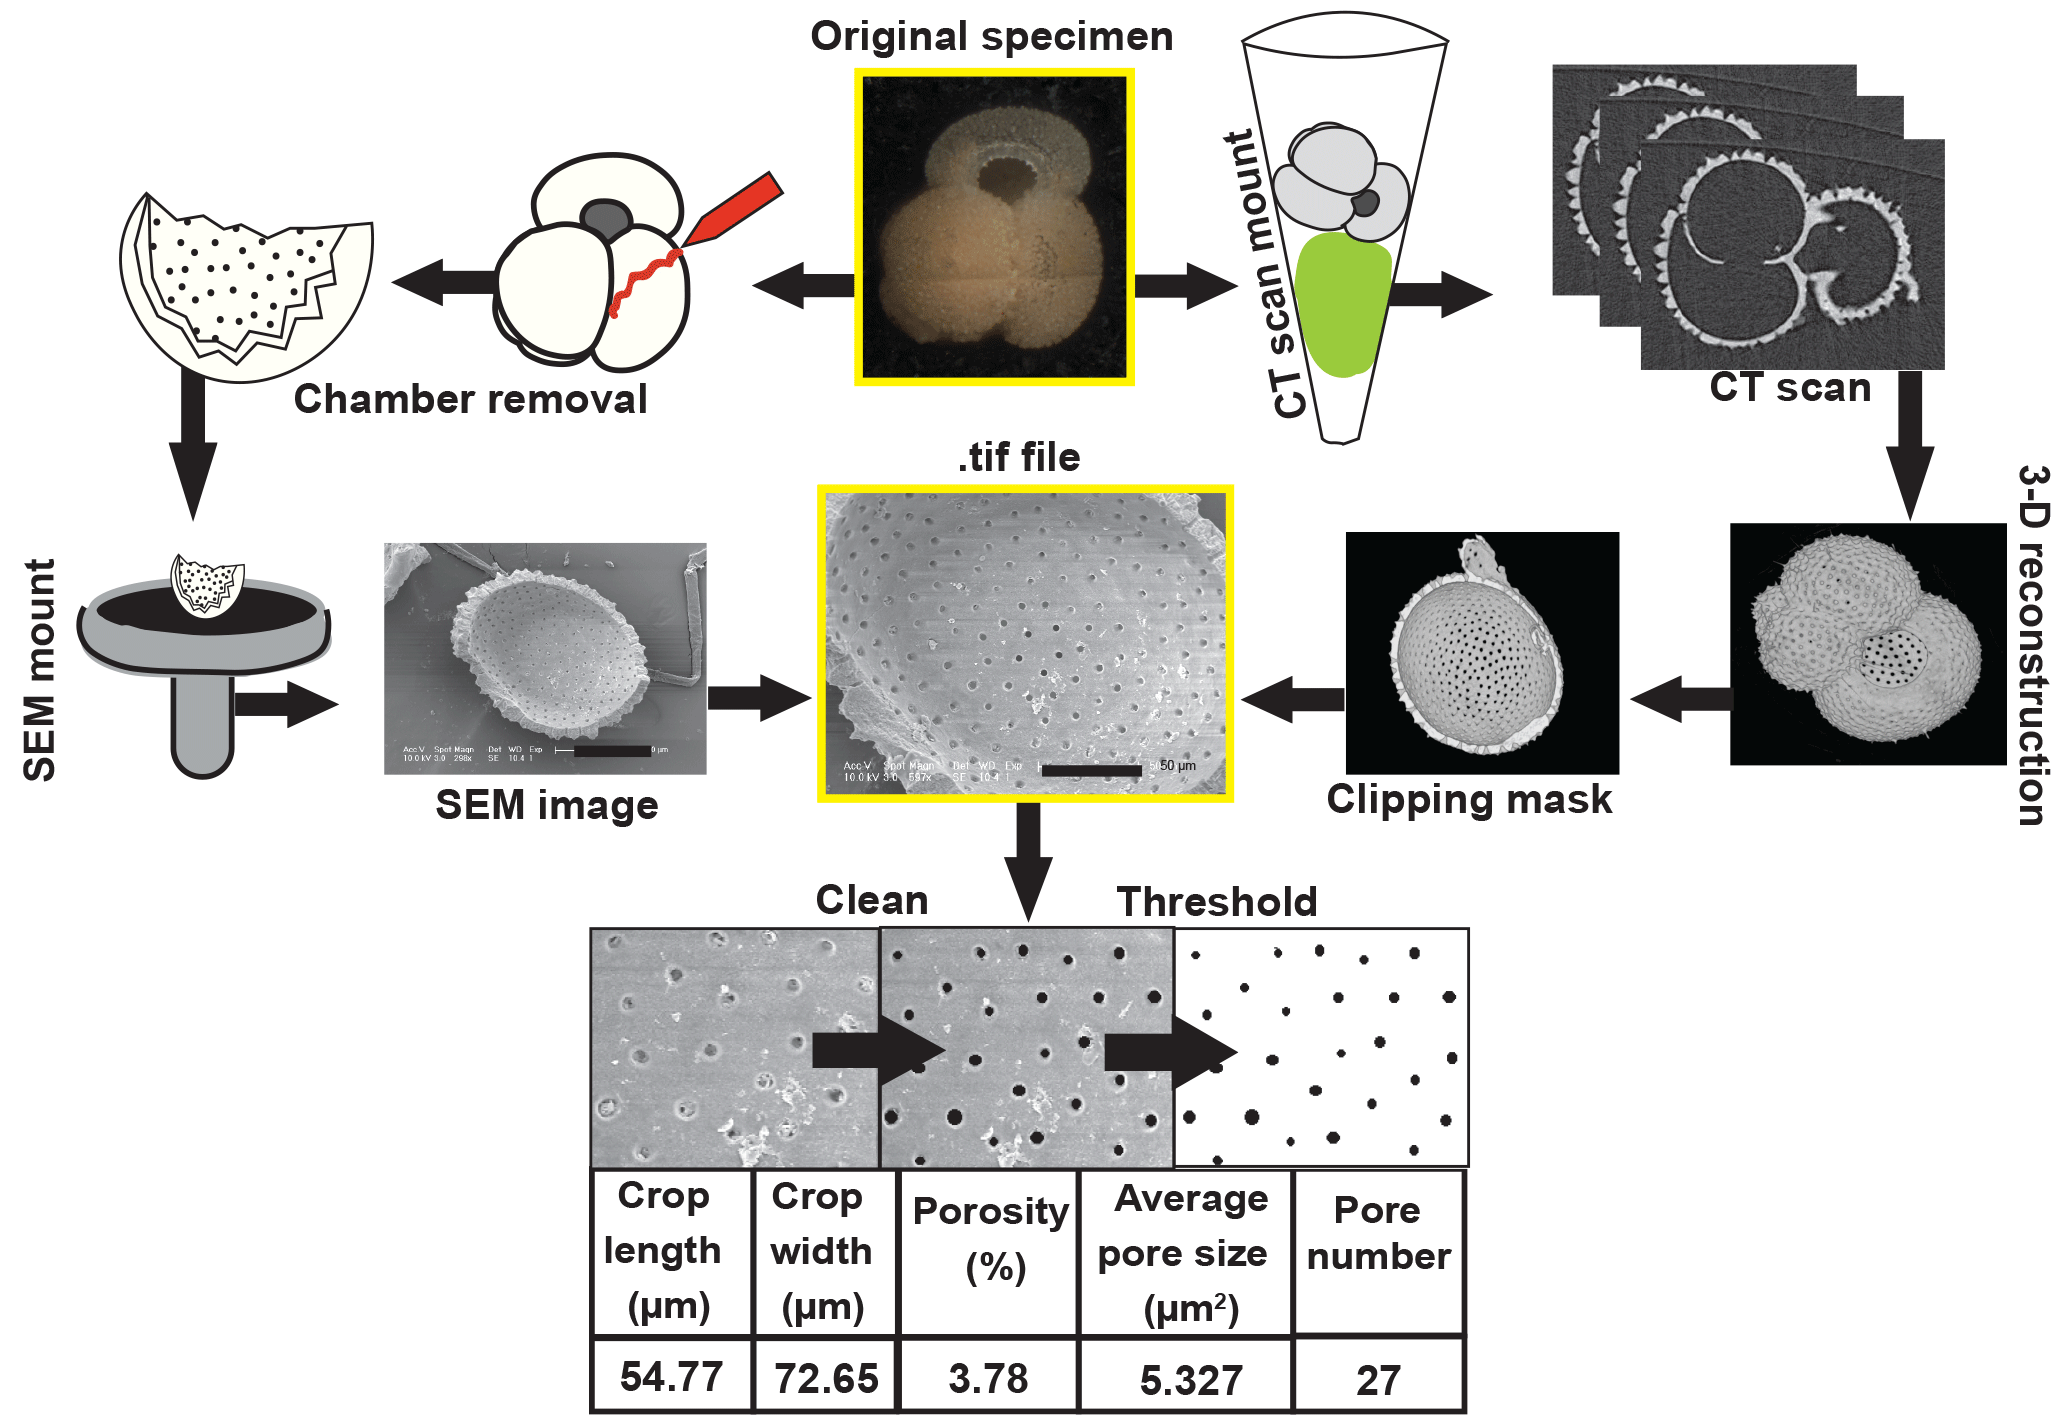
Figure 2Workflow diagrams for porosity and CT scan analyses. Pore characteristics for this study were measured on the internal test wall from SEM images of dissected foraminifera (pathway illustrated on the left side) or from CT scans (as shown on the right side). The method for extracting volume and surface area measurements is also shown on the far right.
After whole-specimen imaging, tests were dissected to remove the final and penultimate chamber and expose its inner wall for porosity measurements (Fig. 2). We quantified porosity from the inner wall of the penultimate chamber in order to avoid known irregularities in the porosity of the final chambers (Bé et al., 1980; Constandache et al., 2013). In Orbulina universa, the only exception, we measured the final chamber, as preceding chambers are typically dissolved in sedimentary remains of this species. Chamber fragments were then mounted on scanning electron microscope pins, coated in gold or platinum and carbon, and imaged in a scanning electron microscope (SEM) at a magnification of 300–600× to obtain the widest views of the inner chamber wall that were undistorted by the curvature of the chamber (Fig. 2). SEM images were processed in ImageJ (Schneider et al., 2012) to select an undistorted section of the chamber wall. The cropped image was converted to black and white and analyzed for the percent area occupied by pores (i.e., relative proportion of black pixels), average pore area, and total pore number. The total cropped area was used to convert pore number into a pore density estimate (i.e., number of pores/area). Images were cleaned if necessary to prevent debris from obscuring the pore measurements (Fig. 2). Light photographic, SEM, and processed ImageJ images are provided through the Yale Peabody Museum collections portal (http://collections.peabody.yale.edu/search/, last access: 26 October 2018), using the Yale Peabody catalog numbers provided in Table S1 in the Supplement. Tables S2–S4 include all measurements collected for this study.
2.2 Explanatory variables
We tested two-dimensional area, major axis length, top-half surface area, top-half volume, elliptical estimate surface area, elliptical estimate volume, sea surface temperature (SST), latitude, ambient temperature and oxygen concentration at habitat depth, and morphogroup for their effect on porosity. Depth habitats were determined based on estimates from Schiebel and Hemleben (2017) and are given in Table S7. Annual average SST (using temperature data from World Ocean Atlas for 10 m depth), ambient temperature, and oxygenation at depth habitat of each species were obtained from the World Ocean Atlas 2013 database (Locarnini et al., 2013, for temperature; Garcia et al., 2013, for oxygen) for each site and species (Table S7). Morphogroups were globigerinid, globigerinoid, globorotalid, and globoquadrinid as per Bé (1968) (Table 1).
2.3 Cultured samples
Specimens of Globigerinoides ruber were cultured under controlled temperature conditions at the Bermuda Institute of Ocean Sciences in St. George's, Bermuda, in September 2016 in order to quantify the response of individual foraminiferal porosity to temperature. Specimens were live-caught 15–20 km off the coast of St. George's, Bermuda (between 32.35012 and 32.35942∘ N, −64.59673 and −64.68807∘ W), from the top 15 m of the water column using a 150 µm mesh Reeve net. All specimens were in the adult life stage at the time of the experiments. Specimens were picked from the towed material and placed in recovery baths at 25 ∘C until they showed signs of good health (spines, streaming cytoplasm, presence of symbionts, successful feeding) at which time they were moved to isolated culture jars and placed in a water bath held at a treatment temperature of 23, 25, or 28 ∘C. Both temperature and pH of the treatment water were monitored and kept stable throughout the experiments. Culture vial oxygen concentrations were checked for all temperature treatments with an oxygen optode attached to a Pyroscience FireSting optical oxygen meter to assure that concentrations did not fall below half saturation. Specimens were fed single Artemia spp. nauplii and measured every other day to document growth. Specimens were kept in culture until they underwent gametogenesis or died (identified by the loss of cytoplasm within the test).
Specimens that accumulated one or more chambers in culture were imaged at a voxel size of 0.5–0.85 µm using a Zeiss Xradia microXCT 400 at the University of Texas in Austin, USA, and a Zeiss Xradia 520 Versa micro-CT at Naturalis Biodiversity Center in Leiden, the Netherlands. Scanned specimens were reconstructed and extracted for inner wall porosity in VG StudioMax 3.0 using clipping planes and the ImageJ procedure explained above (Fig. 2). In order to capture pre- and post-culture, pore measurements for comparison pores were measured on the final 3–4 chambers.
2.4 Statistical methods
Random forest models were used to build predictive models and identify the major determinants for each pore characteristic (porosity, pore density, and pore area) using the rpart, randomForest, and party packages in R. Random forest models are supervised learning procedures that work by identifying the variables with the most explanatory power from a suite of theoretical decision trees (500 in this case) constructed from random samples of the data and predictor variables (Evans et al., 2011). The strength of each predictor variable is assessed by the reduction in model fit when that variable is excluded. In other words, the higher the percentage of incremental mean standard error associated with the removal of a variable, the higher that variable is ranked in terms of importance. They are robust to colinearity, nonlinearity, and deviations from normality in the data. Random forest models are useful for data sets with some missing data, and are applicable in situations without a strong a priori hypothesis (Cutler et al., 2007; Davidson et al., 2009; Boyer, 2010). Even so, the variable importance rankings' output by the standard random forest algorithm can be misleading if several explanatory variables covary and if the variables are of different types. In this study, the environmental variables are strongly covariant and the model contains more than one variable type (all continuous except for morphogroup, which is categorical). To account for this and aid in interpretation of the rankings, an unbiased, conditional variable importance ranking method was incorporated via the party package in R, which disentangles the most important variable from the model (Strobl et al., 2008). This method examines whether a correlation between the response variable and a predictor is conditional on another variable proceeding it in the tree, thereby identifying the most influential variable and demoting others (Strobl et al., 2008).
2.5 Testing for phylogenetic signal
Porosity, pore density, and average pore area were examined for a phylogenetic signal by estimating Pagel's lambda using average porosity for each species and the Cenozoic planktonic foraminiferal phylogeny of Aze et al. (2011). Pagel's lambda is a test designed to identify statistically significant grouping of trait values in phylogenetic clades as compared to the random distribution expected in the absence of a phylogenetic signal (Pagel, 1999). Pore measurement values were normalized using model residuals from random forests run without morphogroup. A matrix of the average residual pore values for each species was created and analyzed using the “phylosig” function in the phytools package in R. The tree was trimmed of all branches lacking pore data.
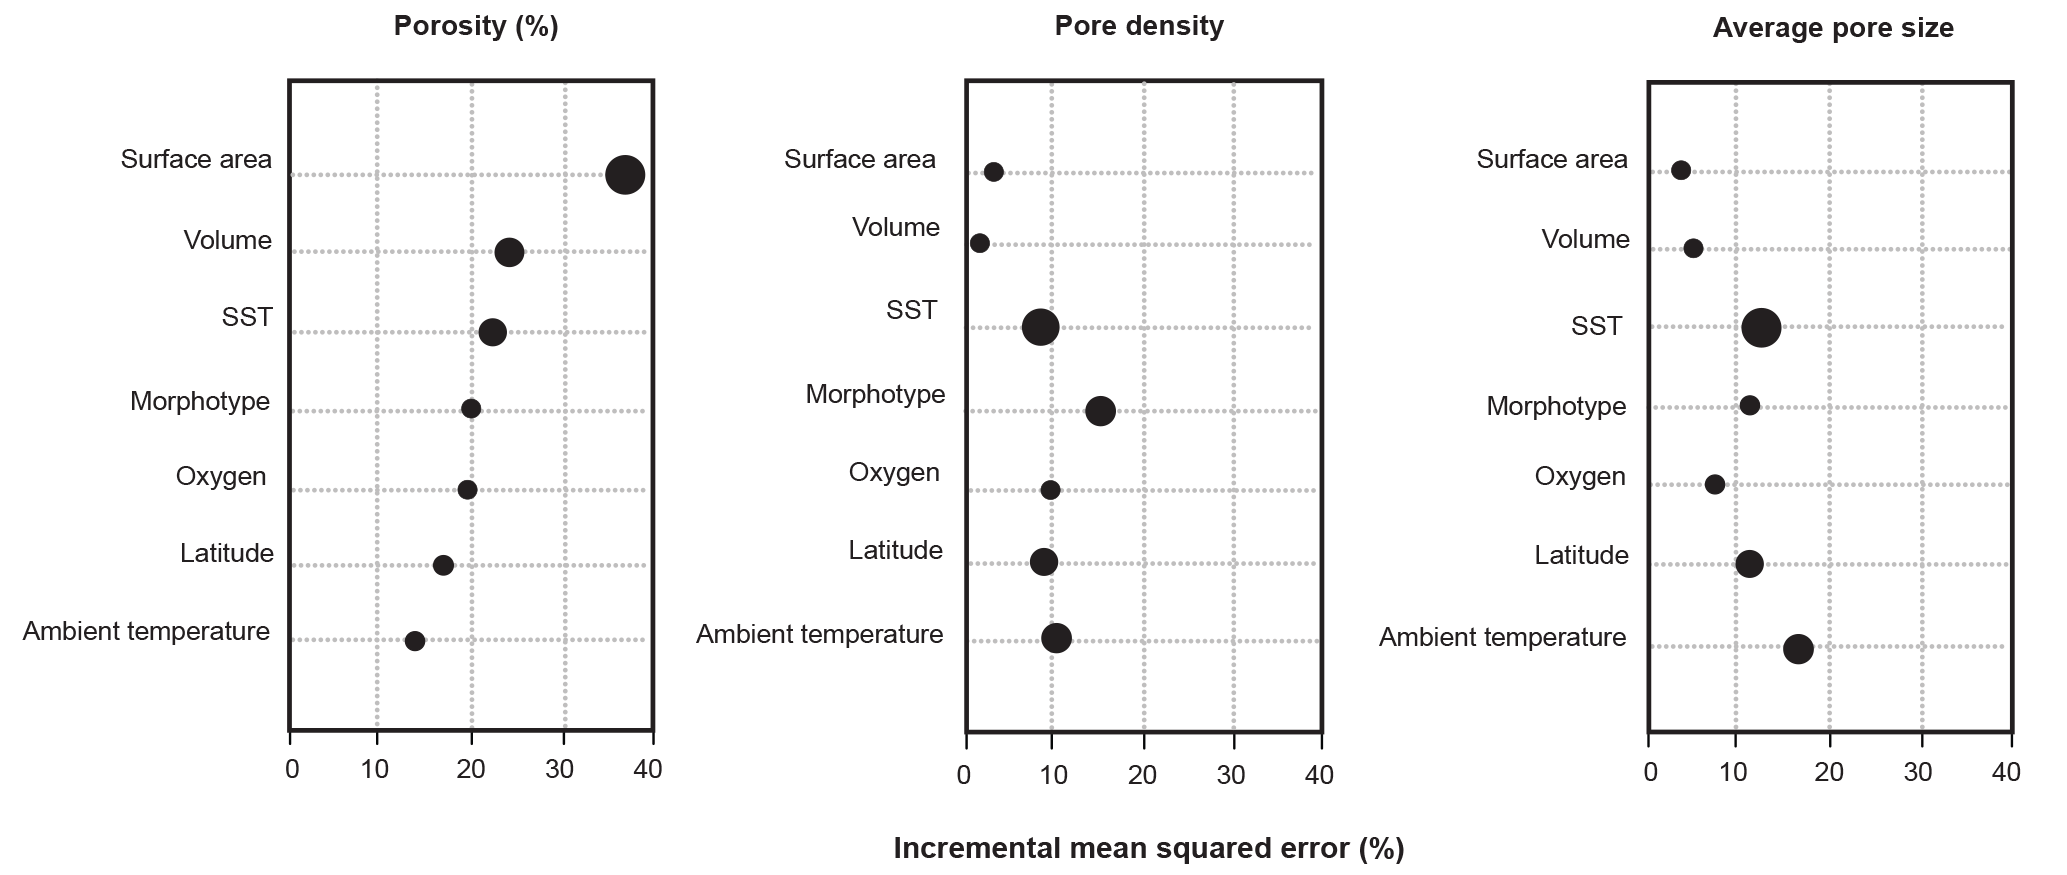
Figure 3Variable importance plots for the random forest models for each pore characteristic. Importance rankings are based on the increase in error produced when the variable in removed (% incremental mean squared error). Marker size refers to the ranking in the conditional variable importance analyses, with the largest markers denoting the most important variables.
A total of 1278 foraminifera were picked, imaged, and identified to the morphospecies level for this study (Fig. S1). In total, 718 specimens representing 17 morphospecies were successfully extracted for both two- and three-dimensional size metrics (i.e., surface area and volume), and are the focus of the statistical analyses presented here. Of the 17 morphospecies, 7 species occur in 3 or more localities and 10 occur in 2 or more localities, allowing us to examine variation within morphospecies across environments.
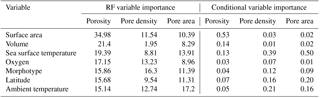
Table 2Variable importance rankings from random forest models and conditional variable importance analysis. Random forest (RF) variable importance values are based on the percent increase in error when the variable is removed from the model. Conditional variable importance values reflect a reassessment of relative variable importance rankings without bias toward factorial or highly correlated variables.
3.1 Factors influencing porosity in core-top samples
In the original exploratory analyses (Fig. S3), six different, highly correlated measurements of test size were examined. Using all of them in the random forest models would be redundant, so we ran iterations of the models with three different sets of size variables – two-dimensional area and major axis length, top-half surface area and volume, and elliptical surface area and volume – and chose the set which produced the model which explained the most variance in the porosity data. We found that measurements of elliptical or top-half surface area paired with volume always produced better-fitting models than the two-dimensional measurements. These metrics better account for the surface area and volume disparities between different morphologies that are lost in two-dimensional measurements. The elliptical and top-half measurement sets performed comparably, but the top-half set produced a slightly stronger model for the porosity data set, so we used those measurements in all three models for consistency. Random forest models were then built with the following seven variables: top-half surface area, top-half volume, sea surface temperature, morphogroup, ambient oxygen concentration, ambient temperature, and latitude.
The random forest model for the porosity data set explained 75.50 % of the data. The most important variable was top-half surface area, which caused a 34.10 % increase in error when omitted from the model, followed by top-half volume and sea surface temperature (26.60 % and 23.80 % increase in error, respectively; Fig. 3; Table 2). The conditional variable analysis also identified surface area as the most important variable. The random forest model for pore area explained 81.50 % of the variance in the data and was the strongest model built for the three different measures of pores (i.e., porosity, pore area, and pore density). For pore area, ambient temperature was the strongest predictor (15.90 % increase in error when absent), followed by sea surface temperature and surface area (14.50 % and 12.80 % increase in error when omitted from the model; Fig. 3). In contrast to the random forest model, the conditional variable analysis identified sea surface temperature as the most important variable in explaining pore area, followed by latitude and ambient temperature (Table 2). The random forest for pore density explained 71.81 % of the variance in the data. Here, morphogroup was the most important factor (resulting in a 15.30 % increase in model error if omitted), followed by ambient temperature (11.30 %; Fig. 3). However, the conditional variable analysis (which is not biased toward factors as random forests are) identified sea surface temperature and ambient temperature as the most important variables.
Pore variables were compared against each other to consider their covariance. Within the pore characteristics, more of the variation in porosity is explained by variation in pore area (r2=0.64) than by pore density (r2=0.17, Fig. 4). Pairwise relationships among porosity, pore area, and pore density were often nonlinear and clustered by morphogroup (Fig. 4). Although globigerinoid foraminifera have a similar range of overall porosities to other morphogroups, they have the widest range in pore areas, and a narrow range of consistently low pore densities. These patterns in pore density and area, and other characteristics not measured in this study like pore shape and rim type, are what makes the pore structures of these morphogroups distinguishable (Bé, 1980).
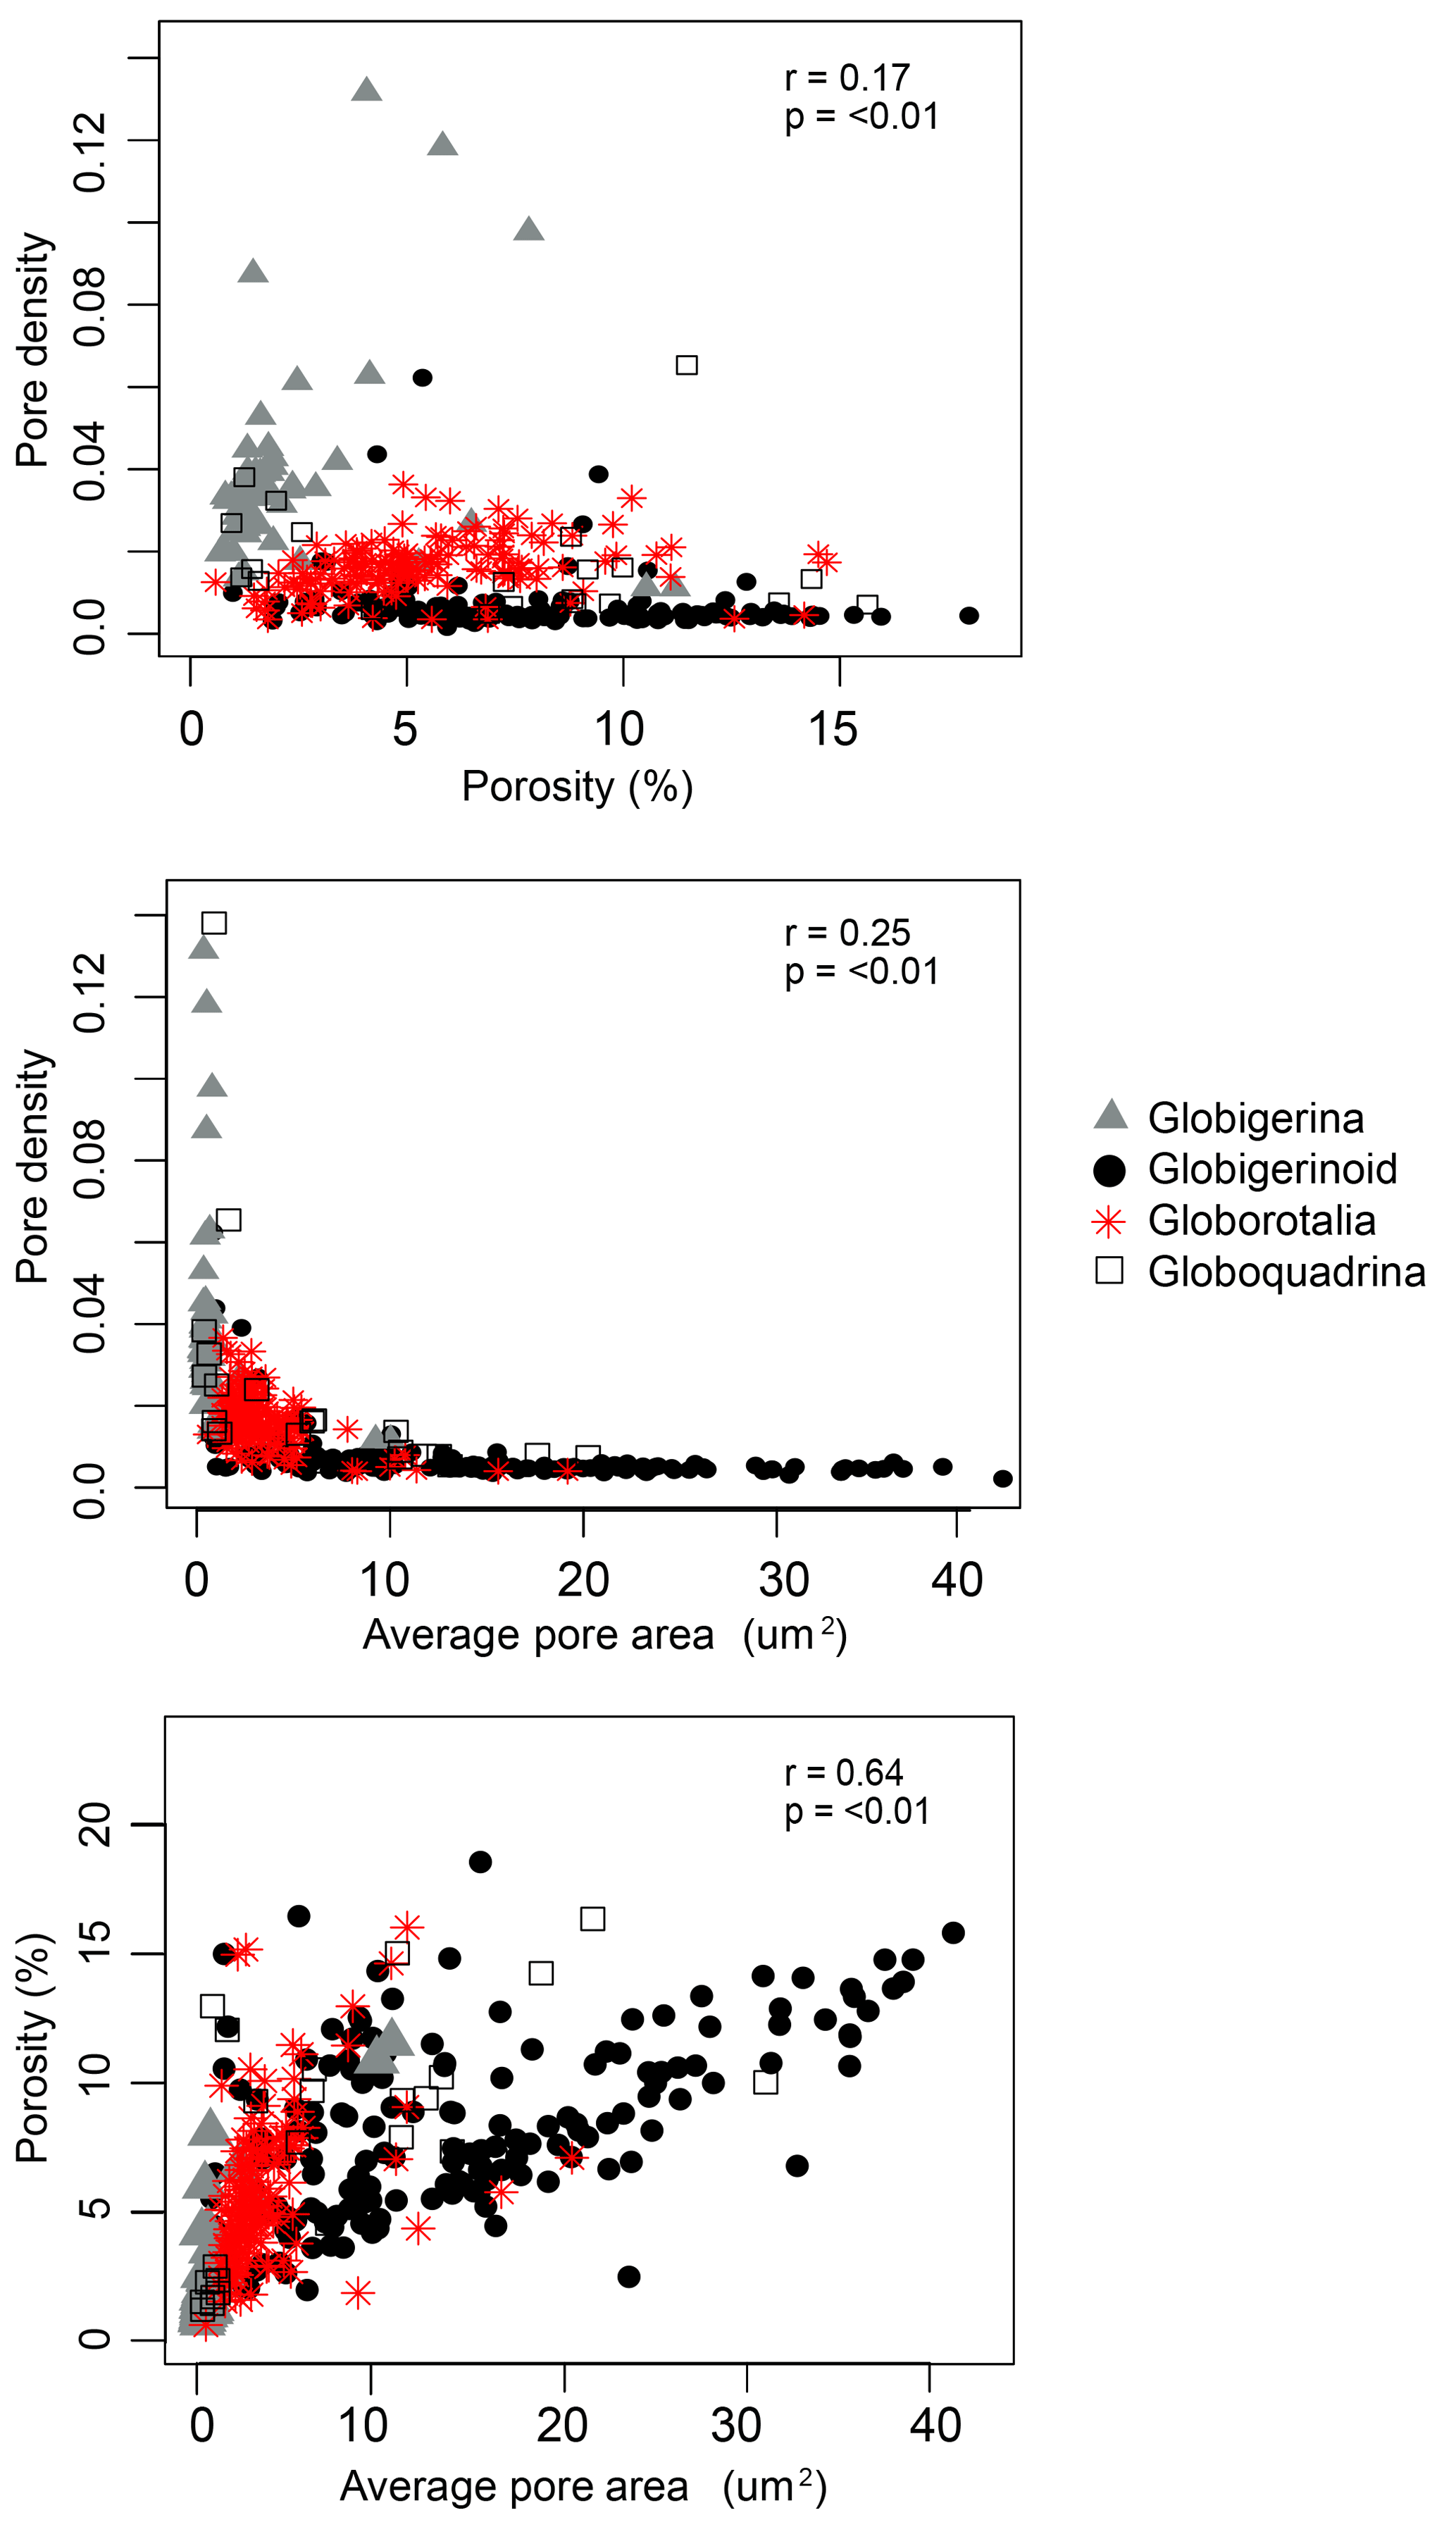
Figure 4Scatter plots of pore variables (with results of pairwise linear regressions) to visualize the relationship between pore variables.
Model residuals for all three pore characteristics were analyzed for phylogenetic signal using Pagel's lambda. The lambda value was 0.25 for porosity (p value = 0.52), 1.09 for pore density (p value = 0.17), and >0.01 for pore area (p value = 1). This means that there was no significant phylogenetic signal detected for any of the three pore characteristics at a 95 % confidence level. Even so, the lambda value of 1.09 for pore density indicates the presence of a phylogenetic signal at an 80 % confidence level for pore density.
3.2 Temperature effect on cultured Globigerinoides ruber
The temperature experiments resulted in statistically significant differences in terminal porosity (Figs. 5, S5) and test size. Average terminal porosity in low, medium, and high temperature were 4.37 % (1 standard deviation (SD) = 0.88 %), 8.21 % (1 SD = 1.33 %), and 11.49 % (1 SD = 0.91 %). The groups were all statistically different according to a one-way analysis of variance (ANOVA; F=57.10, p value < 0.01) and a pairwise Tukey's honest significant difference (HSD) post hoc test (p<0.001 in all pairwise comparisons). Measurements of pre- and post-culture porosity from CT scans show a trend toward the treatment-average porosity as chambers are accumulated (Fig. S5). In the high temperature treatment, pre-culture chambers all have porosities below 6 %, but final cultured chamber porosities of above 10 % by the end of the experiment. The specimens in the high temperature treatment also grew more chambers during their time in culture, with the high temperature group accumulating an average of 0.45 chambers per day versus 0.38 and 0.24 for the low and medium temperature groups, respectively. Average terminal test size in low, medium, and high temperature was 55 334 µm2 (1 SD = 17 500.6 µm2), 88 430 µm2 (1 SD = 32 268.3 µm2), and 103 394 µm2 (1 SD = 36 340.2 µm2), respectively. The groups were all statistically different according to a one-way ANOVA (F=93.57, p value < 0.001), and a pairwise Tukey's HSD post hoc test showed that only the high and low temperature groups were significantly different (p=0.03 pairwise comparison). Pre-culture measurements of test area and porosity were not significantly different between treatments (Fig. 5: F=1.18 and p>0.33 for test size, F=3.70 and p=0.06 for porosity), the high temperature treatment foraminifera accumulated more chambers and achieved larger terminal test sizes than the low temperature group, and the size-normalized porosity was still significantly higher in the high temperature group (Fig. 5).
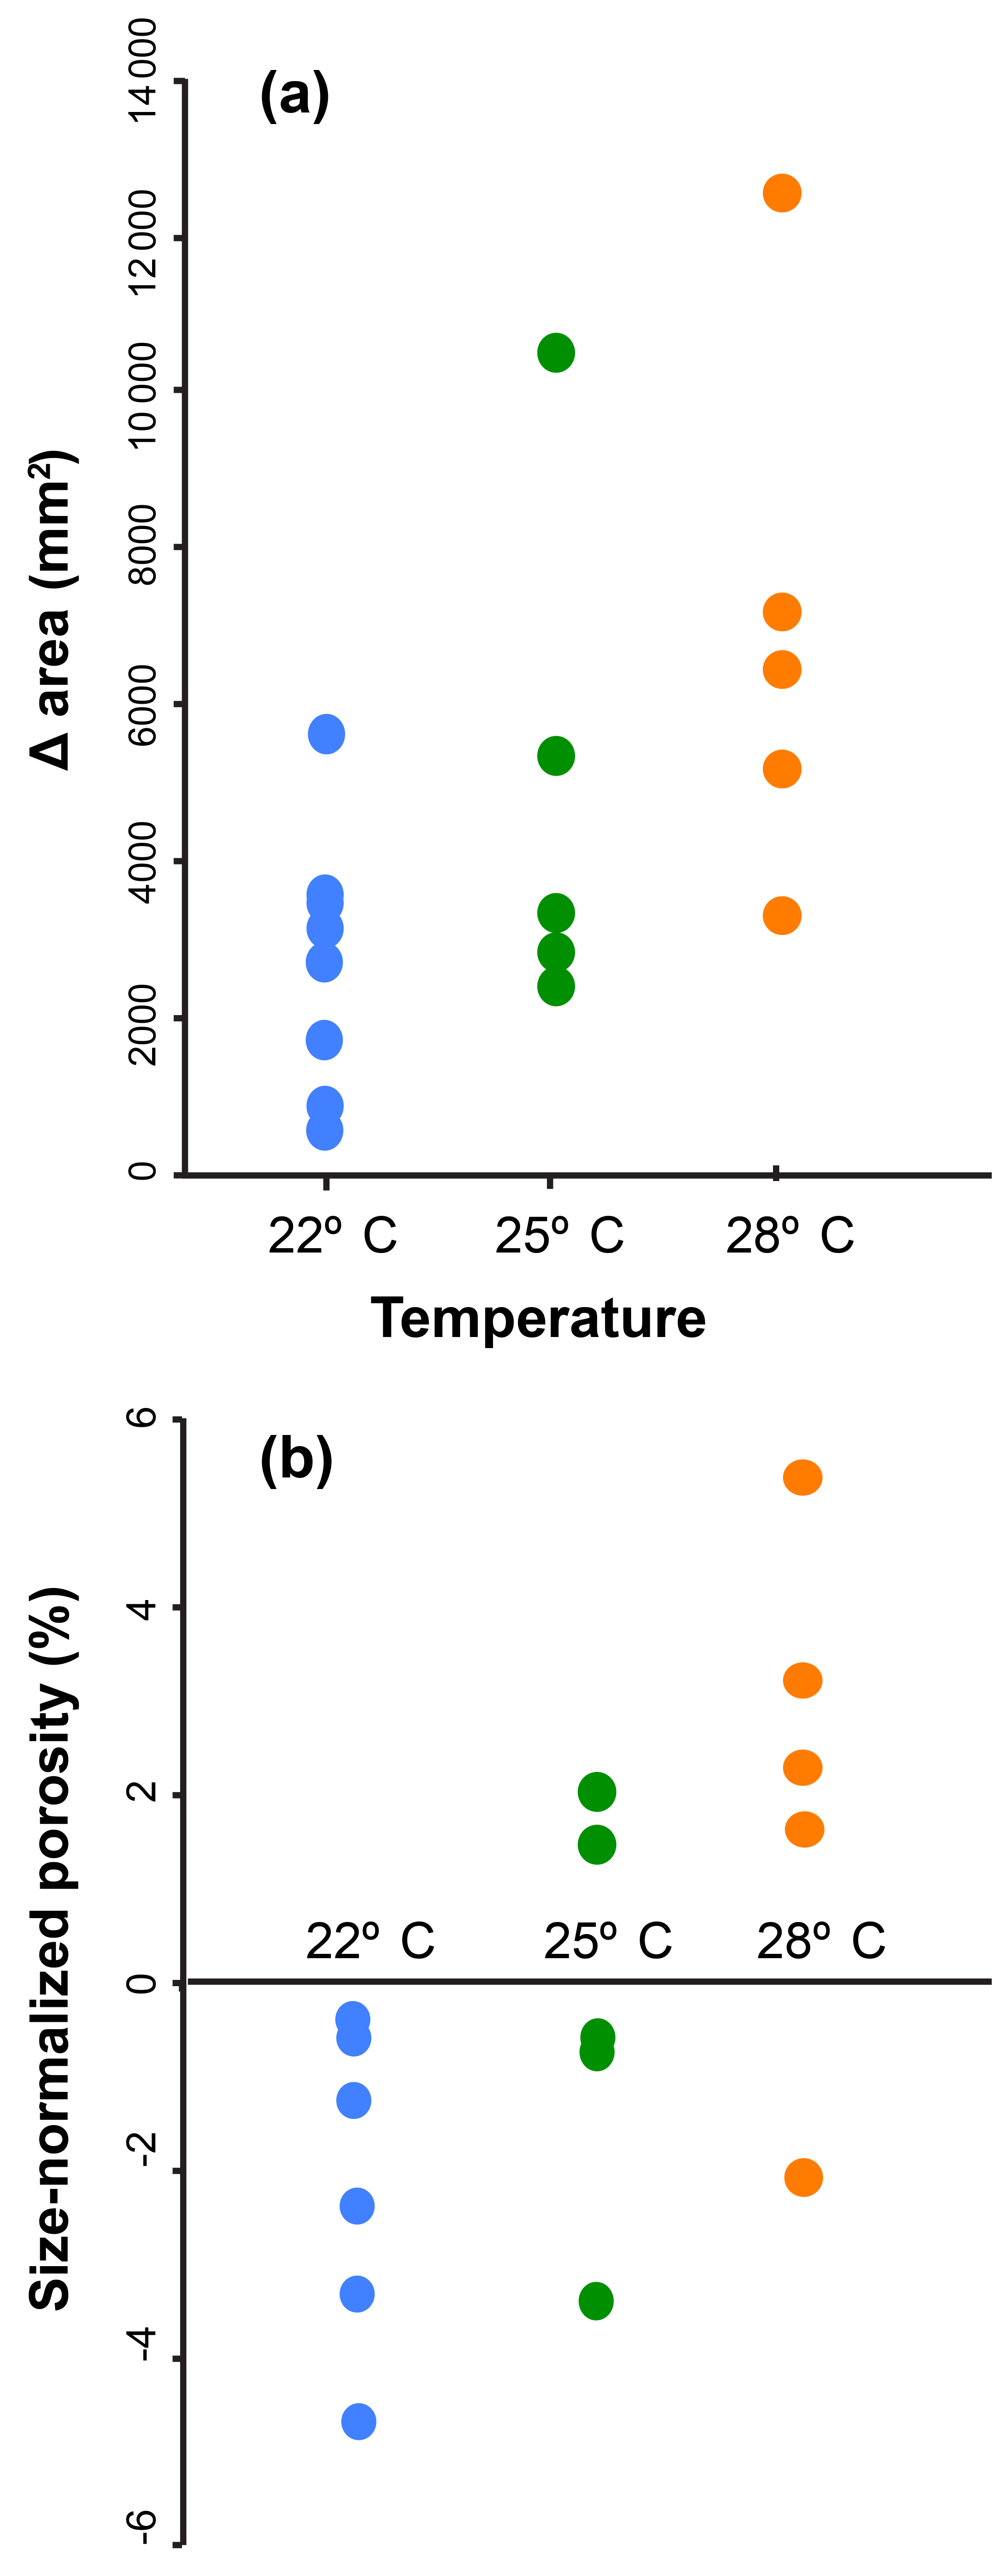
Figure 5Total test area and final chamber porosity of each cultured specimen of Globigerinoides ruber grouped by treatment temperature for (a) the total change in area before and after the experiment, and (b) size-normalized porosity of the final chamber.
Previous work on the pore characteristics of planktonic foraminifera identified a number of environmental and biological correlates which often covary in time and space (Bé, 1968; Bé et al., 1976, 1980; Hottinger and Dreher, 1974; Berthold, 1978; Leutenegger and Hansen, 1979; Caron, 1987a, b; Hemleben et al., 1989; Bijma et al., 1990; Moodley and Hess, 1992; Gupta and Machain-Castillo, 1992; Fisher et al., 2003; Glock et al., 2011; Kuroyanagi et al., 2013). Our study builds on existing work by simultaneously investigating the three major types of drivers that may account for pore variation: biology, environment, and evolutionary history. Two key conclusions emerge from the models and experiments: that the main predictors on the porosity of planktonic foraminifera are test surface area, test volume, and temperature (Fig. 3), and that both porosity and test size can be affected by changes in temperature during the life of an individual (Fig. 5).
Both size and temperature are known to have important effects on metabolism (Schmidt-Nielsen, 1984; Hochachka and Somero, 2002), although there is variability among and within species, on average metabolic rate scales with body mass to the power of 3∕4 in multicellular organisms (Kleiber, 1961; Schmidt-Nielson, 1984; Brown et al., 2004), and 2∕3 to 1 in protozoa (Caron et al., 1990; Agutter and Wheatley, 2004; Glazier, 2009). Overall size in planktonic foraminifera, similar to porosity, is smaller at high latitudes (Hecht, 1976; Schmidt et al., 2013). Size variation, including changes in size throughout ontogeny, has been linked to variation in stable isotope values and the incorporation of trace metals into test calcite, possibly relating to variation in metabolic rate (e.g., Schmidt et al., 2008). Similarly, temperature has a powerful effect on metabolism that can be characterized by the respiratory Q10 relationship – the factor by which an organism's respiration rate increases with a 10 ∘C increase in temperature. Estimates for the respiratory Q10 of symbiont-bearing planktonic foraminifera (specifically Globigerinoides ruber, Globigerinella siphonifera, and Orbulina universa) are approximately 3.18 (Lombard et al., 2009).
Table 3Magnitude of porosity increase with a 10 ∘C temperature increase, as inferred from regressions of average size-normalized porosity and sea surface temperature for core-top species that occurred at more than two localities. The size-normalized porosity average at 10 ∘C and 20 ∘C is listed, along with the factor by which porosity increases over this interval (Q10). See Fig. S6 for plots.
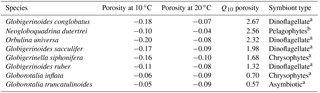
a Ezard et al. (2015). b Bird et al. (2018).
For single-celled organisms like planktonic foraminifera, the metabolisms of large individuals are diffusion limited compared to small individuals, as volume increases to the third power, but surface area to the second. This is supported by our findings, which suggest that surface area was by far the most important factor in the porosity model (Fig. 3). If porosity is reflecting metabolic rates, both should respond to temperature to a similar degree. To compare the temperature sensitivity of porosity with the respiratory and photosynthetic Q10 values (from Lombard et al., 2009), we calculated the change in size-normalized porosity with a 10 ∘C change in estimated ambient temperature (dubbed the Q10 of porosity; Table 3; Fig. S6). We found an increase in porosity with ambient temperature for six of the eight species found at more than one site (i.e., all species in Table 3 except Globorotalia inflata and Globorotalia truncatulinoides; Fig. S6). For those species, the Q10 of porosity varied from 1.3 to 2.3.
These porosity Q10 values are lower than the respiratory Q10 of 3.18 and the photosynthetic Q10 of 2.69 reported in Lombard et al. (2009). One reason for this might be that those measurements were taken from specimens exposed to sudden changes in temperature, which, as the authors noted, may result in higher sensitivity than that present in wild populations. Also, variation in the ratio of photosynthesis to respiration could play a role in the variation we see in the Q10 of porosity. While Lombard et al. (2009) found that, after normalizing for cell size, the respiratory and photosynthetic Q10 of their specimens was consistent among the three species examined (Globigerinella siphonifera, Globigerinoides ruber, and Orbulina universa). What did differ between the species was the net photosynthesis to respiration ratio (P:R). Specifically, this ratio was much lower in the chrysophyte-bearing Globigerinella siphonifera than the dinoflagellate bearers Orbulina universa and Globigerinoides ruber.
In Table 3, species are sorted by Q10 of porosity from highest to lowest, with the symbiont ecologies of each group noted. Here, we can see that the species with the highest Q10 is a surface dweller with dinoflagellate symbionts (Globigerinoides conglobatus). The species with the lowest Q10 (Globorotalia truncatulinoides) is asymbiotic with porosity that actually decreases with temperature. Additionally, the other species with a Q10 of less than 1 is Globorotalia inflata, which has chrysophyte symbionts. These deviations from expectation might be due to the fact that the ambient temperatures are approximated from yearly averages of temperature at estimated depth habitats. While we cannot conclude the extent of the relationship with our available data, the general trend of variation in Q10 of porosity roughly coinciding with symbiont ecology indicates that there may be some influence of photosynthesis or photosynthesis to respiration ratio on porosity.
Warmer water temperatures could lead to higher porosity for two reasons: warmer temperatures drive up metabolic rate and/or oxygen solubility and concentrations are lower in warmer water, necessitating higher rates of diffusion into the cell. For this reason, it was important to disentangle the effects of oxygen and temperature on porosity, and random forest models are specifically suited to dealing with such collinear variables. In all cases, oxygen was deemed less important than temperature and nearly all other variables considered. Our observations demonstrate that temperature is the underlying factor that drives the latitudinal trend in porosity observed by Bé (1968) at the species level. Indeed, our results show a similar trend at the assemblage level and the morphospecies level: a decrease in average porosity with increasing latitude once normalized for size (i.e., top-half surface area; see Figs. 6, S6). However, planktonic foraminifera species are known to inhabit characteristic biomes, and an alternative explanation for the apparent relationship between temperature and porosity could be that the change in porosity is driven by the turnover in species rather than temperature – in other words, by their shared evolutionary history. Three results argue against this alternative hypothesis. First, a phylogenetic signal was not found for porosity using Pagel's lambda. Second, morphogroup (a coarse, categorical approximation for evolutionary relationship) explained relatively little of the variance in porosity in our random forest models and conditional variable analysis. Third, a two-way ANOVA to test for independent and interactive effects of species identity and temperature on the porosities of foraminifera showed a much stronger effect of temperature (F=594.42, p<0.001) than the effect of species (F=7.28, p<0.001). There was a significant interaction effect between the two factors, indicating that the two are not independent (F=7.3, p<0.001), and that species with higher porosities do occur at lower latitudes, and vice versa.
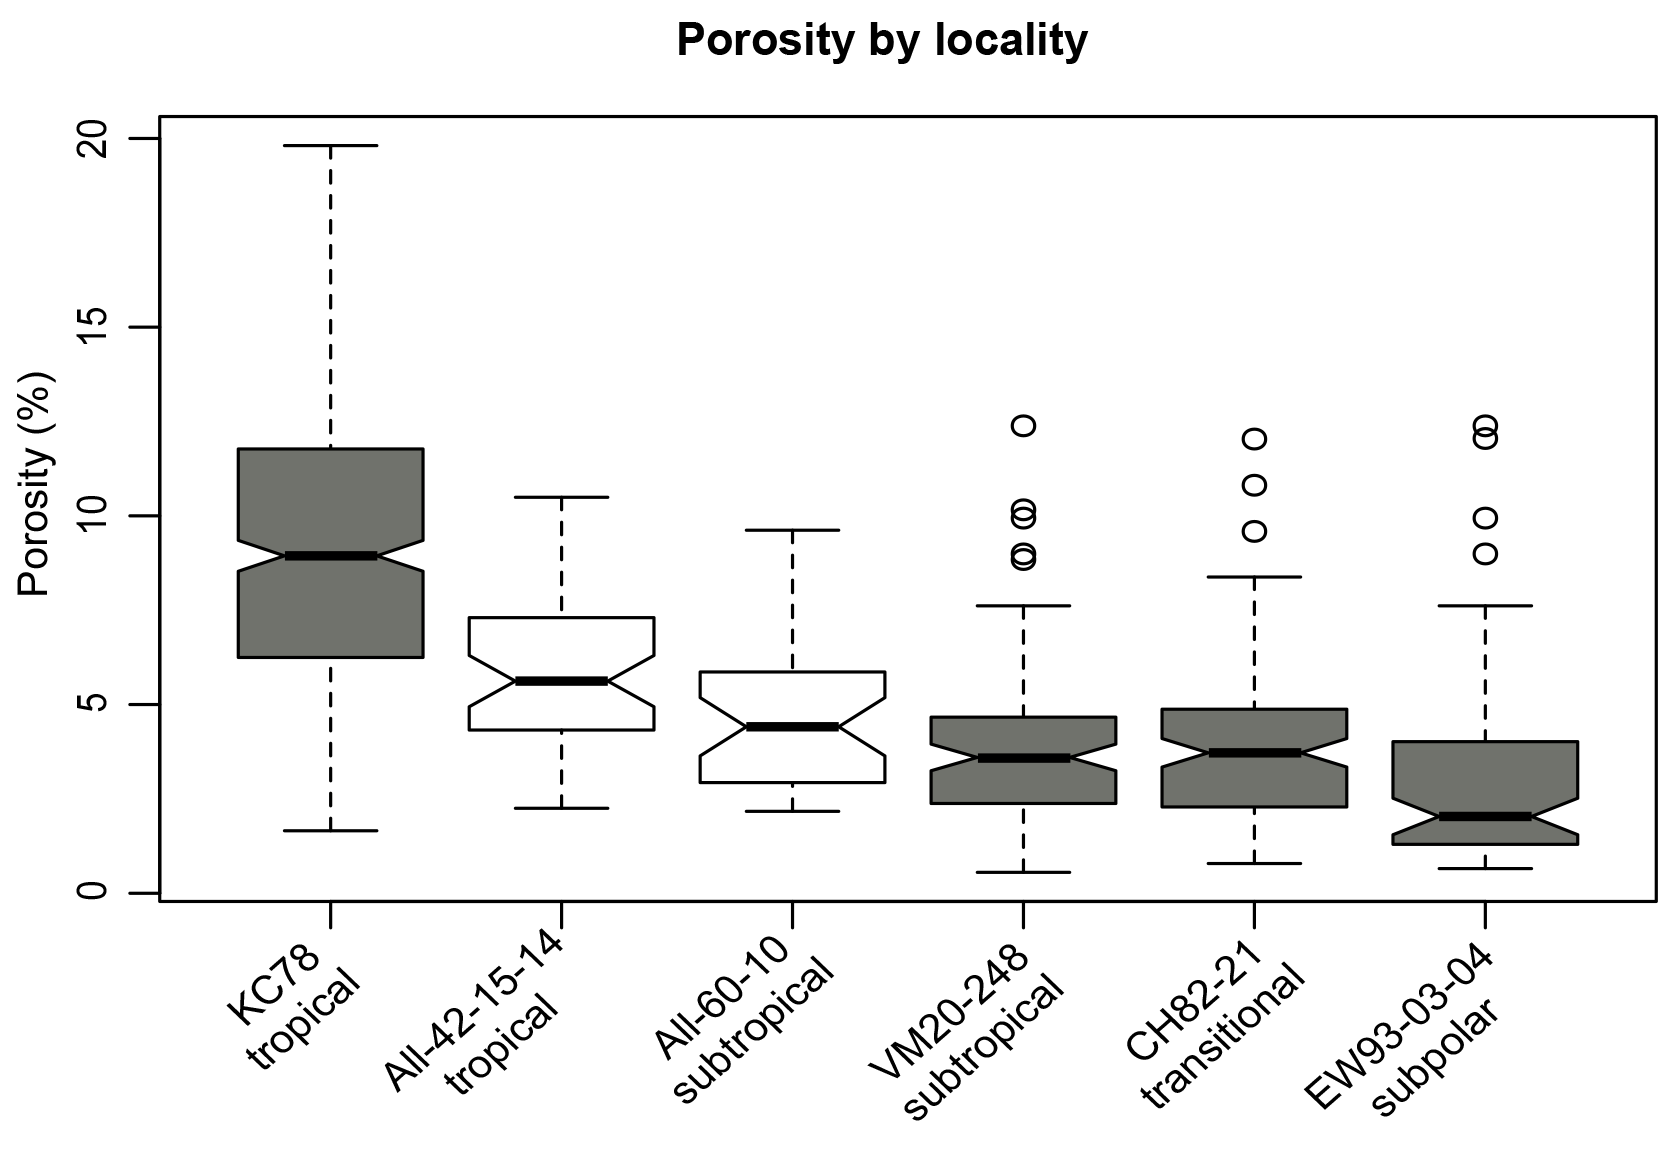
Figure 6Distribution of size-normalized porosity (%) values in each locality, arranged by latitude from lowest to highest. Grey boxes are samples from which a random split was taken, and white boxes were picked for specific species.
A second alternative explanation for the relationship between porosity and temperature is the presence of different cryptic species across localities. Differences in porosity have been observed among genetic species within two morphospecies complexes: Orbulina universa and Globigerinella siphonifera (Huber et al., 1997; de Vargas et al., 1999; Morard et al., 2009, 2013; Marshall et al., 2015; Weiner et al., 2015). In fact, it is the sole characteristic by which two cryptic species of Globigerinella siphonifera can be identified in empty tests (Huber et al., 1997). In Orbulina universa, variation in areal aperture density and placement distinguish among the three cryptic species, along with variation in wall thickness in Orbulina universa (Morard et al., 2009; Marshall et al., 2015). We examined this by culturing individuals of Globigerinoides ruber to test whether, and to what extent, porosity could vary based on environmental conditions at the time of chamber formation. We observed that individuals grown in the high temperature treatment became more porous and larger and accumulated more chambers in culture as compared to those individuals grown in the low temperature treatment (similar to the findings of Bijma et al., 1990) (Figs. 5, S6). The average porosity of the high temperature group is approximately 3 times higher than that of the lower temperature group. Our culturing results indicate that porosity is highly plastic and varies rapidly in response to temperature changes in Globigerinoides ruber. Similarly, Orbulina universa cultured under different oxygen concentrations showed variation in areal aperture size as large as that observed across genetic species (Kuroyanagi et al., 2013). Another environmental factor that may influence terminal sizes and metabolic function is the availability of food sources. Feeding frequency has been shown to influence terminal size and morphology (Bé, 1982; Hemleben et al., 1989), and may thus be expected to influence porosity as well. This factor is difficult to estimate for core-top assemblages, but can be tested with simple culture experiments and subsequent imaging.
Both culturing experiments point to the importance of environment in shaping the porosity of individuals, or ecophenotypy. Ecophenotypy in planktonic foraminifera has largely fallen out of favor as an explanation for variation in morphology, with the observations that ecophenotypes often align with different genetic complexes (Huber et al., 1997; de Vargas et al., 1999, 2001; Morard et al., 2009, 2013; Quillévéré et al., 2011; Marshall et al., 2015; Weiner et al., 2015). However, it is well established that the expression of any phenotypic trait is a product of both its genes and its environment (e.g., Visscher et al., 2008), with the heritability of a trait measuring the relative influence of genetics. In planktonic foraminifera, heritability has yet to be measured for any morphological trait, although it is likely to vary amongst traits as it does in all other organisms studied to date (Visscher et al., 2008). In this context, it is interesting to note that genetic species of planktonic foraminifera are often found in distinct environments (i.e., different biomes or different depth habitats) (Huber et al., 1997; de Vargas et al., 2001; Darling and Wade, 2008; Morard et al., 2009, 2013, 2016; Quillévéré et al., 2011). While evidence for high heritability of wall thickness and porosity is lacking, both porosity and wall thickness have been observed to vary with environmental conditions in culture and across environments gradients (this study; Colombo and Cita, 1980; Caron, 1987a, b; Bijma et al., 1990, 1999; Lea et al., 1999; Spero et al., 1997, 2015; Russell et al., 2004; Lombard et al., 2009; Kuroyanagi et al., 2013; Henehan et al., 2017). This raises the interesting possibility that some of the morphological differences between different genetic species are driven primarily by differences in the environment in which they occur, rather than by heritable genetic differences. While explanations of ecophenotypy have been dismissed in the past (Huber et al., 1997; Morard et al., 2009), our results suggest it should be seriously considered, at least for some traits like porosity, going forward.
Our results do show an evolutionary signal in some pore characteristics, but it is not the dominant factor in determining porosity. We find evidence for the importance of evolutionary history in determining pore density – one of the two factors that together determine porosity (the other being pore area). Random forest models found morphogroup to be the most important explanatory variable of pore density, although the conditional variance analysis attributed much of this explanatory power to a dependence on temperature (SST and ambient temperature). A Pagel's lambda of 1.09 for pore density on the model residuals likewise indicates a phylogenetic signal in the pore density data. Although this analysis was insignificant with α=0.1, we consider this finding important given the small sample size. For all three pore characteristics examined, pore density, pore area, and the resultant porosity, morphogroup does explain 12 %–20 % of the observed variation, so it is unsurprising that pore area has been such a useful trait for taxonomy. Similarly, the pairwise comparison of all three pore characteristics (Fig. 4) emphasizes the nonlinear relationship between pore density and pore area and the role of morphogroup in driving the bifurcating relationship between the two factors underlying porosity. However, when combined, the resulting porosity of an individual is more related to test surface area, test volume, and temperature than it is to evolutionary history.
Test porosity in planktonic foraminifera from core-top samples is primarily explained by test size and temperature. These two factors are key determinants of respiration rate, and therefore suggest that porosity could be closely linked to metabolic rate – likely through a role of porosity in allowing gas exchange across the test wall. Experimental manipulations of G. ruber in cultures show that both test size and chamber porosity are sensitive to temperature, and that porosity is a plastic trait that responds to conditions experienced at the time of chamber formation. These results suggest that porosity has the potential to be a metabolic proxy that could aid in the interpretation of geochemical data and paleoecological reconstructions.
The data used in this study are available in the tables in the Supplement associated with this article, as well as the Pangaea data repository (https://doi.pangaea.de/10.1594/PANGAEA.890092; Burke et al., 2018).
Detailed locality information for all samples used in this study is included in the Supplement Tables. The following samples used in this study are registered with IGSN identification codes: All-42-15-14 (WHO0006U5), CH82-21 (WHO0002A9), EW9303-04 (DSR00078R), VM20-248 (DSR00079L).
The supplement related to this article is available online at: https://doi.org/10.5194/bg-15-6607-2018-supplement.
JEB and PMH designed the study and drafted the manuscript. JEB and WR conducted the CT scanning of cultured specimens. MJH, LEE, JEB, CVD, AEM, PMH, and GLF cultured foraminifera used in this study, and JEB, PMH, and RS identified the species. JEB extracted and analyzed the data. All coauthors contributed to writing the manuscript.
The authors declare that they have no conflict of interest.
The authors of this manuscript would like to thank the following people for
help in completing this work: Jessica Utrup of the Yale Peabody Museum for
assistance in cataloging specimen images; Jessie Maisano at the University of
Texas and Dirk van der Marel at the Naturalis Biodiversity Center for help
obtaining CT scans; Leocadio Blanco-Bercial, Samantha de Putron, and the staff
at BIOS for use of laboratory space and equipment; Kaylea Nelson at the Yale
Center for Research Computing for assistance with the image analyses;
Bruce Corliss from the University of Rhode Island and Richard Norris from the
Scripps Institution of Oceanography for providing the core-top materials; and
Ellen Thomas and the members of the Hull Lab at Yale for feedback and
comments on the manuscript. Janet E. Burke was supported by the National
Science Foundation Graduate Research Fellowship under grant no. DGE-1122492
and Pincelli M. Hull by a Sloan Research Fellowship. Additional financial support for this
work was provided by the Cushman Foundation for Foraminiferal Research, the
Naturalis Biodiversity Center Martin Fellowship, the Bermuda Institute of
Ocean Sciences Grants-in-Aid of Research program, and the Yale Peabody
Museum.
Edited by: Hiroshi
Kitazato
Reviewed by: Anthony Rathburn and one anonymous
referee
Agutter, P. S. and Wheatley, D. N.: Metabolic scaling: consensus or controversy?, Theor. Biol. Med. Model., 1, https://doi.org/10.1186/1742-4682-1-13, 2004.
Anagnostou, E., John, E. H., Edgar, K. M., Foster, G. L., Ridgwell, A., Inglis, G. N., Pancost, R. D., Lunt, D. J., and Pearson, P. N.: Changing atmospheric CO2 concentration was the primary driver of early Cenozoic climate, Nature, 533, 380–384, 2016.
Aze, T., Ezard, T. H., Purvis, A., Coxall, H. K., Stewart, D. R., Wade, B. S., and Pearson, P. N.: A phylogeny of Cenozoic macroperforate planktonic foraminifera from fossil data, Biol. Rev., 86, 900–927, 2011.
Bé, A. W.: Shell porosity of Recent planktonic foraminifera as a climatic index, Science, 161, 881–884, 1968.
Bé, A.: Gametogenic calcification in a spinose planktonic foraminifer, Globigerinoides sacculifer (Brady), Mar. Micropaleontol., 5, 283–310, 1980.
Bé, A. W.: Biology of planktonic foraminifera, Studies in Geology, Notes for a Short Course, 6, 51–89, 1982.
Bé, A. W. and Duplessy, J.-C.: Subtropical convergence fluctuations and Quaternary climates in the middle latitudes of the Indian Ocean, Science, 194, 419–422, 1976.
Bé, A. W., Harrison, S. M., and Lott, L.: Orbulina universa d'Orbigny in the Indian Ocean, Micropaleontology, 19, 150–192, 1973.
Berthold, W.-U.: Ultrastrukturanalyse der endoplasmatischen Algen von Amphistegina lessonii d'Orbigny, Foraminifera (Protozoa) und ihre systematische Stellung, Arch. Protistenkd., 120, 16–62, 1978.
Bijma, J., Hemleben, C., Oberhaensli, H., and Spindler, M.: The effects of increased water fertility on tropical spinose planktonic foraminifers in laboratory cultures, J. Foramin. Res., 22, 242–256, 1992.
Bijma, J., Spero, H., and Lea, D.: Reassessing foraminiferal stable isotope geochemistry: Impact of the oceanic carbonate system (experimental results), in: Use of proxies in paleoceanography, Berlin, Heidelberg, Springer, 1999.
Birch, H. S., Coxall, H. K., Pearson, P. N., Kroon, D., and Schmidt, D. N.: Partial collapse of the marine carbon pump after the Cretaceous-Paleogene boundary, Geology, 44, 287–290, 2016.
Bird, C., Darling, K. F., Russell, A. D., Fehrenbacher, J. S., Davis, C. V., Free, A., and Ngwenya, B. T.: 16S rRNA gene metabarcoding and TEM reveals different ecological strategies within the genus Neogloboquadrina (planktonic foraminifer), PloS one, 13, e0191653, https://doi.org/10.1371/journal.pone.0191653, 2018.
Bolli, H. M., Beckmann, J.-P., and Saunders, J. B.: Benthic foraminiferal biostratigraphy of the south Caribbean region, Cambridge University Press, Cambridge, UK, 1994.
Boyer, A. G.: Consistent ecological selectivity through time in Pacific island avian extinctions, Conserv. Biol., 24, 511–519, 2010.
Brown, J. H., Gillooly, J. F., Allen, A. P., Savage, V. M., and West, G. B.: Toward a metabolic theory of ecology, Ecology, 85, 1771–1789, 2004.
Burke, J., Renema, W., Henehan, M. J., Elder, L. E., Davis, C. V., Maas, A. E., Foster, G. L., Schiebel, R., and Hull, P. M.: Factors influencing porosity in planktonic foraminifera, PANGAEA, https://doi.org/10.1594/PANGAEA.890092, 2018.
Caron, D. A., Anderson, O. R., Lindsey, J. L., Faber Jr, W. W., and Lim, E. L.: Effects of gametogenesis on test structure and dissolution of some spinose planktonic foraminifera and implications for test preservation, Mar. Micropaleontol., 16, 93–116, 1990.
Caron, D. A., Faber, W. W., and Bé, A. W.: Effects of temperature and salinity on the growth and survival of the planktonic foraminifer Globigerinoides sacculifer, J. Mar. Biol. Assoc. UK, 67, 323–341, 1987a.
Caron, D. A., Faber, W. W., and Bé, A. W.: Growth of the spinose planktonic foraminifer Orbulina universa in laboratory culture and the effect of temperature on life processes, J. Mar. Biol. Assoc. UK, 67, 343–358, 1987b.
Colombo, M. R. and Cita, M. B.: Changes in size and test porosity of Orbulina universa d'Orbigny in the Pleistocene record of Cape Bojador (DSDP Site 397, Eastern North Atlantic), Mar. Micropaleontol., 5, 13–29, 1980.
Constandache, M., Yerly, F., and Spezzaferri, S.: Internal pore measurements on macroperforate planktonic Foraminifera as an alternative morphometric approach, Swiss J. Geosci., 106, 179–186, 2013.
Cutler, D. R., Edwards, T. C., Beard, K. H., Cutler, A., Hess, K. T., Gibson, J., and Lawler, J. J.: Random forests for classification in ecology, Ecology, 88, 2783–2792, 2007.
Darling, K. F. and Wade, C. M.: The genetic diversity of planktic foraminifera and the global distribution of ribosomal RNA genotypes, Mar. Micropaleontol., 67, 216–238, 2008.
Davidson, A. D., Hamilton, M. J., Boyer, A. G., Brown, J. H., and Ceballos, G.: Multiple ecological pathways to extinction in mammals, P. Natl. Acad. Sci USA, 106, 10702–10705, 2009.
de Vargas, C., Norris, R., Zaninetti, L., Gibb, S. W., and Pawlowski, J.: Molecular evidence of cryptic speciation in planktonic foraminifers and their relation to oceanic provinces, P. Natl. Acad. Sci USA, 96, 2864–2868, 1999.
de Vargas, C., Renaud, S., Hilbrecht, H., and Pawlowski, J.: Pleistocene adaptive radiation in Globorotalia truncatulinoides: genetic, morphologic, and environmental evidence, Paleobiology, 27, 104–125, 2001.
Erez, J.: Calcification rates, photosynthesis and light in planktonic foraminifera, in: Biomineralization and biological metal accumulation, Springer, 1983.
Evans, J. S., Murphy, M. A., Holden, Z. A., and Cushman, S. A.: Modeling species distribution and change using random forest, in: Predictive species and habitat modeling in landscape ecology, Springer, 2011.
Ezard, T. H., Edgar, K. M., and Hull, P. M.: Environmental and biological controls on size-specific δ13C and δ18O in recent planktonic foraminifera, Paleoceanography, 30, 151–173, 2015.
Fisher, C. G., Sageman, B. B., Asure, S. E., Acker, B., and Mahar, Z.: Planktic Foraminiferal Porosity Analysis as a Tool for Paleoceanographic Reconstruction, Mid-Cretaceous Western Interior Sea, Palaios, 18, 34–46, 2003.
Frerichs, W. E., Heiman, M. E., Borgman, L. E., and Bé, A. W. H.: Latitudinal Variations in Planktonic Foraminiferal Test Porosity Part 1. Optical Studies, J. Foramin. Res., 2, 6–13, 1972.
Garcia, H. E., Locarnini, R. A., Boyer, T. P., Antonov, J. I., Baranova, O. K., Zweng, M. M., Reagan, J. R., and Johnson, D. R.: World Ocean Atlas 2013, Vol. 3, Dissolved Oxygen, Apparent Oxygen Utilization, and Oxygen Saturation, NOAA Atlas NESDIS, 75, 2013.
Glazier, D. S.: Activity affects intraspecific body-size scaling of metabolic rate in ectothermic animals, J. Comp. Physiol. B, 179, 821–828, 2009.
Glock, N., Eisenhauer, A., Milker, Y., Liebetrau, V., Schönfeld, J., Mallon, J., Sommer, S., and Hensen, C.: Environmental influences on the pore density of Bolivina spissa (Cushman), J. Foramin. Res., 41, 22–32, 2011.
Hecht, A. D.: An ecologic model for test size variation in Recent planktonic foraminifera; applications to the fossil record, J. Foramin. Res., 6, 295–311, 1976.
Hemleben, C., Spindler, M., and Anderson, O. R.: Modern planktonic foraminifera, Springer Science & Business Media, 1989.
Henehan, M. J., Evans, D., Shankle, M., Burke, J. E., Foster, G. L., Anagnostou, E., Chalk, T. B., Stewart, J. A., Alt, C. H. S., Durrant, J., and Hull, P. M.: Size-dependent response of foraminiferal calcification to seawater carbonate chemistry, Biogeosciences, 14, 3287–3308, https://doi.org/10.5194/bg-14-3287-2017, 2017.
Hochachka, P. a. G. N. S.: Biochemical Adaptation, Mechanism and Process in Physiological Evolution Oxford University Press, New York, USA, 2002.
Hottinger, L. and Dreher, D.: Differentiation of protoplasm in Nummulitidae (foraminifera) from Elat, Red Sea, Mar. Biol., 25, 41–61, 1974.
Hsiang, A. Y., Elder, L. E., and Hull, P. M.: Towards a morphological metric of assemblage dynamics in the fossil record: a test case using planktonic foraminifera, Phil. Trans. R. Soc. B, 371, 20150227, https://doi.org/10.1098/rstb.2015.0227, 2016.
Hsiang, A. Y., Nelson, K., Elder, L. E., Sibert, E. C., Kahanamoku, S. S., Burke, J. E., Kelly, A., Liu, Y., and Hull, P. M.: AutoMorph: Accelerating morphometrics with automated 2D and 3D image processing and shape extraction, Methods Ecol. Evol., https://doi.org/10.1111/2041-210X.12915, 2017.
Huber, B. T., Bijma, J., and Darling, K.: Cryptic speciation in the living planktonic foraminifer Globigerinella siphonifera (d'Orbigny), Paleobiology, 23, 33–62, 1997.
Kennett, J. P. and Srinivasan, M.: Neogene planktonic foraminifera: a phylogenetic atlas, Hutchinson Ross, 1983.
Kleiber, M.: The fire of life. An introduction to animal energetics, The fire of life, An introduction to animal energetics, 1961.
Kuhnt, T., Schiebel, R., Schmiedl, G., Milker, Y., Mackensen, A., and Friedrich, O.: Automated and manual analyses of the pore density-to-oxygen relationship in Globobulimina turgida (Bailey), J. Foramin. Res., 44, 5–16, 2014.
Kuroyanagi, A., da Rocha, R. E., Bijma, J., Spero, H. J., Russell, A. D., Eggins, S. M., and Kawahata, H.: Effect of dissolved oxygen concentration on planktonic foraminifera through laboratory culture experiments and implications for oceanic anoxic events, Mar. Micropaleontol., 101, 28–32, 2013.
Lamont-Doherty: Sample EW-9303-04, IGSN: DSR00078R.
Lamont-Doherty: Sample VM20-248, IGSN: DSR00079L.
Lea, D. W., Mashiotta, T. A., and Spero, H. J.: Controls on magnesium and strontium uptake in planktonic foraminifera determined by live culturing, Geochim. Cosmochim. Ac., 63, 2369–2379, 1999.
Leutenegger, S. and Hansen, H.: Ultrastructural and radiotracer studies of pore function in foraminifera, Mar. Biol., 54, 11–16, 1979.
Locarnini, R. A., Mishonov, A. V., Antonov, J. I., Boyer, T. P., Garcia, H. E., Baranova, O. K., Zweng, M. M., Paver, C. R., Reagan, J. R., Johnson, D. R., Hamilton, M., and Seidov, D.: World Ocean Atlas 2013, Volume 1: Temperature, edited by: Levitus, S., A. Mishonov Technical Ed., NOAA Atlas NESDIS 73, 40 pp., 2013.
Lombard, F., Erez, J., Michel, E., and Labeyrie, L.: Temperature effect on respiration and photosynthesis of the symbiont-bearing planktonic foraminifera Globigerinoides ruber, Orbulina universa, and Globigerinella siphonifera, Limnol. Oceanogr., 54, 210–218, 2009.
Malmgren, B. and Healy-Williams, N.: Variation in test diameter of Orbulina universa in the paleoclimatology of the late Quaternary of the Gulf of Mexico, Palaeogeogr. Palaeocl., 25, 235–240, 1978.
Marshall, B. J., Thunell, R. C., Spero, H. J., Henehan, M. J., Lorenzoni, L., and Astor, Y.: Morphometric and stable isotopic differentiation of Orbulina universa morphotypes from the Cariaco Basin, Venezuela, Mar. Micropaleontol., 120, 46–64, 2015.
Marszalek, D. S.: The role of heavy skeletons in vertical movements of non-motile zooplankton, Mar. Freshw. Behav. Phy, 8, 295–303, 1982.
Morard, R., Quillévéré, F., Escarguel, G., de Garidel-Thoron, T., de Vargas, C., and Kucera, M.: Ecological modeling of the temperature dependence of cryptic species of planktonic Foraminifera in the Southern Hemisphere, Palaeogeogr. Palaeocl., 391, 13–33, 2013.
Morard, R., Quillévéré, F., Escarguel, G., Ujiie, Y., de Garidel-Thoron, T., Norris, R. D., and de Vargas, C.: Morphological recognition of cryptic species in the planktonic foraminifer Orbulina universa, Mar. Micropaleontol., 71, 148–165, 2009.
Morard, R., Reinelt, M., Chiessi, C. M., Groeneveld, J., and Kucera, M.: Tracing shifts of oceanic fronts using the cryptic diversity of the planktonic foraminifera Globorotalia inflata, Paleoceanography, 31, 1193-1205, 2016.
Pagel, M.: Inferring the historical patterns of biological evolution, Nature, 401, 877–884, 1999.
Qianyu, L. and Radford, S. S.: Evolution and biogeography of Paleogene microperforate planktonic foraminifera, Palaeogeogr. Palaeocl., 83, 87–115, 1991.
Quillevere, F., Morard, R., Escarguel, G., Douady, C. J., Ujiié, Y., De Garidel-Thoron, T., and de Vargas, C.: Global scale same-specimen morpho-genetic analysis of Truncorotalia truncatulinoides: A perspective on the morphological species concept in planktonic foraminifera, Palaeogeogr. Palaeocl., 391, 2–12, 2013.
Ravelo, A. and Fairbanks, R.: Carbon isotopic fractionation in multiple species of planktonic foraminifera from core-tops in the tropical Atlantic, J. Foramin. Res., 25, 53–74, 1995.
Russell, A. D., Hönisch, B., Spero, H. J., and Lea, D. W.: Effects of seawater carbonate ion concentration and temperature on shell U, Mg, and Sr in cultured planktonic foraminifera, Geochim. Cosmochim. Ac., 68, 4347–4361, 2004.
Schiebel, R. and Hemleben, C.: Planktic Foraminifers in the Modern Ocean, Springer, 2017.
Schmidt, D., Elliott, T., and Kasemann, S.: The influences of growth rates on planktic foraminifers as proxies for palaeostudies – a review, Geol. Soc. Spec. Publ., 303, 73–85, 2008.
Schmidt, D. N., Rayfield, E. J., Cocking, A., and Marone, F.: Linking evolution and development: Synchrotron Radiation X-ray tomographic microscopy of planktic foraminifers, Palaeontology, 56, 741–749, 2013.
Schmidt-Nielsen, K.: Scaling: why is animal size so important?, Cambridge Uninversity Press, Cambridge, UK, 1984.
Schneider, C. A., Rasband, W. S., and Eliceiri, K. W.: NIH Image to ImageJ: 25 years of image analysis, Nat. Methods, 9, 671–675, 2012.
Spero, H. J., Bijma, J., Lea, D. W., and Bemis, B. E.: Effect of seawater carbonate concentration on foraminiferal carbon and oxygen isotopes, Nature, 390, 497–500, 1997.
Spero, H. J., Lerche, I., and Williams, D. F.: Opening the carbon isotope “vital effect” black box, 2, quantitative model for interpreting foraminiferal carbon isotope data, Paleoceanography, 6, 639–655, 1991.
Spero, H. J., Eggins, S. M., Russell, A. D., Vetter, L., Kilburn, M. R., and Hönisch, B.: Timing and mechanism for intratest Mg∕Ca variability in a living planktic foraminifer, Earth Planet. Sc. Lett., 409, 32–42, 2015.
Strobl, C., Boulesteix, A.-L., Kneib, T., Augustin, T., and Zeileis, A.: Conditional variable importance for random forests, BMC Bioinformatics, 9, 307, https://doi.org/10.1186/1471-2105-9-307, 2008.
Visscher, P. M., Hill, W. G., and Wray, N. R.: Heritability in the genomics era-concepts and misconceptions, Nat. Rev. Gen., 9, 255–266, 2008.
Weiner, A. K., Weinkauf, M. F., Kurasawa, A., Darling, K. F., and Kucera, M.: Genetic and morphometric evidence for parallel evolution of the Globigerinella calida morphotype, Mar. Micropaleontol., 114, 19–35, 2015.
Wiles, W. W.: Pleistocene changes in the pore concentration of a planktonic foraminiferal species from the Pacific Ocean, Prog. Oceanogr., 4, 153–160, 1965.
Wolf-Gladrow, D. A., Riebesell, U., Burkhardt, S., and Buma, J.: Direct effects of CO2 concentration on growth and isotopic composition of marine plankton, Tellus B, 51, 461–476, 1999.
Woods Hole Oceanographic Institute: Sample AII-42-15-14, IGSN: WHO0006U5.
Woods Hole Oceanographic Institute: Sample CH-82-21, IGSN: WHO0002A9.
Zeebe, R. E., Bijma, J., and Wolf-Gladrow, D. A.: A diffusion-reaction model of carbon isotope fractionation in foraminifera, Mar. Chem., 64, 199–227, 1999.