the Creative Commons Attribution 4.0 License.
the Creative Commons Attribution 4.0 License.
 | 19 Nov 2018
Leaf area index identified as a major source of variability in modeled CO2 fertilization
Qianyu Li
Xingjie Lu
Yingping Wang
Xin Huang
Peter M. Cox
The concentration–carbon feedback (β), also called the CO2 fertilization effect, is a key unknown in climate–carbon-cycle projections. A better understanding of model mechanisms that govern terrestrial ecosystem responses to elevated CO2 is urgently needed to enable a more accurate prediction of future terrestrial carbon sink. We conducted C-only, carbon–nitrogen (C–N) and carbon–nitrogen–phosphorus (C–N–P) simulations of the Community Atmosphere Biosphere Land Exchange model (CABLE) from 1901 to 2100 with fixed climate to identify the most critical model process that causes divergence in β. We calculated CO2 fertilization effects at various hierarchical levels from leaf biochemical reaction and leaf photosynthesis to canopy gross primary production (GPP), net primary production (NPP), and ecosystem carbon storage (cpool) for seven C3 plant functional types (PFTs) in response to increasing CO2 under the RCP 8.5 scenario. Our results show that β values at biochemical and leaf photosynthesis levels vary little across the seven PFTs, but greatly diverge at canopy and ecosystem levels in all simulations. The low variation of the leaf-level β is consistent with a theoretical analysis that leaf photosynthetic sensitivity to increasing CO2 concentration is almost an invariant function. In the CABLE model, the major jump in variation of β values from leaf levels to canopy and ecosystem levels results from divergence in modeled leaf area index (LAI) within and among PFTs. The correlation of βGPP, βNPP, or βcpool each with βLAI is very high in all simulations. Overall, our results indicate that modeled LAI is a key factor causing the divergence in β in the CABLE model. It is therefore urgent to constrain processes that regulate LAI dynamics in order to better represent the response of ecosystem productivity to increasing CO2 in Earth system models.
- Article
(2798 KB) - Full-text XML
-
Supplement
(6261 KB) - BibTeX
- EndNote


Terrestrial ecosystems absorb roughly 30 % of anthropogenic CO2 emissions, and is of great uncertainty and vulnerable to global climate change (Cox et al., 2000; Le Quéré et al., 2018). Persistent increase in atmospheric CO2 concentration will stimulate plant growth and ecosystem carbon storage, forming a negative feedback to CO2 concentration (Long et al., 2004; Friedlingstein et al., 2006; Canadell et al., 2007). This concentration–carbon feedback (β), also called the CO2 fertilization effect, has been identified as a major uncertainty in modeling terrestrial carbon-cycle response to historical climate change (Huntzinger et al., 2017). In the Coupled Model Intercomparison Project (C4MIP) and the Coupled Model Intercomparison Project Phase 5 (CMIP5), all models agree that terrestrial carbon sink will gradually saturate in the future but disagree on the magnitude of β (Friedlingstein et al., 2006, 2015; Arora et al., 2013). Some studies pointed out that the contribution of β is 4 to 4.5 times larger, and more uncertain, than climate–carbon feedback (γ) (Gregory et al., 2009; Bonan and Levis, 2010; Arora et al., 2013). Apart from the substantial uncertainty across different models, Smith et al. (2016) suggested that Earth system models (ESMs) in CMIP5 overestimate global terrestrial β values compared with remote sensing data and Free-Air CO2 Enrichment (FACE) experimental results. Though satellite products they used may underestimate the effect of CO2 fertilization on net primary productivity (De Kauwe et al., 2016), the large disparity between models and FACE experiments gives us little confidence in making policies to combat global warming.
The response of the ecosystem carbon cycle to elevated CO2 (eCO2) is primarily driven by stimulation of leaf-level carboxylation rate in plants (Polglase and Wang, 1992; Long et al., 2004; Heimann et al., 2008). The CO2 stimulation of carboxylation then translates into increasing gross primary production (GPP) and net primary production (NPP), possibly leading to increased biomass and soil carbon storage and slowing down anthropogenically driven increase in atmospheric CO2 (Canadell et al., 2007; Iversen et al., 2012). The leaf-level CO2 fertilization for C3 plants is generally well characterized with models from Farquhar et al. (1980), and the basic biochemical mechanisms have been adopted by most land-surface models, although some models implement variants of Farquhar et al. (1980) (Rogers et al., 2016). Previous research with both theoretical analysis and data synthesis from a large number of experiments has revealed that normalized CO2 sensitivity of leaf-level photosynthesis, which represents kinetics sensitivity of photosynthetic enzymes, varies little among different C3 species at a given CO2 concentration (Luo and Mooney, 1996; Luo et al., 1996). However, the CO2 fertilization effects are considerably more variable at canopy and ecosystem level than at the leaf level, because a cascade of uncertain processes, such as soil moisture feedback (Fatichi et al., 2016), canopy scaling (Rogers et al., 2016), nutrient limitation (Zaehle et al., 2014), allocation (De Kauwe et al., 2014), and carbon turnover process (Friend et al., 2014), influences the responses of GPP, NPP and carbon storage. Therefore, understanding which processes in ecosystem models amplify the variability in β from biochemical and leaf levels to canopy and ecosystem levels is quite important.
Leaf area index (LAI) largely affects canopy assimilation and plant growth under eCO2. Many satellite products exhibit increasing trends of LAI over the past 30 years, although marked disparity still exists among these products (Jiang et al., 2017). Zhu et al. (2016) have attributed global increases in satellite LAI primarily to increased CO2 concentration. LAI plays a key role in scaling leaf-level biogeophysical and biogeochemical processes to global-scale responses in ecosystem models, and the representation of LAI in models causes large uncertainty (Ewert, 2004; Hasegawa et al., 2017). Models generally predict that LAI dynamics will respond to eCO2 positively due to enhanced NPP and leaf biomass (De Kauwe et al., 2014). But how the increasing LAI in turn feeds back to ecosystem carbon uptake as a result of more light interception has not been discussed in previous research. The relative contributions of the leaf-level photosynthesis and LAI to modeled β have rarely been quantified and compared.
The CO2 fertilization effects depend on locations, vegetation types and soil nutrient conditions. The strongest absolute CO2 fertilization effect has been found in tropical and temperate forests where the larger biomass presents than other regions. In comparison, the weakest response to eCO2 occurs in boreal forests (Joos et al., 2001; Peng et al., 2014). But with gradual eCO2, relative response in tropical forests might not be very high owing to light limitation caused by canopy closure (Norby et al., 2005). In addition, β might be overestimated by the neglect of nitrogen (N) limitations on plant growth (Luo et al., 2004; Thornton et al., 2009; Coskun et al., 2016). Several lines of evidence suggest that N availability also influences decomposition of soil organic matter (Hunt et al., 1988; Neff et al., 2002; Averill et al., 2016). β will be reduced by 50 %–78 % in C–N coupled simulations compared with C-only simulations in land-surface models (Thornton et al., 2007; Sokolov et al., 2008; Zaehle et al., 2010). Inadequate phosphorus (P) will also constrain terrestrial carbon uptake, especially in tropical areas (Aerts and Chapin, 2000; Vitousek et al., 2010). It is reported that N limitation on carbon uptake is significant in boreal ecosystems, while P limitation has a profound influence in tropical ecosystems in the CASA-CNP model (Wang et al., 2010). However, whether N and P limitations affect the variability of β across different vegetation types at different hierarchical levels from biochemistry to ecosystem carbon storage has not been carefully examined.
In this study, we tried to answer the following questions: how does variability, as measured by the coefficient of variation (CV) within and across different plant functional types (PFTs), in the CO2 fertilization effect change at different hierarchical levels from leaf to canopy GPP, ecosystem NPP and total carbon storage levels? What is the most important process causing the variability of β for different geographical locations and PFTs? How do nutrient limitations influence the variability of β at different hierarchical levels? We used the Community Atmosphere Biosphere Land Exchange model (CABLE) to identify key mechanisms driving diverse β values under the RCP 8.5 scenario.
2.1 CABLE model description
CABLE (version 2.0) is the Australian community land-surface model (Kowalczyk et al., 2006) and incorporates CASA-CNP to simulate global carbon (C), nitrogen (N) and phosphorus (P) cycles (Wang et al., 2010, 2011). Leaf photosynthesis, stomatal conductance, and heat and water transfer in CABLE are calculated using the two-leaf approach (Wang and Leuning, 1998) for both sunlit leaves and shaded leaves. The descriptions of the photosynthesis module are in Supplement S1.
Leaf area index (LAI) is calculated as
where Cleaf is leaf carbon pool and SLA is specific leaf area.
In the CABLE model, leaf growth is divided into four phases. Phase 1 is from leaf budburst to the beginning of steady leaf growth, phase 2 is from the start of steady leaf growth to the start of leaf senescence, phase 3 is the period of leaf senescence, and phase 4 is from the end of leaf senescence to the start of leaf bud burst. During phase 1, allocation of available carbon to leaf is fixed to 0.8, and allocations to wood and root are set to 0.1 for woody biomes and 0 and 0.2, respectively, for non-woody biomes. During steady leaf growth (phase 2), the allocation coefficients are constants but vary from biome to biome, taking their values from Fung et al. (2005). During phases 3 and 4, the leaf allocation is zero and available carbon is divided between wood and root in proportion to their allocation coefficients. For evergreen biomes, leaf phenology remains at phase 2 throughout the year (Wang et al., 2010). SLA is PFT-specific and does not change through time in this study.
GPP is the sum of canopy net photosynthesis rate (A) and day respiration (Rd). NPP is calculated as the difference between GPP and autotrophic respiration (Ra) (including maintenance and growth respiration), and acts as an input to the compartmental nine-pool carbon-cycle model. The network for carbon transfer in the compartmental model is based on the CASA' model (Fung et al., 2005), including three vegetation pools (leaf, wood and root), three litter pools (metabolic litter, structure litter and coarse wood debris), and three soil pools (fast soil pool, slow soil pool and passive soil pools). Heterotrophic soil respiration (Rh) is calculated as the sum of the respired CO2 from the decomposition of all litter and soil organic carbon pools (Wang et al., 2010).
Wang et al. (2012) and Zhang et al. (2013) provided details explaining how nutrient limitations are incorporated into the carbon cycle in the CASA-CNP module in the CABLE model. In brief, NPP is calculated as
where LAI represents leaf area index, and Vcmax and Jmax are maximum carboxylation rate and maximum rate of electron transport of the top leaves, respectively; both are linearly dependent on leaf N (g N m−2) according to the relationships developed by Kattge et al. (2009) for different plant functional types. Rmi is maintenance respiration rate of plant tissue (i: leaf, wood and root), contingent on nitrogen amount in each part of the plant. Rg is growth respiration, which is described as a function of leaf nitrogen to phosphorus ratio. Heterotrophic respiration (Rh) is limited by the mineral N pool required for microbial soil carbon decomposition (Wang et al., 2010). Net ecosystem productivity (NEP = GPP − Ra − Rh) is the amount of carbon that is either sequestered or lost from ecosystems, and is controlled by N and P availability via abovementioned C–N–P interactions.
2.2 Experimental design
CABLE was run from 1901 to 2100 for C-only, C–N and C–N–P modes. C-only simulation was designed to identify the key carbon-cycle processes that influence the variability of the CO2 fertilization effects. C–N and C–N–P simulations were run to explore how nutrients affect the patterns of and mechanisms underlying the variability of the CO2 fertilization effects. The respective effects of N and P can be calculated through the difference in the carbon uptake between C–N and C-only or C–N–P and C–N simulations. CABLE was first spun up by using meteorological forcing from Community Climate System Model (CCSM) simulations (Hurrell et al., 2013) during 1901 to 1910 until steady states were achieved for the C-only, C–N and C–N–P cases separately. Hourly meteorological driving data include temperature, specific humidity, air pressure, downward solar radiation, downward long-wave radiation, rainfall, snowfall, and wind. In order to separate the CO2 fertilization effect from the effect of climate change, climate forcing was held as the average annual cycle of CCSM meteorological data from 1901 to 2100. Atmospheric CO2 concentrations from 1901 to 2100 were taken from the CMIP5 dataset, representing global annual averages and the RCP 8.5 scenario after 2010 (Etheridge et al., 1996; MacFarling Meure et al., 2006). The spatial resolution of CABLE used here is (latitude vs. longitude). N deposition is prescribed from atmospheric transport models (Lamarque et al., 2010, 2011), spatially explicit but fixed as the average from 1901 to 2100 in time. N fixation is prescribed from a process-based model, spatially explicit but constant in time (Wang and Houlton, 2009). P enters ecosystems through constant rates of weathering and atmospheric deposition (from Mahowald et al., 2008).
2.3 Calculation of β values at five hierarchical levels
We aimed to analyze the CO2 fertilization effects for biochemical reaction (L), leaf photosynthesis rate (p), leaf-to-canopy scaling factor (S), leaf area index (LAI), sunlit leaf GPP (GPPsun), shaded leaf GPP (GPPsha), canopy GPP, NPP, and ecosystem carbon storage (cpool) from C-only, C–N and C–N–P simulations of CABLE. Canopy GPP is the sum of sunlit leaf GPP and shaded leaf GPP. Ecosystem carbon storage is the sum of plant, litter and soil carbon stock. Since CO2 concentration increases on a yearly basis, annual carbon fluxes and storages such as GPPsun, GPPsha, canopy GPP, NPP and ecosystem carbon storage were calculated. Leaf-to-canopy scaling factor and LAI were averaged within a year. β values of these variables were calculated as the normalized sensitivities of those variables to atmospheric CO2 concentration (Ca) as βV:
where V in the denominator represents the average annual value of Ssun, Ssha, LAI, GPP, GPPsun, GPPsha, NPP and ecosystem carbon storage between 2 consecutive years. Subscripts “sun” and “sha” denote the sunlit and shaded components. dV is the difference of these variables between 2 consecutive years. dCa is the difference of the corresponding Ca. The unit of βV is ppm−1. It should be noted that βV is the relative response, which is similar to the traditional definition of the β factor by Bacastow and Keeling (1973), but different from the carbon–concentration feedback parameter in Friedlingstein et al. (2006). The relative response facilitates the comparison among PFTs with different initial biomass and the comparison across carbon fluxes and storages with different units.
Leaf biochemical response (L) was first proposed by Luo et al. (1996). The L function is the normalized response of leaf photosynthesis rate to a small change in intercellular CO2 concentration (Ci) and has been suggested to be an invariant function for C3 plants grown in diverse environments. The rate of photosynthesis is typically RuBP-regeneration-limited under a high CO2 concentration. We found photosynthesis rates are increasingly limited by RuBP regeneration under the RCP 8.5 scenario. Besides, theoretical analysis by Luo and Mooney (1996) showed that biochemical responses are similar for either Rubisco- or RuBP-limited photosynthesis. In this study, L can be used to indicate leaf biochemical response to eCO2. For sunlit leaf and shaded leaf, formulations of L under RuBP-regeneration limitation are defined as
In this study, Γ∗sun and Γ∗sha are yearly average CO2 compensation points in the absence of day respiration for sunlit leaf and shaded leaf, respectively. Ci varies significantly on sub-daily, intra-annual and inter-annual bases. We are interested in how Ci responds to eCO2 on an inter-annual basis. So, we first outputted hourly Ci and then calculated yearly GPP-weighted average Ci for sunlit leaf (Cisun) and shaded leaf (Cisha).
Then leaf-level βp is defined as the product of L and . For sunlit leaf and shaded leaf, the formulations are
Leaf-to-canopy scaling factor (S) scales fluxes at the single top leaf of the canopy to whole canopy fluxes. The formulations of S for sunlit leaves and shaded leaves are
where kb is the extinction coefficient of a canopy of black leaves for direct beam radiation. kn is an empirical parameter used to describe the vertical distribution of leaf nitrogen in the canopy (Kowalczyk et al., 2006). In our simulation, kn is uniformly assigned as 0.001 for different PFTs. The leaf-to-canopy scaling factor varies with time because kb is the function of Sun angle, and LAI varies seasonally and inter-annually. The annual value of the leaf-to-canopy scaling factor was just calculated as the average of hourly leaf-to-canopy scaling factors in a year.

Figure 1Temporal trends of βcpool from 2011 to 2100 for C3 PFTs from CABLE-C-only (a), CABLE-CN (b), and CABLE-CNP (c) simulations. βcpool values for different C3 PFTs all decline with time from 2011 to 2100 under the RCP 8.5 scenario, but the magnitudes of βcpool differ across them in all simulations. In C–N and C–N–P simulations, magnitudes of βcpool are reduced compared with those in C-only simulation for all C3 PFTs except evergreen broadleaf forest. ENF, evergreen needleleaf forest (light green squares); EBF, evergreen broadleaf forest (red circles); DNF, deciduous needleleaf forest (dark blue triangles); DBF, deciduous broadleaf forest (pink triangles); SHB, shrub (dark green diamonds); C3GRAS, C3 grass (dark blue stars); TUN, tundra (orange diamonds).
Big-leaf (or ) can be decomposed as the sum of normalized sensitivity of photosynthesis rate, (or ), and leaf-to-canopy scaling factor, (or ), as shown in Eqs. (10) and (11). Detailed mathematical derivations are in Supplement S2.
There are 10 patches in each model grid in CABLE. Each patch consists of a certain land use type with a specific fraction. To study the variation of β across different C3 PFTs, biome-level parameters such as Γ∗sun, Cisun, Ssun and LAI were calculated as mean values based on PFTs, whereas biome-level GPP, GPPsun, GPPsha, NPP and ecosystem carbon storage were integrated sums based on PFTs. Then Lsun, Lsha, , , βGPP, βNPP and βcpool at the year 2023 (relative to 2022) for different C3 PFTs were calculated and compared. Coefficients of variation (CVs) of β values were calculated across various C3 PFTs for these hierarchical levels. The year 2023 was chosen because large oscillations of LAI occurred for shrub after 2025 in the C–N–P simulation (Supplement Fig. S1c). For C–N and C–N–P simulations, the time series of LAI, GPP, and NPP for shrub, C3 grass and tundra underwent small short-term variability and therefore were smoothed using the “smooth” function in MATLAB software before the calculation of β. We also calculated β values for each patch and CV of β values across different geographical locations within a specific PFT at different hierarchical levels at the year 2023 to explore the variability of β within the same PFTs. All abovementioned calculations were processed in MATLAB R2014b.
3.1 Temporal trends of β at ecosystem level for different PFTs
In C-only simulation, βcpool values for different C3 PFTs all decline with time from 2011 to 2100 under the RCP 8.5 scenario (Fig. 1a). However, the magnitudes of βcpool differ among different PFTs, with the highest values occurring in deciduous broadleaf forest from 2011 to 2075 and in shrub after 2075, and the lowest values occurring in deciduous needleleaf forest and tundra. βcpool values for deciduous needleleaf forest and tundra nearly overlap over time. As compared with C-only simulation, values of βcpool are reduced when N limitation is included as in C–N simulation for all C3 PFTs except evergreen broadleaf forest (Fig. 1b). Deciduous broadleaf forest and evergreen broadleaf forest have the greatest βcpool values, while deciduous needleleaf forest and tundra still have the lowest βcpool values in C–N simulation. When both N and P limitations are taken into account as in C–N–P simulation, magnitudes and trends of βcpool are similar to those in C–N simulation (Fig. 1c) as P limitation is quite weak under present conditions in the current version of CABLE (Zhang et al., 2011).
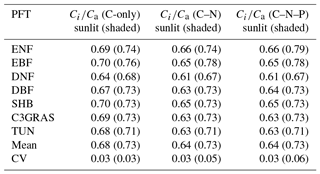
Table 1The ratio of intercellular CO2 concentration (Ci) to atmospheric CO2 concentration (Ca) for different C3 PFTs, and mean and coefficient of variation (CV) across these PFTs of Ci∕Ca in C-only, C–N, and C–N–P simulations of CABLE under the RCP 8.5 scenario. Values for shaded leaves are in brackets. Abbreviations are the same as Fig. 1.
3.2 Variations of intercellular CO2 concentration and CO2 compensation point
To reveal which processes cause the large disparity of β across PFTs as shown in Fig. 1, we first compared intercellular CO2 concentration (Ci) and CO2 compensation point in the absence of day respiration (Γ∗), which are critical parameters for leaf-level biochemical response. In C-only simulation, the ratio of Ci to Ca (Ci∕Ca) is approximately constant with eCO2 for each PFT (Fig. 2a, b). For sunlit leaf, Ci∕Ca values range from 0.64 to 0.70 with CV = 0.03 across different C3 PFTs (Table 1). Ci∕Ca values for shaded leaf are higher than those for sunlit leaf, and the range is 0.68 to 0.76 with CV = 0.03 across different C3 PFTs (Table 1). Evergreen broadleaf forest has the greatest Ci∕Ca value, while deciduous needleleaf forest has the lowest Ci∕Ca value. In C–N simulation, Ci∕Ca values for sunlit leaf are lower than those for the same PFT in C-only simulation, while Ci∕Ca values for shaded leaf change little as compared with those for the same PFT in C-only simulation (Table 1 and Fig. S2). Ci∕Ca values for both sunlit and shaded leaves in C–N–P simulation are very similar to those in C–N simulation (Table 1 and Fig. S3).
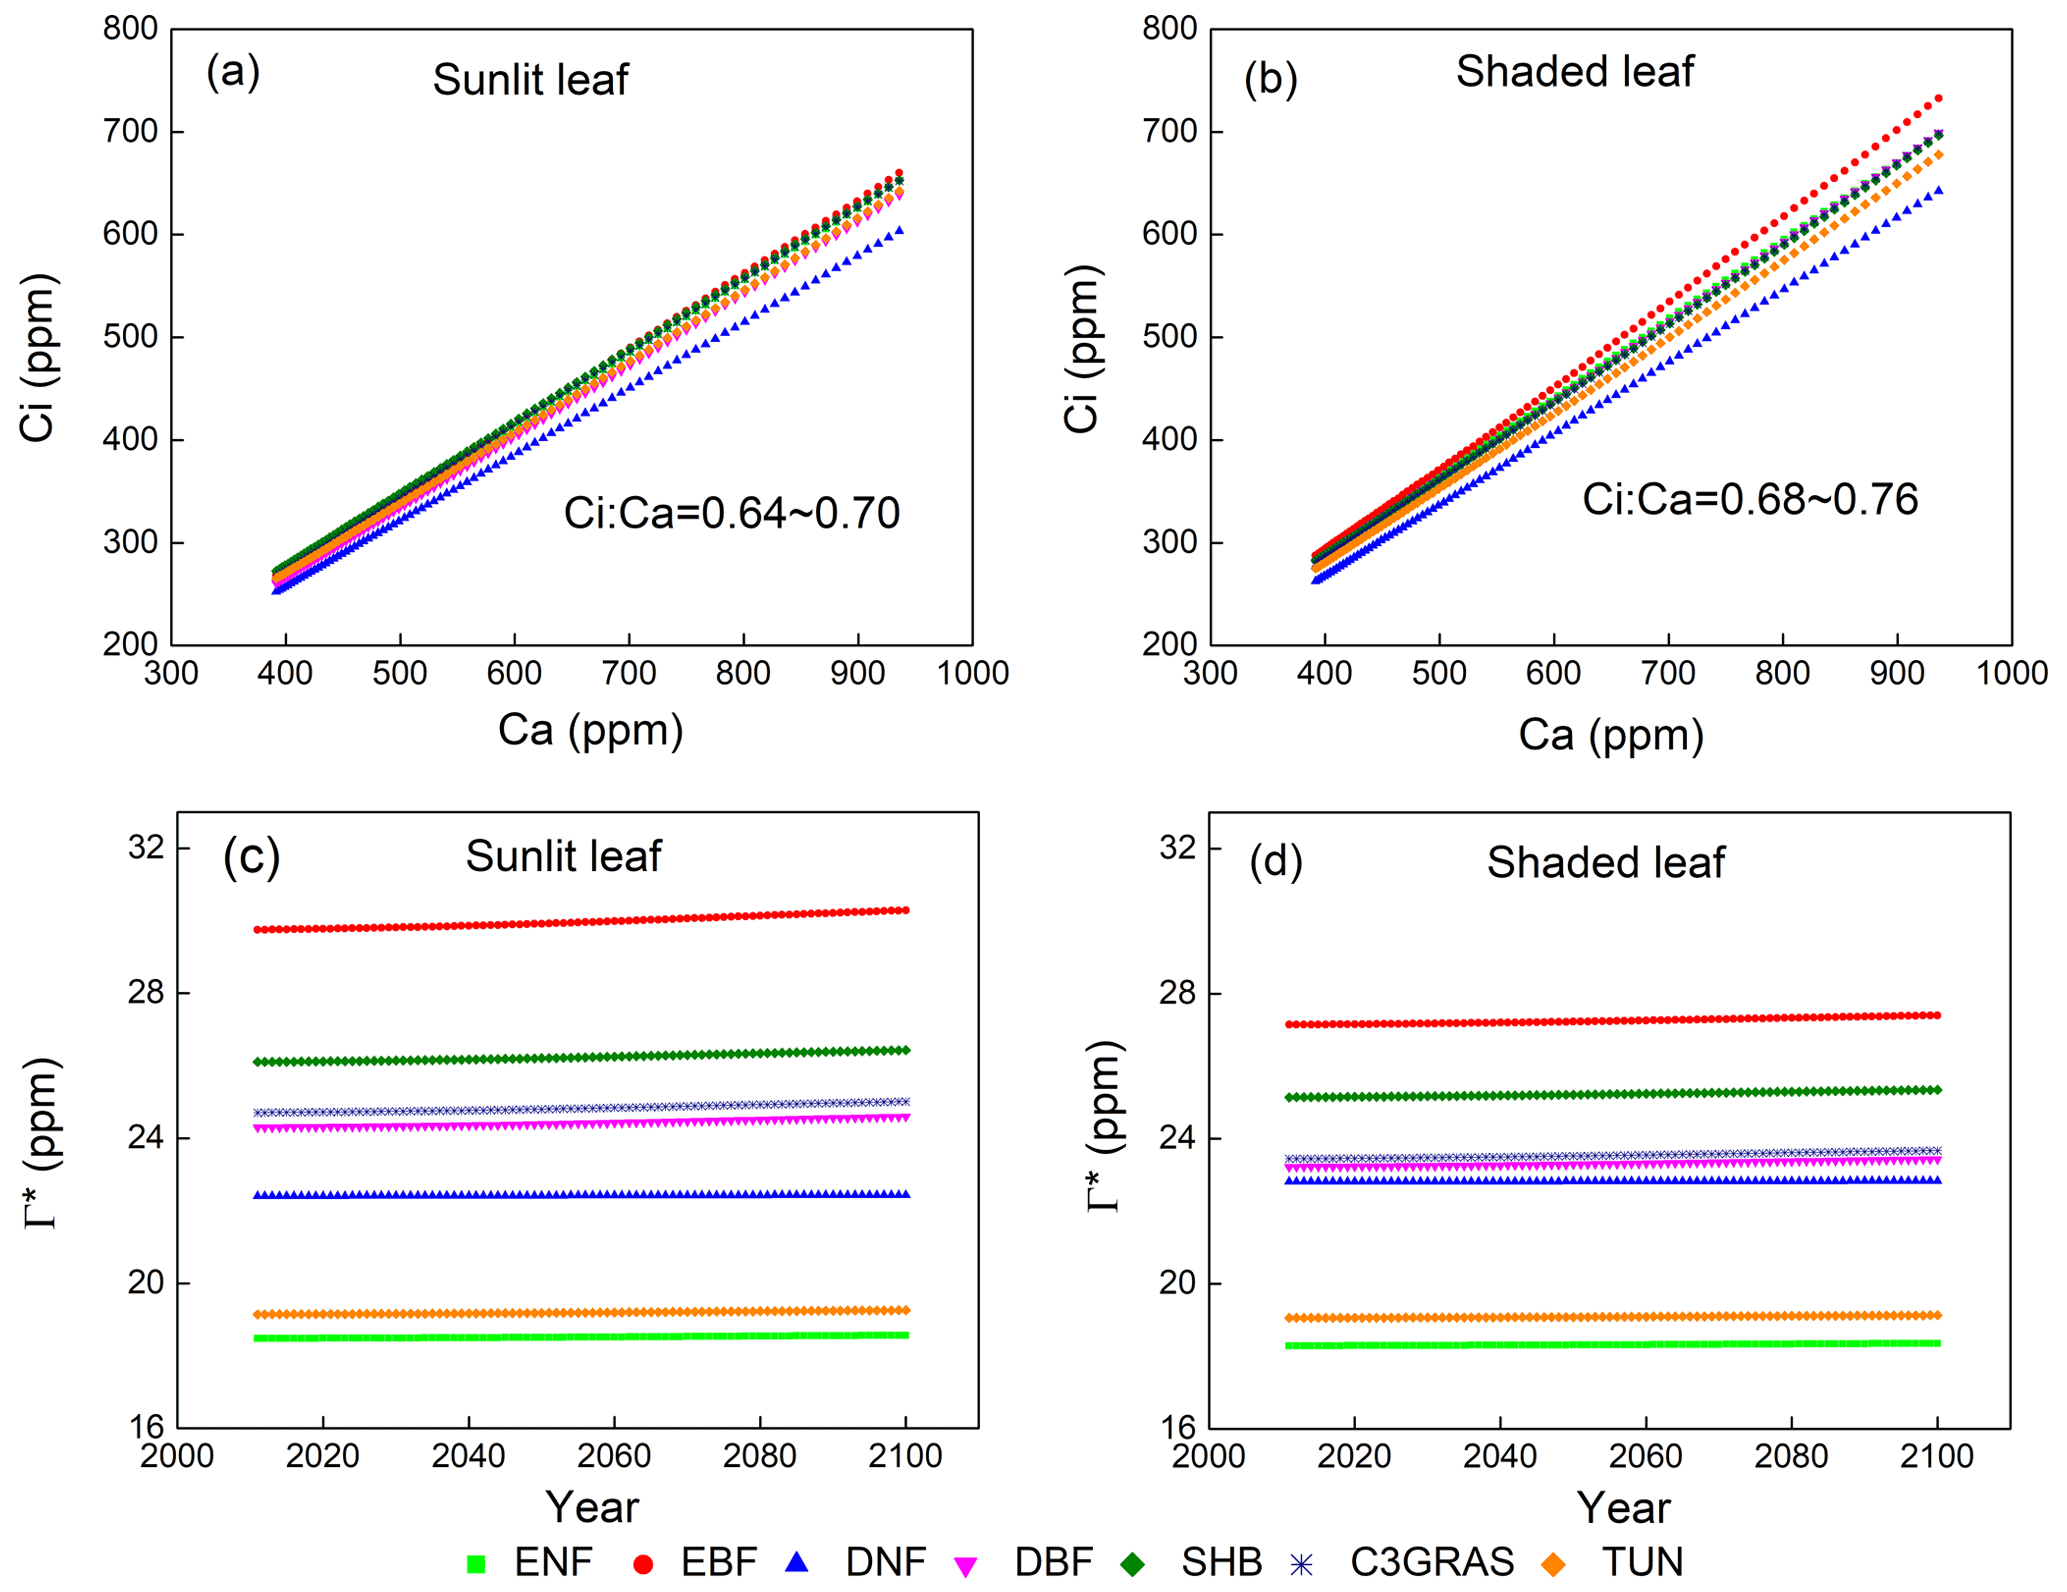
Figure 2Responses of yearly intercellular CO2 concentration (Ci) to eCO2 of a single sunlit leaf (a) and shaded leaf (b) for C3 PFTs from CABLE-C-only simulation. Temporal trends of CO2 compensation point in the absence of day respiration (Γ∗) for sunlit leaf (c) and shaded leaf (d) from 2011 to 2100 from CABLE-C-only simulation. The ratio of Ci to Ca (Ci∕Ca) is approximately constant with eCO2 for each PFT and varies little across PFTs. Γ∗ values vary across different PFTs, but do not change over time for each PFT. Abbreviations and symbols are the same as Fig. 1.
In all of the simulations, values of CO2 compensation point in the absence of day respiration (Γ∗) for a specific PFT do not change over time since air temperature as an input to the model is not affected by the biophysical feedback in the offline model simulations (Figs. 2c, d, S2c, d, S3c, d). But there is a huge variance of Γ∗ across different C3 PFTs because of different leaf temperature which Γ∗ values depend on.
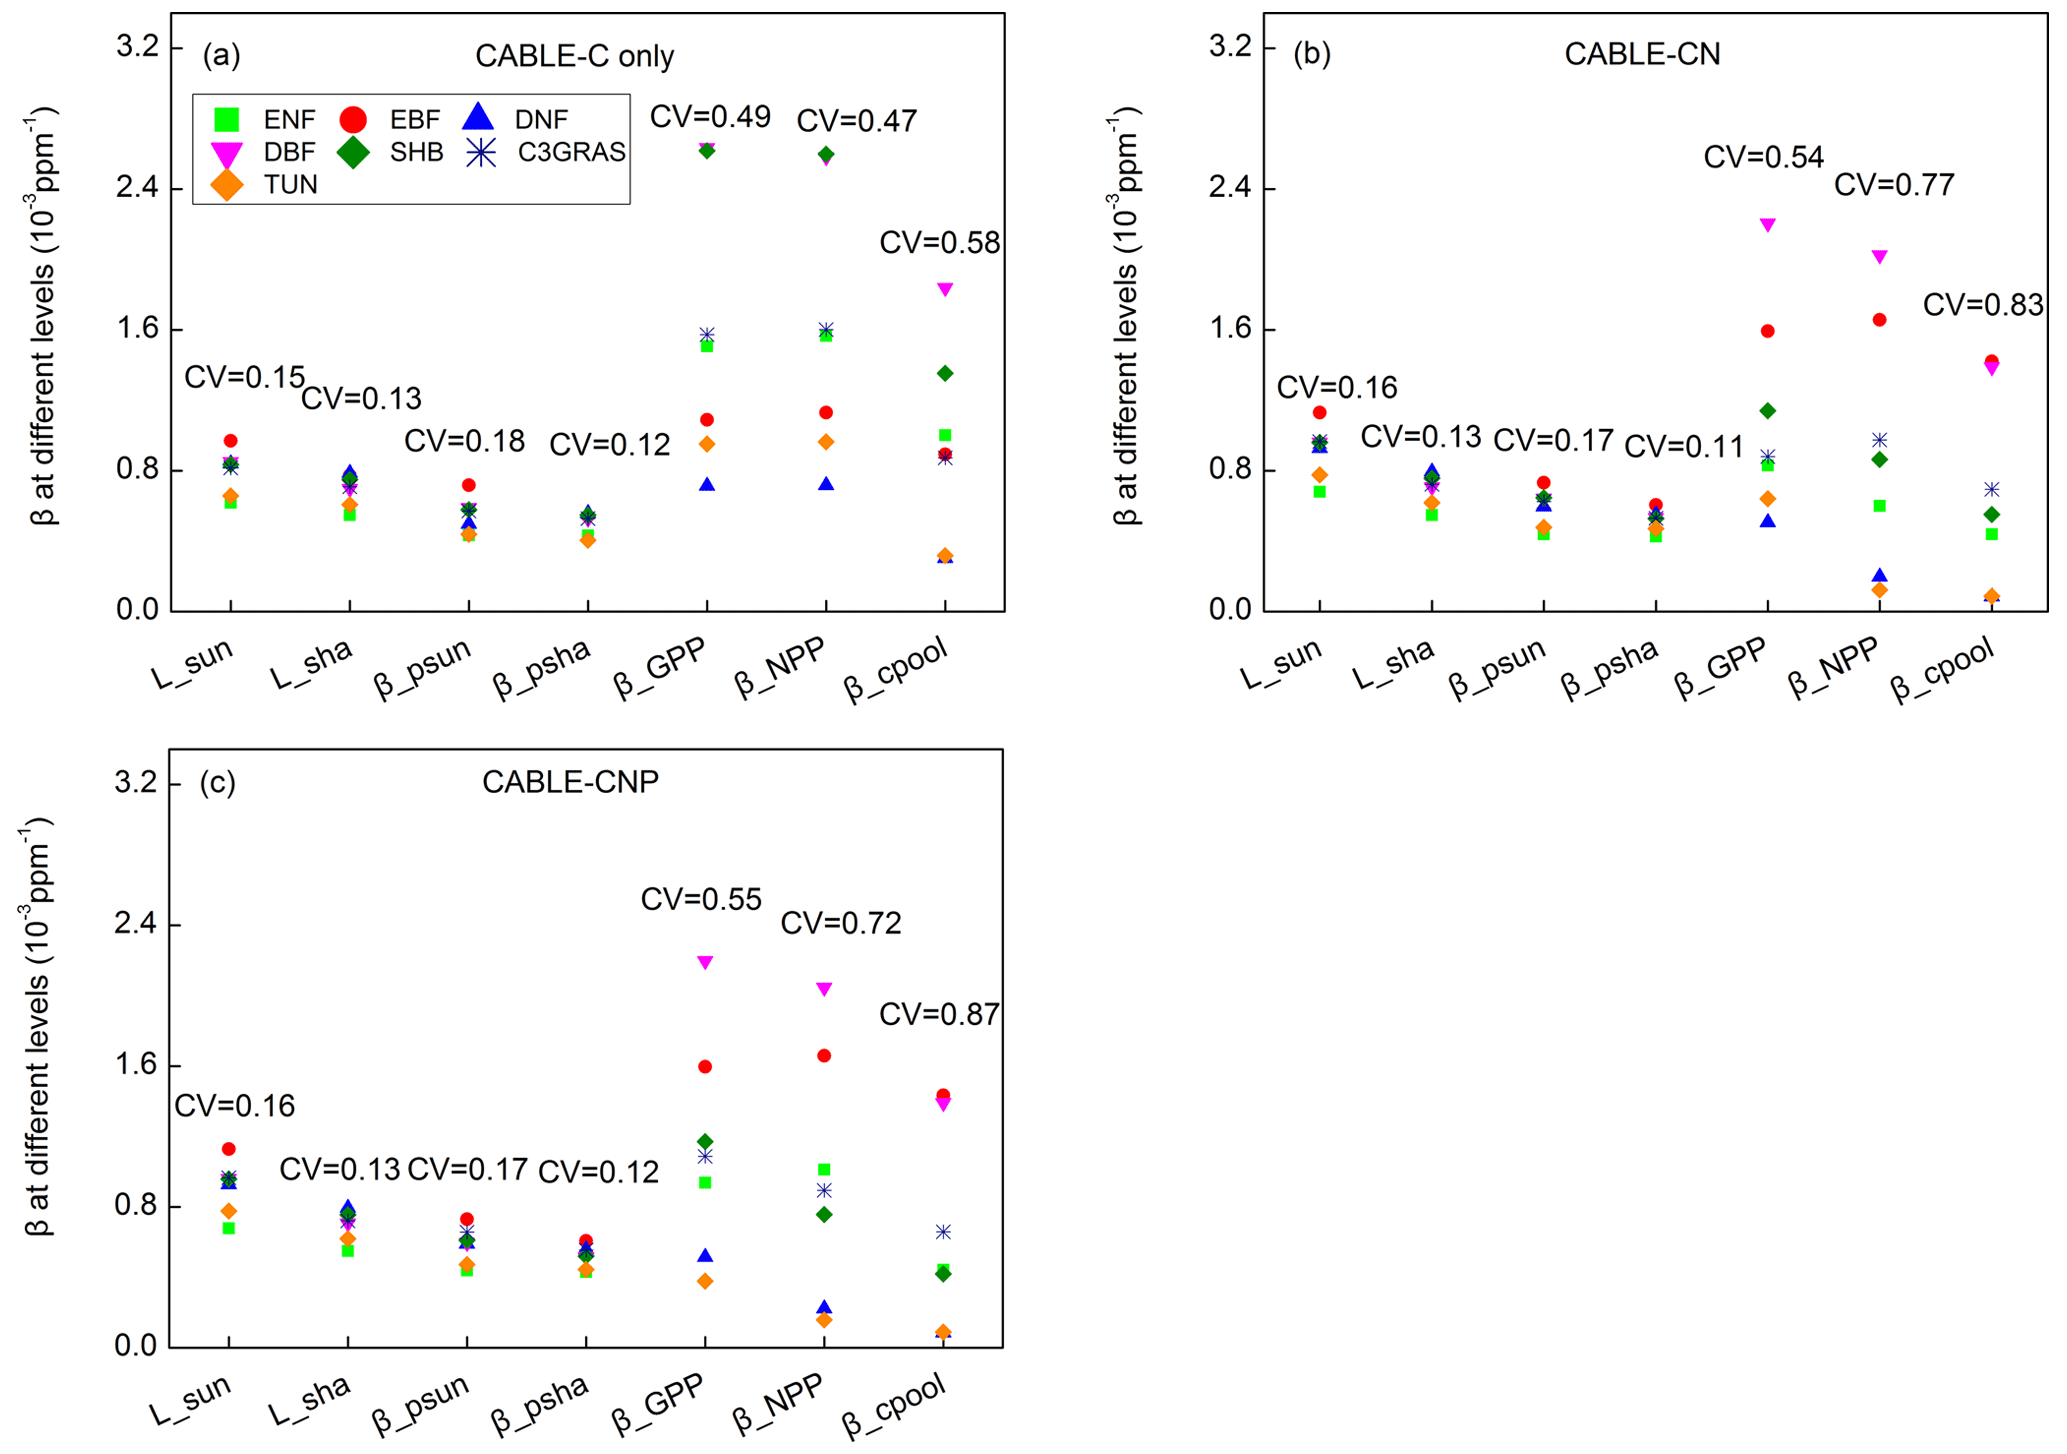
Figure 3Biome-level β values at different levels at the year 2023 from CABLE-C-only (a), CABLE-CN (b), and CABLE-CNP (c) simulations. CV means coefficient of variation of biome-level β across C3 PFTs. β values at biochemical (Lsun and Lsha for sunlit and shaded leaves, respectively) and leaf levels ( and for sunlit and shaded leaves, respectively) are very similar across PFTs, but greatly diverge at canopy level (βGPP) and ecosystem levels (βNPP and βcpool) in all simulations. Unlike in C-only simulation, βNPP diverges more than βGPP across different PFTs in nutrient-coupled simulations. Abbreviations and symbols are the same as Fig. 1.
3.3 Comparison of β at different hierarchical levels
To further trace the cause of the divergence of β across PFTs as shown in Fig. 1 at a specific time, Lsun, Lsha, , , βGPP, βNPP and βcpool at the year 2023 for different C3 PFTs in all simulations were plotted in Fig. 3. CV is marked above data points for each variable to indicate degree of variation across different C3 PFTs. In C-only simulation (Fig. 3a), results show that at leaf biochemical level, L values for sunlit leaf and shaded leaf range from 0.00055 to 0.00097 ppm−1. Variations of Lsun and Lsha among PFTs are small (CV = 0.15 and 0.13). At leaf photosynthesis level, and for the seven PFTs vary from 0.00041 to 0.00072 ppm−1, and the variations among different PFTs are not significant (CV = 0.18 and 0.12). But β values are diverging when scaled up to GPP level, with CV jumping to 0.49 among PFTs. β values of deciduous broadleaf forest and shrub greatly increase from leaf level to GPP level. However, canopy scaling effects do not significantly amplify β values at canopy levels (βGPP) for deciduous needleleaf forest, tundra and evergreen broadleaf forest. Magnitudes and variance of βNPP are similar to those of βGPP because NPP linearly correlates with GPP for all C3 PFTs (Fig. S4). Magnitudes of βcpool for all PFTs are decreased compared with those of βNPP and βGPP. Deciduous broadleaf forest and shrub have the highest βGPP and βNPP values (around 0.0026 ppm−1). Deciduous broadleaf forest has the greatest βcpool value (around 0.0018 ppm−1) among all. Deciduous needleleaf forest has the lowest βGPP, βNPP and βcpool values. CV of βcpool among different PFTs reaches the highest (0.58) compared with CV of β values at other levels.
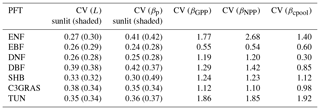
Table 2Coefficients of variation of L, βp, βGPP, βNPP and βcpool across different geographical locations within each C3 PFT at the year 2023 in the CABLE-C-only simulation. The two numbers in the same unit are for sunlit leaves and shaded leaves, respectively. Values for shaded leaves are in brackets. Abbreviations are the same as Fig. 1.
In C–N and C–N–P simulations, magnitudes and variations of β at leaf biochemical and photosynthetic levels are comparable to those in C-only simulation because Ci and Γ∗ values only slightly change under nutrient limitations (Figs. 3b, c, S2, S3). Nutrient-limited βGPP values are smaller than those in C-only simulation, except for evergreen broadleaf forest. There is a large divergence of nutrient-limited βGPP across different PFTs, which is similar to C-only simulation. However, unlike in C-only simulation, βNPP values in nutrient-coupled simulations are reduced for most C3 PFTs and diverge more compared with βGPP values. Coefficients of variation (CVs) of βcpool in nutrient-coupled simulations exceed 0.8, larger than that in C-only simulation.
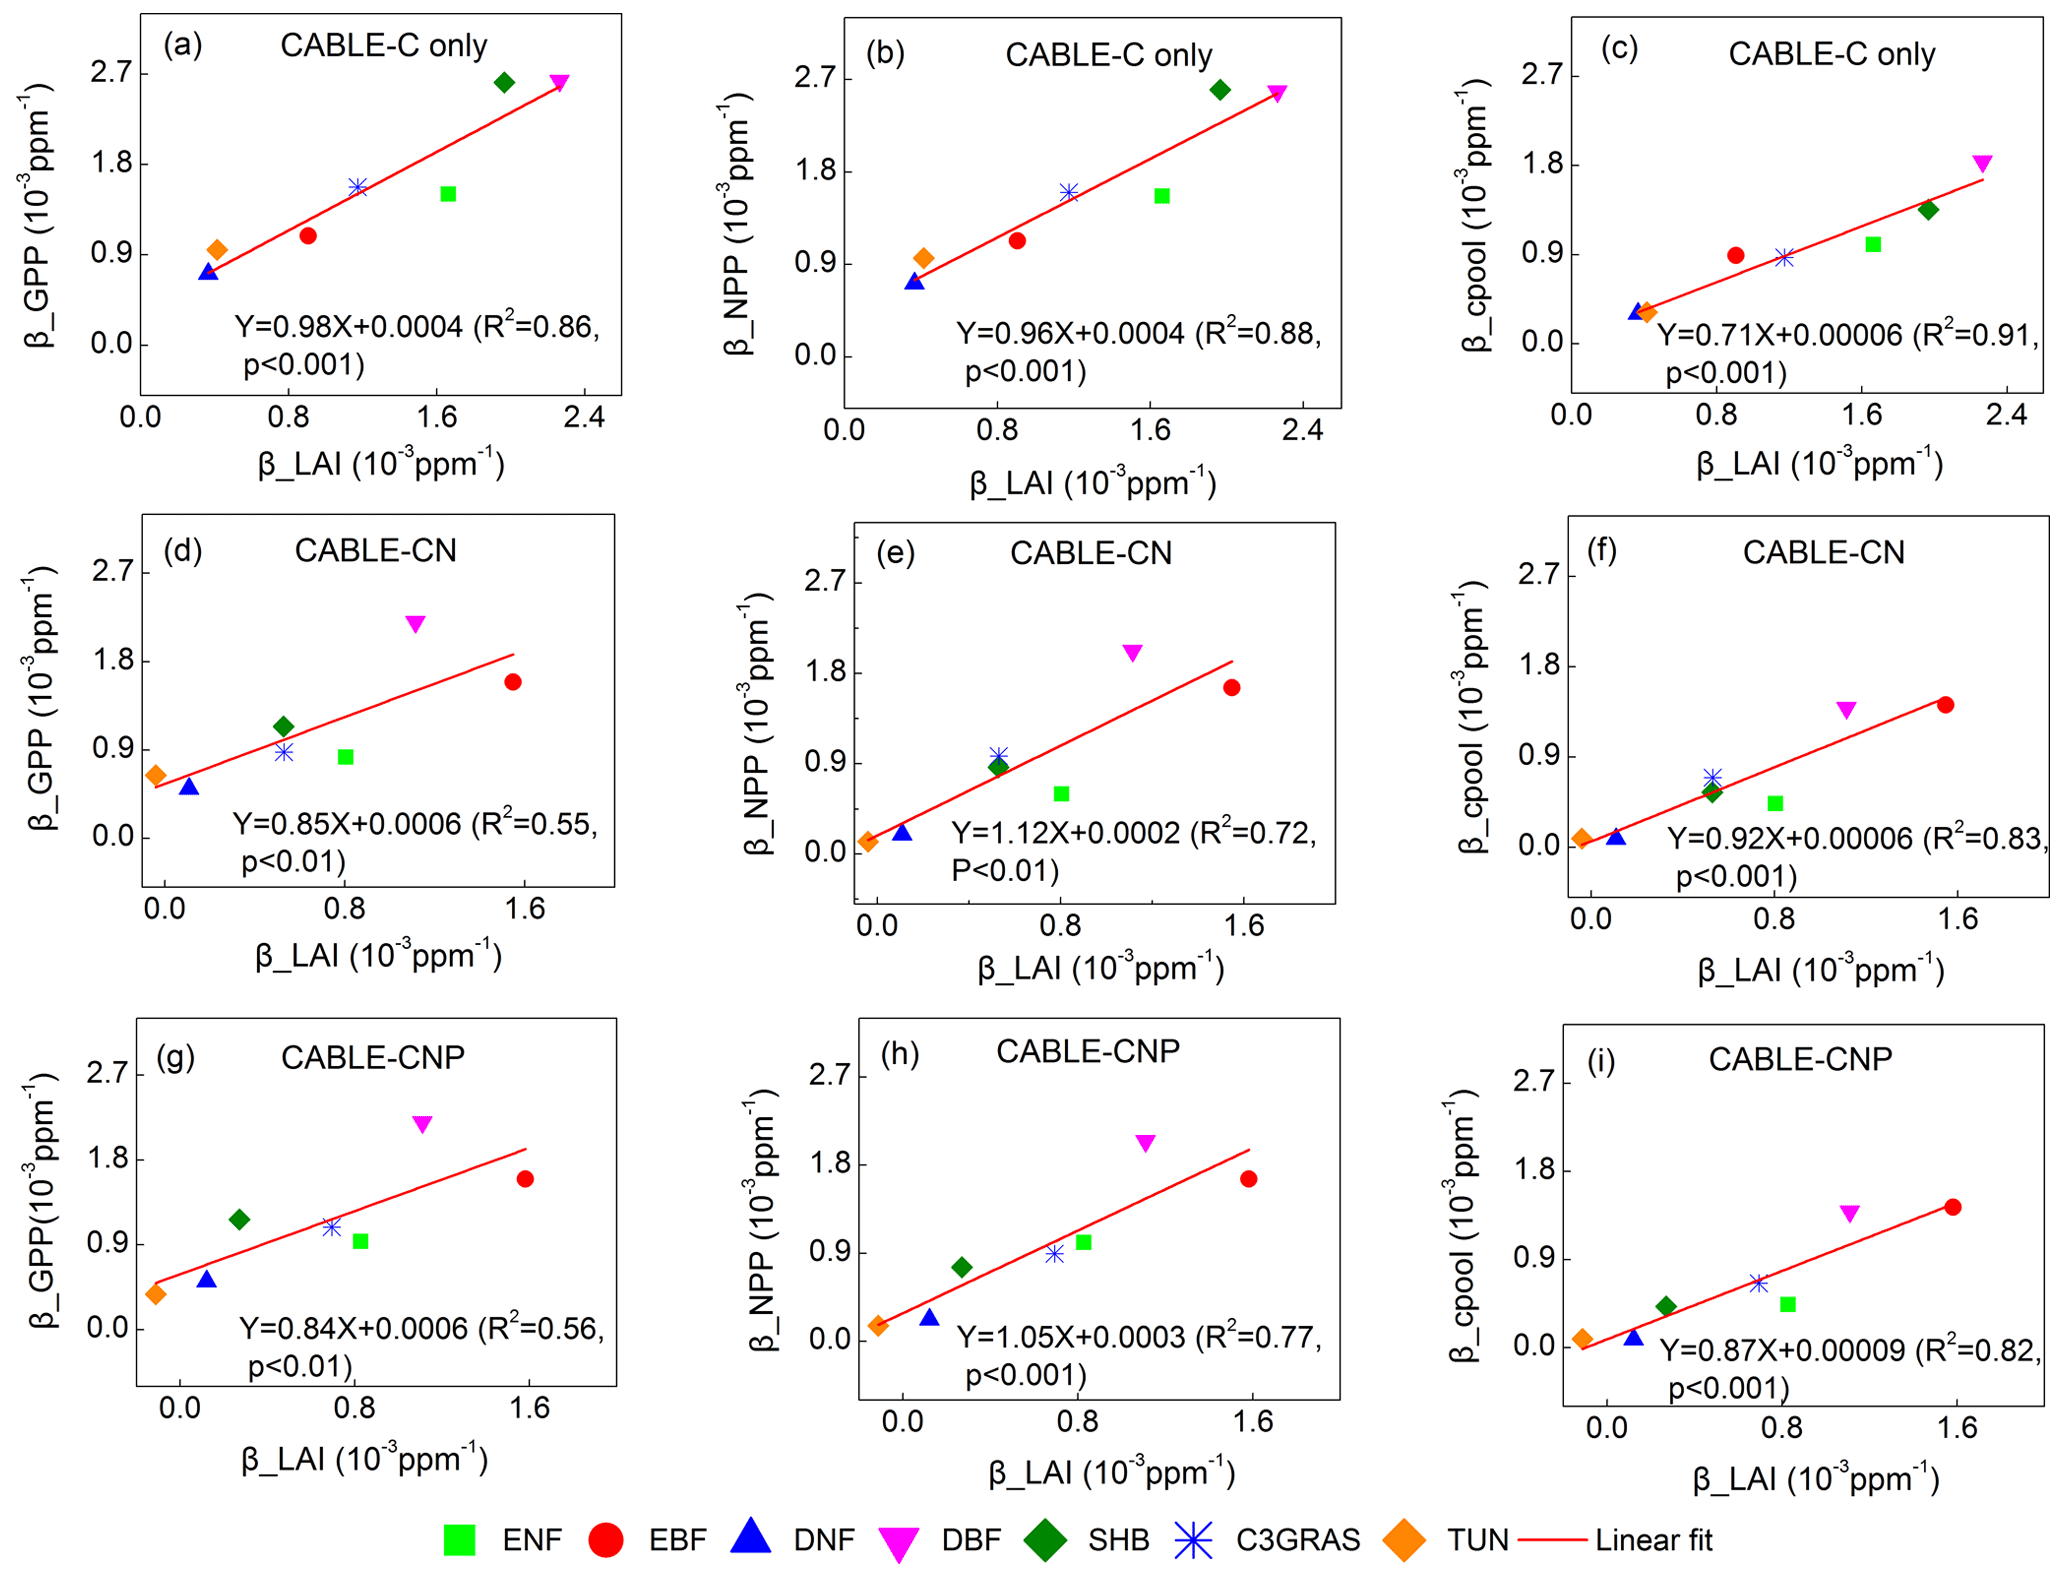
Figure 4Correlations between βGPP and βLAI, βNPP and βLAI, and βcpool and βLAI at the year 2023 across C3 PFTs from CABLE-C-only (a–c), CABLE-CN (d–f) and CABLE-CNP (g–i) simulations. βGPP, βNPP and βcpool all have significant linear correlations with βLAI in all simulations. Abbreviations and symbols are the same as Fig. 1.
Within-PFT variations of β in C-only simulation were listed in Table 2, including CVs for biochemical response L, leaf-level βp, βGPP, βNPP and βcpool across different geographical locations within each PFT. Variations of biochemical and leaf-level responses are relatively smaller than those at canopy and ecosystem levels within all C3 PFTs. βGPP values are greatly differentiated across different geographical locations. Variations of βNPP are very similar to those of βGPP within all PFTs except the evergreen needleleaf forest. CVs of βcpool are lower than those of βNPP within most PFTs except evergreen broadleaf forest and tundra. Within-PFT variations of β in C–N and C–N–P simulations are similar to those in C-only simulation (data not shown).
To further explore why β values at canopy and ecosystem levels are diverging across different C3 PFTs, the correlations between βGPP and βLAI, βNPP and βLAI, βcpool and βLAI for C-only, C–N and C–N–P simulations were plotted at the year 2023. Results show that βGPP, βNPP and βcpool all have significant linear correlations with βLAI across different C3 PFTs (Fig. 4). Results also show that βLAI linearly correlates with βGPP, βNPP and βcpool across patches within the same PFT, although there are some discontinuous points within evergreen broadleaf forest where the canopy of many patches closes (Figs. S5–S7). Therefore variations of β values from leaf to ecosystem scale can be well explained by βLAI or the LAI response to increasing CO2.
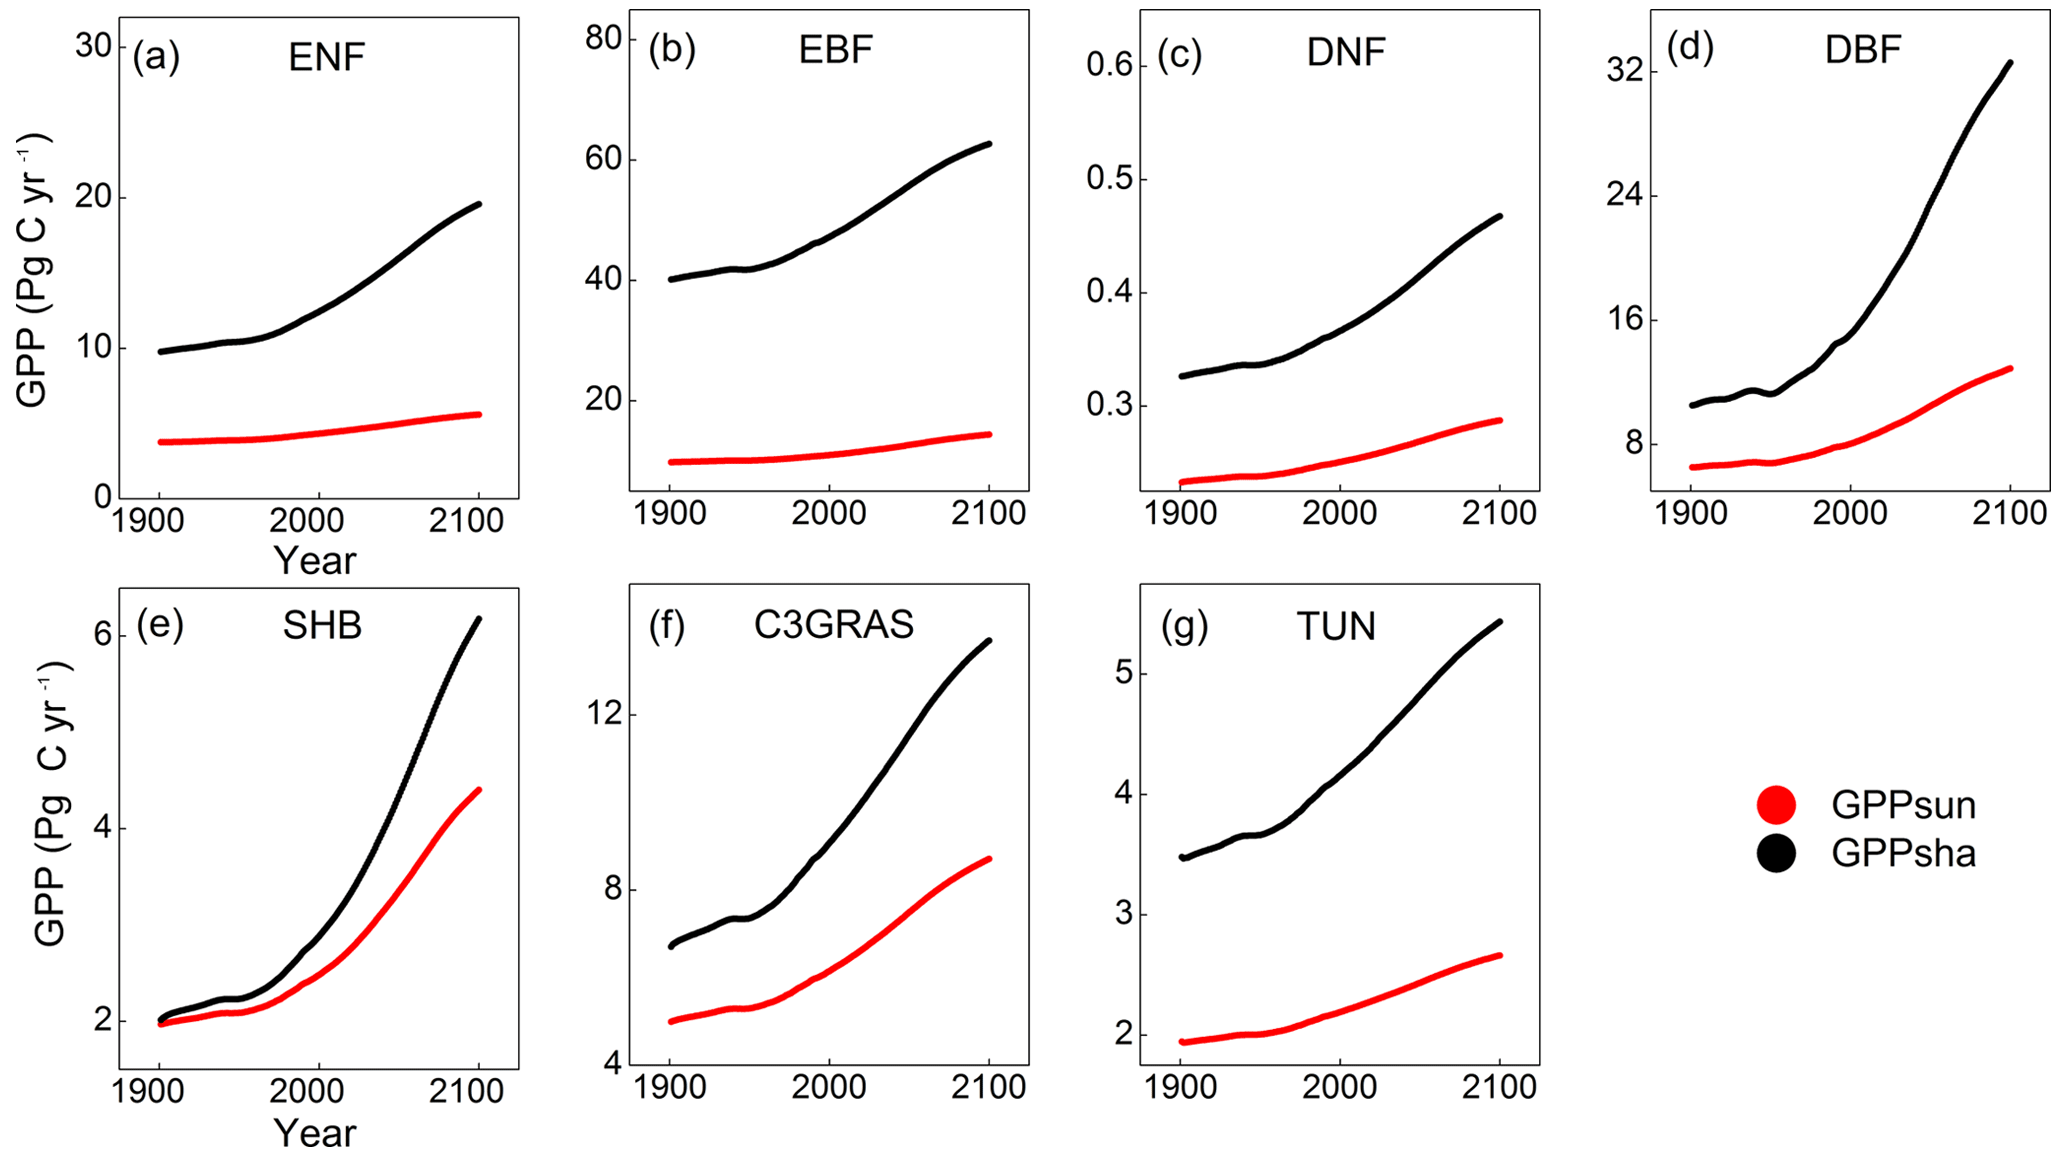
Figure 5Temporal trends of GPPsun (red points) and GPPsha (black points) for C3 PFTs from 1901 to 2100 from CABLE-C-only simulation. GPPsha is higher than GPPsun for all PFTs. With significant increase in CO2 concentration from 2011, GPPsha responds more drastically than GPPsun. Abbreviations are the same as Fig. 1.
3.4 β of sunlit and shaded leaves
To understand the in-depth mechanism for the influence of LAI on canopy GPP, we investigated the response of sunlit and shaded leaf GPP separately from C-only simulation. Temporal trends of sunlit leaf GPP (GPPsun) and shaded leaf GPP (GPPsha) were plotted for each type of C3 PFTs from 1901 to 2100 in Fig. 5. From the beginning of the simulation, GPPsha is higher than GPPsun for all C3 PFTs. With significant increases in CO2 concentration from 2011, GPPsha responds more drastically than GPPsun. Shaded leaf GPP of deciduous broadleaf forest and shrub responds to eCO2 more significantly than other PFTs. However, a single sunlit leaf has a higher photosynthesis rate (psun) than a shaded leaf (psha) because of more radiation absorbed. Thus, the LAI-dependent canopy scaling factor of shaded leaves (Ssha) contributes more to the magnitude and sensitivity of canopy GPP than photosynthesis rate.
Then temporal trends were plotted for and decomposing factors and for each PFT as Eqs. (10) and (11) to further evaluate the above inference. Results show that both of the sensitivities of GPPsun and GPPsha tend to approach zero through time because the decomposing factors , , and all decline with time (Fig. 6). and overlap through time for each PFT. Magnitudes of are higher than those of for all C3 PFTs because the values of are higher than those of . For deciduous needleleaf forest and tundra, both () and contribute to the magnitudes and trends of . For evergreen needleleaf forest, deciduous broadleaf forest, shrub and C3 grass, dominates the magnitude and change in . For evergreen broadleaf forest, predominates the magnitude and change in before 2035.
4.1 Variations of biochemical and photosynthetic responses to eCO2
The direct CO2 fertilization effect occurs at leaf level and is determined by kinetic sensitivity of Rubisco enzymes to internal leaf CO2 concentration. In fact, the normalized short-term sensitivity of leaf-level photosynthesis to CO2 is mainly regulated by Ci and slightly influenced by leaf temperature, regardless of light, nutrient availability, and species characteristics (Luo et al., 1996; Luo and Mooney, 1996). In our study, the modeled Ci∕Ca ratio is approximately constant with eCO2 for a specific PFT, and varies little within and across PFTs in all simulations. This is in line with FACE experimental results which show almost constant Ci∕Ca values for different PFTs under CO2 fertilization (Drake et al., 1997; Long et al., 2004). Γ∗ varies little for different species and only depends on leaf temperature (Luo and Mooney, 1996). Sensitivity analysis in a previous study has shown that a of leaf temperature changes caused approximately ±7 ppm changes in Γ∗, leading to variation of 0.12 to leaf-level β (Luo and Mooney, 1996). The overall variation of leaf-level β caused by variation in leaf temperature is still quite small compared with that of βGPP. Therefore, biochemical and leaf-level β values vary little within and among PFTs in this study. Our results also illustrate that nutrient effects do not significantly change Ci and Γ∗, leading to similar biochemical and leaf-level β values in all simulations, which is in accordance with Luo et al. (1996).
To identify the source of uncertainty of β in CMIP5 models, Hajima et al. (2014) decomposed β into several carbon-cycle components. They used GPP divided by LAI (GPP ∕ LAI) as a proxy to represent leaf-level photosynthesis for CMIP5 models, since there are no leaf-level process outputs of these models. They found the sensitivities of GPP ∕ LAI to eCO2 diverged a lot among models. One possible issue of this calculation is that it ignores different canopy structures used by each CMIP5 model, such as big-leaf, two-leaf or multiple-layer. Our results just show that the sensitivities of GPP ∕ LAI are different from our mechanistic calculation of leaf-level β for different PFTs in a two-leaf model. β values estimated from GPP ∕ LAI formulation are greatly underestimated for woody trees and slightly overestimated for C3 grass and tundra, but best match for shrub if compared with our calculation (Fig. S8). Therefore diagnostics such as Ci and Γ∗ for leaf-level β are more desirable for woody trees. Another advantage of our calculation of leaf-level β is that the reason for the divergence of leaf-level β across PFTs can be traced back to the difference from Ci and leaf temperature as shown in Fig. 2.
4.2 Variations of β at canopy and ecosystem levels
The two-leaf scaling scheme in CABLE is widely employed by many land-surface models, such as Community Land Model version 4.5 (CLM4.5, Oleson et al., 2013) and the Joint UK Land Environment Simulator version 4.5 (JULES4.5, Best et al., 2011; Clark et al., 2011; Harper et al., 2016). We found the responses of ecosystem carbon cycle to eCO2 diverge primarily because the responses of LAI diverge within and among PFTs in all simulations. Besides, GPP of shaded leaves responds to eCO2 more strongly than GPP of sunlit leaves for all C3 PFTs. This is because the portion of shaded leaves increases exponentially with increasing LAI (Fig. S9), leading to a rapid change in shaded leaf GPP, while for sunlit leaves, GPP shows a saturating response because of the decreasing portion of sunlit leaves with increasing LAI (Dai et al., 2004). Our results also indicate that saturation of GPP is not only regulated by the leaf-level photosynthetic response, but also by the response of the LAI-dependent scaling factor to eCO2. For shaded leaves, the sensitivity of the LAI-dependent scaling factor contributes more to the magnitude and trend of than that of photosynthesis rate. The evidence all suggests LAI is a key process in modeling the response of ecosystem carbon cycle to climate change.
It has been reported that different CMIP5 models have simulated diverse LAI during 1985–2006. And modeled LAI values in most CMIP5 models have been overestimated according to satellite products (Anav et al., 2013). Many global vegetation models simulated increasing LAI trends globally in response to eCO2 during the historical period (Zhu et al., 2016). Our modeling study also shows that LAI responds positively to eCO2 for all C3 PFTs in all simulations. But experimental results are not consistent. In one review paper with 12 FACE experimental results, trees had a 21 % increase in LAI and herbaceous C3 grasses did not show a significant change in LAI (Ainsworth and Long, 2005). Some studies reported that LAI dynamics did not significantly change in specific FACE experiments, such as in a closed-canopy deciduous broadleaf forest (ORNL FACE, Norby et al., 2003) and in a mature evergreen broadleaf forest (EucFACE, Duursma et al., 2016). The negligible change in LAI at the EucFACE probably leads to an insignificant response of productivity at this site, even though leaf photosynthesis rate significantly increases under eCO2 (Ellsworth et al., 2017). Besides the impact of LAI on the global carbon cycle, the increasing trend of LAI exerts profound biophysical impacts on climate by altering the energy and water cycles on the Earth's surface (Forzieri et al., 2017; Zeng et al., 2017). But there is a great uncertainty in the relationships between LAI and biophysical processes among land-surface models (Forzieri et al., 2018).
In this study, modeled nutrient-unlimited βGPP and βNPP values are higher than leaf photosynthetic responses for all C3 PFTs in C-only simulation (Fig. 3a). Nutrient-limited βNPP are still higher than photosynthetic responses for many PFTs in C–N and C–N–P simulations (Fig. 3b, c). However, it is generally observed in experiments that the leaf-level response is consistently larger than the whole plant response (Long et al., 2006; Leuzinger et al., 2011). One possible reason is that models overestimate the response of LAI to eCO2, as this study has shown that LAI is an important factor in driving ecosystem response to CO2 fertilization. And it is also likely the overestimation of the response of LAI to eCO2 is responsible for the overestimation of CO2 fertilization in ESMs reported by previous studies (Smith et al., 2015; Mystakidis et al., 2017).
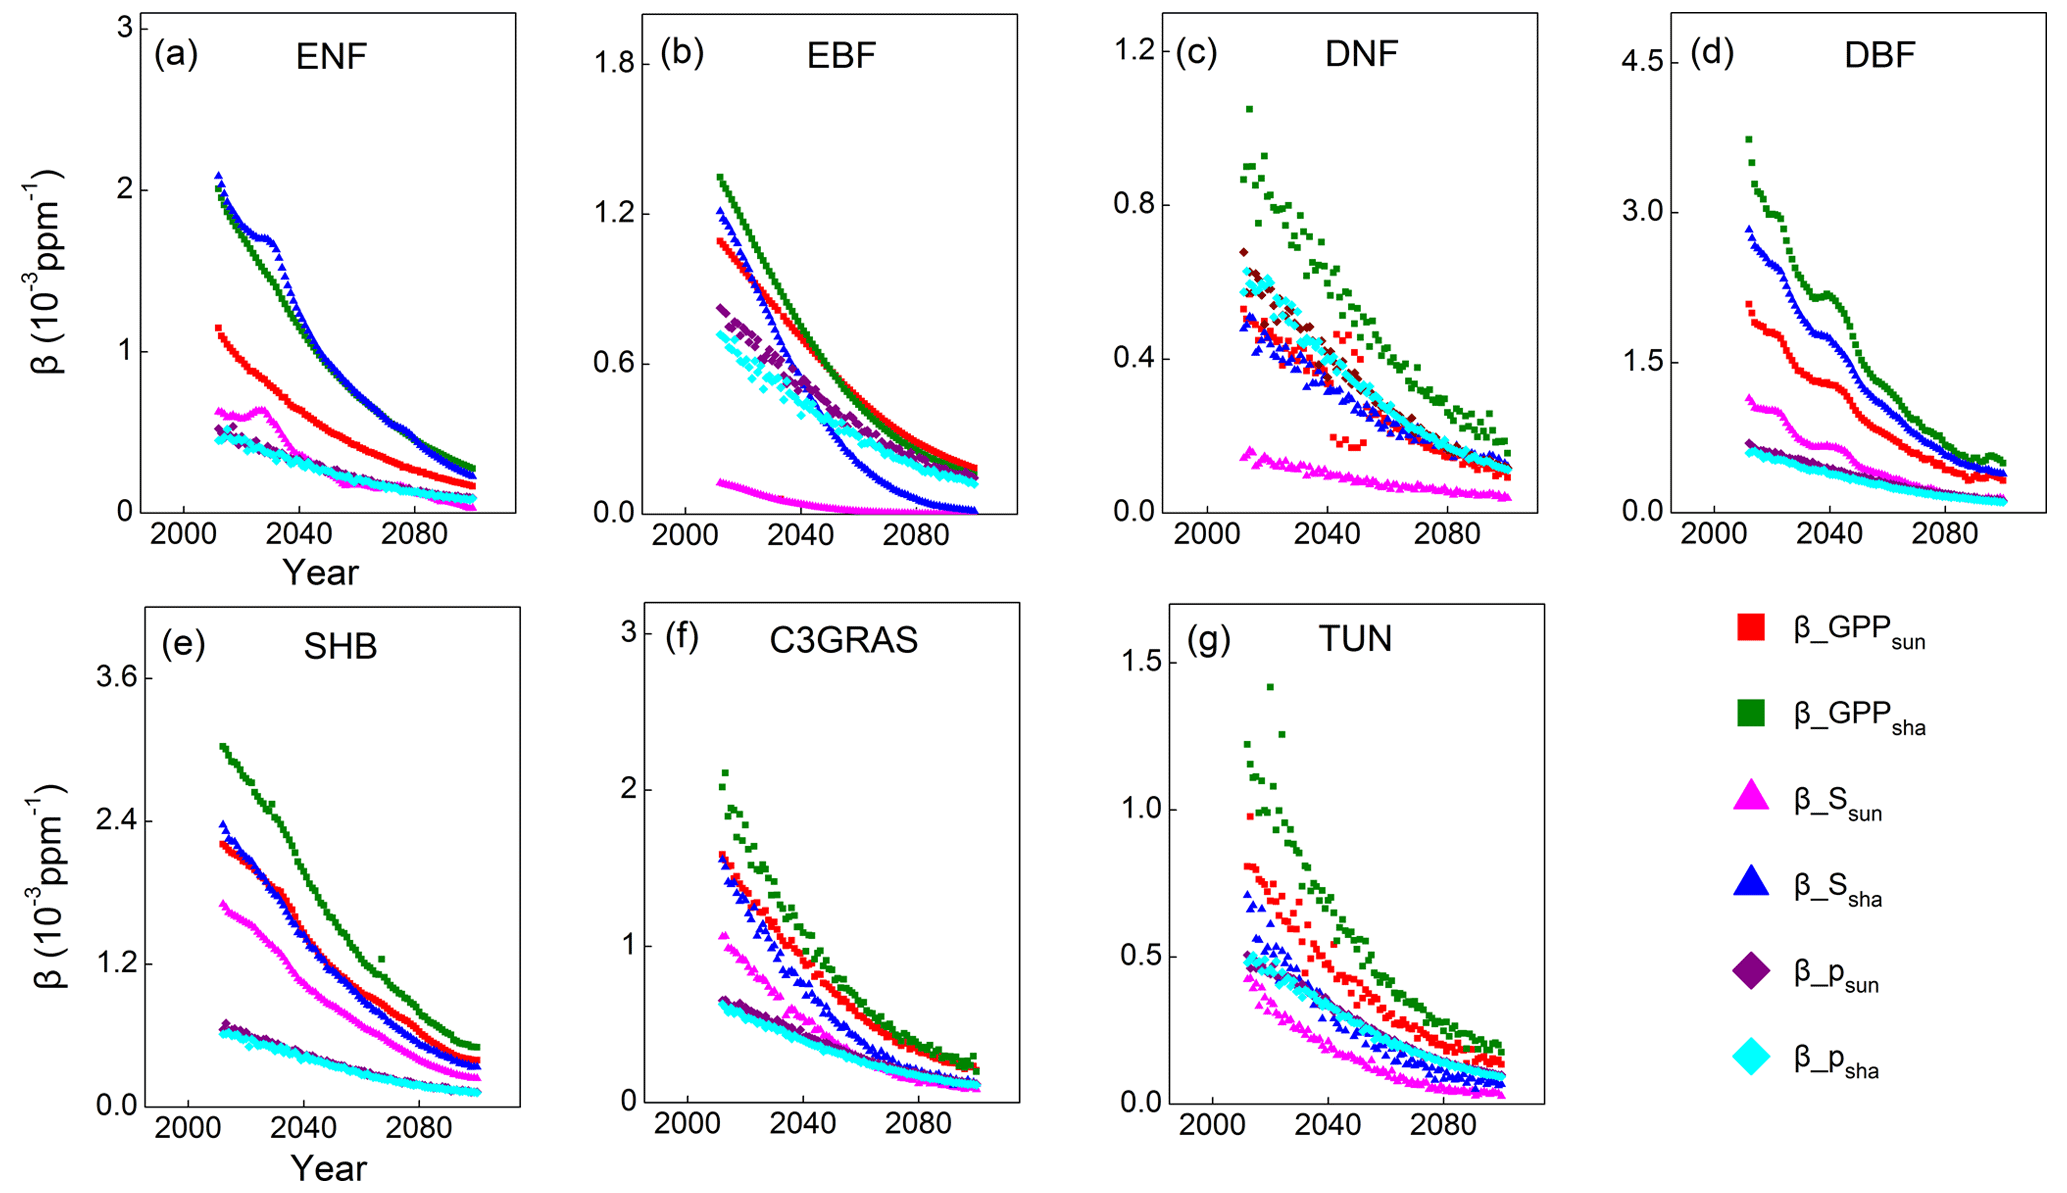
Figure 6Temporal trends of (sensitivity of sunlit leaf GPP; red squares), (sensitivity of shaded leaf GPP; green squares), (sensitivity of scaling fatcor for sunlit leaf; pink triangles), (sensitivity of scaling fatcor for shaded leaf; dark blue triangles), (photosynthetic response for sunlit leaf; purple diamonds) and (photosynthetic response for shaded leaf; sky blue diamonds) for C3 PFTs from CABLE-C-only simulation. The sensitivities of GPPsun and GPPsha tend to approach zero through time because the decomposing factors , , and all decline with time. determines the magnitudes and trends of for almost all PFTs. Abbreviations are the same as Fig. 1.
The overall response of LAI to eCO2 depends on several processes in this study: (1) NPP increase, (2) change in allocation of NPP to leaf, (3) change in specific leaf area (SLA) in response to eCO2, and (4) PFT-specific minimum and maximum LAI values prescribed in the model. First, the low responses of LAI to eCO2 for deciduous needleleaf forest and tundra can be attributed to smaller NPP enhancements in cold areas. The large divergence of the response of LAI within PFTs is mainly due to the large range of NPP increment across different geographical locations. The reduced magnitude of βLAI under nutrient limitations is the direct outcome of reduced βNPP. Accurate estimate of response of GPP and NPP is therefore fundamental to realistic LAI modeling. Second, diverse allocation schemes influence the responses of LAI for different PFTs. And, results from two FACE (Duke Forest and Oak Ridge) experiments indicate that the carbon allocated to leaves is decreased and more carbon is allocated to woods or roots at higher CO2 concentration (De Kauwe et al., 2014). Unfortunately, CABLE has fixed allocation coefficients and likely overestimates LAI response, leading to overestimated responses of GPP, NPP and total carbon storage. Third, we fixed SLA to calculate LAI in CABLE. But a reduction in SLA is a commonly observed response in eCO2 experiments (Luo et al., 1994; Ainsworth and Long, 2005; De Kauwe et al., 2014). Tachiiri et al. (2012) also found SLA and β values are most effectively constrained by observed LAI to smaller values in a model. Therefore, the fixed SLA may also lead to over-prediction of the response of canopy cover to eCO2. Fourth, in our results, LAI values for most C3 PFTs are below the maximum LAI limits with eCO2 in C-only simulation. With only one exception, LAI values of many evergreen broadleaf forest patches saturate at the prescribed maximum value under high CO2 concentration (Fig. S1a and Table S1). That is why the sensitivity of LAI for evergreen broadleaf forest is low and thus leads to small relative GPP enhancements. If the preset LAI upper limits are narrowed, β values are expected to be significantly reduced. Hence model parameters related to LAI need to be better calibrated according to experiments and observations in order to better represent the response of ecosystem productivity to eCO2 (De Kauwe et al., 2014; Qu and Zhuang, 2018).
In this study, the almost identical values and variance of βNPP to those of βGPP within and across C3 PFTs in C-only simulation suggest carbon use efficiency (CUE) does not change with eCO2, as autotrophic respiration is calculated from GPP and plant carbon. In C–N and C–N–P simulations, magnitudes of βNPP for all C3 PFTs except evergreen broadleaf forest all decline compared with those of βGPP, indicating CUE also declines with eCO2 under nutrient limitations. However, FACE experimental results indicate that CUE values under eCO2 are not changed in the N-limited Duke site (Hamilton et al., 2002; Schäfer et al., 2003), increase in the fertile POPFACE site (Gielen et al., 2005) or decrease in the fertile ORNL site (DeLucia et al., 2005). Thus, representations of nutrient effects on GPP and autotrophic respiration in land-surface models should be carefully calibrated with experimental data (DeLucia et al., 2007). Our results also show that βNPP values diverge more than βGPP values across different PFTs in nutrient-coupled simulations, because the different nutrient-limiting effects on autotrophic respiration introduce additional variation across different PFTs. Although β values at ecosystem levels are more variable with nutrient effects, LAI responses are still linearly correlated well with βGPP, βNPP and βcpool across C3 PFTs in nutrient-coupled simulations as in C-only simulation, confirming the dominant role of LAI in regulating carbon-cycle response under CO2 fertilization.
The reduced magnitudes of βcpool compared with those of βGPP and βNPP in all simulations indicate carbon turnover processes make ecosystems respond to eCO2 less sensitively due to the slow allocation and carbon turnover processes. A previous study using seven global vegetation models identified carbon residence time as the dominant cause of uncertainty in terrestrial vegetation responses to future climate and atmospheric CO2 change (Friend et al., 2014). The response of soil carbon storage to eCO2 also depends on soil carbon residence time (Harrison et al., 1993). In this study and many other models, allocation coefficients were fixed over time (Walker et al., 2014). But allocation patterns to plant organs with different lifespans have been reported to change in response to eCO2 in experiments, thereby altering carbon residence time in plants and soil (De Kauwe et al., 2014). Therefore, the fixed allocation scheme we adopted in this study might lead to some biases in simulating the response of carbon residence time to eCO2. In our study, soil decomposition rate is assumed not to be affected by CO2 level, as in most other conventional soil carbon models (Friedlingstein et al., 2006; Luo et al., 2016). However, recent synthesis of experimental data suggested that replenishment of new carbon into soil due to eCO2 increases turnover rate of soil carbon (Van Groenigen et al., 2014; Van Groenigen et al., 2017). Within a certain PFT, the variation of βcpool across different geographical locations is usually smaller than that of βNPP, while the greater variation of βcpool than that of βNPP across different C3 PFTs in C-only simulation suggests other processes such as different carbon allocation patterns, plant carbon turnover, and the soil carbon dynamics of various PFTs are responsible for the additional divergence. In nutrient-coupled simulations, the variations of βcpool across different C3 PFTs are only slightly larger than those of βNPP, indicating that nutrients do not bring many differential effects on carbon turnover processes for different PFTs.
4.3 Implication for understanding β in other models
Although we analyzed a single land-surface model in detail, the patterns of and mechanisms underlying the variability of β we found may be generally applicable to other models. The basic Farquhar photosynthesis model and two-leaf scaling scheme in the CABLE model are shared by many land-surface models. Some models use variants of the Farquhar photosynthesis model such as the co-limitation approach described by Collatz et al. (1991). Inflection point from Rubisco- to RuBP-limited processes is an important control of the absolute photosynthetic response to eCO2 (Rogers et al., 2016). However, the relative photosynthetic responses for different ecosystems will converge to a small range because the normalized photosynthetic response to eCO2 only depends on estimates of intercellular CO2 concentration (Ci), Michaelis–Menten constants (Kc, Ko) and CO2 compensation point (Γ∗), and the relative photosynthetic responses are similar for either Rubisco- or RuBP-limited photosynthesis (Luo et al., 1996; Luo and Mooney, 1996). Soil moisture availability is another key constraint on photosynthetic response. Water stress on plants is generally alleviated under eCO2 due to reduced stomatal conductance (Leuzinger and Körner, 2007; Fatichi et al., 2016). Different models simulate diverse levels of water stress on productivity (De Kauwe et al., 2017). Water stress is simulated in many models to regulate stomatal conductance (Rogers et al., 2016; Wu et al., 2018). For example, the CABLE model represents water stress by an empirical relationship based on soil texture and limits the slope of the coupled relationship between photosynthesis rate and stomatal conductance as Eq. (S11). The influence of water stress is reflected by Ci. Synthesis of many empirical study results and our results in this study all show that the ratio of Ci to Ca is relatively constant, probably due to homeostatic regulations through photosynthetic rate and stomatal conductance (Pearcy and Ehleringer, 1984; Evans and Farquhar, 1991). Wong et al. (1979) showed plant stomata could maintain a constant Ci∕Ca ratio across a wide range of environmental conditions, including the water stress condition. Land-surface models might simulate relatively constant Ci∕Ca ratios under water stress as well since photosynthesis and stomatal conductance are theoretically depicted based on experimental results. Moreover, Luo and Mooney (1996) found that changing the Ci∕Ca ratio from 0.6 to 0.8 caused a variation of less than 0.08 in the sensitivity of leaf photosynthesis to a unit of increase in Ca. Kc and Ko are variable among species, but only slightly affect leaf-level response (Luo and Mooney, 1996). Different leaf temperature will exert a limited influence on the variability of leaf-level β, as we discussed above. Therefore, leaf-level β values for different C3 PFTs are more likely to converge in other land-surface models.
A recent study used 16 crop models to simulate rice yield at two FACE sites (Hasegawa et al., 2017). These models have diverse representations of primary productivity. Their results showed that the variation of yield response across models was not much associated with model structure or magnitude of primary photosynthetic response to eCO2, but was significantly related to the estimations of leaf area. This is consistent with our conclusion and highlights the great need to improve prognostic LAI modeling. Other land-surface modeling groups may benefit from a similar analysis to identify major causes of variability of β across the hierarchical levels from biochemistry to land carbon storage. Candidate causes that can make substantial contributions to the variability include changes in leaf area index, changes in carbon use efficiency and changes in land carbon residence times. If modeling groups can add leaf-level diagnostics in the next inter-model comparison project, it will greatly help disentangle the uncertainty of concentration–carbon feedback.
Exploring the variability of β at different hierarchical levels within and across different C3 PFTs helps unravel model mechanisms that govern terrestrial ecosystem responses to elevated CO2. Our study shows that the sensitivities of biochemistry and leaf-level photosynthesis to eCO2 are very similar within and across C3 PFTs in C-only, C–N and C–N–P simulations of CABLE, in accordance with previous theoretical analysis, while β values of GPP, NPP and ecosystem carbon storage diverge primarily because the sensitivities of LAI significantly differ within and across different PFTs in all simulations. After decomposing β into photosynthetic and LAI components, we find LAI contributes more than photosynthesis to the magnitudes and trends of model responses. Our results indicate that processes related to LAI need to be better constrained with results from experiments and observations in order to better represent the responses of ecosystem carbon cycle processes to changes in CO2 and climate.
The CABLE code is available online https://trac.nci.org.au/trac/cable (Kowalczyk et al., 2006; Wang et al., 2010, 2011). The MATLAB codes for processing model outputs can be accessed by sending an e-mail to lqy14@mails.tsinghua.edu.cn.
The supplement related to this article is available online at: https://doi.org/10.5194/bg-15-6909-2018-supplement.
QL and YL designed the study. QL and XL conducted the model simulations. XL, YL, YW and XH helped to solve the problems of coding. QL, XL, YL and PMC analyzed the results together. All the co-authors were involved in writing the paper and contributed to the review process.
The authors declare that they have no conflict of interest.
We acknowledge the CSIRO supercomputing facility (pearcey) for running the
CABLE model. We thank Tsinghua University for providing the Scholarship for
Overseas Graduate Studies. This paper is financially supported by the
National Key R&D Program of China (2017YFA0604604).
Edited by: Christopher A. Williams
Reviewed
by: Martin De Kauwe and one anonymous referee
Aerts, R. and Chapin, F. S.: The mineral nutrition of wild plants revisited: A re-evaluation of processes and patterns, Adv. Ecol. Res., 30, 1–67, 2000.
Ainsworth, E. A. and Long, S. P.: What have we learned from 15 years of free-air CO2 enrichment (FACE)? A metaanalytic review of the responses of photosynthesis, canopy properties and plant production to rising CO2: Tansley review, New Phytol., 165, 351–372, 2004.
Anav, A., Friedlingstein, P., Kidston, M., Bopp, L., Ciais, P., Cox, P. M., Jones, C. D., Jung, M., Myneni, R. B., and Zhu, Z.: Evaluating the land and ocean components of the global carbon cycle in the CMIP5 earth system models, J. Clim., 26, 6801–6843, 2013.
Arora, V. K., Boer, G. J., Friedlingstein, P., Eby, M., Jones, C. D., Christian, J. R., Bonan, G., Bopp, L., Brovkin, V., Cadule, P., Hajima, T., Ilyina, T., Lindsay, K., Tjiputra, J. F., and Wu, T.: Carbon–Concentration and Carbon–Climate Feedbacks in CMIP5 Earth System Models, J. Clim., 26, 5289–5314, 2013.
Averill, C. and Waring, B.: Nitrogen limitation of decomposition and decay: How can it occur?, Glob. Change Biol., 24, 1417–1427, 2018.
Bacastow, R. and Keeling, C. D.: Atmospheric carbon dioxide and radiocarbon in the natural carbon cycle: II. Changes from A. D. 1700 to 2070 as deduced from a geochemical model, in: Carbon and the Biosphere, edited by: Woodwell, G. M. and Pecan, E. V., CONF-720510, 10 National Technical Information Service, Springfield, Va, 86–135, 1973.
Best, M. J., Pryor, M., Clark, D. B., Rooney, G. G., Essery, R. L. H., Ménard, C. B., Edwards, J. M., Hendry, M. A., Porson, A., Gedney, N., Mercado, L. M., Sitch, S., Blyth, E., Boucher, O., Cox, P. M., Grimmond, C. S. B., and Harding, R. J.: The Joint UK Land Environment Simulator (JULES), model description Part 1: Energy and water fluxes, Geosci. Model Dev., 4, 677–699, https://doi.org/10.5194/gmd-4-677-2011, 2011.
Bonan, G. B. and Levis, S.: Quantifying carbon-nitrogen feedbacks In the Community Land Model (CLM4), Geophys. Res. Lett., 37, L07401, https://doi.org/10.1029/2010GL042430, 2010.
Canadell, J. G., Pataki, D., Gifford, R., Houghton, R. A., Lou, Y., Raupach, M. R., Smith, P., and Steffen, W.: Saturation of the terrestrial carbon sink, in: Ecosystems in a Changing World, edited by: Canadell, J. G., Pataki, D., and Pitelka, L., The IGBP Series, Springer-Verlag, Berlin Heidelberg, 59–78, 2007a.
Clark, D. B., Mercado, L. M., Sitch, S., Jones, C. D., Gedney, N., Best, M. J., Pryor, M., Rooney, G. G., Essery, R. L. H., Blyth, E., Boucher, O., Harding, R. J., Huntingford, C., and Cox, P. M.: The Joint UK Land Environment Simulator (JULES), model description – Part 2: Carbon fluxes and vegetation dynamics, Geosci. Model Dev., 4, 701–722, https://doi.org/10.5194/gmd-4-701-2011, 2011.
Collatz, G. J., Ball, J. T., Grivet, C., and Berry, J. A.: Physiological and environmental regulation of stomatal conductance, photosynthesis and transpiration: a model that includes a laminar boundary layer, Agr. Forest Meteorol., 54, 107–136, 1991.
Collatz, G., Ribas-Carbo, M., and Berry, J.: Coupled Photosynthesis-Stomatal Conductance Model for Leaves of C4 Plants, Aust. J. Plant Physiol., 19, 519–538, 1992.
Coskun, D., Britto, D. T., and Kronzucker, H. J.: Nutrient constraints on terrestrial carbon fixation: The role of nitrogen, J. Plant Physiol., 203, 95–109, 2016.
Cox, P. M.: Description of the TRIFFID Dynamic Global Vegetation Model Hadley Centre, Met Office, Technical Note 24, 2001.
Cox, P. M., Betts, R. A., Jones, C. D., Spall, S. A., and Totterdell, I. J.: Acceleration of global warming due to carbon-cycle feedbacks in a coupled climate model, Nature, 408, 184–187, 2000.
Dai, Y., Dickinson, R. E., and Wang, Y. P.: A two-big-leaf model for canopy temperature, photosynthesis, and stomatal conductance, J. Clim., 17, 2281–2299, 2004.
De Kauwe, M. G., Medlyn, B. E., Zaehle, S., Walker, A. P., Dietze, M. C., Wang, Y. P., Luo, Y. Q., Jain, A. K., El-Masri, B., Hickler, T., Warlind, D., Weng, E. S., Parton, W. J., Thornton, P. E., Wang, S. S., Prentice, I. C., Asao, S., Smith, B., McCarthy, H. R., Iversen, C. M., Hanson, P. J., Warren, J. M., Oren, R., and Norby, R. J.: Where does the carbon go? A model–data intercomparison of vegetation carbon allocation and turnover processes at two temperate forest free-air CO2 enrichment sites, New Phytol., 203, 883–899, 2014.
De Kauwe, M. G., Keenan, T. F., Medlyn, B. E., Prentice, I. C., and Terrer, C.: Satellite based estimates underestimate the effect of CO2 fertilization on net primary productivity, Nat. Clim. Change, 6, 892–893, 2016.
De Kauwe, M. G., Medlyn, B. E., Walker, A. P., Zaehle, S., Asao, S., Guenet, B., Harper, A. B., Hickler, T., Jain, A. K., Luo, Y., Lu, X., Luus, K., Parton, W. J., Shu, S., Wang, Y., Werner, C., Xia, J., Pendall, E., Morgan, J. A., Ryan, E. M., Carrillo, Y., Dijkstra, F. A., Zelikova, T. J., and Norby, R. J.: Challenging terrestrial biosphere models with data from the long-term multifactor Prairie Heating and CO2 Enrichment experiment, Glob. Change Biol., 23, 3623–3645, 2017.
DeLucia, E. H., Moore, D. J., and Norby, R. J.: Contrasting responses of forest ecosystems to rising atmospheric CO2: implications for the global C cycle, Global Biogeochem. Cy., 19, 1–9, 2005.
DeLucia, E. H., Drake, J. E., Thomas, R. B., and Gonzalez-Meler, M.: Forest carbon use efficiency: is respiration a constant fraction of gross primary production?, Glob. Change Biol., 13, 1157–1167, 2007.
Drake, B. G., Gonzàlez-Meler, M. A., and Long, S. P.: More efficient plants: a consequence of rising atmospheric CO2?, Annu. Rev. Plant. Biol., 48, 609–639, 1997.
Duursma, R. A., Gimeno, T. E., Boer, M. M., Crous, K. Y., Tjoelker, M. G., and Ellsworth, D. S.: Canopy leaf area of a mature evergreen Eucalyptus woodland does not respond to elevated atmospheric [CO2] but tracks water availability, Glob. Change Biol., 22, 1666–1676, 2016.
Ellsworth, D. S., Anderson, I. C., Crous, K. Y., Cooke, J., Drake, J. E., Gher-lenda, A. N., and Tjoelker, M. G.: Elevated CO2 does not increase eucalypt forest productivity on a low-phosphorus soil, Nat. Clim. Change, 7, 279–282, 2017.
Etheridge, D. M., Steele, L. P., Langenfelds, R. L., Francey, R. J., Barnola, J. M., and Morgan, V. I.: Natural and anthropogenic changes in atmospheric CO2 over the last 1000 years from air in Antarctic ice and firn, J. Geophys. Res.-Atmos., 101, 4115–4128, 1996.
Evans, J. R. and Farquhar, G. D.: Modeling canopy photosynthesis from the biochemistry of the C3 chloroplast, in: Modeling Crop Photosynthesis-from Biochemistry to Canopy, edited by: Boote, K. J. and Loomis, R. S., Madison, WI, Crop Science Soc. Am., 19, 1–15, 1991.
Ewert, F.: Modelling plant responses to elevated CO2: how important is leaf area index?, Ann. Bot., 93, 619–627, 2004.
Farquhar, G. D., von Caemmerer, S., and Berry, J. A.: A biochemical model of photosynthetic CO2 assimilation in leaves of C3 species, Planta, 149, 78–90, 1980.
Fatichi, S., Leuzinger, S., Paschalis, A., Langley, J. A., Donnellan Barraclough, A., and Hovenden, M. J.: Partitioning direct and indirect effects reveals the response of water-limited ecosystems to elevated CO2, P. Natl. Acad. Sci. USA, 113, 12757–12762, 2016.
Forzieri, G., Alkama, R., Miralles, D. G., and Cescatti, A.: Satellites reveal contrasting responses of regional climate to the widespread greening of Earth, Science, 356, 1180–1184, 2017.
Forzieri, G., Duveiller, G., Georgievski, G., Li, W., Robertson, E., Kautz, M., Lawrence, P., Garcia San Martin, L., Anthoni, P., Ciais, P., Pongratz, J., Sitch, S., Wiltshire, A., Arneth, A., and Cescatti, A.: Evaluating the interplay between biophysical processes and leaf area changes in Land Surface Models, J. Adv. Model. Earth Syst., 10, 1102–1126, 2018.
Friedlingstein, P.: Carbon cycle feedbacks and future climate change, Philos. T. R. Soc. A, 373, 20140421, https://doi.org/10.1098/rsta.2014.0421, 2015.
Friedlingstein, P., Cox, P., Betts, R., Bopp, L., von Bloh, W., Brovkin, V., Cadule, P., Doney, S., Eby, M., Fung, I., Bala, G., John, J., Jones, C., Joos, F., Kato, T., Kawamiya, M., Knorr, W. Lindsay, K., Matthews, H. D., Raddatz, T., Rayner, P., Reick, C., Roeckner, E., Schnitzler, K. G., Schnur, R., Strassmann, K., Weaver, A. J., Yoshikawa, C., and Zeng, N.: Climate-carbon cycle feedback analysis: Results from the C4MIP model intercomparison, J. Clim., 19, 3337–3353, 2006.
Friend, A. D., Lucht, W., Rademacher, T. T., Keribin, R., Betts, R., Cadule, P., Ciais, P., Clark, D. B., Dankers, R., Falloon, P. D., Ito, A., Kahana, R., Kleidon, A., Lomas, M. R., Nishina, K., Ostberg, S., Pavlick, R., Peylin, P., Schaphoff, S., Vuichard, N., Warszawski, L., Wiltshire, A., and Woodward, F. I.: Carbon residence time dominates uncertainty in terrestrial vegetation responses to future climate and atmospheric CO2, P. Natl. Acad. Sci. USA, 111, 3280–3285, 2014.
Fung, I. Y., Doney, S. C., Lindsay, K., and John, J.: Evolution of carbon sinks in a changing climate, P. Natl. Acad. Sci. USA, 102, 11201–11206, 2005.
Gielen, B., Calfapietra, C., Lukac, M., Wittig, V. E., De Angelis, P., Janssens, I. A., Moscatelli, M. C., Grego, S., Cotrufo, M. F., Godbold, D. L., Hoosbeek, M. R., Long, S. P., Miglietta, F., Polle, A., Bernacchi, C. J., Davey, P. A., Ceulemans, R., and Scarascia-Mugnozza, G. E.: Net carbon storage in a poplar plantation (POPFACE) after three years of free-air CO2 enrichment, Tree Physiol., 25, 1399–1408, 2005.
Gregory, J. M., Jones, C. D., Cadule, P., and Friedlingstein, P.: Quantifying carbon cycle feedbacks, J. Clim., 22, 5232–5250, 2009.
Hajima, T., Tachiiri, K., Ito, A., and Kawamiya, M.: Uncertainty of Concentration–Terrestrial Carbon Feedback in Earth System Models*, J. Clim., 27, 3425–3445, 2014.
Hamilton, J. G., DeLucia, E. H., George, K., Naidu, S. L., Finzi, A. C., and Schlesinger, W. H.: Forest carbon balance under elevated CO2, Oecologia, 131, 250–260, 2002.
Harper, A. B., Cox, P. M., Friedlingstein, P., Wiltshire, A. J., Jones, C. D., Sitch, S., Mercado, L. M., Groenendijk, M., Robertson, E., Kattge, J., Bönisch, G., Atkin, O. K., Bahn, M., Cornelissen, J., Niinemets, Ü., Onipchenko, V., Peñuelas, J., Poorter, L., Reich, P. B., Soudzilovskaia, N. A., and Bodegom, P. V.: Improved representation of plant functional types and physiology in the Joint UK Land Environment Simulator (JULES v4.2) using plant trait information, Geosci. Model Dev., 9, 2415–2440, https://doi.org/10.5194/gmd-9-2415-2016, 2016.
Harrison, K., Broecker, W., and Bonani, G.: A strategy for estimating the impact of CO2 fertilization on soil C storage, Global Biogeochem. Cy., 7, 69–80, 1993.
Hasegawa, T., Li, T., Yin, X., Zhu, Y., Boote, K., Baker, J., Bregaglio, S., Buis, S., Confalonieri, R., and Fugice, J.: Causes of variation among rice models in yield response to CO2 examined with Free-Air CO2 Enrichment and growth chamber experiments, Sci. Rep.-UK, 7, 14858, https://doi.org/10.1038/s41598-017-13582-y, 2017.
Heimann, M. and Reichstein, M.: Terrestrial ecosystem carbon dynamics and climate feedbacks, Nature, 451, 289–292, 2008.
Hu, S., Chapin III, F. S., Firestone, M. K., Field, C. B., and Chiariello, N. R.: Nitrogen limitation of microbial decomposition in a grassland under elevated CO2, Nature, 409, 188–191, 2001.
Hunt, H. W., Ingham, E. R., Coleman, D. C., Elliott, E. T., and Reid, C. P. P.: Nitrogen limitation of production and decomposition in prairie, mountain meadow, and pine forest, Ecology, 69, 1009–1016, 1988.
Huntzinger, D. N., Michalak, A. M., Schwalm, C., Ciais, P., King, A. W., Fang, Y., Schaefer, K., Wei, Y., Cook, R. B., Fisher, J. B., Hayes, D., Huang, M., Ito, A., Jain, A. K., Lei, H., Lu, C., Maignan, F., Mao, J., Parazoo, N., Peng, S., Poulter, B., Ricciuto, D., Shi, X., Tian, H., Wang, W., Zeng, N., and Zhao, F.: Uncertainty in the response of terrestrial carbon sink to environmental drivers undermines carbon-climate feedback predictions, Sci. Rep.-UK, 7, 4765, https://doi.org/10.1038/s41598-017-03818-2, 2017.
Hurrell, J. W., Holland, M., Gent, P., Ghan, S., Kay, J. E., Kushner, P., Lamarque, J.-F., Large, W., Lawrence, D., Lindsay, K., Lipscomb, W. H., Long, M. C., Mahowald, N., Marsh, D. R., Neale, R. B., Rasch, P., Vavrus, S., Vertenstein, M., Bader, D., Collins, W. D., Hack, J. J., Kiehl, J., and Marshall, S.: The community earth system model: a framework for collaborative research, B. Am. Meteorol. Soc., 94, 1339–1360, 2013.
Iversen, C. M., Keller, J. K., Garten, C. T., and Norby, R. J.: Soil carbon and nitrogen cycling and storage throughout the soil profile in a sweetgum plantation after 11 years of CO2-enrichment, Glob. Change Biol., 18, 1684–1697, 2012.
Jiang, C., Ryu, Y., Fang, H., Myneni, R., Claverie, M., and Zhu, Z.: Inconsistencies of interannual variability and trends in long-term satellite leaf area index products, Glob. Change Biol., 23, 4133–4146, 2017.
Joos, F., Prentice, I. C., Sitch, S., Meyer, R., Hooss, G., Plattner, G.-K., Gerber, S., and Hasselmann, K.: Global warming feedbacks on terrestrial carbon uptake under the IPCC emission scenarios, Global Biogeochem. Cy., 15, 891–907, 2001.
Kattge, J., Knorr, W., Raddatz, T., and Wirth, C.: Quantifying photosynthetic capacity and its relationship to leaf nitrogen content for global-scale terrestrial biosphere models, Glob. Change Biol., 15, 976–991, 2009.
Kowalczyk, E., Wang, Y., Law, R., Davies, H., McGregor, J., and Abramowitz, G.: The CSIRO Atmosphere Biosphere Land Exchange (CABLE) model for use in climate models and as an offline model, CSIRO Marine and Atmospheric Research Paper, 13, 1–37, 2006.
Lamarque, J.-F., Bond, T. C., Eyring, V., Granier, C., Heil, A., Klimont, Z., Lee, D., Liousse, C., Mieville, A., Owen, B., Schultz, M. G., Shindell, D., Smith, S. J., Stehfest, E., Van Aardenne, J., Cooper, O. R., Kainuma, M., Mahowald, N., McConnell, J. R., Naik, V., Riahi, K., and van Vuuren, D. P.: Historical (1850–2000) gridded anthropogenic and biomass burning emissions of reactive gases and aerosols: methodology and application, Atmos. Chem. Phys., 10, 7017–7039, https://doi.org/10.5194/acp-10-7017-2010, 2010.
Lamarque, J. F., Kyle, G. P., Meinshausen, M., Riahi, K., Smith, S. J., van Vuuren, D. P., Conley, A. J., and Vitt, F.: Global and regional evolution of short-lived radiatively-active gases and aerosols in the Representative Concentration Pathways, Climate Change, 109, 191–212, 2011.
Le Quéré, C., Andrew, R. M., Friedlingstein, P., Sitch, S., Pongratz, J., Manning, A. C., Korsbakken, J. I., Peters, G. P., Canadell, J. G., Jackson, R. B., Boden, T. A., Tans, P. P., Andrews, O. D., Arora, V. K., Bakker, D. C. E., Barbero, L., Becker, M., Betts, R. A., Bopp, L., Chevallier, F., Chini, L. P., Ciais, P., Cosca, C. E., Cross, J., Currie, K., Gasser, T., Harris, I., Hauck, J., Haverd, V., Houghton, R. A., Hunt, C. W., Hurtt, G., Ilyina, T., Jain, A. K., Kato, E., Kautz, M., Keeling, R. F., Klein Goldewijk, K., Körtzinger, A., Landschützer, P., Lefèvre, N., Lenton, A., Lienert, S., Lima, I., Lombardozzi, D., Metzl, N., Millero, F., Monteiro, P. M. S., Munro, D. R., Nabel, J. E. M. S., Nakaoka, S.-I., Nojiri, Y., Padin, X. A., Peregon, A., Pfeil, B., Pierrot, D., Poulter, B., Rehder, G., Reimer, J., Rödenbeck, C., Schwinger, J., Séférian, R., Skjelvan, I., Stocker, B. D., Tian, H., Tilbrook, B., Tubiello, F. N., van der Laan-Luijkx, I. T., van der Werf, G. R., van Heuven, S., Viovy, N., Vuichard, N., Walker, A. P., Watson, A. J., Wiltshire, A. J., Zaehle, S., and Zhu, D.: Global Carbon Budget 2017, Earth Syst. Sci. Data, 10, 405–448, https://doi.org/10.5194/essd-10-405-2018, 2018.
Leuning, R.: Modelling stomatal behaviour and photosynthesis of Eucalyptus grandis, Funct. Plant Biol., 17, 159–175, 1990.
Leuzinger, S. and Körner, C.: Water savings in mature deciduous forest trees under elevated CO2, Glob. Change Biol., 13, 2498–2508, 2007.
Leuzinger, S., Luo, Y., Beier, C., Dieleman, W., Vicca, S., and Koerner, C.: Do global change experiments overestimate impacts on terrestrial ecosystems?, Trends Ecol. Evolut., 26, 236–241, 2011.
Long, S. P., Ainsworth, E. A., Rogers, A., and Ort, D. R.: Rising atmospheric carbon dioxide: plants FACE the Future*, Annu. Rev. Plant Biol., 55, 591–628, 2004.
Long, S. P., Ainsworth, E. A., Leakey, A. D., Nösberger, J., and Ort, D. R.: Food for thought: lower-than-expected crop yield stimulation with rising CO2 concentrations, Science, 312, 1918–1921, 2006.
Luo, Y. and Mooney, H. A.: Stimulation of global photosynthetic carbon influx by an increase in atmospheric carbon dioxide concentration, in: Carbon Dioxide and Terrestrial Ecosystems, edited by: Koch, G. W. and Mooney, H. A., Academic Press, San Diego, 381–397, 1996.
Luo, Y., Field, C. B., and Mooney, H. A.: Predicting responses of photosynthesis and root fraction to elevated [CO2] a: interactions among carbon, nitrogen, and growth, Plant Cell Environ., 17, 1195–1204, 1994.
Luo, Y., Sims, D. A., Thomas, R. B., Tissue, D. T., and Ball, J. T.: Sensitivity of leaf photosynthesis to CO2 concentration is an invariant function for C3 plants: A test with experimental data and global applications, Global Biogeochem. Cy., 10, 209–222, 1996.
Luo, Y., Su, B., Currie, W. S., Dukes, J. S., Finzi, A. C., Hartwig, U., Hungate, B., McMurtrie, R. E., Oren, R., Parton, W. J., Pataki, D. E., Shaw, M. R., Zak, D. R., and Field, C. B.: Progressive nitrogen limitation of ecosystem responses to rising atmospheric carbon dioxide, Bioscience, 54, 731–739, 2004.
Luo, Y., Ahlström, A., Allison, S. D., Batjes, N. H., Brovkin, V., Carvalhais, N., Chappell, A., Ciais, P., Davidson, E. A., Finzi, A., Georgiou, K., Guenet, B., Hararuk, O., Harden, J. W., He, Y., Hopkins, F., Jiang, L., Koven, C., Jackson, R. B., Jones, C. D., Lara, M. J., Liang, J., McGuire, A. D., Parton, W., Peng, C., Randerson, J. T., Salazar, A., Sierra, C. A., Smith, M. J., Tian, H., ToddBrown, K. E. O., Torn, M., van Groenigen, K. J., Wang, Y. P., West, T. O., Wei, Y., Wieder, W. R., Xia, J., Xu, X., Xu, X., and Zhou, T.: Toward more realistic projections of soil carbon dynamics by Earth system models, Global Biogeochem. Cy., 30, 40–56, 2016.
MacFarling Meure, C., Etheridge, D., Trudinger, C., Steele, P., Langenfelds, R., van Ommen, T., Smith, A., and Elkins, J.: Law Dome CO2, CH4 and N2O ice core records extended to 2000 years BP, Geophys. Res. Lett., 33, L14810, https://doi.org/10.1029/2006GL0, 2006.
Mahowald, N., Jickells, T. D., Baker, A. R., Artaxo, P., Benitez-Nelson, C. R., Bergametti, G., Bond, T. C., Chen, Y., Cohen, D. D., Herut, B., Kubilay, N., Losno, R., Luo, C., Maenhaut, W., McGee, K. A., Okin, G. S., Siefert, R. L., and Tsukuda, S.: Global distribution of atmospheric phosphorus sources, concentrations and deposition rates, and anthropogenic impacts, Global Biogeochem. Cy., 22, GB4026, https://doi.org/10.1029/2008GB003240, 2008.
Mystakidis, S., Seneviratne, S. I., Gruber, N., and Davin, E. L.: Hydrological and biogeochemical constraints on terrestrial carbon cycle feedbacks, Environ. Res. Lett., 12, 014009, https://doi.org/10.1088/1748-9326/12/1/014009, 2017.
Neff, J. C., Townsend, A. R., Gleixner, G., Lehman, S. J., Turnbull, J., and Bowman, W. D.: Variable effects of nitrogen additions on the stability and turnover of soil carbon, Nature, 419, 915–917, 2002.
Norby, R. J., Sholtis, J. D., Gunderson, C. A., and Jawdy, S. S.: Leaf dynamics of a deciduous forest canopy: no response to elevated CO2, Oecologia, 136, 574–584, 2003.
Norby, R. J., DeLucia, E. H., Gielen, B., Calfapietra, C., Giardina, C. P., King, J. S., Ledford, J., McCarthy, H. R., Moore, D. J. P., Ceulemans, R., De Angelis, P., Finzi, A. C., Karnosky, D. F., Kubiske, M. E., Lukac, M., Pregitzer, K. S., ScarasciaMugnozza, G. E., Schlesinger, W. H., and Oren, R.: Forest response to elevated CO2 is conserved across a broad range of productivity, P. Natl. Acad. Sci. USA, 102, 18052–18056, 2005.
Oleson, K., Lawrence, D. M., Bonan, G. B., Drewniak, B., Huang, M., Koven, C. D., Levis, S., Li, F., Riley, W. J., Subin, Z. M., Swenson, S. C., Thornton, P. E., Bozbiyik, A., Fisher, R., Heald, C. L., Kluzek, E., Lamarque, J.-F., Lawrence, P. J., Leung, L. R., Lipscomb, W., Muszala, S., Ricciuto, D. M., Sacks, W., Sun, Y., Tang, J., and Yang, Z.-L.: Technical Description of version 4.5 of the Community Land Model (CLM), NCAR Technical Note NCAR/TN-503+STR, Boulder, Colorado, 420 pp., 2013.
Pearcy, R. W. and Ehleringer, J.: Comparative ecophysiology of C3 and C4 plants, Plant Cell Environ., 7, 1–13, 1984.
Peng, J., Dan, L., and Huang, M.: Sensitivity of global and regional terrestrial carbon storage to the direct CO2 effect and climate change based on the CMIP5 model intercomparison, PloS one, 9, e95282, https://doi.org/10.1371/journal.pone.0095282, 2014.
Polglase, P. J. and Wang, Y. P.: Potential CO2-enhanced carbon storage by the terrestrial biosphere, Aust. J. Bot., 40, 641–656, 1992.
Qu, Y. and Zhuang, Q.: Modeling leaf area index in North America using a process-based terrestrial ecosystem model, Ecosphere, 9, https://doi.org/10.1002/ecs2.204, 2018.
Rogers, A., Medlyn, B. E., Dukes, J. S., Bonan, G., von Caemmerer, S., Dietze, M. C., Kattge, J., Leakey, A. D. B., Mercado, L. M., Niinemets, Ü., Prentice, I. C., Serbin, S. P., Sitch, S., Way, D. A., and Zaehle, S.: A roadmap for improving the representation of photosynthesis in earth system models, New Phytol., 213, 22–42, 2016.
Schäfer, K. V. R., Oren, R., Ellsworth, D. S., Lai, C. T., Herrick, J. D., Finzi, A. C., Richter, D. D., and Katul, G. G.: Exposure to an enriched CO2 atmosphere alters carbon assimilation and allocation in a pine forest ecosystem, Glob. Chang Biol., 9, 1378–1400, 2003.
Smith, W. K., Reed, S. C., Cleveland, C. C., Ballantyne, A. P., Anderegg, W. R. L., Wieder, W. R., Liu, Y. Y., and Running, S. W.: Large divergence of satellite and Earth system model estimates of global terrestrial CO2 fertilization, Nat. Clim. Change, 6, 306–310, 2016.
Sokolov, A. P., Kicklighter, D. W., Melillo, J. M., Felzer, B. S., Schlosser, C. A., and Cronin, T. W.: Consequences of considering carbon–nitrogen interactions on the feedbacks between climate and the terrestrial carbon cycle, J. Clim., 21, 3776–3796, 2008.
Tachiiri, K., Ito, A., Hajima, T., Hargreaves, J. C., Annan, J. D., and Kawamiya, M.: Nonlinearity of land carbon sensitivities in climate change simulations, J. Meteor. Soc. Jpn., 90, 259–274, 2012.
Thornton, P. E., Lamarque, J. F., Rosenbloom, N. A., and Mahowald, N. M.: Influence of carbon-nitrogen cycle coupling on land model response to CO2 fertilization and climate variability, Global Biogeochem. Cy., 21, GB4018, https://doi.org/10.1029/2006GB002868, 2007.
Thornton, P. E., Doney, S. C., Lindsay, K., Moore, J. K., Mahowald, N., Randerson, J. T., Fung, I., Lamarque, J. F., Feddema, J. J., and Lee, Y. H.: Carbon-nitrogen interactions regulate climate-carbon cycle feedbacks: results from an atmosphere ocean general circulation model, Biogeosciences, 6, 2099–2120, https://doi.org/10.5194/bg-6-2099-2009, 2009.
Van Groenigen, K. J., Qi, X., Osenberg, C. W., Luo, Y., and Hungate, B. A.: Faster decomposition under increased atmospheric CO2 limits soil C storage, Science, 344, 508–509, 2014.
Van Groenigen, K. J., Osenberg, C. W., Terrer, C., Carrillo, Y., Dijkstra, F. A., Heath, J., Nie, M., Pendall, E., Phillips, R. P., and Hungate, B. A.: Faster turnover of new soil carbon inputs under increased atmospheric CO2, Glob. Chang Biol., 23, 4420–4429, 2017.
Vitousek, P. M., Porder, S., Houlton, B. Z., and Chadwick, O. A.: Terrestrial phosphorus limitation: mechanisms, implications, and nitrogen–phosphorus interactions, Ecol. Appl., 20, 5–15, 2010.
Walker, A. P., Hanson, P. J., De Kauwe, M. G., Medlyn, B. E., Zaehle, S., Asao, S., Dietze, M., Hickler, T., Huntingford, C., Iversen, C. M., Jain, A., Lomas, M., Luo, Y., McCarthy, H., Parton, W. J., Prentice, I. C., Thornton, P. E., Wang, S., Wang, Y.-P., Warlind, D., Weng, E., Warren, J. M., Woodward, F. I., Oren, R., and Norby, R. J.: Comprehensive ecosystem model-data synthesis using multiple data sets at two temperate forest free-air CO2 enrichment experiments: Model performance at ambient CO2 concentration, J. Geophys. Res.-Biogeo., 119, 937–964, 2014.
Wang, Y. P. and Houlton, B. Z.: Nitrogen constraints on terrestrial carbon uptake: Implications for the global carbon-climate feedback, Geophys. Res. Lett., 36, L24403, https://doi.org/10.1029/2009GL041009, 2009.
Wang, Y. P., Law, R. M., and Pak, B.: A global model of carbon, nitrogen and phosphorus cycles for the terrestrial biosphere, Biogeosciences, 7, 2261–2282, https://doi.org/10.5194/bg-7-2261-2010, 2010.
Wang, Y. P., Kowalczyk, E., Leuning, R., Abramowitz, G., Raupach, M. R., Pak, B., van Gorsel, E., and Luhar, A.: Diagnosing errors in a land surface model (CABLE) in the time and frequency domains, J. Geophys. Res.-Biogeo., 116, G01034, https://doi.org/10.1029/2010JG001385, 2011.
Wang, Y. P., Lu, X. J., Wright, I. J., Dai, Y. J., Rayner, P. J., and Reich, P. B.: Correlations among leaf traits provide a significant constraint on the estimate of global gross primary production, Geophys. Res. Lett., 39, https://doi.org/10.1029/2012GL05346, 2012.
Wong, S. C., Cowan, I. R., and Farquhar, G. D.: Stomatal conductance correlates with photosynthetic capacity, Nature, 282, 424–426, 1979.
Wu, D., Ciais, P., Viovy, N., Knapp, A. K., Wilcox, K., Bahn, M., Smith, M. D., Vicca, S., Fatichi, S., Zscheischler, J., He, Y., Li, X., Ito, A., Arneth, A., Harper, A., Ukkola, A., Paschalis, A., Poulter, B., Peng, C., Ricciuto, D., Reinthaler, D., Chen, G., Tian, H., Genet, H., Mao, J., Ingrisch, J., Nabel, J. E. S. M., Pongratz, J., Boysen, L. R., Kautz, M., Schmitt, M., Meir, P., Zhu, Q., Hasibeder, R., Sippel, S., Dangal, S. R. S., Sitch, S., Shi, X., Wang, Y., Luo, Y., Liu, Y., and Piao, S.: Asymmetric responses of primary productivity to altered precipitation simulated by ecosystem models across three long-term grassland sites, Biogeosciences, 15, 3421–3437, https://doi.org/10.5194/bg-15-3421-2018, 2018.
Zaehle, S., Friedlingstein, P., and Friend, A. D.: Terrestrial nitrogen feedbacks may accelerate future climate change, Geophys. Res. Lett., 37, L01401, https://doi.org/10.1029/2009GL041345, 2010.
Zaehle, S., Medlyn, B. E., De Kauwe, M. G., Walker, A. P., Dietze, M. C., Hickler, T., Luo, Y., Wang, Y.-P., El-Masri, B., Thornton, P., Jain, A., Wang, S., Warlind, D., Weng, E., Parton, W., Iversen, C. M., Gallet-Budynek, A., McCarthy, H., Finzi, A., Hanson, P. J., Prentice, I. C., Oren, R., and Norby, R. J.: Evaluation of 11 terrestrial carbon-nitrogen cycle models against observations from two temperate Free-Air CO2 Enrichment studies, New Phytol., 202, 803–822, 2014.
Zeng, Z., Piao, S., Li, L. Z., Zhou, L., Ciais, P., Wang, T., Li, Y., Lian, X., Wood, E. F., and Friedlingstein, P.: Climate mitigation from vegetation biophysical feedbacks during the past three decades, Nat. Clim. Change, 7, 432–436, 2017.
Zhang, Q., Wang, Y. P., Pitman, A. J., and Dai, Y. J.: Limitations of nitrogen and phosphorous on the terrestrial carbon uptake in the 20th century, Geophys. Res. Lett., 38, https://doi.org/10.1029/2011GL049244, 2011.
Zhang, Q., Pitman, A. J., Wang, Y. P., Dai, Y. J., and Lawrence, P. J.: The impact of nitrogen and phosphorous limitation on the estimated terrestrial carbon balance and warming of land use change over the last 156 yr, Earth Syst. Dynam., 4, 333–345, 2013.
Zhu, Z., Piao, S., Myneni, R. B., Huang, M., Zeng, Z., Canadell, J. G., Ciais, P., Sitch, P., Friedlingstein, P., Arneth, A., Cao, C., Cheng, L., Kato, E., Koven, C., Li, Y., Lian, X., Liu, Y., Liu, R., Mao, J., Pan, Y., Peng, S., Peñuelas, J., Poulter, B., Pugh, T. A. M., Stocker, B. D., Viovy, N., Wang, X., Wang, Y., Xiao, Z., Yang, H., Zaehle, S., and Zeng, N.: Greening of the Earth and its drivers, Nat. Clim. Change, 6, 791–795, 2016.