the Creative Commons Attribution 3.0 License.
the Creative Commons Attribution 3.0 License.
Differential response of carbon cycling to long-term nutrient input and altered hydrological conditions in a continental Canadian peatland
Sina Berger
Leandra S. E. Praetzel
Marie Goebel
Christian Blodau
Klaus-Holger Knorr
Peatlands play an important role in global carbon cycling, but their responses to long-term anthropogenically changed hydrologic conditions and nutrient infiltration are not well known. While experimental manipulation studies, e.g., fertilization or water table manipulations, exist on the plot scale, only few studies have addressed such factors under in situ conditions. Therefore, an ecological gradient from the center to the periphery of a continental Canadian peatland bordering a eutrophic water reservoir, as reflected by increasing nutrient input, enhanced water level fluctuations, and increasing coverage of vascular plants, was used for a case study of carbon cycling along a sequence of four differently altered sites. We monitored carbon dioxide (CO2) and methane (CH4) surface fluxes and dissolved inorganic carbon (DIC) and CH4 concentrations in peat profiles from April 2014 through September 2015. Moreover, we studied bulk peat and pore-water quality and we applied δ13C–CH4 and δ13C–CO2 stable isotope abundance analyses to examine dominant CH4 production and emission pathways during the growing season of 2015. We observed differential responses of carbon cycling at the four sites, presumably driven by abundances of plant functional types and vicinity to the reservoir. A shrub-dominated site in close vicinity to the reservoir was a comparably weak sink for CO2 (in 1.5 years: −1093 ± 794, in 1 year: +135 ± 281 g CO2 m−2; a net release) as compared to two graminoid-moss-dominated sites and a moss-dominated site (in 1.5 years: −1552 to −2260 g CO2 m−2, in 1 year: −896 to −1282 g CO2 m−2). Also, the shrub-dominated site featured notably low DIC pore-water concentrations and comparably 13C-enriched CH4 (δ13C– CH4: −57.81 ± 7.03 ‰) and depleted CO2 (δ13C–CO2: −15.85 ± 3.61 ‰) in a more decomposed peat, suggesting a higher share of CH4 oxidation and differences in predominant methanogenic pathways. In comparison to all other sites, the graminoid-moss-dominated site in closer vicinity to the reservoir featured a ∼ 30 % higher CH4 emission (in 1.5 years: +61.4 ± 32, in 1 year: +39.86 ± 16.81 g CH4 m−2). Low δ13C–CH4 signatures (−62.30 ± 5.54 ‰) indicated only low mitigation of CH4 emissions by methanotrophic activity here. Pathways of methanogenesis and methanotrophy appeared to be related to the vicinity to the water reservoir: the importance of acetoclastic CH4 production apparently increased toward the reservoir, whereas the importance of CH4 oxidation increased toward the peatland center. Plant-mediated transport was the prevailing CH4 emission pathway at all sites even where graminoids were rare. Our study thus illustrates accelerated carbon cycling in a strongly altered peatland with consequences for CO2 and CH4 budgets. However, our results suggest that long-term excess nutrient input does not necessarily lead to a loss of the peatland carbon sink function.
- Article
(4902 KB) - Full-text XML
-
Supplement
(1043 KB) - BibTeX
- EndNote


Since the last deglaciation, northern peatlands have played an important role in global carbon (C) cycling by storing atmospheric carbon dioxide (CO2) as peat, but also emitting significant amounts of C as methane (CH4; Succow and Joosten, 2012). C sequestration and CO2 and CH4 release are driven by numerous processes, and the accumulation of peat results from only a small imbalance of photosynthetic C uptake over respiratory losses. CO2 can be released through autotrophic and heterotrophic respiration under aerobic and anaerobic conditions (Limpens et al., 2008). Heterotrophic respiration has been intensively studied and controls are manifold, as reviewed by Blodau (2002).
Methanogenesis is strictly limited to anaerobic conditions (Conrad, 2005). Due to thermodynamic controls, CH4 production is only competitive upon depletion of alternative, energetically more favorable electron acceptors for anaerobic respiration, such as nitrate, iron, sulfate, or oxidized humics (Blodau, 2002; Klüpfel et al., 2014). CH4 is predominantly produced via two pathways: hydrogenotrophic and acetoclastic methanogenesis. During hydrogenotrophic methanogenesis CO2 is reduced to CH4, while during acetoclastic methanogenesis acetate is split into CH4 and CO2. These pathways differ with respect to their discrimination against the heavier 13C isotopes due to the kinetic isotope effect (Hoefs, 1987). Differences in the isotopic composition are thereby commonly presented as δ13C values expressed as δ13C = ( [‰], where R is the ratio of heavy isotope to light isotope of the samples and the VPDB standard. Acetoclastic methanogenesis results in δ13C–CH4 values of −65 to −50 ‰, while hydrogenotrophic methanogenesis discriminates stronger against the heavier C isotope and results in δ13C–CH4 values of −110 to −60 ‰ and considerably 13C-enriched CO2 compared to the acetoclastic pathway (Whiticar et al., 1986). Specific patterns have been observed in terms of the spatial and temporal occurrence of the major CH4 production pathways, with acetoclastic methanogenesis typically increasing in contribution towards the surface or within the rhizosphere (Holmes et al., 2015). On the other hand, an assignment of methanogenic pathways based on 13C signatures of CH4 can be biased by microbial oxidation of CH4. This can in particular be the case in transition to the unsaturated profile where oxygen can enter by diffusion or in the rhizosphere where plants deliver oxygen through aerenchyma to their roots (Chasar et al., 2000). Upon oxidation of CH4 into CO2, the residual CH4 gets enriched in 13C compared to the source CH4 (Teh et al., 2006), a process which yields similar δ13C–CH4 signatures as observed upon CH4 production via the acetoclastic pathway.
CH4 is released to the atmosphere by three different processes: (i) diffusion through the acrotelm, which is a relatively slow process, (ii) ebullition, i.e., fast evasion of CH4 bubbles, and (iii) fast diffusion or pressurized throughflow convection through the aerenchymatous tissues of vascular plants (Morris et al., 2011; Schütz et al., 1991; Whiting and Chanton, 1996; van den Berg et al., 2016; Hornibrook et al., 2009). Due to the slow diffusion of CH4 in peat, up to 100 % of diffusive CH4 is oxidized in the acrotelm before it reaches the atmosphere, while the other processes effectively bypass oxidation and thus contribute a major fraction to observed fluxes (Whalen et al., 1990; Whalen, 2005). Therefore, a change in vascular plant cover or changes in the peat structure and degree of decomposition can be expected to affect CH4 emissions.
C cycling is strongly linked to nitrogen (N) cycling in peatlands. For these normally nutrient-limited ecosystems, eutrophication is a major threat, as demonstrated in several long-term fertilization experiments. A decade of fertilizer applications to bogs in Canada (Mer Bleue), in the UK (Whim bog), and in Sweden (Degerö Stormyr) and 7 years of high nitrogen deposition to a bog in the Italian Alps caused a loss of mosses and an increase in vascular plant biomass (Bubier et al., 2007; Wang et al., 2016; Sheppard et al., 2013; Wiedermann et al., 2007; Bragazza et al., 2012). In the Mer Bleue bog, nutrient addition mostly increased the abundance of shrubs, whereas at Whim bog, Degerö Stormyr, and an Italian mire, both shrub and graminoid cover increased. A number of studies supported the fact that an increase in vascular plant cover can reduce the productivity of peat mosses and, in addition, can potentially promote the decomposition of organic matter by affecting the stoichiometry of soil enzymatic activity (Bragazza et al., 2013, 2015). This could lead to a decreasing ability of peatlands to sequester CO2 from the atmosphere (Bubier et al., 2007) and to higher decomposition of peat (Rydin and Jeglum, 2013). Altered plant communities in peatlands were repeatedly shown to alter CO2 and CH4 fluxes: maximum net ecosystem exchange (NEE) was found to be reduced after long-term fertilization and a concomitantly promoted vascular plant community in the Mer Bleue bog (Bubier et al., 2007). Increased CH4 emissions were observed at Degerö Stormyr from plots with an increased vascular plant coverage after a decade of excess nutrient supply (Eriksson et al., 2010). Indeed, selective removal of plant functional types (PFTs) and vegetation changes can have a strong impact on gas exchange (Larmola et al., 2013; Ward et al., 2013; Kuiper et al., 2014; Robroek et al., 2015). While such plot-based manipulation experiments as reported above revealed clear patterns, there is still a gap of knowledge in terms of the long-term consequences of excess nutrient supply to a peatland and the resulting interactions and feedbacks between plants and peat, especially under in situ conditions. There is only a poor understanding of the interplay of PFTs, substrate quality, and anoxic–oxic conditions and of how the exchange of CO2 and CH4 at the soil–atmosphere interface would eventually be affected.
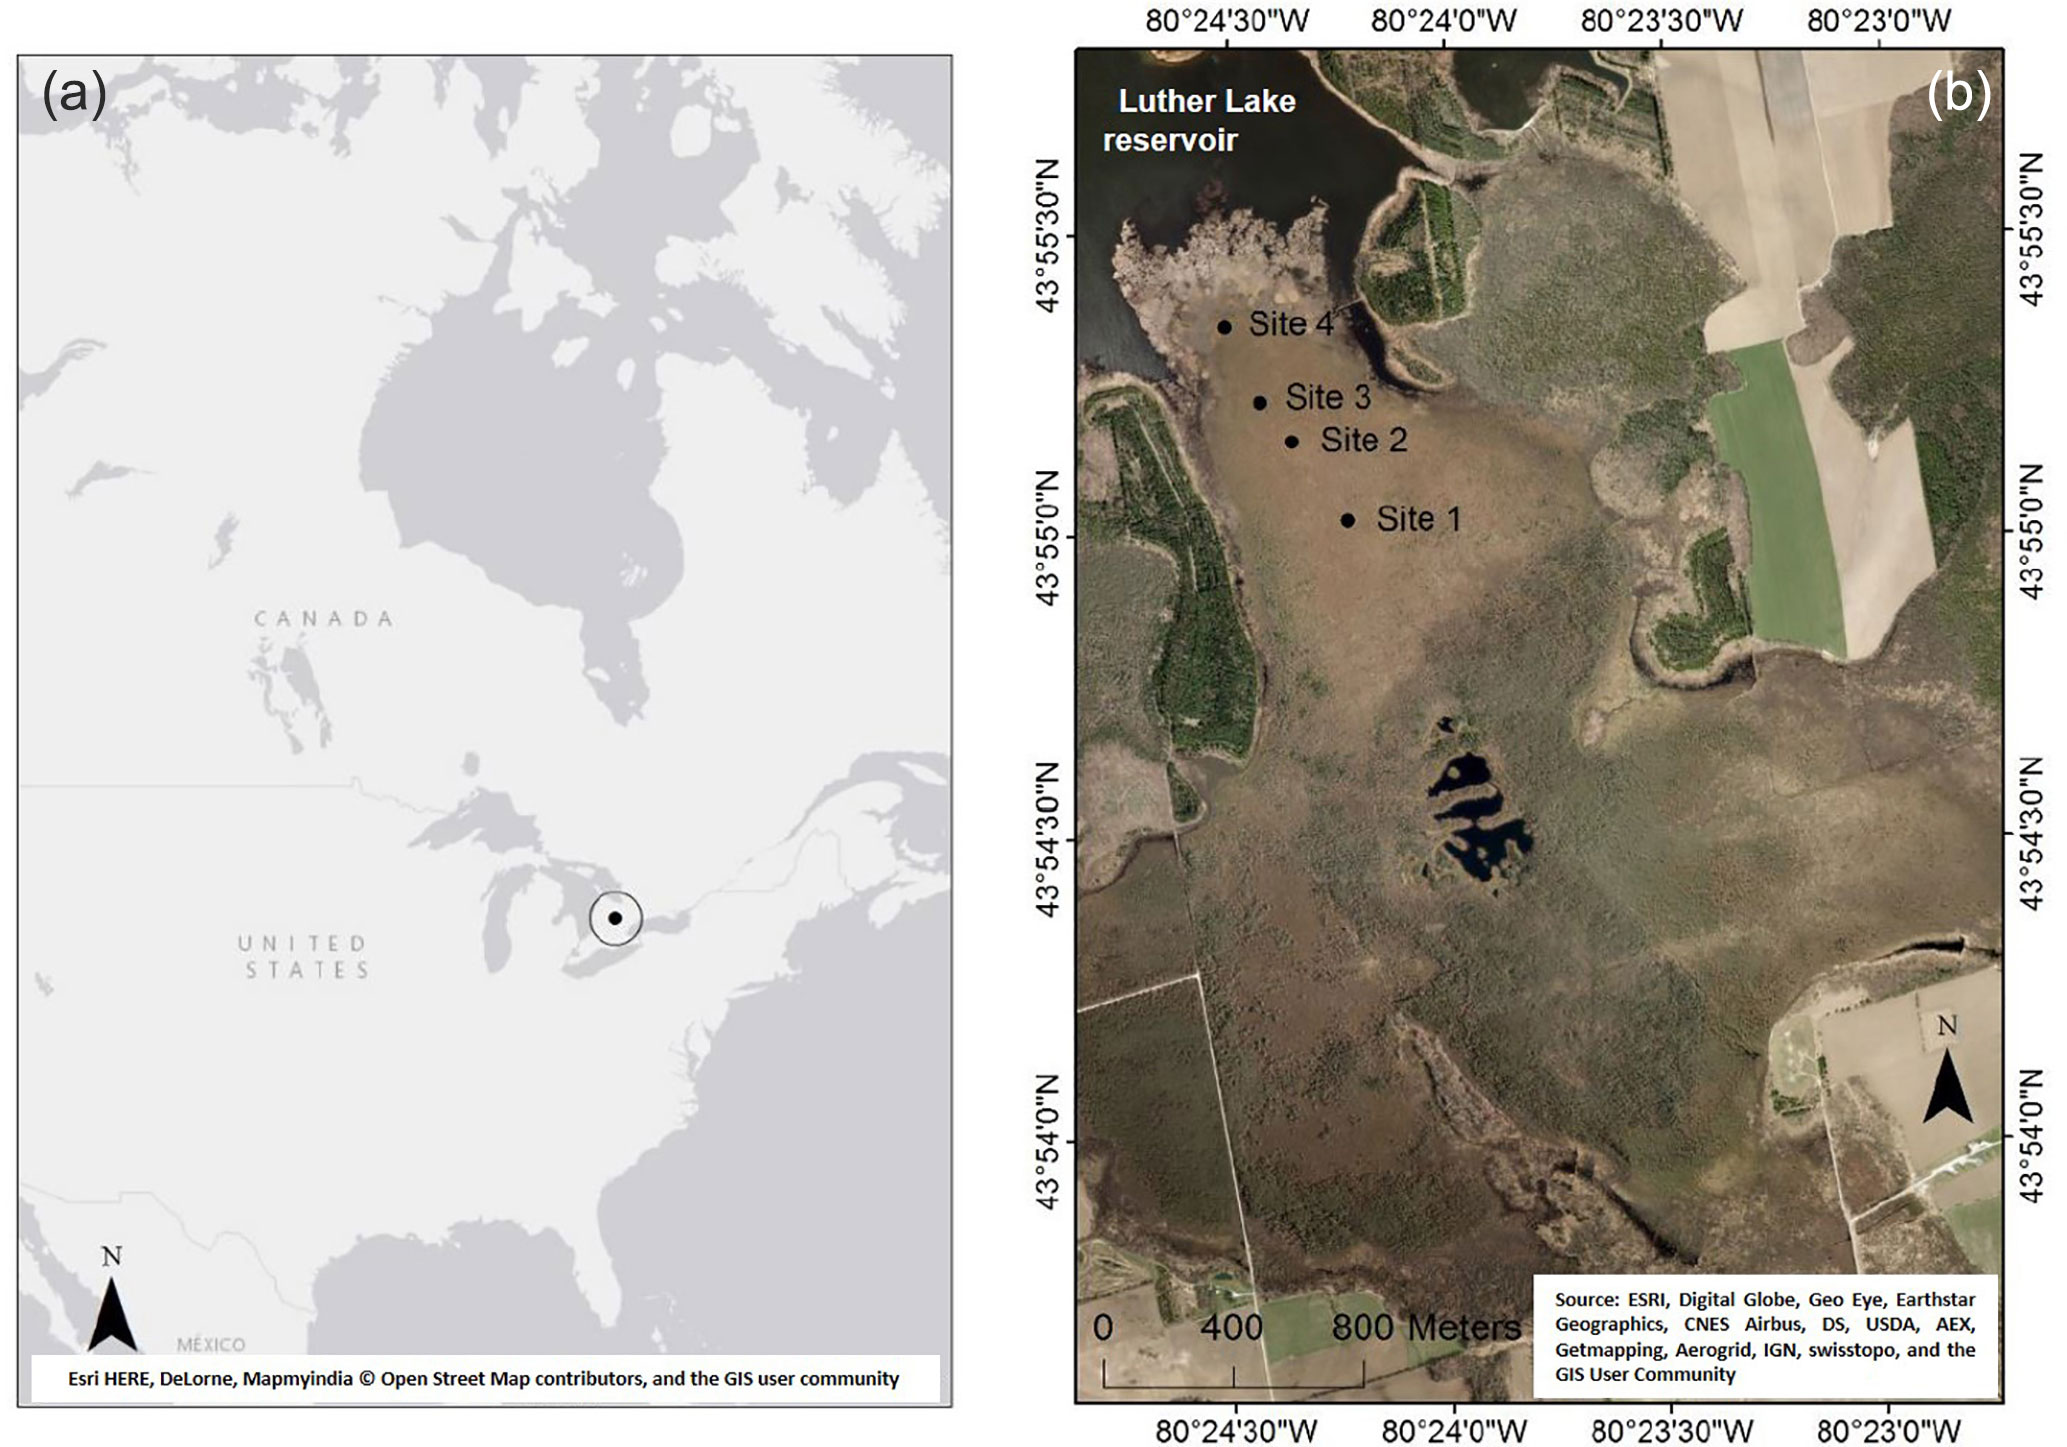
Figure 1Location of Wylde Lake peatland complex in North America (a) and sampling sites (black dots) within Wylde Lake peatland complex (b). Source: ArcGIS.
To address this research gap, we investigated C cycling of the once oligotrophic Wylde Lake peatland, which since 1954 has been exposed to the infiltration of nutrients and strongly pronounced water level fluctuations as induced by a nearby water reservoir. A particular recent finding at this site was that even after decades of excess nutrient supply (currently 5.9 ± 0.1 to 4.35 ± 0.3 of N input and input of several other macronutrients), the peatland still featured high peat accumulation rates of ∼ 200 to ∼ 300 (Berger et al., 2017). However, a strong gradient in vascular plant cover was apparent. As pointed out by Berger et al. (2017), lateral nutrient influx through repeated inundation events cannot be easily compared to sites subjected to deposition from the atmosphere. Nevertheless, an apparently intact peatland system, i.e., an intact mire with active C accumulation, despite such serious anthropogenic impacts would contradict several findings from the abovementioned studies. According to these studies, after 1 decade of N fertilization, increased decomposition and peat degradation would be expected. Moreover, the particular scenario in our study, namely the impact of inundation on nearby ecosystems, is gaining increasing importance as there is a worldwide increase of impoundment area (Tranvik et al., 2009) and therefore serious effects on peatland C cycling are likely (Ballantyne et al., 2014; Kim et al., 2015).
The objective of this study was therefore to extend our findings from the existing study on nutrient impact, vegetation, and net C accumulation (Berger et al., 2017) to compare the effects on C cycling and methanogenesis in more detail. To this end, we assessed current CO2 and CH4 exchange, peat quality, and pore-water chemistry along a transect ranging from a shrub-dominated site (site 4, 200 m of distance to the reservoir; greatest nutrient input) over two graminoid-moss-dominated sites (sites 3 and 2, 400 and 550 m of distance to the reservoir; intermediate nutrient input) to a moss-dominated site (site 1, 800 m of distance to the reservoir; smallest nutrient input) in the Wylde Lake peatland in Ontario, Canada. Moreover, to address changes in methanogenic pathways and to study predominant pathways of CH4 emission, we assessed seasonal variation in δ13C of CH4 and CO2 in peat profiles and in CH4 surface fluxes.
We hypothesized that (1) hydrologically altered and nutrient-enriched peripheral sites feature accelerated C cycling and more decomposed peat due to the input of labile litter from productive vascular vegetation, (2) an increased abundance of vascular plants can increase CO2 uptake but also change patterns of CH4 production and emission, in particular if graminoids with aerenchymatous roots dominate, and (3) long-term nutrient enrichment in combination with hydrologically altered conditions may therefore cause differential responses of C cycling and does not necessarily cause a loss of the C-sink function of peatland ecosystems.
2.1 Description of the study area and study sites
Wylde Lake peatland has been described in detail by Berger et al. (2017). In brief, it is located in southeastern Ontario 80 km northwest of Toronto (43.920361∘ N, 80.407167∘ W; Fig. 1) as part of the Luther Lake Wildlife Management Area. The climate is cool temperate, the average July temperature is 19.1 ∘C, the average January temperature is −8.0 ∘C, and the mean annual temperature is about 6.7 ∘C. Annual precipitation amounts to 946 mm, with the major portion falling in summer (1981 to 2010, Fergus Shand Dam; National Climate Data and Information Archive, 2014). Peat formation started about 9000 years before present on calcareous limnic sediments and the total peat depth today is about 5 m.
For flood control and water management, the Luther Lake reservoir neighboring Wylde Lake peatland was created in 1954. Through flooding of the reservoir, Wylde Lake peatland has been exposed to altered hydrological conditions in a way that the water reservoir has enhanced water level fluctuations in a large part of the site: in summer or under dry conditions, water is released from the reservoir, draining water out of the peatland; under wet conditions, increased water table levels of the reservoir push water into the peatland. Sites in closer vicinity to the reservoir are presumably more affected than sites further away (Berger et al., 2017).
Four intensively investigated sites (Fig. 1) were arranged along a transect stretching from near the shoreline of the reservoir about ∼ 1 km south into the central, treed bog area. Each site featured an individual mosaic of hummocks, hollows, and lawns; however, for comparability, all measurements of this study were taken in and all samples were collected from hollows.
Table 1Overview of the four sites' distances to the water reservoir and the composition of the vegetation in terms of coverage (%) of plant functional types (PFTs) in hollows and the abundances of plant species (vascular plants and mosses, excluding liverworts and hornworts). Abundances are abbreviated as follows: “d” means “dominant” (> 75 %), “a” means “abundant” (51–75 %), “f” means “frequent” (26–50 %), “o” means “occasional” (11–25 %), and “r” means “rare” (1–10 %). Because Sphagnum mosses were very hard to distinguish in the field, we only determined the abundance of the most abundant Sphagnum species of each site.
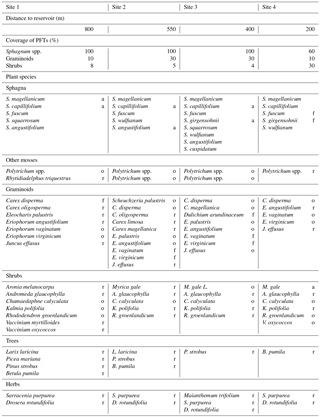
Site 4 was located about 200 m away from the reservoir in an area overgrown by Myrica gale where Sphagnum mosses were in retreat. Site 3 and site 2 were in the open poor fen–bog transition area with site 2 being further away from the reservoir (550 m) than site 3 (400 m). These intermediate sites 2 and 3 were dominated by Sphagnum mosses and graminoids with only a few shrubs. These sites featured a variety of aerenchymatous graminoid species, such as Eriophorum spp. at sites 3 and 2 and Dulichium arundinaceum at site 3. Site 1 (∼ 800 m away from the reservoir) accommodated equal shares of a few graminoids and shrubs above dominant Sphagnum mosses. The four sites also differed with respect to their most abundant Sphagnum species, reflecting increasingly minerotrophic conditions towards the lake. While S. capillifolium, an ombrotrophic to slightly minerotrophic hummock species (Laine et al., 2011), was abundant at sites 1, 2, and 3, its abundance decreased towards site 4. Moreover, site 1 featured the abundant S. magellanicum (another ombrotrophic to weakly minerotrophic hummock species; Laine et al., 2011), site 2 featured the abundant S. angustifolium (tolerating ombrotrophic to minerotrophic conditions; Laine et al., 2011), and site 3 featured the abundant S. girgensohnii, a minerotrophic hollow species (Laine et al., 2011). The two most abundant Sphagnum species at site 4 were S. fuscum (mostly on hummocks but also in hollows, an ombrotrophic species; Laine et al., 2011), with a great ability to recover from desiccation (Nijp et al., 2014), and again the minerotrophic hollow species S. girgensohhnii. See Table 1 for a detailed overview of the vegetation at the sites and see Fig. S1 in the Supplement for photographs of the sites.
As presented in Berger et al. (2017), the study area is subject to apparent nutrient infiltration from the Luther Lake water reservoir as indicated by increasing concentrations of N, phosphorus (P), sulfur, potassium (K), calcium (Ca), magnesium (Mg), iron, copper, and zinc as well as other metals in peat mostly toward the peatland periphery. N input rates of 5.9 ± .1 were reported for site 4 and 4.35 ± 0.3 for site 1; moreover, C∕P and N∕P ratios of surface peat suggested P limitation typical of fens, C∕Ca and C∕Mg ratios indicated Ca and Mg limitation, and C∕K ratios indicated higher K availability as compared to typical values for bogs presented in Wang et al. (2015). The peatland periphery appeared to act as a buffer for nutrients in a way that site 4 received the highest loads of nutrients but also areas further away were to some extent affected. Nevertheless, surface peat accumulation rates of ∼ 200 to ∼ 300 at all sites revealed high recent C sequestration rates.
The impact of anthropogenic activities, in particular the formation of the reservoir, is evident from the peat quality found at the sites: quite similar peat quality was found at all sites for depths that had accumulated before dam construction at Wylde Lake peatland. A clear difference before and after dam construction was evident, reflected by the enrichment in nutrients in the upper depths and the concomitantly altered vegetation.
2.2 Determination of organic matter quality of peat and pore water
Peat samples were taken in July 2014 in depths of 5, 10, and 20 cm below the living Sphagnum layer by manual cutting. Peat from 75 cm of depth was taken with a Russian peat corer. Peat was filled in jars avoiding any headspace and closed airtight to maintain anoxic conditions as far as possible during transport to the laboratory.
To collect in situ pore water, suction samplers (Macro Rhizons; Eijkelkamp, Giesbeck, the Netherlands; pore size ∼ 0.2 µm) were inserted into the peat at 5, 10, and 20 cm of depth. Sampling was done by applying a vacuum and collecting water with syringes; syringes were covered with aluminum foil and peat to avoid exposure to light. Pore water from 75 cm of depth was pumped from 75 cm deep piezometers that were emptied 1 day prior to sampling to ensure sampling of fresh pore water. Samples from piezometers were filtered using Macro Rhizons in the laboratory to ensure similar treatment of pore water from all depths. All samples were taken and analyzed as three replicates.
Prior to Fourier-transform infrared spectroscopic (FTIR) analysis, oven-dried (70 ∘C) bulk peat samples were ground with a ball mill. Pore-water samples were oven-dried (70 ∘C) to complete dryness; afterwards 2 mg of the remaining organic matter were ground in a mortar with 200 mg of potassium bromide (KBr) and pressed to pellets for analysis. We recorded spectra on an FTIR spectrometer (Varian 660; Palo Alto, USA) over a scan range of 4000–650 cm−1 with a resolution of 2 cm−1 and 32 scans per sample. A KBr background was subtracted from the spectra and spectra were baseline corrected. We identified spectral peaks (average location ±30 cm−1) and related them to functional moieties as described in Niemeyer et al. (1992). As absorbance values do not give quantitative information on the absolute abundance of functional groups, we related peaks of around 1620–1610 cm−1 (aromatic C=C compounds and aromatic moieties) to polysaccharide peaks at 1170–950 cm−1 wavenumbers (Niemeyer et al., 1992). A relative increase in ratios thus indicates a relative decrease in the labile polysaccharide moieties and thus an increase in the degree of decomposition in regard to a residual enrichment of refractory aromatics (Broder et al., 2012).
Pore-water samples were analyzed by absorption spectroscopy in the ultra violet and visible range (UV-Vis spectroscopy; Varian UV 1006 M005 spectrometer; Palo Alto, USA). We recorded UV-Vis spectra over a range of 200–800 nm with a resolution of 0.5 nm using a 1 cm quartz cuvette. Prior to measurement, a blank spectrum of ultrapure water was recorded and subtracted from each sample. We additionally recorded fluorescence properties of dissolved organic matter (DOM) on a fluorescence spectrometer (Varian Cary Eclipse; Palo Alto, USA) at a scan rate of 600 nm min−1. Excitation wavelengths (ex) were 240–450 nm in 5 nm steps, with emission wavelengths (em) of 300–600 nm in 2 nm steps to obtain excitation–emission matrices (EEMs). Repeated blanks were run to ensure cleanliness of the cuvette. Raman spectra of a blank were recorded each day to check analytical drift and to normalize fluorescence to Raman units (Murphy et al., 2010).
To evaluate DOM quality, we calculated commonly used indices, such as specific ultraviolet absorbance SUVA254 (as a proxy for aromaticity; Weishaar et al., 2003) and the E2 : E3 ratio (the ratio of UV absorbance at 250 nm divided by absorbance at 365 nm) to provide information about the molecular weight of organic matter (Peuravouri and Pihlaja, 1997) from UV-Vis data. From fluorescence data, we calculated a humification index HIX (Ohno, 2002; see Table S3 in the Supplement for equations used).
2.3 Measurements of environmental variables
Air temperature and photosynthetically active radiation (PAR) were recorded about 1 km south of site 1 in an open area by a HOBO U30 weather station (U30-NRC-SYS-B; Onset, Bourne, MA, USA) at a temporal resolution of 5 min. Water table depth (WTD) below surface, water temperature (Twater), and air pressure were measured in 30 min intervals using one pressure transducer (Solinst Levelogger Edge) in a monitoring well at each site corrected for barometric pressure (Barologger Gold at site 2; Solinst Ltd., Georgetown, Canada). On each day of closed chamber measurements, an extra PAR sensor (Smart Sensor, Onset; part no. S-LIA-M003) and an extra temperature sensor (Temperature Smart Sensor, Onset; part no. S-TMB-M0XX) recorded PAR and air temperature at a temporal resolution of 10 s at the site where chamber measurements were being taken.
2.4 Determination of CO2 and CH4 fluxes
In the hollows of sites 1–4, a set of six collars for chamber measurements were established in April 2012. The collars – installed 0.1–0.15 m into the soil – were cylindrical and had a diameter of 0.4 m and a total height of 0.2 m. Through object-based image analysis (OBIA) based on aerial imagery obtained from UAV flights, the spatial coverages of PFTs at each site were obtained (data summarized in Table 1). Accordingly, the locations for chamber measurement collars at our study sites were defined to proportionally reflect the actual distribution of PFTs.
Closed chamber measurements were performed following Burger et al. (2016). Measurements were taken every 10 to 30 days at each site from 20 April 2014 through 22 September 2015. In total, 19 to 23 daily courses per site could be accomplished. Cylindrical plexiglas chambers were used for the flux measurements: a transparent chamber to measure net ecosystem exchange (NEE) and a chamber covered with reflective insolation foil for ecosystem respiration (Reco). Chamber closure time was 180 s.
Air was circulated between the chamber and a trace gas analyzer (Ultraportable Greenhouse Gas Analyzer 915-001; Los Gatos Research Inc., Mountain View, USA) through 2 mm inner diameter polyethylene tubing recording concentrations of CO2 and CH4 at a temporal resolution of 1 s. According to the manufacturer, the reproducibility of CH4 and CO2 is < 2 and < 300 ppb, respectively. The analyzer was factory calibrated before the campaign. The stability of the calibration was checked repeatedly during summer 2014. In January and July 2015, the analyzer was again recalibrated. If CH4 concentrations increased sharply within the first 60 s of the measurement due to CH4 bubble release caused by the positioning of the chamber, the measurement was discarded and repeated.
During each measurement day, each collar was monitored several times with the transparent and dark chamber at different times (typically between 05:00 and 20:00) and different PAR levels (typically 5 to 2000 ) throughout the day. Unfortunately, due to the remoteness of our study site, measurements at night were not possible.
Gas fluxes were determined by Eq. (1),
based on the changes in concentration over time inside the chamber (Δc) by applying the ideal gas law with the ideal gas constant R and correcting for atmospheric pressure P and temperature inside the chamber T. The chamber volume V and basal area A were calculated from the chamber's physical dimensions, taking into account each collar's vegetation volume as determined in May, July, and October 2014 and in April and August 2015 and extrapolated for the other campaigns. The concentration change over time was derived from the slope of a linear regression of concentration vs. time. The first 40 s after chamber deployment were discarded to account for the analyzer's response time. If the slope was not significantly different from 0 (tested with an F test, α = 0.05), the flux was set to zero.
An empirical description of the measured NEE fluxes of each site was accomplished by applying a hyperbolic light response model (Owen et al., 2007). The nonlinear least squares fit of the data to the model was done according to Eq. (2):
where NEE is in , α is the initial slope of the light response curve (in ), β is the maximum NEE in , Q is the photosynthetic active radiation in , and γ is an estimate of the average Reco. Integration of NEE over the course of 1 day gave net daily ecosystem production (NEP). Gross primary productivity (GPP) was retrieved by subtracting Reco from NEP.
Average CH4 fluxes for measurement days at each site were obtained and, lastly, cumulative emissions of CO2 and CH4 were calculated according to Tilsner et al. (2003).
To determine the isotopic signatures of CH4 fluxes, we carried out additional chamber flux measurements once a month from May to September 2015 using a shrouded chamber and the setup described above. The chamber was closed until CH4 concentrations reached > 10 ppm for analysis of isotopic composition, but not for more than 30 min. Samples for isotopic analysis were extracted from the chamber with 60 mL syringes and filled into 40 mL crimp vials that had previously been flushed with nitrogen (N2) and sealed with rubber stoppers. To correct isotopic values of CH4 for background isotopic signature in the chamber, we collected six air samples at each site on every sampling day. Isotope analysis was carried out as outlined for dissolved gases (see below).
2.5 Sampling of dissolved gases in the peat
Concentrations of CH4 and dissolved inorganic carbon (DIC) along peat profiles were analyzed in 5, 15, 25, 35, 45, and 55 cm of depth with three replicates at each site using diffusive equilibration samplers made of permeable silicone tubes (Kammann et al., 2001) equipped with valves. Samples were taken with 10 mL syringes every 2 to 3 weeks from June 2014 through September 2015. Samples were stored overnight at 5 ∘C and analyzed the next day.
To determine the temporal dynamics of isotopic signatures of CH4 and CO2 in the peat, we installed a separate set of silicone tubes in 5, 15, 25, and 35 cm of depth with three replicates each per site. Silicone tubes for isotope sampling had an inner diameter of 1 or 0.5 cm corresponding to a volume of 20 or 5 mL. The larger samplers were installed in 5 cm of depth and the smaller samplers below, as close to the surface larger volumes of samples were necessary in order to obtain sufficiently high concentrations (> 2.5 ppm) for isotope analysis. The equilibrium of gases such as N2O, CH4, and CO2 at the silicone membrane has been shown to adjust within hours to days and isotopic fractionation can be expected to be negligible (Panikov et al., 2007; Pack et al., 2015). All samplers were installed 1 month prior to the first sampling. Samples were taken monthly from May 2015 to September 2015 using 10 and 60 mL syringes and filled into 10 or 40 mL crimp vials that had been flushed with N2 and sealed with rubber stoppers. After sampling, silicone samplers were refilled with N2 to avoid intrusion of oxygen.
To obtain high-resolution depth profiles of concentration and isotopic signatures of CH4 and DIC, pore-water peepers of 60 cm length and a 1 cm resolution (Hesslein, 1976) were inserted on three occasions in June, July, and September 2015 and allowed to equilibrate for 4 weeks. As results of pore-water peepers generally confirmed the data of the silicone samplers, the results are not presented here but described in the supporting information (see Fig. S6 in the Supplement).
2.6 Analyses of CO2 and CH4 concentrations and δ13C–CO2 and δ13C–CH4 values
Gaseous CO2 and CH4 concentrations were analyzed with a gas chromatograph (SRI 8610 C; SRI Instruments, Torrance, US) equipped with a flame ionization detector (FID) and a methanizer. Samples from pore-water peepers were analyzed by measuring the headspace concentration in the vials.
Ratios of δ13C of CO2 and CH4 were determined by cavity ring-down spectroscopy (CRDS; Picarro G2201-i; Picarro Inc., Santa Clara, US) to simultaneously determine the 13C isotopic composition of CO2 and CH4 with a precision of < 0.16 ‰ for δ13C–CO2 and < 1.15 ‰ for δ13C–CH4. The analyzer was calibrated before each measurement with two working standards of CO2 (1000 ppm, −31.07 ‰) and CH4 (1000 ppm, −42.48 ‰). SD for δ13C–CO2 was below 2 ‰ and below 4 ‰ for δ13C–CH4. For CO2, additional in-house standards with a δ13C value of −26.61, −0.19, and −15,16 ‰ were used and validated by IRMS certified reference materials. Isotopic signatures were expressed in the δ notation in ‰ vs. the VPDB standard according to Eq. (3):
where RSample is the 13C∕12C ratio of the sample and RStandard is the 13C∕12C ratio of the standard.
As the accuracy of δ13C–CO2 values was affected by high CH4 concentrations present in the samples, we established a correction to revise δ13C–CO2 values. This was necessary for molar concentration ratios of CO2 : CH4 between 0.3 and 1.5. Samples with CO2 : CH4 ratios < 0.3 could not be corrected and were discarded; samples with ratios > 1.5 did not need correction. Additionally, δ13C–CO2 values had to be corrected for a storage effect. As samples were stored for several weeks, CO2 was lost from the vials, and isotopic signatures increased by 0.056 ‰ day−1. There was no such effect detectable for CH4.
Dissolved concentrations of CO2 and CH4 were recalculated from partial pressures inside the silicon samplers by applying Henry's law according to Eq. (4):
where c is the concentration in µmol L−1, p is the pressure in atm, and KH is the in situ temperature-corrected Henry constant in (Sander, 1999). Speciation of aqueous CO2 was considered using equilibrium constants from Stumm and Morgan (1996) to calculate total DIC.
DIC and CH4 concentrations in samples from pore-water peepers were recalculated from gas concentrations in the headspace by applying the ideal gas law and temperature-corrected Henry constants.
To gain information about the dominant CH4 production pathway, the isotope fractionation factor αC (for 35 cm of depth) was calculated according to Eq. (5) after Whiticar et al. (1986):
2.7 Statistical analysis
Statistics software R i386 version 3.1.0 was used to verify the differences in organic matter quality between depths and sites. Data were tested for normal distribution (Shapiro–Wilk test, α = 0.05) and homogeneity of variance (Levene test, α = 0.05). In the case that both requirements were met, we carried out a one-way ANOVA (analysis of variance; α = 0.05) with a post hoc Tukey's honest significant difference (HSD) test (α = 0.05) to identify which depths or which sites differed significantly from each other. If either normal distribution or homogeneity of variance were not met, a Kruskal–Wallis test (α = 0.05) with a multiple comparison test after Kruskal–Wallis (α = 0.05) as a post hoc test was applied.
Using RStudio version 0.99.902 and R i386 3.2.3, we examined differences in δ13C values of CO2 and CH4, CO2 and CH4 concentrations, and cumulative emissions between the sites. Means were compared with t tests (if data were normally distributed), a Kruskal–Wallis test, and a post hoc Wilcoxon–Mann–Whitney test (if data were not normally distributed), with confidence levels of α = 0.05 for all statistical tests. Normality was tested with a Shapiro–Wilk test (α = 0.05) and homogeneity of variance was confirmed with a Levene test (α = 0.05). Correlations between environmental variables and fluxes, concentrations, and isotopic signatures were determined with Pearson's product–moment correlation for normally distributed data or with Spearman's rank correlation if data were not normally distributed. With ANOVA (α = 0.05), the effect of categorical variables on CH4 fluxes and δ13C values was computed.
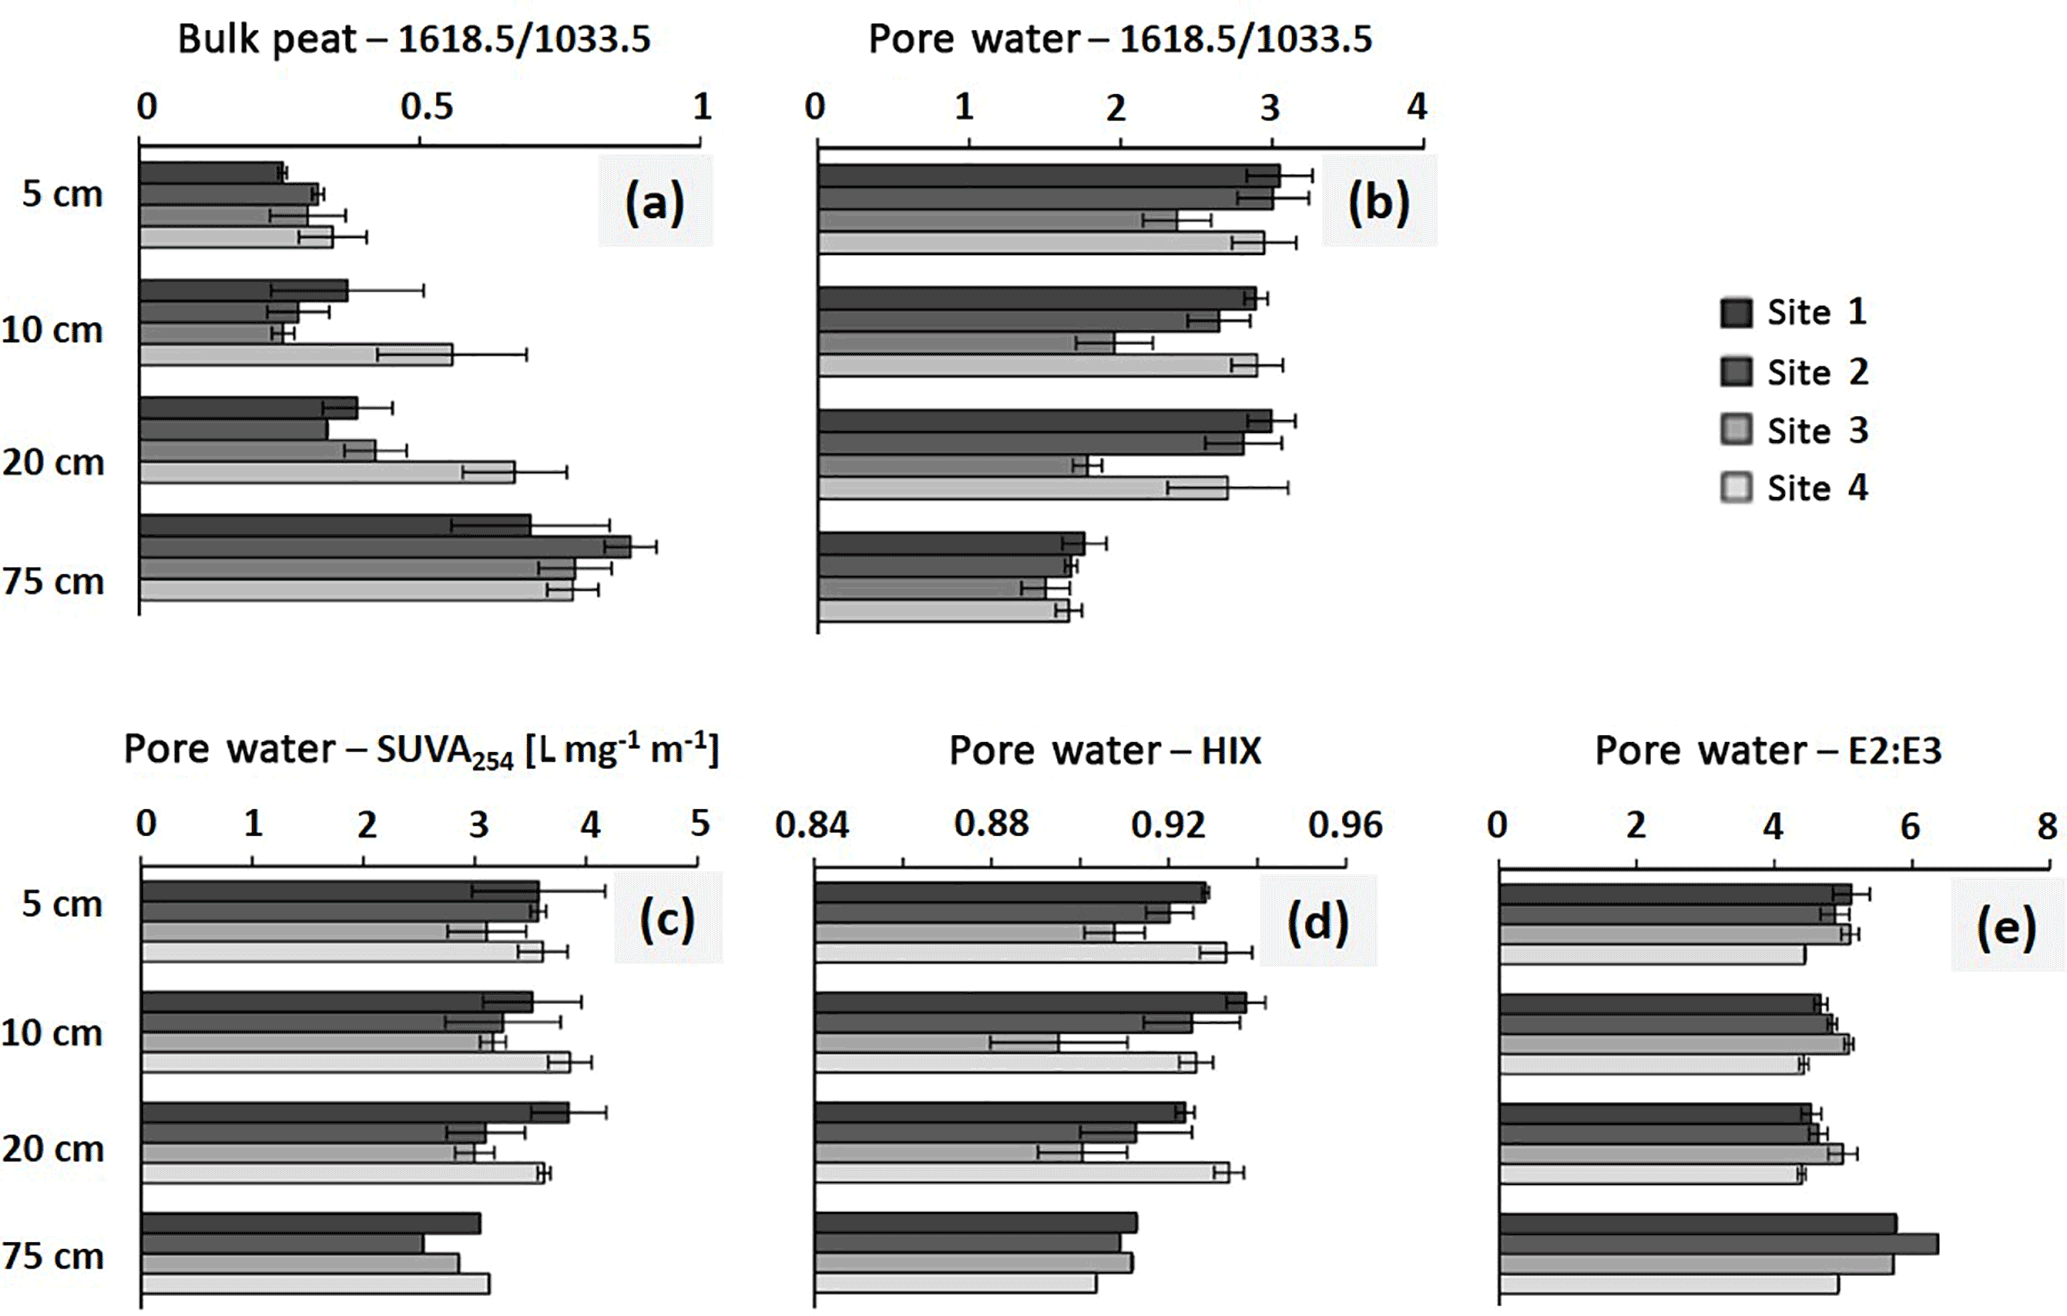
Figure 2FTIR ratios 1618.5∕1033.5 in bulk peat (a) and pore water (b) as well as SUVA254 indicating aromaticity, (c), HIX, humification index, (d) and E2 : E3, indicative of molecular size and aromaticity, (e) for pore-water samples from sites 1 to 4; n = 3. Error bars indicate ±SD.
3.1 Organic matter quality of peat and pore water
The highest degree of bulk peat decomposition, as indicated by the highest 1618.5∕1033.5 absorption ratios, was found at site 4 between 5 and 20 cm of depth (p < 0.05 in 10 and 20 cm of depth; Fig. 2a). The 1618.5∕1033.5 ratios of sites 1–3 were not significantly different. The pore-water sample 1618.5∕1033.5 ratios of site 3 were smallest between 5 and 20 cm of depth as compared to all other sites (p < 0.05), indicating the lowest degree of decomposition of DOM here (Fig. 2b). Aromaticity as determined with SUVA254 (Fig. 2c) did not significantly differ between sites in pore-water samples (exception: site 1 and site 3 in 20 cm of depth (p = 0.033); site 1 SUVA254 was significantly higher than site 3 SUVA254). The degree of humification, as expressed by HIX (Fig. 2d), was significantly lowest in site 3 pore water (5 cm site 3 and 4: p = 0.026; 10 cm site 1 and 3: p = 0.014; 20 cm site 3 and 4: p = 0.020). The slope ratio E2 : E3 (Fig. 2e), indicative of molecular size and aromaticity, did not significantly differ between sites.
3.2 Development of WTD and Twater during the study period
During our study period, hollow WTD showed strong seasonal fluctuations. Maximum WTD (i.e., highest water table levels) throughout the study period were reached during snowmelt in spring 2014 (site 1: 6.94 cm, site 2: 4.99 cm, site 3: 16.26 cm, site 4: 23.18 cm above hollow surface). Minimum WTD (i.e., lowest water table levels) were reached during the summer of 2015 (site 1: 32.5 cm, site 2: 31.75 cm, site 3: 13.34, site 4: 19.11 cm below hollow surface). All sites showed similar courses of WTD; however, site 3 and 4 water levels were generally higher than site 1 and 2 water levels (p < 0.05). The amplitude between maximum and minimum WTD at all sites was overall similar (site 1: ∼ 39.5 cm, site 2: ∼ 36.7 cm, site 3: ∼ 30 cm (logger failure when water levels were lowest), site 4: ∼ 42.3 cm). Twater varied between ∼ 2 ∘C in winter and ∼ 16 ∘C in summer. Detailed courses of WTD and Twater are presented in Fig. 3a and b.
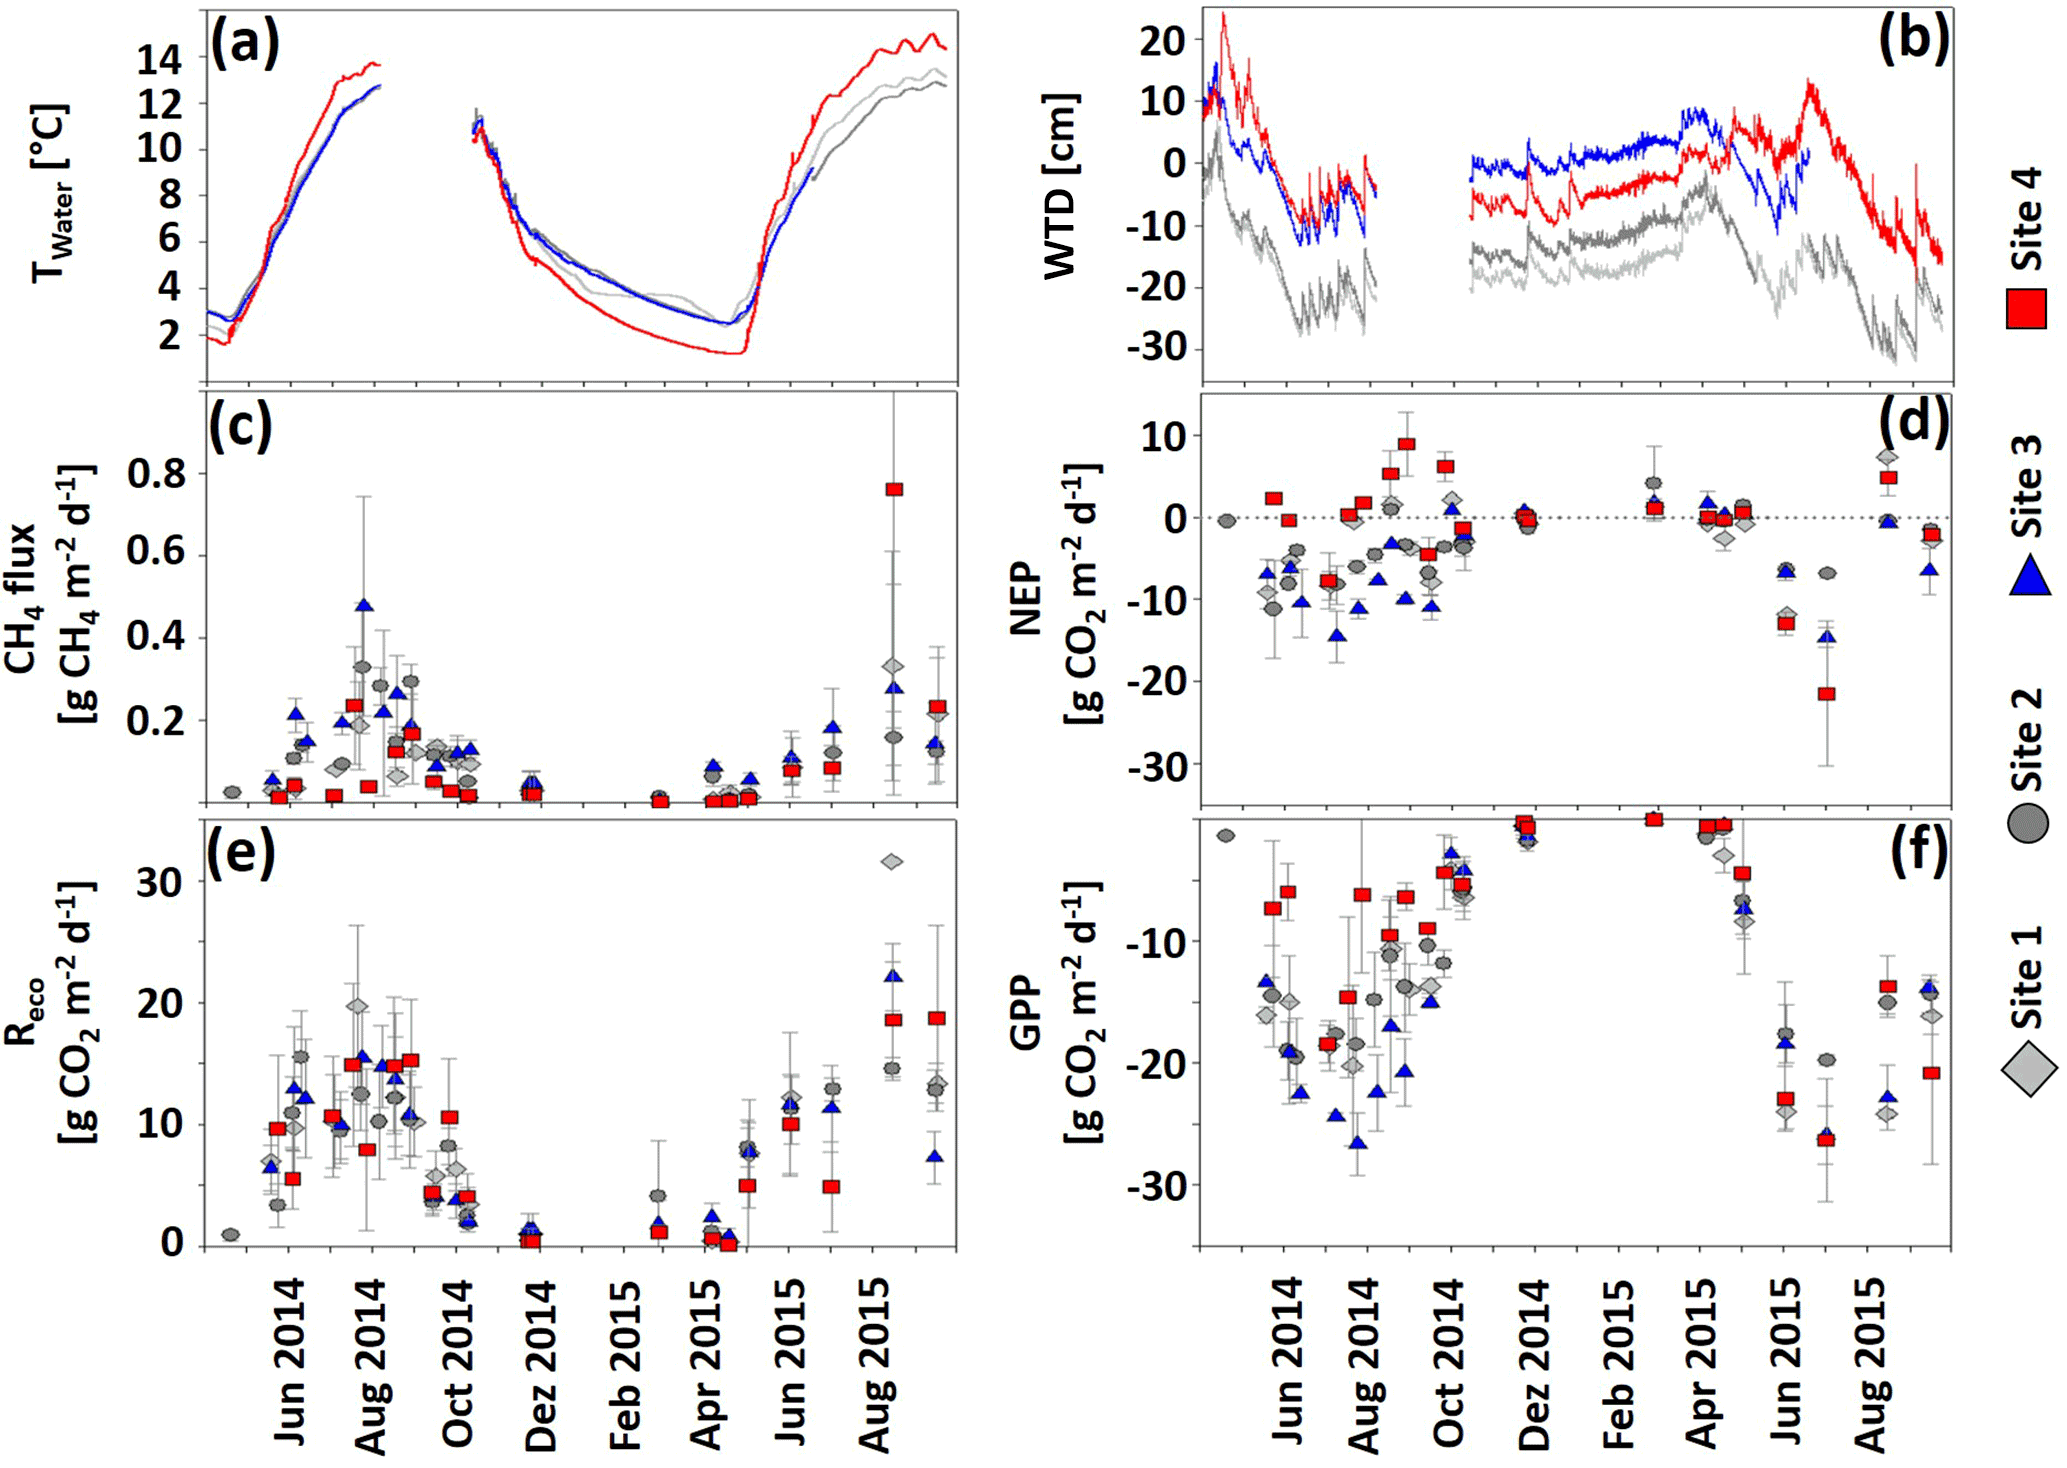
Figure 3Development of (a) Twater (∘C), (b) WTD (cm), (c) CH4 fluxes (), and (d–f) CO2 fluxes (NEP partitioned into Reco and GPP; ) ± 1 SD (n = 6) in hollows at sites 1–4 from 1 April 2014 through 22 September 2015. Negative CO2 and CH4 fluxes indicate uptake, and positive fluxes indicate a release to the atmosphere. The dashed gray line in the NEP graph indicates a 0 flux.
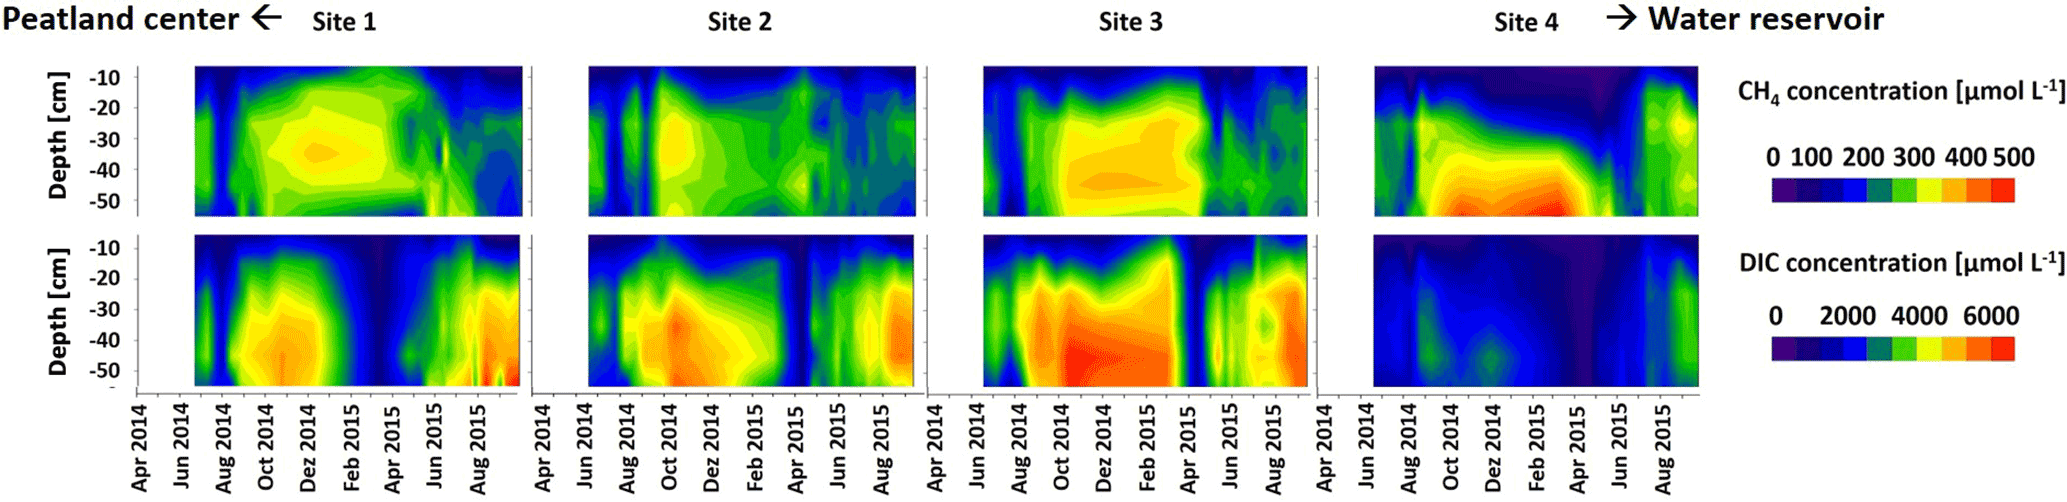
Figure 4Development of mean CH4 and mean DIC concentrations (µmol L−1) in hollows at sites 1–4 from 1 April 2014 through 22 September 2015. Concentrations were interpolated based on biweekly sampling at depths of 5, 15, 25, 35, 45, and 55 cm.
3.3 Fluxes of CO2 and CH4 at the soil–atmosphere interface and concentrations of CH4 and DIC along peat profiles during the study period
Fluxes of CH4 and CO2 (Fig. 3c–f) showed strong annual variability. The greatest CH4 emission (Fig. 3c) occurred during the growing season, and minor fluxes were detected during the dormant season. In general, site 3 emitted more and site 4 less CH4 than the other sites with an exception on 16 August 2015 when a mean flux of 0.76 ± 0.58 was detected at site 4, exceeding the fluxes measured at all other sites. During the entire study period, site 3 released significantly (p < 0.001) more CH4 (61.4 ± 32 g CH4 m−2) than sites 1 (41.8 ± 25.4 g CH4 m−2), 2 (44.6 ± 13.7 g CH4 m−2), and 4 (46.1 ± 35.2 g CH4 m−2); see also Fig. S5 in the Supplement. Annual cumulative CH4 emissions from May 2014 to May 2015 were 22.18 ± 8.96 at site 1, 30.66 ± 7.63 at site 2, 39.86 ± 16.81 at site 3, and 12.53 ± 11.38 g CH4 m−2 at site 4. Thus, site 3 emitted significantly (p < 0.05) more CH4 than site 4, but CH4 emissions at sites 3 and 4 were not different from emissions at sites 1 and 2. Site 3 had the highest negative NEP, indicating the greatest CO2 net uptake, whereas site 4 had the lowest negative, sometimes even positive NEP, indicating little net uptake if not a net emission of CO2 (Fig. 3d). Regarding Reco (Fig. 3e), patterns were similar at all sites. In accordance with the NEP results, GPP (Fig. 3f) was lowest at site 3, indicating the highest photosynthetic uptake here, whereas site 4 had the highest GPP, indicating the smallest uptake. Between May 2014 and September 2015 site 4 accumulated significantly less CO2 (−1093 ± 794 g CO2 m−2, p < 0.05) than the other three sites (−1552 to −2260 g CO2 m−2), while there were no significant differences in terms of CO2 uptake for sites 1, 2, and 3. Between May 2014 and May 2015 NEP of sites 1–3 was strongly negative (−896 to −1282 g CO2 m−2) compared to site 4 NEP (+135 ± 281 g CO2 m−2, p < 0.05).
Site 4 CH4, NEP, and GPP fluxes differed notably between the growing seasons of 2014 and 2015. This was particularly caused by two plots, which in 2015 dramatically increased productivity and CH4 emissions as compared to the previous year (data not shown).
Concentrations of CH4 along the depth profiles (Fig. 4, top panels) of all sites varied strongly throughout the year: they generally increased during the growing season, reached maximum values in the winter season 2014–2015, and comparably decreased during snowmelt in spring. A similar pattern was observed for DIC concentrations along depth profiles (Fig. 4, lower panels). Maximum DIC concentrations were observed below 20 cm of depth in autumn 2014 and winter 2014–2015. Minimum concentrations were observed during snowmelt in March and April 2015. Site 4 DIC concentrations at all depths were overall lower and significantly decreased (p < 0.05) in comparison to all other sites from 23 February through 4 April 2015. Moreover, site 4 DIC concentrations were significantly (p < 0.05) lower than site 3 DIC concentrations on 6 August 2014 and from 19 April through 18 July 2015. Concentrations in the uppermost depths of both CO2 and CH4 were strongly affected by fluctuations of WTD, with strong decreases upon water table decline and vice versa (see Table S4 in the Supplement for statistical results).
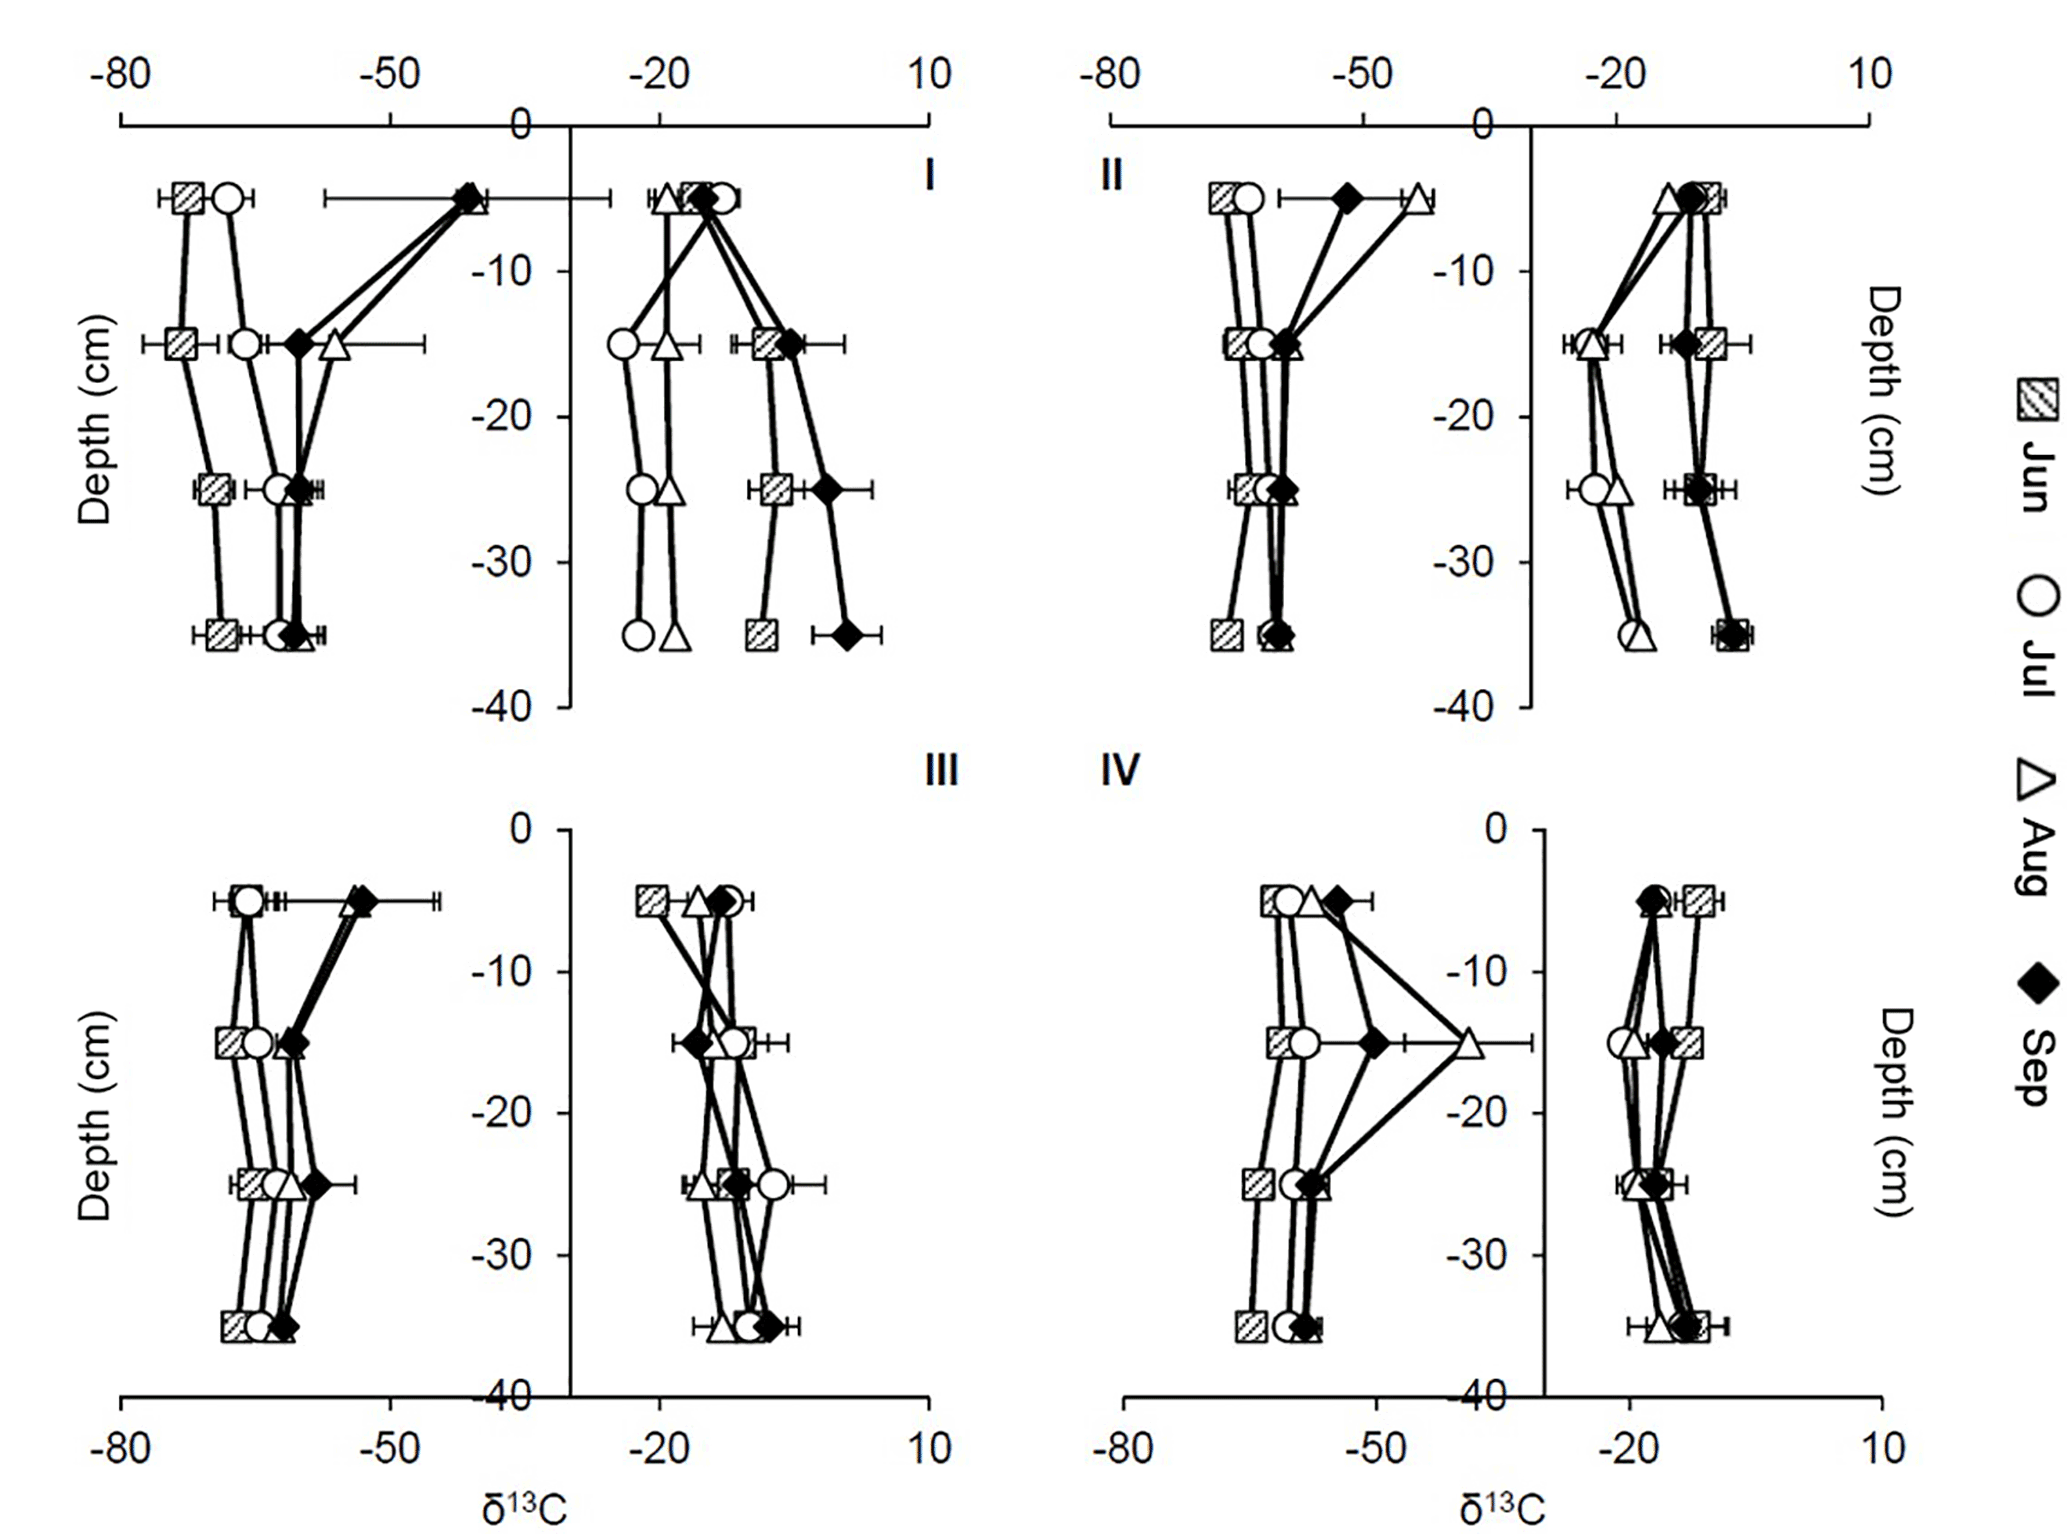
Figure 5Profiles of δ13C–CH4 (left side) and δ13C–CO2 (right side) signatures at sites 1–4 in the peat in 5–35 cm of depth at different points in time. Squares: June (11 June), circles: July (8 July), triangles: August (27 August), diamonds: September (17 September). Graphs show mean values and SDs from three replications at each site (n = 1–3).
3.4 Temporal and spatial variability of δ13C–CO2 and δ13C–CH4 values in peat pore-gas profiles during the growing season in 2015
Values of δ13C of CH4 in the peat ranged from −78.74 to −26.77 ‰, and δ13C of CO2 ranged from −25.81 to +4.03 ‰ (see Fig. 5). Highest δ13C–CH4 and CO2 values were measured at site 1 at 5 and 35 cm of depth in September. Lowest δ13C–CH4 and CO2 values were detected at site 1 in 15 cm of depth in June and at site 2 in 15 cm of depth in August.
Overall, δ13C–CH4 values showed an increasing trend with time from June to August in all depths. Average signatures in 5 to 35 cm of depth differed significantly between sampling dates at all sites except between August and September (p < 0.05). Concomitant to a decline in water table levels in August and September, δ13C–CH4 signatures shifted to less negative values in the upper 5 cm at sites 1–3; this shift was most distinctive at site 1 and least distinctive at site 3. At site 4, such a shift occurred down to 15 cm of depth.
For δ13C–CO2 signatures, significant differences between some sampling dates were found at sites 1, 2, and 4 for average values in 5–35 cm of depth. At sites 1 and 2, signatures in August and September were higher than in June and July, paralleling the trend in δ13C–CH4. At sites 3 and 4, such significant shifts could not be observed.
At sites 1 and 2, δ13C–CH4 signatures apparently increased with depth in June and July, and no trend was observable at sites 3 and 4. In August and September, δ13C–CH4 signatures seemed to decrease with depth except for site 4. Values of δ13C of CO2 increased with depth except at site 1 in July and at site 2 in July and August.
Mean signatures of δ13C–CH4 at site 4 (−57.81 ± 7.03 ‰) differed significantly from those at the other sites (site 1: −61.48 ± 10.71 ‰, site 2: −60.28 ± 5.57 ‰, site 3: −62.30 ± 5.54 ‰) for the whole sampling period (p < 0.01, p < 0.05, p < 0.001).
Values of δ13C of CO2 at site 3 were significantly higher than at the other sites in July (p < 0.05, p < 0.01, p < 0.01). Overall, the highest mean values were found at site 1 (−12.05 ± 8.23 ‰), whereas site 4 revealed the lowest δ13C–CO2 signatures (−15.85 ± 3.61 ‰).
The isotopic composition of CH4 and CO2 as determined from pore-water peepers confirmed the results obtained from the silicone gas samplers. Data are presented in Fig. S5.
Table 2The αC values and SD obtained from silicone samplers in 35 cm of depth at sites 1–4 from June to September. The αC values between 1.04 and 1.055 indicate the prevalence of the acetoclastic CH4 production pathway, and αC values higher than 1.065 indicate the hydrogenotrophic pathway.
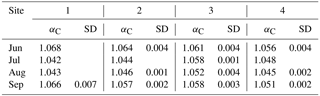
Fractionation factors αC to characterize methanogenic pathways (according to Whiticar et al., 1986) were calculated for water-saturated, presumably anoxic conditions at −35 cm of depth only (Table 2). Frequent or prevailing unsaturated conditions above this depth would favor methanotrophy and thus bias the interpretation of αC. Given that αC values between 1.04 and 1.055 indicate the prevalence of the acetoclastic CH4 production pathway, whereas αC values higher than 1.065 support a shift towards the hydrogenotrophic pathway, the acetoclastic pathway was apparently favored in July and August at sites 1 and 2, in August at site 3, and in July, August, and September at site 4. A shift towards a higher contribution of the hydrogenotrophic pathway was observed in June and September at site 1 and in June at site 2.
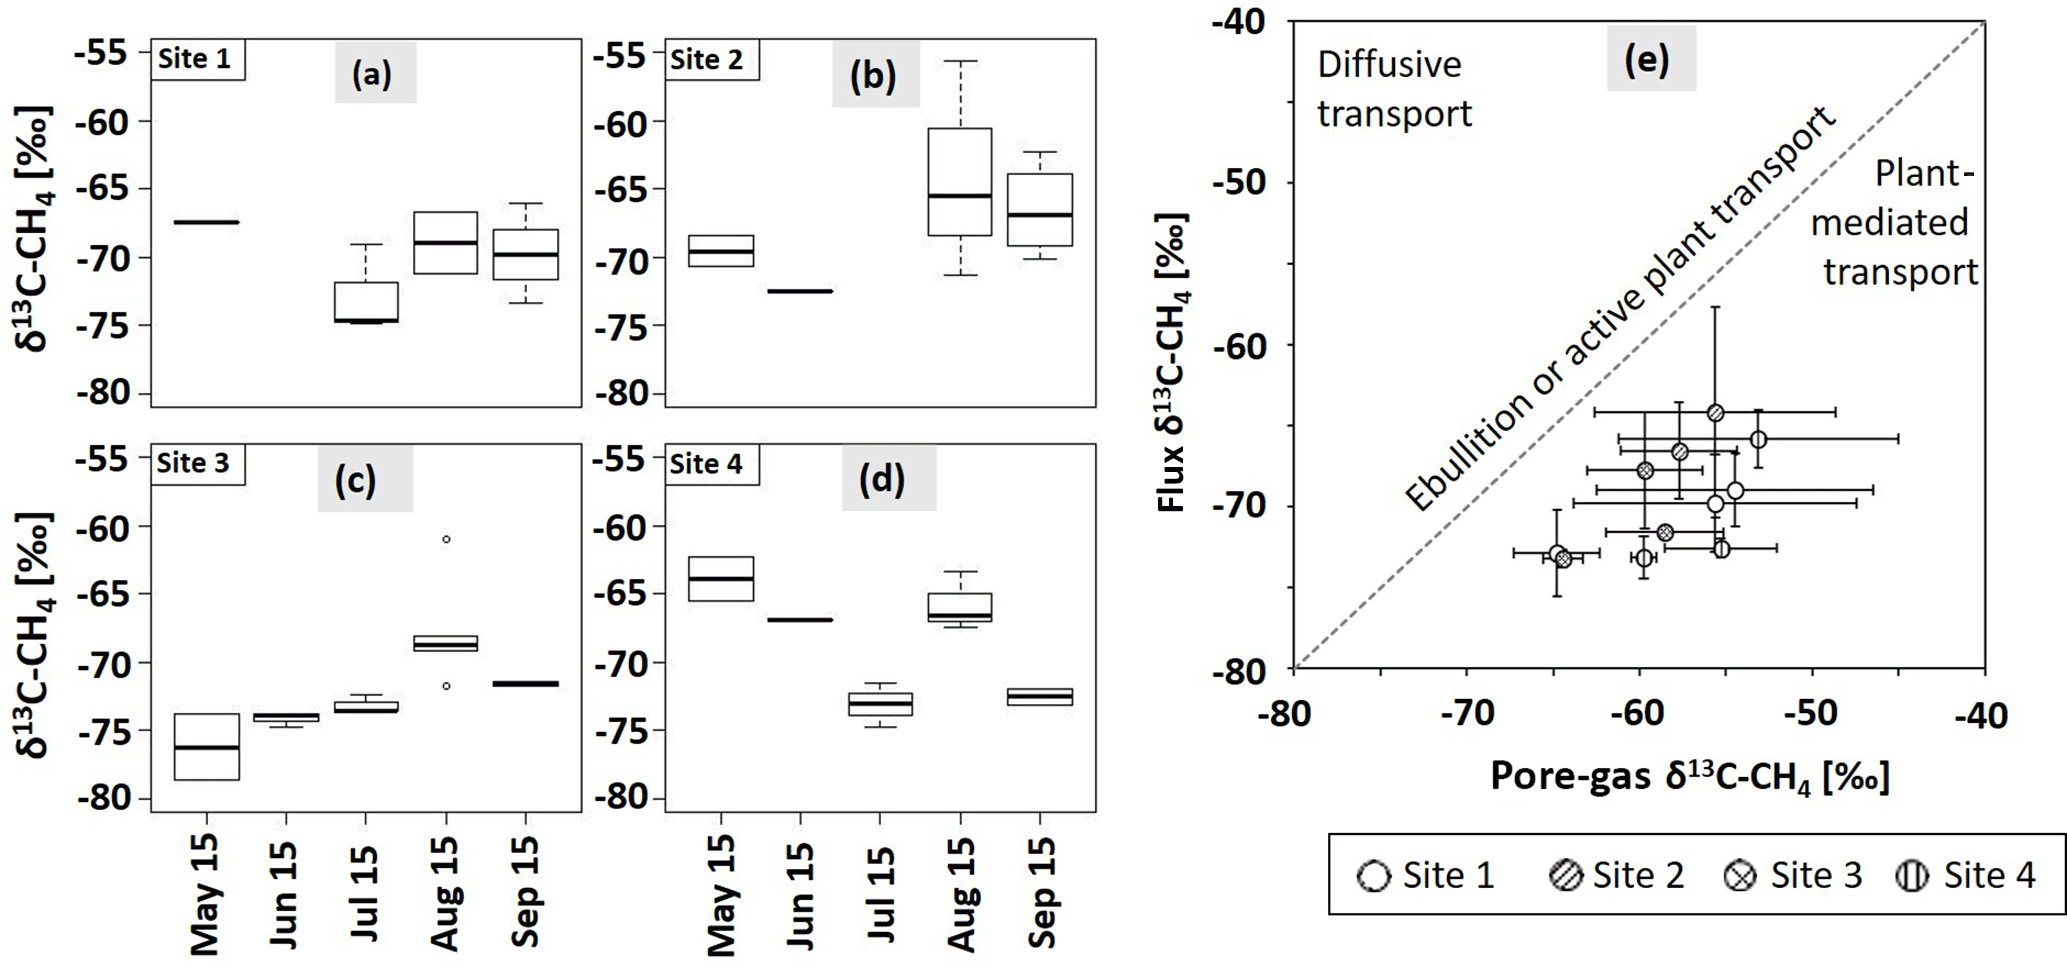
Figure 6The δ13C–CH4 signatures (‰) of CH4 fluxes from May to September for sites 1 (a), 2 (b), 3 (c), and 4 (d, n = 1–4). In July 2015, sampling at site 2 was not possible. Bold lines are the median, boxes show the 25th and 75th percentile, and whiskers indicate minima and maxima within 1.5 times the interquartile range. Single points show outliers. (e) Dominant flux pathway of CH4 according to Hornibrook (2009). Empty circles: site 1, circles with diagonal lines: site 2, circles with crosses: site 3, circles with vertical lines: site 4. Dashed line represents transport via ebullition or active plant transport without any isotopic fractionation. Values are means of pore-gas samples from 5–35 cm of depth and chamber flux measurements. Graphs show mean values and SDs from three replications at each site (n = 1–3).
3.5 δ13C signatures of emitted CH4 during summer 2015
Values of δ13C of emitted CH4 ranged from −81.87 ± 3.81 to −55.61 ± 1.20 ‰ (see Fig. 6a–d). Thereby, δ13C–CH4 signatures increased from July to August and slightly decreased again in September. This pattern was thus related to the course of the WTD. Significant differences were only found at sites 3 and 4 between July and August (p < 0.01, p < 0.05); however, from visual inspection of Fig. 6a–d δ13C–CH4 values seemed to increase between May and September at site 3, while they appeared to decrease at site 4, with distinctly low values in August. There was no such pattern at sites 1 and 2. Taking δ13C–CH4 signatures from all sites, isotopic signatures in July differed significantly from those in August and September (p < 0.05). In September, isotopic signatures of the CH4 flux at site 2 differed significantly from those at the other sites (p < 0.05).
Comparing isotopic signatures of dissolved, strongly 13C-depleted CH4 in the upper 35 cm of the peat and emitted, less 13C-depleted CH4, plant-mediated transport was the dominant CH4 emission pathway during summer 2015 at all sites and on all sampling dates according to Hornibrook (2009; Fig. 6e).
As expected from our studied transect ranging from a strongly altered to an only slightly altered site in terms of nutrient supply, hydrological conditions, and coverage of PFTs, we observed pronounced differences in gas fluxes and peat quality. Besides all differences, the dominant CH4 emission pathway was plant-mediated transport at all sites. We are aware that the effects of anthropogenic impact are much more difficult to constrain in an in situ study such as ours compared to well-defined ecosystem manipulation studies. Nevertheless, our results support an obvious interplay of processes, fluxes, and vegetation that can be related to the observed impacts of nutrient enrichment and altered hydrology, as discussed in the following paragraphs.
4.1 Long-term insights into carbon cycling at the sites
Long-term plant community changes were recently shown to affect peatland organic matter composition (Hodgkins et al., 2014), while such an effect was not identified in a short-term study (Robroek et al., 2015). Along our transect of study sites, we observed the highest degree of bulk peat decomposition in the upper peat layers of site 4, which was located in closest vicinity to the water reservoir and was the most altered among our four sites (Fig. 2a). Our initial hypothesis 1, that peripheral sites feature accelerated C cycling reflected in more decomposed peat, could thus only be partly verified: the fact that we did not find a gradual decrease in terms of the degree of bulk peat decomposition with increasing distance from the reservoir, but observed significant differences only for site 4, suggests that the observed differences could also be primarily induced by the shift to a predominance of shrubs. Shrubs contain more woody parts and thus have higher lignin contents and more phenolic groups than graminoids or mosses and they are also more productive than mosses and graminoids (Bragazza et al., 2007). In recent studies, an increasing ericaceous shrub cover was associated with increasing polyphenol content in plant litter and pore water, as well as increasing phenol oxidase in litter of ericaceous shrubs. Also, a higher release of labile C from vascular plant roots was observed. Increases in shrub cover, observed along an altitudinal gradient reflecting altered temperature regimes, were accompanied by a decreasing Sphagnum productivity (Bragazza et al., 2013, 2015). Even though at site 4 we primarily dealt with eutrophication rather than warming, a similar explanation may apply to our observations: shrubs outcompete Sphagnum mosses after long-term nutrient infiltration and a reduced recalcitrance of the peat arising from shrub litter can result in a reduced C storage, i.e., peat accumulation (Turetsky et al., 2012; Larmola et al., 2013; Ward et al., 2013). This explanation is further suggested by the lowest observed CO2 uptake and lowest DIC concentrations along peat profiles throughout the study period at that particular site.
Pore-water DOM quality indices at site 3 revealed a significantly lower share of aromatic compounds and thus suggested a lower degree of humification and comparably increased molecular weight at that site (Fig. 2c–e). This more labile nature of DOM compared to otherwise similar bulk peat quality suggested either an input from the vegetation (Robroek et al., 2015) or some inflow of water and solutes from the nearby reservoir. Given that the site 4 pore-water DOM characteristics differed strongly from those at site 3, as did predominant PFTs, the distinctive features of the site 3 pore water were probably also induced by the vegetation. However, the fact that the vegetational composition of site 3 and site 2 were rather similar, whereas the pore-water DOM quality was again significantly different, suggested that DOM properties were likely affected by both vegetation, i.e., photosynthetic productivity and concomitantly higher input of labile compounds, and by inflow of DOM from the reservoir.
The nature of our results does not allow for an unambiguous conclusion in terms of whether it is the vicinity to the reservoir or the plant community composition that drives C cycling and peat accumulation at the sites. However, since peatland plant community compositions are known to be remarkably stable over time but experience changes in relative abundances (Rydin and Barber, 2001; Bragazza et al., 2006), we suggest that it was probably the vicinity to the reservoir that shaped the plant community composition at the sites over time, whereas the plant community actually drives C cycling.
4.2 Seasonal development of carbon fluxes
Different PFTs were recently shown to have a strong impact on peatland ecosystem CO2 fluxes (Ward et al., 2013; Kuiper et al., 2014). This could be confirmed by our results: shrub-dominated site 4 showed the lowest cumulative CO2 uptake, whereas at the graminoid-moss-dominated sites 3 and 2 and at the moss-dominated site 1, very high CO2 uptake rates were observed. The CO2 uptake rates of our sites 1, 2, and 3 exceeded the reported CO2 uptake rates of bogs by far: for instance, Teklemariam et al. (2010) reported a net ecosystem exchange of the ombrotrophic, continental Mer Bleue bog of −140 to −20 g C m−2, while hollow CO2 uptake rates in our study were notably higher and rather comparable to the uptake rates reported for fens (Lund et al., 2010). These latter values also compare well with the surface peat accumulation rates of ∼ 200 to ∼ 300 g C m−2 observed at our site (Berger et al., 2017). NEP of site 4 was significantly lower compared to the other sites fluxes, indicating less CO2 uptake. In light of the strong alterations in terms of vegetation cover and the most decomposed surface peat at site 4, our findings from an in situ transect support earlier findings of reduced net CO2 uptake and a concomitantly promoted vascular plant community in a controlled long-term fertilization experiment at the Mer Bleue bog (Bubier et al., 2007). Partitioning of NEP into Reco and GPP further illustrated that the observed differences in CO2 fluxes between sites were predominantly driven by varying GPP, while Reco of all sites was in a comparable range.
With regard to CH4 emissions, site 3 exceeded the other three sites by 30 % on average. In existing studies, the greatest emissions were similarly found in wetter habitats dominated by graminoids (Levy et al., 2012; Gray et al., 2013). Given that CH4 emissions at site 2 were significantly smaller than those from site 3, even though the two sites featured a very similar graminoid-moss-dominated vegetation cover, the differences in CH4 fluxes could be attributed to (i) the wetter conditions at site 3, (ii) a greater nutrient supply at site 3 stimulating greater CH4 production and emissions (Eriksson et al., 2010), or (iii) a mixture of both effects. Interestingly, site 4, which experienced similar water table fluctuations as site 3 but featured a notably different vegetation cover, emitted CH4 in a similar range as sites 1 and 2. High CH4 production due to input of labile organic matter near the reservoir was probably outweighed by less plant-mediated CH4 transport and therefore emissions due to less graminoid cover.
In our study NEP, GPP, and CH4 emissions were negatively correlated with CH4 and DIC concentrations in the uppermost 50 cm of the profiles at sites 1, 2, and 3. Such a decoupling of CO2 and CH4 fluxes from pools in the peat was already observed in previous studies: graminoids are known to be important facilitators of CH4 emissions because they can transport CH4 from deeper, water-saturated layers of the peat into the atmosphere via aerenchymatous tissue and bypass the zone of CH4 oxidation (Shannon and White, 1994; Marushchak et al., 2016). Moreover, they supply exudates via their roots, stimulating microbial activity and accordingly methanogenesis (Bubier et al., 1995). Through their deeper rooting system, graminoids may thus have connected the CH4 pools of deeper layers below our studied profile, i.e., below 50 cm of depth, to fuel the observed surface fluxes. This effect is supported by the observed differences in isotopic signatures of CH4 in the peat and CH4 emitted (see below). The decreasing concentrations of CH4 in near surface layers due to a decrease in water table levels and partial aeration thus did not translate into lower fluxes, a similar effect as suggested by Strack et al. (2006). Moreover, at low water tables and unsaturated conditions diffusivity for CO2 increases, leading to notably higher diffusive fluxes despite low concentrations (Knorr et al., 2008). It is striking that DIC concentrations at site 4 were notably lower as compared with other sites. A reasonable explanation is a lower peat quality resulting from repeated peat oxygenation upon water table fluctuations of the reservoir, stimulating microbial decomposition in the presence of deciduous shrubs (Bragazza et al., 2016), which are apparently promoted in closer vicinity to the eutrophic water reservoir. Such an effect of aeration might appear contradictory, as wetter conditions would be expected near the water reservoir. However, repeated water table fluctuations driven by the management of the reservoir could effectively recharge electron acceptor pools to support ongoing decomposition, as shown, for example, in water table manipulation experiments (Blodau et al., 2004; Knorr et al., 2009). Moreover, near the reservoir an advective redistribution and removal of CO2 and CH4 through advective flow cannot be excluded.
4.3 Methane production, methanotrophy, and pathways of CH4 emissions as inferred from stable isotopes
Distinguishing CH4 production pathways in peatlands using δ13C signatures along depth profiles is a common approach (e.g., Holmes et al., 2015; McCalley et al., 2014; Hodgkins et al., 2014; Kotsyurbenko et al., 2004; Chasar et al., 2000). However, methanogenesis is a strictly anaerobic process and thus saturated, anoxic conditions are a prerequisite for an unbiased differentiation of pathways using 13C only (Conrad, 1996). Methanotrophy would otherwise bias the interpretation of 13C isotopic signatures of CH4, as residual CH4 gets enriched in 13C, mimicking values as observed under methanogenic conditions predominated by the acetoclastic pathway (Whiticar, 1999; Alstad and Whiticar, 2011). Indeed, summer WTD at all study sites dropped down to −32.5 cm (site 1), −31.8 cm (site 2), −13.3 (site 3), and −19.1 cm (site 4) below the surface and we could thus only assume saturated, anoxic conditions below that depth. We will limit the discussion of CH4 production pathways accordingly. For shallower depths, the effects under such conditions are much more favorable and methanotrophy can be expected to predominate: if the proportion of methanogenesis vs. methanotrophy is comparatively shifted toward methanogenesis, a relative 13C–CH4 depletion would be detected, and if the proportion of methanogenesis vs. methanotrophy is comparatively shifted toward methanotrophy, a relative 13C enrichment in CH4 would be detected.
CH4 oxidation was accordingly observed in the top −5 to −15 cm along our study transect during the summer months, with the least negative δ13C–CH4 values at 5 cm of depth at site 1. Moreover, δ13C–CH4 signatures at 5 cm of depth on different sampling dates appeared to be most variable at sites 1 and 2, which were also found to be drier than sites 3 and 4 where less pronounced shifts of δ13C–CH4 signatures occurred throughout the sampling period. However, also at the latter sites, variations in δ13C–CH4 were apparently driven by fluctuations of the water table levels, suggesting that CH4 oxidation must have been an important factor throughout the dry season in summer. Another interesting finding was the strong δ13C–CH4 signal pointing to notable CH4 oxidation at 15 cm of depth at site 4 in August 2015 (−39.10 ‰) as compared to more 13C-depleted CH4 (−57.73 ‰) in 5 cm of depth. This was probably due to the particularly low CH4 concentrations, suggesting an input of atmospheric CH4 (∼ −55 ‰) into the surface peat. Site 4 also featured the most enriched δ13C–CH4 signatures in general, suggesting either the least CH4 production or the most CH4 oxidation here. Site 3 showed the smallest variations in δ13C–CH4 signatures throughout the sampling period, suggesting the least modification of δ13C–CH4 from oxidation here, which corresponds well with the greatest CH4 emissions and the generally highest water levels measured at that site.
Overall the lowest δ13C–CO2 values were found at site 4 where simultaneously least negative values of δ13C–CH4 were observed, suggesting a higher share of CO2 from increased CH4 oxidation. CO2 generally got more enriched in 13C with depth at all sites and sampling dates, as expected from ongoing fractionation by methanogenesis. Great shifts in δ13C–CO2 values at the drier sites 1 and 2 during the entire sampling period could again be explained by the increased exchange of peat-derived CO2 with atmospheric CO2 under unsaturated conditions with dropping water tables in August.
Regarding observed ranges of αC values at −35 cm of depth at the sites, also a gradient in terms of the CH4 production pathway along the transect of study sites became apparent. Sites 1 and 2, which experienced the lowest water tables during the summer and were located the farthest from the water reservoir, featured a distinct shift from mostly hydrogenotrophic CH4 production in June to acetoclastic CH4 production in July and August and another shift back to hydrogenotrophic CH4 production in September, with these shifts being more pronounced at site 1. This could be related to increased vascular plant activity in the growing season and concomitant substrate supply to methanogens, for example through exudation; an increased share of acetoclastic methanogenesis within the rhizosphere has previously been reported (Chasar et al., 2000; Hornibrooket al., 2007). At sites 3 and 4, such obvious shifts of CH4 production pathways could not be observed, though αC values indicated either acetoclastic CH4 production or a co-occurrence of acetoclastic and hydrogenotrophic CH4 production. As acetoclastic methanogenesis is in particular supported in minerotrophic peatlands in the presence of vascular plants (Alstad and Whiticar, 2011; Chasar et al., 2000), the predominance of that pathway – in particular in closer vicinity to the reservoir – is not a surprising finding for Wylde Lake peatland. Indeed, under the predominance of sedges, which supply labile organic matter through roots, acetoclastic CH4 production prevailed (Bellisario et al., 1999; Popp et al., 2000; Strom et al., 2003). However, the fact that CH4 production pathways at sites 3 and 4 (different vegetation) were similar, whereas CH4 production pathways at sites 2 and 3 (similar vegetation) were different, suggested that variation in αC reflects the impact of the reservoir by either (a) sustaining higher water tables or (b) increased nutrient input rather than the presence of sedges at the sites.
The emitted CH4 (see Fig. 6a–d) was in general depleted in 13C compared to the CH4 (see Fig. 5) in all sampled peat layers. This suggests that the emitted CH4 must have been produced in the deeper peat layers (Marushchak et al., 2016) where δ13C–CH4 signatures were probably more depleted, and during transport through plant aerenchyma, the lighter CH4 could bypass oxidation. Moreover, plant-mediated transport also slightly discriminates against 13C–CH4 (Chanton, 2005), favoring more negative values of δ13C in emitted CH4. Interestingly, plant-mediated transport was the dominant CH4 emission pathway even at sites 1 and 4 where graminoid cover accounted only for about 10 %. We suggest that this is due to the great CH4 oxidation in the upper peat layers and rather high concentrations at greater depth facilitating plant-mediated transport and ebullition. From visual inspection of Figs. 5 and 6a–d we suggest that the emitted CH4 originated from at least −35 cm of depth or below.
Hypothesis 2 stating that an increased abundance of vascular plants can increase CO2 uptake but also change patterns of CH4 production and emission, in particular if graminoids dominate, can only partly be accepted. If increased vascular plant cover translated into increased CO2 uptake, we should have observed increasing uptake in the order of site 1 < 2 = 3 < 4, but in fact we observed only significantly decreased uptake at site 4. The CO2 uptake at site 1 (the site with the least coverage of vascular plants) was not statistically different from the cumulative NEP observed at sites 2 and 3. Moreover, we cannot directly state that CH4 production and emission was increased where graminoids dominated. Although the greatest CH4 emission was observed at site 3, cumulative CH4 emission at site 2 was significantly lower, despite relatively similar vegetation. Besides PFTs, CH4 production appeared to be affected by the vicinity of the water reservoir, whereas plant-dominated CH4 emission was the dominant CH4 emission pathway at all study sites, even where graminoid coverage accounted for only 10 %. So, we conclude that an interplay of nutrient input, water table depth, and vegetational composition shaped CO2 uptake, CH4 production, and emissions and there was likely no unique driver in our in situ study compared to well-defined manipulation experiments.
Our study and earlier work at this particular site confirm that despite long-term increased nutrient supply, peatland ecosystem functioning in terms of C sequestration was largely maintained. However, along a sequence of study sites it became apparent that the affected sites responded differently to the altered conditions after dam construction in 1954. Shrub-dominated site 4, which was in closest vicinity to the reservoir and accordingly faced the greatest nutrient input and most pronounced water level fluctuations, indeed showed indications of degradation, such as most decomposed bulk peat, least atmospheric CO2 uptake, and reduced coverage of Sphagnum mosses. However, even here, overall net CO2 uptake still exceeded net CO2 release. The two graminoid-moss-dominated sites and the moss-dominated site featured very high CO2 uptake rates despite the apparent impact of nutrients and altered hydrology. Therefore, as hypothesized, our case study supports the fact that long-term nutrient enrichment in combination with hydrologically altered conditions may cause differential responses of C cycling and does not necessarily cause a loss of the C-sink function of peatland ecosystems.
Moreover, methanogenesis and methanotrophy featured a pattern that appeared to be related not predominantly to vegetation, but primarily to the vicinity to the reservoir and thus nutritional status and hydrologic regime. On the other hand, plant-mediated transport was determined to be the dominant CH4 emission pathway at all sites, even if graminoid cover was only 10 %. All surface peat layers indicated high methanotrophic activity, mitigating CH4 emission through diffusion.
Lastly, our results suggest that with regard to the overall C budget, a graminoid-moss-dominated peatland site can obviously withstand eutrophication in combination with frequent inundation better than a shrub-dominated peatland site. Straightforward results from manipulation experiments of individual factors (e.g., fertilization or water table changes) may therefore not be easily transferred to complex in situ conditions. We suggest that there could be a tipping point when a peatland system shifts from a net C sink – even though experiencing eutrophic conditions – to decreasing productivity, which might be related to an expansion of shrub-dominated vegetation decreasing overall C uptake.
The data can be accessed by email request to the corresponding authors.
The supplement related to this article is available online at: https://doi.org/10.5194/bg-15-885-2018-supplement.
CB, KHK, and SB designed the experiments; SB, LP, and MG conducted fieldwork and analyses with the help of KHK. SB prepared the paper with contributions from KHK, LP, and MG.
The authors declare that they have no conflict of interest.
This study was funded by the Deutsche Forschungsgemeinschaft (German Research Foundation, DFG; BL563/21-1). We thank Martin Neumann from the Grand River Conservation Authority for the permission to carry out research in the Luther Marsh Wildlife Management Area, and we thank Claudia Wagner-Riddle, Peter Smith, and Linda Wing for their help on organizational issues. We also thank Inge-Beatrice Biro, Magdalena Burger, Ines Spangenberg, Niclas Kolbe, Eike Esders, Michael Rammo, Niels Vickus, Fabian Benninghoff, Leonie Fröhlich, Jörg Rostek, and Cornelia Mesmer for their support in the field. Analyses of CO2 and CH4 concentrations, δ13C abundance, and spectral analyses of various samples were carried out at the institutional lab or the Institute of Landscape Ecology, University of Münster. We thank Stefanie Holm, Ronya Wallis, and Madelaine Supper for assistance during the analysis of numerous samples in the laboratory.
This paper is dedicated to the memory of Christian Blodau, who led the Wylde Lake peatland project until he tragically passed away in July 2016.
We thank two anonymous reviewers for their thoughtful comments that helped to
improve this paper.
Edited by: Edzo
Veldkamp
Reviewed by: two anonymous referees
Alstad, K. P. and Whiticar, M. J.: Carbon and hydrogen isotope ratio characterization of methane dynamics for Fluxnet peatland ecosystems, Org. Geochem., 42, 548–558, 2011.
Ballantyne, D. M., Hribljan, J. A., Pypker, T. G., and Chimner, R. A.: Long-term water table manipulations alter peatland gaseous carbon fluxes in northern Michigan, Wetl. Ecol. Manag., 22, 35–47, 2014.
Berger, S., Gebauer, G., Blodau, C., and Knorr, K.-H.: Peatlands in a eutrophic world – assessing the state of a poor fen-bog transition in southern Ontario, Canada, after long term nutrient Input and altered hydrological conditions, Soil Biol. Biochem., 114, 131–144, 2017.
Bellisario, L. M., Bubier, J. L., and Moore, T. R.: Controls on CH4 emissions from a northern peatland, Global Biogeochem. Cy., 13, 81–91, 1999.
Blodau, C.: Carbon cycling in peatlands – a review of processes and controls, Environ. Rev., 10, 111–134, 2002.
Blodau, C., Basiliko, N., and Moore, T. R.: Carbon turnover in peatland mesocosms exposed to different water table levels, Biogeochemistry, 67, 331–351, 2004.
Bragazza, L.: A decade of plant species changes on a mire in the Italian Alps: vegetation-controlled or climate-driven mechanisms?, Climatic Change, 77, 415–429, 2006.
Bragazza, L., Siffi, C., Lacumin, P., and Gerdol, R.: Mass loss and nutrient release during litter decay in peatland: the role of microbial adaptability to litter chemistry, Soil Biol. Biochem., 39, 257–267, 2007.
Bragazza, L., Buttler, A., Habermacher, J., Brancaleoni, L., Gerdol, R., Fritze, H., Hanjík, P., Laiho, R., and Johnson, D.: High nitrogen deposition alters the decomposition of bog plant litter and reduces carbon accumulation, Glob. Change Biol., 18, 1163–1172, 2012.
Bragazza, L., Parisod, J., Buttler, A., and Bardgett, R. D.: Biogeochemical plant-soil microbe feedback in response to climate warming in peatlands, Nat. Clim. Change, 3, 273–277, 2013.
Bragazza, L., Bardgett, R. D., Mitchell, E. A. D., and Buttler, A.: Linking soil microbial communities to vascular plant abundance along a climate gradient, New Phytol., 205, 1175–1182, 2015.
Bragazza, L., Buttler, A., Robroek, B., Albrecht, R., Zaccone, C., Jassey, V., and Signarbieux, C.: Persistent high temperature and low precipitation reduce peat carbon accumulation, Glob. Change Biol., 22, 4114–4123, 2016.
Broder, T., Blodau, C., Biester, H., and Knorr, K. H.: Peat decomposition records in three pristine ombrotrophic bogs in southern Patagonia, Biogeosciences, 9, 1479–1491, https://doi.org/10.5194/bg-9-1479-2012, 2012.
Bubier, J. L., Moore, T. R., Bellisario, L., Comer, N. T., and Crill, P. M.: Ecological controls on methane emissions from a northern peatland complex in the zone of discontinuous permafrost, Manitoba, Canada, Global Biogeochem. Cy., 9, 455–470, 1995.
Bubier, J. L., Moore, T. R., and Bledzki, L. A.: Effects of nutrient addition on vegetation and carbon cycling in an ombrotrophic bog, Glob. Change Biol., 13, 1168–1186, 2007.
Burger, M., Berger, S., Spangenberg, I., and Blodau, C.: Summer fluxes of methane and carbon dioxide from a pond and floating mat in a continental Canadian peatland, Biogeosciences, 13, 3777–3791, https://doi.org/10.5194/bg-13-3777-2016, 2016.
Chanton, J. P.: The effect of gas transport on the isotope signature of methane in wetlands, Org. Geochem., 36, 753–768, 2005.
Chasar, L. S., Chanton, J. P., Glaser, P. H., and Siegel, D. I.: Methane concentration and stable isotope distribution as evidence of rhizospheric processes: comparison of a fen and bog in the glacial Lake Agassiz peatland complex, Ann. Bot., 86, 655–663, 2000.
Conrad, R.: Soil microorganisms as controllers of atmospheric trace gases (H−2, CO, CH4, OCS, N2O and NO), Microbiol. Mol. Biol. Rev., 60, 609–640, 1996.
Conrad, R.: Quantification of methanogenic pathways using stable carbon isotopic signatures. A review and a proposal, Org. Geochem., 36, 739–752, 2005.
Eriksson, T., Öquist, M. G., and Nilsson, M. B.: Production and oxidation of methane in a boreal mire after a decade of increased temperature and nitrogen and sulfur deposition, Glob. Change Biol., 16, 2130–2144, 2010.
Gray, A., Levy, P. E., Cooper, M. D. A., Jones, T., Gaiawyn, J., Leeson, S. R., Ward, S. E., Dinsmore, K. J., Sheppard, L. J., Ostle, N. J., Evans, C. D., Burden, A., and Zielinski, P.: Methane indicator values for peatlands: a comparison of species and functional groups, Glob. Change Biol., 19, 1141–1150, 2013.
Hesslein, R. H.: Insitu sampler for close interval pore water studies, Limnol. Oceanogr., 21, 912–914, 1976.
Hodgkins, S. B., Tfaily, M. M., McCalley, C. K., Logan, T. A., Crill, P. M., Saleska, S. R., Rich, V. I., and Chanton, J. P.: Can changes in peat chemistry associated with permafrost thaw increase greenhouse gas production, P. Natl. Acad. Sci. USA, 111, 5819–5824, 2014.
Hoefs, J.: Stable Isotope Geochemistry, 3rd edn., Springer, Berlin, 1987.
Holmes, M. E., Chanton, J. P., Tjaily, M. M., and Ogram, A.: CO2 and CH4 isotope compositions and production pathways in a tropical peatland, Global Biogeochem. Cy., 29, 1–18, 2015.
Hornibrook, E. R. C. and Bowes, H. L.: Trophic status impacts both the magnitude and stable carbon isotope composition of methane flux from peatlands, Geophys. Res. Lett., 34, L21401, https://doi.org/10.1029/2007GL031231, 2007.
Hornibrook, E. R. C.: The stable carbon isotope composition of methane produced and emitted from northern peatlands, in: Carbon Cycling in Northern Peatlands, edited by: Baird, A. J., Belyea, L. R., Comas, X., Reeve, A. S., and Slater, L. D., Geoph. Monog. Series, Bd. 184, American Geophysical Union, Washington, D.C., 187–203, 2009.
Kammann, C., Grünhage, L., and Jäger, H.-J.: A new sampling technique to monitor concentrations of CH4, N2O and CO2 in air at well-defined depths in soils with varied water potential, Eur. J. Soil Sci., 52, 297–303, 2001.
Kim, Y., Ullah, S., Roulet, N. T., and Moore, T. R.: Effect of inundation, oxygen and temperature on carbon mineralization in boreal ecosystems, Sci. Total Environ., 511, 381–392, 2015.
Klüpfel, L., Piepenbrock, A., Kappler, A., and Sander, M.: Humic substances as fully regenerable electron acceptors in recurrently anoxic environments, Nat. Geosci., 7, 195–200, 2014.
Knorr, K.-H., Oosterwoud, M. R., and Blodau, C.: Experimental drought alters rates of soil respiration and methanogenesis but not carbon exchange in soil of a temperate fen, Soil Biol. Biochem., 40, 1781–1791, 2008.
Knorr, K.-H., Lischeid, G., and Blodau, C.: Dynamics of redox processes in a minerotrophic fen exposed to a water table manipulation, Geoderma, 153, 379–392, 2009.
Kotsyurbenko, O. R., Chin, K.-J., Glagolev, M. V., Stubner, S., Simankova, M. V., Nozhevnikova, A. N., and Conrad, R.: Acetoclastic and hydrogenotrophic methane production and methanogenic populations in an acidic west-Siberian peat bog, Environ. Microbiol., 6, 1159–1173, 2004.
Kuiper, J. J., Mooij, W. M., Bragazza, L., and Robroek, B. J. M.: Plant functional types define magnitude of drought response in peatland CO2 exchange, Ecology, 95, 123–131, 2014.
Laine, J., Harju, P., Timonen, T., Laine, A., Tuittila, E.-S., Minkkinen, K., and Vasander, H.: The Intricate Beauty of Sphagnum mosses – a Finnish Guide to Identification, 2nd amended edition, 2011.
Larmola, T., Bubier, J. L., Kobyljanec, C., Basiliko, N., Juutinen, S., Humphreys, E., Preston, M., and Moore, T. R.: Vegetation feedbacks of nutrient addition lead to a weaker carbon sink in an ombrotrophic bog, Glob. Change Biol., 19, 3729–3739, 2013.
Levy, P. E., Burden, A., Cooper, M. D. A., Dinsmore, K. J., Drewer, J., Evans, C., Fowler, D., Gaiawyn, J., Gray, A., Jones, S. K., Jones, T., Mcnamara, N. P., Mills, R., Ostle, N., Sheppard, L. J., Skiba, U., Sowerby, A., Ward, S. E., and Zielinski, P.: Methane emissions from soils: synthesis and analysis of a large UK data set, Glob. Change Biol., 18, 1657–1669, 2012.
Limpens, J., Berendse, F., Blodau, C., Canadell, J. G., Freeman, C., Holden, J., Roulet, N., Rydin, H., and Schaepman-Strub, G.: Peatlands and the carbon cycle: from local processes to global implications – a synthesis, Biogeosciences, 5, 1475–1491, https://doi.org/10.5194/bg-5-1475-2008, 2008.
Lund, M., Lafleur, P. M., Roulet, N. T., Lindroth, A., Christensen, T. R., Aurela, M., Chojnicki, B. H., Flanagan, L. B., Humphreys, E. R., Laurila, T., Oechel, W., Olejnik, J., Rinne, J., Schubert, P., and Nilsson, M. B.: Variability in exchange of CO2 across 12 northern peatland and tundra sites, Glob. Change Biol., 16, 2436–2448, 2010.
Marushchak, M. E., Friborg, T., Biasi, C., Herbst, M., Johansson, T., Kiepe, I., Liimatainen, M., Lind, S. E., Martikainen, P. J., Virtanen, T., Soegaard, H., and Shurpali, N. J.: Methane dynamics in the subarctic tundra: combining stable isotope analyses, plot- and ecosystem-scale flux measurements, Biogeosciences, 13, 597–608, https://doi.org/10.5194/bg-13-597-2016, 2016.
McCalley, C., Woodcroft, B., Hodgkins, S., Wehr, R., Kim, E.-H., Mondav, R., Crill, P., Chanton, J., Rich, V., Tyson, G., and Saleska, S.: Methane dynamics regulated by microbial community response to permafrost thaw, Nature, 514, 7523, 478–481, 2014.
Morris, P. J., Waddington, J. M., Benscoter, B. W., and Turetsky, M. R.: Conceptual frameworks in peatland ecohydrology: looking beyond the two-layered (acrotelm–catotelm) model, Ecohydrology, 4, 1–11, 2011.
Murphy, K. R., Butler, K. D., Spencer, R. G., Stedmon, C. A., Boehme, J. R., and Aiken, G. R.: Measurement of dissolved organic matter fluorescence in aquatic environments: an interlaboratory comparison, Environ. Sci. Technol., 44, 9405–9412, 2010.
National Climate Data and Information Archive: Canadian Climate Normals, Dataset for the climate station Fergus, Shand Dam, 1981 to 2010, available at: http://climate.weather.gc.ca/climate_normals/index_e.html (last access: 18 November 2015), 2014.
Niemeyer, J., Chen, Y., and Bollag, J. M.: Characterization of humic acids, composts, and peat by diffuse reflectance Fourier-Transform Infrared Spectroscopy, Soil Sci. Soc. Am. J., 56, 135–140, 1992.
Nijp, J. J., Limpens, J., Metselaar, K., van der Zee, S. E. A. T. M., Berendse, F., and Robroek, B. J. M.: Can frequent precipitation moderate the impact of drought on peatmoss carbon uptake in northern peatlands?, New Phytol., 203, 70–80, 2014.
Ohno, T.: Fluorescence inner-filtering correction for determining the humification index of dissolved organic matter, Environ. Sci. Technol., 36, 742–746, 2002.
Owen, K. E., Tenhunen, J., Reichstein, M., Wang, Q., Falge, E., Geyer, R., Xiao, X. M., Stoy, P., Amman, C., Arain, A., Aubinet, M., Aurela, M., Bernhofer, C., Chojnicki, B. H., Grainer, A., Gruenwald, T., Hadley, J., Heinsch, B., Hollinger, D., Knohl, A., Kutsch, W., Lohila, A., Meyers, T., Moors, E., Moureaux, C., Pilegaard, K., Saigusa, N., Verma, S., Vesala, T., and Vogel, C.: Linking flux network measurements to continental scale simulations: ecosystem carbon dioxide exchange capacity under non-water-stressed conditions, Glob. Change Biol., 13, 734–760, 2007.
Pack, M. A., Xu, X., Lupascu, M., Kessler, J. D., and Czimczik, C. I.: A rapid method for preparing low volume CH4 and CO2 gas samples for 14C AMS analysis, Org. Geochem., 78, 89–98, 2015.
Panikov, N. S., Mastepanov, M. A., and Christensen, T. R.: Membrane probe array: Technique development and observation of CO2 and CH4 diurnal oscillations in peat profile, Soil Biol. Biochem., 39, 1712–1723, 2007.
Peuravuori, J. and Pihlaja, K.: Molecular size distribution and spectroscopic properties of aquatic humic substances, Anal. Chim. Acta, 337, 133–149, 1997.
Popp, T. J., Chanton, J. P., Whiting, and G. J., Grant, N.: Evaluation of methane in the rhizosphere of a Carex dominated fen in north central Alberta, Canada, Biogeochemistry, 51, 259–281, 2000.
Robroek, B., Jassey, V. E. J., Kox, M., A. R., Berendsen, R. L., Mills, R. T. E., Cécillon, L., Puissant, J., Meima-Franke, M., Bakker, P. A. H. M., and Bodelier, P. L. E.: Peatland vascular plant functional types affect methane dynamics by altering microbial community structure, J. Ecol., 103, 925–934, 2015.
Rydin, H. and Barber, K. E.: Long-term and fine-scale coexistence of closely related species, Folia Geobot., 36, 53–61, 2001.
Rydin, H. and Jeglum, J. K.: The Biology of Peatlands, 2nd edn., Oxford University Press, 2013.
Sander, R.: Compilation of Henry's Law Constants for Inorganic and Organic Species of Potential Importance in Environmental Chemistry, Max Planck Institute of Chemistry, Mainz, available at: http://www.henrys-law.org/henry-3.0.pdf (last access: 1 June 2016), 1999.
Schütz, H., Schroder, P., and Rennenberg, H.: Role of plants in regulating the methane flux to the atmosphere, in: Trace Gas Emission by Plants, edited by: Sharkey, T. D., Holland, E. A., and Mooney, H. A., Academic Press, NY, 29–69, 1991.
Shannon, R. D. and White, J. R.: A three-year study of controls on methane emissions from two Michigan peatlands, Biogeochemistry, 27, 35–60, 1994.
Sheppard, L. J., Leith, I. D., Leeson, S. R., van Dijk, N., Field, C., and Levy, P.: Fate of N in a peatland, Whim bog: immobilisation in the vegetation and peat, leakage into pore water and losses as N2O depend on the form of N, Biogeosciences, 10, 149–160, https://doi.org/10.5194/bg-10-149-2013, 2013.
Strack, M., Waller, M. F., and Waddington, J. M.: Sedge succession and peatland methane dynamics: a potential feedback to climate change, Ecosystems, 9, 278–287, 2006.
Strom, L., Ekberg, M., Mastepanov, M., and Christensen, T. R.: The effect of vascular plants on carbon turnover and methane emissions from a tundra wetland, Glob. Change Biol., 9, 1185–1193, 2003.
Stumm, W. and Morgan, J. J.: Aquatic chemistry. Chemical Equilibria and Rates in Natural Waters, 3rd edn., Wiley (Environmental Science and Technology), Hoboken, 1996.
Succow, M. and Joosten, H.: Landschaftsökologische Moorkunde, Zweite, völlig neu bearbeitete Auflage, 2. Auflage, E. Schweizerbart`sche Verlagsbuchhandlung, Stuttgart, 2012.
Teh, Y. A., Silver, W. L., Conrad, M. E., Borglin, S. E., and Carlson, C. M.: Carbon isotope fractionation by methane-oxidizing bacteria, J. Gephys. Res.:-Biogeosci., 111, G01003, https://doi.org/10.1029/2005JG000053, 2006.
Tilsner, J., Wrage, N., Lauf, J., and Gebauer, G.: Emission of gaseous nitrogen oxides from an extensively managed grassland in NE Bavaria, Germany. I. Annual budgets of N2O and NOx emissions, Biogeochemistry, 63, 229–247, 2003.
Teklemariam, T. A., Lafleur, P. M., Moore, T. R., Roulet, N. T., and Humphreys, E. R.: The direct and indirect effects of inter-annualmeteorological variability on ecosystem carbon dioxide exchange at a temperate ombrotrophic bog, Agr. Forest Meteorol., 150, 1402–1411, 2010.
Tranvik, L. J., Downing, J. A., Cotner, J. B., Loiselle, S. A., Striegl, R. G., Ballatore, T. J., Dillon, P., Finlay, K., Fortino, K., Knoll, L. B., Kortelainen, P. L., Kutser, T., Larsen, S., Laurion, I., Leech, D. M., McCallister, L., McKnight, D. M., Melack, J. M., Overholt, E., Porter, J. A., Prairie, Y., Renwick, W. H., Roland, F., Sherman, B. S., Schindler, D. W., Sobek, S., Tremblay, A., Vanni, M. J., Verschoor, A. M., von Wachenfeldt, E., and Weyhenmeyer, G. A.: Lakes and reservoirs as regulators of carbon cycling and climate, Limnol. Oceanogr., 54, 2298–2314, 2009.
Turetsky, M. R., Bond-Lamberty, B., Euskirchen, E., Talbot, J., Frolking, S., McGuire, M. R., and Tuittila, E.-S.: The resilience and functional role of moss in boreal and arctic ecosystems, New Phytol., 196, 49–67, 2012.
van den Berg, M., Ingwersen, J., Lamers, M., and Streck, T.: The role of Phragmites in the CH4 and CO2 fluxes in a minerotrophic peatland in southwest Germany, Biogeosciences, 13, 6107–6119, https://doi.org/10.5194/bg-13-6107-2016, 2016.
Ward, S. E., Ostle, N. J., Oakley, S., Quirk, H., Henrys, P. A., and Baedgett, R. D.: Warming effects on greenhouse gas fluxes in peatlands are modulated by vegetation composition, Ecol. Lett., 16, 1285–1293, 2013.
Wang, M., Moore, T. R., Talbot, J., and Riley, J. L.: The stochiometry of carbon and nutrients in peat formation, Global Biogeochem. Cy., 29, 113–121, 2015.
Wang, M., Larmola, T., Murphy, M. T., Moore, T. R., and Bubier, J.: Stoichiometric response of shrubs and mosses to long-term nutrient (N, P and K) addition in an ombrotrophic peatland, Plant Soil, 400, 403–416, 2016.
Weishaar, J. L., Aiken, G. R., Bergamischi, B. A., Fram, M. S., Fujii, R., and Mopper, K.: Evaluation of specific ultraviolet absorbance as an indicator of the chemical composition and reactivity of dissolved organic carbon, Environ. Sci. Technol., 37, 4702–4708, 2003.
Whalen, S. C.: Biogeochemistry of methane exchange between natural wetlands and the atmosphere, Environ. Eng. Sci., 22, 73–94, 2005.
Whalen, S. C., Reeburgh, W. S., and Sandbeck, K. A.: Rapid methane oxidation in a landfill cover soil, Appl. Environ. Microbiol., 56, 3405–3411, 1990.
Whiticar, M. J.: Carbon and hydrogen isotope systematics of bacterial formation and oxidation of methane, Chem. Geol., 161, 291–314, 1999.
Whiticar, M. J., Faber, E., and Schoell, M.: Biogenic methane formation in marine and freshwater environments, CO2 reduction vs. acetate fermentation – isotope evidence, Geochim. Cosmochim. Ac., 50, 693–709, 1986.
Whiting, G. J. and Chanton, J. P.: Control of the diurnal pattern of the methane emission from emergent aquatic macrophytes by gas transport mechanisms, Aquat. Bot., 54, 237–253, 1996.
Wiedermann, M. M., Nordin, A., Gunnarsson, U., Nilsson, M. B., and Ericson, L.: Global change shifts vegetation and plant-parasite interactions in a boreal mire, Ecology, 88, 454–464, 2007.