the Creative Commons Attribution 4.0 License.
the Creative Commons Attribution 4.0 License.
 | 19 Feb 2018
Molecular fingerprinting of particulate organic matter as a new tool for its source apportionment: changes along a headwater drainage in coarse, medium and fine particles as a function of rainfalls
Laurent Jeanneau
Richard Rowland
Shreeram Inamdar
Tracking the sources of particulate organic matter (POM) exported from catchments is important to understand the transfer of energy from soils to oceans. The suitability of investigating the molecular composition of POM by thermally assisted hydrolysis and methylation using tetramethylammonium hydroxide directly coupled to gas chromatography and mass spectrometry is presented. The results of this molecular-fingerprint approach were compared with previously published elemental (% C, % N) and isotopic data (δ13C, δ15N) acquired in a nested headwater catchment in the Piedmont region, eastern United States of America (12 and 79 ha). The concordance between these results highlights the effectiveness of this molecular tool as a valuable method for source fingerprinting of POM. It emphasizes litter as the main source of exported POM at the upstream location (80±14 %), with an increasing proportion of streambed (SBed) sediment remobilization downstream (42 ± 29 %), specifically during events characterized by high rainfall amounts. At the upstream location, the source of POM seems to be controlled by the maximum and median hourly rainfall intensity. An added value of this method is to directly investigate chemical biomarkers and to mine their distributions in terms of biogeochemical functioning of an ecosystem. In this catchment, the distribution of plant-derived biomarkers characterizing lignin, cutin and suberin inputs were similar in SBed and litter, while the proportion of microbial markers was 4 times higher in SBed than in litter. These results indicate that SBed OM was largely from plant litter that has been processed by the aquatic microbial community.
- Article
(3595 KB) - Full-text XML
-
Supplement
(246 KB) - BibTeX
- EndNote


Particulate organic matter (POM) plays key roles in aquatic ecosystems, controlling the transfer and the bioavailability of energy, nutrients and micropollutants. The flux of POM from soils to oceans has been estimated at 0.2 Gt C year−1 (Ludwig et al., 1996), with 80 % coming from biospheric inputs and the complement from petrogenic inputs (Galy et al., 2015). Assuming that the energy provided by natural organic matter is equivalent to the energy provided by the combustion of wood, this flux of POM corresponds to an energy of 2.8 EJ, that is to say less than 2 days of the global energy consumption by humanity in 2015 (yearbook.enerdata.net). This export mainly occurs during storm events, those hot moments being responsible for up to 80 % of annual particulate organic carbon (POC) export, depending on the investigated catchment (Dhillon and Inamdar, 2013; Jeong et al., 2012; Jung et al., 2012; Oeurng et al., 2011).
Among these hot moments, extreme events, defined as when storm flow exceeded the ninth decile less than 10 % of the time (IPCC, 2001), seem to play a dominant role. In two contrasted catchments, a mountainous one in South Korea and a lowland one in the eastern United States of America (USA), the specific POC flux (flux per unit area of the catchment) has been shown to be nonlinearly related to total rainfall with a threshold value beyond which the slope increased sharply (Dhillon and Inamdar, 2013; Jung et al., 2014). The threshold value (approx. 70 mm in the American catchment and approx. 120 mm in the South Korean catchment) and the magnitude of this increase differed between both catchments and is probably watershed-dependent. Is the non linearity of the relationship between rainfall amount and POC export observed previously linked to a modification of the source of POM? POM in a river system is a combination of allochthonous and autochthonous OM. The former is derived mainly from the soil and bank erosion, while the latter can be composed of fresh aquatic living organisms and bed sediments. The balance between these different sources is controlled (i) by the catchment' size and morphology and (ii) by the rainfall event characteristics (Tank et al., 2010).
Tracking the sources of POM can be done indirectly by investigating the sources of suspended matter. This can be done through the analysis of fallout radionuclides such as beryllium-7, lead-210 and cesium-137 (Ritchie et al., 1974; Wallbrink and Murray, 1996; Walling, 1998) or by geochemical fingerprinting of rare elements (Collins and Walling, 2002). It can also be done directly by investigating the composition of POM using bulk-scale descriptors such as OC and nitrogen concentrations, the C∕N ratio, and stable isotopes δ13C and δ15N (Fox and Papanicolaou, 2008). Molecular biomarker analyses have also been used. They are based on specific molecular classes such as lipid or lignin biomarkers (Goñi et al., 2013; Jung et al., 2015). Thermochemiolysis using tetramethylammonium hydroxide coupled to gas chromatography and mass spectrometry (THM-GC-MS) has already been applied to the investigation of the fate of river DOM (dissolved organic matter; Jeanneau et al., 2015) and POM (Mannino and Harvey, 2000). This analytical technique is widely used to investigate the biogeochemistry of soil organic matter (Derenne and Quénéa, 2015) and, coupled to a principal component analysis (PCA), it has been shown to be valuable for forensic soil applications (Lee et al., 2012). An advantage of such an analysis is to generate a distribution of more than 100 identified target compounds with small amounts of particulate matter (from 5 to 10 mg) (Jeanneau et al., 2014), giving a dataset rich enough to differentiate between sources (Walling, 2013). Here this analytical approach is combined with a PCA to determine the main sources of POM as a function of the sediment size, the catchment size and the rainfall characteristics.
The first objective of this paper is to test the suitability of molecular biomarkers derived from THM-GC-MS as a tool to determine the sources of river POM. The second objective is to investigate how the sources of POM changed as a function of the catchment size, particle size of the sediment and the hydrological characteristics of the rainfall events. This study is based on a subset of samples used to investigate the sources of POM exported during storm events using 13C and 15N as tracers (Rowland et al., 2017). We hypothesized that molecular biomarkers provide important insights into sources of POM and can be used as complimentary tracers for POM alongside or in addition to stable isotopes.
2.1 Site description
This study was conducted in a 79 ha watershed (second-order stream) located in the Piedmont physiographic region of Maryland, USA (Fig. 1). The watershed drains into the Big Elk Creek, which discharges into the Chesapeake Bay. For a detailed description of the study site, refer to Rowland et al. (2017). Briefly, the watershed is predominantly forested with pasture along the outer periphery. Dominant canopy species include Fagus grandifolia (American beech), Liriodendron tulipifera (yellow poplar) and Acer rubrum (red maple). Bedrock formations consist of metamorphic gneiss and schist and soils are coarse loamy, mixed, mesic lithic inceptisols on slopes and oxyaquic inceptisols in saturated valley bottoms. Elevations in the watershed range from 77 to 108 m with slope gradients ranging from 0.16 to 24.5∘ (mean 6.3∘). Mean annual precipitation from 1981 to 2010 in this region was 1173.5 mm, with late spring and late summer as the wettest and driest periods, respectively, and mean annual temperature is 13 ∘C (Delaware State Climatologist Office Data Page, http://climate.udel.edu/).
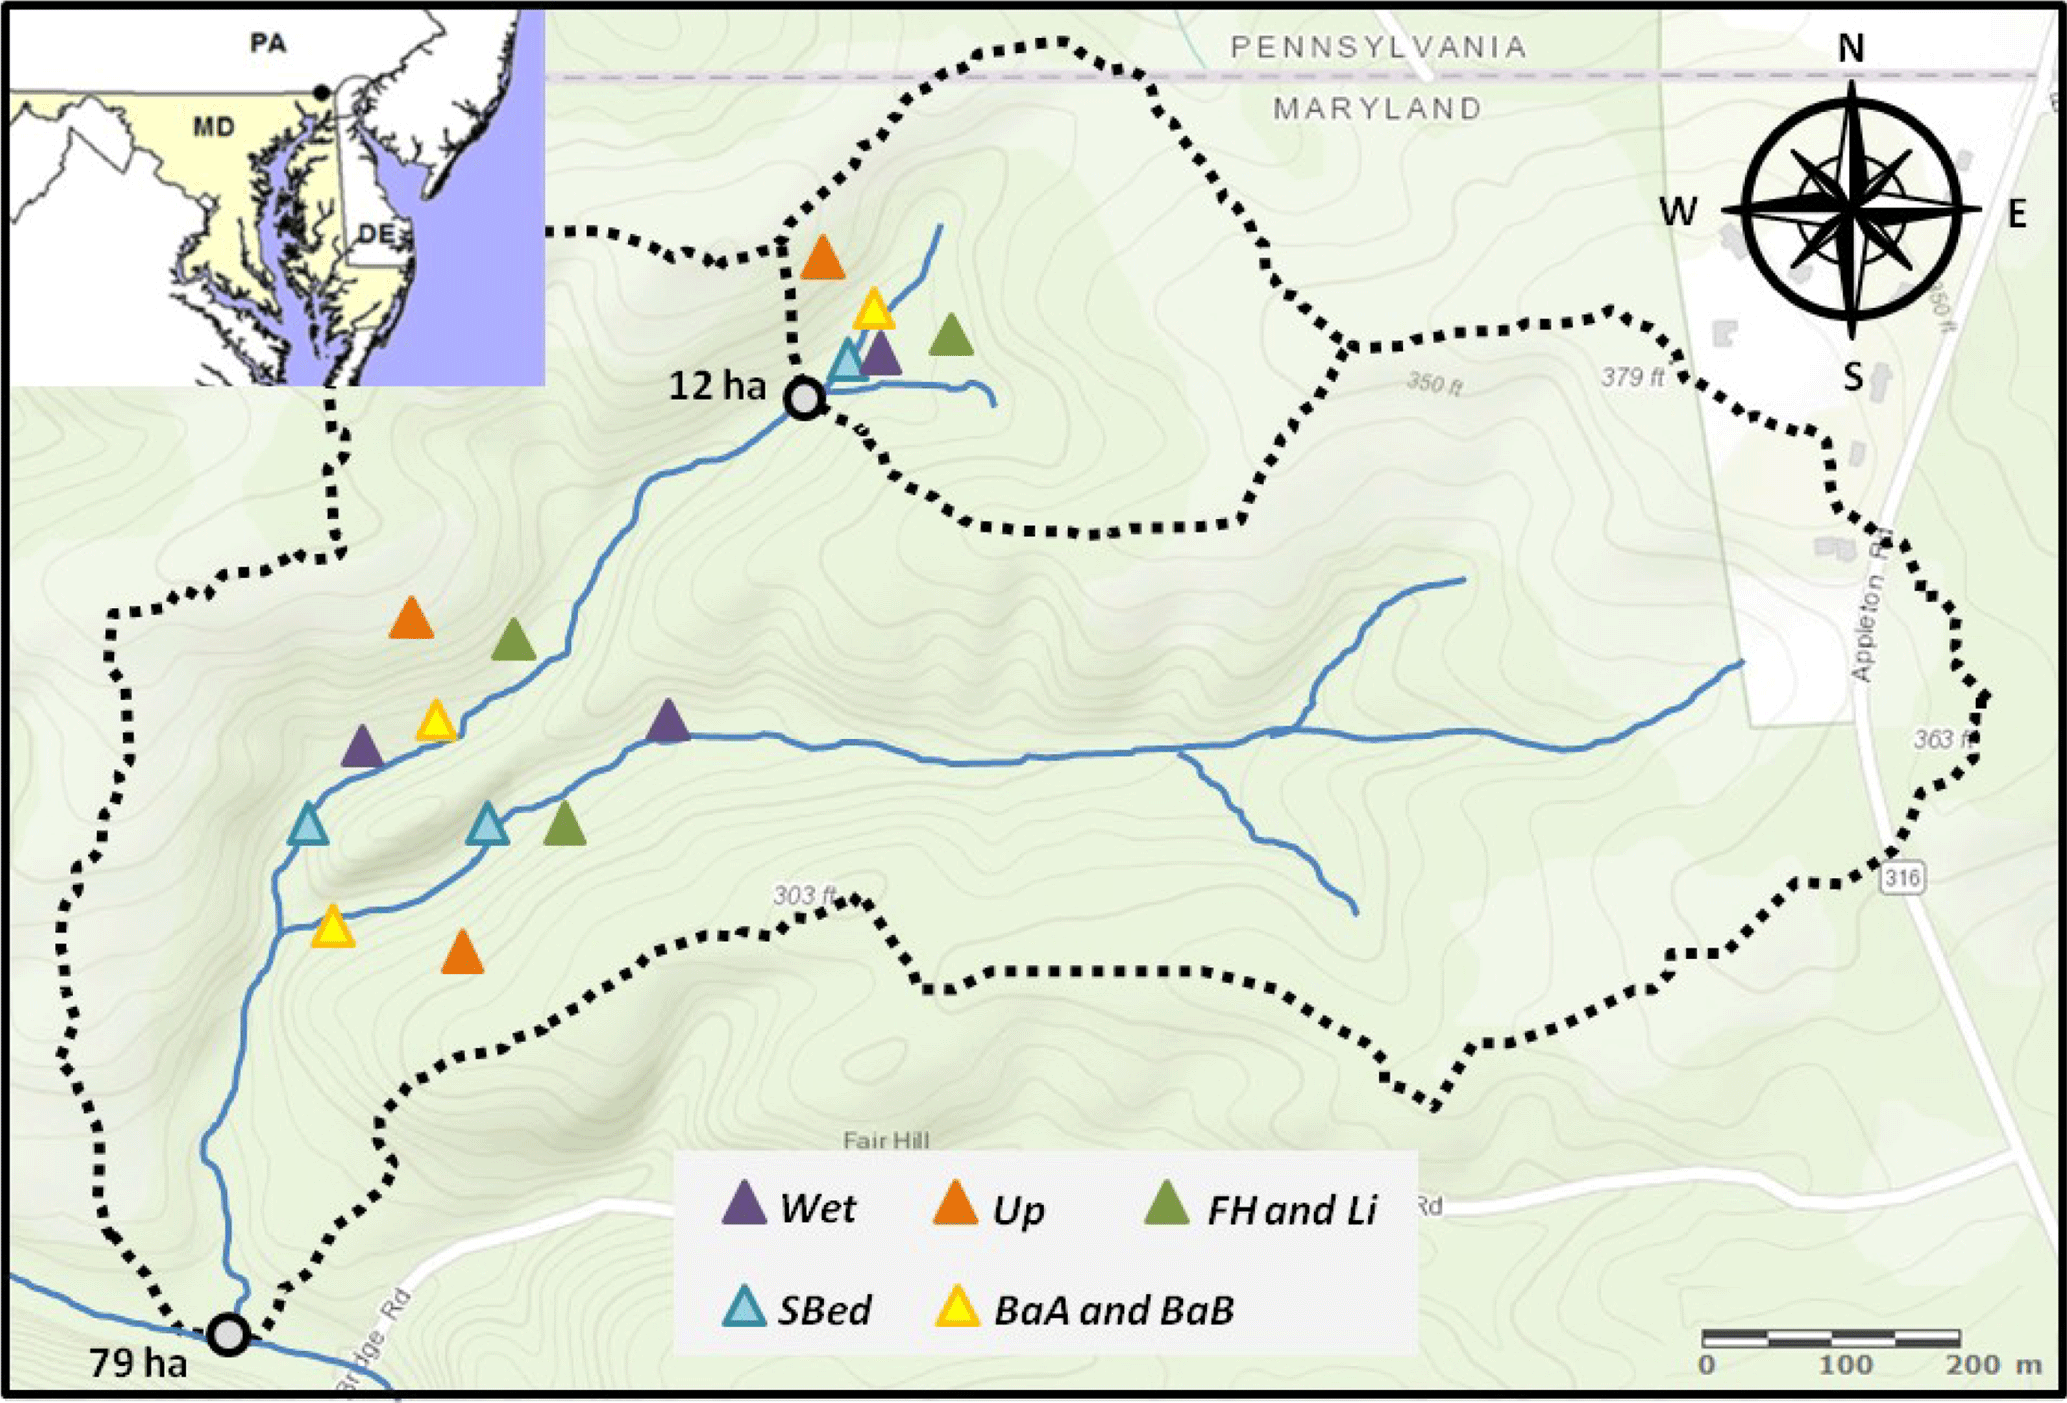
Figure 1Location of the study watershed in the Piedmont region of Maryland. Composite suspended sediments were sampled at the 12 and 79 ha locations (grey circles). The sites of collection of end-members are indicated with triangles: violet for wetland soils (Wet), blue for bed sediments (SBed), green for forest soil humus (FH) and litter (Li), orange for upland soils (Up), and yellow for bank sediments from horizons A and B (BaA and BaB).
2.2 Watershed monitoring and sampling strategy
Detailed information on monitoring and sampling is provided in Rowland et al. (2017). Climatological data were obtained from a local station maintained by the Delaware Environmental Observing System approximately 450 m from the 79 ha catchment outlet. These consist of temperature and GEONOR gage hourly rainfall measurements. Stream discharge estimates were obtained at 20 min intervals using a Parshall flume at 12 ha stream location (nested within the 79 ha watershed, Fig. 1) and a discharge rating curve calculated from paired pressure transducer and acoustic Doppler velocity meter measurements at a rectangular concrete culvert at the 79 ha location.
Suspended sediments were collected using in situ samplers made of 10 cm diameter capped PVC pipes placed vertically in the middle of the stream. The upstream face of the pipes was perforated with 1.5 cm diameter holes beginning ∼10 cm above the streambed. During periods of elevated discharge, stream stage rose above the perforations, trapping suspended sediment within the sampler. The trapped sediment thus represented a time-integrated composite sediment sample (CSS). Such a method induces modification of the velocity profile around the sampler, which could result in grain size fractionation. All CSSs were retrieved within 24 h of the end of an event and frozen prior to processing and analysis. In this study POM was defined by this sampler as the organic matter in the objects (natural debris, soil particles, colloids) that were trapped. The slots on the samplers were approximately 1.5 cm, which represents the higher threshold. The samples were dried before further analysis and then included the smallest fractions defined as colloidal OM and dissolved OM.
Seven potential sediment sources were identified within the catchment and have been sampled at three locations to integrate their spatial heterogeneity (Rowland et al., 2017). These included the streambed (SBed), exposed stream bank A (BaA) and B (BaB) horizons, valley-bottom wetland surficial soils (W), forest floor litter (Li) and humus (FH), and the upland A horizons (Up). Sampling was conducted during the summer of 2015. A total of 500–750 g of each end-member was sampled using an ethanol-cleaned trowel or auger from both of the main tributary branches of the watershed. Streambeds were sampled from areas without major backwatering or pooling, as POM may undergo diagenesis here, and were composited along a three point by three point grid within the channel. Bank sediments were collected from exposed incised banks with three points composited from the A and B horizons. Forest floor litter and humus, valley-bottom wetland soils and upland A horizons samples were composited from five points along 20 m transects in low-gradient locations in order to integrate their spatial heterogeneity.
End-member soil and sediment samples and CSSs were dried in acid-cleaned Pyrex dishes in an oven at 45 ∘C until visibly dry. Oven-dried CSSs were partitioned into coarse (CPOM) > 1000 µm, medium (MPOM) 1000–250 µm and fine (FPOM) <250 µm size classes via dry sieving. Dry masses were recorded for particle size classes from which the fractional mass percentage was calculated for each class in each CSS. End-member samples were presieved at 2 mm to remove large organic debris such as roots. Aliquots were lyophilized overnight and preserved in a desiccator cabinet until elemental, isotopic and molecular analyses. CSS and end-member samples were pulverized and homogenized using a ceramic mortar and pestle that was cleaned with ethanol between samples.
2.3 Analytical methodology
For elemental and isotopic analyses, please refer to Rowland et al. (2017). The thermochemiolysis using tetramethylammonium hydroxide (TMAH) coupled to gas chromatography and mass spectrometry was performed according to Jeanneau et al. (2014). Briefly we introduced approximately 5 mg of freeze-dried solid residue into an 80 µL aluminum reactor with an excess of solid TMAH (ca. 10 mg) and 10 µL of a solution of dihydrocinnamic acid d9 (CDN Isotopes, ref. D5666) diluted at 25 µg mL−1 in methanol as an internal standard. The THM reaction was performed on-line using a vertical micro-furnace pyrolyzer PZ-2020-D (Frontier Laboratories, Japan) operating at 400 ∘C. The products of this reaction were injected into a gas chromatograph (GC) GC-2010 (Shimadzu, Japan) equipped with a SLB 5MS capillary column in the split mode (60 m×0.25 mm ID, 0.25 µm film thickness). The temperature of the transfer line was 321 ∘C and the temperature of the injection port was 310 ∘C. The oven was programmed to maintain an initial temperature of 50 ∘C for 2 min, then rise to 150 ∘C at 15 ∘C min−1, and then rise to 310 ∘C at 3 ∘C min−1 where it stayed for 14 min. Helium was used as the carrier gas, with a flow rate of 1.0 mL min−1. Compounds were detected using a QP2010+ mass spectrometer (MS) (Shimadzu, Japan) operating in the full scan mode. The temperature of the transfer line was set at 280 ∘C, the ionization source at 200 ∘C, and molecules were ionized by electron impact using an energy of 70 eV. The list of analyzed compounds and m∕z (mass ∕ charge) ratios used for their integration are given in the Supplement (Table S1). Compounds were identified on the basis of their full-scan mass spectra by comparison with the NIST library and with published data (Nierop et al., 2005; Nierop and Verstraten, 2004). They were quantified assuming similar ionization and detection efficiencies between all compounds. This assumption means that the concentrations must be handled as rough estimations.
Target compounds were classified into four categories: low molecular weight organic acids, phenolic compounds including lignin and tannin markers, carbohydrates and fatty acids. The peak area of the selected m∕z for each compound was integrated and corrected by a mass spectra factor calculated as the reciprocal of the proportion of the fragment used for the integration and the entire fragmentogram provided by the NIST library (Table S1). The proportion of each compound class was calculated by dividing the sum of the areas of the compounds in this class by the sum of the peak areas of all analyzed compounds, expressed as a percentage. The analytical uncertainty for this analytical method, expressed as a relative SD ranging from 10 to 20 % depending on the samples and the target compounds. The use of THM-GC-MS to investigate the sources of POM meant that it was necessary to assume that matrix effects are equivalent for all analyzed compounds in all samples.
2.4 Statistical analyses and calculation of the proportions of the main sources of POM in CSSs
Statistical analyses were performed using XLSTAT (version 19.01, Addinsoft). First a principal component analysis was performed using the end-members as individuals and CSSs as additional individuals. The relative proportions of the 112 target compounds and the sum of their concentrations in nanograms per milligram (ng mg−1) of freeze-dried matrix were used as variables. The relative distribution of target compounds allows the direct comparison of the different samples without concentration effect, while using the sum of their concentrations takes into consideration the fact that the concentration of target compounds differed from one sample to another.
The first PCA allows the correlated variables to be identified on the basis of a modulus of a Pearson coefficient >0.9. When two variables were correlated, the least abundant was removed. Then a second PCA was performed. The variables with a correlation lower than 0.4 with the two first factors (F1: 29.8 %; F2: 17.2 % of variance) were removed, resulting in a new set of 71 variables. A third PCA was calculated and a hierarchical ascendant classification (HAC) was calculated using the coordinates of the individuals (end-members and CSSs) on the nine first factors that explained 90.5 % of the variance of the dataset. This HAC identified Upland soils and Stream bank sediments as minor contributors. Consequently a fourth PCA was calculated removing upland soils and Stream bank sediments from the potential end-members. Similarly to the three previous PCA, CSSs were considered as additional individuals. The coordinates of CSSs on the two first factors (of 10) of this PCA (F1: 40.1 %; F2: 24.0 % of variance) were used to calculate the proportion of the three main sources of POM in CSSs, identified as (1) streambed sediments, (2) litter and (3) forest floor humus + wetland soil, resolving a system of equations with three unknowns. To solve this system, the coordinates of end-members must be specified. The heterogeneity of the distribution of target compounds resulted in an area for each end-member. To calculate the proportions and uncertainties, the coordinates of end-members were randomly selected 10 times in the areas defined by the 95 % CI (confidence interval). When the calculation gave a negative contribution for an end-member, it was set at 0 and the two other contributions were recalculated to sum at 100. Finally the contributions of those three sources were approximated for the bulk POM by using the proportion and the OC content of each fraction. From the third PCA to the end of the procedure, this treatment was also performed, adding TOC (total organic carbon), δ13C and δ15N from Rowland et al. (2017) as variables.
In order to test the efficiency of the source apportionment calculated with the molecular data, the proportions of end-members and their isotopic values (Rowland et al., 2017) were used in an end-member mixing approach to model the δ13C of CSSs. Modeled values were compared to measured values reported by Rowland et al. (2017) by calculating the relative standard deviation (RSD) and against a linear regression model.
3.1 Rainfall and hydrology
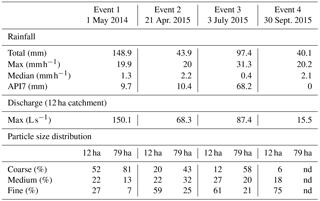
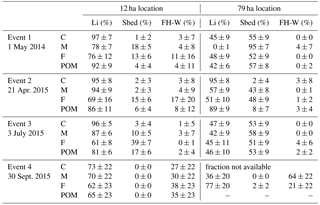
The molecular composition of POM in coarse, medium and fine size classes was investigated for four events. The rainfall and discharge characteristics recorded for those events are indicated in Table 1. The total rainfall ranged from 40.1 (E4) to 148.9 mm (E1), the maximum hourly rainfall (Imax) ranged from 19.9 (E1) to 31.3 mm h−1 (E3) and the median hourly rainfall (Imed) ranged from 0.4 (E3) to 2.2 mm h−1 (E2). The maximum discharge for those events ranged from 15.6 (E4) to 150.1 L s−1 (E1). Then the four events can be distinguished as follows. E1 was characterized by high rainfall, a low maximum intensity (Imax), an intermediate median intensity (Imed) and an intermediate antecedent precipitation index (API7). E2 was characterized by mean total rainfall, a mean Imax, a high Imed and a mean API7. E3 was characterized by high rainfall and Imax, low Imed and high API7. Finally E4 was characterized by low rainfall and Imax, a high Imed and a dry antecedent conditions (API7 =0 mm). E2 and E4 were comparable in terms of precipitation regime but can be differentiated by the API7, E4 occurring after 7 days without precipitation.
Table 1Rainfall characteristics, discharge and proportion of coarse, medium and fine fractions for the four investigated storm events.
3.2 Size distribution
CSSs were separated into coarse (> 1 mm), medium (> 250 µm) and fine (< 250 µm) fractions, with the exception of CSSs at the downstream (79 ha) location for the fourth event (Table 1). In the 12 ha sub-catchment, the coarse, medium and fine fractions represented 22±20, 22±4 and 55±21 % of particulate matter, respectively, while in the 79 ha catchment, they represented 61±19, 22±10 and 18±10 % of particulate matter, respectively. In the 12 ha sub-catchment, the RSD of those proportions was 90, 17 and 37 % for the coarse, medium and fine fractions, respectively, while in the 79 ha catchment it was 31, 45 and 55 %, respectively.
3.3 Molecular composition of end-members
The number of detected target compounds ranged from 49 (SBed#1) to 112 (FH). A Dixon test for extreme value identified the lowest value (SBed#1) as an outlier (p value =0.011). Once this value was removed, the number of detected target compounds ranged from 75 (BaB) to 112 (FH). The low value recorded for one of the SBeds could be due to a combination of low OC content with a low analytical efficiency. This sample was removed from the dataset.
The distribution of target compounds into chemical families gives the first overview of the molecular composition of OM in the different end-members (Fig. 2). In W, Li and FH, the main compounds are phenolic compounds and high molecular weight fatty acids (> C20, HMW) that represent more than 30 % of target compounds. In BaA and BaB, the proportion of phenolic compounds was lower (22±4 and 19±1 %, respectively; mean ± SD) than in W, Li and FH, and the proportion of low molecular weight (< C20, LMW) fatty acids was higher (27 ± 17 and 35 ± 9 %, respectively). In Up, compared to W, Li and FH, the proportion of HMW fatty acids increased (57±19 %), while the proportion of phenolic compounds decreased (13±8 %). In SBed, the main identified target compounds were LMW fatty acids (72±8 %), while phenolic compounds and HMW fatty acids represented 15±2 % and 9±4 %, respectively.
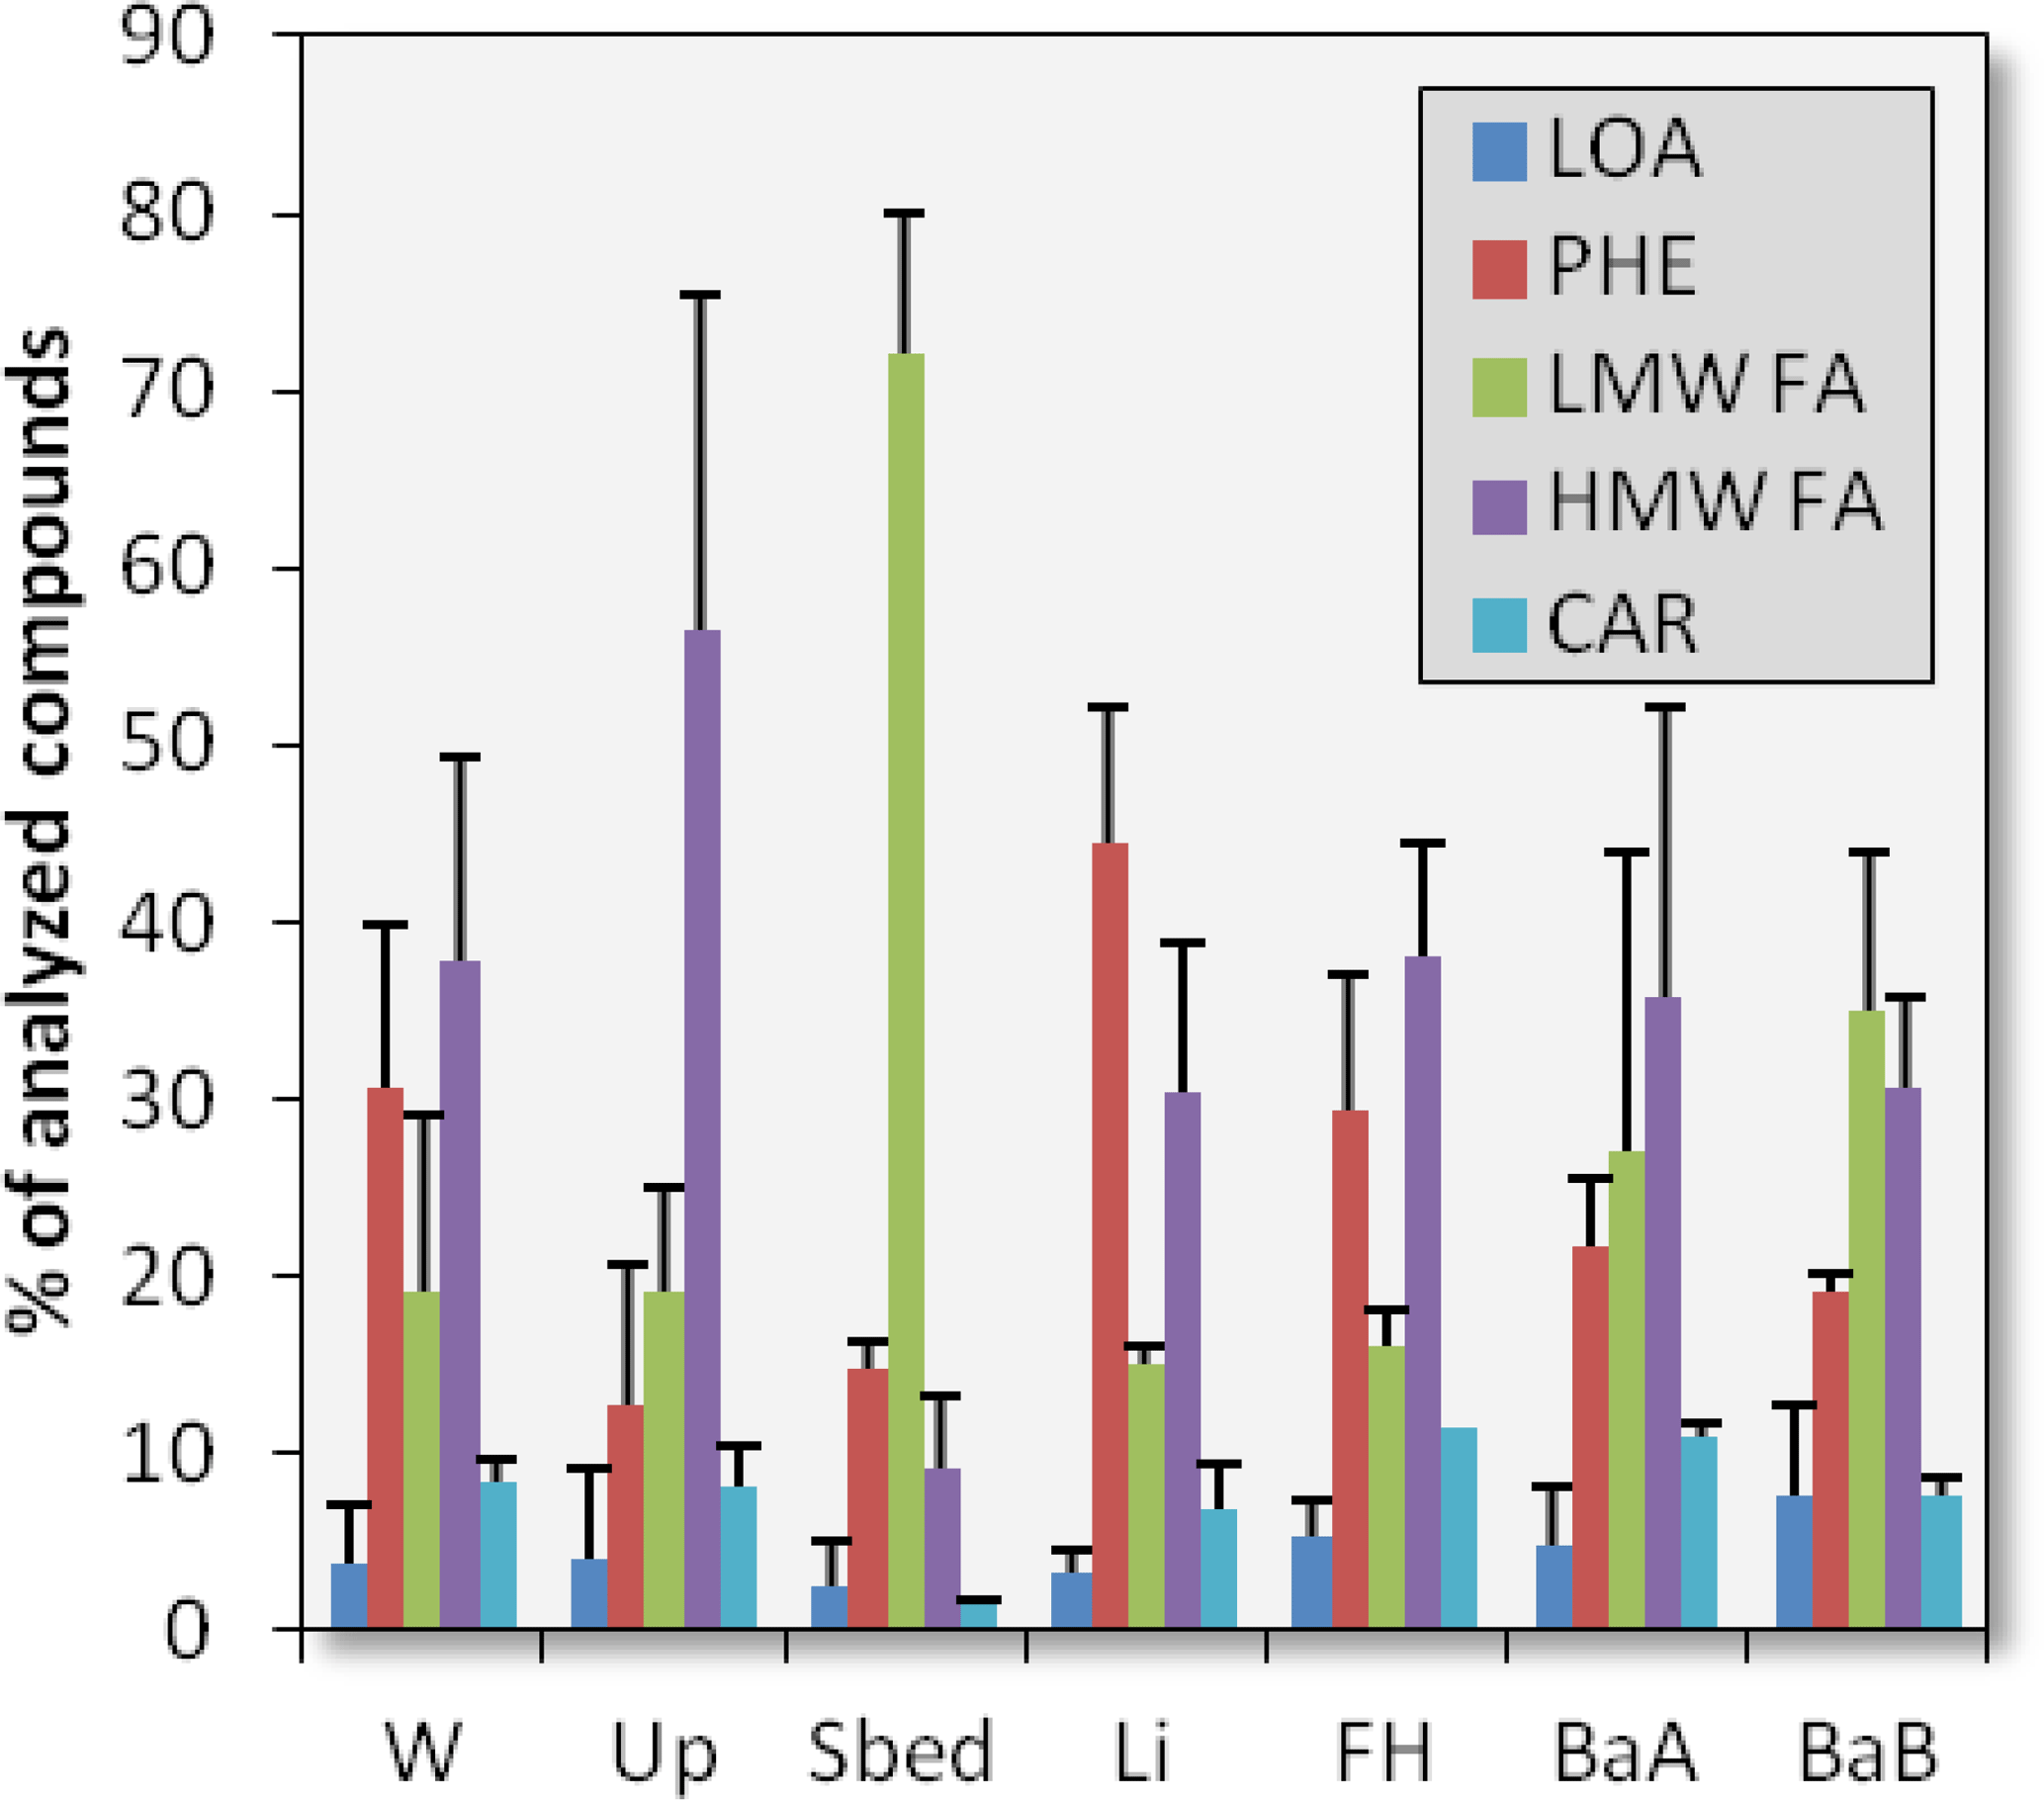
Figure 2Relative proportions of low organic acids (LOA), phenolic compounds (PHE), low molecular weight and high molecular weight fatty acids (LMW and HMW FA), and carbohydrates (CAR) among identified target compounds in the end-members. Uncertainties correspond to SD of sampling triplicates (duplicates for bed sediments SBed).
HMW fatty acids were composed of the following: linear n-alkanoic acids from n-C20 : 0 to n-C32 : 0 with an even-over-odd predominance characteristic of plant-derived inputs (Eglinton and Hamilton, 1967); linear ω-hydroxyacids and α,ω-diacids from n-C16 to n-C28, 10,16-dihydroxyC16 : 0; and 9,10,18-trihydroxyC18 : 0 characteristic of plant-derived aliphatic biopolymers cutin and suberin (Armas-Herrera et al., 2016; Kolattukudy, 2001). These two latter hydroxyacids were the main compounds among HMW fatty acids. The proportion of ω-hydroxyacids and α,ω-diacids among HMW fatty acids is higher in roots than in leaves and can be used to differentiate between suberin from roots and cutin from shoots (Mueller et al., 2012). This proportion decreased from soils (Up, FH and W) and bank sediments to litter and was minimal for SBed (17±8 %), highlighting that the proportion of cutin decreased from SBed and Li to bank sediments and soils.
Phenolic compounds included methoxy-benzene, methoxy-acetophenone, methoxy-benzaldehyde and methoxy-benzoic acids. These compounds derived from lignin and tannins and are characteristic of plant-derived OM. The main compounds were guaiacyl-like structures (3,4-dimethoxybenzaldehyde, 3,4-dimethoxybenzoic acid methyl ester, erythro and threo-1,2-dimethoxy-4-(1,2,3-trimethoxypropyl)benzene) and syringil-like structures (3,4,5-trimethoxybenzaldehyde and 3,4,5-trimethoxybenzoic acid methyl ester, which is typical of the THM-GC-MS of OM deriving from woody plants; Challinor, 1995). Benzoic acid was not classified in this chemical family since it was negatively (slope of the linear regression model: −0.20; −0.18; −0.17) and poorly correlated (Pearson coefficient, p value: 0.14, 0.002; 0.14, 0.002; 0.21, <0.001) with 3,4-dimethoxybenzoic acid methyl ester, 3,4,5-trimethoxybenzoic acid methyl ester and 3-(3,4-dimethoxyphenyl)prop-2-enoic acid methyl ester, respectively, that are the main representatives of the three types of lignin units analyzed by THM-GC-MS (Challinor, 1995). As a consequence, calculating the proportion of molecules coming from lignins and tannins was not considered.
LMW acids included n-alkanoic acids from n-C6 : 0 to n-C19 : 0; iso and anteiso C13 : 0, C15 : 0 and C17 : 0; iso C14 : 0 and C16 : 0; and n-alkenoic acids n-C16:1 and n-C18:1. The LMW fatty acids with less than 13 C atoms can derive from microbial or plant-derived inputs, while the LMW fatty acids with more than 13 C atoms are known as phospholipid fatty acids and are microbial biomarkers (Frostegård et al., 1993) with the exception of n-C16 : 0 and n-C18 : 0 that can derive from plant-derived inputs. The proportion of microbial markers among target compounds was calculated according to Jeanneau et al. (2014). It increased from litter and soils (<15 %) to bank sediments (18±12 % and 25±7 % in BaA and BaB, respectively) to SBed (48±15 %).
3.4 Molecular composition of stream suspended sediments
The distribution of target compounds into the five chemical families previously described changed with the catchment size, as illustrated in Fig. 3. At the 12 ha location, this distribution was fairly homogenous across the particle classes. When averaged across size fractions and events, the THM-GC-MS of the POM of CSSs sampled at the 12 ha location mainly produced phenolic compounds (48±6 %, mean ± SD) and HMW fatty acids (22±10 %). The relative standard deviation weighted by the proportion (RSDp) was 13, 14 and 22 % for C, M and F fractions, respectively, which highlights a low interevent variability of this distribution. At the 79 ha location, the distribution of target compounds was dominated by LMW fatty acids (41±20 %) and phenolic compounds (37±9 %). It was almost stable between the three size fractions with a higher proportion of LMW fatty acids in the M fraction. However, the RSDp was 50, 55 and 23 % for C, M and F fractions, respectively, which means a higher interevent variability than at the 12 ha location.
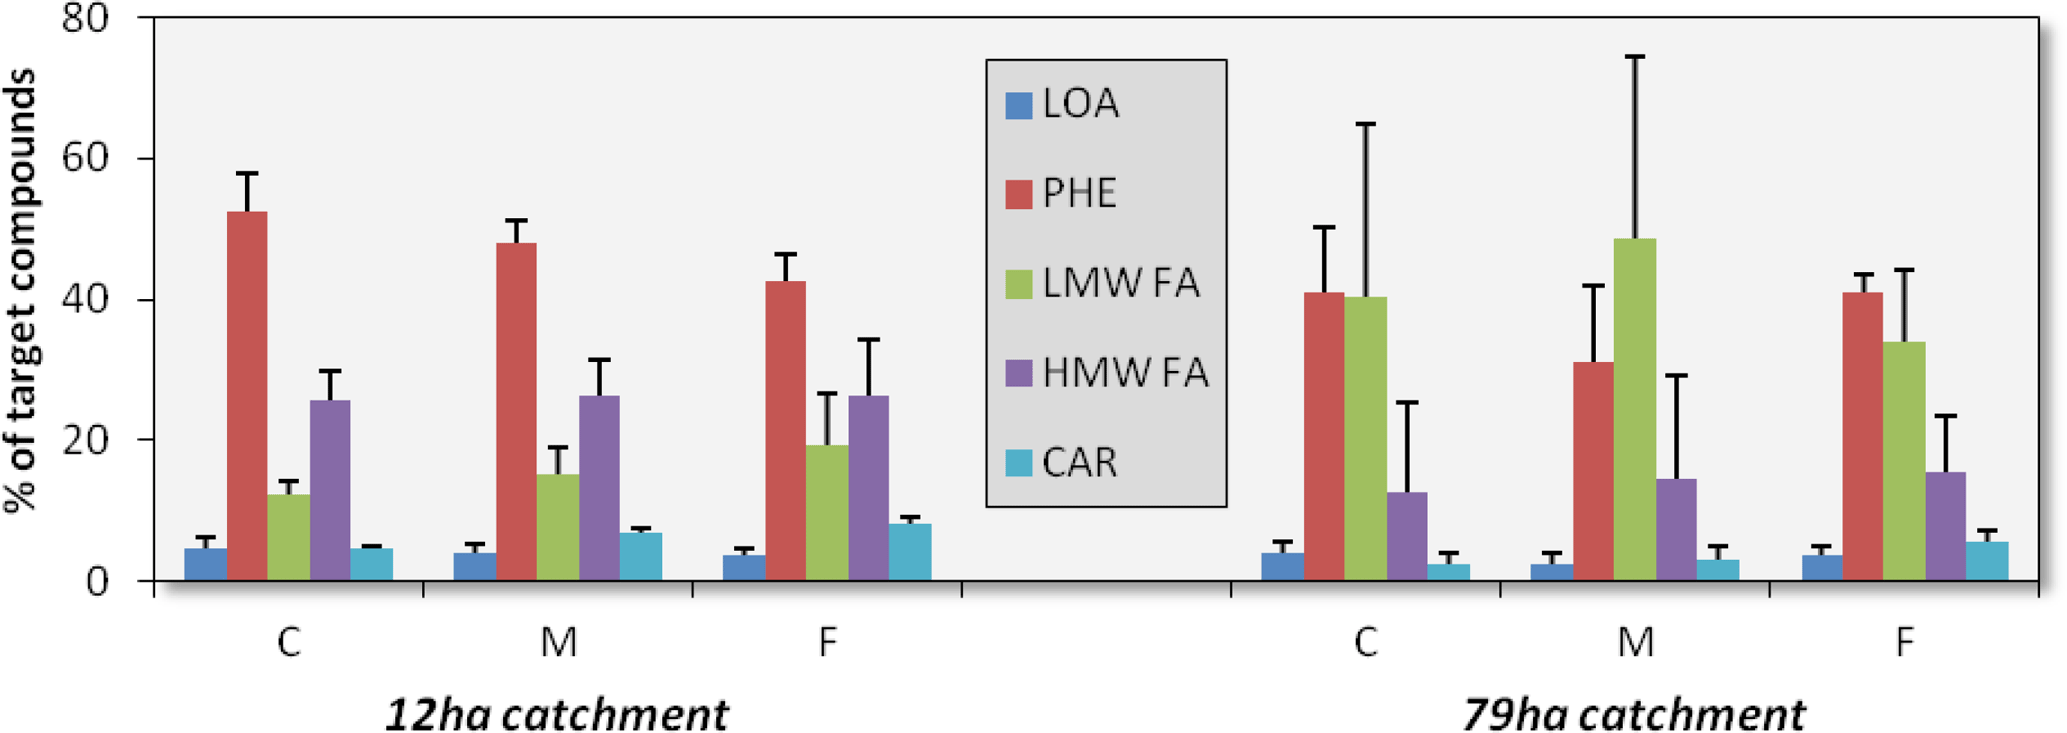
Figure 3Relative proportions of low organic acids (LOA), phenolic compounds (PHE), low molecular weight and high molecular weight fatty acids (LMW and HMW FA), and carbohydrates (CAR) among identified target compounds in the coarse, medium and fine fractions of CSS. Uncertainties correspond to the interevent SD.
3.5 End-members contributions
A HAC was performed using the coordinates of end-members and stream sediments (CSSs) on the nine first factors (90.5 % of variance) of the PCA, which were calculated with the relative proportions of target compounds and the sum of their concentrations as variables. Three classes were isolated. The first one included the three Li, one FH and one W as end-members, the size fractions of CSSs from the 12 ha location and three size fractions of CSS from the 79 ha location. The second group included two W, two FH, and the three BaA, BaB and U end-members. Finally the third group included the SBed end-members and the size fractions of CSS from the 79 ha location. Based on this HAC, Up, BaA and BaB were considered to be minor contributors to the POM exported from the 12 and 79 ha locations.
An additional PCA was then calculated using SBed, Li, FH and W as individuals; CSS as additional individuals; and the previously defined list of 71 variables. The two first factors of this PCA explained 64.1 % of the variance of this final dataset. The projection of end-members and CSS on the plan obtained with these two factors is illustrated in Fig. 4. This projection allows the following to be differentiated: (i) the three groups of end-members, Li, SBed, and a combination of FH and W, denoted by FH-W, and (ii) POM from the two sampling locations. Moreover, the size classes were also separated. From this 2-D projection, an area was defined for each end-member corresponding to the 95 % confidence interval. The results of the source apportionment calculated using this 2-D projection are listed in Table 2. Some CSSs plotted outside the triangle formed by end-members most probably because (1) the litter end-member did not capture the full compositional diversity of the catchment and (2) end-member composition was investigated on bulk samples.
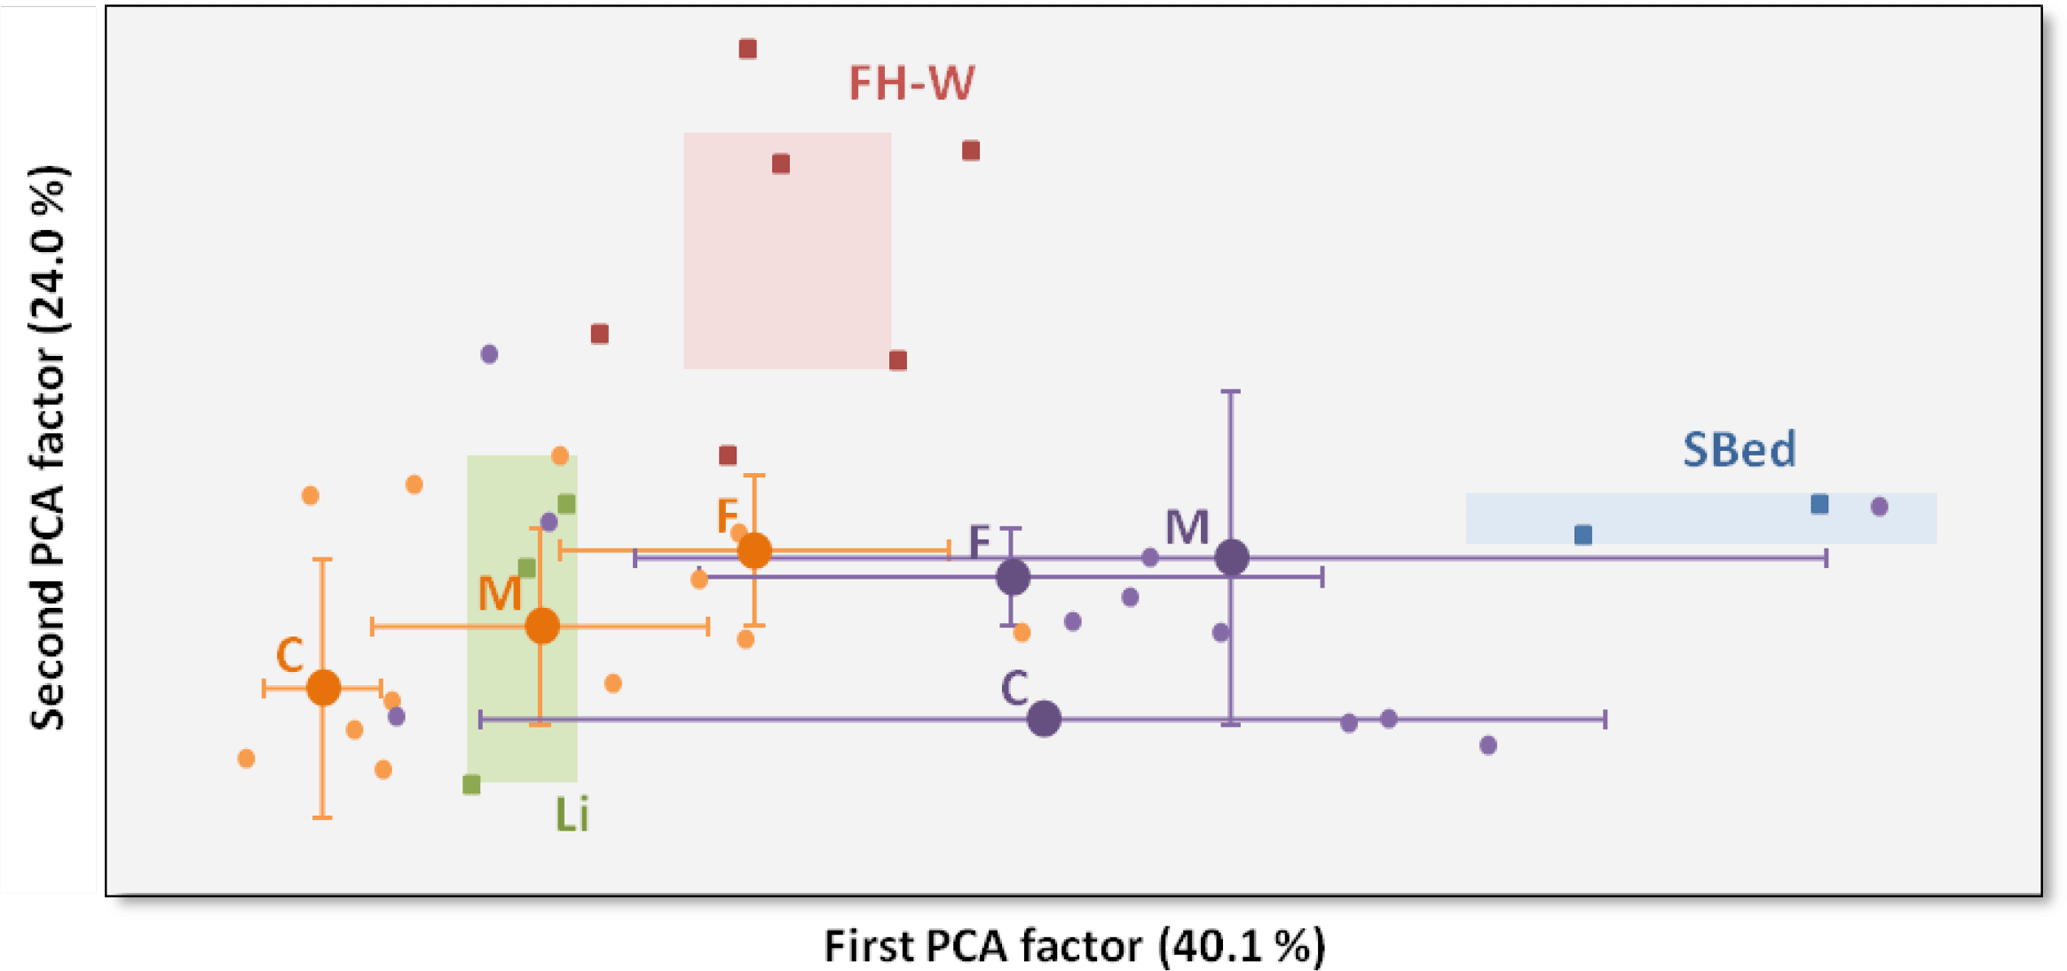
Figure 4Plan defined by the two first factors of the PCA calculated using the distribution of target compounds. Squares represent end-members Li (green), FH-W (red) and SBed (blue). The area characteristic of each end-member is defined by the 95 % confident interval. Circles represent CSS from the 12 ha (orange) and the 79 ha (purple) locations. The mean positions for each size fraction are represented by large circles and uncertainties correspond to interevent SD.
Table 2Source apportionment calculated using the molecular data.
At the 12 ha location, as an average of the four sampled events, from FPOM to CPOM, the proportion of OM coming from SBed decreased from 17±16 % (mean ± SD) to 1±1 %, the proportion of OM coming from FH-W decreased from 16±16 % to 8±12 % and the proportion of OM coming from Li increased from 67±7 to 90±11 %. The large uncertainties quantified by the mean RSD (78±53 %, mean ± SD, n=9) reflected the interstorm variability of this source apportionment. Bulk POM was mainly inherited from Li with contributions ranging from 65 to 92 %.
At the 79 ha location, as an average of the four sampled events, CPOM was mainly inherited from Li (63±28 %) and SBed (36±30 %). MPOM was mainly due to SBed inputs (49±39 %) and received a substantial contribution of FH-W (17±31 %). Similarly to CPOM, FPOM was mainly inherited from Li (55±15 %) and SBed (38±24 %). Similarly to the source apportionment at the 12 ha location, the large uncertainties (RSD %, n=9) were due to interstorm variability. Bulk POM was mainly inherited from Li with contributions ranging from 42 to 89 % and SBed with contributions ranging from 8 to 57 %.
4.1 What are the main sources of POM for the watershed?
The HAC identified four main end-members for the stream water POM: litter (Li), the surface horizon of forest soils (FH) and wetland soils (W), and streambed sediments (SBed). Li was the main source of POM identified along the catchment representing 80±14 and 49±24 % of the POM exported from the 12 and 79 ha catchments, respectively. These high proportions of Li-derived POM is in accordance with the results of Jung et al. (2015) where isotopic and n-alkane fingerprints of POM exported from a mountainous forested headwater catchment highlighted similarities with litter and surface soils. Moreover, the decrease in the proportion of Li-derived OM along the catchment fits well with the observation of Koiter et al. (2013), where the contribution of topsoil sources of suspended sediments decreased from 75 to 30 % when moving downstream.
Stream bank A and B horizons and the surface horizons of upland soils did not group with any CSS, which would mean that they were minor contributors for the investigated samples. This seems to be in contradiction with the documented impact of bank erosion on the mobilization of particulate organic matter (Adams et al., 2015; Nosrati et al., 2011; Tamooh et al., 2012). This apparent contradiction could be due to the catchment's size. Contrary to the previously cited investigations (Adams et al., 2015; Nosrati et al., 2011; Tamooh et al., 2012), this present study focused on a headwater catchment (0.79 km2). In these small catchments, POM mainly comes from the erosion of surrounding soils, as observed for monsoon floods in Laos (Gourdin et al., 2015; Huon et al., 2017) or from a combination of bedrock and surface erosion in an Alpine catchment with relative proportions controlled by the types of precipitation (Smith et al., 2013). However, in this catchment, the mobilization of stream banks has been shown to be effective in winter due to the freeze–thaw process (Inamdar et al., 2017). This present study analyzed four events sampled in spring and summer. The lower contribution of stream bank erosion could then be due to seasonal variability.
The relative proportion of phenolic compounds compared to HMW fatty acids plotted against the proportion of α,ω-diacids and ω-hydroxyacids with more than 20 C atoms among HMW fatty acids resulted in a visual differentiation of Li and SBed from wetland (W), forest humus (FH), river bank horizons A (BaA) and B (BaB), and from upland soil (Up) (Fig. 5). This observation highlights Li as the main origin of SBed plant-derived OM, which fits well with the high proportion of Li-derived POM in CSSs from both catchments. Moreover, from Li to SBed, (i) the ratio of coumaric and ferulic acids to vanillaldehyde, acetovanillone and vanillic acid, commonly denoted by C∕V, decreased from 0.79±0.26 to 0.20±0.07, signified that lignins were more biodegraded in SBed than in Li and (ii) the proportion of microbial markers among the target compounds increased from 12±5 to 48±15 %. Both of these observations highlight the recycling of terrestrial plant-derived OM in river sediments from a headwater catchment and are in accordance with the higher mineralization rate of soil organic carbon in river sediments (Wang et al., 2014).
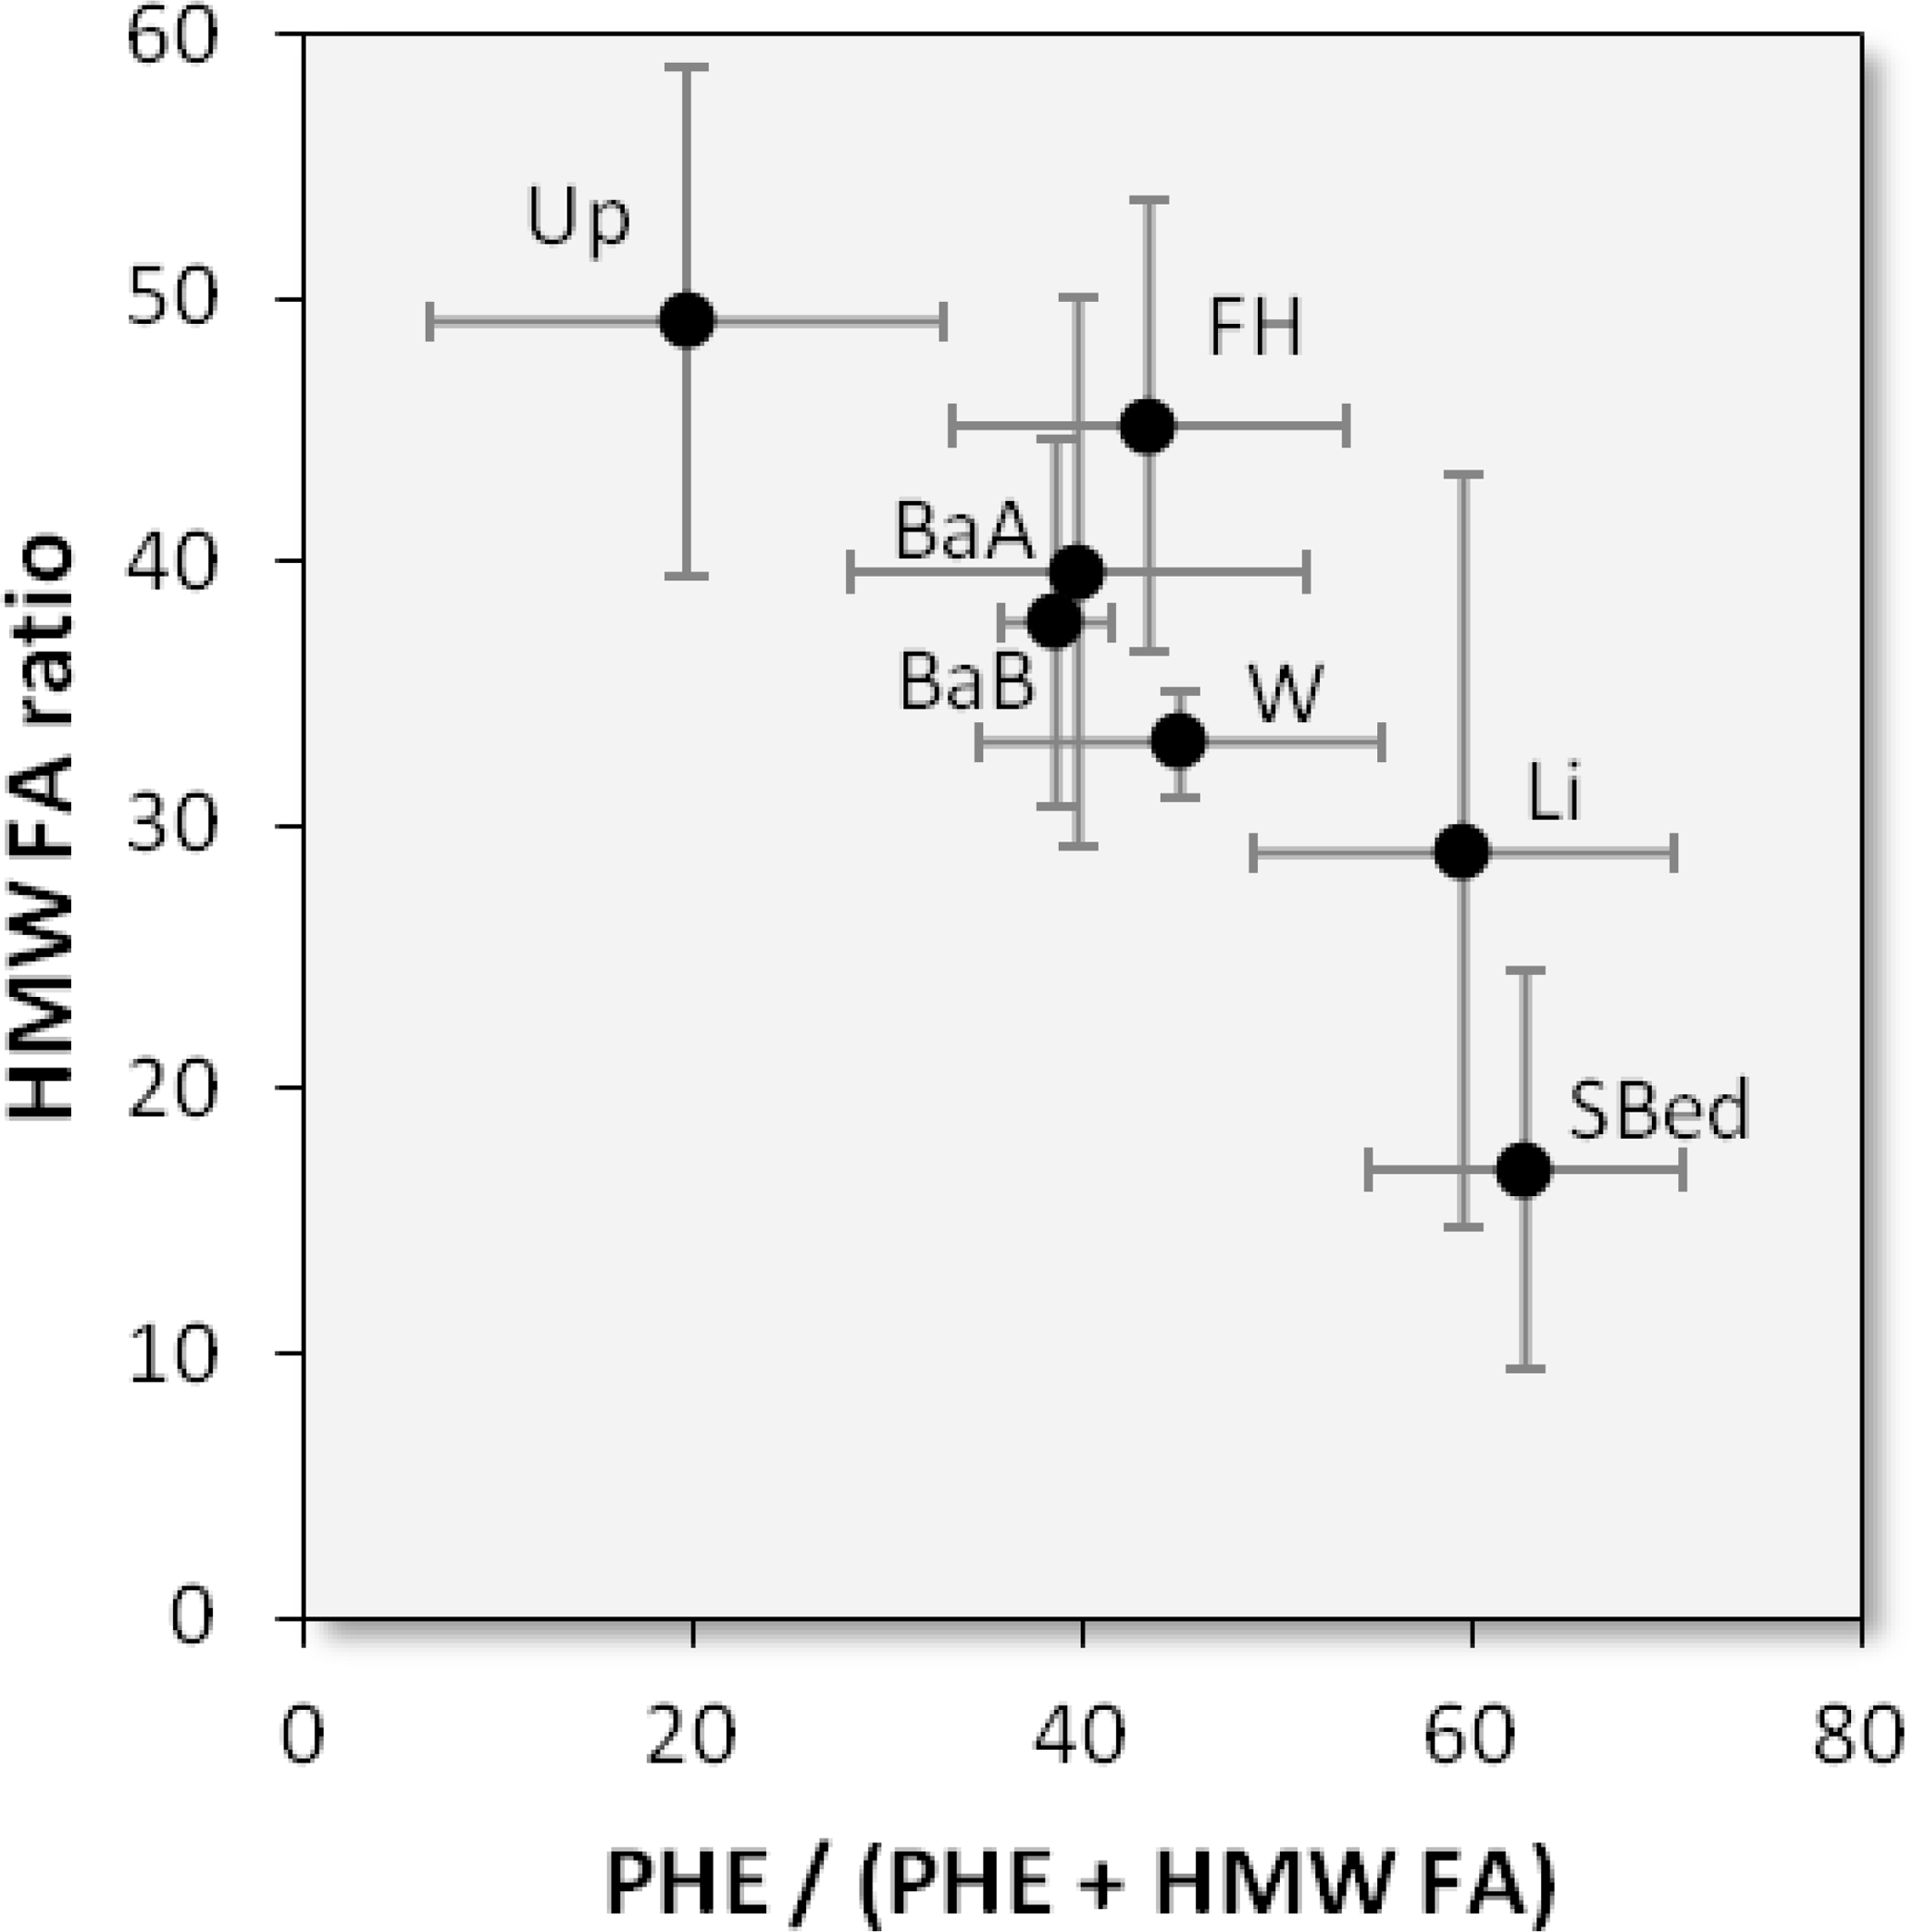
Figure 5Two-dimensional plot illustrating the variability of the distribution of plant-derived markers using the relative proportion of phenolic compounds (PHE) against HMW fatty acids and the proportion of α,ω diacids and ωOH fatty acids among HMW fatty acids (denoted HMW FA ratio).
4.2 Are molecular data in accordance with isotopic and elemental data?
A four-step analysis was performed to determine whether the molecular data produced by THM-GC-MS were in accordance with the isotopic results (Rowland et al., 2017) previously acquired on those samples.
The first step consists of a point-by-point comparison of the source apportionments resulting from the two approaches. Four main observations were reported by Rowland et al. (2017) using the isotopic approach. First, “the litter layer was a dominant contributor to CPOM, especially for the upstream locations”. This is in agreement with our data: the proportion of Li-derived CPOM was 90±11 % and 63±28 % for the 12 and the 79 ha catchments, respectively. Secondly, “the proportional contributions of SBed and banks to MPOM and FPOM increased downstream”. This is also in agreement with molecular data; however, stream banks were not considered to be a main contributor through the present statistical treatment. The proportion of SBed-derived POM increased from 8 ± 8 to 49 ± 39 % and from 17 ± 16 to 38 ± 24 % between the 12 ha and the 79 ha catchments in MPOM and FPOM, respectively. Thirdly, “no appreciable shift was observed in CPOM source”. This is partly in agreement with the molecular data. The main contributor to CPOM was Li in the two locations but the proportion of SBed-derived CPOM increased downstream. Finally, the highest contribution of forest floor humus was observed in MPOM and FPOM for E4. This is in agreement with the source apportionment in this study since the proportion of FH-W-derived POM was the highest for this event in CPOM, MPOM and FPOM from the 12 ha catchment and in MPOM and FPOM from the 79 ha catchment.
In a second step, the quality of the source apportionment calculated from the end-member mixing approach was investigated by modeling the δ13C of the samples using the isotopic fingerprint of end-members. These modeled values were compared to the measured values used in the isotopic fingerprinting approach (Rowland et al., 2017). The relative SD was 1.1±0.2 % (mean ± 95 % CI; n=20) and the linear regression resulted in a slope of 1.01 (R2=0.58; p value <0.0001; Fig. S1), highlighting a fairly good agreement between the model and the data, that is to say between the source apportionment using molecular data and measured δ13C.
In a third step, TOC, δ13C, δ15N and C∕N were added as variables in the PCA treatment. In the first PCA, W, FH, Li, SBed, BaA, BaB and Up were considered to be potential end-members. A HCA using the nine first PCA factors (90.4 % of the variance) highlighted BaA, BaB and Up as minor contributors, similarly to this step performed on molecular data alone. Then a second PCA was calculated with FH, W, Li and SBed as potential end-members and the CSS as additional individuals. The two first factors represented 64.4 % of the variance and resulted in a clear differentiation between Li, SBed and FH-W. The same approach was then applied using the molecular data alone, resulting in the calculation of the proportions of those three end-members in the CSS for 10 different combinations of the position of end-members in the 2-D plan created by the two first factors of the PCA. For each CSS a set of 10 values was created for Li-, SBed- and FH-W-derived POM (Table S2). Student's t test was used to compare these distributions between the modality “molecular data” and the modality “molecular + isotopic, elemental data”. A p value was calculated for each sample. They ranged from 0.08 to 0.49 (0.25±0.03; mean ± 95 % CI), highlighting that there were no significant differences between the two approaches (Table S3).
The final step aimed to investigate to what extent the molecular data are representative of bulk POM. The linear regression between the sum of the concentrations of target compounds (expressed in micrograms per gram, µg g−1, of dry solids) and the total organic content (expressed in percentage of dry solids) resulted in a correlation coefficient of 0.94 (p value <0.0001; Fig. S2). This correlation between bulk scale and molecular analyses has already been highlighted for sedimentary and dissolved OM (Jeanneau and Faure, 2010; Jeanneau et al., 2014) and emphasizes the suitability of molecular investigations to determine the sources of OM.
Once validated by this four-step comparison, what are the insights provided by the molecular approach on the source apportionment of CPOM, MPOM and FPOM along this Piedmont headwater catchment?
4.3 Modification of the source apportionment as a function of rainfall parameters
These present results may be valuable to investigate the relationships between the sources of exported POM and rainfall characteristics. However, they have been acquired on only four events, and so this part of the discussion should be enriched by future investigations.
Rainfall is the primary driver for C export since it controls soil erosion and stream discharge (Raymond and Oh, 2007). Rainfall amount and API7 have been shown to control the export of POC from headwater catchments (Dhillon and Inamdar, 2013, 2014; Jung et al., 2014). Moreover, Imax and Imed have also been identified as important drivers for soil erosion since they control the rainfall erosivity (Wischmeier, 1959). The four investigated events represented a range of rainfall amounts, maximal hourly intensity (Imax), median hourly intensity (Imed) and antecedent precipitation index (API7).
Linear regression were performed between the proportions of Li-, SBed- and FH-W-derived POM in CPOM, MPOM and FPOM from both catchments against rainfall amount, Imax, Imed and API7 (Table 1). With only four investigated events, only relationships characterized by Pearson coefficient higher than 0.8 were considered. No p values were calculated for those regressions since they would not have had any statistical value. With only four events the highlighted relationships must be handled with care and may be seen as guidelines for future works.
In the 12 ha catchment, SBed-derived OM was positively related to Imax and API7 and negatively related to Imed. The positive relationship with API7 was recorded in C and F fractions, while the positive relationship with Imax and the negative relationship with Imed were recorded only in the F fraction. In the M fraction, SBed-derived OM was related to the total rainfall. However, since this fraction represented 22±4 % (mean ± SD) of the exported particles, this relationship was not considered to be representative. In the 12 ha catchment the export of SBed-derived OM would be favored by rainfall characterized by high Imax occurring after a period of dryness (Fig. 6a). Moreover, the proportion of FH-W-derived OM was positively related to Imed in the F fraction. This fraction represented 55±21 % (mean ± SD) of the exported particles, giving some representativity to this observation. A deeper analysis of the relationship between Imed and the proportion of FH-W-derived OM in the different fractions from the 12 ha catchment highlights a concomitant control of API7 (Fig. 6b). For similar Imed (E2 vs. E4), the proportion of FH-W-derived OM increased in the three fractions with dry antecedent conditions. The activation of the soil reservoir seems to be controlled by both Imed and API7, which could be interpreted as (1) the necessity of a dry period to replenish a stock of soil OM available for soil erosion and (2) intensive and regular rainfall which could result in higher soil erosion.
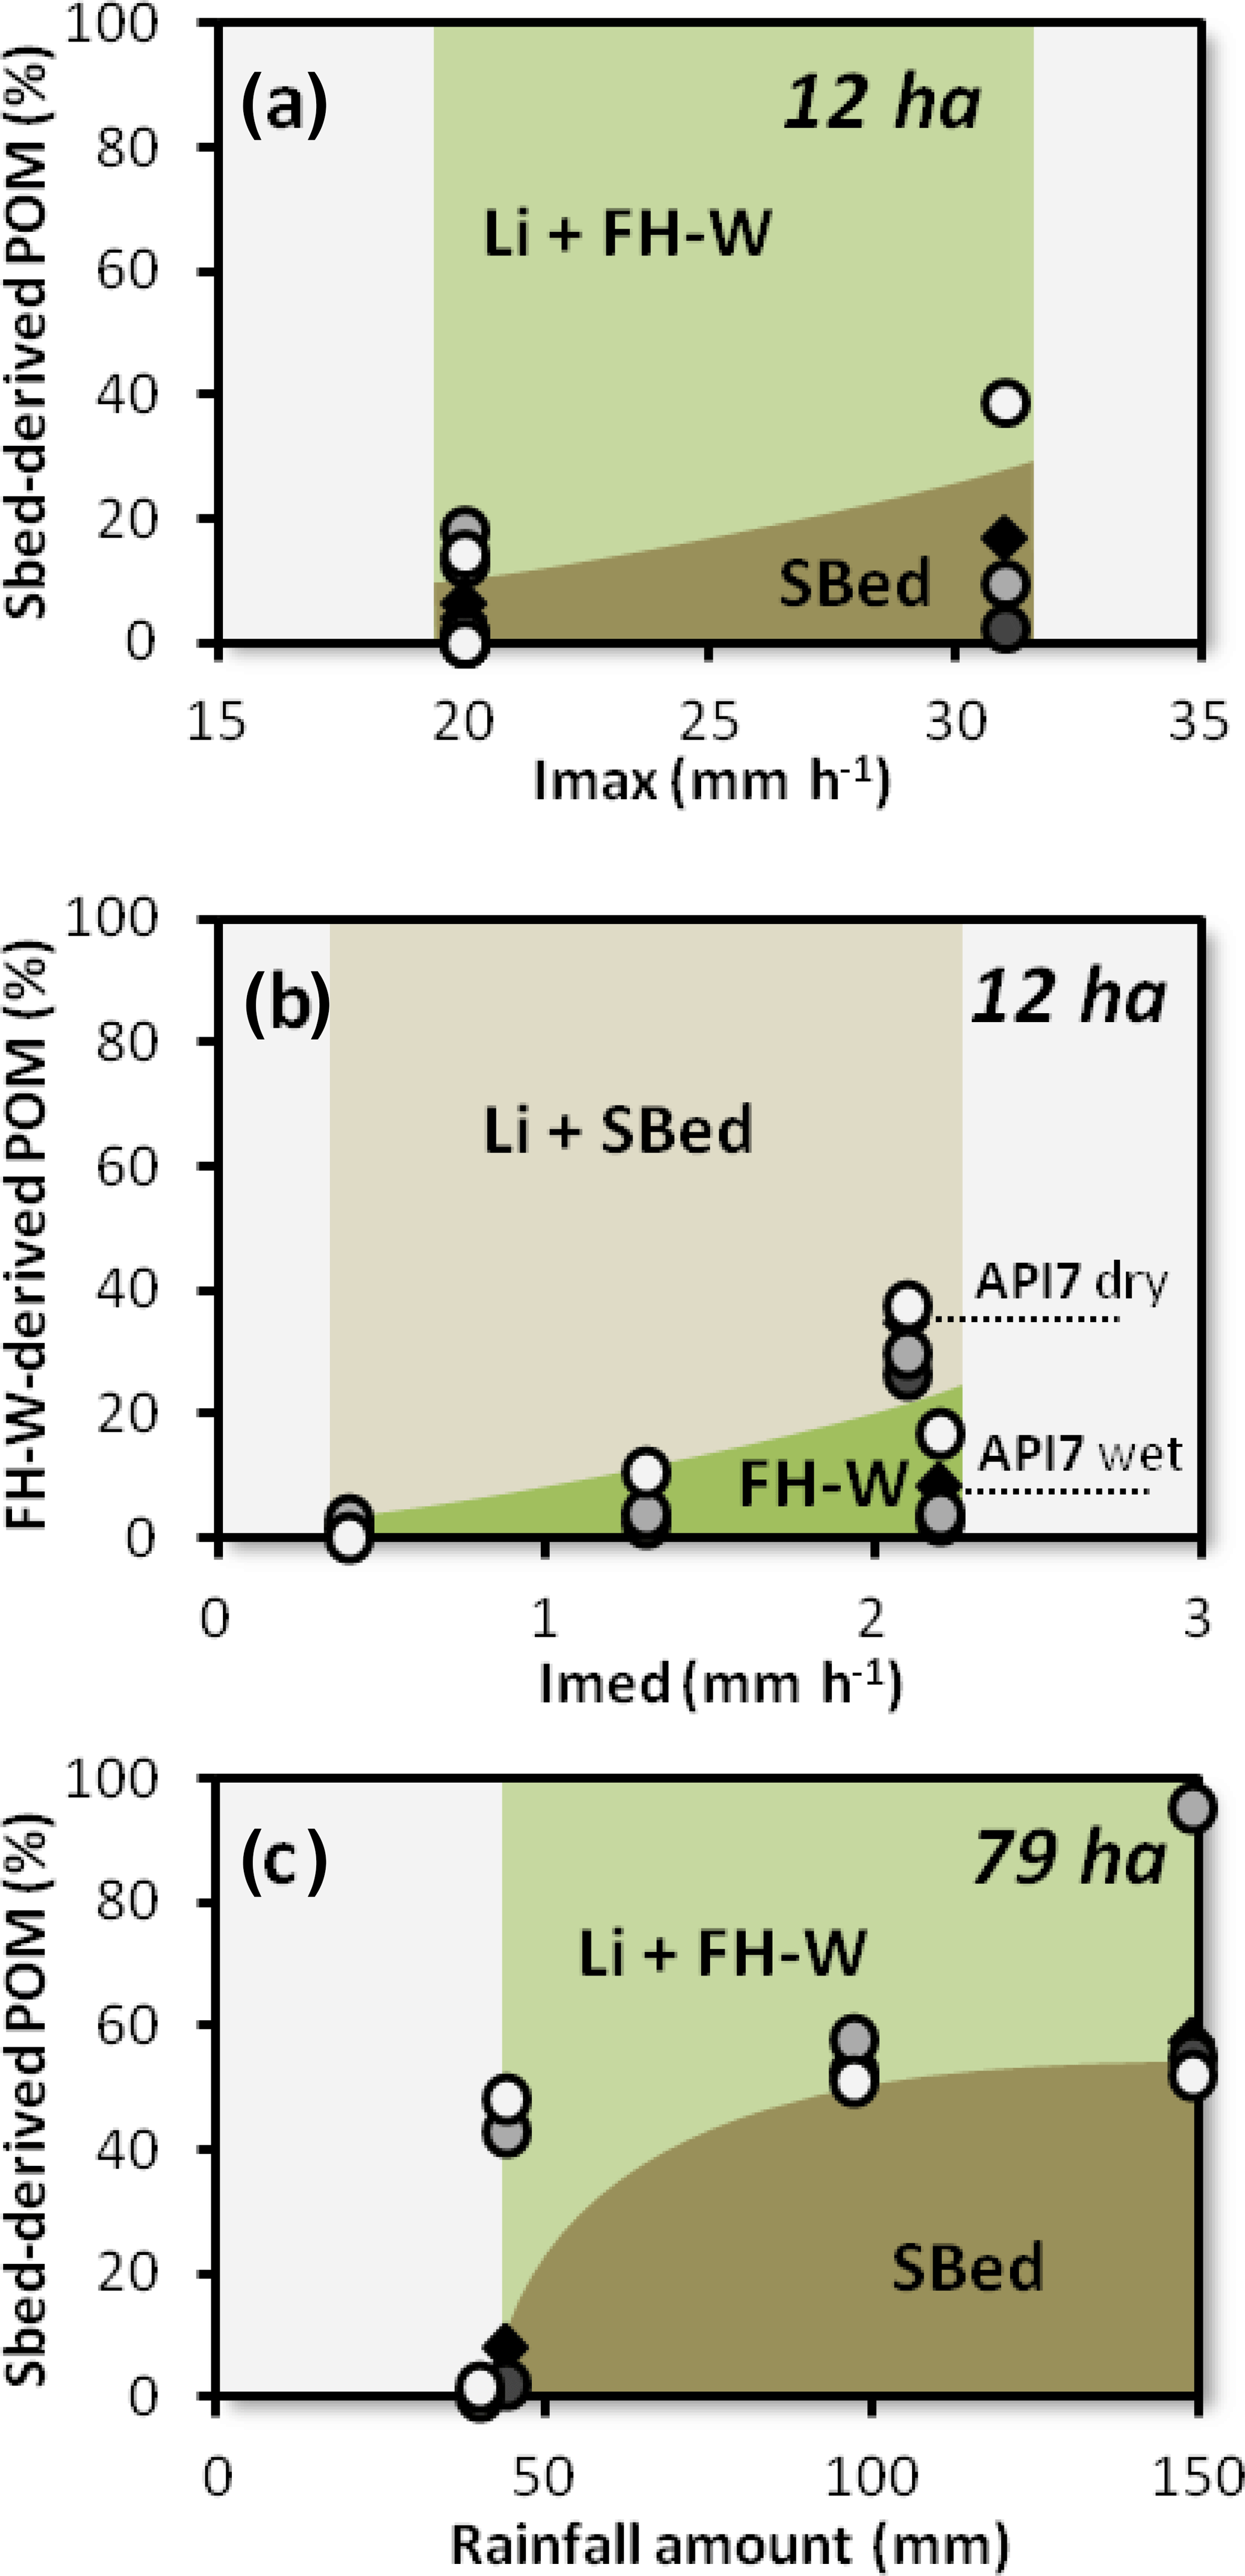
Figure 6Illustration of the most significant correlations between the source apportionments performed using the molecular data and rainfall characteristics. At the 12 ha location, positive correlations are shown (a) between the proportion of Sbed-derived POM and Imax and (b) between the proportion of FH-W-derived POM and Imed. At the 79 ha location, positive correlation is shown between Sbed-derived POM and rainfall amount (c). Coarse, medium and fine fractions are depicted by the dark grey, light grey and white circles, respectively, and the composite POM by the black diamond.
In the 79 ha catchment, the proportions of Li and FH-W were negatively related to the rainfall amount and the proportion of SBed was positively related to this variable. These relationships were recorded in the C and M fractions, with the exception of FH-W (only in the C fraction). A deeper analysis of the link between the POM source apportionment and the rainfall amount highlights different threshold values for C, M and F fractions (Fig. 6c). In M and F fractions, there was a sharp modification of the source of POM between E4 (40.1 mm) and E2 (43.9 mm). The proportion of FH-W-derived POM decreased from 64±20 to 0±1 % and from 21±22 to 1±2 %, in the M and F fractions, respectively. These decreases were concomitant with increases in the proportion of SBed-derived POM from 0±0 to 43±8 % and from 2±2 to 48±9 %, in the M and F fractions, respectively. The source apportionment of FPOM remained unchanged by further increases in the rainfall amount, while for MPOM the source apportionment was clearly modified during E1, which was characterized by the highest rainfall amount (148.9 mm). The proportion of Li-derived POM decreased to 0±1 % and the proportion of SBed-derived POM increased from 58±9 to 95±7 %. The source apportionment of CPOM drastically changed between E2 and E3 (97.4 mm). The proportion of Li-derived POM decreased from 95±8 to 47±9 % and the proportion of SBed-derived POM increased from 2±4 to 53±9 %. This source apportionment remained unchanged between E3 and E1. Since the C fraction was the most important during events 1, 2 and 3, its source apportionment was an important driver of the source of total POM. It was mainly modified between events 2 and 3 with a decrease in the proportion of Li-derived POM and an increase in the proportion of SBed-derived POM. From these observations, the threshold value of 75 mm previously found in this catchment, with an increase in the slope of the POC exported in kilograms per hectare (kg ha−1) as a function of the rainfall amount (Dhillon and Inamdar, 2013), falls in the range from 43.9 mm (E2) to 97.4 mm (E3), where the main modifications of the source of POM exported from the 79 ha catchment were observed. The increase in the proportion of SBed-derived POM accompanied by the increase in the proportion of the C fraction could be the result of the exceeding of a threshold value of the hydrodynamism for sediment remobilization.
4.4 Benefits and limitations of this molecular fingerprinting approach
The present molecular fingerprinting method has benefits and limitations. Among these benefits is the fact that, when the analysis is performed on-line (that is to say, when the products of the THM are directly sent to the GC), then the analysis needs low sample mass, on the order of 5 to 10 mg. Then this method is based on the molecular composition of OM, which is perfectly suitable to investigate the fate of POM. Moreover, it takes advantage of the differences of chemical composition between living organisms (microorganisms vs. plants) and in their different parts (leaves vs. roots). As a consequence the recorded modifications can be discussed in term of biogeochemistry of POM.
However, limitations must be considered. Seasonal variability of the molecular fingerprint could exist especially for quickly reactive reservoir such as litter (Williams et al., 2016). In soils, the turnover of OM takes time (>50 years; Frank et al., 2012). Consequently their molecular fingerprints may be less sensitive to seasonal variations, with the exception of agricultural soils subject to changes in vegetation cover. This limitation can be easily avoided by sampling the most reactive end-members at different seasons. The second and third limitations come from the method itself. First this is a time-consuming method because each compound must be determined with care in each sample. For an analysis, a duration of approximately 2 h is necessary. Finally, because it is not only a value given by an analytical tool, using it requires expertise in organic geochemistry.
When benefits and limitations are well considered, this molecular fingerprinting approach may be particularly suitable to investigate the sources of POM in combination with other fingerprinting approaches.
This study emphasizes the suitability of molecular analysis of POM using THM-GC-MS to investigate the sources of POM in headwater catchments. This analytical technique needs less than 5 mg of freeze-dried matter, which makes it realistic, in regard to the amount of suspended sediment exported, and simple, as it only requires freeze-drying as a preparatory step. With approximately hundreds of target compounds, the provided chemical fingerprint allows for the differentiation of the main sources of exported POM, specifically between litter, surface soils and in-channel sediments. The fairly good relationships obtained by comparison with the conclusions gained by the isotopic–elemental investigation provide additional evidence in favor of this organic fingerprinting approach. The present data highlight plant litter as the main source of exported POM, with an increasing contribution of streambed sediments downstream. This latter contribution seems to be controlled by the rainfall amount with a threshold phenomenon already observed for quantitative data. The contribution of soil erosion could be controlled by both the median intensity of rainfall and the amount of rain in the previous 7 days. The investigation of additional events in different catchments will be necessary to determine if those results are generic.
The raw data to this paper is freely available within the supplement.
The supplement related to this article is available online at: https://doi.org/10.5194/bg-15-973-2018-supplement.
The authors declare that they have no conflict of interest.
This study was funded by NSF ESPCoR grant no. IIA 1330238 (NEWRnet) and USDA
NIFA grant no. 2015-67020-23585. We would like to thank the Fair Hill
Natural Resources Management Area for allowing us to conduct this study in
the Fair Hill Nature Preserve. Many thanks to students who assisted with
sampling, including Erin Johnson, Catherine Winters, Chelsea Krieg, Shawn Del
Percio, Margaret Orr and Daniel Warner. The authors also thank the three
anonymous reviewers who participated in the improvement of the quality of this
paper.
Edited by: Tom J. Battin
Reviewed by: three anonymous referees
Adams, J. L., Tipping, E., Bryant, C. L., Helliwell, R. C., Toberman, H., and Quinton, J.: Aged riverine particulate organic carbon in four UK catchments, Sci. Total Environ., 536, 648–654, https://doi.org/10.1016/j.scitotenv.2015.06.141, 2015.
Armas-Herrera, C. M., Dignac, M.-F., Rumpel, C., Arbelo, C. D., and Chabbi, A.: Management effects on composition and dynamics of cutin and suberin in topsoil under agricultural use, Eur. J. Soil Sci., 67, 360–373, https://doi.org/10.1111/ejss.12328, 2016.
Challinor, J. M.: Characterisation of wood by pyrolysis derivatisation – gas chromatography/mass spectrometry, J. Anal. Appl. Pyrol., 35, 93–107, https://doi.org/10.1016/0165-2370(95)00903-R, 1995.
Collins, A. L. and Walling, D. E.: Selecting fingerprint properties for discriminating potential suspended sediment sources in river basins, J. Hydrol., 261, 218–244, https://doi.org/10.1016/S0022-1694(02)00011-2, 2002.
Derenne, S. and Quénéa, K.: Analytical pyrolysis as a tool to probe soil organic matter, J. Anal. Appl. Pyrol., 111, 108–120, https://doi.org/10.1016/j.jaap.2014.12.001, 2015.
Dhillon, G. S. and Inamdar, S.: Extreme storms and changes in particulate and dissolved organic carbon in runoff: Entering uncharted waters?, Geophys. Res. Lett., 40, 1322–1327, https://doi.org/10.1002/grl.50306, 2013.
Dhillon, G. S. and Inamdar, S.: Storm event patterns of particulate organic carbon (POC) for large storms and differences with dissolved organic carbon (DOC), Biogeochemistry, 118, 61–81, https://doi.org/10.1007/s10533-013-9905-6, 2014.
Eglinton, G. and Hamilton, R. J.: Leaf epicuticular waxes, Science, 156, 1322–1335, 1967.
Fox, J. F. and Papanicolaou, A. N.: Application of the spatial distribution of nitrogen stable isotopes for sediment tracing at the watershed scale, J. Hydrol., 358, 46–55, https://doi.org/10.1016/j.jhydrol.2008.05.032, 2008.
Frank, D. A., Pontes, A. W., and McFarlane, K. J.: Controls on soil organic carbon stocks and turnover among north american ecosystems, Ecosystems, 15, 604–615, https://doi.org/10.1007/s10021-012-9534-2, 2012.
Frostegård, Å., Tunlid, A., and Bååth, E.: Phospholipid fatty acid composition, biomass, and activity of microbial communities from two soil types experimentally exposed to different heavy metals, Appl. Environ. Microb., 59, 3605–3617, 1993.
Galy, V., Peucker-Ehrenbrink, B., and Eglinton, T.: Global carbon export from the terrestrial biosphere controlled by erosion, Nature, 521, 204–207, 2015.
Goñi, M. A., Hatten, J. A., Wheatcroft, R. A., and Borgeld, J. C.: Particulate organic matter export by two contrasting small mountainous rivers from the Pacific Northwest, USA, J. Geophys. Res.-Biogeo., 118, 112–134, https://doi.org/10.1002/jgrg.20024, 2013.
Gourdin, E., Huon, S., Evrard, O., Ribolzi, O., Bariac, T., Sengtaheuanghoung, O., and Ayrault, S.: Sources and export of particle-borne organic matter during a monsoon flood in a catchment of northern Laos, Biogeosciences, 12, 1073–1089, https://doi.org/10.5194/bg-12-1073-2015, 2015.
Huon, S., Evrard, O., Gourdin, E., Lefèvre, I., Bariac, T., Reyss, J.-L., Henry des Tureaux, T., Sengtaheuanghoung, O., Ayrault, S., and Ribolzi, O.: Suspended sediment source and propagation during monsoon events across nested sub-catchments with contrasted land uses in Laos, J. Hydrol. Reg. Stud., 9, 69–84, https://doi.org/10.1016/j.ejrh.2016.11.018, 2017.
Inamdar, S., Johnson, E., Rowland, R., Warner, D., Walter, R., and Merrits, D.: Freeze–thaw processes and intense rainfall: the one-two punch for high sediment and nutrient loads from mid-Atlantic watersheds, Biogeochemistry, https://doi.org/10.1007/s10533-017-0417-7, online first, 2017.
IPCC: Climate Change, The IPCC Third Assessment Report, Volumes I (Science), II (Impacts and Adaptation) and III (Mitigation Strategies), Cambridge Univ. Press, Cambridge, 2001.
Jeanneau, L. and Faure, P.: Quantification of fossil organic matter in contaminated sediments from an industrial watershed: Validation of the quantitative multimolecular approach by radiocarbon analysis, Sci. Total Environ., 408, 4251–4256, 2010
Jeanneau, L., Jaffrezic, A., Pierson-Wickmann, A.-C., Gruau, G., Lambert, T., and Petitjean, P.: Constraints on the sources and production mechanisms of dissolved organic matter in soils from molecular biomarkers, Vadose Zone J., 13, 1–1, https://doi.org/10.2136/vzj2014.02.0015, 2014.
Jeanneau, L., Denis, M., Pierson-Wickmann, A.-C., Gruau, G., Lambert, T., and Petitjean, P.: Sources of dissolved organic matter during storm and inter-storm conditions in a lowland headwater catchment: constraints from high-frequency molecular data, Biogeosciences, 12, 4333–4343, https://doi.org/10.5194/bg-12-4333-2015, 2015.
Jeong, J.-J., Bartsch, S., Fleckenstein, J. H., Matzner, E., Tenhunen, J. D., Lee, S. D., Park, S. K., and Park, J.-H.: Differential storm responses of dissolved and particulate organic carbon in a mountainous headwater stream, investigated by high-frequency, in situ optical measurements, J. Geophys. Res.-Biogeo., 117, G03013, https://doi.org/10.1029/2012JG001999, 2012.
Jung, B.-J., Lee, H.-J., Jeong, J.-J., Owen, J., Kim, B., Meusburger, K., Alewell, C., Gebauer, G., Shope, C., and Park, J.-H.: Storm pulses and varying sources of hydrologic carbon export from a mountainous watershed, J. Hydrol., 440, 90–101, https://doi.org/10.1016/j.jhydrol.2012.03.030, 2012.
Jung, B.-J., Lee, J.-K., Kim, H., and Park, J.-H.: Export, biodegradation, and disinfection byproduct formation of dissolved and particulate organic carbon in a forested headwater stream during extreme rainfall events, Biogeosciences, 11, 6119–6129, https://doi.org/10.5194/bg-11-6119-2014, 2014.
Jung, B.-J., Jeanneau, L., Alewell, C., Kim, B., and Park, J.-H.: Downstream alteration of the composition and biodegradability of particulate organic carbon in a mountainous, mixed land-use watershed, Biogeochemistry, 122, 79–99, https://doi.org/10.1007/s10533-014-0032-9, 2015.
Koiter, A. J., Lobb, D. A., Owens, P. N., Petticrew, E. L., Tiessen, K. H. D., and Li, S.: Investigating the role of connectivity and scale in assessing the sources of sediment in an agricultural watershed in the Canadian prairies using sediment source fingerprinting, J. Soil Sediment., 13, 1676–1691, https://doi.org/10.1007/s11368-013-0762-7, 2013.
Kolattukudy, P.: Polyesters in higher plants, in: Biopolyesters, vol. 71, edited by: Babel, W. and Steinbüchel, A., Springer, Berlin Heidelberg, 1–49, https://doi.org/10.1007/3-540-40021-4_1, 2001.
Lee, C. S., Sung, T. M., Kim, H. S., and Jeon, C. H.: Classification of forensic soil evidences by application of THM-PyGC/MS and multivariate analysis, J. Anal. Appl. Pyrol., 96, 33–42, https://doi.org/10.1016/j.jaap.2012.02.017, 2012.
Ludwig, W., Probst, J.-L., and Kempe, S.: Predicting the oceanic input of organic carbon by continental erosion, Global Biogeochem. Cy., 10, 23–41, https://doi.org/10.1029/95GB02925, 1996.
Mannino, A. and Harvey, H. R.: Terrigenous dissolved organic matter along an estuarine gradient and its flux to the coastal ocean, Org. Geochem., 31, 1611–1625, https://doi.org/10.1016/S0146-6380(00)00099-1, 2000.
Mueller, K. E., Polissar, P. J., Oleksyn, J., and Freeman, K. H.: Differentiating temperate tree species and their organs using lipid biomarkers in leaves, roots and soil, Org. Geochem., 52, 130–141, https://doi.org/10.1016/j.orggeochem.2012.08.014, 2012.
Nierop, K. G. J. and Verstraten, J. M.: Rapid molecular assessment of the bioturbation extent in sandy soil horizons under pine using ester-bound lipids by on-line thermally assisted hydrolysis and methylation-gas chromatography/mass spectrometry, Rapid Commun. Mass Sp., 18, 1081–1088, https://doi.org/10.1002/rcm.1449, 2004.
Nierop, K. G. J., Preston, C. M., and Kaal, J.: Thermally assisted hydrolysis and methylation of purified tannins from plants, Anal. Chem., 77, 5604–5614, https://doi.org/10.1021/ac050564r, 2005.
Nosrati, K., Govers, G., Ahmadi, H., Sharifi, F., Amoozegar, M. A., Merckx, R., and VanMaerke, M.: An exploratory study on the use of enzyme activities as sediment tracers: biochemical fingerprints?, Int. J. Sediment. Res., 26, 136–151, https://doi.org/10.1016/S1001-6279(11)60082-6, 2011.
Oeurng, C., Sauvage, S., Coynel, A., Maneux, E., Etcheber, H., and Sánchez-Pérez, J.-M.: Fluvial transport of suspended sediment and organic carbon during flood events in a large agricultural catchment in southwest France, Hydrol. Process., 25, 2365–2378, https://doi.org/10.1002/hyp.7999, 2011.
Raymond, P. A. and Oh, N.-H.: An empirical study of climatic controls on riverine C export from three major US watersheds, Global Biogeochem. Cy., 21, GB2022, https://doi.org/10.1029/2006GB002783, 2007.
Ritchie, J. C., Spraberry, J. A., and McHenry, J. R.: Estimating soil erosion from the redistribution of fallout 137Cs, Soil Sci. Soc. Am. J., 38, 137–139, https://doi.org/10.2136/sssaj1974.03615995003800010042x, 1974.
Rowland, R., Inamdar, S., and Parr, T.: Evolution of particulate organic matter (POM) along a headwater drainage: role of sources, particle size class, and storm magnitude, Biogeochemistry, 133, 181–200, https://doi.org/10.1007/s10533-017-0325-x, 2017.
Smith, J. C., Galy, A., Hovius, N., Tye, A. M., Turowski, J. M., and Schleppi, P.: Runoff-driven export of particulate organic carbon from soil in temperate forested uplands, Earth Planet. Sc. Lett., 365, 198–208, https://doi.org/10.1016/j.epsl.2013.01.027, 2013.
Tamooh, F., Van den Meersche, K., Meysman, F., Marwick, T. R., Borges, A. V., Merckx, R., Dehairs, F., Schmidt, S., Nyunja, J., and Bouillon, S.: Distribution and origin of suspended matter and organic carbon pools in the Tana River Basin, Kenya, Biogeosciences, 9, 2905–2920, https://doi.org/10.5194/bg-9-2905-2012, 2012.
Tank, J. L., Rosi-Marshall, E. J., Griffiths, N. A., Entrekin, S. A., and Stephen, M. L.: A review of allochthonous organic matter dynamics and metabolism in streams, J. N. Am. Benthol. Soc., 29, 118–146, https://doi.org/10.1899/08-170.1, 2010.
Wallbrink, P. J. and Murray, A. S.: Distribution and variability of 7Be in soils under different surface cover conditions and its potential for describing soil redistribution processes, Water Resour. Res., 32, 467–476, https://doi.org/10.1029/95WR02973, 1996.
Walling, D. E.: Use of 137Cs and other fallout radionuclides in soil erosion investigations: progress, problems and prospects, Joint FAO/IAEA Division of Nuclear Techniques in Food and Agriculture, International Atomic Energy Agency (IAEA), Vienna (Austria), available at: http://www.iaea.org/inis/collection/NCLCollectionStore/_Public/29/049/29049354.pdf, 1998.
Walling, D. E.: The evolution of sediment source fingerprinting investigations in fluvial systems, J. Soil Sediment., 13, 1658–1675, https://doi.org/10.1007/s11368-013-0767-2, 2013.
Wang, X., Cammeraat, E. L. H., Romeijn, P., and Kalbitz, K.: Soil organic carbon redistribution by water erosion – the role of CO2 emissions for the carbon budget, Plos One, 9, e96299, https://doi.org/10.1371/journal.pone.0096299, 2014.
Williams, J. S., Dungait, J. A. J., Bol, R., and Abbott, G. D.: Contrasting temperature responses of dissolved organic carbon and phenols leached from soils, Plant Soil, 399, 13–27, https://doi.org/10.1007/s11104-015-2678-z, 2016.
Wischmeier, W. H.: A rainfall erosion index for a universal soil-loss equation1, Soil Sci. Soc. Am. J., 23, 246–249, https://doi.org/10.2136/sssaj1959.03615995002300030027x, 1959.