the Creative Commons Attribution 4.0 License.
the Creative Commons Attribution 4.0 License.
 | 25 Mar 2019
Unifying soil organic matter formation and persistence frameworks: the MEMS model
Andy D. Robertson
Keith Paustian
Stephen Ogle
Matthew D. Wallenstein
Emanuele Lugato
M. Francesca Cotrufo
Soil organic matter (SOM) dynamics in ecosystem-scale biogeochemical models have traditionally been simulated as immeasurable fluxes between conceptually defined pools. This greatly limits how empirical data can be used to improve model performance and reduce the uncertainty associated with their predictions of carbon (C) cycling. Recent advances in our understanding of the biogeochemical processes that govern SOM formation and persistence demand a new mathematical model with a structure built around key mechanisms and biogeochemically relevant pools. Here, we present one approach that aims to address this need. Our new model (MEMS v1.0) is developed from the Microbial Efficiency-Matrix Stabilization framework, which emphasizes the importance of linking the chemistry of organic matter inputs with efficiency of microbial processing and ultimately with the soil mineral matrix, when studying SOM formation and stabilization. Building on this framework, MEMS v1.0 is also capable of simulating the concept of C saturation and represents decomposition processes and mechanisms of physico-chemical stabilization to define SOM formation into four primary fractions. After describing the model in detail, we optimize four key parameters identified through a variance-based sensitivity analysis. Optimization employed soil fractionation data from 154 sites with diverse environmental conditions, directly equating mineral-associated organic matter and particulate organic matter fractions with corresponding model pools. Finally, model performance was evaluated using total topsoil (0–20 cm) C data from 8192 forest and grassland sites across Europe. Despite the relative simplicity of the model, it was able to accurately capture general trends in soil C stocks across extensive gradients of temperature, precipitation, annual C inputs and soil texture. The novel approach that MEMS v1.0 takes to simulate SOM dynamics has the potential to improve our forecasts of how soils respond to management and environmental perturbation. Ensuring these forecasts are accurate is key to effectively informing policy that can address the sustainability of ecosystem services and help mitigate climate change.
- Article
(3998 KB) - Full-text XML
-
Supplement
(5849 KB) - BibTeX
- EndNote


The biogeochemical processes that govern soil organic matter (SOM) formation and persistence impact more than half of the terrestrial carbon (C) cycle and thus play a key role in climate–C feedbacks (Jones and Falloon, 2009; Arora et al., 2013). In order to predict changes to the C cycle, it is imperative that mathematical models describe these processes accurately. However, most ecosystem-scale biogeochemical models represent SOM dynamics with first-order transfers between conceptual pools defined by turnover time, limiting their capacity to incorporate recent advances in scientific understanding of SOM dynamics (Campbell and Paustian, 2015). Due to the use of conceptual pools, empirical data from SOM fractionation cannot be used directly to constrain parameter values that govern fluxes between pools because diverse SOM compounds can have similar turnover times but are differentially influenced by environmental variables (Schmidt et al., 2011; Lehmann and Kleber, 2015). As a result, empirical data are commonly abstracted and transformed before being used to parameterize or evaluate the processes of SOM formation and persistence that the model is intended to simulate (Elliott et al., 1996; Zimmermann et al., 2007). This has resulted in many conventional SOM models (e.g. RothC, Jenkinson and Rayner, 1977, DNDC, Li et al., 1992, EPIC, Williams et al., 1984, and CENTURY, Parton et al., 1987) being structurally similar (i.e. partitioning total SOM into discrete pools based on turnover times determined from radiocarbon experiments; see Stout and O'Brien, 1973, and Jenkinson, 1977) but each taking different approaches to simplify the complex mechanisms that govern SOM dynamics. Consequently, simulations of SOM can vary greatly between models, often predicting contrasting responses to the same driving inputs and environmental change (e.g. Smith et al., 1997).
Structuring SOM models around functionally defined and measurable pools that result from known biogeochemical processes is one way to help minimize these discrepancies. Two recent insights into SOM dynamics present a path towards addressing this issue. There is now strong evidence that (1) low molecular weight, chemically labile molecules, primarily of microbial origin (Liang et al., 2017), persist longer than chemically recalcitrant C structures when protected by organo-mineral complexation (Mikutta et al., 2006; Kögel-Knabner et al., 2008; Kleber et al., 2011); and (2) each soil type has a finite limit to which it can accrue C in mineral-associated fractions (i.e. the C-saturation hypothesis) (Six et al., 2002; Stewart et al., 2007; Gulde et al., 2008; Ahrens et al., 2015). Structuring an SOM model around these known and quantifiable biogeochemical pools and processes has the potential to drastically reduce uncertainty by enhancing opportunities for parameterization and validation of models with empirical data. Furthermore, mechanistic models can have value in process explanation as well their value in predictive capabilities; such models can pinpoint the processes that have the greatest influence on a system even when they are not traditionally determined empirically.
Conventional SOM models readily acknowledge the importance of microbes in plant litter decomposition and SOM dynamics, but model improvement was initially constrained by the concept that stable SOM included “humified” compounds (Paul and van Veen, 1978). This quantified stable SOM using an operational proxy (high pH alkaline extraction) rather than relating stabilization to the mechanisms that are now widely recognized, such as organo-mineral interactions and aggregate formation (Lehmann and Kleber, 2015). As our contemporary understanding of stable SOM moves away from humification theory, so too must the way we represent SOM stabilization pathways in biogeochemical models. Similarly, many SOM models partition plant residues into labile and recalcitrant pools with turnover times that reflect the assumption of selective preservation (i.e. chemically recalcitrant litter-C is only used by microorganisms when labile compounds are scarce). While many existing models do include a flux from labile residues into stable SOM, this is typically a much smaller absolute amount than the flux from recalcitrant residues. Evidence indicates that biochemically recalcitrant structural litter C compounds may not be as important in the formation of long-term persistent SOM as originally thought (Marschner et al., 2008; Dungait et al., 2012; Kallenbach et al., 2016). Instead, they form light particulate organic matter (POM) (Haddix et al., 2015), a relatively vulnerable fraction of SOM with a turnover time of years to decades (von Lützow et al., 2006, 2007). Consequently, there have been several calls to represent this new understanding and re-examine how microbial activity is simulated in SOM models (Schmidt et al., 2011; Moorhead et al., 2014; Campbell and Paustian, 2015; Wieder et al., 2015).
Current conceptual frameworks more clearly link the role of microbes to SOM dynamics (e.g. Cotrufo et al., 2013; Liang et al., 2017) and generally isolate two discrete litter decomposition pathways for SOM formation (Cotrufo et al., 2015): a “physical” path through perturbation and cryomixing that moves fragmented litter particles into the mineral soil forming coarse POM and a “dissolved” path, through which soluble and suspended C compounds are transported vertically through water flow and, when mineral surfaces are available, form mineral associated organic matter (MAOM). Microbial products and very small litter particles can be transported by both pathways, forming a heavy POM fraction with “biofilms” and aggregated litter fragments around larger mineral particles (i.e. sand; Heckman et al., 2013; Ludwig et al., 2015; Buks and Kaupenjohann, 2016). Attempts to formulate these empirical observations of litter decomposition into mathematical frameworks recently culminated with the development of the LIDEL model (Campbell et al., 2016), which in turn built upon the relationships of litter decomposition described by Moorhead et al. (2013) and Sinsabaugh et al. (2013). While the LIDEL model was evaluated against a detailed lab experiment of litter decomposition (Soong et al., 2015), it does not simulate SOM pools and dynamics. In nature, litter decomposition processes and SOM formation processes are necessarily coupled but are often studied and modelled separately. However, models that link litter decomposition to SOM formation are required to represent SOM dynamics in ecosystem models.
Beside the processes of leaching and fragmentation that control the two pathways mentioned above, litter decomposition processes that form SOM are governed by the balance between microbial anabolism and catabolism (Swift et al., 1979; Liang et al., 2017). A recent paradigm has emerged that emphasizes the role of microbial life strategies (e.g. K vs. r, referring to copiotrophic and oligotrophic microbial functional groups) and carbon use efficiency (CUE) in the formation of SOM from plant inputs (Dorodnikov et al., 2009; Cotrufo et al., 2013; Lehmann and Kleber, 2015; Kallenbach et al., 2016). As a result, scientists have explored several approaches to represent microbes in SOM models. Research has indicated that explicitly representing microbes in an SOM model can provide very different predictions of SOM dynamics and include important feedbacks such as acclimation, priming and pulse responses to wet–dry cycles (Bradford et al., 2010; Kuzyakov et al., 2010; Lawrence et al., 2009; Schmidt et al., 2011). This research has shown that, compared to conventional models, microbially explicit SOM models have drastically different simulated responses to environmental change (Allison et al., 2010; Wieder et al., 2015; Manzoni et al., 2016). However, these responses are generally validated against data on microsite spatial scales and are not necessarily generalizable over larger spatial scales (Luo et al., 2016).
Microbes have been explicitly represented in SOM models in many ways and for many years, from relatively simple approaches using a single microbial biomass pool or fungal:bacterial ratios (e.g. McGill et al., 1981; Wieder et al., 2013; Waring et al., 2013) to more complex associations with microbial guilds or community dynamics based on dominant traits derived through genetic profiling (Miki et al., 2010; Allison et al., 2012; Wallenstein and Hall, 2012). The MIcrobial-MIneral Carbon Stabilization (MIMICS) model (Wieder et al., 2014) consolidated existing research at the time and uses the size of a microbial biomass pool together with Michaelis–Menten kinetics to feedback on C decay rates of SOM pools. While the MIMICS model and others (for an example see Manzoni et al., 2016) provide a potentially viable framework for explicitly representing microbes in an SOM model, it remains unclear whether this is practical given the lack of input data required to drive and validate these relationships (Treseder et al., 2012; Sierra et al., 2015). Furthermore, parsimony and analytical tractability are both key concerns for ecosystem models designed to operate over large spatial and temporal scales. While microbially explicit models may be essential for addressing research questions on small spatial scales, they may introduce unnecessary, additional uncertainty to global simulations (Stockmann et al., 2013).
While microbial efficiency largely controls SOM formation rates, and microbial products are major components of the MAOM and the coarse, heavy POM fractions of SOM (Christensen, 1992; Heckman et al., 2013) the long-term persistence of SOM is determined by mineral associations that are subject to saturation. Saturation limits for SOM were proposed more than a decade ago (Six et al., 2002) and have been supported by several empirical studies (e.g. Gulde et al., 2008; Stewart et al., 2008; Feng et al., 2012; Beare et al., 2014). Briefly, the concept of C saturation suggests that each soil has an upper limit to the capacity to store C in mineral-associated (i.e. silt + clay <53 µm) fractions due to biochemical and physical stabilization mechanisms (e.g. cation bridging, surface complexation and aggregation) that are limited by a finite area of reactive mineral surfaces. While saturation kinetics are easy to define conceptually (Stewart et al., 2007), C saturation as a concept has been adopted by only a few SOM models (Struc-C, Malamoud et al, 2009; COMISSION, Ahrens et al., 2015; Millennial, Abramoff et al., 2017). This is partly because its use in an SOM model requires a robust estimate of the specific site's saturation capacity. SOM saturation has been modelled using (i) empirical regressions between silt + clay content and C concentration of that fraction (Six et al., 2002, as applied in COMISSION), and (ii) empirical relationships between clay content and the derived Qmax parameter of Langmuir isotherm functions (Mayes et al., 2012, as applied in Millennial). As noted by Ahrens et al. (2015), the use of C-saturation kinetics in an ecosystem model would require a map of mineral-associated C saturation capacity, and since soil C stocks in silt + clay fractions can make up the majority of total soil C stocks, a lot of weight would be put on that single driving variable for each site. However, it is worth noting that, when applying C-saturation concepts, only the mineral-associated organic matter (MAOM) fraction saturates. Other SOM fractions (e.g. particulate organic matter, POM) theoretically have no saturation limit (Stewart et al., 2008; Castellano et al., 2015).
Attempts to consolidate the concepts of microbial control on litter decomposition and mineral control on SOM stabilization resulted in the MEMS framework (Cotrufo et al., 2013). To date, we are aware of only one attempt to represent MEMS within a mathematical model, the Millennial model (Abramoff et al., 2017). However, this model does not simulate litter decomposition explicitly and as a result does not include the impact of litter input chemistry, which is a fundamental component of the MEMS framework and needed to improve ecosystem modelling, as discussed previously.
In this study we describe and demonstrate the application of a new mathematical model (MEMS v1.0) that applies three major concepts of SOM dynamics: (1) litter input chemistry-dependent microbial CUE informing SOM formation (Cotrufo et al., 2013), (2) separate dissolved and physical pathways to SOM formation (Cotrufo et al., 2015), and (3) soil C saturation related to litter input chemistry (Castellano et al., 2015). The scope of this inaugural model description is limited to representing these three concepts and is not intended to include every mechanism relevant to SOM cycling. Our objective is to demonstrate the benefits of structuring an SOM model around key biogeochemical processes rather than turnover times. Using measured SOM physical fractions from 154 forest and grassland sites across Europe, key parameters were optimized to improve model performance when simulating POM-C (consisting of both light and heavy POM) and MAOM-C under equilibrium conditions. The resulting model was then used to test whether the behaviour of simulated SOM dynamics concur with the expected theoretical relationships. Finally, the model performance in predicting soil C stocks at equilibrium was evaluated by simulating 8192 forest and grassland sites across Europe, representing a diverse set of driving variables (i.e. climate, soil type and vegetation type).

Figure 1Conceptual model diagram of MEMS v1.0 (see Table 1 for detailed information regarding each pool). Litter pools of MEMS v1.0 are defined as >2 mm particles and comprise of hot-water extractable (C1), acid-soluble (C2) and acid-insoluble (C3) fractions. A microbial pool (C4) and dissolved carbon pool (C6) are also part of the organic horizon and litter decomposition processes (see LIDEL for more information; Campbell et al., 2016). Soil organic matter (<2 mm particles below ground) comprises a light particulate organic matter pool (light POM, C10) formed from the input through fragmentation and physical transfer of the structural litter residues (C2 and C3), a coarse, heavy POM pool (C5) formed from both litter fragmentation and microbial residues coating sand-sized particles, a dissolved organic matter (DOM) pool (C8) formed from the decomposition of all other pools and receiving DOM from the organic soil layer, and a mineral-associated organic matter pool (MAOM C9), which exchanges C through sorption and desorption with the DOM. Arrows indicate the fluxes of carbon between the different pools. Carbon dioxide is produced from a number of these fluxes, but for simplicity of graphical representation, these arrows are not linked to the carbon dioxide pool (C7). Deeper soil layers can be represented by the same structure, with or without root inputs depending on depth but are not implemented in this inaugural version of MEMS v1.0.
2.1 Model description
The MEMS model (herein MEMS v1.0) is designed to be as parsimonious as possible while simulating the spatial and temporal scales relevant to management and policy decision-making. The model is structured (Fig. 1) to simulate plant litter decomposition explicitly, with decomposition products defining C inputs to discrete soil pools that can be isolated with common SOM fractionation techniques (Table 1). Each state variable in MEMS v1.0 can be quantified directly using common measurement protocols and therefore calibration and evaluation data can be generated with a single fractionation scheme (Table S1). Detailed information about the model structure, the mathematical representation (i.e. differential equations) and how each mechanism is described mathematically can be found in the Supplement. All model parameters can be found in Table 2.
Table 1State variables of MEMS v1.0 and fractionation definitions (measurement proxy and protocol) for isolating each pool. C1 to C4, and C6, refer to the organic layer (above ground, >2 mm particles), while C5 and C8 to C10 refer to the mineral soil (below ground, <2 mm particles). POM is particulate organic matter; DOM is dissolved organic matter; OM is organic matter. All SOM fractions are primary fractions obtained after dispersion to break up aggregates. For details on a fractionation scheme to quantify each pool of the MEMS model, please refer Table S1.
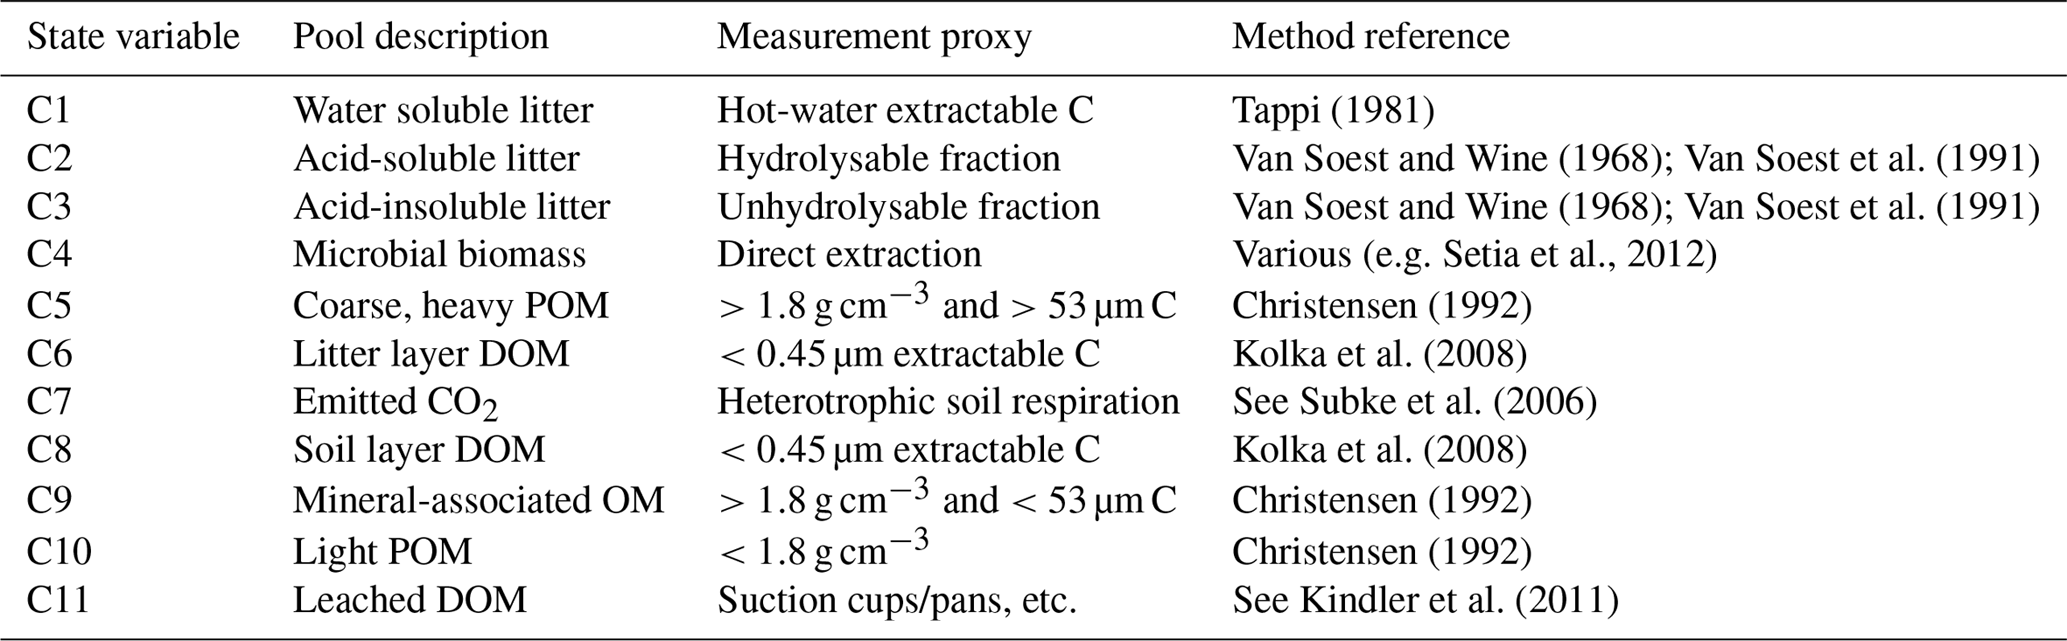
Table 2Description and default values of all parameters used with MEMS v1.0. Where possible, notation has been used to remain consistent with further details in the supplement. Driving variables are reported in Table 3. Ranges are indicative of those observed in the literature. Refer to Sect. 2 and Table S2 for details of the optimized parameter ranges.

* These parameters are calculated as functions of others. For example, Qmax is a function of sand content, soil bulk density, rock fraction, SCicept and SCslope. More details and the equations associated can be found in the Supplement.
MEMS v1.0 is an SOM model that operates at the ecosystem scale on a daily time step. Carbon inputs to the model are resolved for each source (in the case of multiple input streams, e.g. manure, crop residue, compost) discretely, partitioning daily C inputs between solid-phase (C1, C2, C3) and dissolved (C6) litter pools as a function of litter chemistry (nitrogen, N, content and the acid-insoluble fraction, i.e. lignin) that influences microbial decomposition processes. This structure is similar to the LIDEL model (Campbell et al., 2016) and follows the hypothesis that both N availability and lignin content influence decomposition by affecting microbial activity (Aber et al., 1990; Manzoni et al., 2008; Sinsabaugh et al., 2013; Moorhead et al., 2013). Similar approaches have been used in many of the updated traditional SOM models (e.g. lignin : N ratios in CENTURY; Kirschbaum and Paul, 2002). These input partitioning coefficients can be determined experimentally for each C input source (Tables 1 and S1). Upon reaching the soil, C compounds are subject to biotic and abiotic processes that transform and transport organic matter through an organic horizon and subsequent mineral soil layers. As described here, MEMS v1.0 currently only simulates a surface organic horizon and a single mineral soil layer and does not yet differentiate between above- and belowground litter input chemistry to avoid requiring additional input parameters on root litter chemistry. However, the model architecture is sufficiently generalizable to apply to multiple soil layers and/or multiple discrete sources of C input. Where possible we use the parameter names and abbreviations from the LIDEL model (Campbell et al., 2016).
2.1.1 Microbe mediated transformations and dissolved organic matter (DOM) production
Many of the biogeochemical processes represented by MEMS v1.0 are assumed to be microbially mediated (and therefore result in exoenzyme breakdown and CO2 production), but only two lead to C assimilation into a distinct microbial biomass pool – from the water-soluble and acid-soluble litter pools (C1 and C2). In the mineral soil (i.e. pools C5, C8, C9 and C10), microbial anabolism and catabolism are implicit and considered part of the turnover of each pool. This ensures parsimony and allows model parameters to represent the differences in microbial community for each pool, as opposed to the alternative of explicit microbial pools. The C transferred from the C1 and C2 litter pools into microbial biomass is defined by a dynamic CUE parameter controlled by the N content of the input material and the lignocellulose index (LCI, defined as the ratio between acid-insoluble and acid-soluble + acid-insoluble) of the litter layer (i.e. lower CUE results when a higher proportion of the litter is acid insoluble). Including microbially explicit processes in the litter layer helps to determine the proportion of C inputs that result in MAOM and POM formation (see Liang et al., 2017) and allows for future model versions to account for distinctions between different points of entry for inputs (Sokol et al., 2018). The lack of C transferred from other pools (e.g. C3) into microbial biomass implies their decay from co-metabolism with the more labile C sources (i.e. Klotzbucher et al., 2011; Moorhead et al., 2013). Once assimilated within microbial biomass, the anabolism of microbial activity results in generation of microbial products (i.e. necromass) that form tightly bound aggregates of biofilms and small litter fragments around sand-sized soil particles (Huang et al., 2006; Buks and Kaupenjohann, 2016) and dissolved organic matter (DOM). These contribute to the heavy POM (C5) and litter DOM (C6) pools, respectively. While these specific processes are well supported by relevant literature, retaining parsimony and the generalizable structure required by an ecosystem-scale model MEMS v1.0 represents microbial metabolism processes more generally (i.e. by linking them to a dynamic microbial CUE rather than specific community traits).
Even though not all pools explicitly produce microbial biomass, all pools do produce DOM. Recent studies have shown that DOM and small suspended particulates result from the decomposition and fragmentation of all forms of inputs including those characterized as inert, such as pyrolized material (Soong et al., 2015). Consequently, the model assumes that all microbially mediated decomposition produces some C in DOM with rates specific to the pool from which the C originates. Since DOM generation is strongly influenced by the elemental composition of the input material (Soong et al., 2015), it is intrinsically linked to microbial CUE, employing the same formulation as LIDEL, which accounts for input N content and LCI of the litter layer (Campbell et al., 2016). At present, root exudation is not explicitly represented, but the presence of a soil DOM pool (C8) will allow for incorporation of root exudation processes in later versions. More detail regarding the microbially transformed organic matter inputs compared to those directly incorporated into the soil can be found in the Supplement.
2.1.2 Perturbation and physical transport
While microbial activity directly influences DOM production and therefore its transport with water flow (pool C8), the physical pathway to SOM formation (i.e. forming pools C5 and C10; POM) results from perturbation and fragmentation processes (Cotrufo et al., 2015). The exact mechanisms of perturbation are hard to generalize over the globally diverse conditions that an ecosystem-scale model such as MEMS v1.0 is designed to operate. Consequently, the litter fragmentation and perturbation rate (LITfrg) in MEMS v1.0 is represented as a first-order process where the default value of LITfrg was informed by empirical estimates (e.g. Scheu and Wolters, 1991; Paton et al., 1995; Yoo et al., 2011), but uncertainty can be reduced by relating this rate to specific site conditions that reflect, in particular, soil macro- and mesofauna activity. The division of litter fragmentation between the C5 and C10 pools is derived from fractionation results that separate the light and heavy POM. The split between these two fractions appears to vary with land use (Poeplau and Don, 2013), although the exact relationship is unclear. Consequently, MEMS v1.0 applies an average over all land uses. Particulate organic matter is divided between a heavy and a light pool because recent evidence suggests the two fractions are differentially influenced by temperature and management linked to aggregation and land-use change (de Gryze et al., 2004; Tan et al., 2007; Poeplau et al., 2017). Furthermore, the heavy, coarse POM pool can play an important role in soil nutrient cycling (Wander, 2004) and it has a different turnover time to either the MAOM or light POM fraction (Crow et al., 2007; Poeplau et al., 2018).
2.1.3 Liquid-phase transport
Vertical transport of DOM can be simulated as a function of water flow in a process-based soil hydrology model. However, in this first, stand-alone version, MEMS v1.0 assumes that DOM is transported rapidly downward through percolation and advection according to a constant water flux. As with the LITfrg parameter, the rate of vertical C transport (controlled by parameter DOCfrg) would ideally be site-specific but is currently fixed at a general, default value informed by relevant literature (Trumbore et al., 1992; Kindler et al., 2011). More information can be found in the Supplement and in Table 2.
2.1.4 Sorption and desorption with mineral surfaces
The organo-mineral complexes that define a large portion of MAOM-C in MEMS v1.0 operate under the principles of Langmuir isotherms, which have also been used in the COMISSION and Millennial models (Ahrens et al., 2015, and Abramoff et al., 2017, respectively). These isotherms represent a net C transfer between soil DOM (pool C8) and MAOM (pool C9) that encapsulates all sorption mechanisms (e.g. cation bridging, surface complexation). While MEMS v1.0 uses the same general Langmuir saturation function as the Millennial model, it estimates maximum sorption capacity (parameter Qmax) differently. Here, we use sand content to derive the maximum C concentration of the silt + clay fraction according to a regression calculated by pooling all soil data reported by Six et al. (2002). This is then converted to C density using the site-specific soil bulk density provided as a driving variable to the model.
In addition to the Qmax parameter, the isotherm saturation function also relies on an estimate of a specific soil's binding affinity (parameter Klm). Typically, this is a product of a soil's specific mineralogy, influencing the type of organo-mineral bonds that are formed and the strength of those bonds (Kothawala et al., 2009). Furthermore, the type of C compounds being sorbed are also key to defining an isotherm's binding affinity (Kothawala et al., 2008, 2012). This parameter can be very difficult to generalize without requiring exhaustive information on soil physio-chemical conditions (e.g. clay type, Fe ∕ Al concentration), but the work of Mayes et al. (2012) presented an empirical relationship between Klm and native soil pH, with pH acting as a proxy for mineralogical conditions. As a result, sorption rates to mineral surfaces are dependent on pH (see Eq. 35 in Supplement). This relationship (derived from isotherms calculated for 138 soils of varying taxonomies) provides a good starting point for estimating Klm and is also used by the Millennial model (Abramoff et al., 2017). It is worth noting that desorption is implicit in the Langmuir saturation function used by MEMS v1.0 (unlike the explicit representation in COMISSION, Ahrens et al., 2015), meaning that when the MAOM pool reaches saturation the net transfer from soil DOM to MAOM may be negative and C is transferred from MAOM to DOM. The simulated sorption–desorption processes in MEMS v1.0 are directly derived from empirical data and are similar to other SOM models (Wang et al., 2013; Ahrens et al., 2015; Dwivedi et al., 2017).
2.1.5 Heterotrophic respiration and controls on microbial activity
Aside from the litter layer DOM (pool C6), each of the state variables in MEMS v1.0 decay with unique specific maximum rates, with the resultant C flux being partitioned into CO2 (aggregated into the C7 sink term) and an accompanying decomposition product flux into other pools, mainly DOM. Thus, the decay rate constants represent total mass loss potential, embodying DOM-C generation as well as CO2 emissions, as per a recent decomposition conceptualization (Soong et al., 2015). The total amount of heterotrophic respiration is the sum of CO2 produced from the biotic decay of all model pools after other fluxes (e.g. DOM generation) are calculated (more detail can be seen in the Supplement). While the maximum specific decay rates for most pools are fixed parameters informed by empirical data (Table 2), several studies suggest linking decay rates of recalcitrant compounds to those of more microbially accessible compounds (Moorhead et al., 2013; Campbell et al., 2016). This follows similar hypotheses to the priming effect, in which chemically recalcitrant compounds (e.g. lignin, cutin and suberin) are processed co-metabolically when microbes act preferentially on more energetically favourable compounds nearby (Carrington et al., 2012; Větrovský et al., 2014). Consequently, MEMS v1.0 applies this through use of the same functions as those used by the LIDEL model (Campbell et al., 2016), estimating the maximum specific decay rate of pool C3 with a relationship to parameter k2 (i.e. the maximum specific decay rate of the acid-soluble litter fraction, pool C2). At present, CO2 emitted from soil mineralization of DOM is associated with the values presented in Kalbitz et al. (2005).
2.1.6 Decay rate modifiers
Temperature is used as the main environmental control on maximum specific decay rates of each pool. The rate-modifying function used by MEMS v1.0 is adapted from that of the StandCarb model (Harmon and Domingo, 2001). This function is consistent with empirical data and enzyme kinetics, implying that microbial decomposition rates peak at an optimum temperature with reduced rates above and below. Coefficients that define the function also include the Q10 and reference temperature for that specific pool. Therefore, the function can utilize empirical data if available for a site. This is a relatively simple function that only accounts for temperature. Simulating the influence of other important controls on decomposition, such as water, oxygen, pH and nutrients, are beyond the scope of this inaugural version of the MEMS model but are central to future development efforts.
2.1.7 Model implementation and driving variables
MEMS v1.0 is a series of ordinary differential equations solved for discrete time steps by numerical integration using finite differencing techniques from the Runge–Kutta family of solvers. Implementation is performed through the deSolve package (Soetart et al., 2010) written for R (all equations and associated details can be found in Supplement). Parameters used to solve MEMS v1.0 are described along with their default values and associated references in Table 2.
Table 3List of required driving variables for the MEMS v1.0 model. Baseline values represent mean values as reported in the LUCAS database (Toth et al., 2013) of 8192 forest and grassland sites across Europe and were used for all qualitative testing and sensitivity analyses.
* When daily measurements are not available annual values can be used to interpolate daily estimates. For more information please refer to the Supplement.
Initializing MEMS v1.0 requires external inputs of basic site characteristics (climatic and edaphic conditions as well as land management information) and ideally measurements of daily C input. However, C inputs are rarely available on daily timescales. Consequently, for this inaugural version of the MEMS model we employ a simple function to interpolate daily C inputs from annual net primary productivity (NPP), partitioning above and below ground and to the simulated soil layer using land-use specific root : shoot ratios and a simple root distribution function (Poeplau, 2016). These driving variables are external inputs of the initial model version but may be obtained from coupled climate and plant growth submodels in future versions when incorporated into a full ecosystem model. Details of these approaches are given in the Supplement and all required driving variables are shown in Table 3. Since the major C pools can each be quantified using common analytical methods (Table 1), the best way of initializing the size of these pools in MEMS v1.0 is to use measured data. However, when measured data are not available, a typical site simulation employs a spin-up that runs the model to steady-state conditions based on average climatic and edaphic conditions, as well as average C inputs.
2.2 Global sensitivity analysis
The default parameter values (i.e. those governing C turnover and fluxes between pools) used by MEMS v1.0 are informed by data from relevant literature (Table 2). However, different studies may suggest different values based on discrete site conditions, meaning a priori estimates may not necessarily be generalizable across all sites that the model could simulate. A variance-based global sensitivity analysis was performed to determine each parameter's relative contribution to the change in each state variable (i.e. determining which parameters have the largest influence on the size of each model pool). The sensitivity analysis was repeated for different simulation lengths (1–1000 years) as different fluxes operate on different temporal scales, thereby meaning that the relative importance of each parameter changes through time. Initial pool sizes were set to 0 and the model was initialized to simulate a steady-state scenario based on average site conditions derived from ∼8000 forest and grassland sites in the Land-Use/Land Cover Area frame Survey (LUCAS) data set (Toth et al., 2013; see Table 3). Specifically, this meant starting a model run with no C in the system and gradually building up the litter and soil pools until they reached equilibrium based on driving variables (soil type, C inputs, climate) that remain fixed over time. To evaluate how much each model parameter (e.g. decay rates, DOM generation rates; see Table 2) affects the amount of C in each pool (i.e. C1–C11; Fig. 1), parameter values were changed to be higher or lower from their baseline and pool sizes are tracked over simulation time. Note that all temperature modifier parameters (Tref, Topt, , Tlag and Tshp; Table 2) were excluded in this sensitivity analysis as the resulting Tmod has the same effect on all decay rates. Maximum and minimum values of all other parameters (n=24) were defined as 50 % above and below the literature-derived (baseline) value (Table 2). Using Latin Hypercube techniques to sample within the full parameter space, a global sensitivity varying all parameters was used to determine total variance for changes to each model pool (i.e. how much each pool changes in size when all parameters vary up to 50 %). Then, in turn, each individual parameter was fixed at its baseline value, while all others varied. This defines each parameter's contribution to a pool's variance, averaged over variations in all other parameters (Sobol, 2001; Saltelli et al., 2008) (i.e. how much each pool changes in size when all parameters, except one, vary up to 50 %). When normalized over the global sensitivity variance, a contribution index provides the proportion of variance explained by each parameter. The analysis was run 10 000 times to define the total parameter space and the whole procedure was repeated annually for simulation lengths between 1 and 1000 years. Put simply, 10 000 different combinations of parameter values between the minimums and maximums were used to repeatedly run the model for 1000 years given average site conditions. The results showing changes in pool size correspond to the changes in parameter values (e.g. when maximum decay rate of MAOM is increased, pool C9 may decrease in size but other pools may increase). The impact that a single parameter has on pool size, compared to that of all parameters, is described by the contribution index, where the total effect of all the parameters is equal to the maximum change in pool size. Note that the results of a global sensitivity analysis of this kind are non-directional and do not indicate whether a parameter increases or decreases a pool size, but rather that it simply changes from the baseline.
2.3 Model response to changes in driving variables
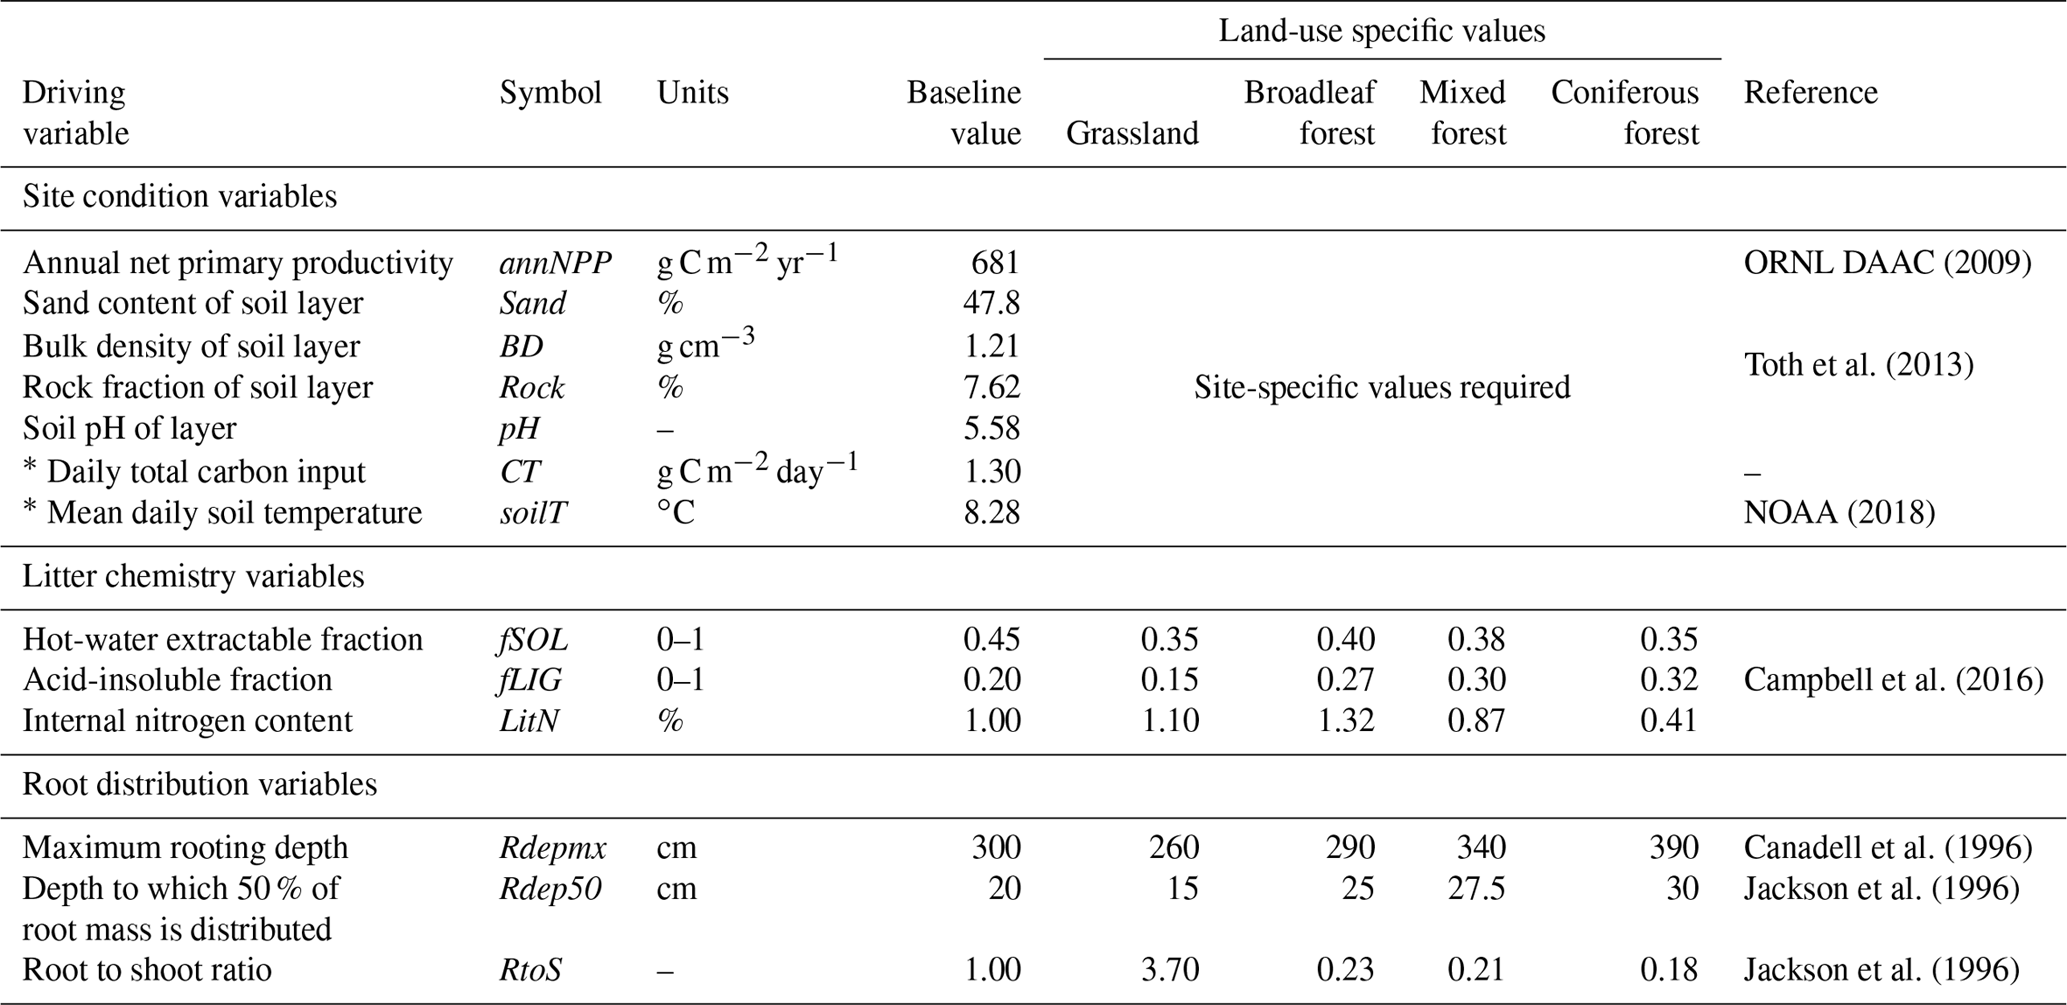
To determine the model's steady-state response to changes in each individual driving variable, a local one-at-a-time (OAT) sensitivity analysis was performed by sequentially simulating different equilibrium conditions for 1000 years. The baseline estimates for edaphic inputs, temperature and C input quantity were informed by the LUCAS data set (Toth et al., 2013; see Table 3 and below for more details), with mean values defining the mid-points and ranges defined as the minima and maxima. Litter chemistry driving variables were adapted from the ranges described by Campbell et al. (2016). Note that, while typically described as a sensitivity analysis, an OAT approach is not as robust as variance-based techniques because it cannot determine interactions between input variables. However, OAT results are easier to interpret as there are no confounding impacts and observed relationships are solely a result of changing one variable. Additionally, we assess the model's qualitative relationships between driving variables by comparison to a study by Castellano et al. (2015); combinations of high and low sand content and high and low soil pH were used to examine whether model projections agree with the hypothesized relationships between input litter chemistry and MAOM-C stocks at steady state. In these scenarios, alfalfa (Medicago sativa) and ponderosa pine (Pinus ponderosa) were used as examples of high- and low-quality litter inputs, respectively, with litter chemistry driving variables adopted from Campbell et al. (2016).
2.4 Parameter optimization
2.4.1 LUCAS data set and soil fractionation data
Parameter optimization for MEMS v1.0 used data from the LUCAS data set (Toth et al., 2013). This data set contains basic soil properties including C data for almost 20 000 sites across Europe, sampled in 2009, representing a wide spatial range over 25 countries with diverse gradients of soil types, climates and land uses (Fig. S1). Complimented with geo-referenced estimates of annual NPP from MODIS satellite data (ORNL DAAC, 2009) and daily temperature data from the Climate Prediction Center's Global Temperature (CPC-GT) database (NOAA, 2018), this provided all driving variables required to run MEMS v1.0. The use of modelled and interpolated NPP as well as climate data is not recommended over measurement data directly collected from the site(s) being simulated, but for the analysis herein these measured data were unavailable.
A representative subsample (Fig. S2) of forest and grassland sites from LUCAS was selected for fractionation to generate data for POM and MAOM pools (see data set online available at the European Soil Data Centre). Specifically, topsoil (0–20 cm) samples from 78 grassland sites and 76 forested sites were fractionated by size (53 µm) after full soil dispersion in dilute (0.5 %) sodium hexametaphosphate with glass beads on a shaker. The fraction passing through (<53 µm) was collected as the MAOM, while the fraction remaining on the sieve was collected as the POM. It is worth noting that this fractionation did not separate the POM into a light and a heavy POM, as represented in MEMS v1.0 (i.e. C5 and C10), thus these model fractions were combined for data-model comparisons (see below). After drying to constant weight in a 60 ∘C oven, each fraction was analysed for C and N concentration in an elemental analyser (LECO TruSpec CN). Samples from sites with a soil inorganic C content greater than 0.2 % (as reported in the LUCAS database) were acidified before elemental analyses to remove carbonates, so that the % C of each fraction represented the organic C only. Carbon concentrations of each fraction and the total soil organic carbon (SOC) were converted to stocks for the top 20 cm soil layer using bulk density estimates reported with the LUCAS database. A georeferenced summary of these 154 sites can be seen in Fig. S2 and summary information of the fractionation data and comparisons between land-use classes is shown in Figs. S3 and S4.
2.4.2 Optimization procedure
Informed by the global sensitivity analysis, four parameters accounted for ∼60 % of the variation in steady-state bulk (and MAOM/total POM) soil C stocks. These were Nmid, k5, k9 and k10 (see Table 2 for details) and were used for optimization to improve model performance. Maximum and minimum values representing realistic ranges of each parameter were informed by relevant literature and rounded to appropriate boundaries (Tables 2 and S2): Nmid (0.875, 2.625), k5 (6.0−5, 1.0−3), k9 (1.0−5, 4.0−5), k10 (1.0−4, 1.0−3). These values set the limits for Latin Hypercube sampling to define 1024 unique parameter sets that, together, span the full range of each parameter. The fractionated LUCAS site data were used to train and test the model, applying a repeated k-fold cross-validation approach (Kuhn and Johnson, 2013) to identify best parameter values for the full variation of conditions at all 154 sites. Comparisons were made between measured soil C stocks and those resulting from steady-state simulations for each site. Of these sites, 120 (78 %) were used for training and the remaining 34 (22 %) were used for testing. Root mean square error (RMSE) was applied as the objective function. Using the training results, the set of parameters that reported the lowest RMSE for each fraction was used to ensure this “best” parameter set also performed well (i.e. RMSE was within 10 % of that reported for the training sites) compared to the 34 sites of measured data withheld for testing. This process was repeated 10 times using different subsets of the 154 sites for training and testing (i.e. 10 “folds” in the cross-validation approach).
To determine the optimized parameter values, a single fold was chosen at random from those that reported the lowest RMSE for each subset of training sites (i.e. each fold). Optimized values differ depending on which measured fraction is compared to model predictions (whether comparing pool C9 to measured MAOM-C, the sum of pools C5 and C10 to measured total POM-C or the sum of pools C5, C8, C9 and C10 to measured bulk SOC). The new, optimized parameter values (Table S2) were derived from a randomly chosen fold that minimized the RMSE when compared to the MAOM fraction. This was chosen (instead of those optimized for POM or bulk SOC) since the MAOM fraction is typically the largest single soil C pool and using this approach led to the biggest overall decrease in RMSE when compared to all available data (Table S2). In future analyses, a more rigorous approach may be to apply a cost function regarding all available measured pool data (e.g. including litter pool data when it is also measured), but for our initial model evaluation we deemed this random choice sufficient.
2.4.3 Model evaluation for forests and grasslands in Europe
Having optimized key parameter values, the new global parameter set for MEMS v1.0 was used to simulate the remaining forest and grassland sites of the LUCAS data set for independent evaluation. Driving variables of edaphic conditions and land-use type were extracted for each site from LUCAS and combined with daily estimates of C inputs and temperature (derived from simple interpolations assuming a normal distribution of MODIS annual NPP data (see Supplement for details) and CPC-GT daily maximum and minimum air temperature data, respectively). Where these data were unavailable, the site was removed from further evaluation. Three forest land-use classes (as described in LUCAS) were included, along with the pure grassland land-use class. This resulted in a final data set of 8192 sites (3487 grasslands, 1713 coniferous forests, 1590 broadleaved forests and 1402 mixed forests). Mixed forests are defined to contain coniferous and broadleaved species that each contribute >25 % to the total tree canopy. Summary information for these sites can be found in Fig. S1. To differentiate between input litter chemistry, root : shoot ratios and root distribution of the four land uses, generic driving variables for each were derived from relevant literature. Details of these inputs are shown in Table 3.
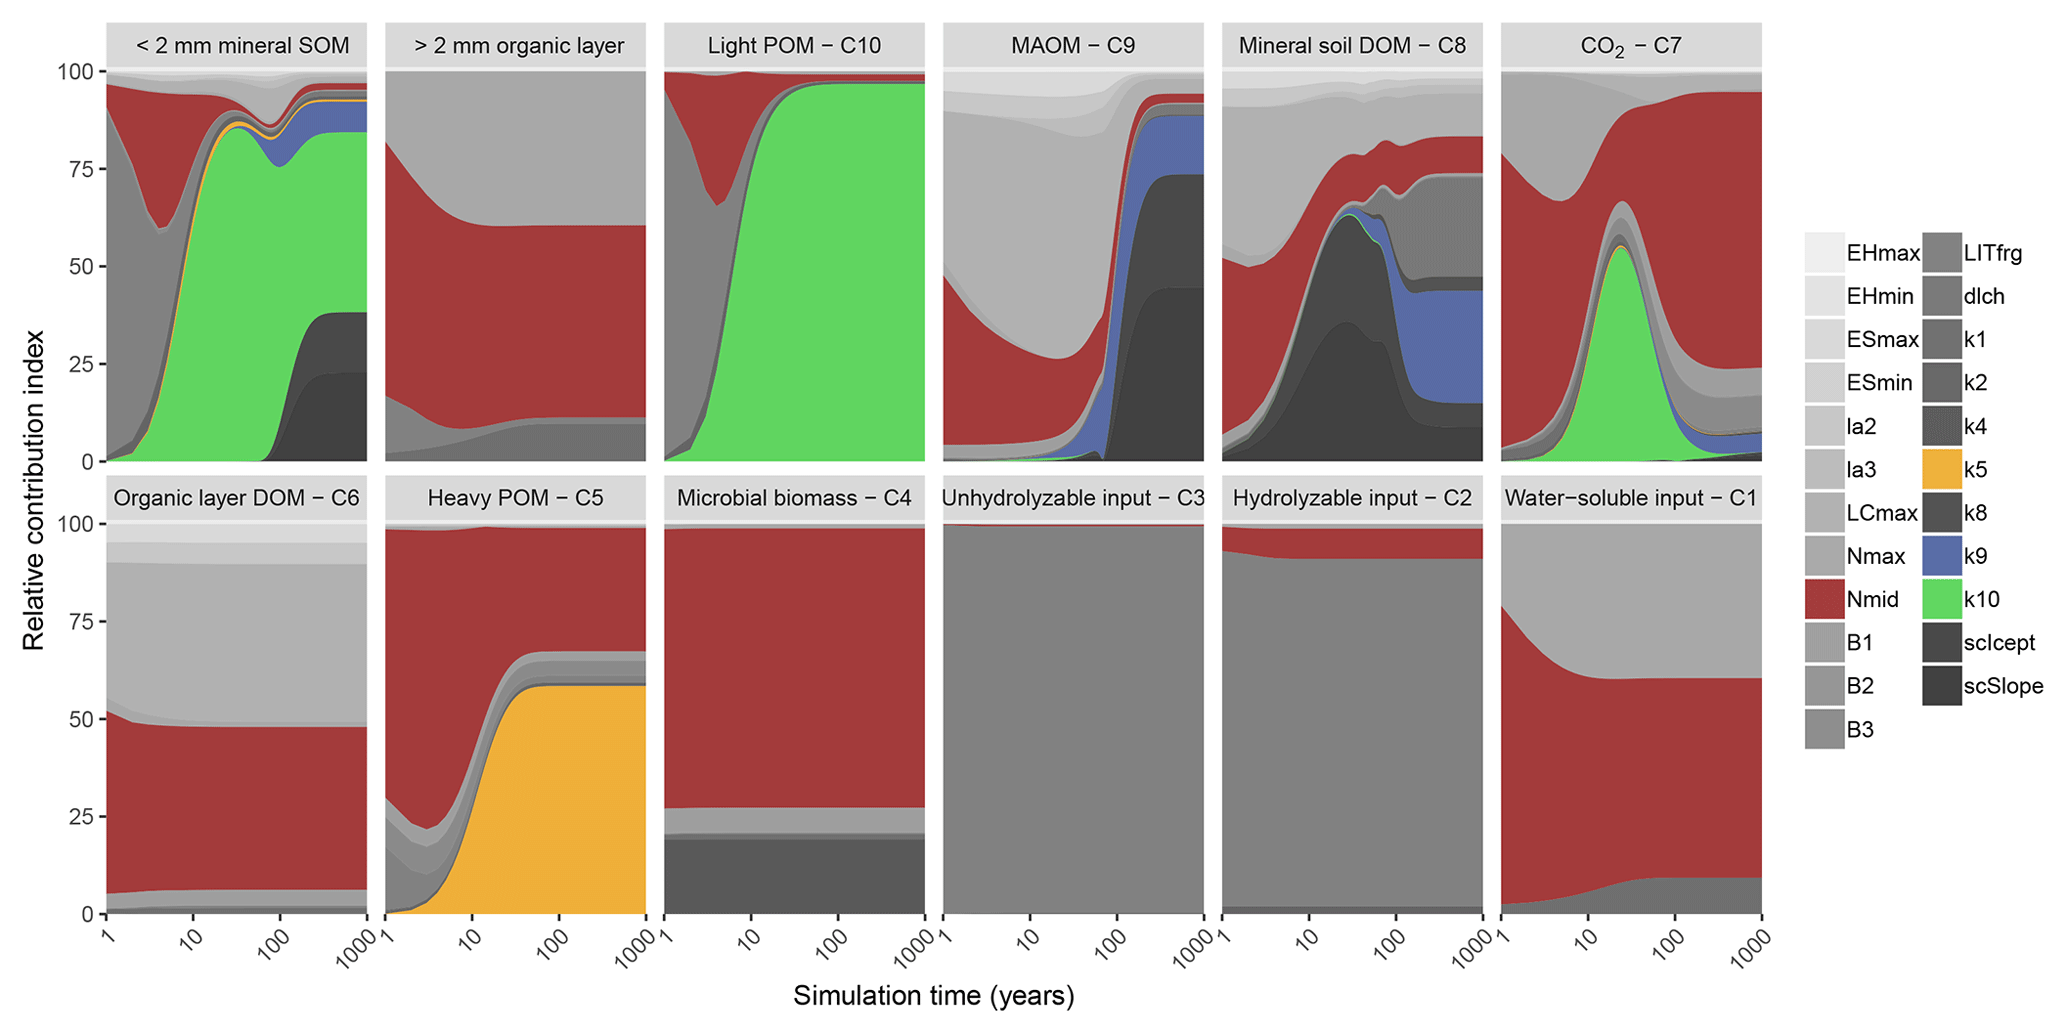
Figure 2Global sensitivity analysis results showing the relative contribution of each parameter to a change in carbon stock of each pool in MEMS v1.0 (leached carbon to deeper soil layers [pool C11] is omitted for clarity) after simulation to steady state. The two top-left panels represent the sum of soil pools (C5, C8, C9 and C10) and organic layer pools (C1, C2, C3, C4 and C6). Details of each parameter and the abbreviations used can be found in Table 2. The sensitivity analysis was repeated annually for simulation times between 1 and 100 years, every 10 years after that to 400-year simulations and every 100 years after that up to a 1000-year simulation. Results are presented on a log scale in years. The four parameters that were optimized in our analysis (Table S2) are coloured to highlight their importance in the different pools (mid-point of logistic curve where nitrogen content of input influences microbial carbon use efficiency, Nmid, is red; maximum decay rate of heavy particulate organic matter, k5, is orange; maximum decay rate of mineral-associated organic matter, k9, is blue; maximum decay rate of light particulate organic matter, k10, is green). A fully colourized, high-quality version of these results can be found in Fig. S5.
Each of the 8192 sites was initialized with zero pool sizes and simulated for 1000 years to achieve steady-state conditions. This assumed the same intra-annual distribution of daily temperature and C input for each year. Organic carbon content reported in LUCAS was converted to SOC stock using the estimated bulk density reported with the database and reduced according to the measured rock/gravel content (Eq. 1), i.e.
where SOC is soil organic carbon stock in Mg C ha−1, Cconc is the measured C content in percent, Lρ is the bulk density of soil layer L in g cm−3 and Lrock is the rock content of soil layer L expressed as a fraction. This total SOC stock was compared to the MEMS v1.0 model output. In addition to comparing measured values with those predicted at steady state (which may not be an accurate assumption for many sites), a more general comparison was performed to examine groups of sites under similar site conditions. Model performance was evaluated for several classes of environmental conditions, with sites divided into above and below median values of mean annual temperature (MAT, 8.3 ∘C), mean annual precipitation (MAP, 687 mm), annual NPP (647 g C m−2 yr−1) and sand content (50 %) for each land-use type. Several standard metrics for error and bias were used to evaluate model performance following the flow chart presented in Smith et al. (1997), including mean absolute error (MAE), mean bias error (MBE), root mean square error (RMSE), modelling efficiency (EF), and coefficient of determination (CofD). Additionally, we used 16 environmental classes to derive an estimate of measurement uncertainty based around sites of similar conditions (e.g. hot, wet, low input, sandy soil) for each land use. To include both measurement and simulation error in the same evaluation metric, we applied a modified F test statistic that uses lack-of-fit sum of squares to account for both experimental and prediction uncertainty (see Sima et al., 2018 for more information). The variance required to calculate these was derived by using the full number of environmental classes as described above (n=16). Due to the lower number of fractionated sites in each group, only temperature and sand content were used as environmental classes (i.e. n=4) to evaluate performance at these 154 sites. One-way ANOVAs were performed to show where average model results were significantly different from average measured C stocks. An α level of 0.05 was used to determine the significance of the ANOVA and F tests. Finally, we also use the standard errors for bulk topsoil C stocks of each environmental class to determine the significance of RMSE assuming a two-tailed Student's t distribution and 95 % confidence interval, as described by Smith et al. (1997). All data processing and statistical analysis were performed in R (v3.4; R Core Modelling Team, 2018).
3.1 Sensitivity and behaviour of MEMS v1.0
3.1.1 Parameter sensitivity at different timescales
Bulk SOC stocks were sensitive to different sets of parameters depending on the duration of the simulation (Figs. 2 and S5). Parameters that define litter fragmentation and perturbation rates (LITfrg) or microbial CUE (mainly LCmax, Nmax and Nmid) are responsible for rapid (<2 years) changes in C stocks, particularly those in the litter layer and light POM. As simulation time increases, the influence of these parameters declines relative to the litter and POM decay rate parameters, particularly k5 and k10. Fifty years after simulations are initialized, more than 75 % of the sensitivity in total soil C stock was due to the maximum specific decay rate of light POM (i.e. parameter k10). After this point, its relative contribution to total C stock sensitivity diminishes (to approximately 45 %) as the parameters that define MAOM-C sorption become more important (i.e. coefficients that determine the regression to calculate MAOM-C saturation capacity [SCicept and SCslope). Overall, our sensitivity analysis showed that the expected dynamics with different processes (e.g. litter fragmentation, microbial processing and sorption) are operating on the appropriate timescales to structure SOM dynamics, and their associated parameters are more or less important depending on the initial pool sizes and model run and experiment duration. Figure 2 can be interpreted as a depiction of how the C pools of MEMS v1.0 are impacted by different parameters as each pool accumulates over time.
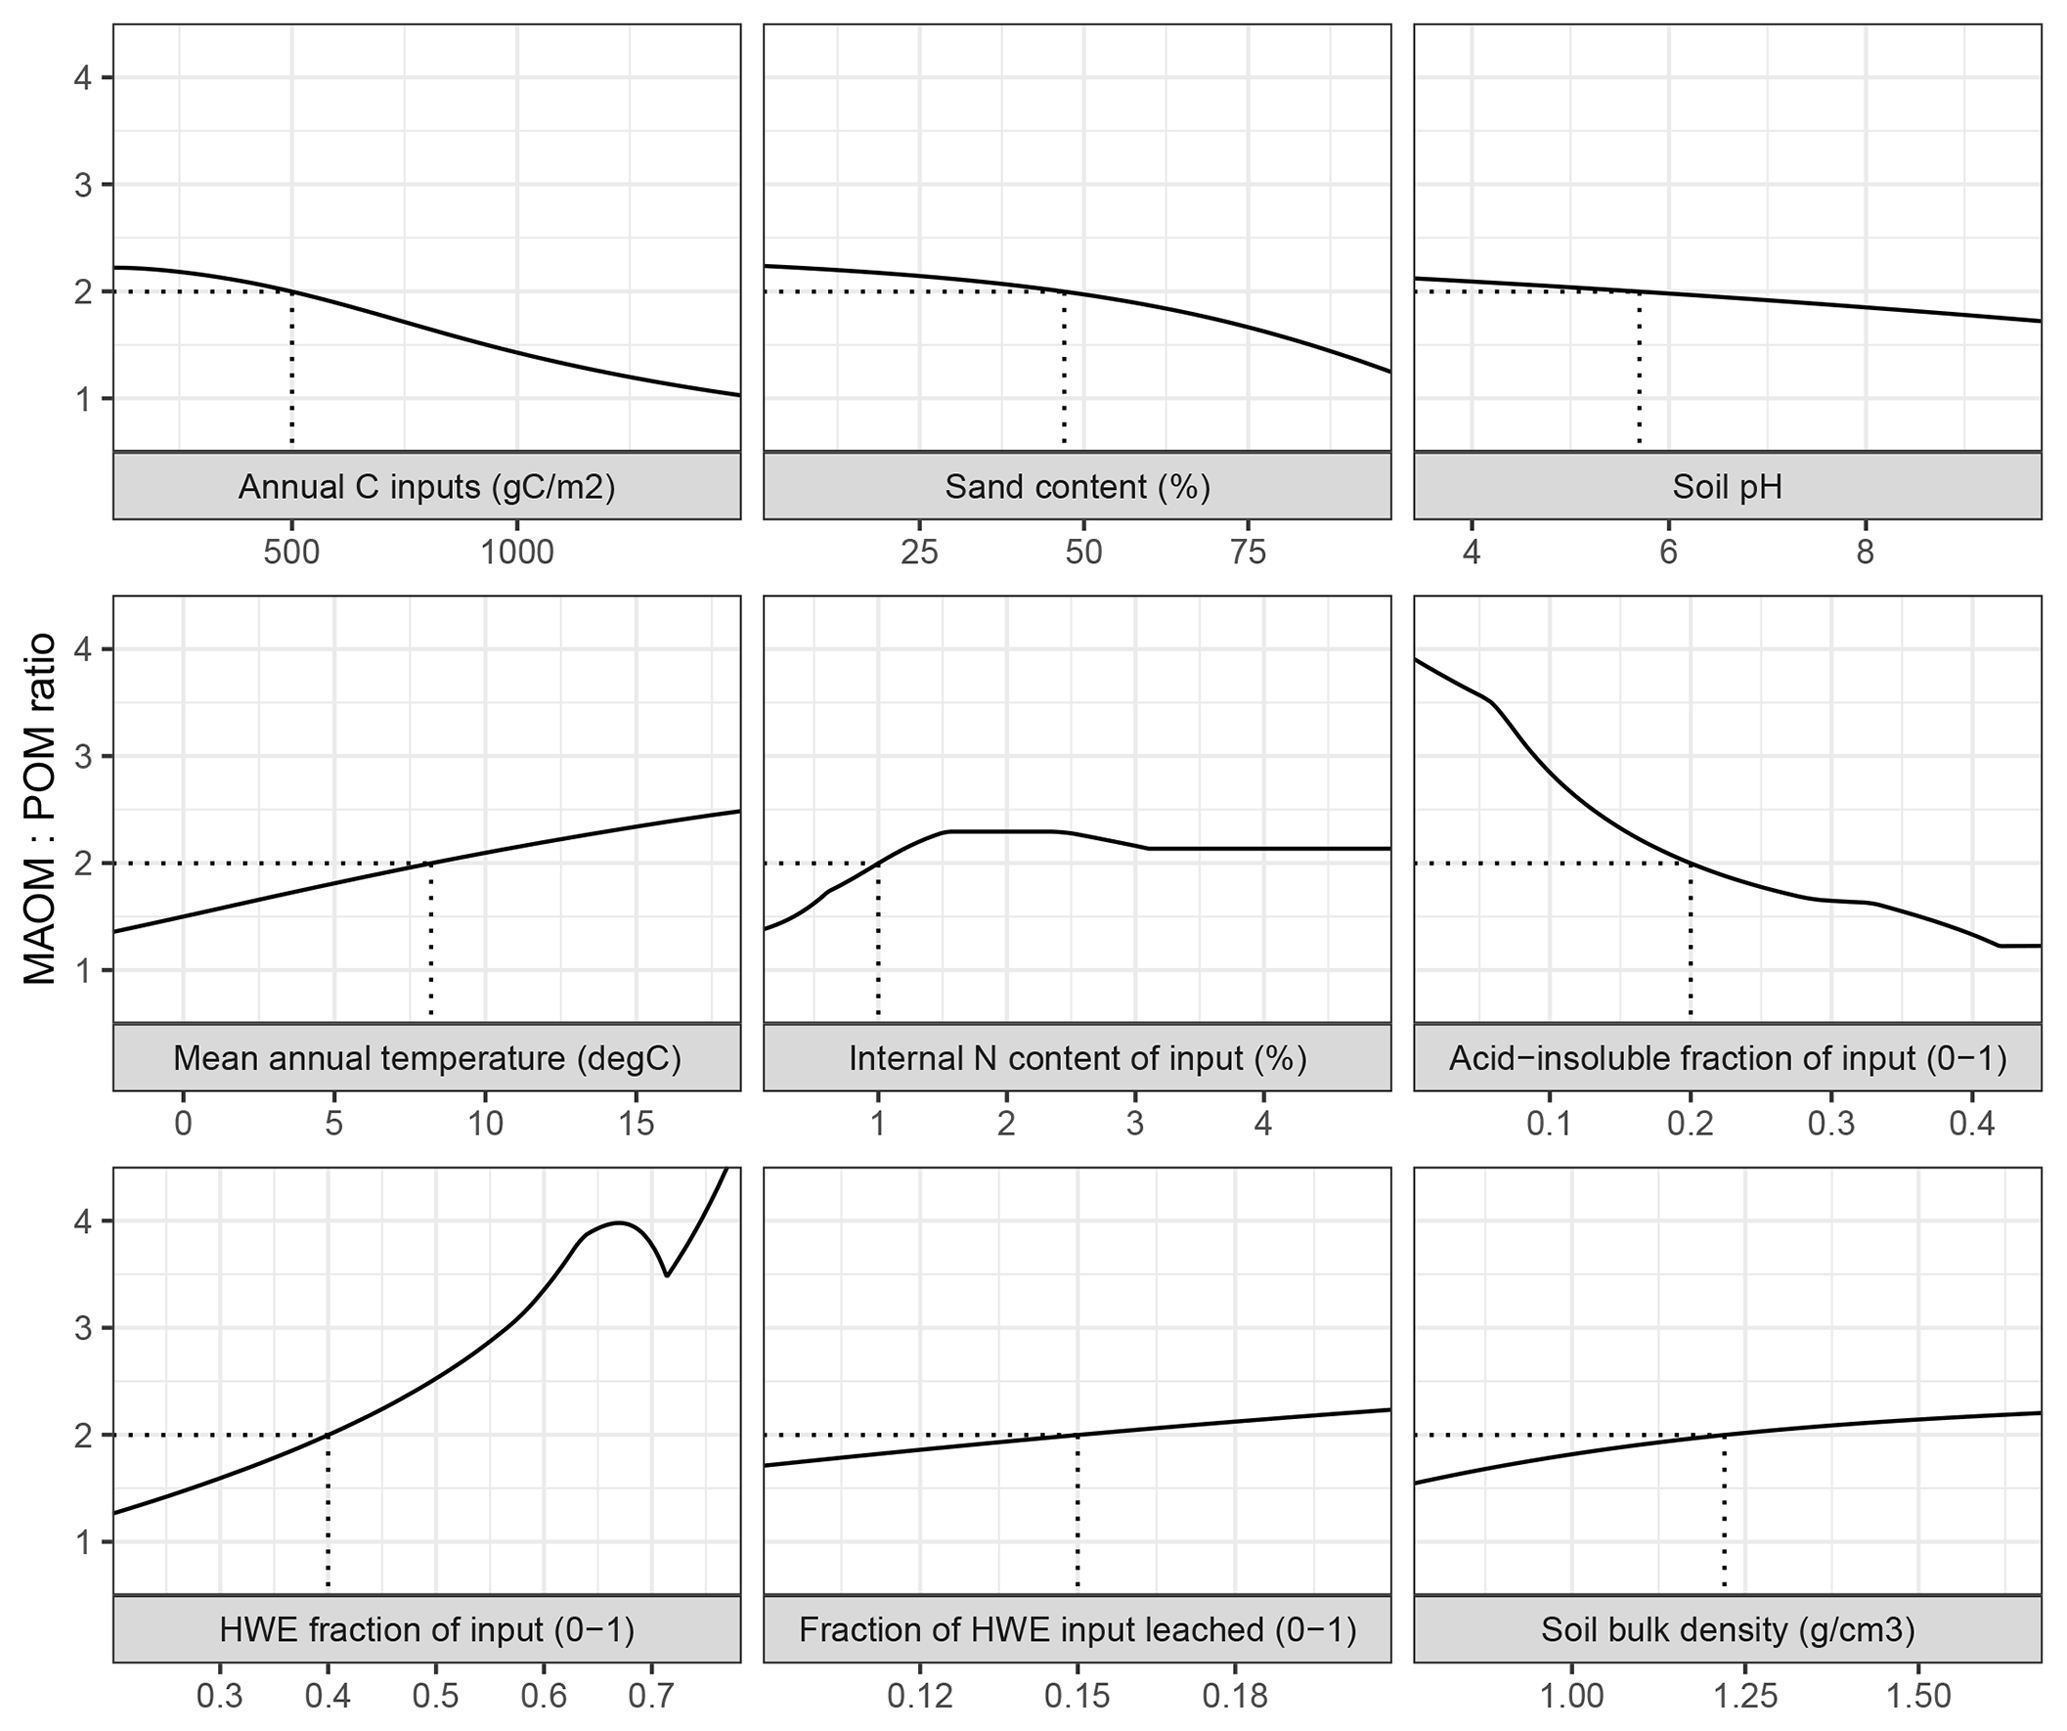
Figure 3The ratio between mineral-associated organic matter and total particulate organic matter (MAOM : POM) under steady-state input conditions in MEMS v1.0 as a response to the full, realistic range of driving variables. Note that total POM refers to the sum of pools C5 and C10. Each input was varied individually, while all others remained fixed at baseline values (indicated by dashed lines) – mean, maximum and minimum values for litter chemistry driving variables (LitN, fDOC, fLIG and fSOL) were derived from Campbell et al. (2016) and edaphic, climatic and C input driving variables (soil bulk density, sand content, soil pH, mean annual temperature and annual net primary productivity) were derived from the LUCAS data set (Toth et al., 2013).
3.1.2 Soil carbon response to changing environmental conditions
Alone, each driving variable (edaphic conditions, temperature, and input litter quantity and quality) in MEMS v1.0 has a discrete and non-linear relationship to the proportion of soil C stored in the MAOM and POM pools under steady-state conditions (Fig. 3). This analysis alters only one driving variable at time while holding others constant at an average value. Bulk C stocks are predicted to be mostly MAOM in all cases except when C inputs (annNPP) are very high (i.e. >1.5 kg C m−2 yr−1; Fig. 3). This results from the fact that the MAOM pool will saturate at high input rates, whereas the POM pools do not (Castellano et al., 2015). Sand content and soil pH influence a site's MAOM saturation capacity, and therefore a low capacity (i.e. high sand content) with mineralogy associated with weaker organo-mineral bonding (i.e. high soil pH) has proportionally more total POM. Litter input chemistry variables also have different, and sizable, impacts on whether SOM forms and persists primarily in MAOM or in POM (as denoted by the MAOM : POM ratio). Note that POM in the MAOM : POM ratio refers to total POM (i.e. pools C5 and C10 combined). The fraction of litter input that is hot-water extractable (fSOL) is a key determinant of MAOM formation rates, and when fSOL is high, MAOM-C stocks at steady state are predicted to be more than 4 times higher than POM-C stocks (Fig. 3). Conversely, when input material has a high acid-insoluble (fLIG) content and a low N content (LitN) the size of the organic horizon increases and, over time, POM-C stocks approach a 1 : 1 ratio with MAOM-C stocks. Figure 3 shows the impact of changing one driving variable, while all others remain constant. When many of these inputs vary at the same time, the relationships to MAOM : POM can be very different (for example, the model predicts twice as much POM-C as MAOM-C when simulating a sandy soil with coniferous vegetation and high annNPP).

Figure 4Mineral-associated organic matter (MAOM) stock response to different levels of input litter quality and quantity compared for edaphic conditions which equate to different MAOM sorption relationships in MEMS v1.0. Formatting adopted from Castellano et al. (2015) to aid comparison between the hypothetical relationship postulated and the actual response simulated by MEMS v1.0 here.
MAOM-C saturation in the model is largely dependent on an interaction between the quantity of C inputs, the soil texture (i.e. sand content) and mineralogy (i.e. for which soil pH is used as a proxy). Figure 4 shows that our mathematical formulation of sorption to mineral surfaces generated a very similar relationship to that proposed by Castellano et al. (2015). When C inputs are low, litter input chemistry has the greatest influence on the MAOM-C stock under steady-state conditions. This is particularly true in soils with the strongest mineral bonding (i.e. low pH) and high sorption capacity (i.e. low sand %; Fig. 4 top-right panel).
3.2 Improved simulation due to parameter optimization
Initial parameter values derived from relevant literature provided good estimates judging from model performance with measured fractionation data (Table S2). Prior to optimization, the difference between measured and modelled bulk soil C stocks of fractionated LUCAS sites was insignificant for all four land uses (one-way ANOVA, p>0.05). However, accounting for experimental and simulation uncertainty (variance calculated by four groups: divisions of high and low mean annual temperature and sand content) MEMS v1.0 only accurately described bulk SOC stocks for the grassland land-use class (F statistic < 0.05). After optimization, an overall model fit with all soil C fractions (MAOM, total POM and bulk) was improved by increasing the maximum decay rate of MAOM (parameter k9) and decreasing the maximum decay rate of light POM (parameter k10), the maximum decay rate of coarse, heavy POM (parameter k5) and the inflection point for the logistic curve that defines the N effect on microbial CUE (parameter Nmid). This resulted in a lower RMSE for comparisons between measured data and baseline values (Table S2). Despite the improved model fit, the error in simulated values for broadleaved forest sites was still more than the error inherent to the measured data (at a 95 % threshold and as defined by the modified F test from Sima et al., 2018). This was primarily caused by two sites at which measured total POM-C stocks were reported to be >95 Mg C ha−1 in the top 20 cm (Fig. 5). When these sites were removed from statistical comparisons there were no significant differences between modelled and measured bulk SOC stocks for any land-use class.
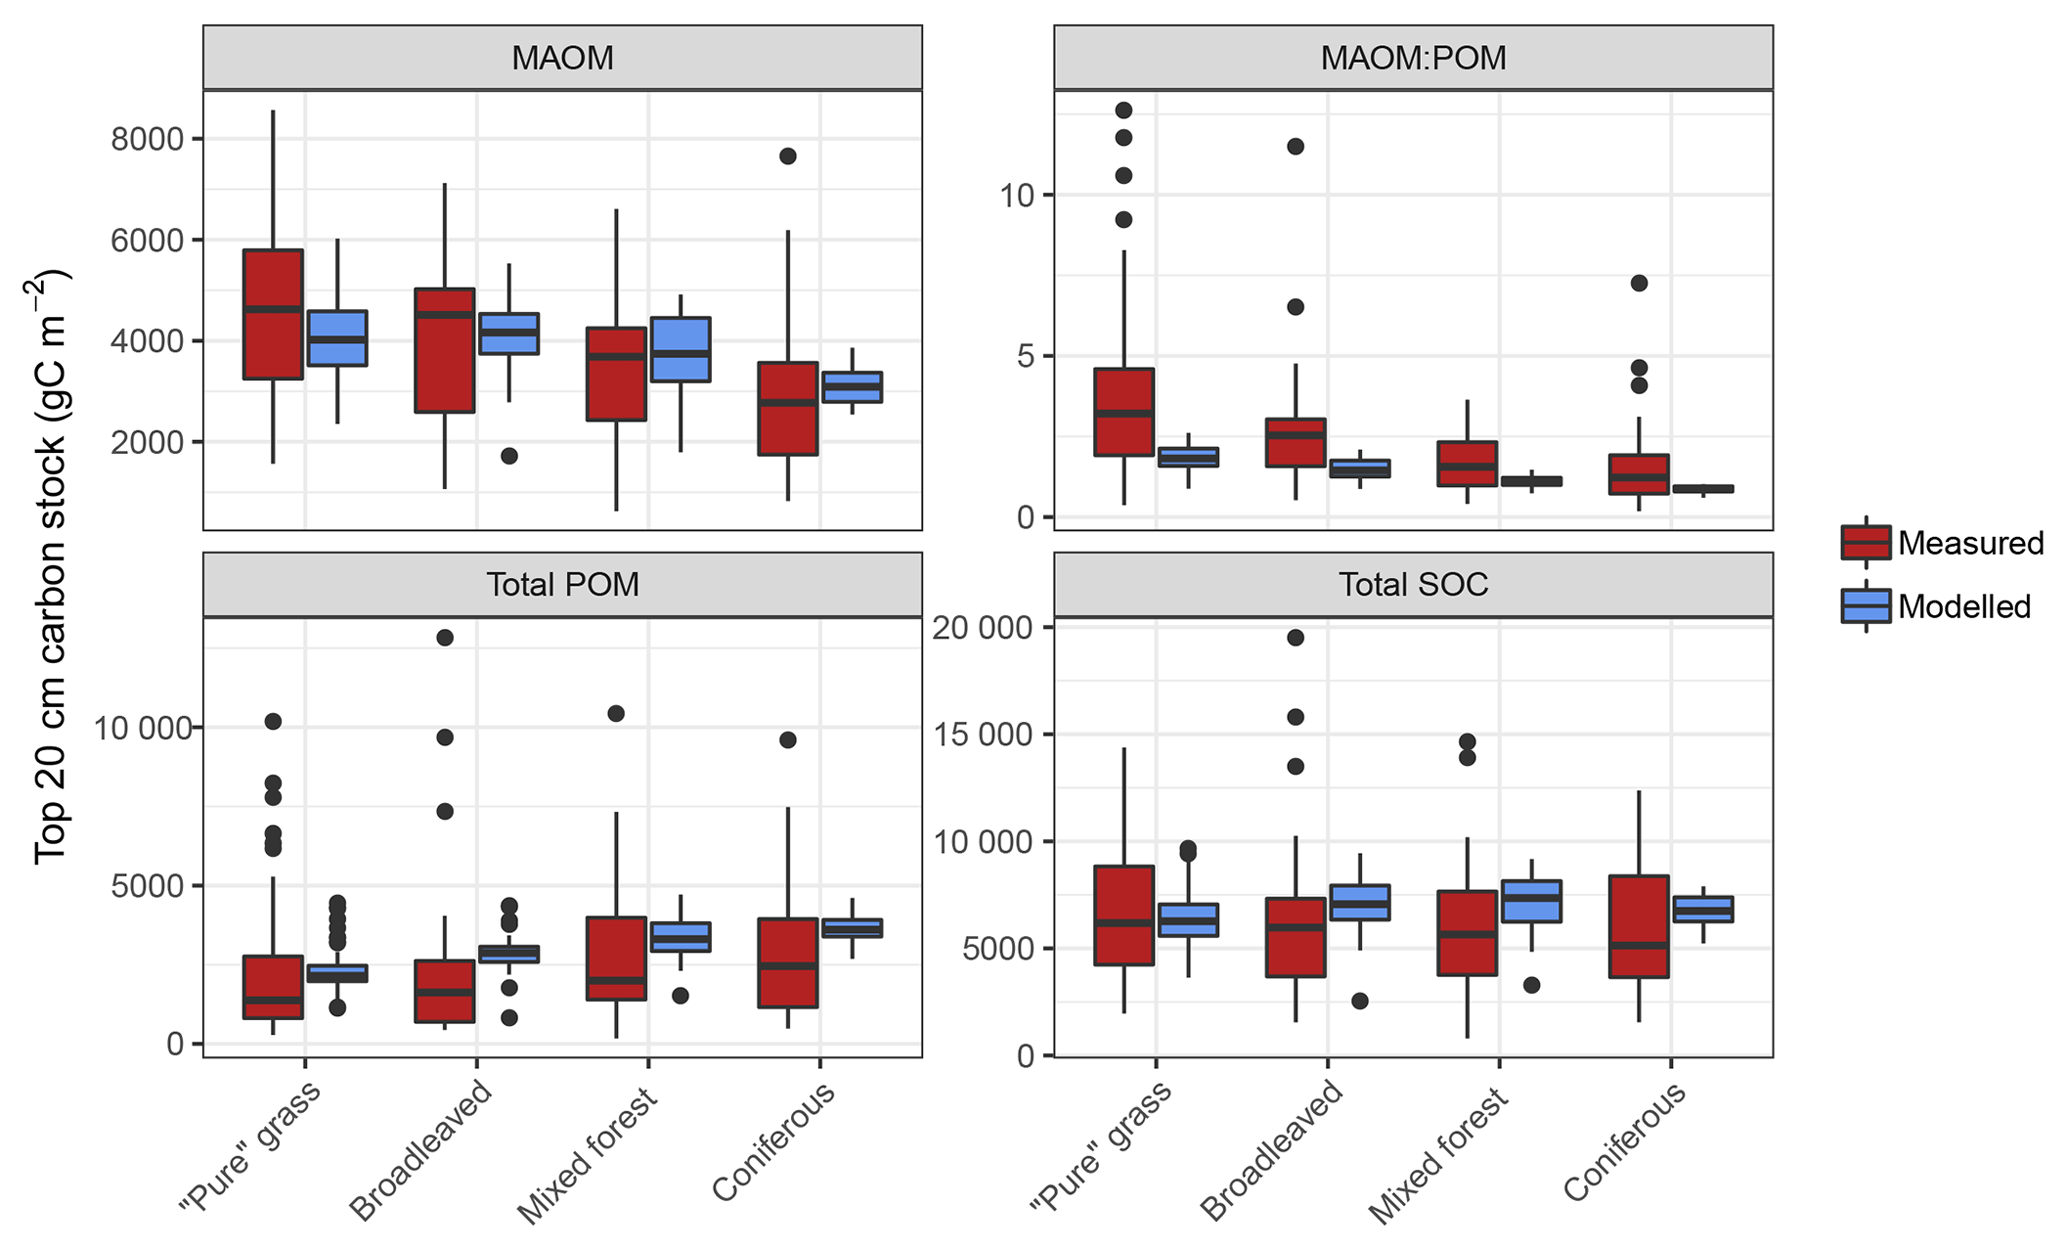
Figure 5Measured and modelled soil C stocks (split into mineral-associated organic matter, MAOM; total particulate organic matter, POM; and total soil organic carbon, SOC) for the forest and grassland land-use classes of the fractionated sites from the LUCAS data set (n=154). Note that the MAOM : POM ratio facet is unitless, not shown by the y-axis label. Also note the free y-axis scales and that total POM is a sum of both light and heavy fractions.
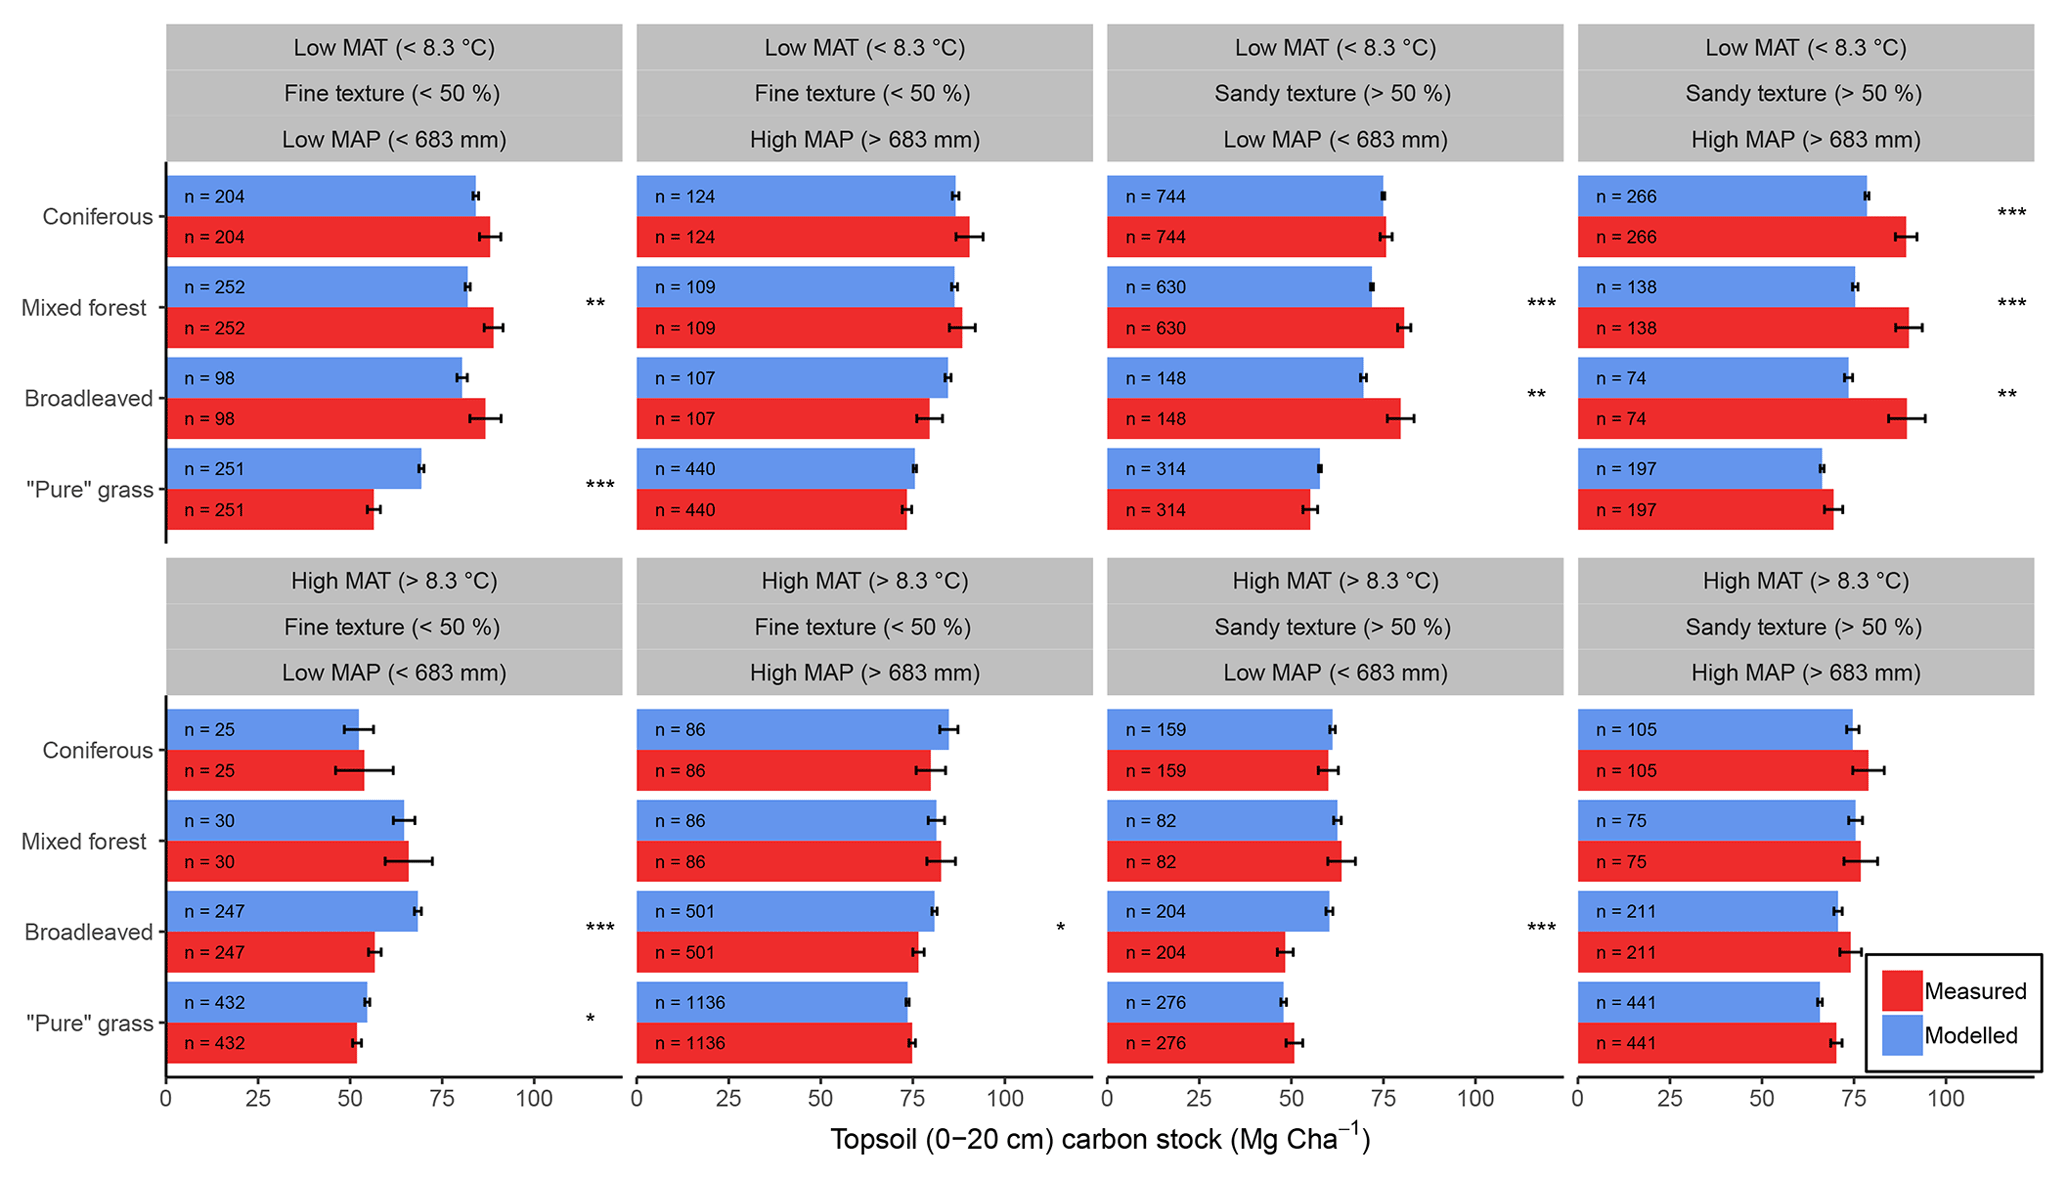
Figure 6Comparisons between average (±1 standard error) measured (red) and modelled (blue) bulk SOC stocks for 8192 forestry and grassland sites over a climatic and edaphic gradient across Europe. Each comparison is partitioned into high and low groups of mean annual precipitation (MAP, top and bottom panels), mean annual temperature (MAT, left and right panels) and soil texture (alternating panels left to right). ANOVA comparisons of means are performed to show significant differences (, , ). Number of samples for each land use and division is shown at the base of each bar.
Measured fractionation data from the four major land-use classes showed a wide range of soil C stocks and a significantly different MAOM : POM ratio between grassland and forests (Figs. 5 and S4). This was predominantly due to grassland topsoil (0–20 cm) having more MAOM and less total POM compared to coniferous soils (Fig. S3). On average, simulations of the fractionated sites agreed well with measured data, demonstrating no significant differences (p>0.05) between measured and modelled C stocks of total POM or bulk soil for all land uses, and for MAOM at broadleaved, mixed and coniferous forest sites (Fig. 5). The only statistically significant difference was between measured and modelled MAOM-C stocks for grassland sites (p<0.01). However, measurements have a considerably larger range between minimum and maximum values than model simulations, particularly for total POM, which largely explained the high overall RMSE when comparing all 154 sites (Table S2).
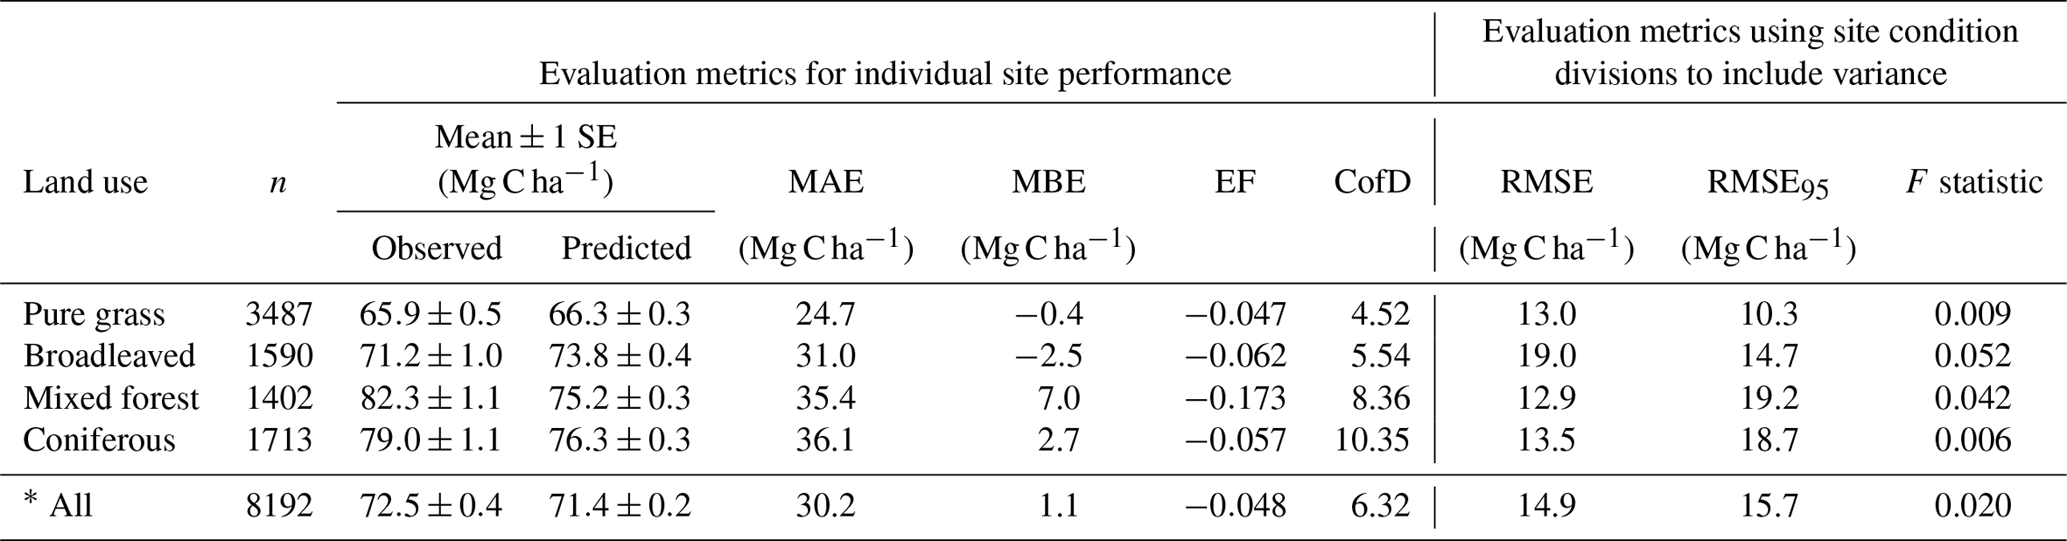
Table 4Evaluation results of comparisons between measured and modelled topsoil (0–20 cm) C stock for 8192 grassland and forest sites across Europe (see Fig. 7 for geographic distribution of residuals). Mean absolute error (MAE) and mean bias error (MBE) describe the overall difference and directional difference between measured and modelled values, respectively. The model is deemed to describe the trend of the measured data better than the mean of the measurements when the modelling efficiency (EF) is positive, or when the coefficient of determination (CofD) is above 1. Each is a discrete evaluation metric. Divisions of high and low site conditions (mean annual temperature, mean annual precipitation, annual C inputs, sand content) were used to derive statistical significance (root mean square error, RMSE, and F statistic) of differences between measured and modelled values while accounting for measurement variance within these divisions. An RMSE value below RMSE95 indicates that simulated C stocks fall within the 95 % confidence interval of the measurements. An F statistic below 0.05 also shows that simulated values are not significantly different to measurements at a 95 % confidence level.
* All sites use 64 divisions (high and low site conditions and land-use type.)
3.3 Model evaluation for forests and grasslands in Europe
Despite only including a few of the many factors that influence SOM dynamics, MEMS v1.0 was able to capture the expected relationships between site conditions and total mineral soil C stocks based on an evaluation of the optimized model with independent data (Fig. 6). Mean absolute error over all sites (n=8192) was low (MBE = 1.1 Mg C ha−1) and CofD was above 1, indicating that the simulated C stocks capture the trend of the measured data better than the mean of the measurements (Table 4). The main lack of fit was observed, as the model consistently underestimated bulk soil C stocks in forest systems with low mean annual temperature (MAT < 8.3 ∘C) and sandy soil textures (sand content > 50 %) (Fig. S6). When divided by land-use classes, grassland sites had the lowest residuals and mixed-forest sites had the highest (Figs. 6 and S6). Using low and high divisions of MAT, MAP, sand content and C input quantity to account for variance between each of these groups (n=16), RMSE indicated that the model predictions of C stocks fell within the 95 % confidence interval of the measurements for coniferous and mixed-forest sites. Using the same groups but also accounting for simulated variance, indicated that the accuracy of MEMS v1.0 predictions were statistically significant for all land uses besides broadleaved forest sites (F statistic > 0.05; Table 4). A geographic analysis of model performance indicated that the model performed best across France and northeastern Europe but poorly across the UK, Ireland and southern Sweden (Fig. 7). Furthermore, topsoil C stocks of broadleaved sites in southeastern Europe, particularly Romania, were consistently overestimated by the model, especially when sites had low MAP (Figs. 6 and 7).
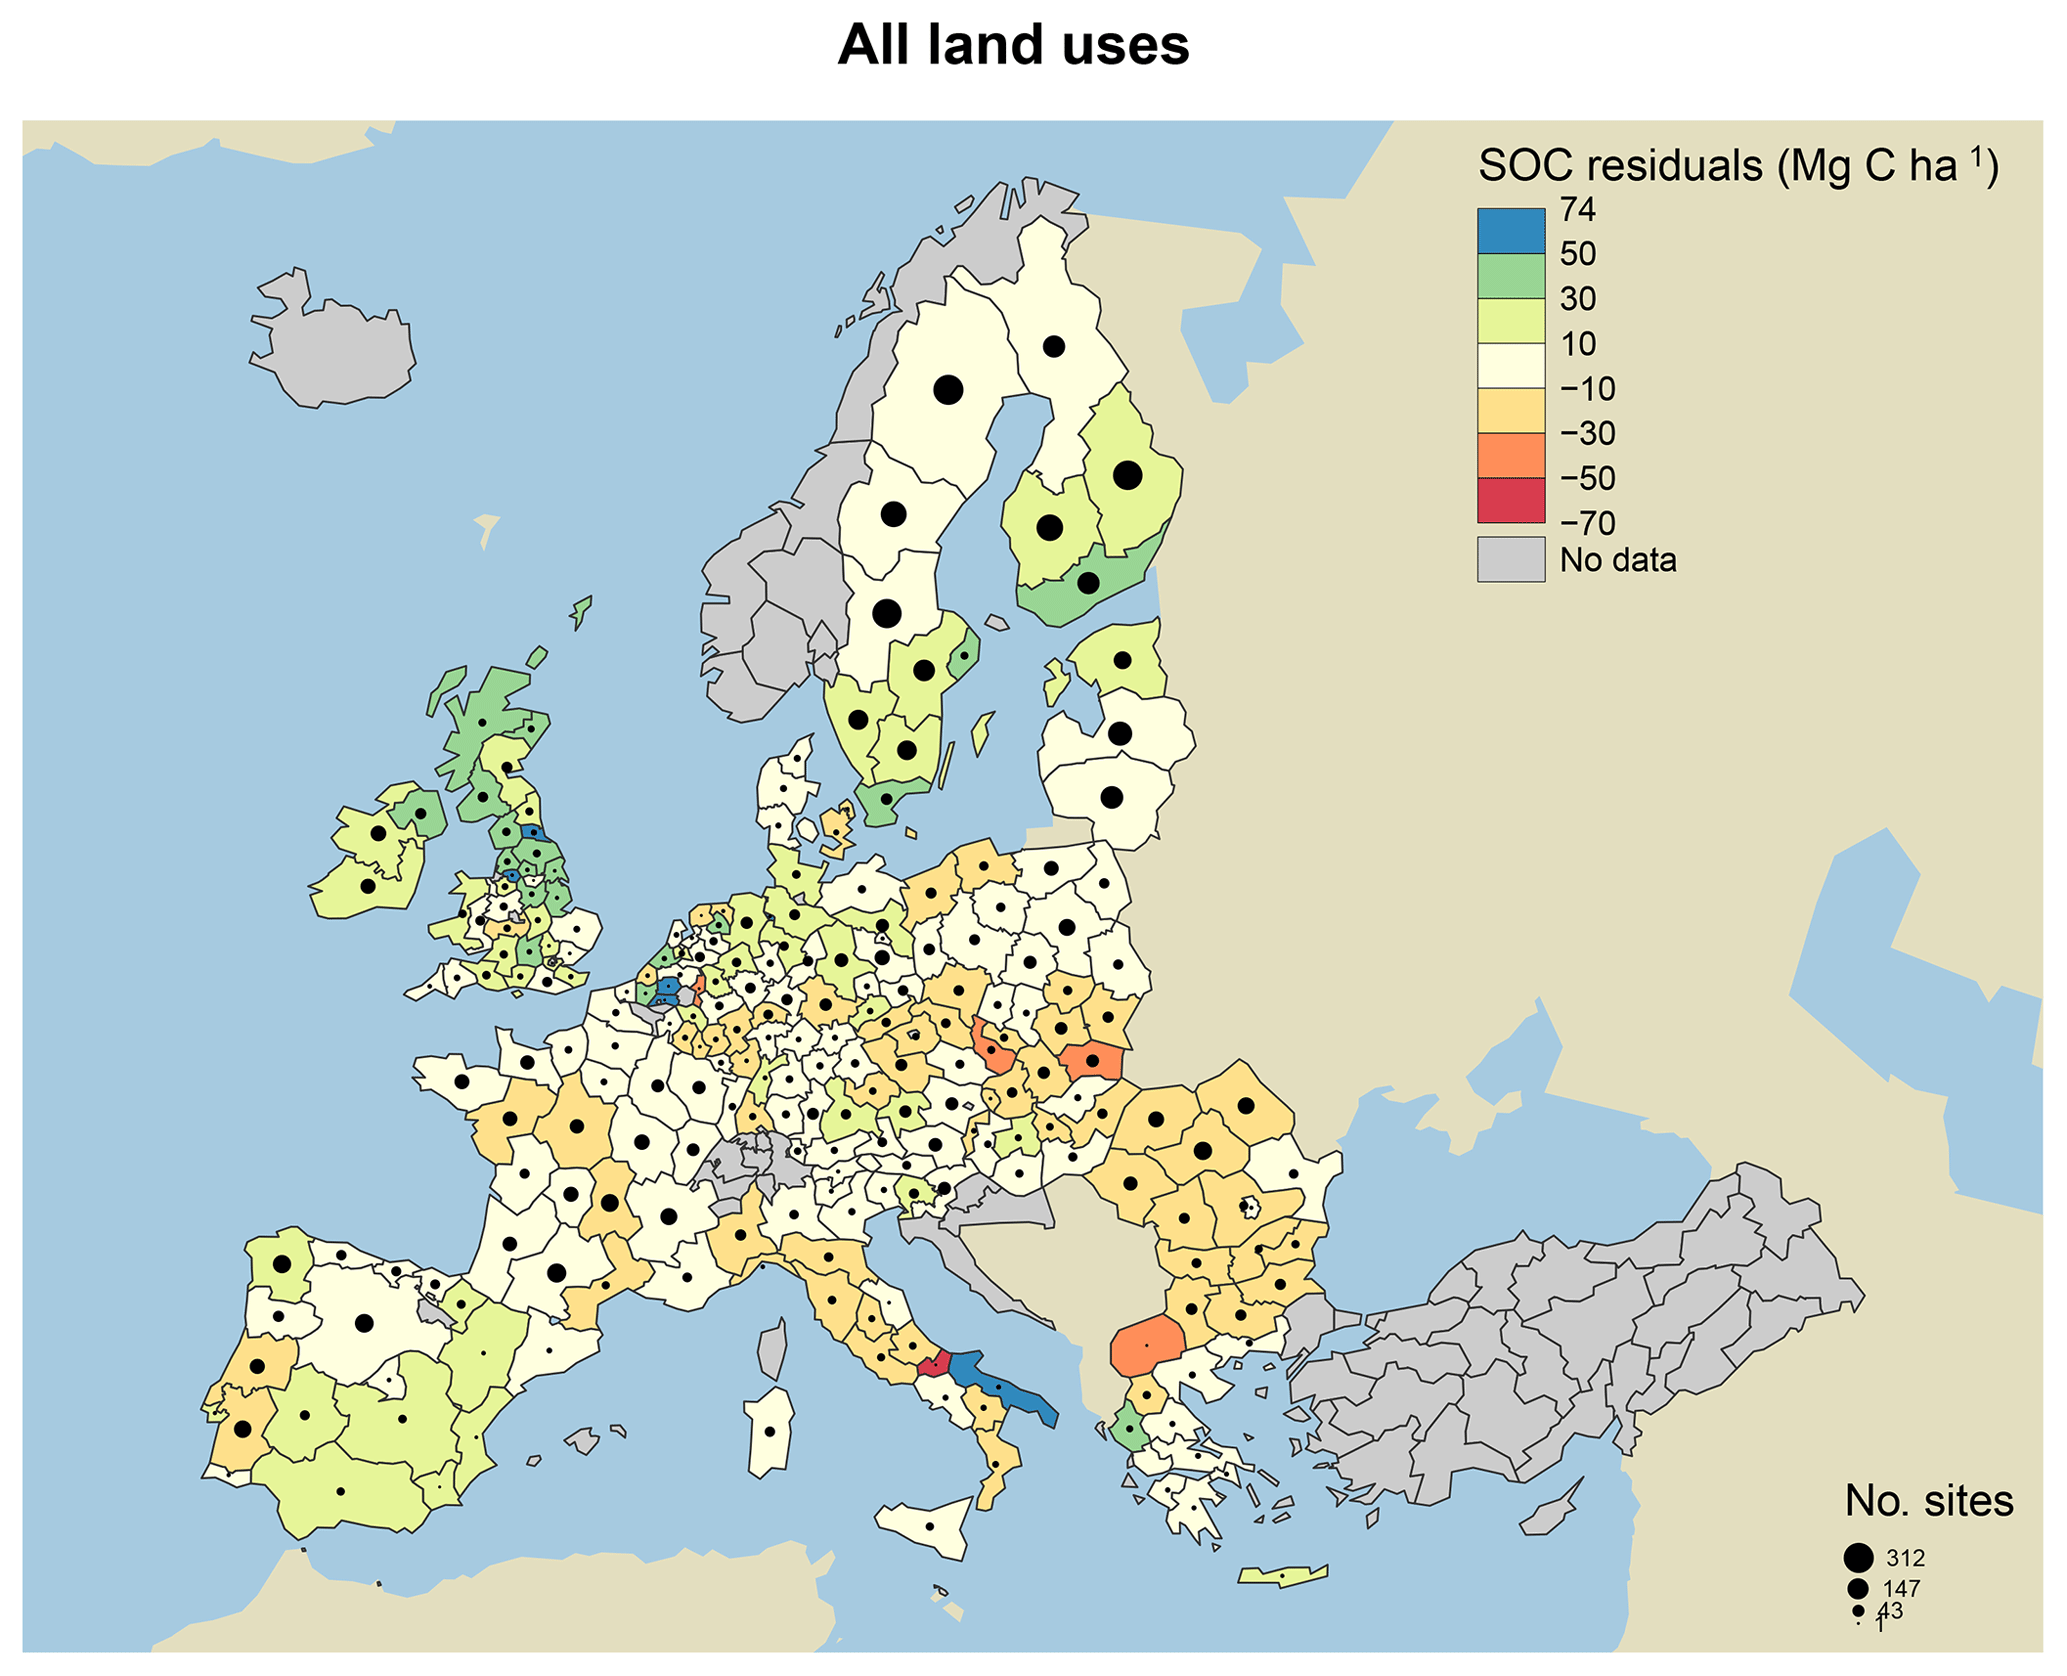
Figure 7Model residuals of topsoil (0–20 cm) C stocks (Mg C ha−1) for 8192 sites (3487 grasslands, 1713 coniferous forests, 1590 broadleaved forests and 1402 mixed forests) across Europe, comparing measured values from the LUCAS database (Toth et al., 2013) to simulated steady-state estimates from the MEMS v1.0 model. All land uses are grouped for averages. Residuals are averaged across all sites within each NUTS2 region (populations between 800 000 and 3 million) and coloured accordingly. Measured site C stocks were subtracted from modelled values, meaning that the model underestimates SOC stocks in positive (blue) regions and overestimates SOC stocks in negative (red) regions. Residuals average to within 10 Mg C ha−1 in areas with the lightest yellow colour. The size of the circles within each region represents the number of sites simulated. Grey regions included no sites.
In general, discrepancies between measured and modelled values were largest for the broadleaved forest land-use class (Fig. S6). Results from analysis of the fractionated sites suggest that the model cannot achieve the very high POM-C stocks measured at some sites. Optimized parameter values aim to produce a good overall model fit but are unlikely to be able to capture the full range of measured values (for example, the lowest bulk topsoil C stock for a broadleaved site was 7 Mg C ha−1, whereas the highest was 218 Mg C ha−1). A summary of model performance at these 8192 evaluation sites is shown in Table 4. While the model's performance comparing absolute C stocks appears good, this is done with the assumption that these topsoil C stocks at forest and grassland sites in our analysis are at steady state. This is unlikely to be true and therefore it is encouraging when general trends are as expected (as is the case for many of the land uses and for many of the different environmental divisions; Fig. 6).
MEMS v1.0 was designed to consolidate recent advances in our understanding of SOM formation and persistence into a parsimonious mathematical model that uses a generalizable structure which, after further development, can be implemented in Ecosystem and Earth System model applications. In this study we aimed to provide proof-of-concept that a model structure built around known biogeochemical mechanisms (Fig. 1) and measurable pools could be advantageous for application over varied site conditions. Another advantage of using this novel structure is that each aspect is empirically quantifiable, allowing for straightforward model evaluation of both total and fractionated SOM, addressing a common concern among conventional SOM models (Campbell and Paustian, 2015).
4.1 Sensitivity and behaviour of MEMS v1.0
The relationships between model driving variables and soil C stocks at steady state highlight the importance of litter chemistry on relative proportions of MAOM and total POM in MEMS v1.0 (Fig. 3). This is generally because both POM pools accumulate C when input litter has a high acid-insoluble fraction and a low N content, resulting from reduced microbial accessibility and reduced DOM production (Scheibe and Gleixner, 2014). This trend is also common in empirical studies and often associated with land-use change from herbaceous to woody vegetation (Filley et al., 2008). Many of the parameters that influence the processes of POM formation and persistence (e.g. LITfrg, Nmid, LCImax) have relatively high importance (i.e. sensitivity) to changes in total SOM within relatively short time frames (i.e. <10 years; Fig. 2). This may potentially capture the important real-world trend that POM is typically more vulnerable to decomposition with disturbance compared to MAOM (Cambardella and Elliott, 1992). However, disturbance impacts were not evaluated in the inaugural study.
One main objective of structuring MEMS v1.0 around empirically defined biogeochemical processes is so that it can accurately represent the timescales on which different processes operate, rather than being solely dependent on turnover times of conceptual pools. This is particularly relevant given our new understanding that the MAOM fraction has short-term dynamics (Jilling et al., 2018). Consequently, it is reassuring to see that this knowledge, which is incorporated into the MEMS v1.0 design, can be seen in Fig. 2 (and Fig. S5), where the parameters that operate on short timescales also have an immediate impact on the MAOM pool given the complexity of controls in the model structure. The model's agreement with the hypothesized relationship from Castellano et al. (2015) is also reassuring, and represents an important proof of concept that associates litter chemistry and C saturation capacity with MAOM-C stocks at steady state (Fig. 4).
4.2 Model evaluation of MEMS v1.0
While average agreement between measured and modelled soil C stocks was very good for MEMS v1.0, the model failed to capture the wide range in total POM-C stocks that were observed at the fractionated LUCAS sites (Fig. 5). This may be because this first version of the model does not include several of the key controls on POM dynamics, such as water/oxygen limitations (Keiluweit et al., 2016), aggregation (Gentile et al., 2011), activity of soil fauna (Frouz, 2018) and nutrient availability (Bu et al., 2015; Averill and Waring, 2018). There are also limitations of our approach given that very few of the sites will likely be under true steady-state conditions, leading to further discrepancies between model predictions and measured values. Furthermore, the variability in driving variables of litter chemistry, N content and root:shoot ratios are underestimated when using our approach of grouping many different land uses into broad classes.
When examining the comparison between measured and modelled bulk soil C stocks for the 8192 forest and grassland sites, residuals were particularly large for high-latitude forestry sites in southern Sweden and the UK (Fig. 7). We hypothesize that this is primarily due to the fact that MEMS v1.0 does not simulate soil moisture controls on decomposition, and temperature effects are applied through a simple function. In reality, these sorts of forest soils are known to have very high total POM-C stocks, resulting from decades of consistent inputs and cold, wet climates, resulting in low decomposition rates (Berg, 2000). Differences between measured and modelled soil C stocks are also likely due to uncertainties with driving variables and specifically the MODIS estimates of NPP. The 2009 NPP data from MODIS were used to estimate the C inputs to soils in our simulations, and these data may not be representative of the average historical C inputs for those sites, which would impact the observed amounts of soil C.
4.3 Improving the parameters of MEMS v1.0
The current iteration of the MEMS model is not intended to be able to simulate all scenarios and environmental conditions, but this study indicates it can be reasonably accurate in simulating forest and grassland sites in Europe under steady-state conditions (Fig. 6; Table 4). That said, several of the parameters in MEMS v1.0 are either poorly constrained or loosely defined in the current model. The LITfrg parameter, for example, defines a fixed litter fragmentation and perturbation rate that transfers C from the structural litter pools (C2 and C3) below ground (to C5 and C10). The global sensitivity analysis of MEMS v1.0 indicates that LITfrg is particularly important for several model pools and total SOC early in a simulation (Figs. 2 and S5). There are several areas of research that may help make this process more mechanistic in MEMS and allow for feedbacks with site conditions (e.g. Scheu and Wolters, 1991; Yoo et al., 2011). One option for generalizing the vertical transport of structural litter into the soil may be to apply a diffusion approach that can be valid on the ecosystem scale, as described in the SOMPROF model (Braakhekke et al., 2011). More empirical data that link site conditions to perturbation processes (e.g. cryoturbation, bioturbation, churning clays) would help with this area of MEMS model development.
As with vertical distribution of physical SOM, the transport of DOM vertically between layers lacks a mechanistic foundation in MEMS v1.0. A noteworthy approach that attempts to simulate this transport while also representing bioturbation through diffusion and sorption-desorption processes is presented in the COMISSION model (Ahrens et al., 2015). While these models apply more mechanistic functions to represent these key processes, one can debate whether the increased complexity and computational demands are necessary. This, of course, depends on the model objectives, and in MEMS v1.0 we have prioritized parsimony and deliberately minimized the number of algorithms and parameters. While the model cannot yet address hypotheses about litter fragmentation or DOM leaching, the generic structure of MEMS v1.0 can incorporate these processes in a more explicit manner in future versions.
Additional parameters of MEMS v1.0 that are poorly constrained include those associated with the LIDEL model. These parameters (specifically those related to DOM generation and microbial assimilation; see Table 2) were estimated using Bayesian analysis that employed empirical data (Soong et al., 2015) but resulted in large posterior distributions with high uncertainty as noted by Campbell et al. (2016). Consequently, more data are required from different litter types to help constrain these parameter values. In particular, the amount of DOM leached from decaying microbial biomass (parameter la2) is particularly important for MAOM formation when the pool is relatively small (<25 years in Fig. 2). MEMS v1.0 currently uses the estimated value from Campbell et al. (2016) for this parameter (0.19 g DOM per g decayed microbial biomass), but it is worth noting that the reported posterior interval width was more than double this value (0.398 g DOM per g decayed microbial biomass). Similarly, the rate of microbial product generation from microbial biomass (parameter B3) was seen to be even more variable (Campbell et al., 2016). Empirically, the rate at which microbial products are generated from microbial turnover is highly variable depending on the microbial community and the site conditions (Xu et al., 2014). While improving these parameters was outside the scope of this study, the path towards improved model performance can be addressed with new empirical data that better inform the model parameters.
4.4 Opportunities for further development in MEMS v1.0
In its current capacity, MEMS v1.0 is far from being able to simulate full ecosystems and is limited in scope regarding the land-use scenarios it can simulate accurately. Specifically, the initial model does not simulate the hydrological or nitrogen cycles and currently operates on a single soil layer. However, MEMS v1.0 has been built to have a modular architecture, with careful consideration given to how additional processes can be addressed through future model development.
The relationship between C and N in soils is fundamental to SOM dynamics (McGill and Cole, 1981), and therefore simulating the N cycle is at the forefront of plans to develop in the MEMS model. Since the MEMS model structure is based on soil fractions that can be physically isolated, each current soil C pool in MEMS v1.0 (i.e. pools C5, C8, C9 and C10) can also have a direct equivalent for N, and be consistent with the fractionation scheme for the C dynamics (Table S1). However, additional pools of nitrate and ammonium (and associated mechanisms to describe N fixation, nitrification and denitrification) are needed to accurately describe plant–soil nutrient feedbacks. This highlights a major objective of future MEMS model development, i.e. to ensure the model can be easily coupled with existing modules that describe other aspects of the ecosystem (e.g. plant growth routines).
Another key feature of MEMS v1.0 is its ability to test specific hypotheses directly against empirical data, such as the effects of soil priming on soil C stocks, effects of microbial feedbacks on OM sorption to mineral surfaces, or the effects of soil fauna on SOM formation. Because each of the existing model pools can be isolated physically and quantified, the rates of flux between these pools can also be quantified with isotopic tracer studies. Not only does this mean parameterization and evaluation data can be generated easily, but also that experiments can be designed with this mathematical framework in mind, specifically generating the data required to develop, evaluate and improve the model. While the current scope of MEMS v1.0 does not address all climate-C feedbacks, it does provide the basis for a more mechanistic model that can simulate SOM dynamics on the ecosystem scale.
As a carbon model designed around the processes that govern SOM formation, MEMS v1.0 provides an analytically tractable framework that can be used to test specific hypotheses by pairing empirical experiments with model simulations. While the inaugural version of this new model has limitations for direct evaluation with real-world measurements, on average, its performance with simulating steady-state conditions equates well with topsoil C stocks measured for ∼8000 forest and grassland sites across Europe. Using a structure that aligns with our contemporary understanding of soil C dynamics, we also show that MEMS v1.0 is capable of accurately proportioning SOM between particulate and mineral-associated fractions by accounting for litter chemistry of the input material. By using litter chemistry to inform SOM formation pathways and edaphic conditions to inform the C-saturation capacity of a soil, MEMS v1.0 also shows consistent trends with experimental findings.
The next steps for MEMS model development will require detailed routines of N and hydrological cycling, as well as additional external drivers of SOM dynamics (e.g. land management practices). To reliably incorporate these aspects in the MEMS model will require effective collaboration between modellers and experimentalists to design studies that can both (i) elucidate the underlying mechanisms that MEMS is built upon and (ii) generate the parameterization and validation data required to reduce model uncertainty. Successful execution of this strategy will help to develop an ecosystem-scale model that can improve assessments of management and policy action on sustainability of soils and associated ecosystem services.
The LUCAS data set is available online (European Soil Data Centre, 2013) along with details of the larger project. The additional MAOM and POM fractionation data for the 154 sites used in this analysis can also be found in the European Soil Data Centre (ESDAC) repository online. Access to model code is currently restricted to those directly collaborating with the MEMS development team. This is to ensure all bugs are caught and treated before release to the public. Detailed information and code relevant to specific questions can be provided upon request.
The supplement related to this article is available online at: https://doi.org/10.5194/bg-16-1225-2019-supplement.
All authors contributed to the conceptualization of the MEMS model framework with MFC, KP and MDW formalizing the original foundational science. The in-practice model structure was then formalized by ADR, MFC, KP, SO and MWD. All model building, coding, statistical analyses and data analysis on the measured fractionation data and all model–measure comparisons were performed by ADR. Guidance on the optimization procedures was provided by SO. The LUCAS database was provided by EL and all initial analysis and preparation of the data (e.g. refining bulk density estimates and NPP values for each site) were performed by EL. The project was overseen by all authors but primarily led by MFC. Funding was initially provided by MDW and later through grants awarded to MFC and KP. The development, testing and evaluation of the model was performed solely by ADR, as was all data presentation apart from the final conceptual diagram (Fig. 1), which was outsourced (see acknowledgments). The manuscript was written and edited by ADR with comments and feedback from all co-authors.
The authors declare that they have no conflict of interest.
This research was supported by a National Science Foundation CAREER grant (number 255228) awarded to MDW, the US DOE Advanced Research Projects Agency-Energy programme (ROOTS project; DE-FOA-00001565), the NSF-DEB award no. 1743237 and the JRC (purchase order D.B720517). The authors like to thank Michelle Haddix for the soil organic matter fractionation work and Yao Zhang for help with regard to various parts of data generation (e.g. climate inputs) and model development. The conceptual figure diagram was redrawn and stylized by Katie Burnet.
This paper was edited by Sébastien Fontaine and reviewed by Thomas Wutzler and one anonymous referee.
Aber, J. D., Melillo, J. M., and McClaugherty, C. A.: Predicting long-term patterns of mass loss, nitrogen dynamics, and soil organic matter formation from initial fine litter chemistry in temperate forest ecosystems, Can. J. Botany, 68, 2201–2208, 1990.
Abramoff, R., Xu, X., Hartman, M., O'Brien, S., Feng, W., Davidson, E., Finzi, A., Moorhead, D., Schimel, J., Torn, M., and Mayes, M. A.: The Millennial model: in search of measurable pools and transformations for modeling soil carbon in the new century, Biogeochemistry, 137, 51–71, 2018.
Ahrens, B., Braakhekke, M. C., Guggenberger, G., Schrumpf, M., and Reichstein, M.: Contribution of sorption, DOC transport and microbial interactions to the 14C age of a soil organic carbon profile: Insights from a calibrated process model, Soil Biol. Biochem., 88, 390–402, 2015.
Allison, S. D.: A trait-based approach for modelling microbial litter decomposition, Ecol. Lett., 15, 1058–1070, 2012.
Allison, S. D., Wallenstein, M. D., and Bradford, M. A.: Soil-carbon response to warming dependent on microbial physiology, Nat. Geosci., 3, 336–340, 2010.
Arora, V. K., Boer, G. J., Friedlingstein, P., Eby, M., Jones, C. D., Christian, J. R., Bonan, G., Bopp, L., Brovkin, V., Cadule, P., Hajima, T., Ilyini, T., Lindsay, K., Tjiputra, J. F., and Wu, T.: Carbon–concentration and carbon–climate feedbacks in CMIP5 Earth system models, J. Climate, 26,, 5289–5314, 2013.
Averill, C. and Waring, B.: Nitrogen limitation of decomposition and decay: How can it occur?, Global Change Biol., 24, 1417–1427, 2018.
Beare, M. H., McNeill, S. J., Curtin, D., Parfitt, R. L., Jones, H. S., Dodd, M. B., and Sharp, J.: Estimating the organic carbon stabilisation capacity and saturation deficit of soils: a New Zealand case study, Biogeochemistry, 120, 71–87, 2014.
Berg, B.: Litter decomposition and organic matter turnover in northern forest soils, Forst Ecol. Manag., 133, 13–22, 2000.
Braakhekke, M. C., Beer, C., Hoosbeek, M. R., Reichstein, M., Kruijt, B., Schrumpf, M., and Kabat, P.: SOMPROF: A vertically explicit soil organic matter model, Ecol. Model., 222, 1712–1730, 2011.
Bradford, M. A., Watts, B. W., and Davies, C. A.: Thermal adaptation of heterotrophic soil respiration in laboratory microcosms, Global Change Biol., 16, 1576–1588, 2010.
Bu, R., Lu, J., Ren, T., Liu, B., Li, X., and Cong, R.: Particulate organic matter affects soil nitrogen mineralization under two crop rotation systems, PLoS One, 10, e0143835, https://doi.org/10.1371/journal.pone.0143835, 2015.
Büks, F. and Kaupenjohann, M.: Enzymatic biofilm digestion in soil aggregates facilitates the release of particulate organic matter by sonication, Soil, 2, 499–509, 2016.
Cambardella, C. A. and Elliott, E. T.: Particulate soil organic-matter changes across a grassland cultivation sequence, Soil Sci. Soc. Am. J., 56, 777–783, 1992.
Campbell, E. E. and Paustian, K.: Current developments in soil organic matter modeling and the expansion of model applications: a review, Environ. Res. Lett., 10, 123004, https://doi.org/10.1088/1748-9326/10/12/123004, 2015.
Campbell, E. E., Parton, W. J., Soong, J. L., Paustian, K., Hobbs, N. T., and Cotrufo, M. F.: Using litter chemistry controls on microbial processes to partition litter carbon fluxes with the litter decomposition and leaching (LIDEL) model, Soil Biol. Biochem., 100, 160–174, 2016.
Canadell, J., Jackson, R. B., Ehleringer, J. B., Mooney, H. A., Sala, O. E., and Schulze, E. D.: Maximum rooting depth of vegetation types at the global scale, Oecologia, 108, 583–595, 1996.
Carrington, E. M., Hernes, P. J., Dyda, R. Y., Plante, A. F., and Six, J.: Biochemical changes across a carbon saturation gradient: lignin, cutin, and suberin decomposition and stabilization in fractionated carbon pools, Soil Biol. Biochem., 47, 179–190, 2012.
Castellano, M. J., Mueller, K. E., Olk, D. C., Sawyer, J. E., and Six, J.: Integrating plant litter quality, soil organic matter stabilization, and the carbon saturation concept, Global Change Biol., 21, 3200–3209, 2015.
Christensen, B. T.: Physical fractionation of soil and organic matter in primary particle size and density separates, in: Advances in soil science, Springer, New York, NY, 1–90, 1992.
Cotrufo, M. F., Soong, J. L., Horton, A. J., Campbell, E. E., Haddix, M. L., Wall, D. H., and Parton, W. J.: Formation of soil organic matter via biochemical and physical pathways of litter mass loss, Nat. Geosci., 8, 776–779, 2015.
Cotrufo, M. F., Wallenstein, M. D., Boot, C. M., Denef, K., and Paul, E.: The Microbial Efficiency-Matrix Stabilization (MEMS) framework integrates plant litter decomposition with soil organic matter stabilization: do labile plant inputs form stable soil organic matter?, Global Change Biol., 19, 988–995, 2013.
Crow, S. E., Swanston, C. W., Lajtha, K., Brooks, J. R., and Keirstead, H.: Density fractionation of forest soils: methodological questions and interpretation of incubation results and turnover time in an ecosystem context, Biogeochemistry, 85, 69–90, 2007.
De Gryze, S., Six, J., Paustian, K., Morris, S. J., Paul, E. A., and Merckx, R.: Soil organic carbon pool changes following land-use conversions, Global Change Biol., 10, 1120–1132, 2004.
Dorodnikov, M., Blagodatskaya, E., Blagodatsky, S., Marhan, S., Fangmeier, A., and Kuzyakov, Y.: Stimulation of microbial extracellular enzyme activities by elevated CO2 depends on soil aggregate size, Global Change Biol., 15, 1603–1614, 2009.
Dungait, J. A., Hopkins, D. W., Gregory, A. S., and Whitmore, A. P.: Soil organic matter turnover is governed by accessibility not recalcitrance, Global Change Biol., 18, 1781–1796, 2012.
Dwivedi, D., Riley, W. J., Torn, M. S., Spycher, N., Maggi, F., and Tang, J. Y.: Mineral properties, microbes, transport, and plant-input profiles control vertical distribution and age of soil carbon stocks, Soil Biol. Biochem., 107, 244–259, 2017.
Elliott, E. T., Paustian, K., and Frey, S. D.: Modeling the measurable or measuring the modelable: A hierarchical approach to isolating meaningful soil organic matter fractionations. In Evaluation of soil organic matter models, Springer, Berlin, Heidelberg, 161–179, 1996.
European Soil Data Centre (ESDAC): LUCAS 2009 TOPSOIL data, European Commission, Joint Research Center, available at: https://esdac.jrc.ec.europa.eu/content/lucas-2009-topsoil-data (last access: 17 March 2019), 2013.
Feng, W.: Testing the soil carbon saturation theory: maximal carbon stabilization and soil organic matter stability as a function of organic carbon inputs, PhD Thesis, University of Pennsylvania, 2012.
Filley, T. R., Boutton, T. W., Liao, J. D., Jastrow, J. D., and Gamblin, D. E.: Chemical changes to nonaggregated particulate soil organic matter following grassland-to-woodland transition in a subtropical savanna, J. Geophys. Res.-Biogeo., 113, G03009, https://doi.org/10.1029/2007JG000564, 2008.
Frouz, J.: Effects of soil macro-and mesofauna on litter decomposition and soil organic matter stabilization, Geoderma, 332, 161–172, 2018.
Gentile, R., Vanlauwe, B., and Six, J.: Litter quality impacts short-but not long-term soil carbon dynamics in soil aggregate fractions, Ecol. Appl., 21, 695–703, 2011.
Gulde, S., Chung, H., Amelung, W., Chang, C., and Six, J.: Soil carbon saturation controls labile and stable carbon pool dynamics, Soil Sci. Soc. Am. J., 72, 605–612, 2008.
Haddix, M. L., Paul, E. A., and Cotrufo, M. F.: Dual, differential isotope labeling shows the preferential movement of labile plant constituents into mineral-bonded soil organic matter, Global Change Biol., 22, 2301–2312, 2016.
Harmon, M. and Domingo J.: A User's Guide to STANDCARB Version 2.0: A Model to Simulate the Carbon Stores in Forest Stands, Department of Forest Science, Oregon State University, Corvallis, 219 pp., 2001.
Heckman, K., Grandy, A. S., Gao, X., Keiluweit, M., Wickings, K., Carpenter, K., Chorover, J., and Rasmussen, C.: Sorptive fractionation of organic matter and formation of organo-hydroxy-aluminum complexes during litter biodegradation in the presence of gibbsite, Geochim. Cosmochim. Ac., 121, 667–683, 2013.
Huang, P. M., Wang, M. K., and Chiu, C. Y.: Soil mineral–organic matter–microbe interactions: impacts on biogeochemical processes and biodiversity in soils, Pedobiologia, 49, 609–635, 2005.
Jackson, R. B., Canadell, J., Ehleringer, J. R., Mooney, H. A., Sala, O. E., and Schulze, E. D.: A global analysis of root distributions for terrestrial biomes, Oecologia, 108, 389–411, 1996.
Jenkinson, D. S.: Studies on the decomposition of plant material in soil, V. The effects of plant cover and soil type on the loss of carbon from 14c labelled ryegrass decomposing under field conditions, J. Soil Sci., 28, 424–434, 1977.
Jenkinson, D. S. and Rayner, J. H.: The turnover of soil organic matter in some of the Rothamsted classical experiments, Soil Sci., 123, 298–305, 1977.
Jilling, A., Keiluweit, M., Contosta, A. R., Frey, S., Schimel, J., Schnecker, J., Smith, R. G., Tieman, L., and Grandy, A. S. Minerals in the rhizosphere: overlooked mediators of soil nitrogen availability to plants and microbes, Biogeochemistry, 139, 103–122, 2018.
Jones, C. and Falloon, P.: Sources of uncertainty in global modelling of future soil organic carbon storage, in: Uncertainties in Environmental Modelling and Consequences for Policy Making, Springer, Dordrecht, 283–315, 2009.
Kalbitz, K., Schwesig, D., Rethemeyer, J., and Matzner, E.: Stabilization of dissolved organic matter by sorption to the mineral soil, Soil Biol. Biochem., 37, 1319–1331, 2005.
Kallenbach, C. M., Frey, S. D., and Grandy, A. S.: Direct evidence for microbial-derived soil organic matter formation and its ecophysiological controls, Nat. Commun., 7, 13630, https://doi.org/10.1038/ncomms13630, 2016.
Keiluweit, M., Nico, P. S., Kleber, M., and Fendorf, S.: Are oxygen limitations under recognized regulators of organic carbon turnover in upland soils?, Biogeochemistry, 127, 157–171, 2016.
Kindler, R., Siemens, J. A. N., Kaiser, K., Walmsley, D. C., Bernhofer, C., Buchmann, N., Cellier, P., Eugster, W., Gleixner, G., Grünwald, T., Heim, A., Ibrom, A., Jones, S. K., Jones, M., Klumpp, K., Kutsch, W., Steenberg Larsen, K., Lehuger, S., Loubet, B., McKenzie, R., Moors, E., Osborne, B., Pilegaard, K., Rebmann, C., Saunders, M., Schmidt, M. W. I., Schrumpf, M., Seyfferth, J., Skiba, U., Soussana, J.-F., Sutton, M. A., Tefs, C., Vowinckel, B., Zeeman, M. J., and Kaupenjohann, M.: Dissolved carbon leaching from soil is a crucial component of the net ecosystem carbon balance, Global Change Biol., 17, 1167–1185, 2011.
Kirschbaum, M. U. and Paul, K. I.: Modelling C and N dynamics in forest soils with a modified version of the CENTURY model, Soil Biol. Biochem., 34, 341–354, 2002.
Kleber, M., Nico, P. S., Plante, A., Filley, T., Kramer, M., Swanston, C., and Sollins, P.: Old and stable soil organic matter is not necessarily chemically recalcitrant: implications for modeling concepts and temperature sensitivity, Global Change Biol., 17, 1097–1107, 2011.
Klotzbücher, T., Kaiser, K., Guggenberger, G., Gatzek, C., and Kalbitz, K.: A new conceptual model for the fate of lignin in decomposing plant litter, Ecology, 92, 1052–1062, 2011.
Kögel-Knabner, I., Guggenberger, G., Kleber, M., Kandeler, E., Kalbitz, K., Scheu, S., Eusterhues, K., and Leinweber, P.: Organo-mineral associations in temperate soils: Integrating biology, mineralogy, and organic matter chemistry, J. Plant Nutr. Soil Sci., 171, 61–82, 2008.
Kolka, R., Weishampel, P., and Fröberg, M.: Measurement and importance of dissolved organic carbon, in: Field measurements for forest carbon monitoring, Springer, Dordrecht, 171–176, 2008.
Kothawala, D. N., Moore, T. R., and Hendershot, W. H.: Adsorption of dissolved organic carbon to mineral soils: A comparison of four isotherm approaches, Geoderma, 148, 43–50, 2008.
Kothawala, D. N., Moore, T. R., and Hendershot, W. H.: Soil properties controlling the adsorption of dissolved organic carbon to mineral soils, Soil Sci. Soc. Am. J., 73, 1831–1842, 2009.
Kothawala, D. N., Roehm, C., Blodau, C., and Moore, T. R.: Selective adsorption of dissolved organic matter to mineral soils, Geoderma, 189, 334–342, 2012.
Kuhn, M. and Johnson, K.: Applied predictive modeling, vol. 26, New York, Springer, 2013.
Kuzyakov, Y.: Priming effects: interactions between living and dead organic matter, Soil Biol. Biochem., 42, 1363–1371, 2010.
Lawrence, C. R., Neff, J. C., and Schimel, J. P.: Does adding microbial mechanisms of decomposition improve soil organic matter models? A comparison of four models using data from a pulsed rewetting experiment, Soil Biol. Biochem., 41, 1923–1934, 2009.
Lehmann, J. and Kleber, M.: The contentious nature of soil organic matter, Nature, 528, 60–68, 2015.
Li, C., Frolking, S., and Frolking, T. A.: A model of nitrous oxide evolution from soil driven by rainfall events: 1. Model structure and sensitivity, J. Geophys. Res.-Atmos., 97, 9759–9776, 1992.
Liang, C., Schimel, J. P., and Jastrow, J. D.: The importance of anabolism in microbial control over soil carbon storage, Nat. Microbiol., 2, 17105, https://doi.org/10.1038/nmicrobiol.2017.105, 2017.
Ludwig, M., Achtenhagen, J., Miltner, A., Eckhardt, K. U., Leinweber, P., Emmerling, C., and Thiele-Bruhn, S.: Microbial contribution to SOM quantity and quality in density fractions of temperate arable soils, Soil Biol. Biochem., 81, 311–322, 2015.
Luo, Y., Ahlström, A., Allison, S. D., Batjes, N. H., Brovkin, V., Carvalhais, N., Chappell, A., Ciais, P., Davidson, E. A., Finzi, A., Georgiou, K., Guenet, B., Hararuk, O., Harden, J. W., He, Y., Hopkins, F., Jiang, L., Koven, C., Jackson, R. B., Jones, C. D., Lara, M.J., Liang, J., McGuire, A. D., Parton, W., Peng, C., Randerson, J. T., Salazar, A., Sierra, C. A., Smith, M. J., Tian, H., Todd-Brown, K. E. O., Torn, M., van Groenigen K. J., Wang, Y. P., West, T. O., Wei, Y., Wieder, W. R., Xia, J., Xu, X., Xu, X., and Zhou, T.: Toward more realistic projections of soil carbon dynamics by Earth system models, Global Biogeochem. Cy., 30, 40–56, 2016.
Lützow, M. V., Kögel-Knabner, I., Ekschmitt, K., Matzner, E., Guggenberger, G., Marschner, B., and Flessa, H.: Stabilization of organic matter in temperate soils: mechanisms and their relevance under different soil conditions–a review, Eur. J. Soil Sci., 57, 426–445, 2006.
Malamoud, K., McBratney, A. B., Minasny, B., and Field, D. J.: Modelling how carbon affects soil structure, Geoderma, 149, 19–26, 2009.
Manzoni, S., Jackson, R. B., Trofymow, J. A., and Porporato, A.: The global stoichiometry of litter nitrogen mineralization, Science, 321, 684–686, 2008.
Manzoni, S., Moyano, F., Kätterer, T., and Schimel, J.: Modeling coupled enzymatic and solute transport controls on decomposition in drying soils, Soil Biol. Biochem., 95, 275–287, 2016.
Marschner, B., Brodowski, S., Dreves, A., Gleixner, G., Gude, A., Grootes, P. M., Hamer, U., Heim, A., Jandl, G., Ji, R., Kaiser, K., Kalbitz, K., Kramer, C., Leinweber, P., Rethemeyer, J., Schäffer, A., Schmidt, M. W. I, Schwark, L., and Weisenberg, G. L. B.: How relevant is recalcitrance for the stabilization of organic matter in soils?, J. Plant Nutr. Soil Sc., 171, 91–110, 2008.
Mayes, M. A., Heal, K. R., Brandt, C. C., Phillips, J. R., and Jardine, P. M.: Relation between soil order and sorption of dissolved organic carbon in temperate subsoils, Soil Sci. Soc. Am. J., 76, 1027–1037, 2012.
McGill, W. B. and Cole, C. V.: Comparative aspects of cycling of organic C, N, S and P through soil organic matter, Geoderma, 26, 267–286, 1981.
McGill, W., Hunt, H., Woodmansee, R., and Reuss, J.: Phoenix, a model of the dynamics of carbon and nitrogen in grassland soils Terrestrial Nitrogen Cycles, Ecological Bulletins, Swedish Natural Science Research Council, Stockholm, Sweden, 49–115, 1981.
Miki, T., Ushio, M., Fukui, S., and Kondoh, M.: Functional diversity of microbial decomposers facilitates plant coexistence in a plant–microbe–soil feedback model, P. Natl. Acad. Sci. USA, 107, 14251–14256, 2010.
Mikutta, R., Kleber, M., Torn, M. S., and Jahn, R.: Stabilization of soil organic matter: association with minerals or chemical recalcitrance?, Biogeochemistry, 77, 25–56, 2006.
Moorhead, D. L., Lashermes, G., Sinsabaugh, R. L., and Weintraub, M. N.: Calculating co-metabolic costs of lignin decay and their impacts on carbon use efficiency, Soil Biol. Biochem., 66, 17–19, 2013.
Moorhead, D., Lashermes, G., Recous, S., and Bertrand, I.: Interacting microbe and litter quality controls on litter decomposition: a modeling analysis, PloS one, 9, e108769, https://doi.org/10.1371/journal.pone.0108769, 2014.
NOAA: CPC Global Temperature data provided by the NOAA/OAR/ESRL PSD, Boulder, Colorado, USA, available: https://www.esrl.noaa.gov/psd/ (last access: 17 March 2019), 2018.
ORNL DAAC: MODIS and VIIRS Land Products Global Subsetting and Visualization Tool, ORNL DAAC, Oak Ridge, Tennessee, USA, Subset obtained for MOD13Q1 product at various sites in Spatial Range: N = 70.00N, S = 20.00N, E = 35.00, W W, time period: 2009 to 2009, and subset size: 0.25 × 0.25 km, available at: https://daac.ornl.gov/LAND_VAL/guides/MODIS_Global_C5.html (last access: 20 March 2016), 2009.
Parton, W. J., Schimel, D. S., Cole, C. V., and Ojima, D. S.: Analysis of factors controlling soil organic matter levels in Great Plains Grasslands 1, Soil Sci. Soc. Am. J., 51, 1173–1179, 1987.
Paton, T., Humphreys, G. S., and Mitchell, P.: Soils: A New Global View, Yale University Press, New Haven, chap. 3, Bioturbation, 33–67, 1995.
Paul, E. A. and van Veen, J. A.: The use of tracers to determine the dynamic nature of organic matter, Trans. 11th Int. Congress of Soil Science, 3, 61–102, 1978.
Poeplau, C.: Estimating root: shoot ratio and soil carbon inputs in temperate grasslands with the RothC model, Plant Soil, 407, 293–305, 2016.
Poeplau, C. and Don, A.: Sensitivity of soil organic carbon stocks and fractions to different land-use changes across Europe, Geoderma, 192, 189–201, 2013.
Poeplau, C., Don, A., Six, J., Kaiser, M., Benbi, D., Chenu, C., Cotrufo, M. F., Derrien, D., Gioacchini, P., Grand., S., Gregorich, E., Griepentrog, M., Gunina, A., Haddix, M., Kuzyakov, Y., Kühnel, A., Macdonald, L. M., Soong, J., Trigalet, S., Vermeire, M.-L., Rovira, P., van Wesemael, B., Wiesmeier, M., Yeasmin, S., Yevdokimov, I., and Nieder, R.: Isolating organic carbon fractions with varying turnover rates in temperate agricultural soils – A comprehensive method comparison, Soil Biol. Biochem., 125, 10–26, 2018.
Poeplau, C., Kätterer, T., Leblans, N. I., and Sigurdsson, B. D.: Sensitivity of soil carbon fractions and their specific stabilization mechanisms to extreme soil warming in a subarctic grassland, Global Change Biol., 23, 1316–1327, 2017.
R Core Team: R: A language and environment for statistical computing. R Foundation for Statistical Computing, Vienna, Austria, available at: https://www.R-project.org/ (last access: 17 March 2019), 2018.
Saltelli, A., Ratto, M., Andres, T., Campolongo, F., Cariboni, J., Gatelli, D., Saisana, M., and Tarantola, S.: Global sensitivity analysis: the primer, John Wiley and Sons, 2008.
Scheibe, A. and Gleixner, G.: Influence of litter diversity on dissolved organic matter release and soil carbon formation in a mixed beech forest, PloS one, 9, e114040, https://doi.org/10.1371/journal.pone.0114040, 2014.
Scheu, S. and Wolters, V.: Influence of fragmentation and bioturbation on the decomposition of 14C-labelled beech leaf litter, Soil Biol. Biochem., 23, 1029–1034, 1991.
Schmidt, M. W., Torn, M. S., Abiven, S., Dittmar, T., Guggenberger, G., Janssens, I. A., Kleber, M., Kögel-Knabner, I., Lehmann, J., Manning, D. A. C., Nannipieri, P., Rasse, D. P., Weiner, S., and Trumbore, S. E.: Persistence of soil organic matter as an ecosystem property, Nature, 478, 49–56, 2011.
Setia, R., Verma, S. L., and Marschner, P.: Measuring microbial biomass carbon by direct extraction–comparison with chloroform fumigation-extraction, Eur. J. Soil Biol., 53, 103–106, 2012.
Sierra, C. A., Malghani, S., and Müller, M.: Model structure and parameter identification of soil organic matter models, Soil Biol. Biochem., 90, 197–203, 2015.
Sima, N. Q., Harmel, R. D., Fang, Q. X., Ma, L., and Andales, A. A.: A modified F-test for evaluating model performance by including both experimental and simulation uncertainties, Environ. Model. Softw., 104, 236–248, 2018.
Sinsabaugh, R. L., Manzoni, S., Moorhead, D. L., and Richter, A.: Carbon use efficiency of microbial communities: stoichiometry, methodology and modelling, Ecol. Lett., 16, 930–939, 2013.
Six, J., Conant, R. T., Paul, E. A., and Paustian, K.: Stabilization mechanisms of soil organic matter: implications for C-saturation of soils, Plant Soil, 241, 155–176, 2002.
Smith, P., Smith, J. U., Powlson, D. S., McGill, W. B., Arah, J. R. M., Chertov, O. G., Coleman, K., Franko, U., Frolking, S., Jenkinson, D. S., Jensen, L. S., Kelly, R. H., Klein-Gunnewiek, H., Komarov, A. S., Li, C., Molina, J. A. E., Mueller, T., Parton, W. J., Thornley, J. H. M., and Whitmore, A. P.: A comparison of the performance of nine soil organic matter models using datasets from seven long-term experiments, Geoderma, 81, 153–225, 1997.
Sobol, I. M.: Global sensitivity indices for nonlinear mathematical models and their Monte Carlo estimates, Math. Comput. Simulat., 55, 271–280, 2001.
Soetaert, K., Petzoldt, T., and Setzer, R. W.: Solving Differential Equations in R: Package deSolve, J. Stat. Softw., 33, 1–25, 2010.
Soong, J. L., Parton, W. J., Calderon, F., Campbell, E. E., and Cotrufo, M. F.: A new conceptual model on the fate and controls of fresh and pyrolized plant litter decomposition, Biogeochemistry, 124, 27–44, 2015.
Soong, J. L., Vandegehuchte, M. L., Horton, A. J., Nielsen, U. N., Denef, K., Shaw, E. A., de Tomasel, C. M., Parton, W., Wall, D. H., and Cotrufo, M. F.: Soil microarthropods support ecosystem productivity and soil C accrual: evidence from a litter decomposition study in the tallgrass prairie, Soil Biol. Biochem., 92, 230–238, 2016.
Sokol, N. W., Sanderman, J., and Bradford, M. A.: Pathways of mineral-associated soil organic matter formation: Integrating the role of plant carbon source, chemistry, and point of entry, Global Change Biol.. https://doi.org/10.1111/gcb.14482, 2018.
Stewart, C. E., Paustian, K., Conant, R. T., Plante, A. F., and Six, J.: Soil carbon saturation: concept, evidence and evaluation, Biogeochemistry, 86, 19–31, 2007.
Stewart, C. E., Plante, A. F., Paustian, K., Conant, R. T., and Six, J.: Soil Carbon Saturation: Linking Concept and Measurable Carbon Pools, Soil Sci. Soc. Am. J., 72, 379–392, 2008.
Stockmann, U., Adams, M. A., Crawford, J. W., Field, D. J., Henakaarchchi, N., Jenkins, M., Minasny, B., McBratney, A. B., de Remy de Courchelles, V., Singh, K., Wheeler, I., Abbott, L., Angers, D. A., Baldock, J., Bird, M., Brookes, P. C., Chenu, C., Jastrow, J. D., Lal, R., Lehmann, J., O'Donnell, A. G., Parton, W. J., Whitehead, D., and Zimmermann, M.: The knowns, known unknowns and unknowns of sequestration of soil organic carbon, Agr. Ecosyst. Environ., 164, 80–99, 2013.
Stout, J. D. and O'Brien, B. J.: Factors affecting radiocarbon enrichment in soil and the turnover of soil organic matter, Proceedings of the 8th International Conference on Radiocarbon Dating, Wellington, New Zealand, 2, 394–407, 1973.
Subke, J. A., Inglima, I., and Francesca Cotrufo, M.: Trends and methodological impacts in soil CO2 efflux partitioning: a metaanalytical review, Global Change Biol., 12, 921–943, 2006.
Swift, M. J., Heal, O. W., Anderson, J. M., and Anderson, J. M.: Decomposition in terrestrial ecosystems, Vol. 5, University of California Press, 1979.
Tan, Z., Lal, R., Owens, L., and Izaurralde, R. C.: Distribution of light and heavy fractions of soil organic carbon as related to land use and tillage practice, Soil Till. Res., 92, 53–59, 2007.
Tappi: Water solubility of wood and pulp. Test method T204 (or 207), Technical Association of the Pulp and Paper Industry, Atlanta, 1981.
Toth, G., Jones, A., Montanarella, L.: LUCAS Topsoil Survey – methodology, data and results, in: JRC Technical Reports, European Union, Luxemburg, 2013.
Treseder, K. K., Balser, T. C., Bradford, M. A., Brodie, E. L., Dubinsky, E. A., Eviner, V. T., Hofmockel, K. S., Lennon, J. T., Levine, U. Y., MacGregor, B. J., Pett-Ridge, J., and Waldrop, M. P.: Integrating microbial ecology into ecosystem models: challenges and priorities, Biogeochemistry, 109, 7–18, 2012.
Trumbore, S. E., Schiff, S. L., Aravena, R., and Elgood, R.: Sources and transformation of dissolved organic carbon in the Harp Lake forested catchment: the role of soils, Radiocarbon, 34, 626–635, 1992.
Van Soest, P. J., Robertson, J. B., and Lewis, B. A.: Methods for dietary fiber, neutral detergent fiber, and nonstarch polysaccharides in relation to animal nutrition, J. Dairy Sci., 74, 3583–3597, 1991.
Van Soest, P. J. and Wine, R. H.: Determination of lignin and cellulose in acid-detergent fiber with permanganate, J. AOAC, 51, 780–785, 1968.
Větrovský, T., Steffen, K. T., and Baldrian, P.: Potential of cometabolic transformation of polysaccharides and lignin in lignocellulose by soil Actinobacteria, PLoS One, 9, e89108, https://doi.org/10.1371/journal.pone.0089108, 2014.
von Lützow, M., Kögel-Knabner, I., Ekschmitt, K., Flessa, H., Guggenberger, G., Matzner, E., and Marschner, B.: SOM fractionation methods: relevance to functional pools and to stabilization mechanisms, Soil Biol. Biochem., 39, 2183–2207, 2007.
Wallenstein, M. D. and Hall, E. K.: A trait-based framework for predicting when and where microbial adaptation to climate change will affect ecosystem functioning, Biogeochemistry, 109, 35–47, 2012.
Wander, M.: Soil organic matter fractions and their relevance to soil function. Soil organic matter in sustainable agriculture, CRC Press, Boca Raton, FL, 67–102, 2004.
Wang, G., Post, W. M., and Mayes, M. A.: Development of microbial-enzyme-mediated decomposition model parameters through steady-state and dynamic analyses, Ecol. Appl., 23, 255–272, 2013.
Waring, B. G., Averill, C., and Hawkes, C. V.: Differences in fungal and bacterial physiology alter soil carbon and nitrogen cycling: insights from meta-analysis and theoretical models, Ecol. Lett., 16, 887–894, 2013.
Wieder, W. R., Allison, S. D., Davidson, E. A., Georgiou, K., Hararuk, O., He, Y., Hopkins, F., Luo, Y., Smith, M. J., Sulman, B., Todd-Brown, K., Wang, Y.-P., Xia, J., and Xu, X.: Explicitly representing soil microbial processes in Earth system models, Global Biogeochem. Cy., 29, 1782–1800, 2015.
Wieder, W. R., Bonan, G. B., and Allison, S. D.: Global soil carbon projections are improved by modelling microbial processes, Nat. Clim. Change, 3, 909–912, 2013.
Wieder, W. R., Grandy, A. S., Kallenbach, C. M., and Bonan, G. B.: Integrating microbial physiology and physio-chemical principles in soils with the MIcrobial-MIneral Carbon Stabilization (MIMICS) model, Biogeosciences, 11, 3899–3917, https://doi.org/10.5194/bg-11-3899-2014, 2014.
Williams, J. R., Jones, C. A., and Dyke, P. T.: A modeling approach to determining the relationship between erosion and soil productivity, T. ASAE, 27, 129–144, 1984.
Xu, X., Schimel, J. P., Thornton, P. E., Song, X., Yuan, F., and Goswami, S.: Substrate and environmental controls on microbial assimilation of soil organic carbon: a framework for Earth system models, Ecol. Lett., 17, 547–555, 2014.
Yoo, K., Ji, J., Aufdenkampe, A., and Klaminder, J.: Rates of soil mixing and associated carbon fluxes in a forest versus tilled agricultural field: Implications for modeling the soil carbon cycle, J. Geophys. Res.-Biogeo., 116, G01014, https://doi.org/10.1029/2010JG001304, 2011.
Zimmermann, M., Leifeld, J., Schmidt, M. W. I., Smith, P., and Fuhrer, J.: Measured soil organic matter fractions can be related to pools in the RothC model, Eur. J. Soil Sci., 58, 658–667, 2007.