the Creative Commons Attribution 4.0 License.
the Creative Commons Attribution 4.0 License.
 | 11 Apr 2019
Partitioning net ecosystem exchange of CO2 on the pedon scale in the Lena River Delta, Siberia
Tim Eckhardt
Christian Knoblauch
Lars Kutzbach
David Holl
Gillian Simpson
Evgeny Abakumov
Eva-Maria Pfeiffer
Arctic tundra ecosystems are currently facing amplified rates of climate warming. Since these ecosystems store significant amounts of soil organic carbon, which can be mineralized to carbon dioxide (CO2) and methane (CH4), rising temperatures may cause increasing greenhouse gas fluxes to the atmosphere. To understand how net the ecosystem exchange (NEE) of CO2 will respond to changing climatic and environmental conditions, it is necessary to understand the individual responses of the processes contributing to NEE. Therefore, this study aimed to partition NEE at the soil–plant–atmosphere interface in an arctic tundra ecosystem and to identify the main environmental drivers of these fluxes. NEE was partitioned into gross primary productivity (GPP) and ecosystem respiration (Reco) and further into autotrophic (RA) and heterotrophic respiration (RH). The study examined CO2 flux data collected during the growing season in 2015 using closed-chamber measurements in a polygonal tundra landscape in the Lena River Delta, northeastern Siberia. To capture the influence of soil hydrology on CO2 fluxes, measurements were conducted at a water-saturated polygon center and a well-drained polygon rim. These chamber-measured fluxes were used to model NEE, GPP, Reco, RH, RA, and net primary production (NPP) at the pedon scale (1–10 m) and to determine cumulative growing season fluxes. Here, the response of in situ measured RA and RH fluxes from permafrost-affected soils of the polygonal tundra to hydrological conditions have been examined. Although changes in the water table depth at the polygon center sites did not affect CO2 fluxes from RH, rising water tables were linked to reduced CO2 fluxes from RA. Furthermore, this work found the polygonal tundra in the Lena River Delta to be a net sink for atmospheric CO2 during the growing season. The NEE at the wet, depressed polygon center was more than twice that at the drier polygon rim. These differences between the two sites were caused by higher GPP fluxes due to a higher vascular plant density and lower Reco fluxes due to oxygen limitation under water-saturated conditions at the polygon center in comparison to the rim. Hence, soil hydrological conditions were one of the key drivers for the different CO2 fluxes across this highly heterogeneous tundra landscape.
- Article
(6754 KB) - Full-text XML
- BibTeX
- EndNote


An estimated 1000 Pg (petagrams) of organic carbon (OC) are stored in the upper 3 m of northern permafrost-affected soils (Hugelius et al., 2014). Given the large amount of OC stored in these soils, the response of the arctic carbon cycle to a changing climate is of global importance (McGuire et al., 2009). Over thousands of years, carbon has been sequestered in permafrost-affected soils and sediments due to cold conditions and poor drainage, resulting in water saturation and slow organic matter decomposition. Currently, arctic ecosystems are facing amplified warming (AMAP, 2017; Taylor et al., 2013), which will lead to the longer and deeper thawing of permafrost-affected soils (Romanovsky et al., 2010). On the one hand, the microbial decomposition of newly available thawed permafrost organic matter releases carbon dioxide (CO2) and methane (CH4) (e.g., Knoblauch et al., 2018, 2013; Zimov et al., 2006a; Schuur et al., 2009; Grosse et al., 2011). On the other hand, higher temperatures increase the assimilation of CO2 by tundra vegetation due to a prolonged growing period and increased nutrient availability in the deeper layers of thawed soils (e.g., Beermann et al., 2017; Elmendorf et al., 2012; Salmon et al., 2016; Parmentier et al., 2011).
With an area of 3 million km2, more than half of the northern high-latitude tundra ecosystems are situated in Russia (Walker et al., 2005). To date, just a few studies on CO2 fluxes from the vast Russian arctic tundra ecosystems are available (e.g., Parmentier et al., 2011; Marushchak et al., 2013; Rößger et al., 2019; Kittler et al., 2016), especially on the pedon scale (Kwon et al., 2016; Corradi et al., 2005; Heikkinen et al., 2004; Zamolodchikov et al., 2000). Since tundra soils are highly heterogeneous on the pedon scale in terms of temperature and moisture (Aalto et al., 2013), measurements on this scale are required to determine the response of individual CO2 fluxes to these parameters. To cover this heterogeneity on the pedon scale, chamber measurements are more appropriate than the eddy covariance (EC) method, which covers the next larger scale, even though a downscaling EC approach for CO2 fluxes of an arctic ecosystem was recently presented (Rößger et al., 2019). An improved understanding of CO2 dynamics in permafrost-affected soils is needed to improve estimates of future CO2 balances of the highly heterogeneous arctic tundra regions. Without developments in our understanding of the response of CO2 dynamics in permafrost-affected ecosystems to changing climatic conditions such as temperature and moisture, estimates of the carbon balance of the circum-arctic tundra and its future response to changing climatic conditions remain biased.
The net ecosystem exchange (NEE) of CO2 between the land surface and the atmosphere is composed of the CO2 uptake by plants, termed gross primary productivity (GPP), and the release of CO2 from soils and plants, which is ecosystem respiration (Reco) (Chapin et al., 2006). The latter can be further split into autotrophic respiration by plants (RA) and heterotrophic respiration (RH) consisting of microbial soil organic matter (SOM) decomposition. In this study the atmospheric sign convention is used, whereby a positive NEE defines a net release of CO2 from the soil to the atmosphere and a negative sign defines a net uptake of CO2 from the atmosphere.
In order to partition NEE into its underlying fluxes, measurements of GPP, Reco, RA, and RH are required. These individual process-based fluxes governing the CO2 balance respond differently to changing climatic conditions such as temperature and moisture. For instance, it was shown that temperature changes in arctic soils could cause a significant increase in the CO2 uptake via GPP (Shaver et al., 1998; Oberbauer et al., 2007; Natali et al., 2012; Mauritz et al., 2017), which can be, beside other factors, attributed to shifts in vegetation composition (Elmendorf et al., 2012; Hudson et al., 2011) and increased nutrient availability (Johnson et al., 2000; Salmon et al., 2016; Beermann et al., 2015). Furthermore, the effect of drainage on GPP remains uncertain; some studies found drainage of arctic soils to reduce GPP (Merbold et al., 2009; Chivers et al., 2009; Kwon et al., 2016), while other studies found drainage to lead to a slight increase in GPP (Olivas et al., 2010; Kittler et al., 2016). The effect of increasing soil moisture on GPP differs between ecosystems (Mauritz et al., 2017; Olivas et al., 2010; Chivers et al., 2009). As respiratory processes are temperature sensitive (Mahecha et al., 2010), the release of CO2 by Reco increases in response to soil warming across arctic ecosystems (e.g., Hicks Pries et al., 2015; Oberbauer et al., 2007; Natali et al., 2015). An increase in Reco was also observed as a result of drainage of arctic soils and vice versa: a decrease with increasing water saturation (Elberling et al., 2013; Mauritz et al., 2017; Chivers et al., 2009; e.g., Kwon et al., 2016; Olivas et al., 2010) was observed due to the presence or absence of oxygen in drained soils (Hobbie et al., 2002). However, it was also shown that Reco fluxes could increase with increasing water saturation due to higher soil temperatures in water-saturated soils (Zona et al., 2012), which highlights the interconnection of moisture and temperature in soils. In general, higher soil temperatures lead to a higher increase in Reco than GPP, which causes a reduction of the net CO2 uptake (Parmentier et al., 2011; Oberbauer et al., 2007; Voigt et al., 2017; Mauritz et al., 2017). Also, drainage of arctic soils causes a reduction of NEE (means less negative values) due to a higher increase in Reco than GPP (Merbold et al., 2009; Chivers et al., 2009; Kittler et al., 2016; Olivas et al., 2010), while the effect of increasing water saturation of soils on NEE differs between arctic ecosystems (Chivers et al., 2009; Mauritz et al., 2017). Both soil temperature and moisture are predicted to change in the future due to increased temperatures and precipitation in the pan-Arctic (Christensen et al., 2013). As Reco and GPP respond differently to temperature and moisture changes it is essential not only to focus on changes to NEE, but also to gain a quantitative understanding of its components and their individual responses to environmental and climatic changes to improve model simulations of future CO2 fluxes. Therefore, partitioning approaches for in situ measured CO2 fluxes are required.
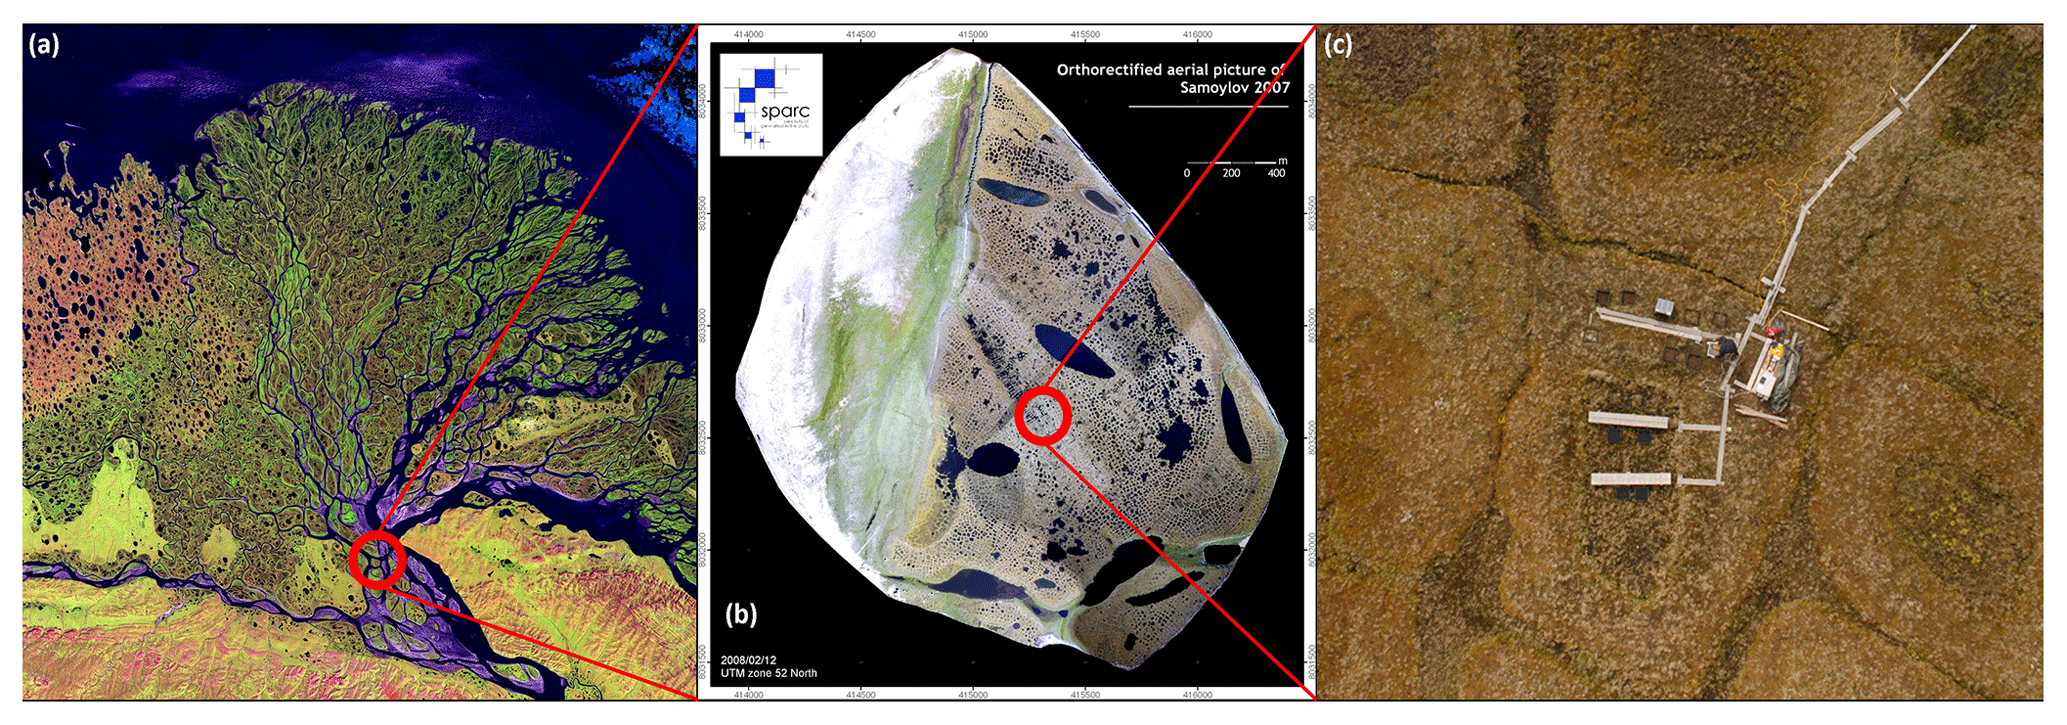
Figure 1The study site on Samoylov Island, Lena River Delta, northeastern Siberia (72∘22′ N, 126∘28′ E). Satellite images: (a) NASA, 2002; (b) Boike et al., 2012; (c) Boike et al., 2015.
The release of CO2 from soils by Reco is the largest efflux of carbon from terrestrial ecosystems to the atmosphere (Mahecha et al., 2010). Autotrophic respiration can be separated into aboveground plant respiration and belowground plant respiration (i.e., respiration of roots). Heterotrophic respiration is associated with the decomposition of SOM by heterotrophic soil organisms. To date, only a few estimates of RH fluxes from arctic tundra ecosystems over the growing season have been published (Nobrega and Grogan, 2008; Biasi et al., 2014; Segal and Sullivan, 2014), with data lacking for ecosystems such as the polygonal tundra. Warming of the arctic soils will influence RH fluxes both directly and indirectly: rising soil temperatures will increase SOM decomposition, but will also cause permafrost thaw, exposing previously frozen SOM to microbial decomposition (Schuur et al., 2011; Dorrepaal et al., 2009). This decomposition could substantially reduce carbon storage in arctic tundra ecosystems, as gross ecosystem productivity has been found to be less temperature sensitive than Reco in these ecosystems (Grogan and Chapin, 2000; Dorrepaal et al., 2009). Warming could also reduce soil moisture (Suseela et al., 2012) and increase RA due to increasing aboveground biomass (Natali et al., 2012), which could lead to a lower contribution of RH to Reco (Hicks Pries et al., 2015; Chen et al., 2016). Furthermore, changes in soil moisture are known to affect microbial activity in soils directly with decreasing activity during times of high and low soil moisture and an optimum at moderate soil moisture conditions (Moyano et al., 2013). The increase in RA and RH fluxes due to warming might be compensated for by higher net primary production (Hicks Pries et al., 2013), but whether this compensation is valid for the entire growing season and across highly heterogeneous arctic ecosystems on the pedon scale remains uncertain. Furthermore, it remains uncertain how RA fluxes will respond to changing hydrological regimes as the impact of this parameter on RA fluxes has never been analyzed in tundra regions.
As changes in soil temperature and moisture can significantly alter the individual fluxes contributing to NEE, this study aims to improve the current understanding of CO2 flux dynamics in permafrost-affected ecosystems by (i) partitioning NEE into individual flux components (photosynthesis, ecosystem respiration, and autotrophic and heterotrophic respiration) at the pedon scale of the polygonal tundra and (ii) gaining insights into the response of these individual fluxes to different environmental parameters. Therefore, closed-chamber measurements were conducted at two sites in the polygonal tundra in northeastern Siberia over an almost complete growing season. Finally, a CO2 budget for a nearly complete vegetation period is determined for the two sites using data-calibrated flux models. These models were based on the time-sensitive bulk flux partitioning model by Runkle et al. (2013), which has been used in different arctic ecosystems (Helbig et al., 2017; Zona et al., 2014).
The investigation area is located on Samoylov Island in the southern central Lena River Delta, northeastern Siberia (72∘22′ N, 126∘28′ E; Fig. 1). The Lena River forms the largest delta in the Arctic, which can be geomorphologically divided into river terraces of different ages and floodplain levels (Schwamborn et al., 2002). The delta is located in the continuous permafrost zone with permafrost extending to depths of 300 to 500 m (Yershov, 1998) and relatively low mean annual soil temperatures of −7.8 ∘C at 1.7 m of depth compared to other arctic tundra sites (Boike et al., 2013). The study site has an arctic continental climate characterized by low temperatures and low precipitation. The mean annual air temperature between 1998 and 2011 was −12.5 ∘C, and mean annual precipitation between 1981 and 2011 was 321 mm (Pogoda i Klimat, 2016), while summer rainfall is 125 mm, ranging from 52 to 199 mm (Boike et al., 2013). Polar day lasts from 7 May until 8 August, and polar night lasts from 15 November to 28 January. Snowmelt usually starts in the first half of June, and the growing season usually spans from around mid-June until mid-September.
The study site is covered by ice-wedge polygonal tundra on a Late Holocene river terrace with elevations from 10 to 16 m above sea level on the eastern part of Samoylov Island. The development of polygonal structures has created depressed polygon centers surrounded by elevated polygon rims with elevation differences of about 0.5 m. Underlying permafrost prevents drainage in polygon centers, resulting in water-saturated soils, anoxic soil conditions at shallow depths, and significant amounts of soil organic carbon of around 33 kg m−2 in the uppermost meter (Zubrzycki et al., 2013). In contrast, due to oxic conditions in the topsoil, the elevated polygon rim soils have accumulated less soil organic carbon of around 19 kg m−2 (Zubrzycki et al., 2013). A land cover classification based on Landsat satellite imagery revealed that if excluding large thermokarst lakes the polygonal tundra on Samoylov Island consists of 65 % dry tundra, 19 % wet tundra, and 16 % small water bodies including small ponds overgrown by vascular plants (Muster et al., 2012).
In this study, two different sites were investigated: (i) a wet–depressed polygon center (wet tundra) and (ii) its surrounding elevated polygon rim (dry tundra, 72∘22′26 N 126∘29′49 E). These sites were located within the footprint area of an eddy covariance (EC) system in which NEE of CO2 was measured (Holl et al., 2019; Kutzbach et al., 2007b; Wille et al., 2008; Runkle et al., 2013). The maximum active layer depth (ALD) at the study site was deeper at the polygon center (40 cm) than at the polygon rim (30 cm). The soils at the polygon centers were classified as Histic or Reductaquic Cryosols (IUSS Working Group WRB, 2014) with a water table close to the soil surface. Polygon rim soils were characterized by cryoturbation and therefore classified as Turbic Glacic Cryosols (IUSS Working Group WRB, 2014) with a water table just a few centimeters above the permafrost table. Total organic carbon (TOC) contents above 10 % were found in the surface horizon above the cryoturbated horizons of the polygon rim, while high TOC contents were found at the polygon center throughout the active layer (Zubrzycki et al., 2013). Vegetation on polygon rims is dominated by mosses (Hylocomium splendens, Polytrichum spp., Rhytidium rugosum), some small vascular plants (Dryas punctata and Astragalus frigidus), and lichens (Peltigera spp.) and can be classified as non-tussock sedge, dwarf-shrub, moss tundra (Walker et al., 2005). The vegetation of the polygon centers was dominated by the hydrophilic sedge Carex aquatilis, which have in general much higher growth forms than at the rim, and mosses (Drepanocladus revolvens, Meesia triqueta, Scorpidium scorpioides) and was classified as sedge, moss, dwarf-shrub wetland (Walker et al., 2005).
3.1 Meteorological data
Meteorological variables were recorded at 30 min intervals at the nearby EC system and adjacent meteorological station 40 m southwest of the study site. Data collected were air temperature (MP103A; ROTRONIC AG, Switzerland), air pressure (RPT410F; Druck Messtechnik GmbH, Germany), and photosynthetically active radiation (PAR; wavelength: 400–700 nm; QS2, Delta-T Devices Ltd., UK), as well as the incoming and reflected components of shortwave and longwave radiation, respectively (CNR 1; Kipp&Zonen, the Netherlands). The radiative surface temperature (Tsurf; in Kelvin, K) was calculated as
where L↑B is the upward infrared radiation (W m−2), σ is the Stefan–Boltzmann constant (W m−2 K−4), and the dimensionless emissivity ε was assumed to be 0.98 after Wilber et al. (1999). Furthermore, soil temperature (Tsoil) was measured at 2 cm of soil depth in intervals of 30 min at an adjacent polygon rim and center.
3.2 Soil sampling and vegetation indices
Undisturbed soil samples were taken from the active layer at the polygon rim using steel rings (diameter 6 cm). At the water-saturated polygon center, an undisturbed soil monolith was taken from the active layer using a spade and subsequently subsampled into four soil layers based on the degradation status of the organic matter. Coarse roots were removed, and soil samples were homogenized for analysis of soil water content (mass difference between wet and dried (105 ∘C) soil samples) and pH (CG820; Schott AG, Mainz, Germany). Total carbon and nitrogen (N) contents (VarioMAX cube; Elementar Analysesysteme GmbH, Hanau, Germany), as well as total organic carbon and total inorganic carbon contents (TIC; liquiTOC II, Elementar Analysesysteme GmbH, Hanau, Germany), were determined from dried (105 ∘C for more than 24 h) and milled soil samples. To analyze vegetation indices, gridded quadrats of 10 cm × 10 cm were placed over the collars, and a visual identification of the plant species present as well as their abundance (% surface cover) was conducted in four grid squares.
3.3 Net ecosystem exchange and ecosystem respiration
A total of eight PVC frames (50 cm × 50 cm), four at each site, were installed in July 2014 in preparation for NEE and Reco flux measurements with closed chambers the following year. The frames were equipped with a U-shaped frame filled with water to avoid gas exchange between the chamber headspace and ambient air. The chamber (50 cm × 50 cm × 50 cm) used for NEE and Reco flux measurements was made of clear acrylic glass (Plexiglas SunActive GS; Evonik Industries AG, Germany). The chamber was equipped with a fan for continuous mixing of headspace air (axial fan, 12V/DC; Conrad Electronic SE, Germany). Furthermore, a PAR sensor (SKP212; Skye Instruments Ltd., UK) and a temperature probe (107 Thermistor probe; Campbell Scientific Ltd., USA) were installed inside the chamber. Including the volume inside the chamber frames, the chamber enclosed a volume of 124–143 L. For Reco measurements, the chamber was covered with an opaque material. Boardwalks were installed at both sites to avoid disturbance. The volumetric soil water content (VWC) was measured with a GS3 sensor (Decagon Devices, Inc., USA) during each measurement directly beside the chamber frame at a depth of 5 cm. A diver (Schlumberger Ltd., USA) was installed at the polygon center to measure water table (WT) depth every 15 min. To prevent pressure-induced gas release during chamber closure (Christiansen et al., 2011), two holes (3 cm in diameter) at the top of the chamber were left open while placing the chamber on the frames and then closed for measurements. Soil temperatures between the surface and the frozen ground in 5 cm intervals and thaw depth were measured daily at both sites. For each chamber flux measurement, CO2 concentrations in the chamber headspace were continuously measured with a gas analyzer (UGGA 30-p; Los Gatos Research, USA). The chamber headspace air was pumped in a closed loop via transparent polyurethane tubes (inner diameter 4 mm, each 10 m length) through the analyzer with a flow rate of 200 mL min−1. The CO2 concentration was logged (CR800 series; Campbell Scientific Ltd., USA) together with PAR as well as soil and air temperature at a frequency of 1 Hz. Each chamber closure period was restricted to 120 s to minimize warming inside the chamber relative to the ambient temperature.
Chamber measurements were conducted from 11 July until 22 September 2015, at least every third day between 06:00 and 21:00 (local time), apart from the period 2–9 and 17–24 August. Two consecutive measurements were performed at each frame: first, NEE (n=679) was measured with the transparent chamber, followed by an Reco measurement (n=679) with the dark chamber shortly after. The four frames of one site were measured consecutively before moving to the other site. GPP fluxes were calculated from the sum of the measured Reco and NEE fluxes.
3.4 Heterotrophic respiration
For RH measurements the root-trenching method was applied at both sites. It is challenging to separate belowground respiration fluxes into autotrophic and heterotrophic components because roots and microorganisms are closely linked within the rhizosphere (Hanson et al., 2000). There are a wide range of methods for partitioning Reco (Subke et al., 2006; Kuzyakov, 2006), each with its associated advantages and disadvantages. Root trenching, for example, despite some disturbance on the plant–soil interface, can give accurate estimates of the rates of RA and RH (Diaz-Pines et al., 2010) and produces similar results as a non-disturbing 14C partitioning approach in an arctic tundra ecosystem (Biasi et al., 2014) and a partitioning approach based on 13C (Chemidlin Prévost-Bouré et al., 2009). In this study, by inserting PVC frames below the main rooting zone at 20 cm deep into the soil, lateral roots were cut off. All living plant biomass including living moss tissue inside the frames was removed carefully in 2014. To prevent regrowth, the living plant biomass was removed periodically over the measurement period. This removal causes the die-off of roots, and in a period of days after the disturbance RH equals NEE. A total of eight frames, four at each site, were prepared for RH measurements. RH fluxes (n=662) were measured during the same periods and with the same closure period as NEE and Reco measurements on unaltered plots.
To test if RH fluxes are biased due to the additional decomposition of residual roots, four additional PVC frames (two per site) were installed in 2015 following the sampling and preparation protocol of 2014. A total of 302 RH flux measurements were made on these newly installed plots. The difference between the mean RH fluxes of each single plot trenched in 2014 and those trenched in 2015 were analyzed using a Student's t test.
RA fluxes at the unaltered sites were calculated by subtracting the mean RH fluxes measured at the trenched sites from the mean of the Reco fluxes at the unaltered sites of the same day. The calculated RA fluxes were summed with the calculated GPP fluxes to estimate the net primary productivity (NPP) fluxes.
3.5 Flux calculation
CO2 fluxes (µg CO2 m−2 s−1) were calculated using MATLAB® R2015a (The MathWorks Inc., Natick, MA, 2000) with a routine that uses different regression models to describe the change in the chamber headspace CO2 concentration over time and conducts statistical analysis to aid model selection (Eckhardt and Kutzbach, 2016; Kutzbach et al., 2007a).
Due to possible perturbations while placing the chamber on the frame, the first 30 s of each 2 min measurement period were discarded and the remaining 90 data points were used for flux calculations. The precision of the gas analyzer with 1 s signal filtering is <0.3 ppm for CO2 according to the manufacturer. The root mean square error (RMSE) did not exceed this value under the typical performance of chamber measurements and the fitting of the linear and nonlinear regression models. Higher RMSE values indicated failed model fitting or disturbed chamber measurements. Therefore, if RMSE exceeded 0.3 ppm, the concentration-over-time curve was reinspected. Variation of PAR during chamber measurements due to shifts in cloud cover leads to irregular CO2 concentration time series and perturbation of the calculated CO2 fluxes (Schneider et al., 2012). These perturbed concentration time series show distinct autocorrelation of the residuals of the regression models and were filtered out by using a threshold for residual autocorrelation indicated by the Durbin–Watson test (Durbin and Watson, 1950). The flux curve was reinspected if the RMSE exceeded 0.3 ppm or showed a distinct autocorrelation to see if irregularities could be removed by adjusting the size of the flux calculation window. If irregularities could be removed by adjusting the size of the flux calculation window, the flux curve was recalculated; if not, the measurement was discarded. Overall, about 3 % (n=47) of the CO2 flux measurements (NEE, Reco and RH measurements) were discarded from the dataset because they did not meet the abovementioned quality criteria.
Studies have shown that CO2 fluxes calculated with linear regression models can be seriously biased (Kutzbach et al., 2007a), while nonlinear regression models significantly improve flux calculations (Pihlatie et al., 2013). However, we found that the temporal evolution of CO2 concentration in the chamber was best modeled with a linear regression model, as determined by the Akaike information criterion corrected for small samples sizes (AICc) (Burnham and Anderson, 2004). This is in good agreement with other studies, which have shown that in some cases a linear regression model can produce a better CO2 flux estimate for a nonlinear concentration-over-time curve than a nonlinear regression model (Koskinen et al., 2014; Görres et al., 2014).
3.6 Modeling CO2 fluxes at the pedon scale
Different numerical models were fitted to the measured Reco and RH fluxes and to the calculated GPP fluxes to quantify seasonal GPP, Reco, and RH fluxes. To calibrate the models, these were fitted to the GPP, Reco, and RH fluxes. The resulting fitting parameters were used to reproduce the fluxes over the complete measurement period. Model calibration was done by applying a 15 d moving window over the measurement period moving in 1 d intervals. If fewer than eight chamber measurements were performed during these 15 d, the moving window was extended to 19 d. Subsequently, the modeled fluxes for each measurement plot were averaged for each site. CO2 fluxes from each of the four measurement plots were used separately for model calibration and the summed fluxes were used to analyze differences between both sites using a Student's t test.
The empirical Q10 model (van't Hoff, 1898) was fitted to the measured Reco and RH fluxes:
where the (variable) fit parameter Rbase is the basal respiration at the reference temperature Tref (15 ∘C). The reference temperature and γ (10 ∘C) were held constant according to Mahecha et al. (2010). Q10 was a fit parameter describing the ecosystem sensitivity of respiration to a 10 ∘C change in temperature. For this study a fixed Q10 value of 1.52 was used, which represents the seasonal mean value of the bulk partitioning model for the CO2 fluxes in the EC footprint area (Runkle et al., 2013). Air temperature (Ta), surface temperature (Tsurf), and soil temperature (Tsoil) measured at a depth of 2 cm were tested as input variables.
The model calibration was done with MATLAB® R2015a (The MathWorks Inc., Natick, MA, 2000). The model parameters were estimated by nonlinear least-squares regression fitting (nlinfit function), and the uncertainty of the parameters was determined by calculating the 95 % confidence intervals using the nlparci function. The selection of the best-performing temperature as an input variable for the Reco and RH model was based on comparing the of the model runs with different temperatures as an input variable. The selected input variable was chosen for all measurement plots of the same site.
To estimate GPP, the measured Reco fluxes were subtracted from the measured NEE for each measurement plot. The rectangular hyperbola function was fitted to the calculated GPP fluxes as a function of PAR (in µmol m−2 s−1):
where the (variable) fit parameter Pmax was the maximum canopy photosynthetic potential (hypothetical GPP at infinite PAR). The values for the initial canopy quantum efficiency α (in µg m−2 s−1 ∕ µmol m−2 s−1; initial slope of the GPP model at PAR = 0) were obtained from modeling the CO2 fluxes with EC data (Holl et al., 2018). From the determined values when α was held variable, a function was formulated that accounts for the seasonality of α with specific values for each day of the growing season using the following function:
where b=0.042, c=209.5, d=2, e=25.51, f=0.008, and x is the day of the year 2015. Afterwards, these values (variable on daily basis) were used for both sites to reproduce GPP fluxes from chamber measurements over the complete measurement period.
Although the transmissivity of the chamber material was high, with >90 % for wavelengths between 380 and 780 nm (Evonik, 2015), it caused a reduction in the amount of incoming radiation reaching the surface, which could be further reduced based on the sun elevation. During the complete measurement period, the PAR values measured inside the chamber were on average 20 % lower than the PAR values measured outside the chamber (data not shown). Therefore, GPP modeling was conducted in two steps. First, the GPP model was calibrated using PAR values measured inside the chamber; secondly, the reproduction of GPP fluxes over the growing season was carried out using PAR values measured outside the chamber. Without this two-step calibration the GPP fluxes would have been underestimated.
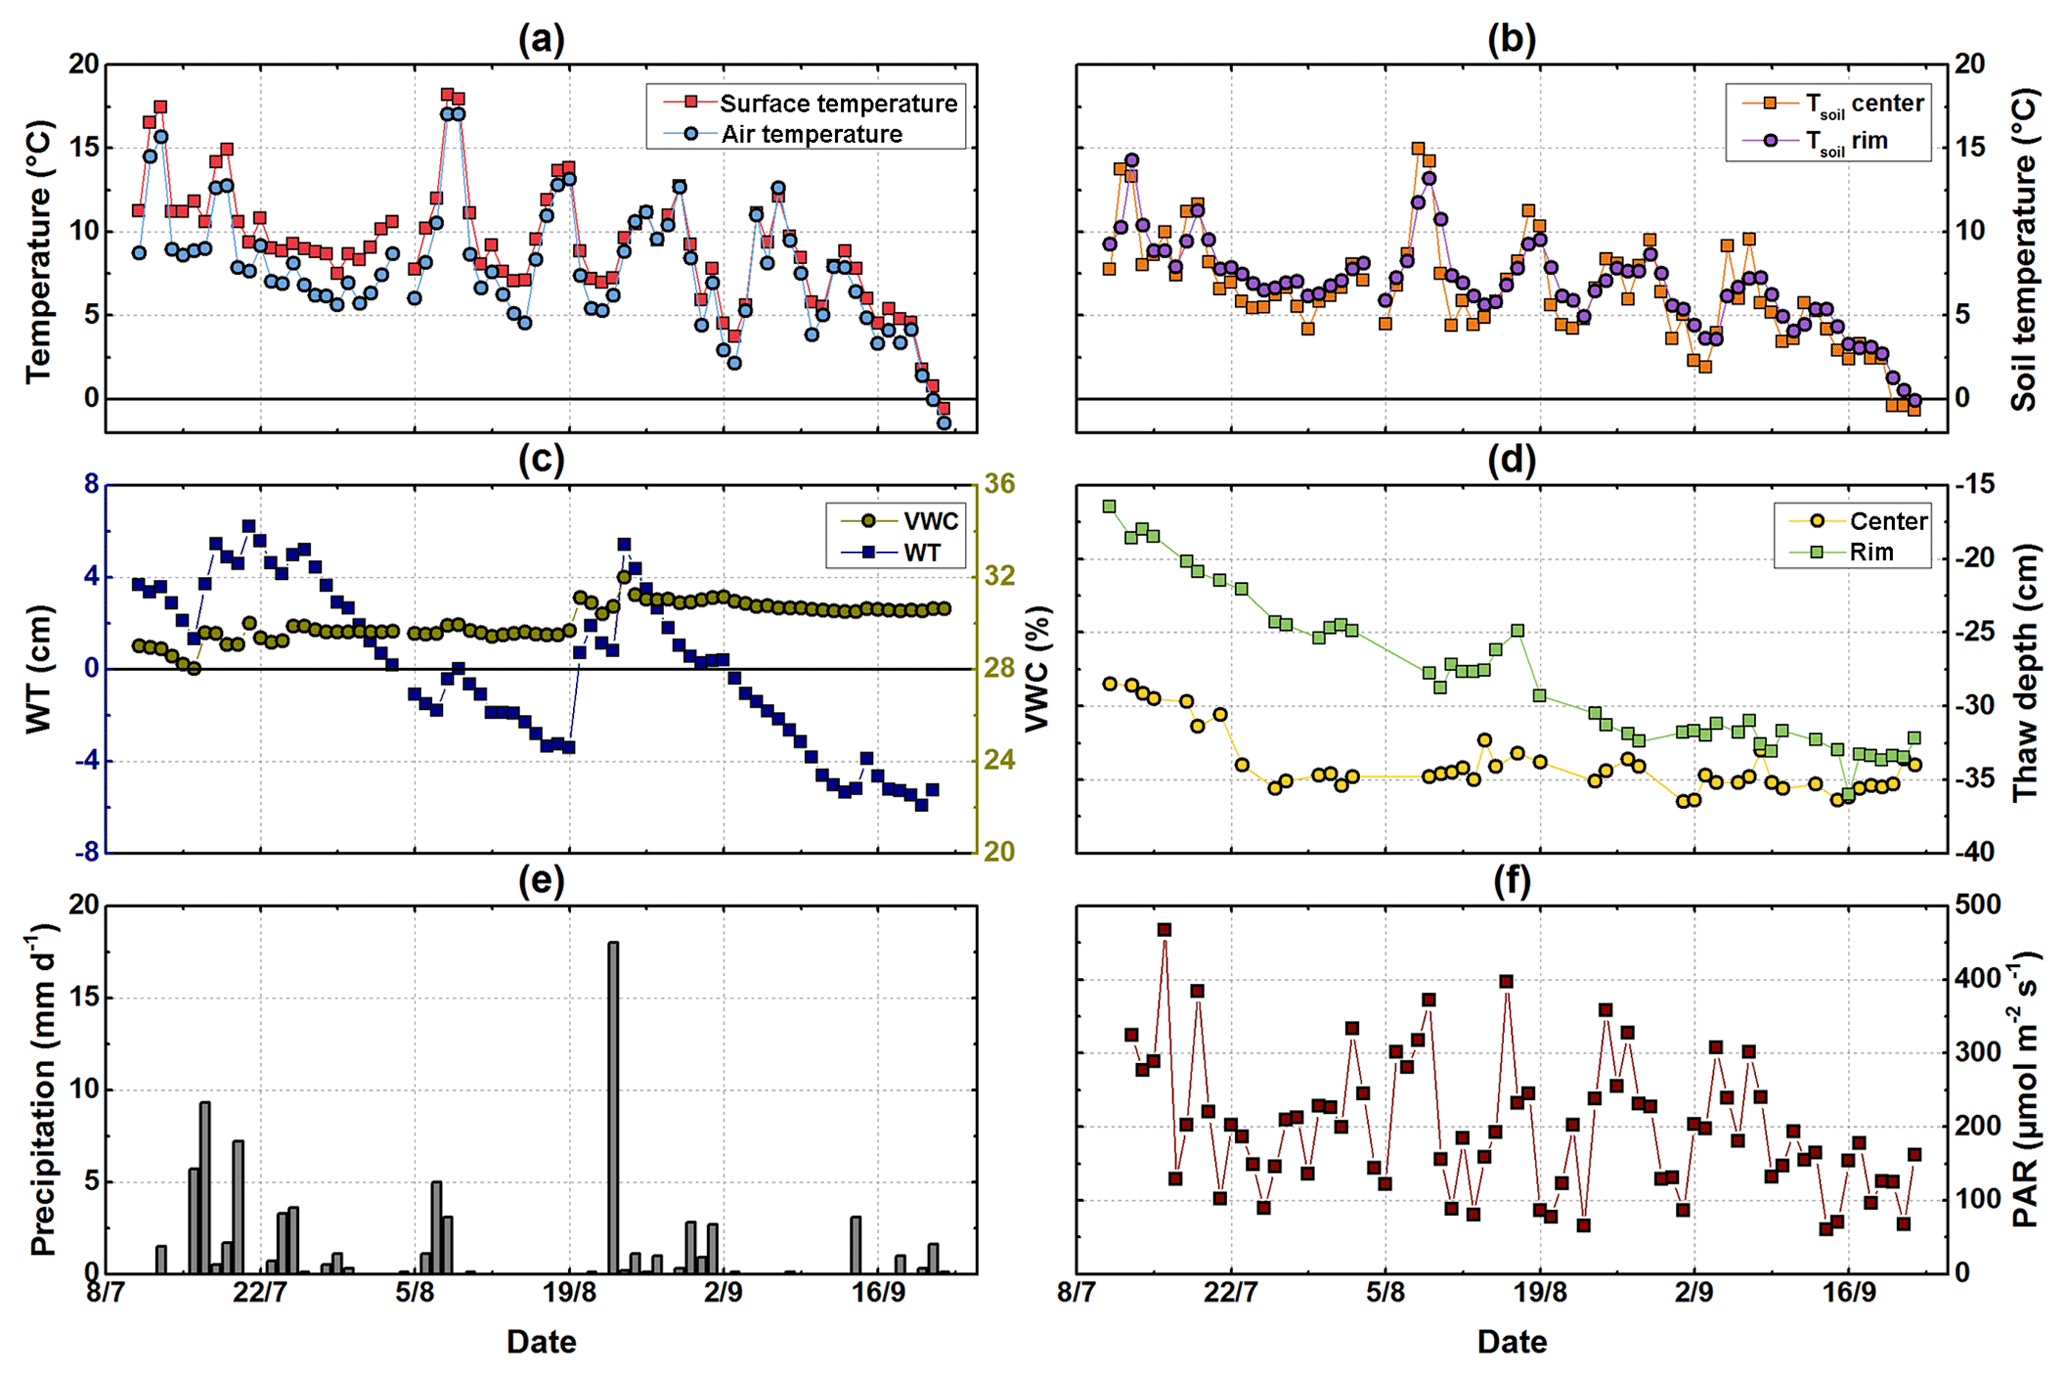
Figure 2Meteorological conditions from mid-July to end of September. (a) Half-hourly air temperature measured at 2 m of height at the eddy covariance tower and surface temperature; (b) soil temperatures measured at 2 cm of depth at the polygon rim and center; (c) water table relative to the soil surface measured at the polygon center and volumetric water content measured at the polygon rim; (d) daily measured thaw depth at the polygon rim and center; (e) daily precipitation measured at the eddy covariance station; (f) photosynthetically active radiation (PAR) measured half-hourly at the eddy covariance tower.
The NEEs for both sites were calculated as the sum of the modeled GPP and Reco fluxes. The RA fluxes were calculated as the difference of the modeled Reco and RH fluxes. Furthermore, NPP was calculated from the sum of RA and GPP fluxes.
As both sites are within the footprint of an EC station, which determines CO2 fluxes on a larger spatial scale (100 to 1000 m), the resulting NEE from the modeling approach was compared with NEE of the same period obtained from EC measurements reported by Holl et al. (2019). For this upscaling, the resulting NEEs from the chamber model were weighted (NEEchamber) based on the half-hourly relative contributions of the surface classes defined by Muster et al. (2012) to the EC footprint using the following equation:
where NEEC and NEER are the modeled half-hourly chamber NEE for the polygon center and rim, respectively, and Coverwet and Coverdry are the relative contribution of the surface classes polygon center and rim, respectively, to the EC footprint as given in Holl et al. (2019).
4.1 Meteorological data, environmental conditions, and soil characteristics
The mean daily air temperature over the study period ranged from 23 to −2 ∘C (Fig. 2a). The average air temperature in August 2015 (9 ∘C) was similar to the long-term mean air temperature for the period 1998–2011 (Boike et al., 2013). Compared to the long-term mean, it was about 1 ∘C colder during July (9 ∘C), whereas September was around 2 ∘C warmer than the reference period (3 ∘C). The total precipitation from mid-July to the end of September 2015 was 78 mm, which is below the mean precipitation of 96 ± 48 mm between 2003 and 2010 (Boike et al., 2013).
From mid-July to the end of September 2015, soil temperatures at 2 cm of depth at the polygon rim showed a higher diurnal variability than at the center. The highest soil temperatures were measured in mid-July and at the beginning of August. At the end of September, the temperatures became slightly negative (Fig. 2b). At the polygon rim, the thaw depth increased from the beginning of the campaign in mid-July until mid-September to reach a maximum depth of 36 cm. Maximum thaw depth was reached at the polygon center much earlier in the season (mid-July) and remained relatively constant until mid-September. The water table depth at the polygon center was tightly coupled to rainfall. The VWC at 5 cm of soil depth was on average 30 % at the polygon rim, with highest values observed after rainfall events (Fig. 2c). The daily averaged PAR values showed a strong seasonality with decreasing daily mean values towards the end of the season, although there was a period at the end of July with rather low daily averaged PAR values.

Figure 3Chamber-measured NEE, Reco, and RH fluxes, as well as calculated GPP, NPP, and RA fluxes. The error bars denote the standard deviation of the four replicate measurements at each site. (a) Fluxes of NEE (n= 83), Reco (n= 85), and RH (n= 85) at the polygon center; (b) calculated fluxes of GPP (n= 83), NPP (n= 83), and RA (n= 85) at the polygon center; (c) measured fluxes of NEE (n= 83), Reco (n= 85), and RH (n= 85) at the polygon rim; (d) calculated fluxes of GPP (n= 83), NPP (n= 83), and RA (n= 85) at the polygon rim.
The total soil organic carbon content was lower at the polygon rim (2 %–12 %) than at the polygon center (10 %–20 %) and showed a decrease with depth, which was more pronounced at the polygon rim. The estimated SOC stocks within 30 cm of depth were about 11 kg m−2 and about 21 kg m−2 at the polygon rim and center, respectively. The total inorganic carbon content was 0.2 % at both sites in each soil depth.
4.2 Chamber CO2 fluxes
In general, the CO2 uptake (NEE) at the polygon center was higher (with more negative values) than at the rim (Fig. 3). In September both sites acted as small net CO2 sources. The standard error of the flux calculation was around 3.5 and 2.3 µg CO2 m−2 s−1 for the polygon center and rim, respectively, and decreased slightly towards the end of the season. In contrast to the NEE, the measured Reco fluxes were on average higher at the rim compared to the center. The highest ecosystem respiration fluxes of the rim and center were measured at beginning of August, when the air temperature exceeded 20 ∘C.
In general, the release of CO2 by RH was higher at the polygon rim than at the center and showed no seasonality (Fig. 3). An increase in RH fluxes after periodical re-clipping of the vegetation was not observed. Comparing RH fluxes from measurement plots that were trenched in 2014 with those trenched in 2015 revealed no significant differences (t test, p>0.05) between the years of root trenching (data not shown).
Due to a period with rather low daily averaged PAR at the end of July, the uptake was partly lower as at the beginning of the measurement period at both sites. After reaching peak net CO2 uptake at the beginning of August, the uptake decreased until the end of September. This seasonality was more pronounced at the polygon center than at the polygon rim. Interestingly, towards September the net CO2 uptake at the polygon rim exhibited an increase for a period of about 1 week, before it decreased again towards the end of September. Reco fluxes showed a similar but less distinct seasonal pattern, and the peak of the highest Reco fluxes was in mid-August. In contrast, RH fluxes showed no seasonal trend at the polygon center, while at the polygon rim the RH fluxes were also highest when Reco and NEE reached their maxima.
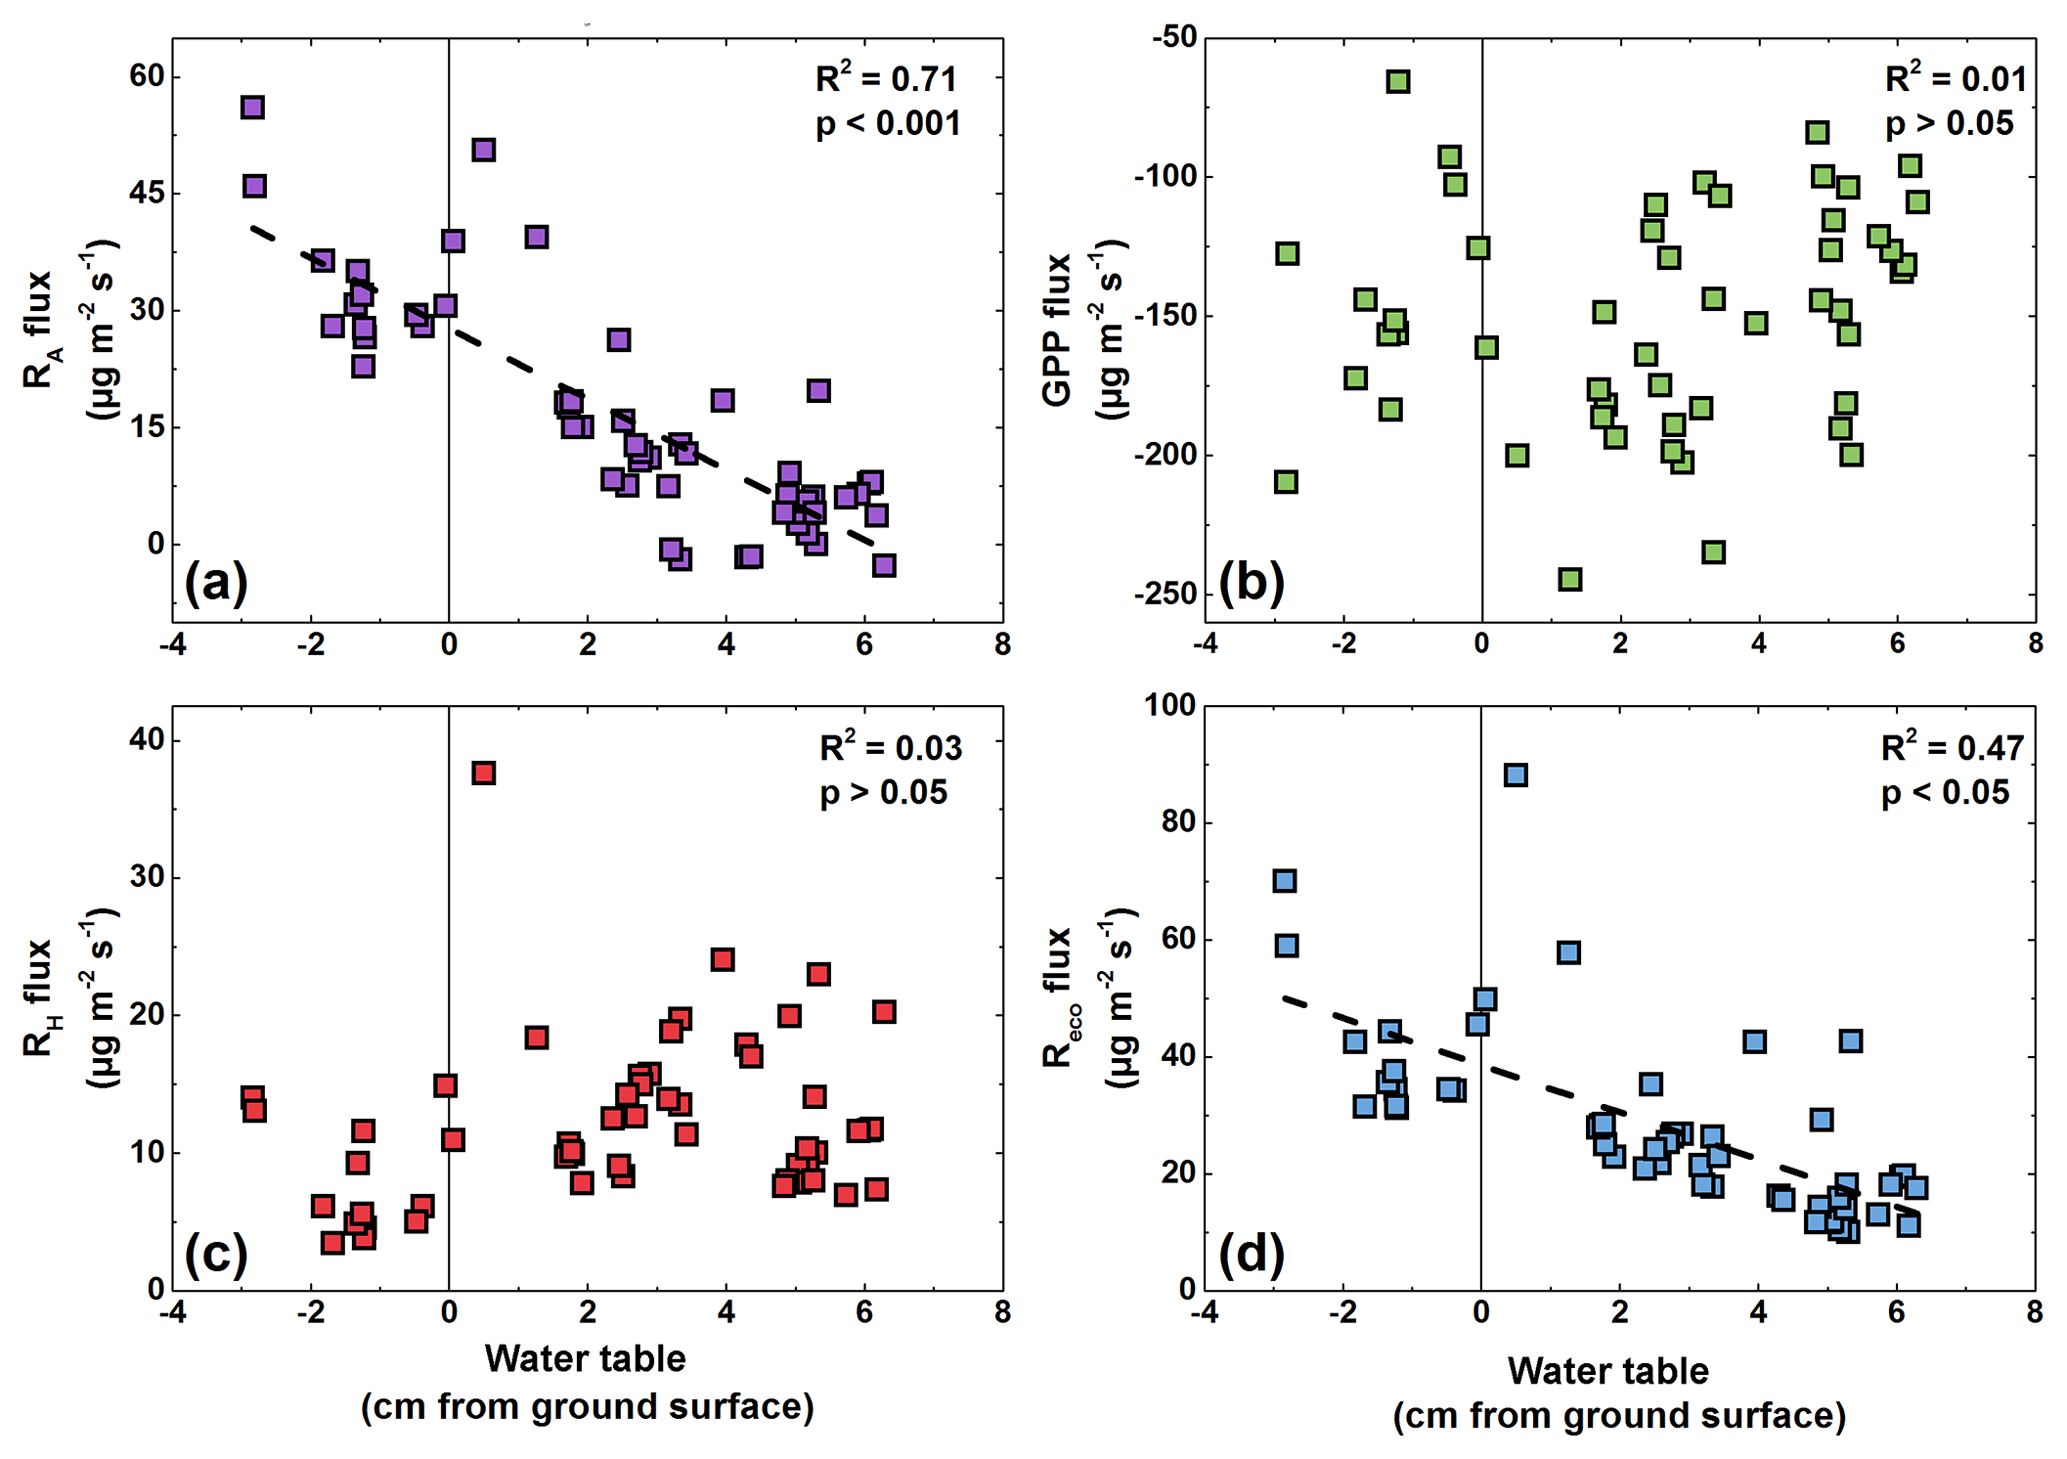
Figure 4Relationships between water table fluctuations and (a) Reco fluxes, (b) RH fluxes, (c) RA fluxes, and (d) GPP fluxes during the period July–August at the polygon center. Negative values on the x axis indicate a water table below the soil surface.
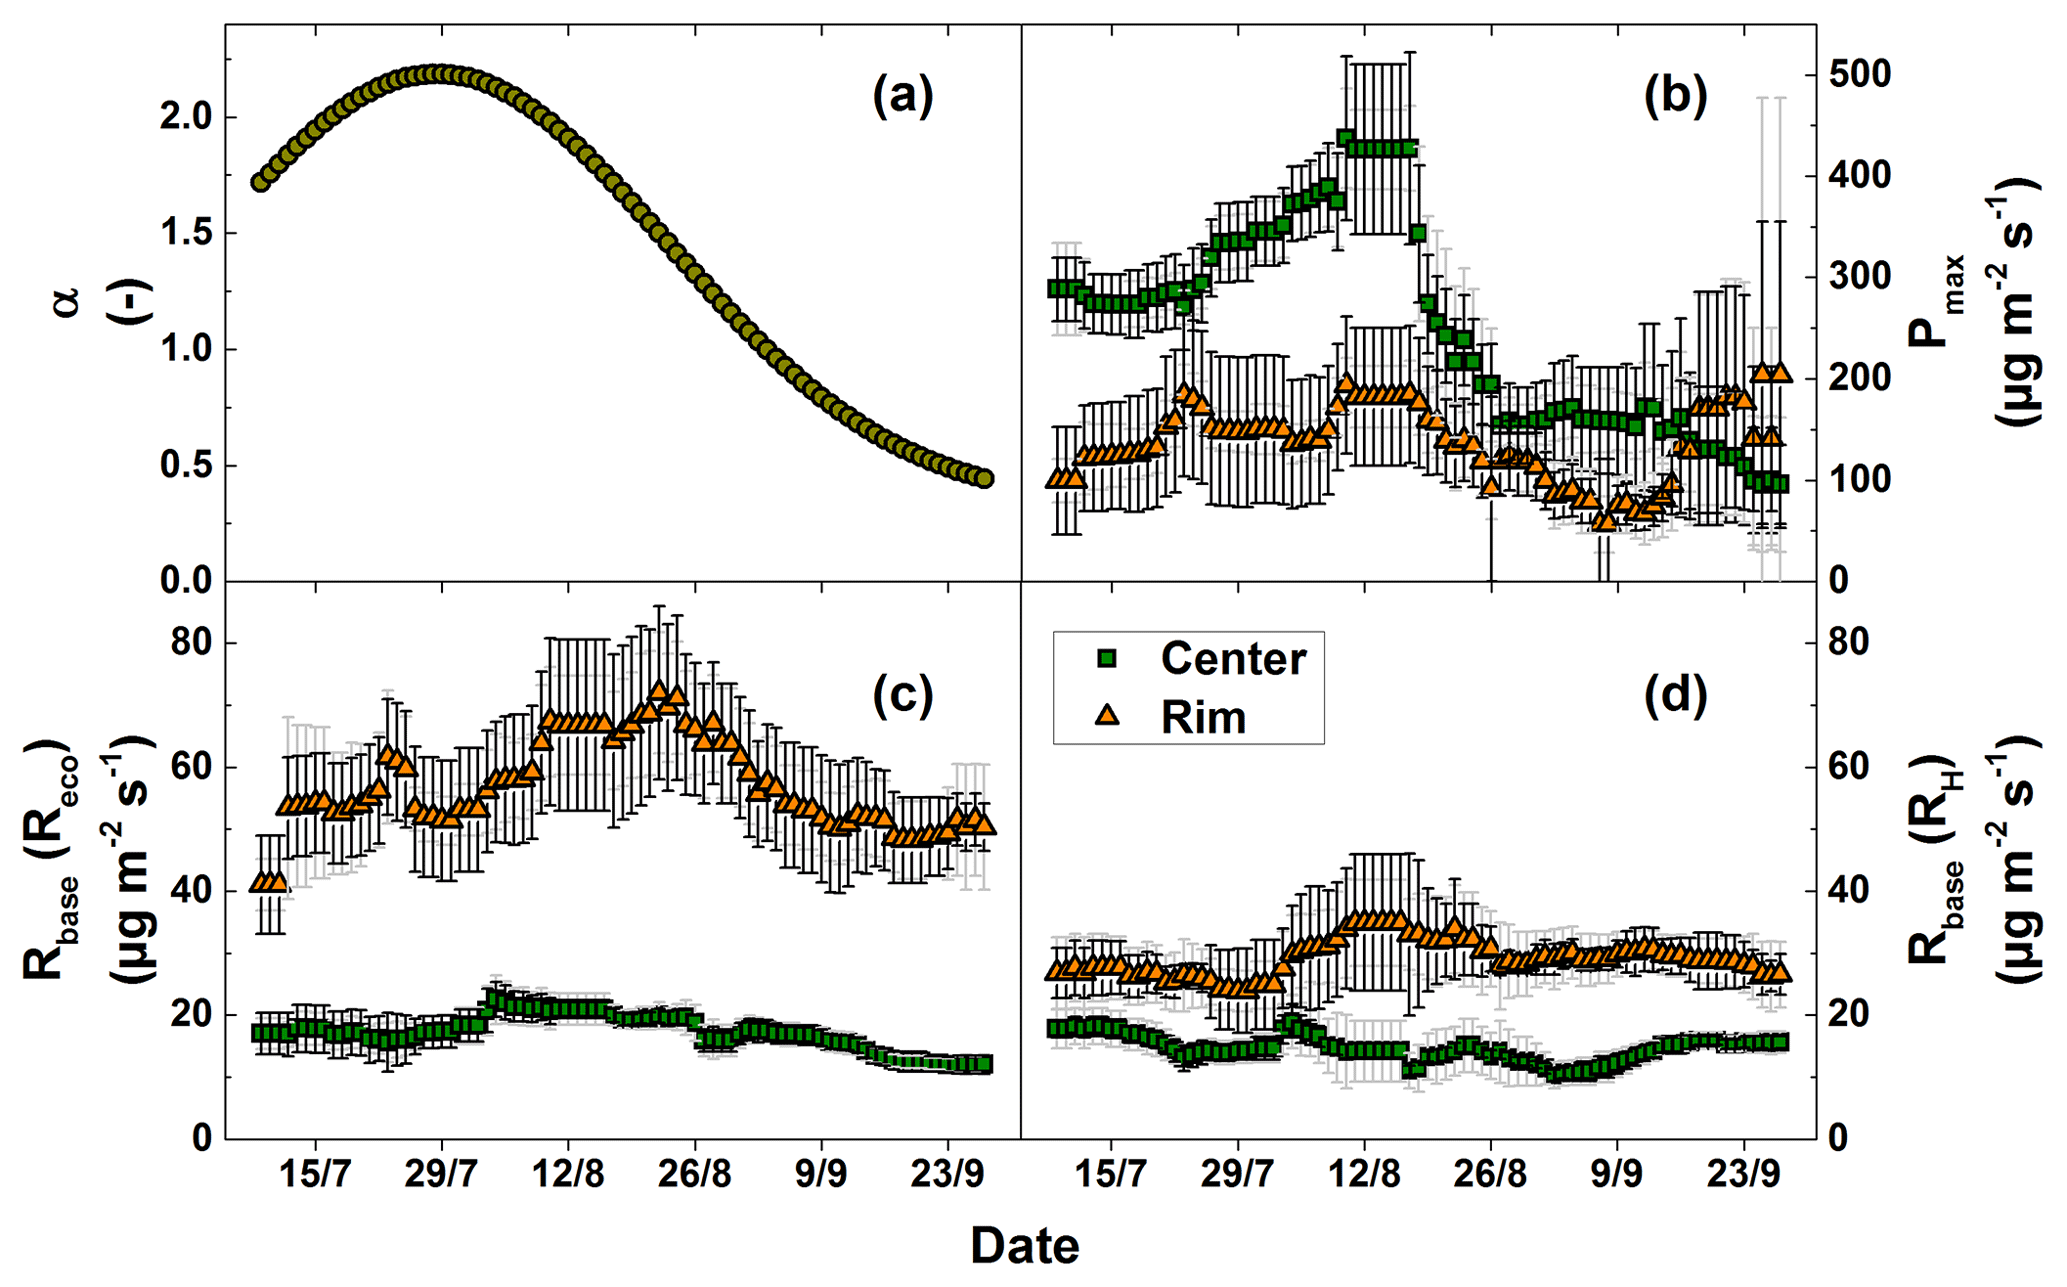
Figure 5Fitting parameters of the CO2 flux models. The values are given with the standard deviation of the model results from the single measurement plots (light grey error bars) and the confidence intervals (95 %) of the fitting parameters (dark grey error bars).
As GPP, NPP, and RA fluxes were calculated from the measured NEE, Reco, and RH fluxes, these fluxes show similar patterns of seasonality. The highest GPP and NPP fluxes were observed during the vegetation maximum, with a more pronounced seasonality at the polygon center compared to the rim. In general, RA fluxes were within the same range at both sites, which is in contrast to the calculated GPP fluxes that were almost twice as high at the polygon center as at the rim.
Interestingly, the Reco fluxes were linearly correlated with WT fluctuations from the beginning of July until the end of August (Fig. 4d). In contrast, neither a trend of higher RH fluxes during times of high WT nor a trend of lower RH fluxes during times of low WT was observed. Instead, the RA fluxes showed a significant correlation (R2=0.71; p<0.05) with WT fluctuations.

Figure 6Modeled and measured CO2 fluxes at the polygon center in µg CO2 m−2 s−1. Measured fluxes are available for NEE (a), Reco (b), and RH (c). NEE model fluxes were calculated from modeled GPP (e) minus modeled Reco, RA model fluxes (d) from modeled Reco minus modeled RH, and NPP model fluxes (f) from modeled GPP minus modeled RA. Note the different scales of the axes.
4.3 Modeled CO2 fluxes
The fitting parameter of the GPP model (Eq. 3), Pmax, showed strong spatial and temporal variability (Fig. 5b). The α values (Eq. 4) used for the GPP model showed a high temporal variability with a mean of 1.47±0.62. This value increased sharply towards the peak vegetation period at the end of July and decreased thereafter until the end of the growing season. The Pmax values showed a strong temporal variability (high standard deviation) at the polygon center (mean: 250.7±101.9 µg CO2 m−2 s−1). Considerable differences in Pmax were also observed between the polygon rim and the center. The average Pmax at the polygon rim (135.4±37.2 µg CO2 m−2 s−1) was substantially lower than at the polygon center (250.7±101.9 µg CO2 m−2 s−1). As with the measured NEE, Pmax values displayed an increase at the polygon rim towards the end of September. The fitting parameter of the Reco and RH model (Eq. 2), Rbase, also showed strong spatial and temporal variability (Fig. 5d). In general, Rbase was higher at the polygon rim. The averaged Rbase values for the RH model fit differed substantially between sites with 14.6±2.1 µg CO2 m−2 s−1 at the polygon center and 29.0±2.9 µg CO2 m−2 s−1 at the polygon rim.
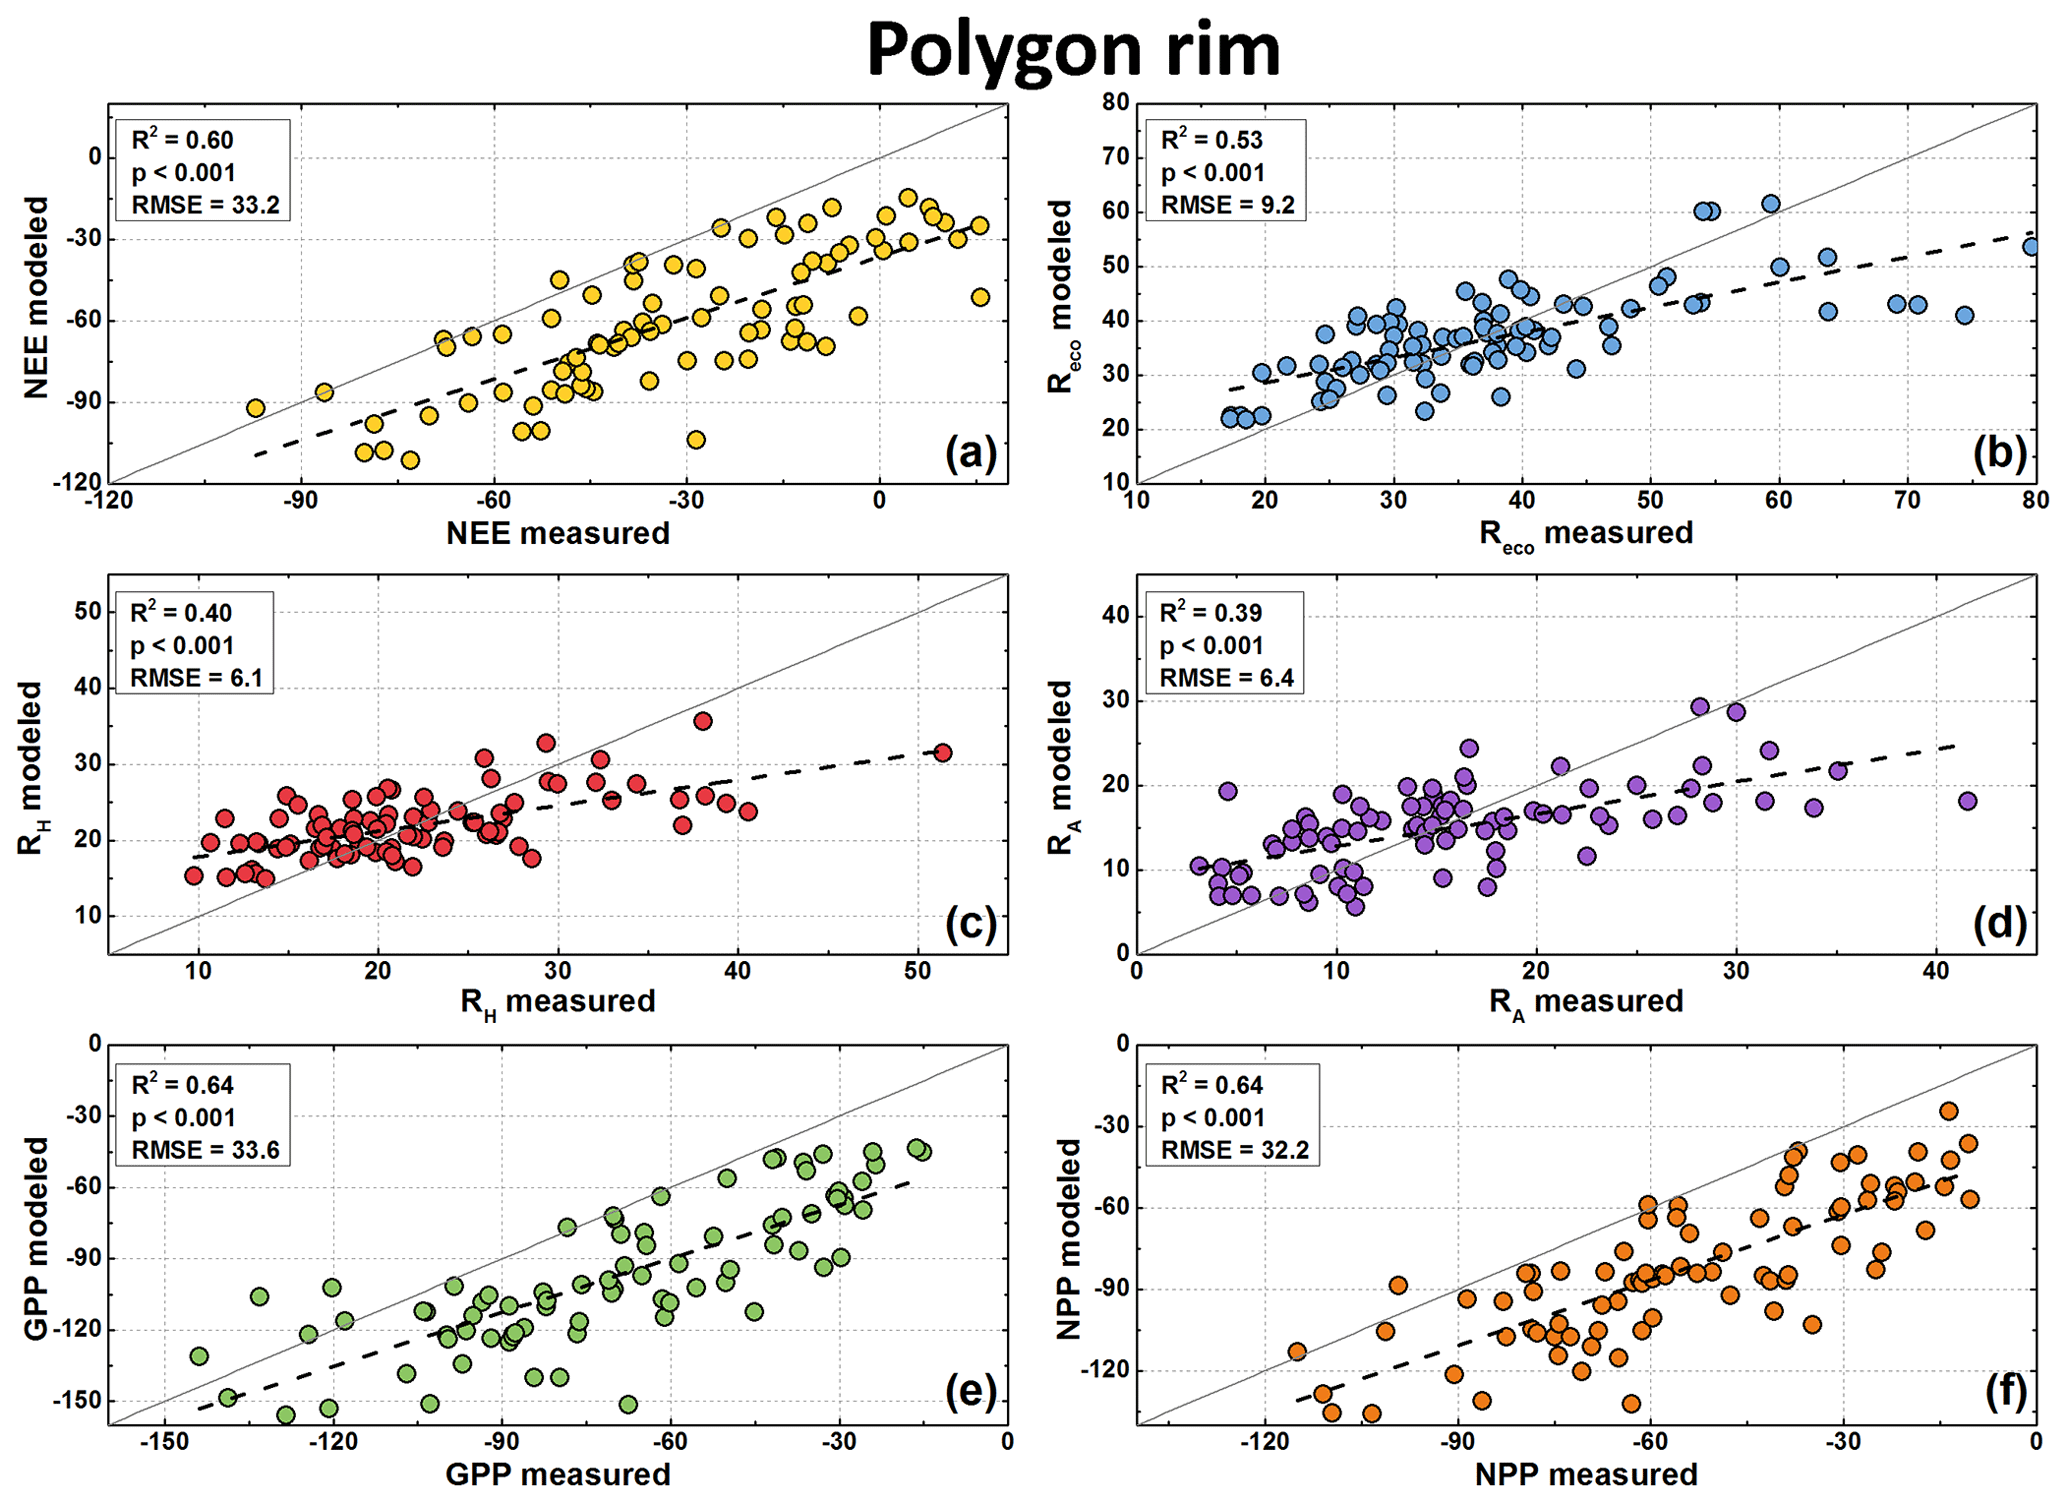
Figure 7Modeled and measured CO2 fluxes at the polygon rim in µg CO2 m−2 s−1. Measured fluxes are available for NEE (a), Reco (b), and RH (c). NEE model fluxes were calculated from modeled GPP (e) minus modeled Reco, RA model fluxes (d) from modeled Reco minus modeled RH, and NPP model fluxes (f) from modeled GPP minus modeled RA. Note the different scales of the axes.
Polygon center Reco fluxes were best modeled using surface temperature as an explanatory variable (), while for the polygon rim the soil temperature showed the best fitting (). In contrast to the Reco fluxes, the polygon center RH fluxes were best modeled when the air temperature was used as an explanatory variable (). At the polygon rim, using the soil temperature as an explanatory variable showed the best fitting () when modeling RH fluxes. Differences in the goodness of the fits for the Reco flux model were small. The of the GPP model was 0.82 for the polygon center and 0.45 for the polygon rim.
The modeled GPP, Reco, and RH fluxes were used to calculate the NEE, RA, and NPP fluxes. All fluxes showed similar seasonal patterns as fluxes from chamber measurements. The comparison between modeled and measured fluxes showed highly significant correlation (R2=0.39–0.88, p<0.001; Figs. 6 and 7). However, the fluxes at the polygon rim tended to be underestimated by the model if the respiration fluxes were high and the other fluxes were low (close to zero or positive NEE). A similar trend was observed for the respiration fluxes from the polygon center. Furthermore, NEE, GPP, and NPP fluxes seem to be generally underestimated by the flux models. However, this offset was to be expected due to the use of different PAR values for flux calculation (see Sect. 3.6).
Table 1Means and range of the modeled fluxes in µg CO2 m−2 s−1.

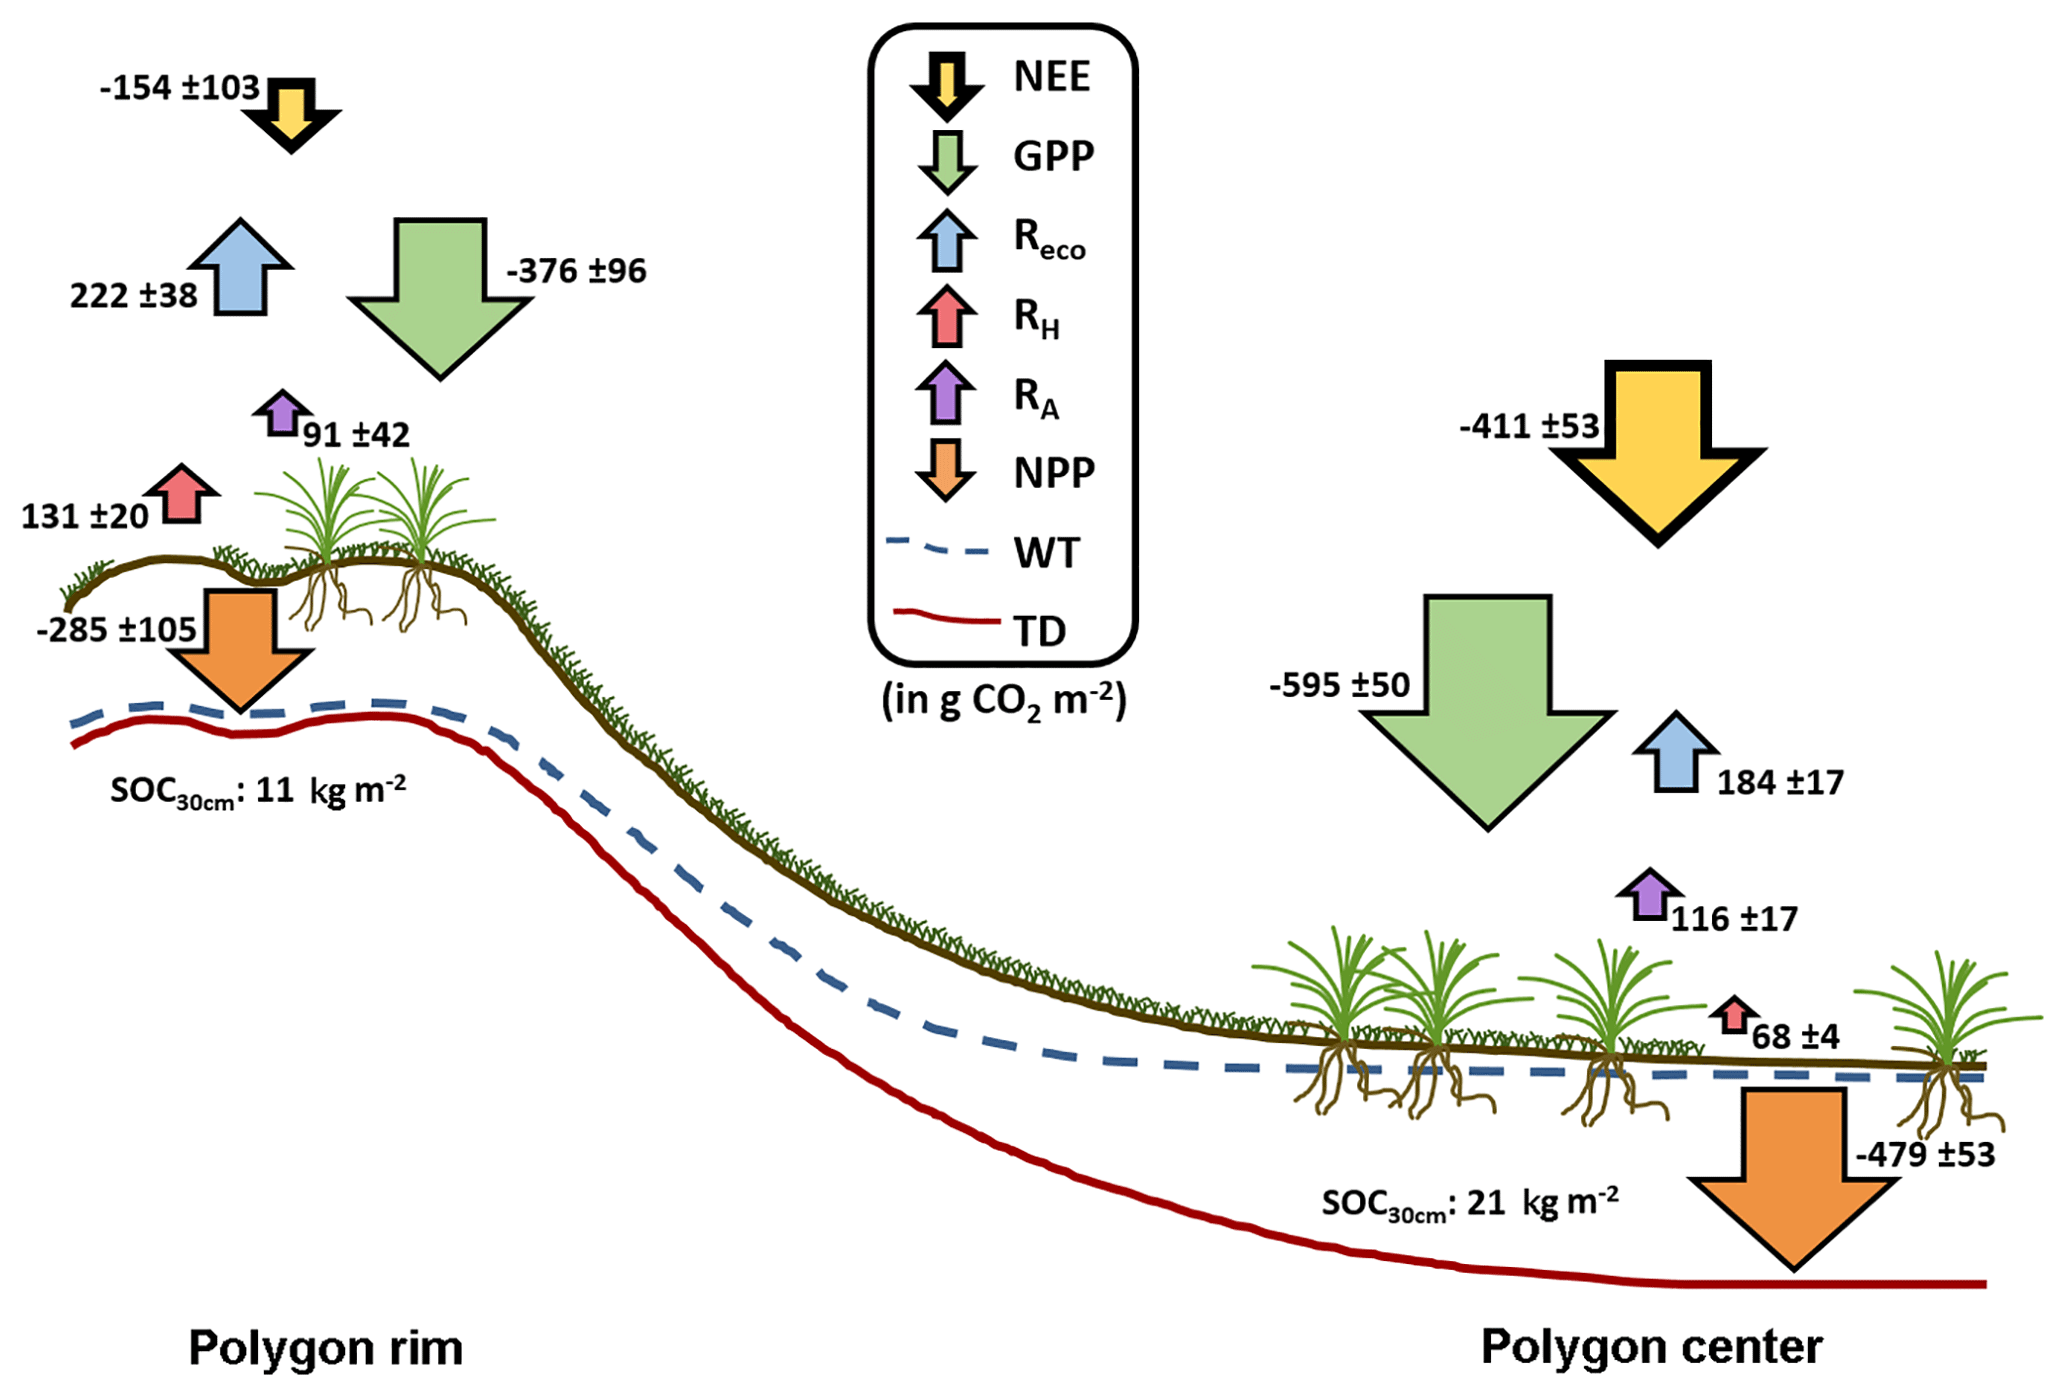
Figure 8Integrated CO2 fluxes at the polygon rim and center. The values were calculated from the model results and are given in g CO2 m−2. In total, both sites acted as a net CO2 sink during the growing season. NEE: net ecosystem exchange; GPP: gross primary productivity; Reco: ecosystem respiration; RH: heterotrophic respiration; RA: autotrophic respiration; NPP: net primary productivity; WT: water table; TD: thaw depth.
4.4 Integrated fluxes
Based on the modeled chamber CO2 fluxes, time-integrated CO2 fluxes were calculated for the period between mid-July and the end of September 2015 (Table 1, Fig. 8). The integrated GPP flux at the polygon center was significantly (t test, p<0.01) higher than at the polygon rim. In contrast, the integrated RH fluxes at the polygon rim were almost double those at the polygon center (p<0.001). This trend was also observed for Reco fluxes, although here the difference was not as large as seen for RH fluxes and was not significant (p>0.05). Furthermore, the flux differences in RA between the sites were rather small. Much higher GPP fluxes in association with lower RH and similar RA fluxes led to an integrated NEE, which was more than twice as high at the polygon center ( µg CO2 m−1 s−1) as at the rim ( µg CO2 m−1 s−1) and led to an almost twice as high NPP at the center as at the rim. The upscaled NEE from modeled chamber data correlated highly significantly (R2=0.77, p<0.001) with modeled NEE from EC data (Fig. 9). However, the upscaled NEE from modeled chamber data tended to underestimate the highest uptake and release by NEE in comparison to modeled NEE from EC data.
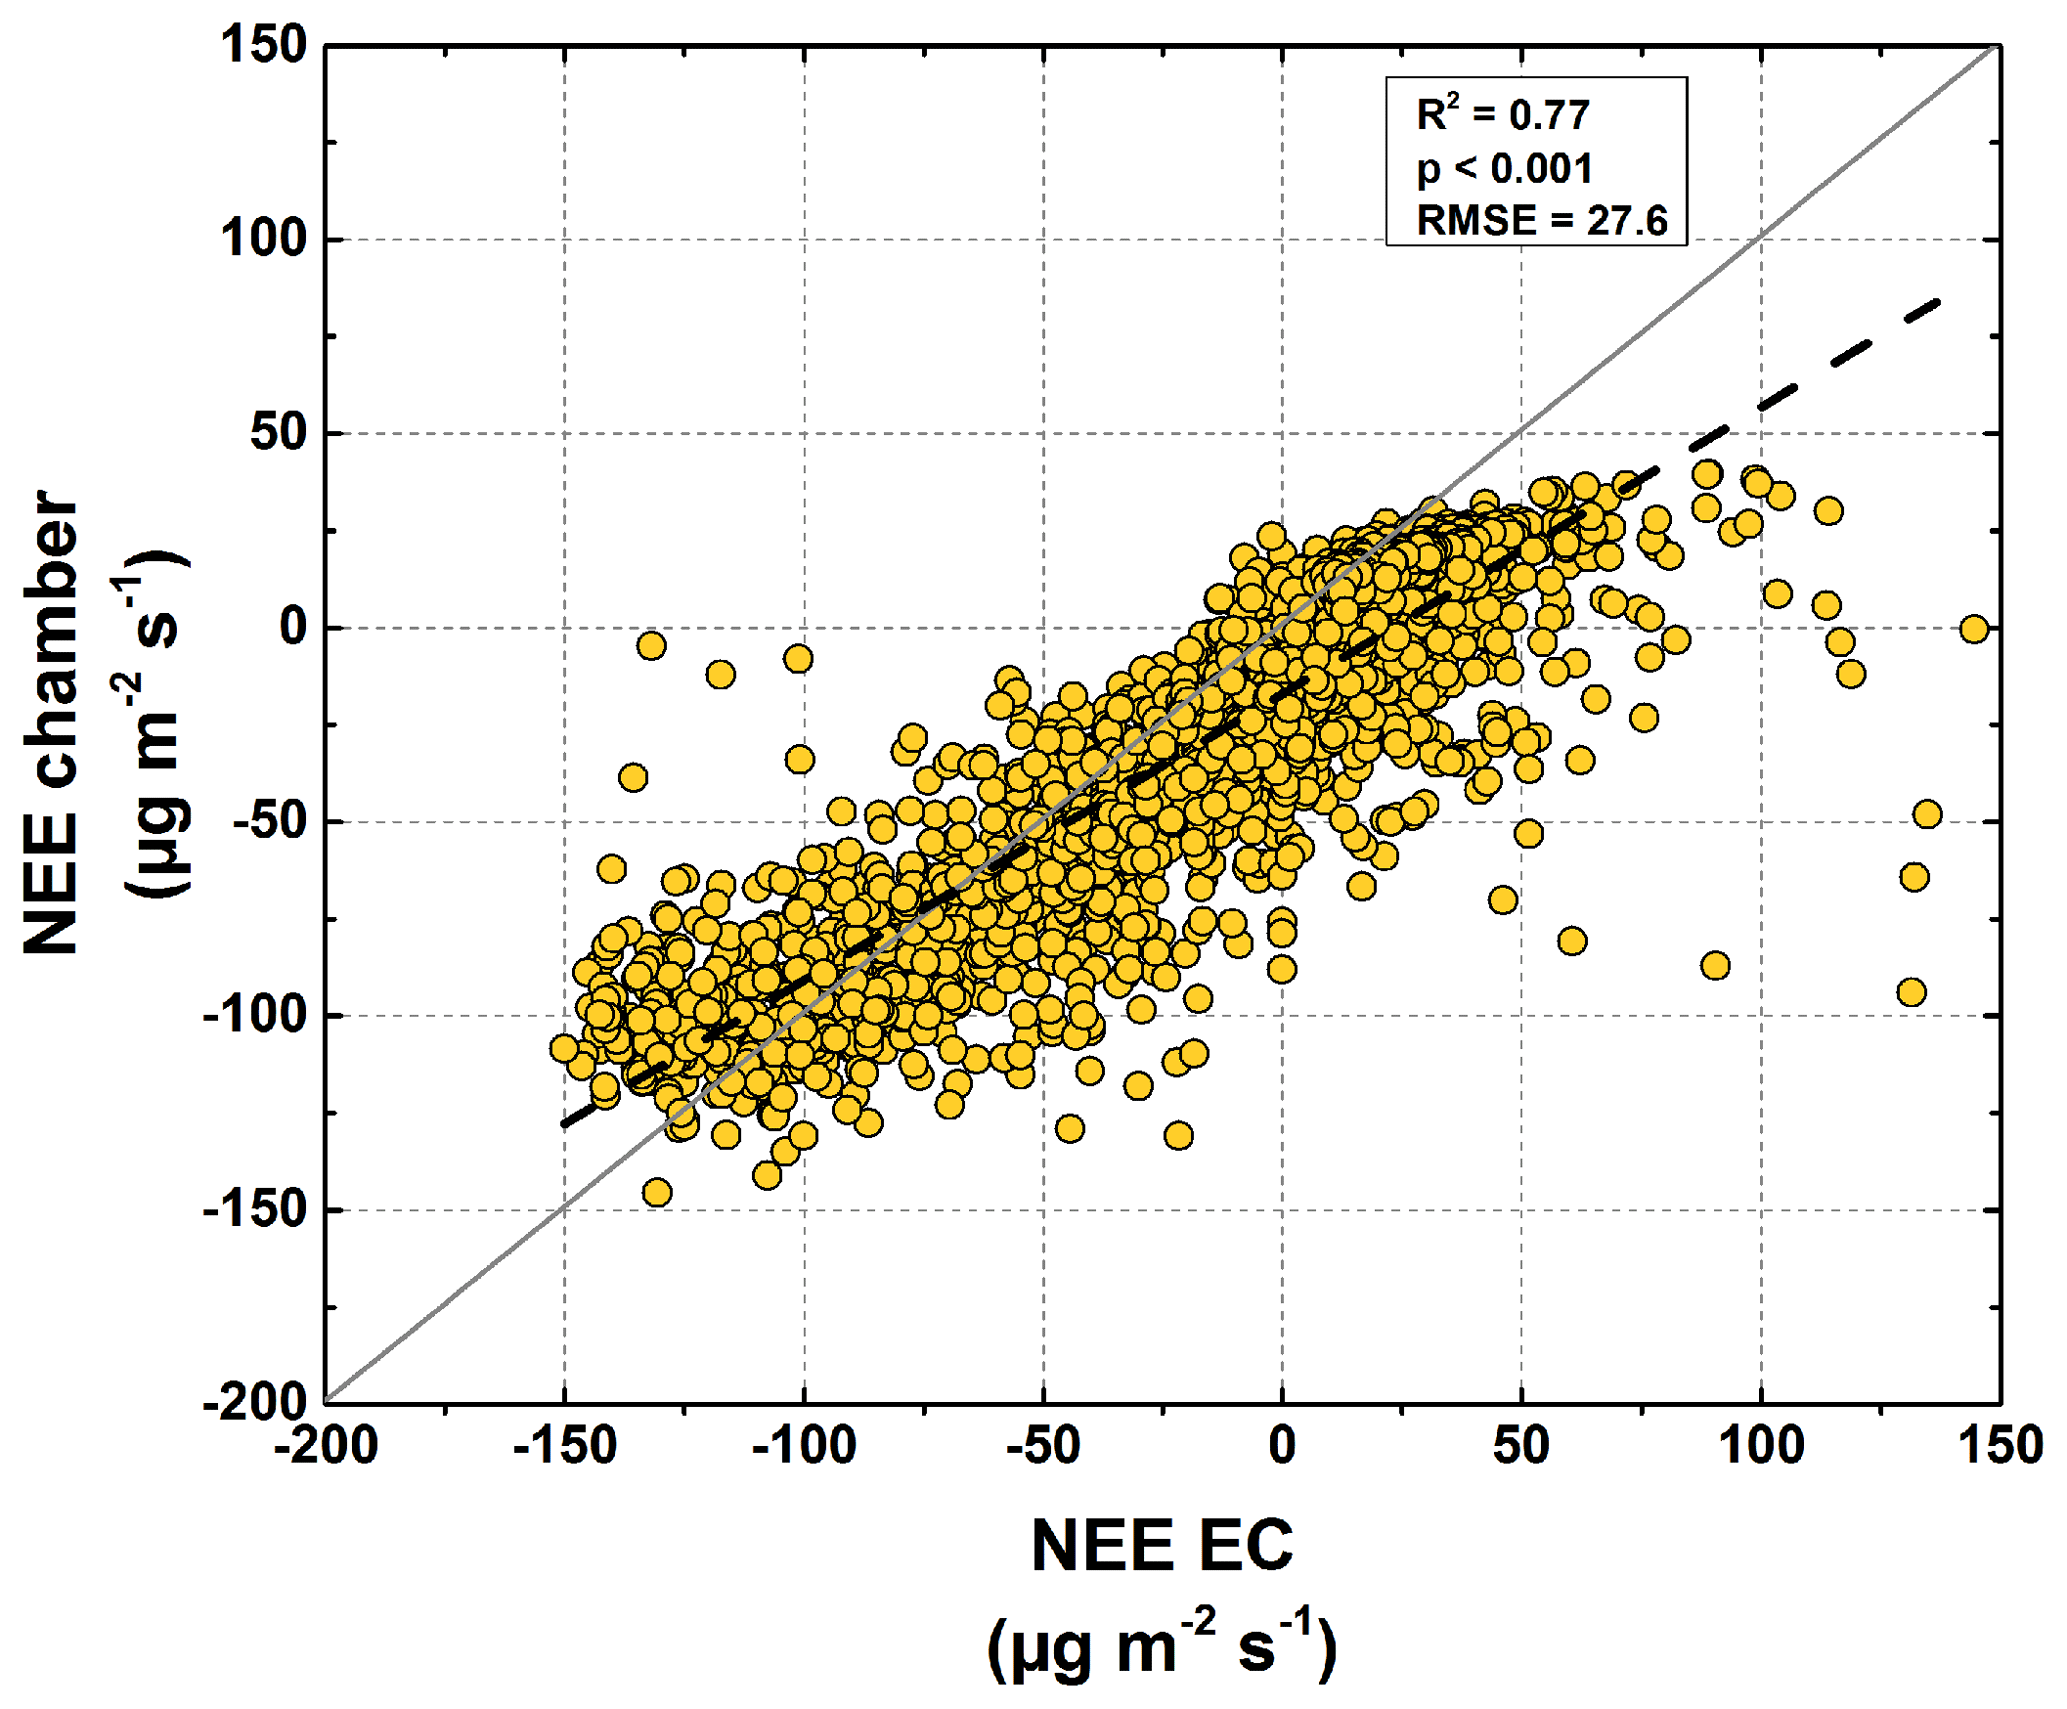
Figure 9Comparison of chamber and half-hourly averaged EC NEE. The chamber NEE was calculated based on the contribution of each surface class to the EC footprint (Eq. 5).
This study presented NEE, GPP, NPP, Reco, RH, and RA fluxes obtained from direct measurements and modeling approaches for dry and wet sites of the polygonal tundra. The RH fluxes were higher at the polygon rim compared to the center due to drier soil conditions at the rim. RA fluxes from both sites were similar, although the vascular plant cover at the center was higher, probably due to water-saturated conditions at the center. In addition, the integrated Reco fluxes at the rim were higher than at the center due to higher RH and similar RA fluxes at both sites. The mean GPP fluxes are much higher at the center compared to the rim due to differences in vegetation between the sites. Together with RA fluxes that are within the same range between the sites, the differences in GPP lead to an NPP almost 2 times higher at the center compared to the rim. In sum, both the water-saturated polygon center and the non-saturated polygon rim acted as net sinks for atmospheric CO2 for the period from mid-July to the end of September 2015. However, the CO2 sink strength differed substantially between wet and dry tundra, which can be related to the different hydrological conditions and vegetation composition
Table 2Comparison of daily averaged CO2 fluxes from different polygonal tundra sites, which are similar in vegetation and soil composition to our study site. All listed fluxes were measured with the closed-chamber technique.
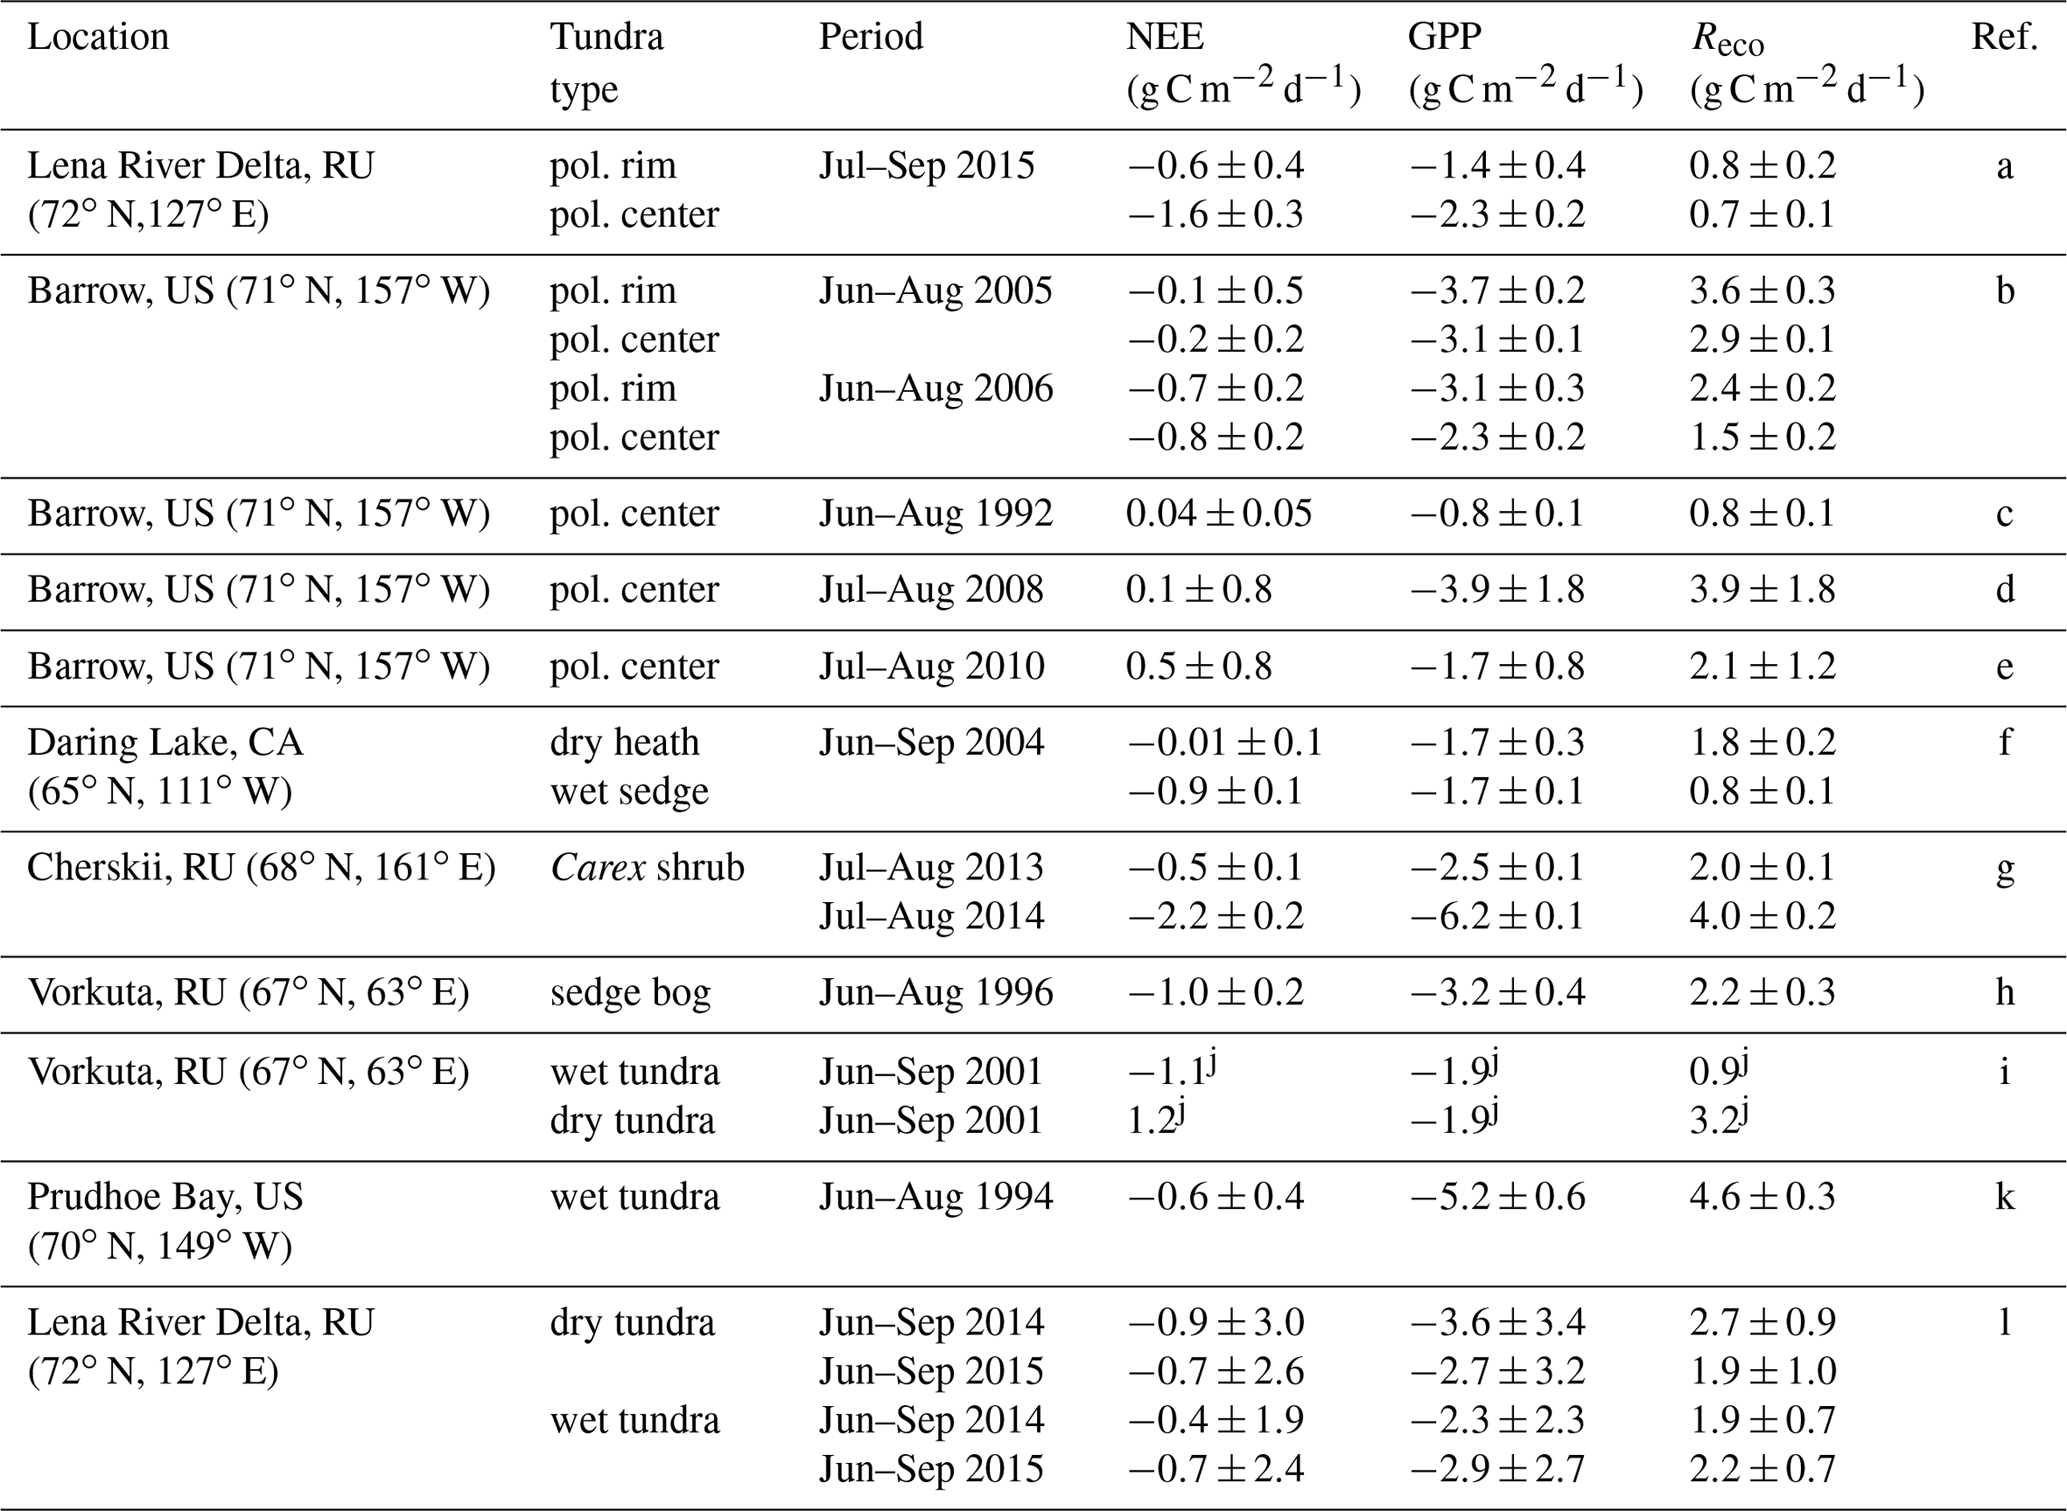
a This study; b Olivas et al. (2011); c Oechel et al. (1995); d Lara and Tweedie (2014); e Lara et al. (2012); f Nobrega and Grogan (2008); g Kwon et al. (2016); h Zamolodchikov et al. (2000); i Heikkinen et al. (2004); j standard deviation not specified; k Vourlitis et al. (2000); l Rößger et al. (2019).
5.1 CO2 fluxes from arctic tundra sites
To the best of our knowledge, CO2 fluxes from polygon rim and center sites have been reported only from Barrow, Alaska (Table 2). The daily averaged net CO2 uptake at the polygon center from this study is twice as high as reported from any other study concerning CO2 fluxes from polygonal tundra. Only the study by Olivas et al. (2011) reported the polygonal tundra to be a net sink, while other studies (Oechel et al., 1995; Lara et al., 2012; Lara and Tweedie, 2014) reported the polygonal tundra to be a net source of CO2 over the growing season. The GPP fluxes from the polygon center from this study exceed the GPP fluxes from Barrow reported by Oechel et al. (1995) and Lara et al. (2012), but they are distinctly lower than those reported by Olivas et al. (2011) and Lara and Tweedie (2014). In terms of respiration, the Reco fluxes from this study at both sites are lower compared to the reported Reco fluxes from the polygonal tundra at Barrow. However, the interannual variability of reported CO2 fluxes from Barrow is rather high, which could also be caused by different vegetation and soil composition between the sites at Barrow.
A comparison of the CO2 fluxes from the wet and dry site from this study with other wet and dry sites of the arctic tundra revealed rather low photosynthesis and respiration rates from the polygonal tundra on Samoylov Island (Table 2). The Reco fluxes from this study at both sites are the lowest compared to other sites, and the GPP fluxes of the polygon rim from this study are at the lower end compared to other dry sites, while the GPP fluxes of the polygon center are between the fluxes from other wet sites. Only one study from a Carex shrub site in Cherskii reported higher NEE (Kwon et al., 2016) compared to the polygon center from this study. Both the moderate GPP and low Reco fluxes at the polygon center lead to rather high net CO2 uptake compared to other arctic tundra sites.
5.2 Factors controlling CO2 fluxes
The rather moderate GPP and low Reco fluxes of the polygonal tundra on Samoylov Island compared to other arctic sites might be due to differences in vegetation composition, organic matter contents, low nutrient availability, or low temperatures and radiation at the study site. The polygonal tundra on Samoylov Island is considered an ecosystem with rather moderate GPP due to its low vascular plant cover with a maximum leaf coverage of 0.3 (Kutzbach et al., 2007b). Mosses, which have a high coverage (>0.9), were dominant at both sites and have a much lower photosynthetic capacity than vascular plants (Brown et al., 1980). In general, the photosynthesis of vascular plants and respiration fluxes are lowered due to the low nutrient availability in arctic tundra ecosystems (Shaver et al., 1998). A low nutrient availability is typical for most tundra soils due to water-saturated conditions and low soil temperatures (Johnson et al., 2000). These conditions cause low microbial decomposition rates (Hobbie et al., 2002), which in turn result in a low supply of bioavailable nutrients (Beermann et al., 2015). However, following Sanders et al. (2010) the nitrogen turnover rates of the soils found at the study site can be estimated as rather low compared to other arctic tundra sites. Additionally, the long-term average net radiation at the study site (June to August, 1999–2011) was 85 W m−2 (1999–2011), which is lower than values reported from other arctic tundra sites in Alaska and Greenland (Boike et al., 2013; e.g., Wendler and Eaton, 1990; Oechel et al., 2014; Soegaard et al., 2001; Lynch et al., 1999). These factors might explain the comparatively low Reco and moderate GPP fluxes at the polygon rim and center compared to other arctic tundra sites.
The differences observed in GPP between the polygon rim and center can be related to the vascular plant coverage. The polygon center had a much higher abundance of sedges, while the rim was moss dominated, and the sparsely spread vascular plants had shorter and fewer leaves. Therefore, the photosynthetic capacity is higher at the polygon center than at the rim, resulting in the center having a higher GPP. Additionally, limited water availability due to the elevation of the polygon rim caused moisture runoff, with a drier or desiccated moss layer, which may have contributed to a lower GPP (Olivas et al., 2011). On the other hand, Olivas et al. (2011) found GPP fluxes to be higher at a polygon rim than at a polygon center in the Alaskan coastal plains. They related low GPP fluxes at the polygon center to the submersion of the moss layer and vascular plants. At the polygon center of the current study, the WT was frequently below the soil surface so that the submersion of erect vascular plants was not regularly observed, and most of the moss layer itself was not submerged. This difference in GPP between the Alaskan study sites (Olivas et al., 2011) and those presented in this study reveals the important influence, beside the vegetation composition, of water level and its fluctuations throughout the season on CO2 fluxes.
Differences in respiration fluxes between the wet and dry sites can be related to different soil conditions. The cold and waterlogged conditions, typical for the polygon centers, reduced the decomposition of SOM due to oxygen limitation, causing low microbial activity and therefore low RH (Hobbie et al., 2002; Walz et al., 2017). Furthermore, moisture runoff at the rim created drier conditions in the topsoil, which increased soil oxygen availability and subsequently enhanced RH and Reco (Oechel et al., 1998). In addition, the stronger diurnal amplitude of the soil temperature at the polygon rim compared to the center led to higher daily soil temperatures. Both the increased temperatures and oxygen supply at the polygon rim relative to the center enhance microbial decomposition, causing higher RH fluxes to be observed at the polygon rim. As such, the low CO2 uptake (NEE) at the rim is caused not only by low GPP, but also by higher Reco fluxes compared to the center. The higher NEE at the polygon center compared to the rim is mainly driven by substantially higher GPP and lower RH fluxes, which are due to differences in vascular plant cover, temperature, and hydrology. This finding is in good agreement with Nobrega and Grogan (2008), who compared a wet sedge, dry heath, and mesic birch site and found that the highest CO2 uptake at the wet sedge site was due to limited Reco associated with waterlogged conditions.
Measurements of CO2 fluxes at the polygon rim showed an increase in net CO2 uptake throughout September, whereas at the polygon center the NEE appeared to continuously decrease (lower net uptake of CO2). This increase in late-season NEE at the polygon rim cannot be explained by rising PAR or temperature, but it may be related to the photosynthetic activity of mosses. At the study site, Kutzbach et al. (2007b) considered September as the period during which moss photosynthesis dominates GPP. During this time of the growing season, mosses can still assimilate substantial amounts of CO2 because they tend to reach light saturation at lower irradiance (Harley et al., 1989). The photosynthetic activity of mosses declines rapidly when they face desiccation because they cannot actively control their tissue water content (Turetsky et al., 2012). Additionally, it has been shown that mosses face light stress during times of high PAR (Murray et al., 1993). This light stress causes delayed senescence and more late-season photosynthesis (Zona et al., 2011). On Samoylov, the photosynthetic activity on the moss-dominated polygon rim is expected to be low during warm and dry periods, such as those seen at the beginning of September 2015, and during times of high PAR. In contrast, with continuous rainfall, dew formation, and the lower PAR observed in mid-September, the mosses on the polygon rim are likely to have resumed their metabolic activity, which led to increasing NEE at the rim. These findings are in good agreement with Olivas et al. (2011), who reported the highest contribution of mosses to GPP at the beginning and end of the growing season.
5.3 Partitioning respiration fluxes in arctic tundra ecosystems
To date, only a few studies have estimated RH fluxes from arctic tundra ecosystems over a growing season under in situ conditions (Nobrega and Grogan, 2008; Biasi et al., 2014). Surprisingly, the differences in RH flux estimates reported in the literature and those presented in this study were rather low. Differences in RH fluxes measured with the trenching method may result from differences in the time between trenching and the start of the measurements. Nobrega and Grogan (2008), for example, started their RH measurements 1 d after clipping, while measurements in this study and that of Biasi et al. (2014) started about 1 year after treatment. Therefore, although these studies employed a similar partitioning approach for seasonal estimates of RH fluxes, any comparison must be made with caution. The few RH flux estimates in the literature from other arctic tundra sites were higher than the RH values from the Lena River Delta (0.5±0.1 and 0.3±0.02 g C m−2 d−1 at the polygon rim and center, respectively). Higher growing season RH fluxes than found in this study (0.8–1.8 g C m−2 d−1) have been measured at a mesic birch and dry heath site at Daring Lake in Canada (Nobrega and Grogan, 2008) and at a bare peat site (1.0 g C m−2 d−1) in the subarctic tundra at Seida, Russia (Biasi et al., 2014). Both sites contained substantially higher amounts of SOC in the organic-rich layer than the soil at the polygon rim and were well-aerated compared to the soil at the polygon center, both of which likely caused a higher organic matter decomposition rate and could explain the higher RH fluxes than found at the polygonal tundra sites. Similar RH fluxes to those reported in our study were measured at a wet sedge site in Daring Lake (0.4 g C m−2 d−1) (Nobrega and Grogan, 2008), where soil and environmental conditions like WT, ALD, soil temperature, vegetation, and SOC were similar to the Samoylov sites and vegetated peat sites in Seida (0.4–0.6 g C m−2 d−1) (Biasi et al., 2014). Despite these differences, the average contributions of RH to Reco of 42 % at the center and 60 % at the rim are in good agreement with those observed at Seida (37 %–64 %) and Daring Lake (44 %–64 %). Similar contributions have also been determined from arctic tussock tundra sites, where RH makes up approximately 40 % of growing season Reco (Segal and Sullivan, 2014; Nowinski et al., 2010), and from a moist acidic tussock tundra site (Hicks Pries et al., 2013). In contrast to these results, in a subarctic peatland, Dorrepaal et al. (2009) report a substantially higher contribution of RH to Reco of about 70 %. The different contribution of RH to Reco at the polygon rim and center on Samoylov Island can be related to differences in vascular plant coverage and moisture conditions between these sites. The higher GPP at the center relative to the rim also caused higher rates of RA, in turn lowering the contribution of RH to Reco. Additionally, anoxic soil conditions due to standing water, which characterized the polygon center, reduced SOM decomposition rates. Furthermore, Moyano et al. (2013) and Nobrega and Grogan (2008) have shown that consistently moderate moisture conditions, as at the polygon rim, promote microbial activity and therefore enable higher RH rates than at the center.
At the polygon center, the WT significantly correlated with Reco and RA fluxes, but no correlation between RH fluxes and WT was found. In contrast to this, none of the determined respiration fluxes (Reco, RH, RA) correlated with VWC at the polygon rim, which might be due to a rather low range of VWC (28 %–34 %). The RA fluxes may be negatively affected by high WT due to the submersion of the moss layer and part-wise vascular leaves, as submersion can lead to plant stress, reducing productivity and nutrient turnover (Gebauer et al., 1995). However, if RA fluxes were reduced due to low photosynthetic activity, we would expect a correlation between GPP and RA fluxes, as observed at the polygon rim (R2=0.48, p<0.05) but not at the center (R2=0.01, p>0.05). Instead, only half as much CO2 is released by RA at the center compared to the rim at similar GPP fluxes, as the GPP : RA ratio indicates (10.5 vs. 5.1 for the polygon center and rim, respectively). It is likely that RA is reduced due to water-saturated soils, as shown previously for Reco fluxes in the Arctic (e.g., Christensen et al., 1998), perhaps due to slow diffusion under water-saturated conditions (Frank et al., 1996). Furthermore, it might be possible that RH fluxes are not affected by water table fluctuations as the decomposition of SOM could take place in deeper layers. This finding is in contrast to a set of studies that attributed correlations between Reco fluxes and WT fluctuations solely to the impact of oxygen availability on RH fluxes (Juszczak et al., 2013; Chimner and Cooper, 2003; Dorrepaal et al., 2009) or an observed impact of moisture conditions on RH fluxes across multiple peatland ecosystems (Estop-Aragonés et al., 2018), while another study has shown no effect between water table fluctuations and Reco fluxes (Chivers et al., 2009). However, the partitioning approach used in this study showed that RH fluxes are not responding to water table fluctuations. Instead the CO2 release by RA is correlated with water table fluctuations. These findings show the importance of hydrologic conditions for Reco fluxes and the need for partitioning approaches to understand the response of individual Reco fluxes to changing hydrologic conditions.
To determine the impact of hydrological conditions and temperature on RH and RA fluxes, it would be useful to perform both warming and wetting experiments in situ. So far, although a number of studies have determined the temperature response of NEE, GPP, and Reco fluxes in arctic ecosystems with warming experiments (e.g., Natali et al., 2011; Frey et al., 2008; Voigt et al., 2017), much less research has focused on the response of RA and RH fluxes to increasing temperature (Hicks Pries et al., 2015). Wetting experiments in arctic tundra ecosystems to determine the individual response of RA and RH fluxes to changing hydrological conditions are also lacking. As climate change will likely lead to strong changes in the hydrological regimes of Siberian tundra regions (Zimov et al., 2006b; Merbold et al., 2009), the responses of respiration fluxes to altered hydrological conditions should be addressed in future studies.
The contributions of GPP, Reco, RH, and RA fluxes to NEE in a drained (rim) and water-saturated (center) site in the arctic polygonal tundra of northeast Siberia have been quantified in this study. Both investigated sites acted as CO2 sinks during the measurement period from mid-July to the end of September 2015. The polygon center was a considerably stronger CO2 sink than the polygon rim. The main drivers behind these differences in CO2 fluxes at the pedon scale were the higher GPP at the polygon center and lower RH fluxes at the polygon center. The substantial differences in NEE between the dry and wet tundra sites highlight the importance of pedon-scale measurements for reliable estimates of CO2 surface–atmosphere fluxes from arctic tundra sites and the important role of soil moisture conditions in CO2 fluxes. Hereby, it was shown that RA fluxes respond to water table changes, with a low release of CO2 by RA fluxes during times of a high water table. Therefore, future studies on CO2 fluxes from arctic tundra ecosystems should focus on the role of hydrological conditions as a driver of these fluxes.
All datasets shown are available at https://doi.org/10.1594/PANGAEA.898876 (last access: 4 April 2019; Eckhardt et al., 2019).
TE, CK, LK, and EMP designed the study. GS and TE performed the chamber measurements and laboratory analysis. DH and TE performed the visualization of flux comparisons. TE wrote the paper with contributions from all authors.
The authors declare that they have no conflict of interest.
We would like to thank the members of the joint Russian–German field campaigns LENA 2014 and LENA 2015, especially Mikhail N. Gregoriev (Permafrost Institute, Yakutsk, Russia), Waldemar Schneider, and Günter Stoof (Alfred Wegener Institute for Polar and Marine Research, Potsdam, Germany), and the crew of the Russian research station Samoylov for logistical as well as technical support. We are grateful to Josefine Walz and Mercedes Molina Gámez for valuable help with chamber measurements and Norman Roessger for intensive support on model development (all Institute of Soil Science, Universität Hamburg). This work was supported by the German Ministry of Education and Research (CarboPerm Project, BMBF grant no. 03G0836A; KoPf Project, BMBF grant no. 03F0764A). The German coauthors received additional support from the Cluster of Excellence CliSAP (EXC177) at the University of Hamburg funded by the German Research Foundation (DFG). We are also grateful for the reviews of Albertus J. Dolman and two anonymous reviewers and the comments of the editor Lutz Merbold on a previous version of this paper.
This paper was edited by Lutz Merbold and reviewed by Albertus J. (Han) Dolman and two anonymous referees.
Aalto, J., le Roux, P. C., and Luoto, M.: Vegetation mediates soil temperature and moisture in arctic-alpine environments, Arct. Antarct. Alp. Res., 45, 429–439, https://doi.org/10.1657/1938-4246-45.4.429, 2013.
AMAP: Snow, Water, Ice and Permafrost in the Arctic (SWIPA) 2017, Arctic Monitoring and Assessment Programme (AMAP), Oslo, Norway, xiv, 269 pp., 2017.
Beermann, F., Teltewskoi, A., Fiencke, C., Pfeiffer, E. M., and Kutzbach, L.: Stoichiometric analysis of nutrient availability (N, P, K) within soils of polygonal tundra, Biogeochemistry, 122, 211–227, https://doi.org/10.1007/s10533-014-0037-4, 2015.
Beermann, F., Langer, M., Wetterich, S., Strauss, J., Boike, J., Fiencke, C., Schirrmeister, L., Pfeiffer, E.-M., and Kutzbach, L.: Permafrost Thaw and Liberation of Inorganic Nitrogen in Eastern Siberia, Permafrost Periglac., 28, 605–618, https://doi.org/10.1002/ppp.1958, 2017.
Biasi, C., Jokinen, S., Marushchak, M. E., Hämäläinen, K., Trubnikova, T., Oinonen, M., and Martikainen, P. J.: Microbial Respiration in Arctic Upland and Peat Soils as a Source of Atmospheric Carbon Dioxide, Ecosystems, 17, 112–126, https://doi.org/10.1007/s10021-013-9710-z, 2014.
Boike, J., Kattenstroth, B., Abramova, K., Bornemann, N., Chetverova, A., Fedorova, I., Fröb, K., Grigoriev, M., Grüber, M., Kutzbach, L., Langer, M., Minke, M., Muster, S., Piel, K., Pfeiffer, E.-M., Stoof, G., Westermann, S., Wischnewski, K., Wille, C., and Hubberten, H.-W.: Baseline characteristics of climate, permafrost and land cover from a new permafrost observatory in the Lena River Delta, Siberia (1998–2011), Biogeosciences, 10, 2105–2128, https://doi.org/10.5194/bg-10-2105-2013, 2013.
Brown, J., Miller, P. C., Tieszen, L. L., and Bunnell, F.: An arctic ecosystem: the coastal tundra at Barrow, Alaska, Dowden, Hutchinson & Ross, Inc., Stroudsberg, PA, USA, 1980.
Burnham, K. P. and Anderson, D. R.: Multimodel inference – understanding AIC and BIC in model selection, Sociol. Method. Res., 33, 261–304, https://doi.org/10.1177/0049124104268644, 2004.
Chapin, F. S., Woodwell, G. M., Randerson, J. T., Rastetter, E. B., Lovett, G. M., Baldocchi, D. D., Clark, D. A., Harmon, M. E., Schimel, D. S., Valentini, R., Wirth, C., Aber, J. D., Cole, J. J., Goulden, M. L., Harden, J. W., Heimann, M., Howarth, R. W., Matson, P. A., McGuire, A. D., Melillo, J. M., Mooney, H. A., Neff, J. C., Houghton, R. A., Pace, M. L., Ryan, M. G., Running, S. W., Sala, O. E., Schlesinger, W. H., and Schulze, E.-D.: Reconciling Carbon-cycle Concepts, Terminology, and Methods, Ecosystems, 9, 1041–1050, https://doi.org/10.1007/s10021-005-0105-7, 2006.
Chemidlin Prévost-Bouré, N., Ngao, J., Berveiller, D., Bonal, D., Damesin, C., Dufrêne, E., Lata, J.-C., Le Dantec, V., Longdoz, B., Ponton, S., Soudani, K., and Epron, D.: Root exclusion through trenching does not affect the isotopic composition of soil CO2 efflux, Plant Soil, 319, 1–13, https://doi.org/10.1007/s11104-008-9844-5, 2009.
Chen, J., Luo, Y., Xia, J., Shi, Z., Jiang, L., Niu, S., Zhou, X., and Cao, J.: Differential responses of ecosystem respiration components to experimental warming in a meadow grassland on the Tibetan Plateau, Agr. Forest Meteorol., 220, 21–29, https://doi.org/10.1016/j.agrformet.2016.01.010, 2016.
Chimner, R. A. and Cooper, D. J.: Influence of water table levels on CO2 emissions in a Colorado subalpine fen: an in situ microcosm study, Soil Biol. Biochem., 35, 345–351, https://doi.org/10.1016/S0038-0717(02)00284-5, 2003.
Chivers, M. R., Turetsky, M. R., Waddington, J. M., Harden, J. W., and McGuire, A. D.: Effects of Experimental Water Table and Temperature Manipulations on Ecosystem CO2 Fluxes in an Alaskan Rich Fen, Ecosystems, 12, 1329–1342, https://doi.org/10.1007/s10021-009-9292-y, 2009.
Christensen, J. H., Kanikicharla, K. K., Marshall, G., and Turner, J.: Climate phenomena and their relevance for future regional climate change, in: Climate Change 2013: The physical science basis, Contribution of Working Group I to the fifth Assessment of the Intergovernmental Panel on Climate Change, Cambridge, Cambridge University Press, 1217–1308, 2013.
Christensen, T. R., Jonasson, S., Michelsen, A., Callaghan, T. V., and Havström, M.: Environmental controls on soil respiration in the Eurasian and Greenlandic Arctic, J. Geophys. Res., 103, 29015–29021, https://doi.org/10.1029/98JD00084, 1998.
Christiansen, J. R., Korhonen, J. F. J., Juszczak, R., Giebels, M., and Pihlatie, M.: Assessing the effects of chamber placement, manual sampling and headspace mixing on CH4 fluxes in a laboratory experiment, Plant Soil, 343, 171–185, https://doi.org/10.1007/s11104-010-0701-y, 2011.
Corradi, C., Kolle, O., Walter, K., Zimov, S. A., and Schulze, E. D.: Carbon dioxide and methane exchange of a north-east Siberian tussock tundra, Glob. Change Biol., 11, 1910–1925, https://doi.org/10.1111/j.1365-2486.2005.01023.x, 2005.
Diaz-Pines, E., Schindlbacher, A., Pfeffer, M., Jandl, R., Zechmeister-Boltenstern, S., and Rubio, A.: Root trenching: a useful tool to estimate autotrophic soil respiration? A case study in an Austrian mountain forest, Eur. J. For. Res., 129, 101–109, https://doi.org/10.1007/s10342-008-0250-6, 2010.
Dorrepaal, E., Toet, S., van Logtestijn, R. S. P., Swart, E., van de Weg, M. J., Callaghan, T. V., and Aerts, R.: Carbon respiration from subsurface peat accelerated by climate warming in the subarctic, Nature, 460, 616–679, https://doi.org/10.1038/nature08216, 2009.
Durbin, J. and Watson, G. S.: Testing for serial correlation in least sqaures regression: 1, Biometrika, 37, 409–428, https://doi.org/10.1093/biomet/37.3-4.409, 1950.
Eckhardt, T. and Kutzbach, L.: MATLAB code to calculate gas fluxes from chamber-based methods, Pangaea, https://doi.org/10.1594/PANGAEA.857799, 2016.
Eckhardt, T., Knoblauch, C., Kutzbach, L., Holl, D., Simpson, G., Abakumov, E., and Pfeiffer, E.-M.: Carbon dioxide fluxes and soil, vegetation, meteorological data from a polygonal tundra in northeastern Siberia, Pangaea, https://doi.org/10.1594/PANGAEA.898876, 2019.
Elberling, B., Michelsen, A., Schädel, C., Schuur, E. A., Christiansen, H. H., Berg, L., Tamstorf, M. P., and Sigsgaard, C.: Long-term CO2 production following permafrost thaw, Nat. Clim. Change, 3, 890, https://doi.org/10.1038/NCLIMATE1955, 2013.
Elmendorf, S. C., Henry, G. H. R., Hollister, R. D., Björk, R. G., Boulanger-Lapointe, N., Cooper, E. J., Cornelissen, J. H. C., Day, T. A., Dorrepaal, E., Elumeeva, T. G., Gill, M., Gould, W. A., Harte, J., Hik, D. S., Hofgaard, A., Johnson, D. R., Johnstone, J. F., Jónsdóttir, I. S., Jorgenson, J. C., Klanderud, K., Klein, J. A., Koh, S., Kudo, G., Lara, M., Lévesque, E., Magnússon, B., May, J. L., Mercado-Díaz, J. A., Michelsen, A., Molau, U., Myers-Smith, I. H., Oberbauer, S. F., Onipchenko, V. G., Rixen, C., Martin Schmidt, N., Shaver, G. R., Spasojevic, M. J., Þórhallsdóttir, Þ. E., Tolvanen, A., Troxler, T., Tweedie, C. E., Villareal, S., Wahren, C.-H., Walker, X., Webber, P. J., Welker, J. M., and Wipf, S.: Plot-scale evidence of tundra vegetation change and links to recent summer warming, Nat. Clim. Change, 2, 453–457, https://doi.org/10.1038/nclimate1465, 2012.
Estop-Aragonés, C., Cooper, M. D., Fisher, J. P., Thierry, A., Garnett, M. H., Charman, D. J., Murton, J. B., Phoenix, G. K., Treharne, R., and Sanderson, N. K.: Limited release of previously-frozen C and increased new peat formation after thaw in permafrost peatlands, Soil Biol. Biochem., 118, 115–129, 2018.
Frank, M. J., Kuipers, J. A. M., and van Swaaij, W. P. M.: Diffusion coefficients and viscosities of CO2+H2O, CO2+CH3OH, NH3+H2O, and NH3+CH3OH liquid mixtures, J. Chem. Eng. Data, 41, 297–302, https://doi.org/10.1021/je950157k, 1996.
Frey, S. D., Drijber, R., Smith, H., and Melillo, J.: Microbial biomass, functional capacity, and community structure after 12 years of soil warming, Soil Biol. Biochem., 40, 2904–2907, https://doi.org/10.1016/j.soilbio.2008.07.020, 2008.
Gebauer, R. L. E., Reynolds, J. F., and Tenhunen, J. D.: Growth and allocation of the arctic sedges Eriohorum angustifolium and E. vaginatum: effects of variable soil oxygen and nutrient availability, Oecologia, 104, 330–339, https://doi.org/10.1007/bf00328369, 1995.
Görres, C. M., Kutzbach, L., and Elsgaard, L.: Comparative modeling of annual CO2 flux of temperate peat soils under permanent grassland management, Agr. Ecosyst. Environ., 186, 64–76, https://doi.org/10.1016/j.agee.2014.01.014, 2014.
Grogan, P. and Chapin, F. S.: Initial effects of experimental warming on above- and belowground components of net ecosystem CO2 exchange in arctic tundra, Oecologia, 125, 512–520, https://doi.org/10.1007/s004420000490, 2000.
Grosse, G., Harden, J., Turetsky, M., McGuire, A. D., Camill, P., Tarnocai, C., Frolking, S., Schuur, E. A. G., Jorgenson, T., Marchenko, S., Romanovsky, V., Wickland, K. P., French, N., Waldrop, M., Bourgeau-Chavez, L., and Striegl, R. G.: Vulnerability of high-latitude soil organic carbon in North America to disturbance, J. Geophys. Res.-Biogeo., 116, G00K06, https://doi.org/10.1029/2010jg001507, 2011.
Hanson, P. J., Edwards, N. T., Garten, C. T., and Andrews, J. A.: Separating root and soil microbial contributions to soil respiration: A review of methods and observations, Biogeochemistry, 48, 115–146, https://doi.org/10.1023/a:1006244819642, 2000.
Harley, P. C., Tenhunen, J. D., Murray, K. J., and Beyers, J.: Irradiance and temperature effects on photosynthesis of tussock tundra Sphagnum mosses from the foothills of the Philip Smith Mountains, Alaska, Oecologia, 79, 251–259, https://doi.org/10.1007/bf00388485, 1989.
Heikkinen, J. E. P., Virtanen, T., Huttunen, J. T., Elsakov, V., and Martikainen, P. J.: Carbon balance in East European tundra, Global Biogeochem. Cy., 18, GB1023, https://doi.org/10.1029/2003GB002054, 2004.
Helbig, M., Chasmer, L. E., Desai, A. R., Kljun, N., Quinton, W. L., and Sonnentag, O.: Direct and indirect climate change effects on carbon dioxide fluxes in a thawing boreal forest-wetland landscape, Glob. Change Biol., 23, 3231–3248, https://doi.org/10.1111/gcb.13638, 2017.
Hicks Pries, C. E., Schuur, E. A., and Crummer, K. G.: Thawing permafrost increases old soil and autotrophic respiration in tundra: partitioning ecosystem respiration using delta 13C and 14C, Glob. Change Biol., 19, 649–661, https://doi.org/10.1111/gcb.12058, 2013.
Hicks Pries, C. E., van Logtestijn, R. S., Schuur, E. A., Natali, S. M., Cornelissen, J. H., Aerts, R., and Dorrepaal, E.: Decadal warming causes a consistent and persistent shift from heterotrophic to autotrophic respiration in contrasting permafrost ecosystems, Glob. Change Biol., 21, 4508–4519, https://doi.org/10.1111/gcb.13032, 2015.
Hobbie, S. E., Nadelhoffer, K. J., and Högberg, P.: A synthesis: The role of nutrients as constraints on carbon balances in boreal and arctic regions, Plant Soil, 242, 163–170, https://doi.org/10.1023/a:1019670731128, 2002.
Holl, D., Wille, C., Sachs, T., Schreiber, P., Runkle, B. R. K., Beckebanze, L., Langer, M., Boike, J., Pfeiffer, E.-M., Fedorova, I., Bolshianov, D. Y., Grigoriev, M. N., and Kutzbach, L.: A long-term (2002 to 2017) record of closed-path and open-path eddy covariance CO2 net ecosystem exchange fluxes from the Siberian Arctic, Earth Syst. Sci. Data, 11, 221–240, https://doi.org/10.5194/essd-11-221-2019, 2019.
Hudson, J. M. G., Henry, G. H. R., and Cornwell, W. K.: Taller and larger: shifts in Arctic tundra leaf traits after 16 years of experimental warming, Glob. Change Biol., 17, 1013–1021, https://doi.org/10.1111/j.1365-2486.2010.02294.x, 2011.
Hugelius, G., Strauss, J., Zubrzycki, S., Harden, J. W., Schuur, E. A. G., Ping, C.-L., Schirrmeister, L., Grosse, G., Michaelson, G. J., Koven, C. D., O'Donnell, J. A., Elberling, B., Mishra, U., Camill, P., Yu, Z., Palmtag, J., and Kuhry, P.: Estimated stocks of circumpolar permafrost carbon with quantified uncertainty ranges and identified data gaps, Biogeosciences, 11, 6573–6593, https://doi.org/10.5194/bg-11-6573-2014, 2014.
IUSS Working Group WRB: World reference base for soil resources 2014 international soil classification system for naming soils and creating legends for soil maps, FAO, Rome, 2014.
Johnson, L. C., Shaver, G. R., Cades, D. H., Rastetter, E., Nadelhoffer, K., Giblin, A., Laundre, J., and Stanley, A.: Plant carbon-nutrient interactions control CO2 exchange in Alaskan wet sedge tundra ecosystems, Ecology, 81, 453–469, https://doi.org/10.1890/0012-9658(2000)081[0453:PCNICC]2.0.CO;2, 2000.
Juszczak, R., Humphreys, E., Acosta, M., Michalak-Galczewska, M., Kayzer, D., and Olejnik, J.: Ecosystem respiration in a heterogeneous temperate peatland and its sensitivity to peat temperature and water table depth, Plant Soil, 366, 505–520, https://doi.org/10.1007/s11104-012-1441-y, 2013.
Kittler, F., Burjack, I., Corradi, C. A. R., Heimann, M., Kolle, O., Merbold, L., Zimov, N., Zimov, S., and Göckede, M.: Impacts of a decadal drainage disturbance on surface–atmosphere fluxes of carbon dioxide in a permafrost ecosystem, Biogeosciences, 13, 5315–5332, https://doi.org/10.5194/bg-13-5315-2016, 2016.
Knoblauch, C., Beer, C., Sosnin, A., Wagner, D., and Pfeiffer, E. M.: Predicting long-term carbon mineralization and trace gas production from thawing permafrost of Northeast Siberia, Glob. Change Biol., 19, 1160–1172, https://doi.org/10.1111/gcb.12116, 2013.
Knoblauch, C., Beer, C., Liebner, S., Grigoriev, M. N., and Pfeiffer, E.-M.: Methane production as key to the greenhouse gas budget of thawing permafrost, Nat. Clim. Change, 8, 309–312, https://doi.org/10.1038/s41558-018-0095-z, 2018.
Koskinen, M., Minkkinen, K., Ojanen, P., Kämäräinen, M., Laurila, T., and Lohila, A.: Measurements of CO2 exchange with an automated chamber system throughout the year: challenges in measuring night-time respiration on porous peat soil, Biogeosciences, 11, 347–363, https://doi.org/10.5194/bg-11-347-2014, 2014.
Kutzbach, L., Schneider, J., Sachs, T., Giebels, M., Nykänen, H., Shurpali, N. J., Martikainen, P. J., Alm, J., and Wilmking, M.: CO2 flux determination by closed-chamber methods can be seriously biased by inappropriate application of linear regression, Biogeosciences, 4, 1005–1025, https://doi.org/10.5194/bg-4-1005-2007, 2007a.
Kutzbach, L., Wille, C., and Pfeiffer, E.-M.: The exchange of carbon dioxide between wet arctic tundra and the atmosphere at the Lena River Delta, Northern Siberia, Biogeosciences, 4, 869–890, https://doi.org/10.5194/bg-4-869-2007, 2007b.
Kuzyakov, Y.: Sources of CO2 efflux from soil and review of partitioning methods, Soil Biol. Biochem., 38, 425–448, https://doi.org/10.1016/j.soilbio.2005.08.020, 2006.
Kwon, M. J., Heimann, M., Kolle, O., Luus, K. A., Schuur, E. A. G., Zimov, N., Zimov, S. A., and Göckede, M.: Long-term drainage reduces CO2 uptake and increases CO2 emission on a Siberian floodplain due to shifts in vegetation community and soil thermal characteristics, Biogeosciences, 13, 4219–4235, https://doi.org/10.5194/bg-13-4219-2016, 2016.
Lara, M. J., Villarreal, S., Johnson, D. R., Hollister, R. D., Webber, P. J., and Tweedie, C. E.: Estimated change in tundra ecosystem function near Barrow, Alaska between 1972 and 2010, Environ. Res. Lett., 7, 015507, https://doi.org/10.1088/1748-9326/7/1/015507, 2012.
Lara, M. J. and Tweedie, C. E.: CO2 and CH4 Fluxes across Polygon Geomorphic Types, Barrow, Alaska, 2006–2010, Next Generation Ecosystem Experiments Arctic Data Collection, Oak Ridge National Laboratory, U.S. Department of Energy, Oak Ridge, Tennessee, USA, https://doi.org/10.5440/1156852 (last access: 4 December 2018), 2014.
Lynch, A. H., Chapin, F. S., Hinzman, L. D., Wu, W., Lilly, E., Vourlitis, G., and Kim, E.: Surface Energy Balance on the Arctic Tundra: Measurements and Models, J. Climate, 12, 2585–2606, https://doi.org/10.1175/1520-0442(1999)012<2585:sebota>2.0.co;2, 1999.
Mahecha, M. D., Reichstein, M., Carvalhais, N., Lasslop, G., Lange, H., Seneviratne, S. I., Vargas, R., Ammann, C., Arain, M. A., Cescatti, A., Janssens, I. A., Migliavacca, M., Montagnani, L., and Richardson, A. D.: Global Convergence in the Temperature Sensitivity of Respiration at Ecosystem Level, Science, 329, 838–840, https://doi.org/10.1126/science.1189587, 2010.
Marushchak, M. E., Kiepe, I., Biasi, C., Elsakov, V., Friborg, T., Johansson, T., Soegaard, H., Virtanen, T., and Martikainen, P. J.: Carbon dioxide balance of subarctic tundra from plot to regional scales, Biogeosciences, 10, 437–452, https://doi.org/10.5194/bg-10-437-2013, 2013.
Mauritz, M., Bracho, R., Celis, G., Hutchings, J., Natali, S. M., Pegoraro, E., Salmon, V. G., Schadel, C., Webb, E. E., and Schuur, E. A. G.: Nonlinear CO2 flux response to 7 years of experimentally induced permafrost thaw, Glob. Change Biol., 23, 3646–3666, https://doi.org/10.1111/gcb.13661, 2017.
McGuire, A. D., Anderson, L. G., Christensen, T. R., Dallimore, S., Guo, L. D., Hayes, D. J., Heimann, M., Lorenson, T. D., Macdonald, R. W., and Roulet, N.: Sensitivity of the carbon cycle in the Arctic to climate change, Ecol. Monogr., 79, 523–555, https://doi.org/10.1890/08-2025.1, 2009.
Merbold, L., Kutsch, W. L., Corradi, C., Kolle, O., Rebmann, C., Stoy, P. C., Zimov, S. A., and Schulze, E. D.: Artificial drainage and associated carbon fluxes (CO2/CH4) in a tundra ecosystem, Glob. Change Biol., 15, 2599–2614, https://doi.org/10.1111/j.1365-2486.2009.01962.x, 2009.
Moyano, F. E., Manzoni, S., Chenu, C. J. S. B., and Biochemistry: Responses of soil heterotrophic respiration to moisture availability: An exploration of processes and models, Soil Biol. Biochem., 59, 72–85, 2013.
Murray, K., Tenhunen, J., and Nowak, R.: Photoinhibition as a control on photosynthesis and production of Sphagnum mosses, Oecologia, 96, 200–207, 1993.
Muster, S., Langer, M., Heim, B., Westermann, S., and Boike, J.: Subpixel heterogeneity of ice-wedge polygonal tundra: a multi-scale analysis of land cover and evapotranspiration in the Lena River Delta, Siberia, Tellus B, 64, 17301, https://doi.org/10.3402/tellusb.v64i0.17301, 2012.
NASA: Landsat Programme: Lena Delta in Landsat 7, available at: https://earthobservatory.nasa.gov/images/2704/lena-river-delta (last access: 13 November 2018), 2002.
Natali, S. M., Schuur, E. A. G., Trucco, C., Hicks Pries, C. E., Crummer, K. G., and Baron Lopez, A. F.: Effects of experimental warming of air, soil and permafrost on carbon balance in Alaskan tundra, Glob. Change Biol., 17, 1394–1407, https://doi.org/10.1111/j.1365-2486.2010.02303.x, 2011.
Natali, S. M., Schuur, E. A. G., and Rubin, R. L.: Increased plant productivity in Alaskan tundra as a result of experimental warming of soil and permafrost, J. Ecology, 100, 488–498, https://doi.org/10.1111/j.1365-2745.2011.01925.x, 2012.
Natali, S. M., Schuur, E. A. G., Mauritz, M., Schade, J. D., Celis, G., Crummer, K. G., Johnston, C., Krapek, J., Pegoraro, E., Salmon, V. G., and Webb, E. E.: Permafrost thaw and soil moisture driving CO2 and CH4 release from upland tundra, J. Geophys. Res.-Biogeo., 120, 525–537, https://doi.org/10.1002/2014JG002872, 2015.
Nobrega, S. and Grogan, P.: Landscape and Ecosystem-Level Controls on Net Carbon Dioxide Exchange along a Natural Moisture Gradient in Canadian Low Arctic Tundra, Ecosystems, 11, 377–396, https://doi.org/10.1007/s10021-008-9128-1, 2008.
Nowinski, N. S., Taneva, L., Trumbore, S. E., and Welker, J. M.: Decomposition of old organic matter as a result of deeper active layers in a snow depth manipulation experiment, Oecologia, 163, 785–792, https://doi.org/10.1007/s00442-009-1556-x, 2010.
Oberbauer, S. F., Tweedie, C. E., Welker, J. M., Fahnestock, J. T., Henry, G. H. R., Webber, P. J., Hollister, R. D., Walker, M. D., Kuchy, A., Elmore, E., and Starr, G.: Tundra CO2 fluxes in response to experimental warming across latitundinal and moisture gradients, Ecol. Monogr., 77, 221–238, https://doi.org/10.1890/06-0649, 2007.
Oechel, W. C., Vourlitis, G. L., Hastings, S. J., and Bochkarev, S. A.: Change in Arctic CO2 Flux Over Two Decades: Effects of Climate Change at Barrow, Alaska, Ecol. Appl., 5, 846–855, https://doi.org/10.2307/1941992, 1995.
Oechel, W. C., Vourlitis, G. L., Hastings, S. J., Ault, R. P., and Bryant, P.: The effects of water table manipulation and elevated temperature on the net CO2 flux of wet sedge tundra ecosystems, Glob. Change Biol., 4, 77–90, https://doi.org/10.1046/j.1365-2486.1998.00110.x, 1998.
Oechel, W. C., Laskowski, C. A., Burba, G., Gioli, B., and Kalhori, A. A. M.: Annual patterns and budget of CO2 flux in an Arctic tussock tundra ecosystem, J. Geophys. Res.-Biogeo., 119, 323–339, https://doi.org/10.1002/2013JG002431, 2014.
Olivas, P. C., Oberbauer, S. F., Tweedie, C. E., Oechel, W. C., and Kuchy, A.: Responses of CO2 flux components of Alaskan Coastal Plain tundra to shifts in water table, J. Geophys. Res.-Biogeo., 115, G00I05, https://doi.org/10.1029/2009JG001254, 2010.
Olivas, P. C., Oberbauer, S. F., Tweedie, C., Oechel, W. C., Lin, D., and Kuchy, A.: Effects of Fine-Scale Topography on CO2 Flux Components of Alaskan Coastal Plain Tundra: Response to Contrasting Growing Seasons, Arct. Antarct. Alp. Res., 43, 256–266, https://doi.org/10.1657/1938-4246-43.2.256, 2011.
Parmentier, F., Van Der Molen, M., Van Huissteden, J., Karsanaev, S., Kononov, A., Suzdalov, D., Maximov, T., and Dolman, A.: Longer growing seasons do not increase net carbon uptake in the northeastern Siberian tundra, J. Geophys. Res.-Biogeo., 116, G04013, https://doi.org/10.1029/2011JG001653, 2011.
Pihlatie, M. K., Christiansen, J. R., Aaltonen, H., Korhonen, J. F., Nordbo, A., Rasilo, T., Benanti, G., Giebels, M., Helmy, M., and Sheehy, J.: Comparison of static chambers to measure CH4 emissions from soils, Agr. Forest Meteorol., 171, 124–136, doi.org/10.1016/j.agrformet.2012.11.008, 2013.
Pogoda i Klimat: Climate Tiksi, available at: http://www.pogodaiklimat.ru/climate/21824.htm, last access: 8 May 2016.
Romanovsky, V. E., Smith, S. L., and Christiansen, H. H.: Permafrost thermal state in the polar Northern Hemisphere during the international polar year 2007–2009: a synthesis, Permafrost Periglac., 21, 106–116, https://doi.org/10.1002/ppp.689, 2010.
Rößger, N., Wille, C., Holl, D., Göckede, M., and Kutzbach, L.: Scaling and balancing carbon dioxide fluxes in a heterogeneous tundra ecosystem of the Lena River Delta, Biogeosciences Discuss., https://doi.org/10.5194/bg-2019-10, in review, 2019.
Runkle, B. R. K., Sachs, T., Wille, C., Pfeiffer, E.-M., and Kutzbach, L.: Bulk partitioning the growing season net ecosystem exchange of CO2 in Siberian tundra reveals the seasonality of its carbon sequestration strength, Biogeosciences, 10, 1337–1349, https://doi.org/10.5194/bg-10-1337-2013, 2013.
Salmon, V. G., Soucy, P., Mauritz, M., Celis, G., Natali, S. M., Mack, M. C., and Schuur, E. A.: Nitrogen availability increases in a tundra ecosystem during five years of experimental permafrost thaw, Glob. Change Biol., 22, 1927–1941, https://doi.org/10.1111/gcb.13204, 2016.
Sanders, T., Fiencke, C., and Pfeiffer, E.-M. J. P.: Small-scale variability of dissolved inorganic nitrogen (DIN), C∕N ratios and ammonia oxidizing capacities in various permafrost affected soils of Samoylov Island, Lena River Delta, Northeast Siberia, Polarforschung, Bremerhaven, Alfred Wegener Institute for Polar and Marine Research & German Society of Polar Research, 80, 23–35, 2010.
Schneider, J., Kutzbach, L., and Wilmking, M.: Carbon dioxide exchange fluxes of a boreal peatland over a complete growing season, Komi Republic, NW Russia, Biogeochemistry, 111, 485–513, https://doi.org/10.1007/s10533-011-9684-x, 2012.
Schuur, E. A. G., Vogel, J. G., Crummer, K. G., Lee, H., Sickman, J. O., and Osterkamp, T. E.: The effect of permafrost thaw on old carbon release and net carbon exchange from tundra, Nature, 459, 556–559, https://doi.org/10.1038/nature08031, 2009.
Schuur, E. A. G., Abbott, B., and Network, P. C.: High risk of permafrost thaw, Nature, 480, 32–33, https://doi.org/10.1038/480032a, 2011.
Schwamborn, G., Rachold, V., and Grigoriev, M. N.: Late Quaternary sedimentation history of the Lena Delta, Quatern. Int., 89, 119–134, https://doi.org/10.1016/S1040-6182(01)00084-2, 2002.
Segal, A. D. and Sullivan, P. F.: Identifying the sources and uncertainties of ecosystem respiration in Arctic tussock tundra, Biogeochemistry, 121, 489–503, https://doi.org/10.1007/s10533-014-0017-8, 2014.
Shaver, G., Johnson, L., Cades, D., Murray, G., Laundre, J., Rastetter, E., Nadelhoffer, K., and Giblin, A. J. E. M.: Biomass and CO2 flux in wet sedge tundras: responses to nutrients, temperature, and light, Ecol. Monogr., 68, 75–97, 1998.
Soegaard, H., Hasholt, B., Friborg, T., and Nordstroem, C.: Surface energy- and water balance in a high-arcticenvironment in NE Greenland, Theor. Appl. Climatol., 70, 35–51, https://doi.org/10.1007/s007040170004, 2001.
Subke, J.-A., Inglima, I., and Cotrufo, M. F.: Trends and methodological impacts in soil CO2 efflux partitioning: A metaanalytical review, Glob. Change Biol., 12, 921–943, https://doi.org/10.1111/j.1365-2486.2006.01117.x, 2006.
Suseela, V., Conant, R. T., Wallenstein, M. D., and Dukes, J. S.: Effects of soil moisture on the temperature sensitivity of heterotrophic respiration vary seasonally in an old-field climate change experiment, Glob. Change Biol., 18, 336–348, https://doi.org/10.1111/j.1365-2486.2011.02516.x, 2012.
Taylor, P. C., Cai, M., Hu, A., Meehl, G. A., Washington, W., and Zhang, G. J.: A decomposition of feedback contributions to polar warming amplification, J. Climate, 26, 7023–7043, https://doi.org/10.1175/JCLI-D-12-00696.1, 2013.
Turetsky, M. R., Bond-Lamberty, B., Euskirchen, E., Talbot, J., Frolking, S., McGuire, A. D., and Tuittila, E. S.: The resilience and functional role of moss in boreal and arctic ecosystems, New Phytol., 196, 49–67, https://doi.org/10.1111/j.1469-8137.2012.04254.x, 2012.
van't Hoff, J. H.: Lectures on theoretical and physical chemistry, Part 1: Chemical dynamics, Edward Arnold, London, 1898.
Voigt, C., Lamprecht, R. E., Marushchak, M. E., Lind, S. E., Novakovskiy, A., Aurela, M., Martikainen, P. J., and Biasi, C.: Warming of subarctic tundra increases emissions of all three important greenhouse gases – carbon dioxide, methane, and nitrous oxide, Glob. Change Biol., 23, 3121–3138, https://doi.org/10.1111/gcb.13563, 2017.
Vourlitis, G. L., Oechel, W. C., Hope, A., Stow, D., Boynton, B., Verfaillie, J., Zulueta, R., and Hastings, S. J.: Physiological models for scaling plot measurements of CO2 flux across an Arctic tundra landscape, Ecol. Appl., 10, 60–72, https://doi.org/10.1890/1051-0761(2000)010[0060:PMFSPM]2.0.CO;2, 2000.
Walker, D. A., Raynolds, M. K., Daniëls, F. J. A., Einarsson, E., Elvebakk, A., Gould, W. A., Katenin, A. E., Kholod, S. S., Markon, C. J., Melnikov, E. S., Moskalenko, N. G., Talbot, S. S., Yurtsev, B. A., and Franklin, J.: The Circumpolar Arctic vegetation map, J. Veg. Sci., 16, 267–282, https://doi.org/10.1658/1100-9233(2005)016[0267:TCAVM]2.0.CO;2, 2005.
Walz, J., Knoblauch, C., Böhme, L., and Pfeiffer, E.-M.: Regulation of soil organic matter decomposition in permafrost-affected Siberian tundra soils – Impact of oxygen availability, freezing and thawing, temperature, and labile organic matter, Soil Biol. Biochem., 110, 34–43, https://doi.org/10.1016/j.soilbio.2017.03.001, 2017.
Wendler, G. and Eaton, F.: Surface radiation budget at Barrow, Alaska, Theor. Appl. Climatol., 41, 107–115, https://doi.org/10.1007/bf00866433, 1990.
Wilber, A. C., Kratz, D. P., and Gupta, S. K.: Surface Emissivity Maps for Use in Satellite Retrievals of Longwave Radiation, NASA Langley Technical Report Server, 1999.
Wille, C., Kutzbach, L., Sachs, T., Wagner, D., and Pfeiffer, E.-M.: Methane emission from Siberian arctic polygonal tundra: eddy covariance measurements and modeling, Glob. Change Biol., 14, 1395–1408, https://doi.org/10.1111/j.1365-2486.2008.01586.x, 2008.
Yershov, E. D.: General Geocryology, Cambridge University Press, Cambridge, 1998.
Zamolodchikov, D., Karelin, D., and Ivaschenko, A.: Sensitivity of Tundra Carbon Balance to Ambient Temperature, Water Air Soil Poll., 119, 157–169, https://doi.org/10.1023/a:1005194613088, 2000.
Zimov, S. A., Davydov, S. P., Zimova, G. M., Davydova, A. I., Schuur, E. A. G., Dutta, K., and Chapin, F. S.: Permafrost carbon: Stock and decomposability of a globally significant carbon pool, Geophys. Res. Lett., 33, L20502, https://doi.org/10.1029/2006gl027484, 2006a.
Zimov, S. A., Schuur, E. A. G., and Chapin, F. S.: Permafrost and the global carbon budget, Science, 312, 1612–1613, https://doi.org/10.1126/science.1128908, 2006b.
Zona, D., Lipson, D., Zulueta, R., Oberbauer, S., and Oechel, W.: Microtopographic controls on ecosystem functioning in the Arctic Coastal Plain, J. Geophys. Res.-Biogeo., 116, G00I08, https://doi.org/10.1029/2009JG001241, 2011.
Zona, D., Lipson, D. A., Paw U, K. T., Oberbauer, S. F., Olivas, P., Gioli, B., and Oechel, W. C.: Increased CO2 loss from vegetated drained lake tundra ecosystems due to flooding, Global Biogeochem. Cy., 26, GB2004, https://doi.org/10.1029/2011GB004037, 2012.
Zona, D., Lipson, D. A., Richards, J. H., Phoenix, G. K., Liljedahl, A. K., Ueyama, M., Sturtevant, C. S., and Oechel, W. C.: Delayed responses of an Arctic ecosystem to an extreme summer: impacts on net ecosystem exchange and vegetation functioning, Biogeosciences, 11, 5877–5888, https://doi.org/10.5194/bg-11-5877-2014, 2014.
Zubrzycki, S., Kutzbach, L., Grosse, G., Desyatkin, A., and Pfeiffer, E.-M.: Organic carbon and total nitrogen stocks in soils of the Lena River Delta, Biogeosciences, 10, 3507–3524, https://doi.org/10.5194/bg-10-3507-2013, 2013.