the Creative Commons Attribution 4.0 License.
the Creative Commons Attribution 4.0 License.
 | 18 Apr 2019
Estimating the soil N2O emission intensity of croplands in northwest Europe
Mathew Williams
Robert M. Rees
Cairistiona F. E. Topp
The application of nitrogenous fertilisers to agricultural soils is a major source of anthropogenic N2O emissions. Reducing the nitrogen (N) footprint of agriculture is a global challenge that depends, among other things, on our ability to quantify the N2O emission intensity of the world's most widespread and productive agricultural systems. In this context, biogeochemistry (BGC) models are widely used to estimate soil N2O emissions in agroecosystems. The choice of spatial scale is crucial because larger-scale studies are limited by low input data precision, while smaller-scale studies lack wider relevance. The robustness of large-scale model predictions depends on preliminary and data-demanding model calibration/validation, while relevant studies often omit the performance of output uncertainty analysis and underreport model outputs that would allow a critical assessment of results. This study takes a novel approach to these aspects. The study focuses on arable eastern Scotland – a data-rich region typical of northwest Europe in terms of edaphoclimatic conditions, cropping patterns and productivity levels. We used a calibrated and locally validated BGC model to simulate direct soil N2O emissions along with NO3 leaching and crop N uptake in fields of barley, wheat and oilseed rape. We found that 0.59 % (±0.36) of the applied N is emitted as N2O while 37 % (±6) is taken up by crops and 14 % (±7) is leached as NO3. We show that crop type is a key determinant of N2O emission factors (EFs) with cereals having a low (mean EF<0.6 %), and oilseed rape a high (mean EF=2.48 %), N2O emission intensity. Fertiliser addition was the most important N2O emissions driver suggesting that appropriate actions can reduce crop N2O intensity. Finally, we estimated a 74 % relative uncertainty around N2O predictions attributable to soil data variability. However, we argue that higher-resolution soil data alone might not suffice to reduce this uncertainty.
- Article
(1786 KB) - Full-text XML
-
Supplement
(1166 KB) - BibTeX
- EndNote


The emission of N2O from agricultural soils is a particularly interesting aspect of the global N cycle because it represents a key contribution of modern agriculture to climate change which, in turn, poses a serious threat to agriculture itself (Paustian et al., 2016). Nitrous oxide is a powerful greenhouse gas with a global warming potential 298 times stronger than carbon dioxide (CO2) at a 100-year time horizon, and it is also a major stratospheric ozone-depleting substance (Galloway et al., 2013; Ravishankara et al., 2009). Almost a third of the N2O entering the atmosphere on an annual basis originates from human activities with agriculture being the principal source (Reay et al., 2012). Nitrous oxide is emitted from agricultural soils as a direct consequence of the application of nitrogenous fertilisers, crop residues and manure, but it can also be released indirectly from leached N compounds (i.e. nitrate) (De Vries et al., 2011a). The emission of N2O from agricultural soils is controlled by the microbe-mediated processes of nitrification and denitrification. These processes are tightly coupled and are affected by the combination of environmental conditions; the soil's physical and biochemical composition; and the amount, timing and type of the applied fertiliser (Smith, 2017). These facts suggest that soil N2O emissions are highly variable both spatially and temporally, which makes measuring and predicting soil N2O particularly difficult (Cowan et al., 2014). In its latest report, the Intergovernmental Panel on Climate Change (IPCC) stated that, on average, 1 % of the N applied to agricultural soils is lost directly to the atmosphere as N2O. Nevertheless, this default N2O emission factor (EF) is generic and does not reflect the role of different N amendments (e.g. ammonium nitrate, urea), soil conditions (e.g. texture, pH), climate (e.g. wet, dry) and cultivated crops, which vary greatly on a global scale but act together to define the real N2O EF (Leip et al., 2011).
Even though crop production occurs in almost every corner of the world, certain areas are major crop producers (Monfreda et al., 2008). These areas are critical components of the global agricultural system and important consumers of nitrogenous fertilisers; hence, they are also possible hotspots of soil N2O emissions (Potter et al., 2010). One of these areas is northwestern Europe, which lies between 47 and 57∘ N and includes eastern Great Britain, northern France, the Low Countries, western Germany and the temperate plains of Scandinavia (Olesen et al., 2011). The main crops cultivated in this wide zone are cereals, primarily wheat and secondarily barley (European Commission, 2018). Crop farming is intensive and depends on the use of synthetic fertilisers and other agrochemicals to achieve wheat and barley yields that are the highest in the world (Stoate et al., 2001). The climate of the plains of northwest Europe is oceanic, and brown soils (Cambisols) are the most widespread soil group (Bonsall et al., 2002; Toth et al., 2008).
Scotland is a small yet representative region of northwestern Europe. Almost all of Scotland's arable soils are located at the eastern part of the country where climatic and soil conditions are favourable to the cultivation of crops (Hay et al., 2000). Crop production is dominated by wheat, barley, oilseed rape, oats and potatoes, with wheat and barley alone representing three quarters of the total arable area (The Scottish Government, 2013). Most existing estimates of agricultural soil N2O emissions in this area are based on the default (Tier 1) IPCC EFs and statistical models which do not consider many of the underlying N2O-controlling factors (Lilly et al., 2003; Flynn et al., 2005; Lilly et al., 2009). The few model-based estimates on N2O emissions from Scottish croplands are part of national-scale (UK) studies that consider all types of agricultural land use and do not examine the role of different crop types (Brown et al., 2002; Cardenas et al., 2013). Since 2016, the National Greenhouse Gas Inventory of the UK uses a country-specific (Tier 2) N2O EF equal to 0.791 % for arable soils on which mineral fertiliser is added. Nevertheless, the estimates of agricultural soil N2O emissions remain the most uncertain aspect of the greenhouse gas budget of Scotland and the UK (Bell et al., 2014).
Process-based agroecosystem biogeochemistry (BGC) modelling is widely used to estimate soil N2O emissions as well as other variables such as crop yields, CO2, methane (CH4) and NO3 leaching. Such models, along with long-term country-tailored measurement inventories, are considered as the best tools for estimating N2O emissions from agricultural soils (i.e. IPCC Tier 3 method) (Sylvester-Bradley et al., 2015). Agroecosystem BGC models vary in complexity but the most advanced amongst them provide detailed descriptions of the processes that directly and indirectly affect the production on N2O in soils (Necpálová et al., 2015; Gilhespy et al., 2014; Holzworth et al., 2014; Balkovia et al., 2013). Model-based estimates of soil N2O depend on the modelling scale and local conditions. The quality of input data can affect the robustness of model predictions, which for large-scale simulations depends on the coarseness of the spatial input data (Pogson and Smith, 2015). Moreover, models are developed and parameterised using experimental data collected in the lab or at the field under conditions which can be very different to those of the area in which the model is applied. Therefore, models have to be tested at and calibrated to the climatic and soil conditions of their area of application (Li et al., 2015; Bellocchi et al., 2014; Wang and Chen, 2012). However, rarely do regional-scale model-based studies provide information on how (and if) the used model was calibrated and tested under the conditions (climatic, soil, crop types) of the region in which it was used.
Scotland is an interesting case from a BGC modelling perspective because (1) it is among the few European countries for which data of high spatial resolution (and quality) on climate, soil and crop management are available; (2) it maintains a national greenhouse gases inventory including measured data on soil N2O emissions from different types of croplands; and (3) its croplands are made up of farms with a large average size (i.e. >0.5 km2) by northwestern European standards and, therefore, smaller crop cover uncertainty within each simulation spatial unit (i.e grid cell) (Eurostat, 2015). In this study, we build upon these advantages and apply a process-based agroecosystem model (Landscape-DNDC) across eastern Scotland to simulate soil N2O emissions from the arable soils (i.e. wheat, barley, oilseeds) of the region. The model's parametric sensitivity has been examined by Myrgiotis et al. (2018a), and it has been calibrated and evaluated under UK/Scottish edaphoclimatic conditions by Myrgiotis et al. (2018b).
The study takes a novel approach to aspects that are critical for the robustness of large-scale model-based predictions. Firstly, and in contrast to previous N2O-focused studies, nitrate (NO3) loss via leaching and crop N uptake are also simulated to provide a picture of the N budget (soil mineral/organic N, nitric oxide and N2 fluxes not considered) of the agroecosystems of arable eastern Scotland and to assure that N2O prediction is not made at the expense of other key variables (i.e. an unrealistic description of the N budget). Secondly, each crop and soil type is considered individually in terms of expected cropping patterns (i.e. sow and harvest dates) and fertiliser input (i.e. timing, frequency and intensity of fertiliser use) instead of merging crops and soils into aggregate groups (i.e. cereals and oilseeds, and clayish and sandy), which is typical of large-scale modelling studies. Thirdly, we estimate the relative uncertainty around the simulated N2O, NO3 and N uptake as caused by variability in soil-related model inputs and model parameters. Through this link between model estimates, data precision and model parameterisation we identify possible future research foci. The three variables considered in this study (crop N, N2O, NO3) represent a part of the N budget of a crop field. A complete N budget would require the inclusion of soil mineral N (SMN) and other N-based gas fluxes, i.e. nitrogen oxides (NOx), nitrogen gas (N2) and ammonia (NH3) volatilisation. Much more N is lost from the soil–crop system as N2, NOx and NH3 than it is as N2O; however, field measured data on non-N2O fluxes are scarce and thus the scope for model evaluation is limited (De Vries et al., 2011b). In regards to NH3 volatilisation, the present study focuses on arable soils and considers only synthetic fertiliser (ammonium nitrate) application, which are both regarded as factors contributing to low NH3 volatilisation (Pan et al., 2016; Baobao et al., 2016). Considering the aforementioned as well as the spatial and temporal scale of our study, we have not considered these non-N2O gases. In summary, the aims of the study are to
-
estimate crop-specific N2O EFs in Scotland,
-
estimate the fraction of fertiliser N lost via NO3 leaching and absorbed by crops, and
-
quantify the parametric and input data uncertainty around the model's predictions.
2.1 Regional simulations
A state-of-the-art process-based agroecosystem BGC model (Landscape-DNDC) was coupled to geographically explicit information on climate, soil and crop management in order to simulate soil N2O emissions from the croplands of eastern Scotland (Haas et al., 2012). Leaching of NO3, crop yields and crop N uptake were also simulated. The model was run using input data for 2011, 2012 and 2013, with 2013 being the year of reference for the results. The simulations for years 2011 and 2012 were performed to assure the stabilisation of the model's soil carbon (C) pools as suggested by the model's developers and proven by preparatory simulations.
This study considered four crops that in 2013 represented 83 % of the total arable area of Scotland and 93 % of the arable area of eastern Scotland: winter wheat, winter barley, spring barley and winter oilseed rape (WOSR). Only the application of ammonium nitrate was considered since this is the main source used in crop farming systems in eastern Scotland. The spatial scale of the input data and of the outputs is 1 km2 and the simulated area covers 3800 km2. The model was run twice at the regional scale: (1) using zero fertiliser application (i.e. control treatment) and (2) using an amount of fertiliser that varies according to crop and soil type. For each grid cell, the difference between the total simulated emission of N2O (kg N-N2Oha−1), NO3 leached (kg N-N2O ha−1), and crop N uptake (kg N ha−1) under control and treatment conditions was divided by the total amount of N (kg N ha−1) applied to that grid cell, and the results were expressed as factors:
-
N2O emission factor (N2O EF),
-
NO3 leaching factor (NO3 LF) and
-
crop N uptake factor (NUF).
2.2 Landscape-DNDC
Landscape-DNDC is a complex process-based ecosystem model that describes the biogeochemistry of terrestrial ecosystems (Haas et al., 2012). It belongs to a large family of models who trace their conceptual background to the original DeNitrification-DeComposition model (DNDC) (Gilhespy et al., 2014; Li et al., 1992). The model can simulate energy, water and nutrient transport inside the soil–plant–atmosphere system in arable, grassland and forest ecosystems. It has a modular structure that facilitates the integration of modules that describe different parts of the simulated system (i.e. plant growth, water cycling, soil biogeochemistry). Landscape-DNDC was developed with regional-scale application in mind and facilitates the performance of multiple point-based (i.e. an area of 1 ha) simulations in parallel.
The user has access to the model's parameters and can also reshape its structure by using different module combinations. The model requires input data on climatic (e.g. min/max precipitation, temperature, wind speed) and soil (e.g pH, clay content, bulk density) conditions as well as information on field management (e.g. crop rotation, date and depth of tillage). Soil discretisation is used to provide the model with soil-related information allowing all properties (e.g. soil bulk density, BD; and pH) to be attributed to layers of user-defined thickness (cm). The model's crop growth module is simplistic (empirical) and depends on few parameters. For the purpose of this study the crop growth module was calibrated using measured crop yield and N content data for barley, wheat and oilseed rape. These data were collected at UK-based experiments and extracted from the relevant literature.
Landscape-DNDC was run using the default values for all of its soil biogeochemistry and hydrology-related parameters (i.e. more than 100 unique parameters) except for nine parameters. These parameters (Table 1) were found to be critical for the prediction of N2O fluxes and other aspects of N cycling (including NO3 and crop N uptake) under UK edaphoclimatic conditions (Myrgiotis et al., 2018a, b). Table 1 presents the nine soil biogeochemistry parameters, their values and respective ranges that were used for the simulations.
Table 1Most critical soil biogeochemistry parameters of the Landscape-DNDC model.

2.3 Uncertainty quantification
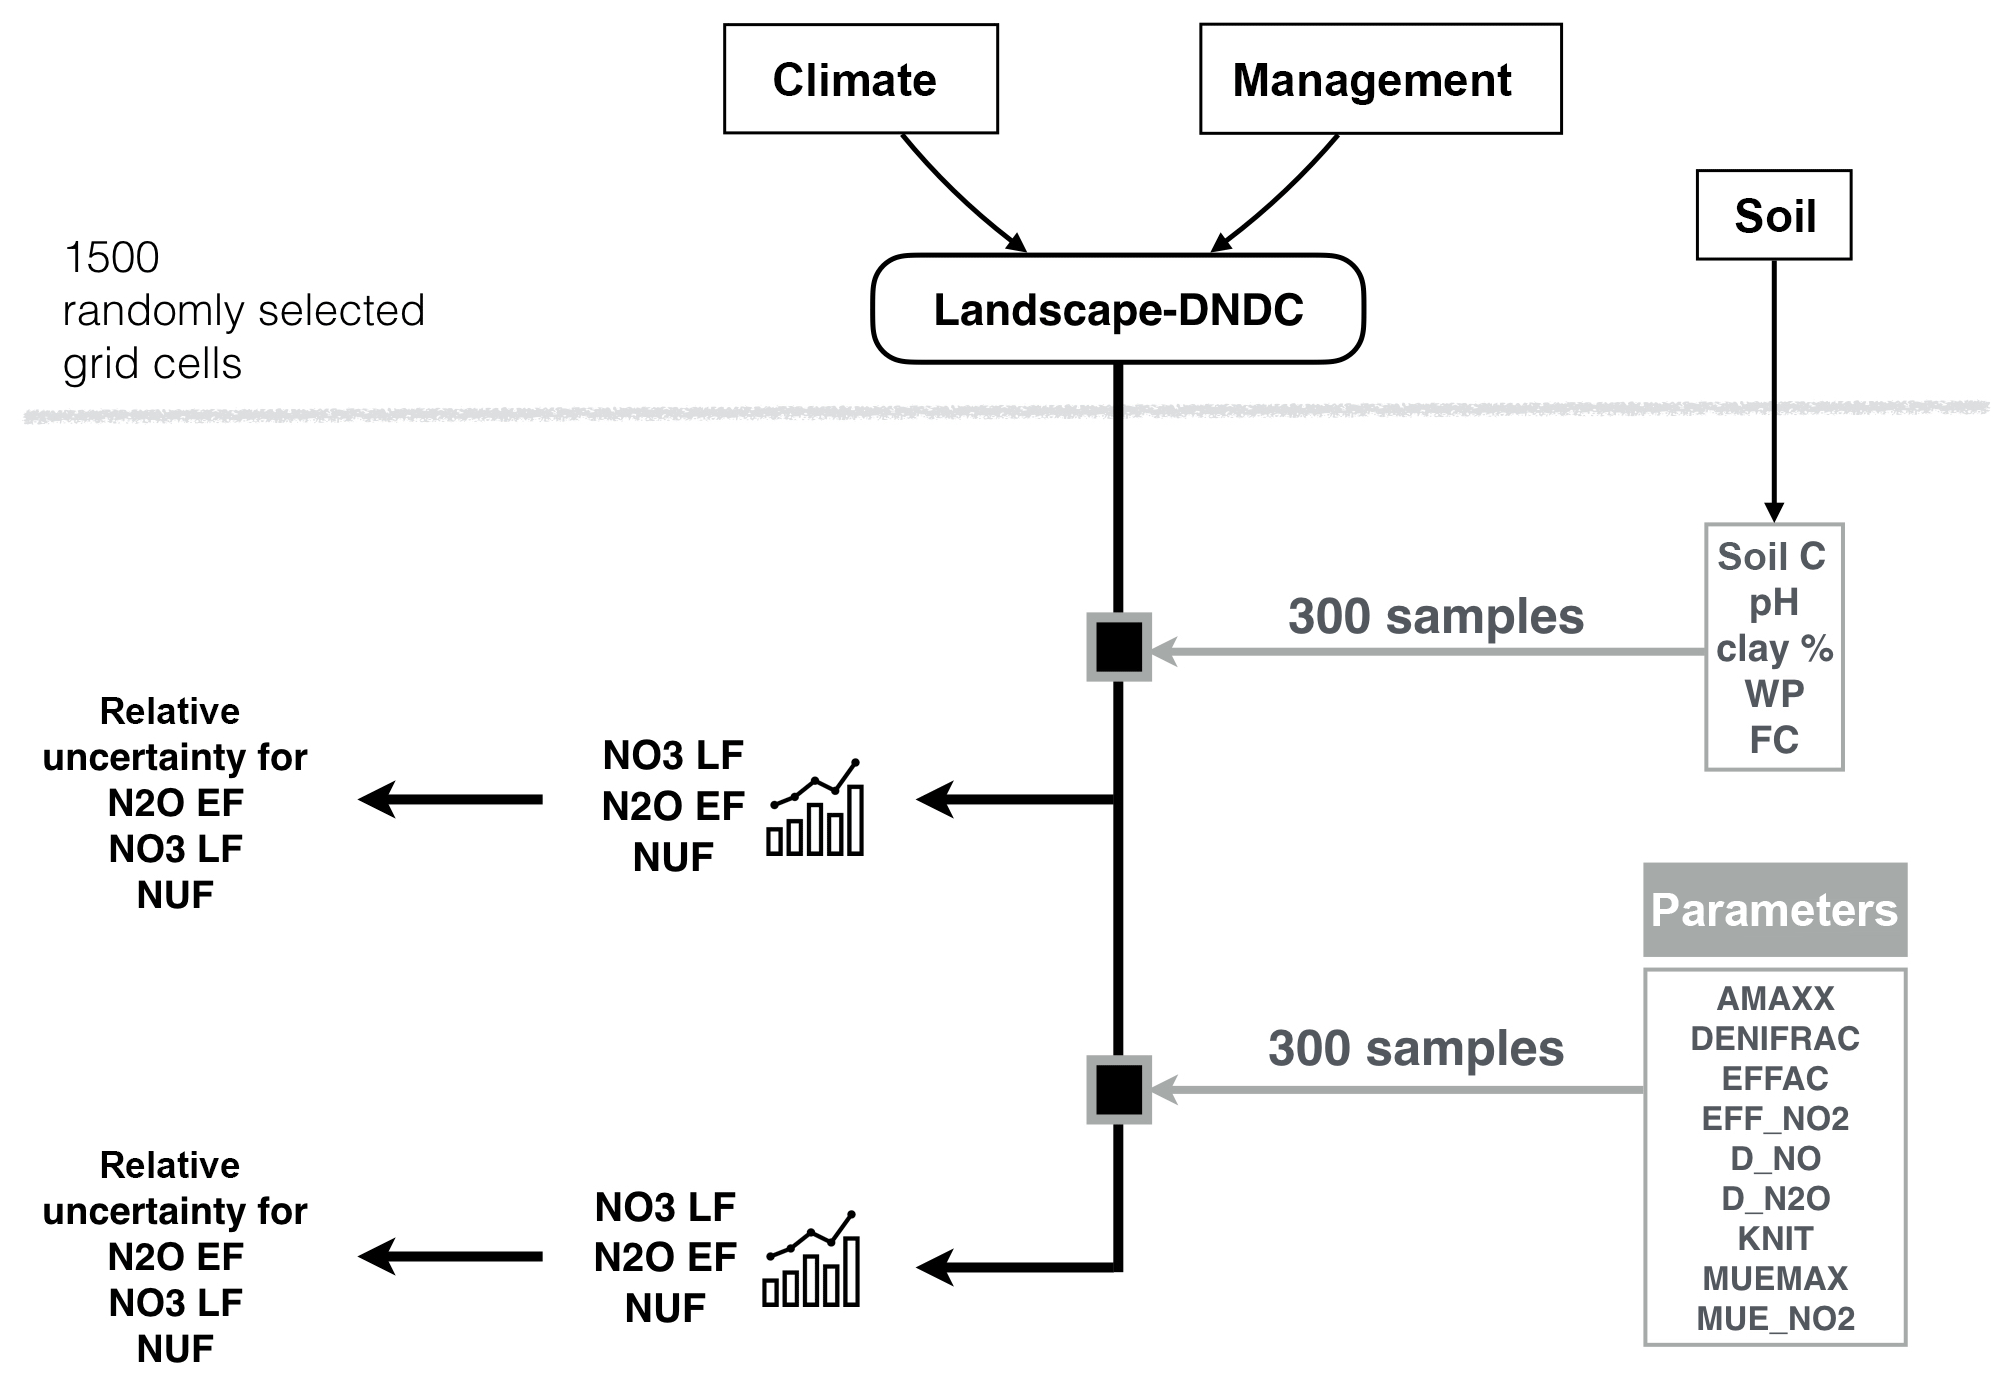
The effect of uncertainty around soil-related model inputs and model parameters on the prediction of N2O, NO3 and crop N uptake was quantified in this study by running the model in 1500 grid cells (1 km2), which were selected using random sampling weighted according to soil texture (i.e. pseudo-regional simulations). As a first step, the model was run at the pseudo-regional scale 300 times using at each iteration (for each soil cell) a vector of input values (for bulk density, clay fraction, pH, C content, wilting point, field capacity) that was created by randomly sampling the respective variable's range (i.e. standard deviation of measurements). In a second step, the model was run again 300 times using at each iteration the previously used soil input vectors and 300 additional randomly sampled vectors for the nine soil biogeochemistry parameters (Table 1). The parameter samples were drawn from the each parameter's posterior distribution (Myrgiotis et al., 2018b). Figure 1 presents the process that was followed to quantify soil-input- and parameter-related uncertainty over the model's predictions. The use of a condensed version of the full set of spatially distributed drivers (i.e. pseudo-regional setup) was devised as a low-computer-demand method to assess prediction uncertainty at the regional scale. The relative uncertainty was estimated for each grid cell by dividing the standard deviation for N2O EF, NO3 LF and NUF by the respective mean. The relative uncertainty is expressed in the results section as a percentage.
2.4 Regional inputs
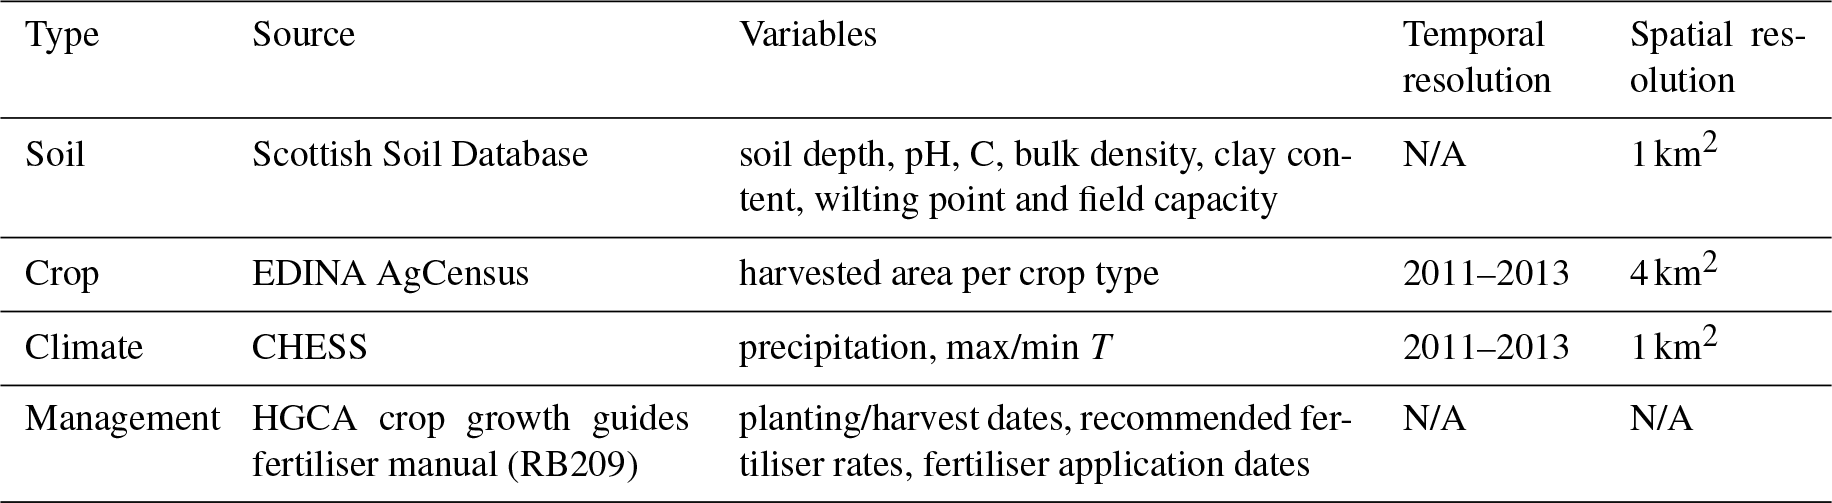
The information that was used to drive the model at the regional scale consisted of data on climate, soil, crop cover and management (see Table 2). Only the crop cover data were spatially processed in order to produce information at a 1 km2 grid, which is the spatial scale of reference for the simulations and the results of this study.
2.4.1 Climate data
The climate data were obtained from the Climate, Hydrological and Ecological research Support System (CHESS) of the Centre for Ecology & Hydrology of the UK (Robinson et al., 2017). The data used in this study include daily precipitation (mm) and minimum and maximum temperature (∘C). The original spatial resolution of the data was 1 km2.
2.4.2 Soil data
A number of global-scale soil data products are available at different spatial resolutions (Batjes, 2016; Hengl et al., 2014). Scotland maintains its own soil database constructed based on field surveys, and, therefore, the soil data used in this study were extracted from the Scottish Soil Database (Scottish Spatial Data Infrastructure, 2014). The data present the distribution of different soil classes across Scotland in a gridded format (1 km2). More than one soil class can be found within the limits of a single grid cell. For each soil class, information is provided about the soil's measured depth (m), the number of soil layers and the thickness (m) of each layer. For each layer the mean and standard deviation of the measured bulk density (BD), clay content (%), soil C content (%), soil pH, wilting point and field capacity are provided along with the type of the soil's texture. It should be noted here that data of the Scottish Soil Database can be obtained at a very fine (250 m) resolution. Our decision to use the 1 km2 resolution data was based on the fact that (1) more than half of all crop farms in Scotland are larger than 0.5 km2 in size and close to one-third are larger than 1 km2 and that (2) the granularity of the 250 m resolution data is not lost when the data are aggregated to the 1 km2 grid (i.e. number/coverage of different soil groups).
2.4.3 Crop cover data
The crop cover data were obtained from the EDINA AgCensus database (Edina AgCensus, 2016). The data define the area (in km2) that winter wheat, spring and winter barley and winter oilseed rape covered in 2011, 2012 and 2013. The original spatial resolution of the crop cover data was 4 km2 (Fig. 2). The data were spatially disaggregated and linked to the soil and climate data (Fig. 3).
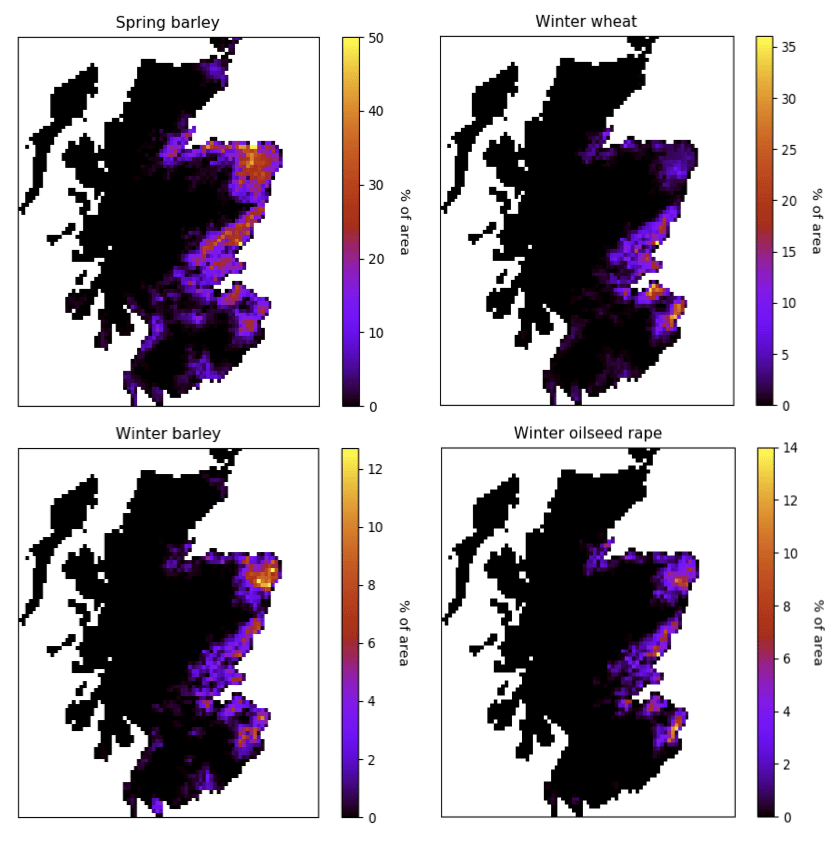
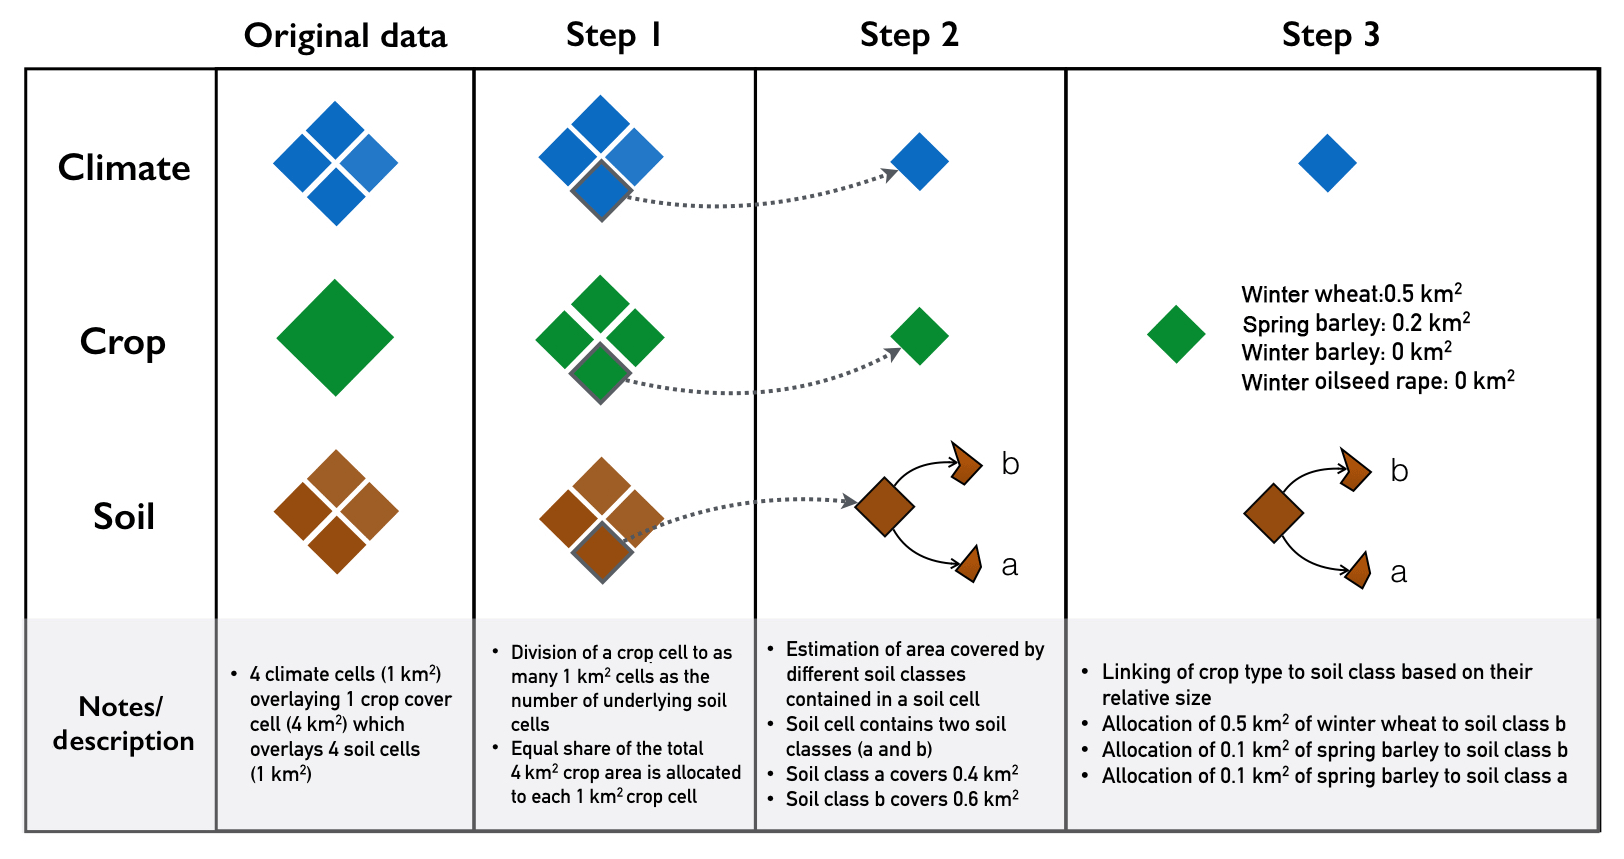
Figure 3Description of the processing of spatial data on climate, soil and crop cover. Example values are used for the size (km2) of soil classes (step 2) and the area covered by different crops (step 3) to demonstrate the process followed.
2.4.4 Crop management data
The crop management data were compiled from information in the DEFRA fertiliser manual (DEFRA, 2010) and the crop growth guides published by the UK Home-Grown Cereals Authority (HGCA). The information that was obtained from these sources referred to the four crops considered in the study (winter/spring barley, winter wheat, winter oilseed rape) and included
-
planting dates for each crop type,
-
harvest dates for each crop type,
-
total recommended amount of fertiliser applied to each crop type depending on soil texture and depth,
-
number of separate treatments (splits) in which the total amount of fertiliser was applied to the soil (per crop type),
-
date of application of each fertiliser split (per crop type) and
-
percentage of total recommended fertiliser that was applied at each split application (per crop type).
Further details on the simulated management activities (e.g. harvest dates and fertiliser kg N ha−1) are presented in the Supplement.
3.1 Crop yields
We divided the total simulated yield to the total simulated area (per crop type for 2013) and compared the results with respective data from the Scottish agricultural census of 2013 (Fig. 4). The predicted yields per hectare for cereals are above the observed values but are in the right order of magnitude for all crops. The simulated cereal yields are on average 10 % higher than the measured value with the difference ranging between 20 % for winter barley and 8 % for winter wheat.

Figure 4Comparison of mean measured yields (t ha−1) for Scotland and simulated yield (t ha−1) values for eastern Scotland.
3.2 N2O
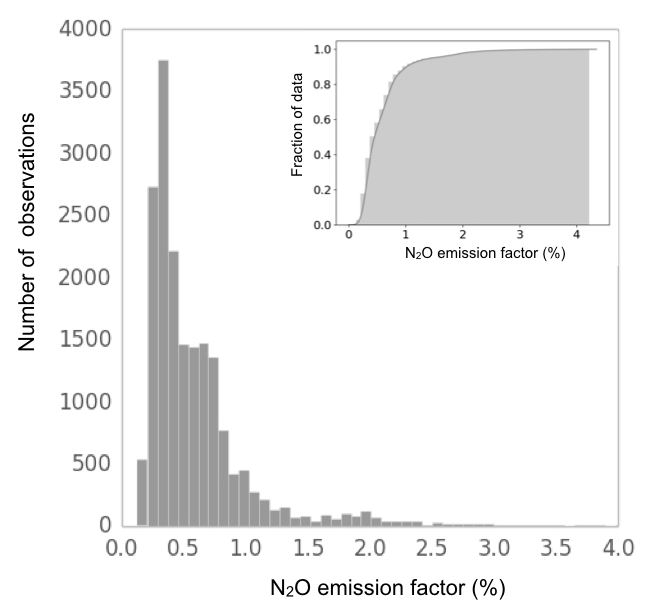
The simulated mean N2O EF for arable eastern Scotland was 0.59 % (±0.36 %) with 75 % of the EFs estimated being below 0.70 % (Fig. 5). The results of the simulations are presented as EFs and thus integrate the amount of fertiliser N (kg N ha−1) applied at the soils present in each 1 km2 cell. In this context, the spatial distribution of the estimated N2O EFs (Fig. 6) reveals one sizeable hotspot of high EFs (area in red at the northeast part of the map).
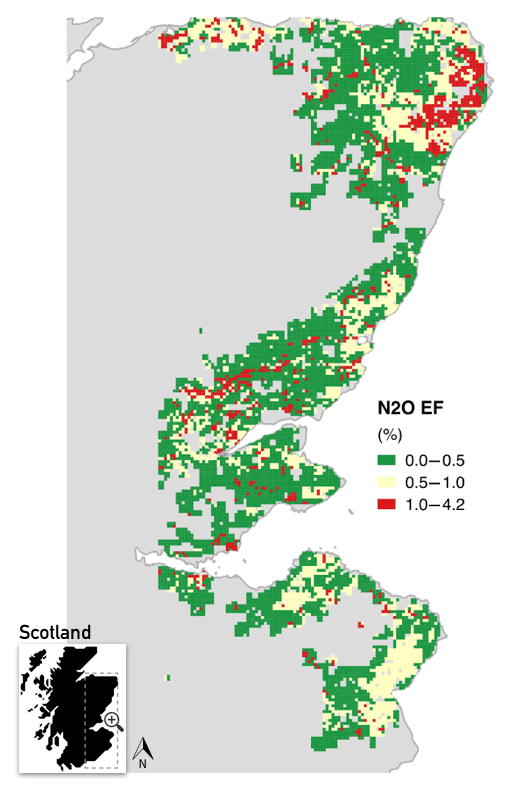
A closer analysis of the N2O EFs revealed a stratification of N2O EFs that is related to crop type. By grouping N2O EFs according to crop (Table 3) the dominant presence of spring barley in the simulated area becomes apparent, with the mean estimated N2O EF for all crops (i.e. 0.59 %) being very close to the EF that is specific to spring barley (0.57 %). Winter wheat and winter barley, which cover almost a third of the simulated area, were found to have a lower crop-specific EF than spring barley. The N2O footprint of WOSR was very high (2.48 %) and, in most cases, was responsible for the high N2O hotspots (Fig. 6).
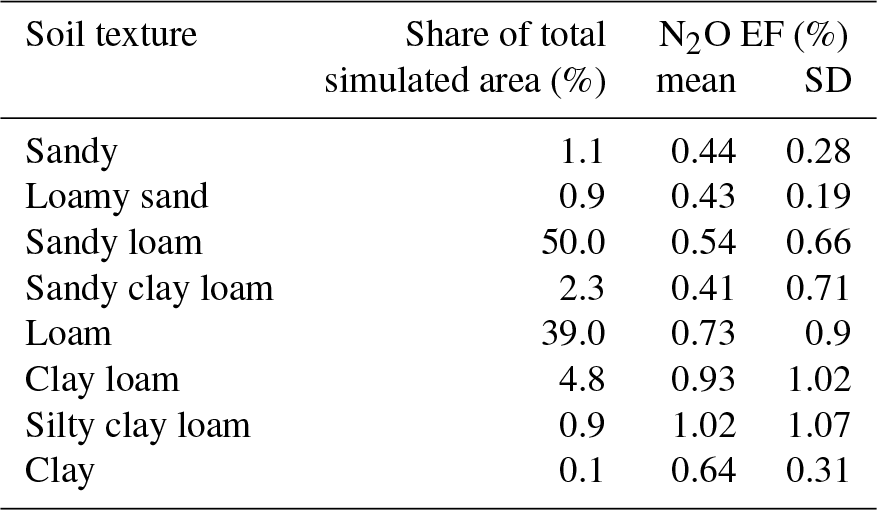
Considering the fact that soils of loamy and sandy loam texture represent most of the simulated soils, the grouping of the estimated EFs according to soil texture (Table 4) showed that N2O EFs were slightly higher in loamy soils than in sandy loam. Even in light of this information the average N2O EF was ≈0.5 %. Soil textures associated with low hydraulic conductivity like clay loams and silty clay loams produced higher-than-average EFs even though clay soils did not produce similar results. However, soils with clay texture represented only 0.1 % of the total simulated area.
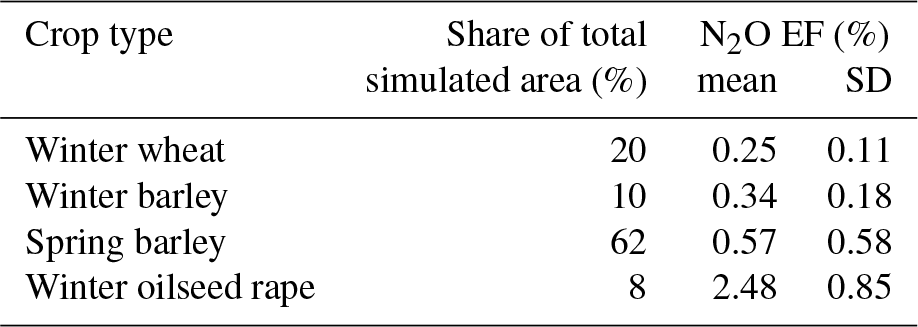
Table 4Estimated N2O EF by type of soil texture. Soil textures are listed in order of decreasing hydraulic conductivity.
3.3 NO3 and crop N uptake
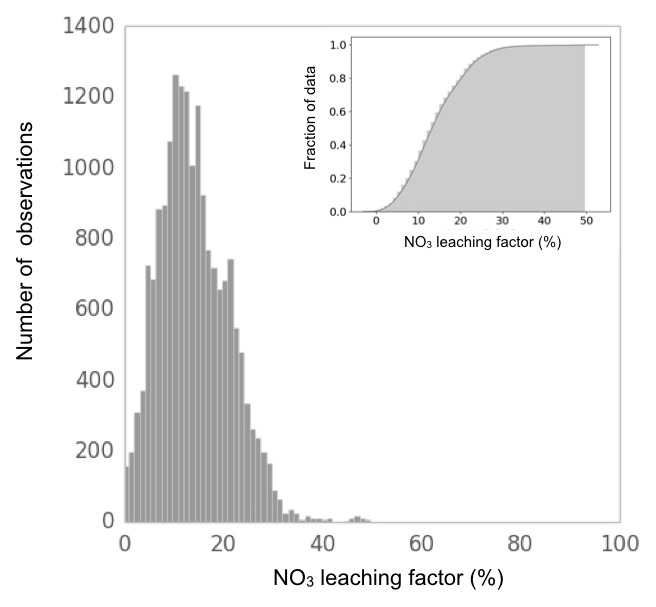
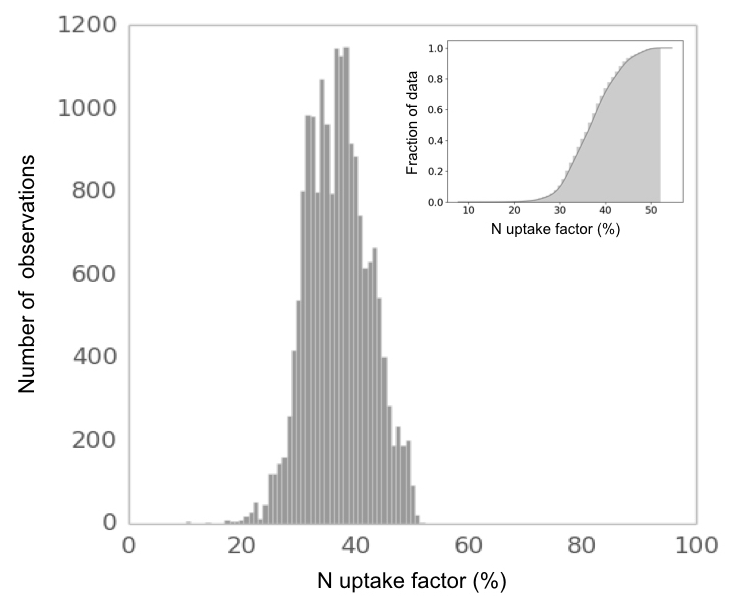
The simulated mean NO3 LF for arable eastern Scotland was 14 % (±7 %) with 75 % of the estimated NO3 LFs being less than 18 % (Fig. 7). In terms of the simulated uptake of N by crops, the mean NUF was 37 % (±7 %) with three quarters of the estimated NUF being below 40 % (Fig. 8).
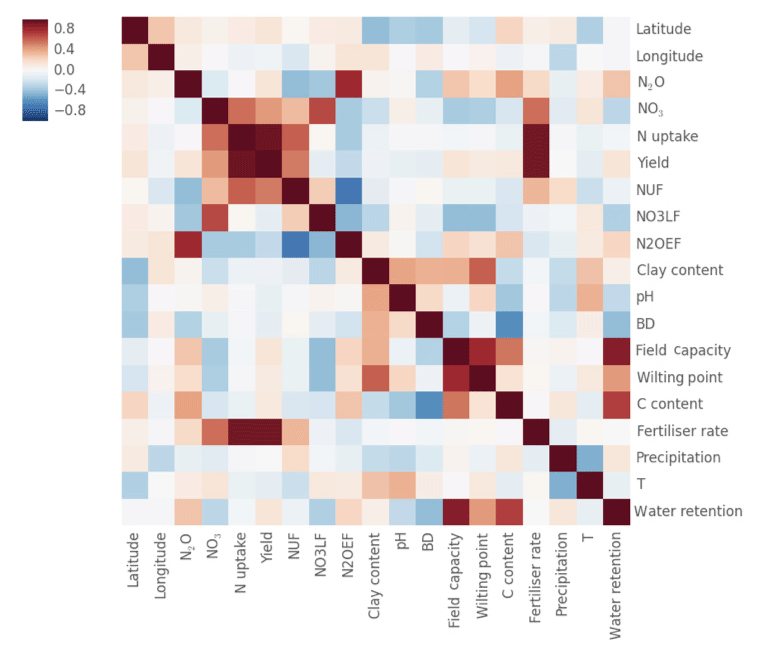
3.4 Correlation of model drivers and outputs
The simulations that were performed to obtain the outputs which were then processed and expressed as emission, leaching and uptake factors produced a large volume of data that were further analysed to construct a heatmap (Fig. 9) of the correlations between model drivers (e.g. soil pH and C) and outputs (e.g. yield and N2O). The soil-related drivers that were used to produce the heatmap refer to the top 30 cm. A strong (>0.7) positive correlation was observed between the predicted crop yield and N uptake. This is explained by the coupling of crop N absorption and biomass growth both in reality and according to the concept embodied in Landscape-DNDC. Total NO3 leaching (but not the associated NO3 LF) shows a positive correlation with crop yield and uptake as they do with the rate of fertiliser application. This is explained by the fact that the loss of N from the soil via leaching is driven by the amount of N present in the soil and thus depends strongly on the fertiliser rate.
3.5 Relative uncertainty of model predictions
We used 300 randomly sampled vectors of soil-related inputs and model parameters to run the model at a pseudo-regional scale in order to provide an assessment of the input and parametric uncertainty of the estimated N2O EF, NO3 LF and NUF (Fig. 1). The results of this process are summarised in the bar plots presented in Fig. 10. The relative uncertainty values express the mean relative standard deviation that was estimated at 1500 randomly selected grid cells after (1) 300 simulations performed under varying soil inputs (i.e. clay, pH, C, WP, FC) only and (2) 300 simulations performed under varying soil inputs and model parameters. The stabilisation of the simulated outputs relative to the size of samples used has been assessed visually by plotting the pseudo-regional mean and SD for each variable (N2O, NO3 and NUF) against the sample size. The results (Fig. 10) show that the N2O EF is the output variable most sensitive to uncertainties around model inputs in contrast to NUF which appears to be insensitive to them. The relative uncertainty of the simulated NO3 LF is 25 % smaller than that of N2O EF.
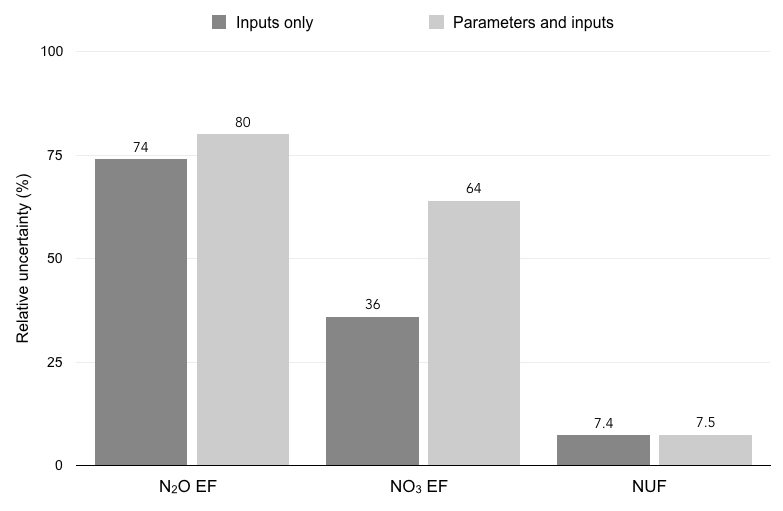
Figure 10Uncertainty (expressed as relative uncertainty) of predicted N2O EF, NO3 LF and NUF as caused by the (1) variability in soil-related input data (inputs only) and (2) the variability in soil-related input data and model parameters (parameters and inputs).
The mean N2O EF for Scottish croplands of 0.59 % that was estimated in this study is smaller than the generic IPCC N2O EF (1 %). However, this result is consistent with recent measured data in the UK (Bell et al., 2014; Sylvester-Bradley et al., 2015). A few studies have estimated N2O EFs from Scotland's croplands, highlighting how these vary from year to year and how they differ from default Tier 1 EFs (Dobbie et al., 1999; Hinton et al., 2015). Brown et al. (2002) used process-based modelling on a county-level spatial scale to derive a cropland-specific EF of 1 %. Flynn et al. (2005) analysed and upscaled field-scale N2O measurements to estimate an arable-specific N2O EF equal to 0.6 % resulting from mineral fertiliser application. Cardenas et al. (2013) ran the UK-DNDC model using gridded input data (5 km resolution) and found an N2O EF of 0.82 % (±0.48) under synthetic fertiliser application and 0.44 (±0.33) % for manure application. Lilly et al. (2009) used modelled soil wetness data (at 100 m resolution) to upscale measured soil N2O data. They estimated an average cereal-specific N2O EF of 0.79 % (0.66 %–1.08 % for spring cereals and 0.50 %–0.75 % for winter cereals). More recently, Fitton et al. (2017) simulated N2O emissions in UK croplands using the DailyDayCent model and estimated the contribution of different factors (i.e. soil properties, climate, fertiliser rate) to the simulated N2O. In common with our study Fitton et al. (2017) found that fertiliser rate was the most important factor contributing by 60 % to the total simulated N2O emissions in Scotland (Fig. 9).
A number of studies have presented crop-specific soil N2O EFs in other parts of northwest Europe. Gabrielle et al. (2006) used process-based modelling (i.e. Crop Environmental Resources Synthesis model) to simulate soil N2O emissions in the most important wheat-producing region of northern France. The authors highlighted the role of the spatial resolution of available input data in model-based studies and estimated a winter wheat-specific N2O EF that was less than a third (i.e. 0.07 %–0.30 %) of the default IPCC EF; for comparison, the winter wheat-specific EF in our study was 0.25 % (±0.11). Dechow and Freibauer (2011) used empirical modelling based on a measured dataset (from northwestern European sites) to estimate a mean cropland-specific N2O EF of 0.91 % for Germany. The measured data that Dechow and Freibauer (2011) used was a subset of the dataset compiled by Stehfest and Bouwman (2006), whose study also suggested a global cropland-specific N2O EF of 0.91 %. The Dechow and Freibauer (2011) study also found that the N2O EF followed a southeast to northwest gradient (i.e. from continental to oceanic climate) with EFs in north and west Germany being between 0.25 % and 0.75 % – significantly lower than those in the south and east. Lesschen et al. (2011) also used the Stehfest and Bouwman (2006) dataset to estimate N2O EFs tailored to European conditions and stratified according to land use, texture and fertiliser type. Their study suggested that between 0.4 % and 0.6 % of the N (in ammonium nitrate form) applied to arable soils is lost directly as N2O (excluding emissions due to crop residues N). The lower EF (0.4 %) corresponds to more sand-based soils and the higher EF (0.6 %) to more clay-based soils. In one of the few studies that present spatially stratified soil N2O EFs for European croplands (i.e. 31 crops considered together), Leip et al. (2011) used European-wide input data and a process-based model (DNDC-EUROPE) to estimate mineral fertiliser-specific N2O EFs equal to 0.5 % for the UK, 0.9 % for France and 1.7 % for Germany.
The results of our simulations showed that the highest N2O EFs were associated with winter oilseed rape with intermediate EFs occurring under spring barley and the lowest N2O EFs under winter wheat and winter barley. The large N2O footprint of WOSR production is caused by three factors. Firstly, the N content of the straw of WOSR is higher than that of the other crops (Walter et al., 2014). This means that more N is contained in the residues that are left on the field after harvest and thus more N is free to be emitted as N2O flux (Walter et al., 2014; Rathke et al., 2006). Secondly, oilseed rape requires more fertiliser N than cereals; therefore, more N is added to soils where WOSR is cultivated (Sylvester-Bradley and Kindred, 2009). Thirdly, crop growth representation in Landscape-DNDC is simplistic (semi-empirical) and treats oilseed rape more like a cereal. Oilseed rape requires more N than cereals do at their early post-winter growth stage. For this reason the recommended amount of fertiliser N for WOSR at the first (out of two) splits is significantly higher than that of cereals (Bouchet et al., 2016). Consequently, the semi-empirical crop growth module tends to underestimate crop N uptake by WOSR right after the first application (i.e. March), leaving more N to be lost as N2O and NO3. A high N2O footprint for oilseed cultivation in northwest Europe has been identified in studies in France (Jeuffroy et al., 2013) and Germany (Kaiser and Ruser, 2000) as well as in a meta-analysis by Walter et al. (2014) and a model-based study by Flynn et al. (2005). The high N2O emissions associated with oilseed rape cultivation in the UK have also been discussed by Baggs et al. (2000).
In order to provide a more complete picture of N budgeting in the simulated agroecosystems, we estimated the fraction of applied N that is leached as NO3 LF and absorbed by the growing crop (NUF). In this context, the predicted mean NO3 LF (14 %) was almost half the generic LF suggested by IPCC (30 %) and the UK cropland-specific LF suggested by Cardenas et al. (2013) (28 %). According to Landscape-DNDC, leached N is the amount of N (kg N ha−1) that leaves the lowest layer of the simulated soil. A regional-scale study using Landscape-DNDC in Germany has found that total mean NO3 leaching exceeds the total mean N2O emissions by a factor of 20 (Klatt et al., 2016). In our study this factor was equal to 24. Possible reasons for the discrepancy between modelled leaching losses in our study and in other studies may include pathways of N loss that are not fully characterised by the model (e.g. surface flow) or a tendency of the model to overestimate soil N storage. In terms of crop N uptake, the mean NUF (37 %) is slightly above the global average N use efficiency (NUE) estimated by Raun and Johnson (1999) (i.e. 33 %). It should also be clarified that by NUE we refer here to the value that is estimated according to Raun and Johnson (1999) where only fertiliser-based N is considered as a N source. The global NUE suggested by Raun and Johnson (1999) was produced using data from a large set of countries and integrates high- and low-efficiency crop-growing systems. A more recent study by Lassaletta et al. (2014) has found that the global NUE was in decline from 1961 (65 %) to 1980 (45 %) and has since then stabilised at 47 %. Lassaletta et al. (2014) also estimated that NUE in the Netherlands, which is a northwestern European country, was around 35 %. In a UK context, measurements of fertiliser recovery by spring barley in Scotland estimated N recoveries between 43 % and 61 % (McTaggart and Smith, 1995). Also, Sylvester-Bradley and Kindred (2009) analysed data on N uptake for various UK crops and showed that around 60 % of the total available N (i.e. N in soil and in fertiliser) is taken up by the crop, if only spring and winter barley, winter wheat and winter oilseed rape are considered. The respective value based on our regional simulations was 59 %, which means that roughly 2∕3 of crop N comes from fertiliser applied during the growing season and 1∕3 comes from the soil's N pool – itself shaped by post-harvest residue decomposition and wet/dry deposition. Taking into account the fact that the crop growth module of Landscape-DNDC is relatively simplistic, the model tended to under-predict NUF but, nevertheless, provided crop N contents within realistic bounds. Overall, around half of the simulated applied N is absorbed by the crop and lost via leaching. These results mean that half of the applied N can exit the simulated systems as volatilised NH3, nitric oxide, nitrogen dioxide, and N2 or remain, as Van Meter et al. (2016) suggest, ”hidden” for long periods inside the soil matrix.
The estimated N2O EFs were negatively correlated to NUF and NO3 LF, which is explained by the fact that N loss via leaching and crop uptake acts in opposition to the emission of N2O and other N-based gases. This is because, in Landscape-DNDC, the crop N uptake is calculated before NO3 leaching and gas diffusion (Kracher, 2010). Also, high soil field capacity and high C content appear to have a positive impact of the estimated N2O EF and N2O emission in general. As the capacity of a simulated soil area to hold water increases (i.e. high FC low WP) so does the possibility of larger anaerobic soil zones and therefore of denitrification activity. The size of a soil's microbial pool depends (in modelling terms) on its C content, and therefore more C results in a larger microbial population. This in turn leads to an increase in the presence of nitrifying and denitrifying organisms and the production of N2O that they control. This process complexity – where factors interact to generate spatial and temporal variability – highlights the value of process-based modelling in predicting soil N2O emissions. The fertiliser rate stands out as the only input variable that clearly affects all three N-based outputs as well as yield. We believe that soil-input-related uncertainty could be reduced by using higher-resolution soil data (<1 km2). However, the uncertainty that is caused by management-related inputs (i.e. sow and harvest timing, fertiliser splits and amounts) should be expected to remain rather large even when using higher-resolution data. This is because management-related inputs, including N application rates, are constructed by combining crop cover and soil data layers whose original resolution is 4 and 1 km2 respectively. Taking everything into account, we argue that the use of high-resolution soil data would be more effective when combined with accurate information on crop cover (i.e. satellite-derived crop cover information) because that would allow more accurate calculations of the timing and the amount of fertiliser application in the simulated crop fields.
The method used to quantify model input and parametric uncertainty in this study was designed so as to be time efficient but at a minimum cost in terms of robustness. We estimated that a full regional-scale uncertainty analysis would have lasted 27 times more than what our pseudo-regional analysis did. The impact of uncertainty of the nine key model parameters (related to soil biogeochemistry) appears to be small compared to that of soil-related inputs. The small number of parameters examined and the fact that their ranges have been calibrated according to UK conditions (i.e. measured N2O data) can explain their limited role. However, the examined parameters have a noticeable impact on NO3 leaching prediction. We attribute this higher parametric sensitivity to the fact the parameters have been calibrated only against measured soil N2O data. We can reasonably assume that the use of (currently lacking) measured data on NO3 leaching would have had a similar impact on NO3 LF relative uncertainty. The results suggest that model predictions of N2O emission and NO3 leaching are sensitive to uncertainties around soil-related input data such as soil clay content, pH, C and water retention properties, with N2O emissions being particularly sensitive to them. The low sensitivity of the predicted crop N uptake to model parameters and soil inputs reflects the fact that, under sufficient N supply, climate is the main determinant of crop growth and, consequently, N uptake.
Finally, all simulated agroecosystems (i.e. soil–crop combinations) are managed according to recommended practices, with activities like harvest and fertiliser application happening at the same time across large areas. This synchrony is not realistic and it is done purely due to lack of accurate knowledge of actual management. Management interventions that under certain climatic conditions can lead to increased loss of N can be represented in simulations even though in actuality they would be rescheduled (e.g. fertiliser spread on a day of very heavy rainfall). It can be argued that the simulated systems are managed less intelligently than real-life systems. Nevertheless, the large number of simulations (18 367 unique instances) under a range of climate, soil and crop management combinations together with the fine spatial scale of the input data assure that any patterns in soil N2O production (e.g. localised hotspots, strong dependency on certain drivers) are detectable.
This study offers new insights on the regional N2O footprint of arable agriculture in Scotland and, by extension, in northwest Europe. It shows (1) that the soil N2O EF for cereals is well below the generic IPCC EF of 1 %; (2) that winter oilseed rape cultivation (especially if in monoculture) contributes to much higher N2O emissions (per unit area) than that of cereals; and (3) that the soil N2O emissions are the result of dynamic interactions between different factors, of which only fertiliser N was identified as having a clear effect on all simulated variables. In general, we conclude that, while the N footprint of northwestern European croplands is affected by inherent edaphoclimatic conditions, human decisions on cropping patterns and fertilisation largely control direct soil N2O emissions. Moreover, the low mean crop N uptake that was estimated here suggests that there is a considerable margin for increases in the N use efficiency of crop-based agricultural systems. A complete impact assessment of different N-conscious agricultural practices (e.g. reduced fertiliser use, alternative crop coverage patterns) would require a consideration of both crop yields and N-related variables (N2O, NO3, N uptake), but this was beyond the scope of our study.
We carefully considered critical aspects of large-scale agroecosystem BGC modelling by ensuring (1) that the model that was used was calibrated and tested under local conditions, (2) that a high resolution was selected for the input data considering their different original resolutions, (3) that N2O fluxes were not simulated at the expense of a realistic prediction of the other aspects of cropland N budget, and (4) that a measure of model output uncertainty was estimated and presented. These modelling tasks might be data-demanding but, we argue that, their completion guarantees the robustness of model-based studies and should, therefore, be part of similar studies in the future. Moreover, our uncertainty analysis results show that parameter calibration can minimise their impact on model output uncertainty, leaving soil data as the main source of output uncertainty (when not considering model structural uncertainty).
Process-based BGC models will always represent simplifications of real agroecosystems, but they offer the opportunity to explore management and policy interventions that can increase the resource-use efficiency and reduce the environmental footprint of arable systems across the world. The development of algorithms that reproduce farmer decisions (planting, fertiliser application, etc.) based on a combination of observed and simulated variables (e.g precipitation, temperature, crop/soil N content) and field-based information (e.g. census questionnaires) can improve agroecosystem modelling by replacing more simplistic approaches in defining the modelled field management with approaches that assume management is reactive to varying local conditions and even data-based. We believe that the development of such tools would benefit large-scale BGC modelling and could have synergies in the precision agriculture domain. In this context, remote sensing is increasingly used to obtain information on the crop cover and even crop N content. By combining such data with higher-resolution (<1 km2) soil data, which are available for Scotland, the soil-input-related uncertainty of N2O model predictions can be reduced.
The soil data used in this study are maintained by the James Hutton Institute and were provided on the basis of a research-use licence agreement. A lower-resolution version of the data used in this study is publicly available (https://www.hutton.ac.uk/sites/default/files/files/soils/downloads/Hutton_NSIS10km_OpenData.zip, last access: 15 April 2019) The climate data used in this study are publicly available and are maintained by the UK Centre for Ecology and Hydrology (https://doi.org/10.5285/b745e7b1-626c-4ccc-ac27-56582e77b900, Robinson et al., 2017). The crop coverage data used in this study are publicly available and can be obtained through the EDINA agcensus portal (http://agcensus.edina.ac.uk, last access: 15 April 2019).
The supplement related to this article is available online at: https://doi.org/10.5194/bg-16-1641-2019-supplement.
VM designed and conducted the study. CFET, MW and RMR provided input on data appropriateness, availability, retrieval and processing and appraised the different methodological approaches that were tested and used in the study. All co-authors were involved in writing this article.
The authors declare that they have no conflict of interest.
The authors are grateful to the Scottish Government for supporting this work as well as to the NERC Greenhouse Gas Emissions & Feedbacks programme and the Soils-R-GGREAT consortium for their contribution.
This paper was edited by Akihiko Ito and reviewed by two anonymous referees.
Baggs, E. M., Rees, R. M., and Smith, K. A.: Nitrous oxide emission from soils after incorporating crop residues, Soil Use Manage., 16, 82–87, 2000. a
Balkovia, J., van der Velde, M., Schmid, E., Skalsky, R., Khabarov, N., Obersteiner, M., Stürmer, B., and Xiong, W.: Pan-European crop modelling with EPIC: Implementation, up-scaling and regional crop yield validation, Agr. Syst., 120, 61–75, 2013. a
Baobao, P., Shu, K. L., Arvin, M., Yiqi, L., and Deli, C.: Ammonia volatilization from synthetic fertilizers and its mitigation strategies: A global synthesis, Agr. Ecosyst. Environ., 232, 283–289, https://doi.org/10.1016/j.agee.2016.08.019, 2016. a
Batjes, N. H.: Harmonized soil property values for broad-scale modelling (WISE30sec) with estimates of global soil carbon stocks, Geoderma, 269, 61–68, 2016. a
Bell, M. J., Cloy, J. M., and Rees, R. M.: The true extent of agriculture's contribution to national greenhouse gas emissions, Environ. Sci. Policy, 39, 1–12, 2014. a, b
Bellocchi, G., Rivington, M., Matthews, K., and Acutis, M.: Deliberative processes for comprehensive evaluation of agroecological models. A review, Agron. Sustain. Dev., 35, 589–605, 2014. a
Bonsall, C., Macklin, M. G., Anderson, D. E., and Payton, R. W.: Climate Change and the Adoption of Agriculture in North-West Europe, Eur. J. Archaeol., 5, 9–23, https://doi.org/10.1177/1465712002005001168, 2002. a
Bouchet, A.-S., Laperche, A., Bissuel-Belaygue, C., Snowdon, R., Nesi, N., and Stahl, A.: Nitrogen use efficiency in rapeseed. A review, Agron. Sustain. Dev., 36, 1–20, https://doi.org/10.1007/s13593-016-0371-0, 2016. a
Brown, L., Syed, B., Jarvis, S. C., Sneath, R. W., Phillips, V. R., Goulding, K. W. T., and Li, C. L.: Development and application of a mechanistic model to estimate emission of nitrous oxide from UK agriculture, Atmos. Environ., 36, 917–928, 2002. a, b
Cardenas, L. M., Gooday, R., Brown, L., Scholefield, D., Cuttle, S., Gilhespy, S., Matthews, R., Misselbrook, T., Wang, J., Li, C. L., Hughes, G., and Lord, E.: Towards an improved inventory of N2O from agriculture: Model evaluation of N2O emission factors and N fraction leached from different sources in UK agriculture, Atmos. Environ., 79, 340–348, 2013. a, b, c
Cowan, N. J., Famulari, D., Levy, P. E., Anderson, M., Bell, M. J., Rees, R. M., Reay, D. S., and Skiba, U. M.: An improved method for measuring soil N2O fluxes using a quantum cascade laser with a dynamic chamber, Eur. J. Soil Sci., 65, 643–652, 2014. a
Dechow, R. and Freibauer, A.: Assessment of German nitrous oxide emissions using empirical modelling approaches, Nutr. Cycl. Agroecosys., 91, 235–254, https://doi.org/10.1007/s10705-011-9458-9, 2011. a, b, c
DEFRA: Fertiliser Manual RB209, 9th Edn., Stationery Office, Norwich, UK, 2010. a
De Vries, W., Kros, J., Reinds, G. J., and Butterbach-Bahl, K.: Quantifying impacts of nitrogen use in European agriculture on global warming potential, Curr. Opin. Env. Sust., 3, 291–302, 2011a. a
De Vries, W., Leip, A., Reinds, G. J., Kros, J., Lesschen, J. P., and Bouwman, A. F.: Comparison of land nitrogen budgets for European agriculture by various modeling approaches, Environ. Pollut., 159, 3254–3268, https://doi.org/10.1016/j.envpol.2011.03.038, 2011b. a
Dobbie, K. E., McTaggart, I. P., and Smith, K. A.: Nitrous oxide emissions from intensive agricultural systems: Variations between crops and seasons, key driving variables, and mean emission factors, J. Geophys. Res.-Atmos., 104, 26891–26899, 1999. a
Edina AgCensus: Grid square agricultural census data for England, Scotland and Wales, available at: http://agcensus.edina.ac.uk (last access: 1 March 2017), 2016. a
European Commission: European Union: Agri-food database, available at: http://agridata.ec.europa.eu/extensions/DataPortal/home.html (last access: 1 June 2018), 2018. a
Eurostat: Farm structure statistics, available at: https://ec.europa.eu/eurostat/web/agriculture/data/database (last access: 1 October 2018), 2015. a
Fitton, N., Datta, A., Cloy, J. M., Rees, R. M., Topp, C. F. E., Bell, M. J., Cardenas, L. M., Williams, J., Smith, K., Thorman, R., Watson, C. J., McGeough, K. L., Kuhnert, M., Hastings, A., Anthony, S., Chadwick, D., and Smith, P.: Modelling spatial and inter-annual variations of nitrous oxide emissions from UK cropland and grasslands using DailyDayCent, Agr. Ecosyst. Environ., 250, 1–11, https://doi.org/10.1016/j.agee.2017.08.032, 2017. a, b
Flynn, H. C., Smith, J., Smith, K. A., Wright, J., Smith, P., and Massheder, J.: Climate- and crop-responsive emission factors significantly alter estimates of current and future nitrous oxide emissions from fertilizer use, Glob. Change Biol., 11, 1522–1536, 2005. a, b, c
Gabrielle, B., Laville, P., Duval, O., Nicoullaud, B., Germon, J. C., and Henault, C.: Process-based modeling of nitrous oxide emissions from wheat-cropped soils at the subregional scale, Global Biogeochem. Cy., 20, GB4018, https://doi.org/10.1029/2006GB002686, 2006. a
Galloway, J. N., Leach, A. M., Bleeker, A., and Erisman, J. W.: A chronology of human understanding of the nitrogen cycle, Philos. T. R. Soc. B, 368, 20130120, https://doi.org/10.1098/rstb.2013.0120, 2013. a
Gilhespy, S. L., Anthony, S., Cardenas, L., Chadwick, D., del Prado, A., Li, C., Misselbrook, T., Rees, R. M., Salas, W., Sanz-Cobena, A., Smith, P., Tilston, E. L., Topp, C. F. E., Vetter, S., and Yeluripati, J. B.: First 20 years of DNDC (DeNitrification DeComposition): Model evolution, Ecol. Model., 292, 51–62, 2014. a, b
Haas, E., Klatt, S., Fröhlich, A., Kraft, P., Werner, C., Kiese, R., Grote, R., Breuer, L., and Butterbach-Bahl, K.: LandscapeDNDC: a process model for simulation of biosphere–atmosphere–hydrosphere exchange processes at site and regional scale, Landscape Ecol., 28, 615–636, https://doi.org/10.1007/s10980-012-9772-x, 2012. a, b
Hay, R., Russell, G., and Edwards, T. W.: Crop Production in the East of Scotland, Tech. rep., Scottish Agricultural Science Agency, Edinburgh, UK, 2000. a
Hengl, T., de Jesus, J. M., MacMillan, R. A., Batjes, N. H., Heuvelink, G. B. M., Ribeiro, E., Samuel-Rosa, A., Kempen, B., Leenaars, J. G. B., Walsh, M. G., and Gonzalez, M. R.: SoilGrids1km – Global Soil Information Based on Automated Mapping, PLoS ONE, 9, e105992-17, https://doi.org/10.1371/journal.pone.0105992, 2014. a
Hinton, N. J., Cloy, J. M., Bell, M. J., Chadwick, D. R., Topp, C. F. E., and Rees, R. M.: Managing fertiliser nitrogen to reduce nitrous oxide emissions and emission intensities from a cultivated Cambisol in Scotland, Geoderma Regional, 4, 55–65, 2015. a
Holzworth, D. P., Huth, N. I., deVoil, P. G., Zurcher, E. J., Herrmann, N. I., McLean, G., Chenu, K., van Oosterom, E. J., Snow, V., Murphy, C., Moore, A. D., Brown, H., Whish, J. P. M., Verrall, S., Fainges, J., Bell, L. W., Peake, A. S., Poulton, P. L., Hochman, Z., Thorburn, P. J., Gaydon, D. S., Dalgliesh, N. P., Rodriguez, D., Cox, H., Chapman, S., Doherty, A., Teixeira, E., Sharp, J., Cichota, R., Vogeler, I., Li, F. Y., Wang, E., Hammer, G. L., Robertson, M. J., Dimes, J. P., Whitbread, A. M., Hunt, J., van Rees, H., McClelland, T., Carberry, P. S., Hargreaves, J. N. G., MacLeod, N., McDonald, C., Harsdorf, J., Wedgwood, S., and Keating, B. A.: Evolution towards a new generation of agricultural systems simulation, Environ. Model. Softw., 62, 327–350, 2014. a
Jeuffroy, M. H., Baranger, E., Carrouée, B., de Chezelles, E., Gosme, M., Hénault, C., Schneider, A., and Cellier, P.: Nitrous oxide emissions from crop rotations including wheat, oilseed rape and dry peas, Biogeosciences, 10, 1787–1797, https://doi.org/10.5194/bg-10-1787-2013, 2013. a
Kaiser, E. A. and Ruser, R.: Nitrous oxide emissions from arable soils in Germany – An evaluation of six long-term field experiments, J. Plant Nutr. Soil Sc., 163, 249–259, 2000. a
Klatt, S., Kraus, D., Rahn, K., Werner, C., Kiese, R., Butterbach-Bahl, K., and Haas, E.: Parameter-Induced Uncertainty Quantification of Regional N2O Emissions and NO3 Leaching using the Biogeochemical Model LandscapeDNDC, in: Synthesis and Modeling of Greenhouse Gas Emissions and Carbon Storage in Agricultural and Forest Systems to Guide Mitigation and Adaptation, edited by: Del Grosso, S., Ahuja, L., and Parton, W., Adv. Agric. Syst. Model. 6. ASA, CSSA, and SSSA, Madison, WI, 149–172, https://doi.org/10.2134/advagricsystmodel6.2013.0001, 2016. a
Kracher, D.: Modeling Nitrous Oxide Emissionsand Associated C and N Turnover and Exchange Processes Between Atmosphere and Biosphere for Agricultural Ecosystems Onsite and Regional Scale, PhD thesis, Albert-Ludwigs-Universität, Freiburg im Breisgau, Germany, 2010. a
Lassaletta, L., Billen, G., Grizzetti, B., Anglade, J., and Garnier, J.: 50 year trends in nitrogen use efficiency of world cropping systems: the relationship between yield and nitrogen input to cropland, Environ. Res. Lett., 9, 105011, https://doi.org/10.1088/1748-9326/9/10/105011, 2014. a, b
Leip, A., Busto, M., and Winiwarter, W.: Developing spatially stratified N2O emission factors for Europe, Environ. Pollut., 159, 3223–3232, 2011. a, b
Lesschen, J. P., Velthof, G. L., de Vries, W., and Kros, J.: Differentiation of nitrous oxide emission factors for agricultural soils, Environ. Pollut., 159, 3215–3222, https://doi.org/10.1016/j.envpol.2011.04.001, 2011. a
Li, C. L., Frolking, S., and Frolking, T. A.: A model of nitrous oxide evolution from soil driven by rainfall events: 1. Model structure and sensitivity, J. Geophys. Res.-Oceans, 97, 9759–9776, 1992. a
Li, X., Yeluripati, J., Jones, E. O., Uchida, Y., and Hatano, R.: Hierarchical Bayesian calibration of nitrous oxide (N2O) and nitrogen monoxide (NO) flux module of an agro-ecosystem model: ECOSSE, Ecol. Model., 316, 14–27, 2015. a
Lilly, A., Ball, B. C., McTaggart, I. P., and Horne, P. L.: Spatial and temporal scaling of nitrous oxide emissions from the field to the regional scale in Scotland, Nutr. Cycl. Agroecosys., 66, 241–257, 2003. a
Lilly, A., Ball, B. C., McTaggart, I. P., and DeGroote, J.: Spatial modelling of nitrous oxide emissions at the national scale using soil, climate and land use information, Glob. Change Biol., 15, 2321–2332, 2009. a, b
McTaggart, I. P. and Smith, K. A.: The effect of rate, form and timing of fertilizer N on nitrogen uptake and grain N content in spring malting barley, J. Agr. Sci., 125, 341–353, https://doi.org/10.1017/S0021859600084847, 1995. a
Monfreda, C., Ramankutty, N., and Foley, J. A.: Farming the planet: 2. Geographic distribution of crop areas, yields, physiological types, and net primary production in the year 2000, Global Biogeochem. Cy., 22, GB1022, https://doi.org/10.1029/2007GB002947, 2008. a
Myrgiotis, V., Rees, R. M., Topp, C. F., and Williams, M.: A systematic approach to identifying key parameters and processes in agroecosystem models, Ecol. Model., 368, 344–356, https://doi.org/10.1016/j.ecolmodel.2017.12.009, 2018a. a, b
Myrgiotis, V., Williams, M., Topp, C. F. E., and Rees, R. M.: Improving model prediction of soil N2O emissions through Bayesian calibration, Sci. Total Environ., 624, 1467–1477, https://doi.org/10.1016/j.scitotenv.2017.12.202, 2018b. a, b, c
Necpálová, M., Anex, R. P., Fienen, M. N., Del Grosso, S. J., Castellano, M. J., Sawyer, J. E., Iqbal, J., Pantoja, J. L., and Barker, D. W.: Understanding the DayCent model: Calibration, sensitivity, and identifiability through inverse modeling, Environ. Modell. Softw., 66, 110–130, 2015. a
Olesen, J. E., Trnka, M., Kersebaum, K. C., Skjelvaag, A. O., Seguin, B., Peltonen-Sainio, P., Rossi, F., Kozyra, J., and Micale, F.: Impacts and adaptation of European crop production systems to climate change, Eur. J. Agron., 34, 96–112, https://doi.org/10.1016/j.eja.2010.11.003, 2011. a
Pan, B., Lam, S. K., Mosier, A., Luo, Y., and Chen, D.: Ammonia volatilization from synthetic fertilizers and its mitigation strategies: A global synthesis, Agr. Ecosyst. Environ., 232, 283–289, https://doi.org/10.1016/j.agee.2016.08.019, 2016. a
Paustian, K., Lehmann, J., Ogle, S., Reay, D., Robertson, G. P., and Smith, P.: Climate-smart soils, Nature, 532, 49–57, 2016. a
Pogson, M. and Smith, P.: Effect of spatial data resolution on uncertainty, Environ. Modell. Softw., 63, 87–96, 2015. a
Potter, P., Ramankutty, N., Bennett, E. M., and Donner, S. D.: Characterizing the Spatial Patterns of Global Fertilizer Application and Manure Production, Earth Interact., 14, 1–22, https://doi.org/10.1175/2009EI288.1, 2010. a
Rathke, G., Behrens, T., and Diepenbrock, W.: Integrated nitrogen management strategies to improve seed yield, oil content and nitrogen efficiency of winter oilseed rape (Brassica napus L.): A review, Agr. Ecosyst. Environ., 117, 80–108, 2006. a
Raun, W. R. and Johnson, G. V.: Improving nitrogen use efficiency for cereal production, Agron. J., 91, 357–363, 1999. a, b, c
Ravishankara, A. R., Haag, D., and Portmann, R. W.: Nitrous Oxide (N2O): The Dominant Ozone-Depleting Substance Emitted in the 21st Century, Science, 326, 123–125, 2009. a
Reay, D. S., Davidson, E. A., Smith, K. A., Smith, P., Melillo, J. M., Dentener, F., and Crutzen, P. J.: Global agriculture and nitrous oxide emissions, Nature Climate Change, 2, 410–416, 2012. a
Robinson, E., Blyth, E., Clark, D., Comyn-Platt, E., Finch, J., and Rudd, A.: Climate hydrology and ecology research support system meteorology dataset for Great Britain (1961–2015) [CHESS-met] v1.2. NERC Environmental Information Data Centre, https://doi.org/10.5285/b745e7b1-626c-4ccc-ac27-56582e77b900, 2017. a, b
The Scottish Government: Results From the June 2013 Scottish Agricultural Census, Edinburgh, UK, 1–49, 2013. a
Scottish Spatial Data Infrastructure: National Soil Inventory of Scotland, available at: https://www.spatialdata.gov.scot/geonetwork/srv/eng/catalog.search#/home (last access: 9 April 2019), 2014. a
Smith, K. A.: Changing views of nitrous oxide emissions from agricultural soil: key controlling processes and assessment at different spatial scales, Eur. J. Soil Sci., 68, 137–155, https://doi.org/10.1111/ejss.12409, 2017. a
Stehfest, E. and Bouwman, L.: N2O and NO emission from agricultural fields and soils under natural vegetation: summarizing available measurement data and modeling of global annual emissions, Nutr. Cycl. Agroecosys., 74, 207–228, https://doi.org/10.1007/s10705-006-9000-7, 2006. a, b
Stoate, C., Boatman, N. D., Borralho, R. J., Carvalho, C. R., Snoo, G. R. d., and Eden, P.: Ecological impacts of arable intensification in Europe, J. Environ. Manage., 63, 337–365, https://doi.org/10.1006/jema.2001.0473, 2001. a
Sylvester-Bradley, R. and Kindred, D. R.: Analysing nitrogen responses of cereals to prioritize routes to the improvement of nitrogen use efficiency, J. Exp. Bot., 60, 1939–1951, 2009. a, b
Sylvester-Bradley, R., Thorman, R., Kindred, D. R., Wynn, S. C., Smith, K. E., Rees, R. M., Topp, C. F. E., Pappa, V. A., Mortimer, N. D., Misselbrook, T. H., Gilhespy, S., Cardenas, L. M., Chauhan, M., Bennet, G., Malkin, S., and Munro, D. G.: Minimising nitrous oxide intensities of arable crop products (MIN-NO), Tech. rep., Kenilworth, UK, 2015. a, b
Toth, G., Montanarella, L., Stolbovoy, V., Mate, F., Bodis, K., Jones, A., Panagos, P., and van Liedekerke, M.: Soils of the European Union, Tech. rep., Institute for Environment and Sustainability, Luxembourg, 2008. a
Van Meter, K. J., Basu, N. B., Veenstra, J. J., and Burras, C. L.: The nitrogen legacy: emerging evidence of nitrogen accumulation in anthropogenic landscapes, Environ. Res. Lett., 11, 1–12, 2016. a
Walter, K., Don, A., Fuß, R., Kern, J., Drewer, J., and Flessa, H.: Direct nitrous oxide emissions from oilseed rape cropping – a meta-analysis, GCB Bioenergy, 7, 1260–1271, 2014. a, b, c
Wang, G. and Chen, S.: A review on parameterization and uncertainty in modeling greenhouse gas emissions from soil, Geoderma, 170, 206–216, 2012. a