the Creative Commons Attribution 4.0 License.
the Creative Commons Attribution 4.0 License.
 | 23 May 2019
Kinetics of calcite precipitation by ureolytic bacteria under aerobic and anaerobic conditions
Andrew C. Mitchell
Erika J. Espinosa-Ortiz
Stacy L. Parks
Adrienne J. Phillips
Alfred B. Cunningham
The kinetics of urea hydrolysis (ureolysis) and induced calcium carbonate (CaCO3) precipitation for engineering use in the subsurface was investigated under aerobic conditions using Sporosarcina pasteurii (ATCC strain 11859) as well as Bacillus sphaericus strains 21776 and 21787. All bacterial strains showed ureolytic activity inducing CaCO3 precipitation aerobically. Rate constants not normalized to biomass demonstrated slightly higher-rate coefficients for both ureolysis (kurea) and CaCO3 precipitation (kprecip) for B. sphaericus 21776 ( h−1, h−1) compared to S. pasteurii ( h−1, h−1), though these differences were not statistically significantly different. B. sphaericus 21787 showed little ureolytic activity but was still capable of inducing some CaCO3 precipitation. Cell growth appeared to be inhibited during the period of CaCO3 precipitation. Transmission electron microscopy (TEM) images suggest this is due to the encasement of cells and was reflected in lower kurea values observed in the presence of dissolved Ca. However, biomass regrowth could be observed after CaCO3 precipitation ceased, which suggests that ureolysis-induced CaCO3 precipitation is not necessarily lethal for the entire population. The kinetics of ureolysis and CaCO3 precipitation with S. pasteurii was further analyzed under anaerobic conditions. Rate coefficients obtained in anaerobic environments were comparable to those under aerobic conditions; however, no cell growth was observed under anaerobic conditions with , or Fe3+ as potential terminal electron acceptors. These data suggest that the initial rates of ureolysis and ureolysis-induced CaCO3 precipitation are not significantly affected by the absence of oxygen but that long-term ureolytic activity might require the addition of suitable electron acceptors. Variations in the ureolytic capabilities and associated rates of CaCO3 precipitation between strains must be fully considered in subsurface engineering strategies that utilize microbial amendments.
- Article
(3064 KB) - Full-text XML
-
Supplement
(616 KB) - BibTeX
- EndNote


Carbonate precipitation is a natural phenomenon that may also be utilized in many subsurface engineering applications (Phillips et al., 2013a) including soil stabilization (van Paassen et al., 2010), immobilization of radionuclides (Mitchell and Ferris, 2005, 2006a, b; Tobler et al., 2012; Warren et al., 2001), and mineral plugging for enhanced oil recovery and carbon sequestration (Dupraz et al., 2009; Ferris et al., 1996; Mitchell et al., 2010; Phillips et al., 2013b). Mineral precipitation can be induced by bacteria as a by-product of common microbial processes, such as urea hydrolysis (ureolysis). In this process, bacteria hydrolyze urea (CO(NH2)2), an important nitrogen compound found in natural environments, to ammonia (NH3) and carbonic acid (H2CO3) (Eqs. 1–3). The NH3 and H2CO3 equilibrate in circumneutral aqueous environments to form bicarbonate (), two ammonium ions () and one hydroxide ion (OH−) (Eqs. 4–5), or at higher pH values, to one carbonate ion () and two (Eqs. 4–6). In the presence of dissolved calcium (Ca2+), this increase in carbonate alkalinity shifts the saturation state of the system, allowing for solid calcium carbonate (CaCO3) to form (Eq. 7). The overall reaction from the hydrolysis of urea in the presence of Ca2+ is summarized by Eq. (8).
The use of ureolytic bacteria in biotechnological applications is appealing for many reasons. Ureolytically active microorganisms are common in a wide variety of soil and aquatic environments; thus, indigenous microorganisms capable of ureolysis can be either stimulated in situ or, alternatively, they can be used to augment environments lacking ureolytic microorganisms (Fujita et al., 2000; Warren et al., 2001). Urea is a fairly inexpensive substrate and it is often contained in wastewater (Hammes et al., 2003b), so this waste product may be used to stimulate ureolysis in engineering applications (Mitchell et al., 2010). Moreover, the controlled increase in pH and alkalinity in the subsurface by ureolytic bacteria is preferable to the injection of a basic solution (abiotic process), which could lead to instantaneous CaCO3 supersaturation and precipitation at the point of injection limiting the radius of influence of the technology. The injection of urea into the subsurface followed by microbially induced ureolysis would allow for controlled, gradual ureolysis further away from the injection point, promoting a wider spatial distribution of CaCO3 in the subsurface and avoiding uncontrolled plugging at the point of injection (Cuthbert et al., 2013; Ebigbo et al., 2012; Mitchell and Ferris, 2005; Schultz et al., 2011; Tobler et al., 2012, 2014).
Among different ureolytic bacteria, Sporosarcina pasteurii (formerly known as Bacillus pasteurii) has been extensively used as the model urease-producing organism in ureolysis-driven CaCO3 precipitation studies, due to its high ureolytic activity and constitutive production of urease (Phillips et al., 2013a). The use of S. pasteurii for CaCO3 precipitation is feasible under aerobic conditions and the kinetics of ureolysis under different conditions have been studied. Most studies have reported first-order ureolysis rates with respect to urea concentration, with the rate constant (kurea) ranging between 0.002 and 0.090 h−1 under aerobic conditions in artificial groundwater without nutrients added (Dupraz et al., 2009; Ferris et al., 2004; Hammes et al., 2003a; Mitchell and Ferris, 2005; Tobler et al., 2012) and 0.35 h−1 with the addition of nutrients (Lauchnor et al., 2015). Ureolysis rates have been suggested to be temperature-dependent (Ferris et al., 2004), and it seems to also be affected by cell concentration (inoculum size) (Lauchnor et al., 2015; Tobler et al., 2011).
Although the ureolytic activity of S. pasteurii under anoxic conditions has been observed (Martin et al., 2012; Mortensen et al., 2011; Tobler et al., 2012), there is controversy regarding the extent and duration of ureolytic activity that can be achieved in the absence of oxygen. Mortensen et al. (2011) and Tobler et al. (2012) observed extensive ureolytic activity under anoxic conditions, suggesting that the anoxic environment does not inhibit urease activity. Conversely, Martin et al. (2012) observed limited cell growth and poor ureolysis under anoxic conditions and suggested that the ureolytic activity observed was due to the urease already present in the cells.
In this study, the ability of S. pasteurii to grow in the absence of oxygen (with or without nitrate (), sulfate () or ferric ion (Fe3+) as possible electron acceptors) was investigated along with the kinetics of ureolysis and CaCO3 precipitation. Moreover, this study investigates and compares the ureolytic activity of S. pasteurii with different strains of Bacillus sphaericus under aerobic conditions, which have also been suggested to be capable of ureolysis-induced CaCO3 precipitation (Dick et al., 2006; Hammes et al., 2003a).
2.1 Solutions
Kinetic experiments were carried out using the CaCO3 mineralizing medium (CMM) described by Ferris et al. (1996) (see Table SI1.1 in the Supplement). Both Ca2+-inclusive (CMM+) and Ca2+-exclusive (CMM−) versions of this medium were used. Aerobic CMM− was prepared as follows. A double-strength solution of nutrient broth was prepared and autoclaved. Nutrient broth was chosen in this experiment to enable cell growth. A separate solution of double-strength urea, ammonium chloride and sodium bicarbonate was prepared and stirred until completely dissolved. These two solutions were combined and adjusted to a pH of 6.0 using concentrated HCl. CMM+ was prepared similarly, but calcium chloride was added after the pH adjustment. Media were filter-sterilized into sterile Pyrex bottles using 0.2 µm pore size filters (Nalgene, Rochester, NY). Anaerobic CMM was produced in the same manner. However, all stock solutions were made in an anaerobic chamber using water that had been degassed by stirring overnight in the oxygen-free atmosphere of the chamber (90 % N2, 5 % CO2, 5 % H2). Solutions were filter-sterilized into serum bottles and were then capped and sealed inside the chamber. Prior to the experiments, the solutions were combined to reach the final concentrations listed in Table SI1.1.
2.2 Bacterial strains and culturing conditions
Three strains of ureolytic bacteria were used: S. pasteurii (ATCC 11859) and two isolates from a garden soil and landfill soil – B. sphaericus 21776 and B. sphaericus 21787 (Belgian Coordinated Collections of Microorganisms, Laboratory of Microbiology, Ghent University) (Hammes et al., 2003a). Bacillus subtilis strain 186 (ATCC 23 857), a non-ureolytic organism, was used as a control species. Abiotic (i.e., non-inoculated) controls were also set up and run in parallel. Pilot cultures were grown in flasks by adding 100 µL of thawed stock to 100 mL of autoclaved brain heart infusion (BHI) +2 % urea. S. pasteurii and B. sphaericus were grown on an incubator shaker (New Brunswick Scientific, Edison, NJ) at 30 ∘C and 150 rpm, while B. subtilis was grown on an incubator shaker at 37 ∘C and 150 rpm. A total of 100 µL of pilot cultures was transferred at 24 and 48 h to new flasks containing 100 mL of BHI +2 % urea.
2.3 Aerobic experiments
Once the pilot cultures were ready for inoculation, 40 mL of culture was added to a 50 mL centrifuge tube. This tube was centrifuged at 4303×g using a Sorvall Instruments (Asheville, NC) RC-5C centrifuge for 10 min at 4–6 ∘C. The supernatant was poured off and the cell pellet was resuspended using about 40 mL of CMM− and again centrifuged for 10 min. This process was repeated once more. After the third run in the centrifuge, the supernatant was poured off and enough CMM− was added to achieve a final optical density reading at 600 nm (OD600) of 0.4 (CMM-blank corrected, measured in a 96-well plate using a BioTek Synergy HT plate reader). A total of 1 mL of prepared S. pasteurii, B. sphaericus strain 21776 or strain 21787 culture was added to 250 mL Pyrex bottles with 150 mL of media (either CMM+ or CMM−; initial concentration of biomass OD). After inoculation, the systems were statically incubated at 30 ∘C for kinetic experiments.
2.4 Anaerobic experiments
Pilot cultures for anaerobic experiments were limited to the use of S. pasteurii and were grown in the same manner as those used in aerobic experiments. However, cells were transferred into an anaerobic chamber and resuspended in anaerobically prepared CMM−, then transferred to a serum bottle, sealed and crimped inside the anaerobic chamber. Optical density measurements for time zero were taken after the final suspension, with the same initial density as the aerobic experiments (OD). The first set of experiments investigated cell growth and ureolysis under oxygen-free conditions with a range of potential terminal electron acceptors (TEAs). Experiments were run using a batch system, consisting of 100 mL of CMM− media including 10 mM , or Fe3+ as potential TEAs and inoculated with 1 mL of S. pasteurii in 150 mL serum bottles. Concentrated stock solutions of each TEA were made in the anaerobic chamber and filter-sterilized: (i) a 1 M solution of NaNO3; (ii) a concentrated solution, made by combining 1 M Na2SO4 and 1 M Na2S, where Na2S was added to quench any residual oxygen and make reduction possible; and (iii) a stock solution of Fe(III) citrate, using 50 mM Fe(III) citrate as previously described (Gerlach et al., 2011). Appropriate amounts of each stock solution were added to the separate serum bottles containing CMM− and S. pasteurii. The growth survey was also conducted in CMM− without the addition of a TEA. After inoculation, the systems were statically incubated at 30 ∘C. Abiotic control experiments, without the inclusion of S. pasteurii, were also performed. Aliquots were extracted from the systems in the anaerobic chamber and monitored for pH and OD600 during the duration of the experiments. Comparative aerobic control experiments were also performed with CMM− media including 10 mM , or Fe3+ and inoculated with 1 mL of S. pasteurii in 150 mL serum bottles.
The second set of experiments investigated the detailed kinetics of ureolysis and CaCO3 precipitation with S. pasteurii and CMM+ as described above, with as the potential TEA, by monitoring pH, dissolved Ca2+ and concentrations. Control experiments were also performed with CMM+ without the addition of a TEA and CMM− with as a potential TEA. Here, a stock solution of 10 M NaNO3 was made by mixing and filter-sterilizing in the anaerobic chamber, and an appropriate amount was added to the CMM+ or CMM− to reach a final concentration of 1 M .
2.5 Experimental sampling and analysis
At different time points, 3 mL of sample was aseptically extracted from the systems and measurements were made of pH, biomass, and Ca2+ concentration. concentrations were determined using the Nessler Assay (Mitchell and Ferris, 2005). Urea concentrations were determined from concentrations, according to Eqs. (3) and (4). Ca2+ concentrations were measured after appropriate dilution in trace-metal grade 5 % HNO3 (Fisher Scientific) using an Agilent 7500ce inductively coupled plasma mass spectrometer (ICP-MS). Bacterial biomass was determined using three methods: plate counts, OD600 and protein assays. OD600 was used as a growth indicator in experiments carried out in the absence of Ca2+ (see Sect. 1.2 in the Supplement). Transmission electron microscopy (TEM) images were taken using a LEO 912AB TEM and photographed with a Proscan 2048×2048 charge-coupled device (CCD) camera from a batch culture in CMM+ inoculated with S. pasteurii. At the point of crystal formation (after approximately 2.5 h), a mixture of CaCO3 crystals and cells were extracted from the system. Separate samples of S. pasteurii grown in the absence of Ca2+ were also collected and imaged. Further details are given in the Supplement Sect. 1.3.
The PHREEQC (version 2) speciation–solubility geochemical model (Parkhust and Appelo, 1999) was used to calculate solution speciation and carbonate mineral saturation. The simulation was performed using calcite as the only precipitate as it was identified by X-ray diffraction (XRD) as the calcium carbonate polymorph present in the systems. The MINTEQ database was used for all calculations, and the thermodynamic constants for urea (Stokes, 1967) were added (more information is provided in SI1.4 in the Supplement).
2.6 Kinetics of ureolysis and CaCO3 precipitation
The rate coefficient for ureolysis was determined by integrating the following first-order differential equation assuming constant biomass concentrations during the period of urea hydrolysis (Ferris et al., 2004; Mitchell and Ferris, 2005):
to get:
where kurea is the first-order rate coefficient for ureolysis, t is the time and X is the concentration of biomass (Sect. SI2.1 in the Supplement). First-order relationships have been successfully used to describe microbial ureolysis (Lauchnor et al., 2015; Connolly et al., 2015). Indeed, while the Michaelis–Menten model has been used when evaluating ureolysis, studies of ureolysis-based carbonate precipitation have demonstrated that the first-order ureolysis rate model fits well for urea concentrations of 330 mM or below (Lauchnor et al., 2015; Connolly et al., 2015), which is the concentration range used in this study.
The change in urea concentration was determined according to Eqs. (3) and (4) (Eq. 11).
Biomass-normalized ureolysis rates were calculated. Firstly, it was assumed that biomass (X) is constant in Eqs. (10) and (11), as performed in other studies of ureolysis kinetics (Cuthbert et al., 2012; Ferris et al., 2004; Mitchell and Ferris, 2005, 2006; Schultz et al., 2011; Tobler et al., 2011). Secondly, the obtained first-order rate coefficients with respect to urea concentration (kurea) were normalized to the biomass concentration by dividing the ureolysis rate coefficient by the biomass at the onset of precipitation (i.e., urea hydrolysis rates were normalized to the initial biomass concentration, determined as either OD600 or CFU mL−1; Supplement Sect. 2.2), which was equivalent to the initial biomass in each system (X=X0). This is an appropriate choice of model, since the biomass analysis indicated that the cell density was constant for the duration of CaCO3 precipitation and was equivalent to the initial biomass in the systems, as presented in the results section. The biomass-normalized ureolysis rates were compared to other parameters previously published (Ferris et al., 2004; Fujita et al., 2000; Stocks-Fischer et al., 1999; Tobler et al., 2011). The media used in the different studies were similar to those used in this study, all with 25 mM of Ca2+, 333 mM urea and including nutrient-broth-based growth media, apart from (i) Ferris et al. (2004), who used a dilute artificial groundwater (nongrowth medium) with Ca2+ and urea concentrations of 1.75 and 6 mM, respectively, and (ii) Tobler et al. (2011), who used different Ca2+ concentrations varying from 50 to 500 mM and urea concentrations between 250 and 500 mM.
The precipitation of CaCO3 from the system is dependent on the saturation state of the system, as well as the growth mechanism of CaCO3 (Ferris et al., 2004; Mitchell and Ferris, 2005; Teng et al., 2000). The literature is ambiguous on defining a set rate expression for CaCO3 precipitation, so a non-affinity-based first-order rate law was applied to these studies for both its simplicity and the fact that it seems to describe the data well, assuming that for every mole of Ca2+ removed from the solution 1 mol of CaCO3 formed (Teng et al., 2000):
Integration of the above equation yields
where kprecip is the first-order rate coefficient for CaCO3 precipitation. Rate constants were found using a nonlinear regression method utilizing the Solver function in Microsoft Excel. Due to the significant lag phase, the data used for analysis excluded onset time before ureolysis and CaCO3 precipitation occurred, as previously documented (Tobler et al., 2011).
3.1 Aerobic experiments
3.1.1 Solution chemistry
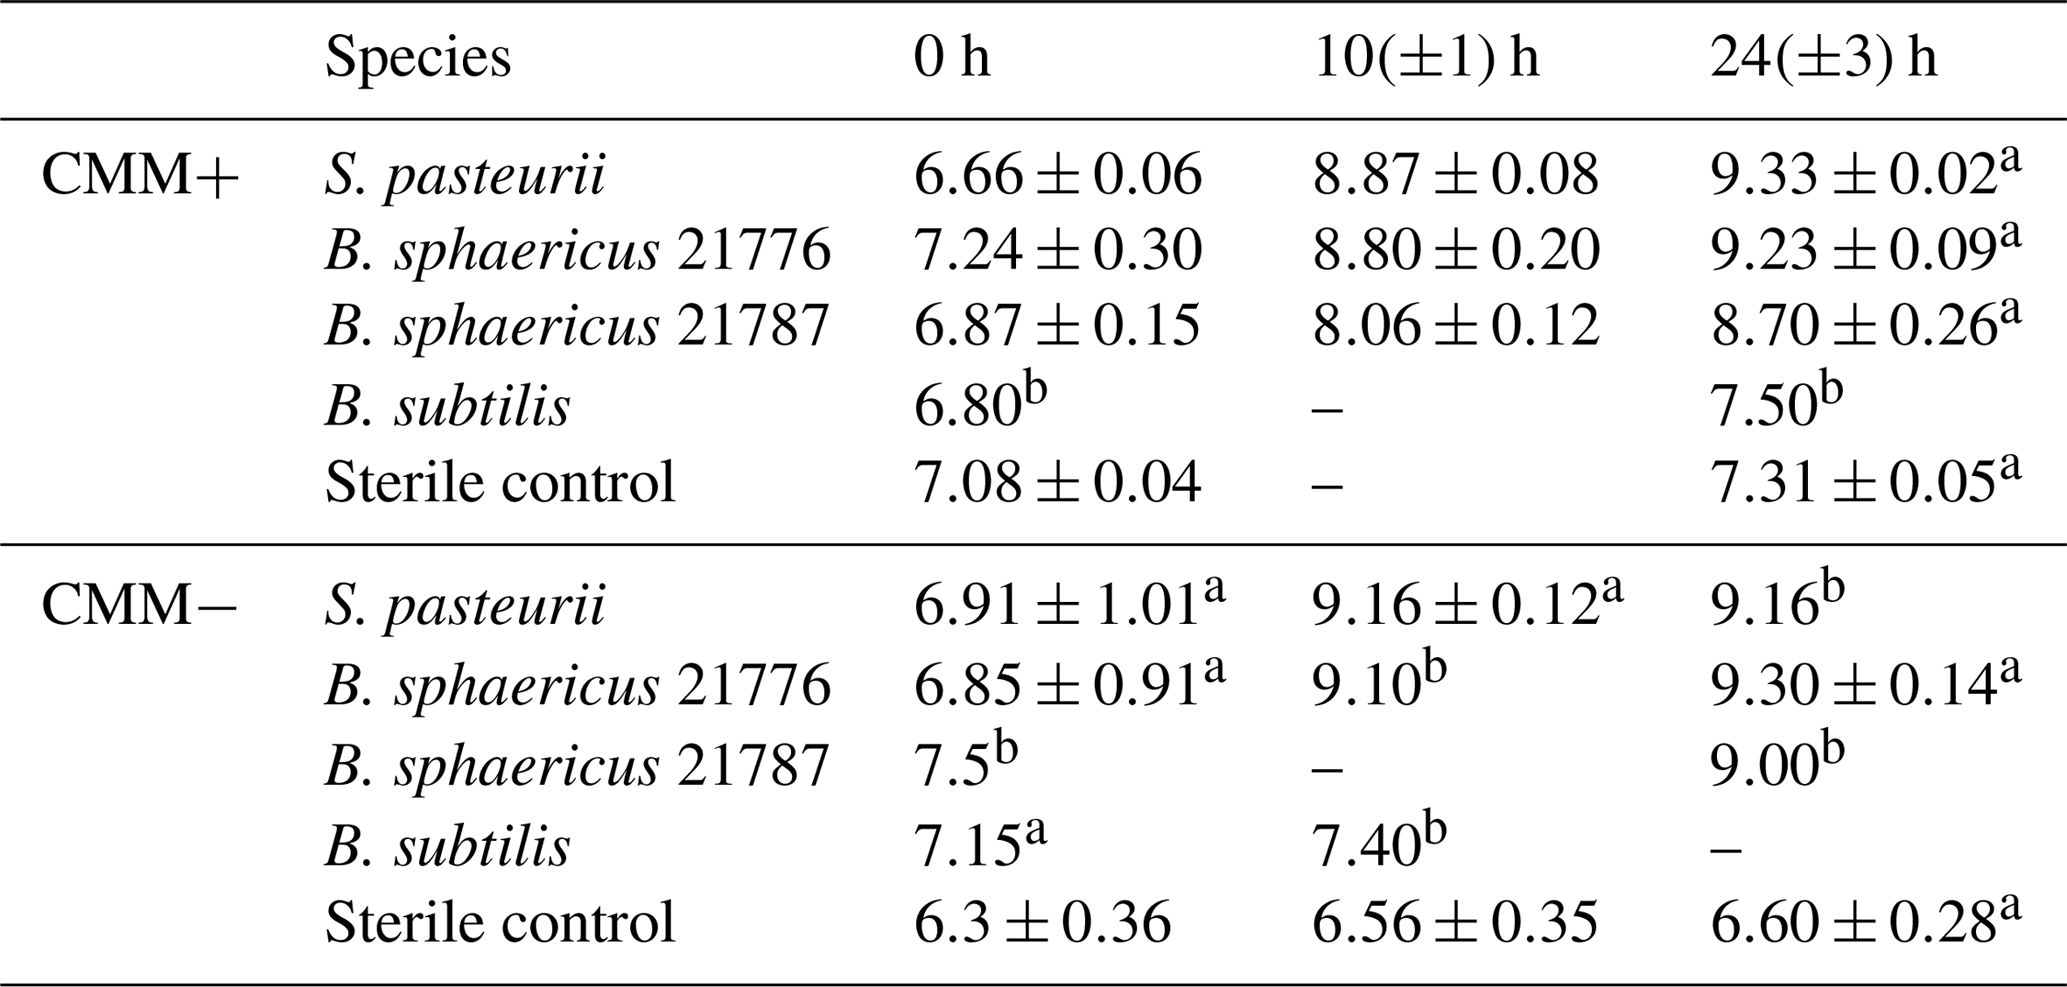
Aerobic experiments with a CMM+ medium inoculated with S. pasteurii, B. sphaericus 21776 and B. sphaericus 21787 showed an increase in pH (Table 1) and (displayed as a stoichiometrically equivalent decrease in urea concentrations; see Fig. 1) over time. These results support observations from previous studies confirming the ureolytic capabilities of S. pasteurii (Ferris et al., 2004; Fujita et al., 2000; Warren et al., 2001) and B. sphaericus species (Dick et al., 2006; Hammes et al., 2003a). Differences in the rate of pH change and the amount of urea hydrolyzed between the different bacterial species suggest differences in their ureolytic activity. After 30 h, 58 %–82 % and 72 %–80 % of the available urea was hydrolyzed by S. pasteurii and B. sphaericus 21776, respectively. B. sphaericus 21787 exhibited little utilization of urea (12 %–15 % hydrolyzed) accompanied by a smaller increase in pH values (∼ pH 8.7 by 24±3 h) compared to the other bacterial strains: ∼ pH 9.3 by 24±3 h, consistent with buffering by , which has a pKa value of 9.3 at 30 ∘C (Mitchell and Ferris, 2005). Control experiments, inoculated with the non-ureolytic organism B. subtilis and sterile controls, did not exhibit significant changes in pH or urea concentrations (Table 1, Fig. 1). Geochemical modeling suggested that no CaCO3 precipitation should occur in the absence of ureolysis and that approximately 0.45 mM of urea would have had to be hydrolyzed to achieve supersaturation and for CaCO3 precipitation to commence (see Supplement Sect. SI1.4).
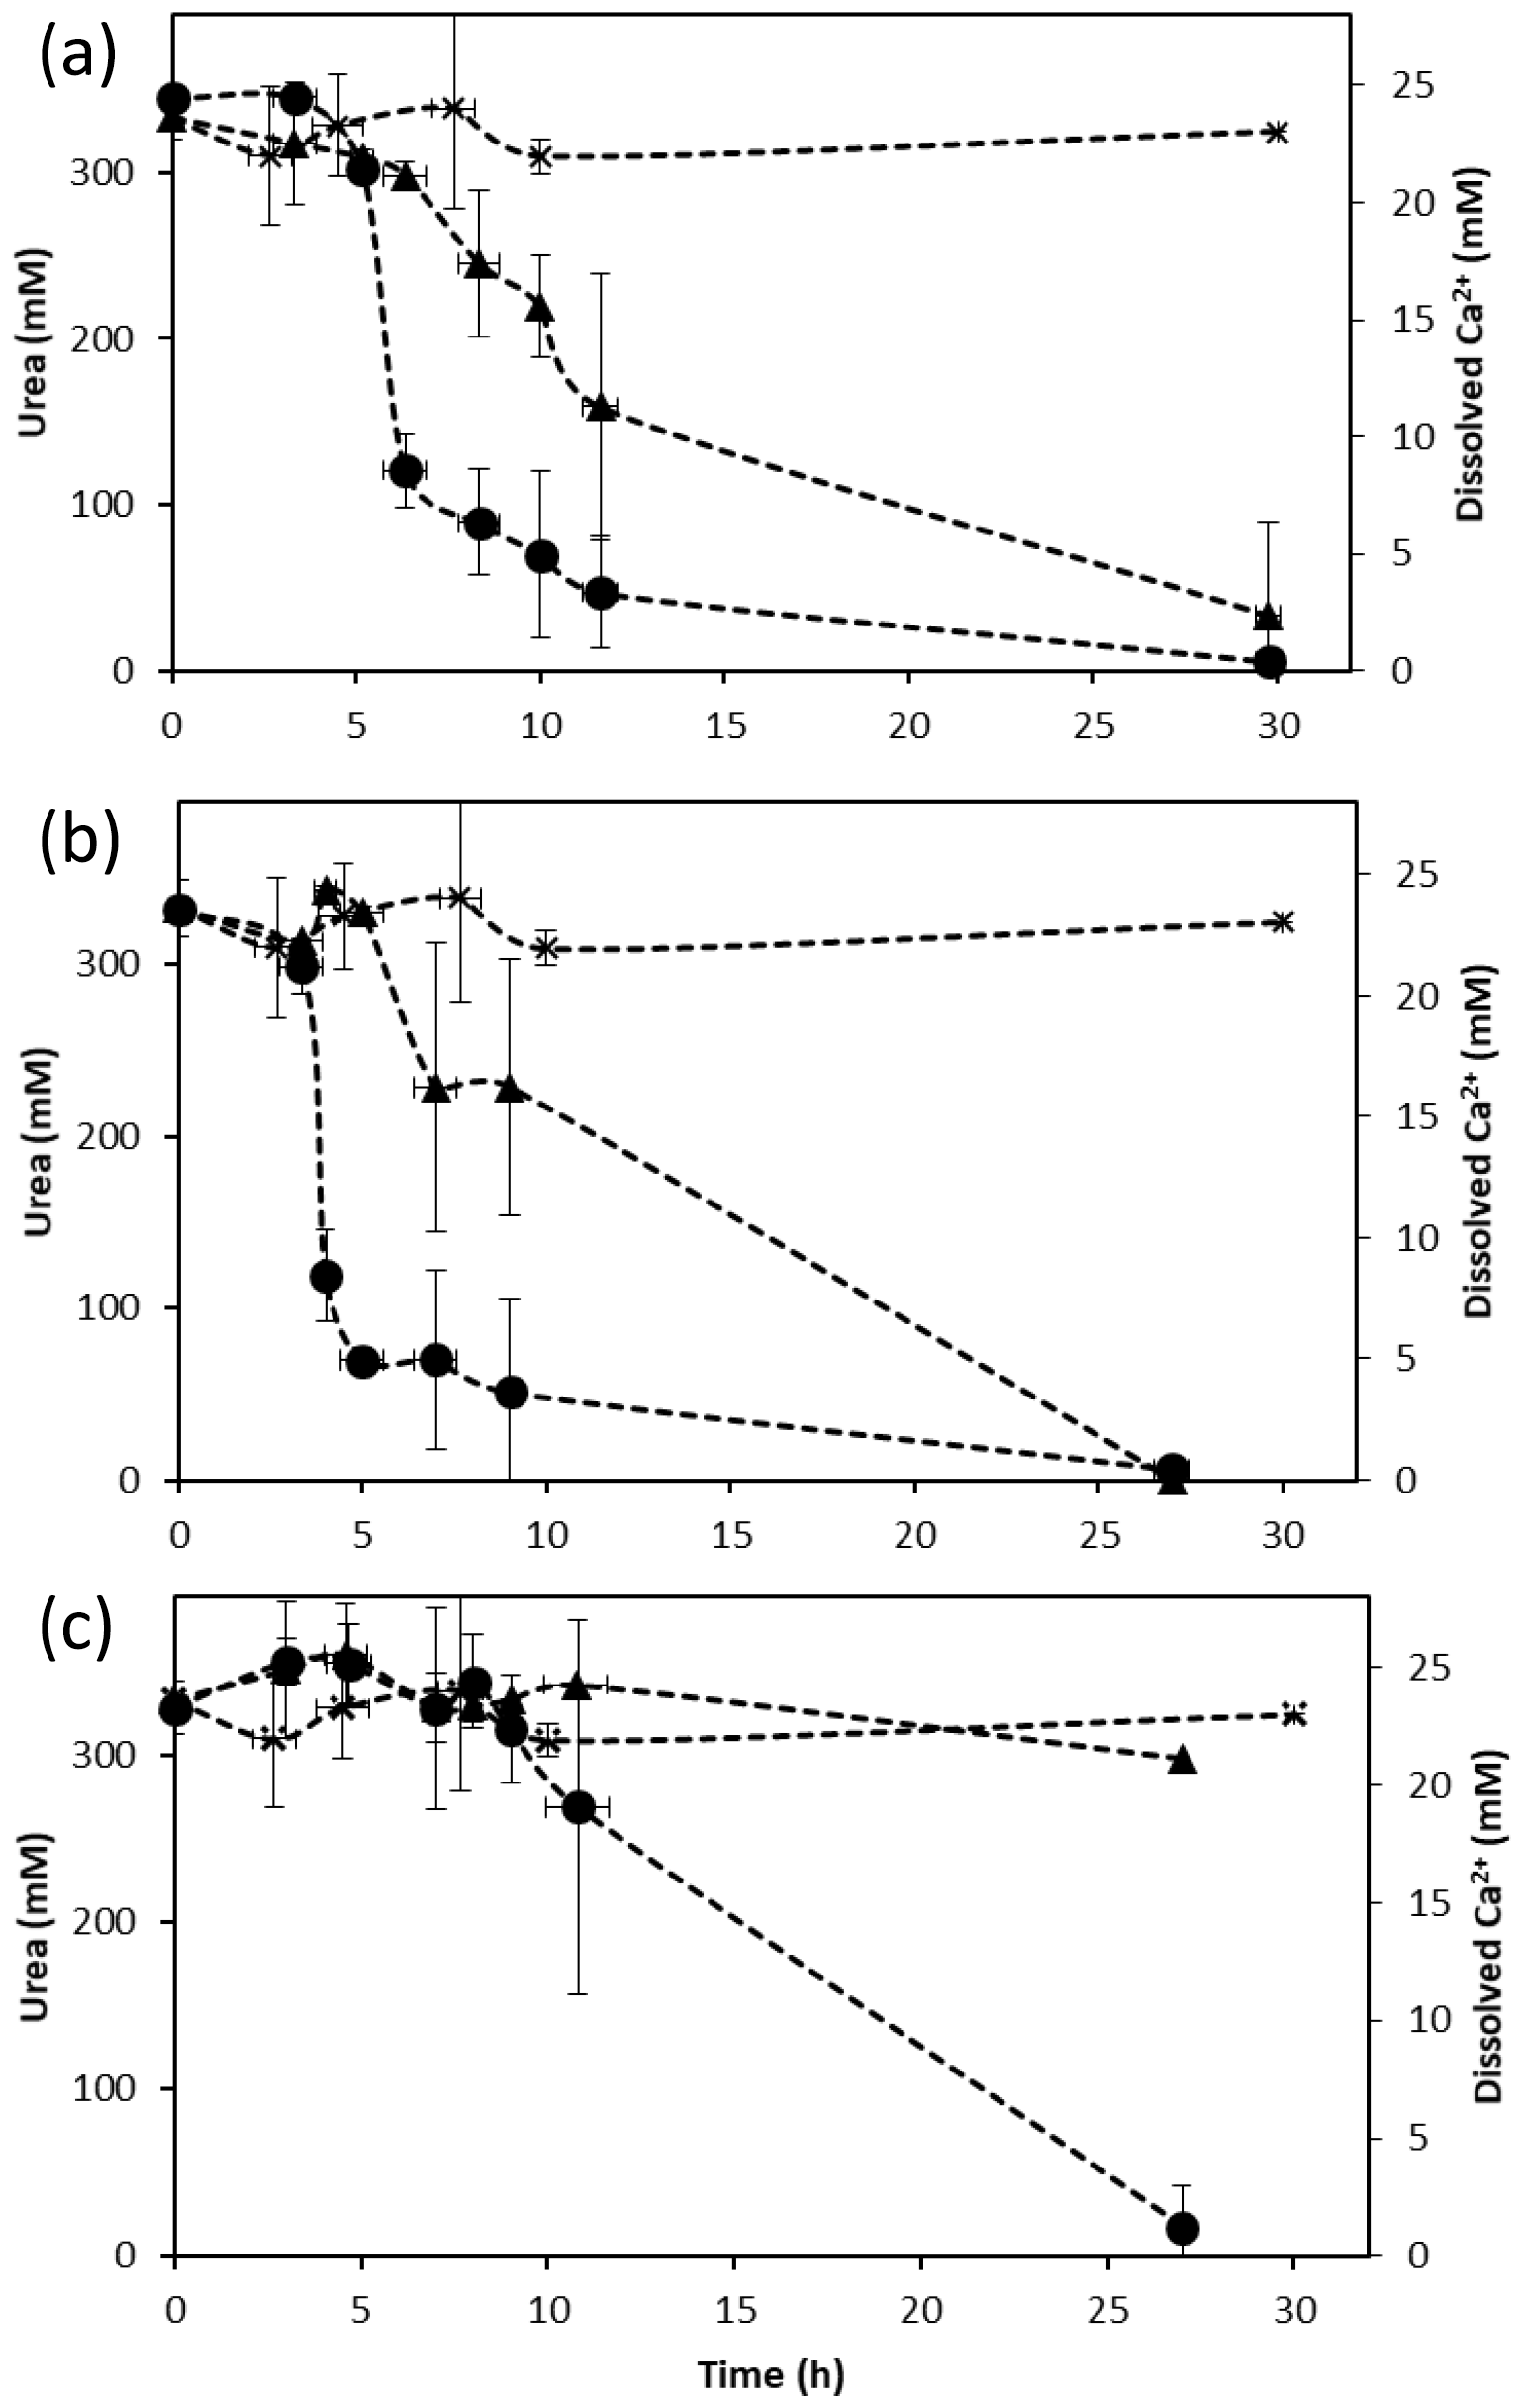
Figure 1Changes in urea (triangle) and dissolved calcium (circle) concentrations during ureolysis over time in calcium-inclusive aerobic experiments for (a) S. pasteurii, (b) B. sphaericus 21776 and (c) B. sphaericus 21787. Urea concentrations for abiotic control experiments (x) are also shown. Data points are the averages of triplicate experiments; vertical error bars represent the standard deviations; horizontal error bars indicate standard deviation of the sampling times; error bars are smaller than markers if not visible.
Table 1Change in pH in aerobic calcium-inclusive (CMM+) and calcium-exclusive experiments (CMM−). Results are averages from triplicate experiments unless stated otherwise. Data for hour 0 were taken immediately after inoculation.
a Data taken from only two experiments. bData taken from only one experiment. – No data available.
In all the experiments containing ureolytic bacteria, Ca2+ concentration decreased to ∼5 % of the initial Ca2+ concentration in the liquid medium after approximately 30 h (Fig. 1). The decrease in Ca2+ concentrations suggests the precipitation of CaCO3, which was identified by XRD as the polymorph calcite. The onset of CaCO3 precipitation occurred shortly after the start of the experiment (∼3–4 h) in the S. pasteurii and B. sphaericus 21776 experiments, whereas the onset of precipitation was delayed (∼9 h) for B. sphaericus 21787. This supports differences in the rate of urea hydrolysis and thus the time at which CaCO3 saturation was exceeded (Eqs. 2, 4, 5 and 7). Differences in ureolysis and CaCO3 precipitation rates can be attributed to differences in the specific ureolytic activities of the organisms or the number of ureolytically active cells (Anbu et al., 2016; Hammes et al., 2003a). B. sphaericus 21776 and S. pasteurii exhibit urease activities approximately twice that of B. sphaericus 21787 when Ca2+ is present (Hammes et al., 2003a), supporting our observations of limited ureolysis and delayed CaCO3 precipitation by B. sphaericus 21787. Nevertheless, the decrease in Ca2+ concentrations in the absence of significant urea hydrolysis for B. sphaericus 21787 suggests there was a sufficient carbonate ion concentration in the CMM+ and from ureolysis to sustain CaCO3 precipitation. Hammes et al. (2003a) observed B. sphaericus 21787 was also able to precipitate CaCO3 despite lower urease activity in the presence of Ca2+, suggesting this strain may enhance precipitation via other mechanisms such as enhanced nucleation on cell surfaces or via organic exudates (Mitchell et al., 2006b).
3.1.2 Aerobic bacterial growth and ureolytic activity
Changes in biomass, measured as protein and colony-forming units (CFUs), were observed during ureolysis in both aerobic CMM+ and CMM− experiments (Fig. 2). CFUs and protein concentrations exhibited similar trends for S. pasteurii and B. sphaericus 21776, where in CMM− experiments CFUs and protein increased over time asymptotically (Fig. 2). In CMM+ experiments, CFUs and protein concentrations seemed to slightly decrease or remain quasi-constant while CaCO3 precipitation occurred (< 10 h), followed by an increase in CFUs and protein once Ca2+ had been depleted (Figs. 1 and 2). Decrease in biomass growth during CaCO3 precipitation has been suggested to occur due to the encasement of bacteria within the CaCO3 precipitates (Tobler et al., 2011). Encasement of S. pasteurii cells in CaCO3 minerals has been reported (Cuthbert et al., 2012; Ebigbo et al., 2012; Schultz et al., 2011; Stocks-Fischer et al., 1999), and cell indentations in CaCO3 precipitates have been observed (Mitchell and Ferris, 2005). The recovery (i.e., regrowth) of biomass after CaCO3 precipitation suggests that ureolysis-induced CaCO3 precipitation does not have to be a lethal event for the population as a whole and that net cell growth can resume after CaCO3 precipitation ceases (Fig. 2). For both B. sphaericus strains, in contrast to S. pasteurii, CFUs were higher in the CMM+ experiments, despite protein concentrations being lower in the CMM+ experiments. This might suggest that cell mortality of B. sphaericus strains is increased in the calcium-free experiments, which may reflect lower tolerance to the higher pH values generally observed in the calcium-free experiments (Table 1, Fig. 2).
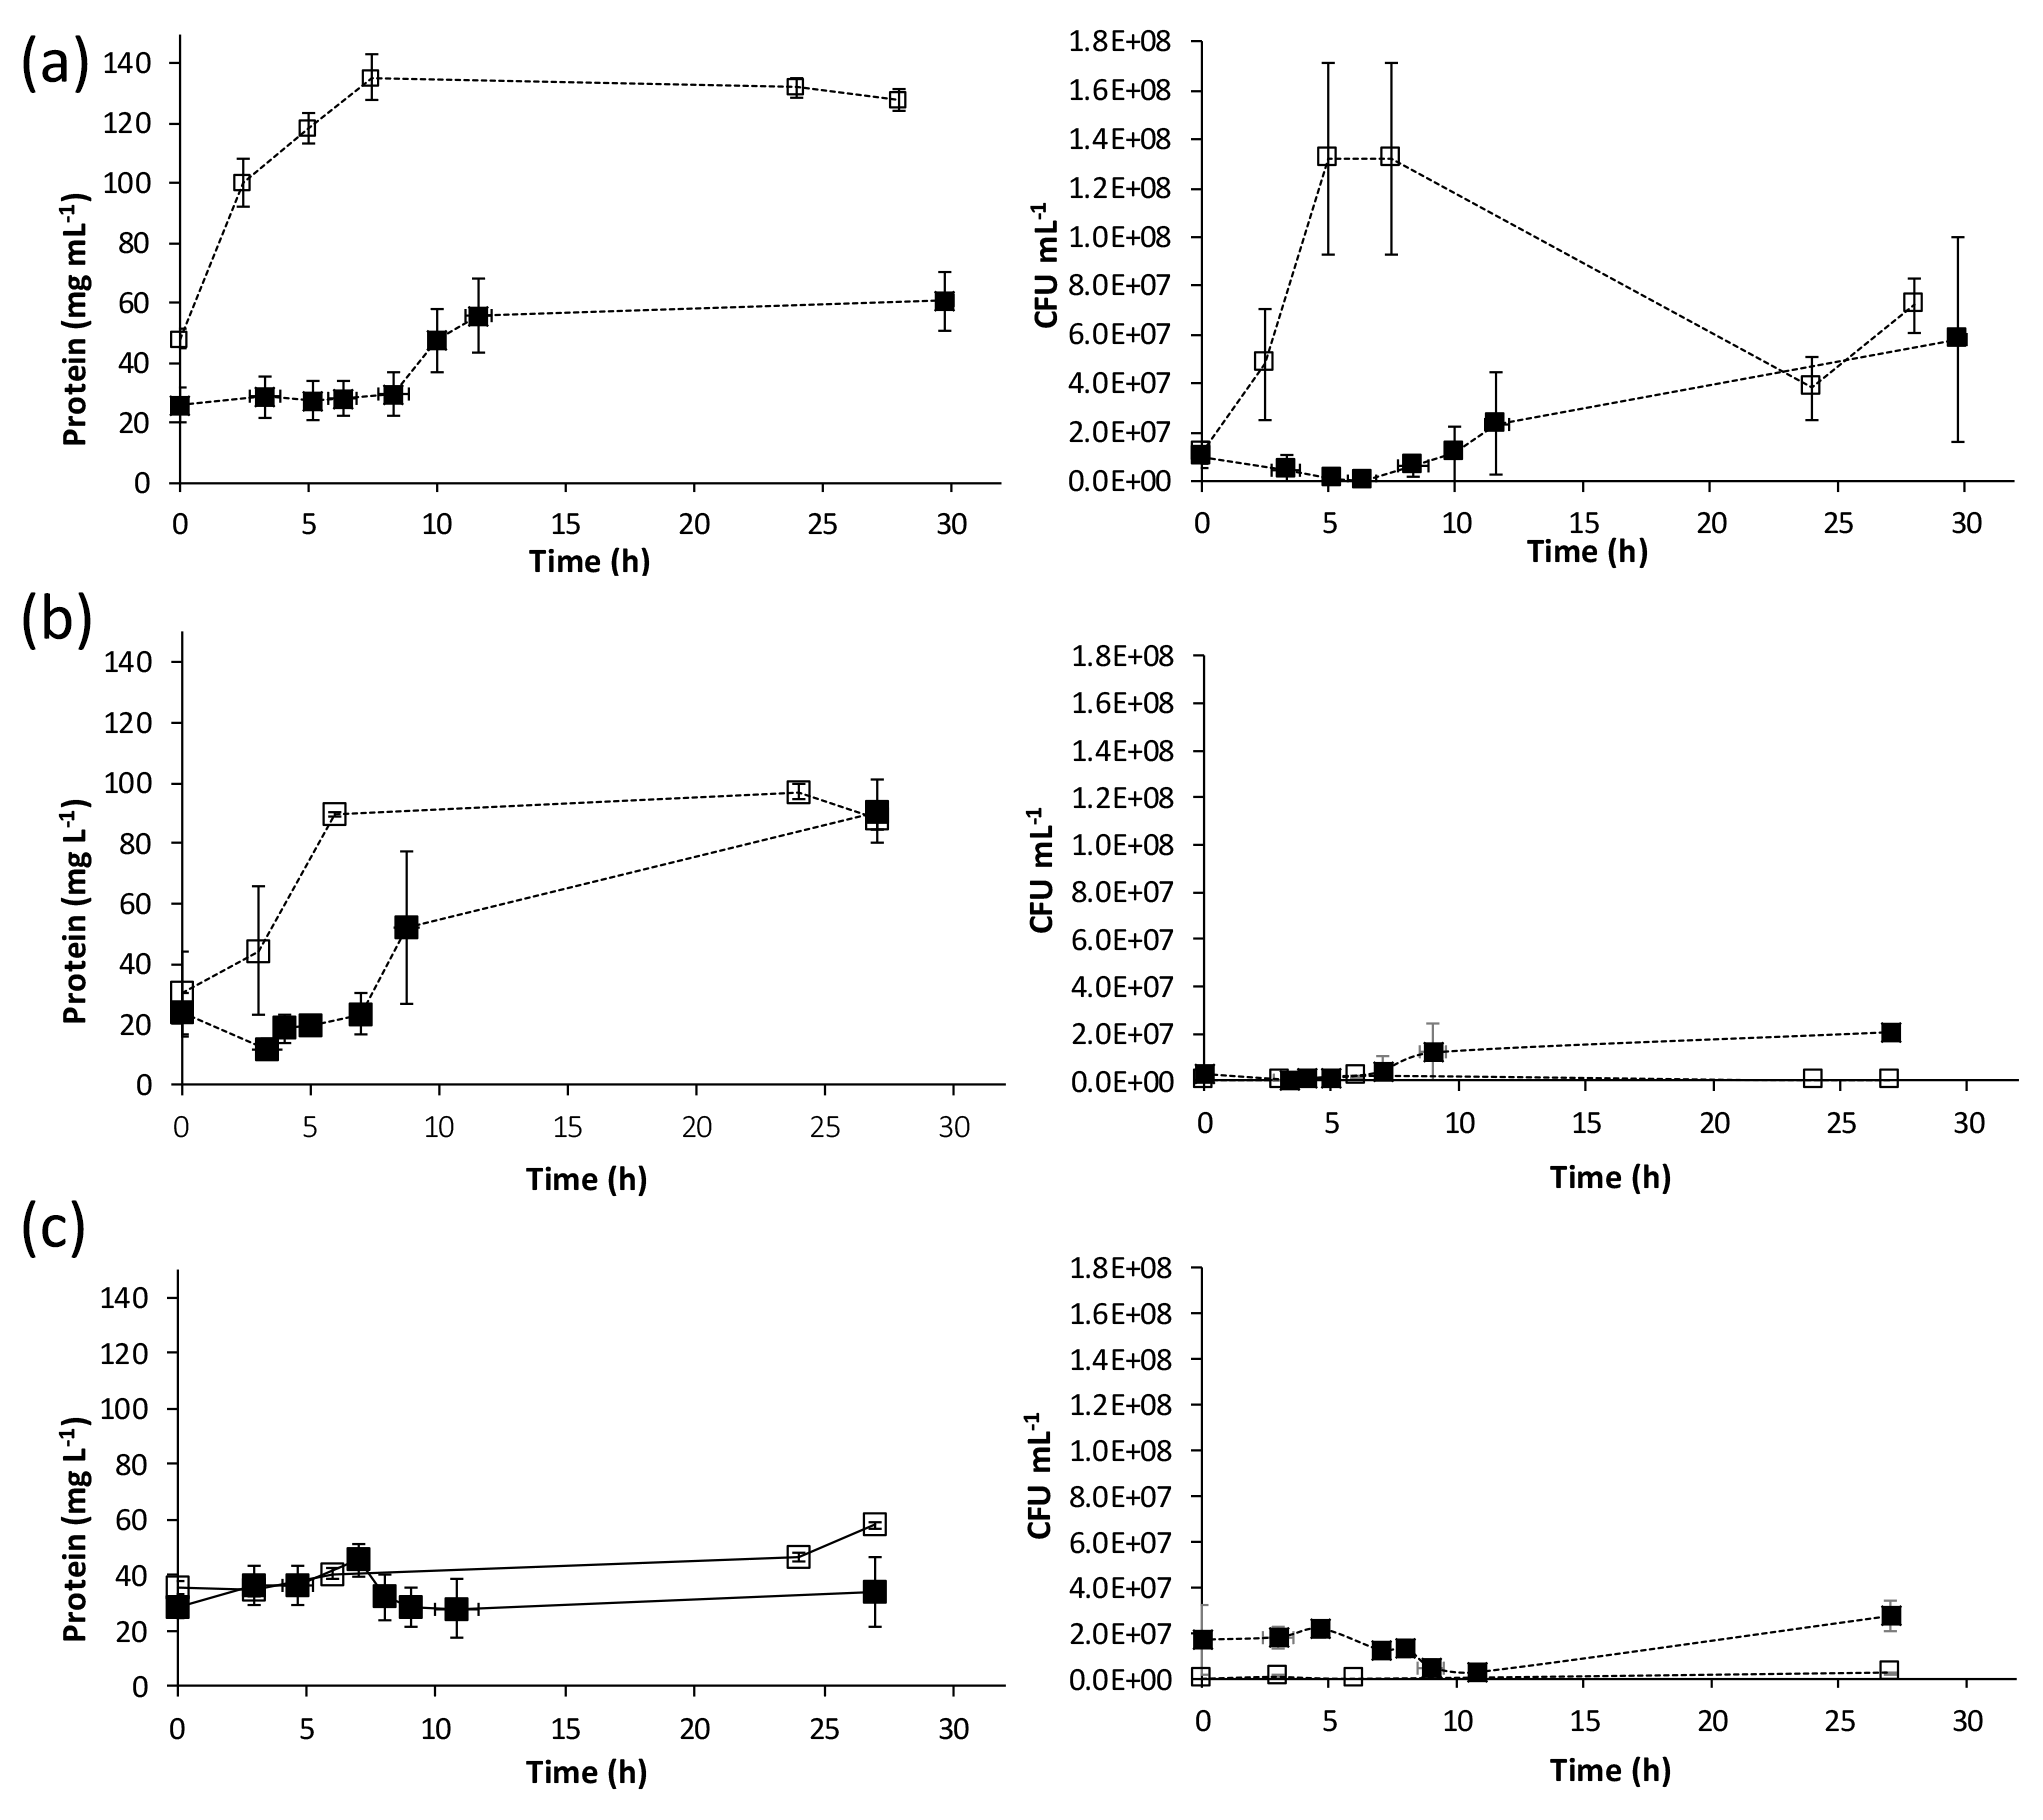
Figure 2Change in protein concentrations and CFU mL−1 over time for calcium-inclusive (solid markers) and calcium-exclusive (open markers). Aerobic media: (a) S. pasteurii, (b) B. sphaericus 21776 and (c) B. sphaericus 21787. Data points are the average of triplicate experiments; vertical error bars represent the standard deviation of triplicate experiments; horizontal error bars indicate standard deviation of the sampling times.
TEM images and electron energy-loss spectroscopy (EELS) of material collected on 0.2 µm pore size filters from the CMM+ S. pasteurii systems (Fig. 3a–c) confirm that some cells are surrounded by a layer of calcium-containing precipitates. Figure 3d shows S. pasteurii grown in CMM− for comparison. The data suggest that cells are removed from suspension and potentially inactivated by CaCO3 encasement, either in large crystals (Mitchell and Ferris, 2005, 2006a) or by a thin coating (Fig. 3a–c).
Quasi-constant biomass concentrations during CaCO3 precipitation (Fig. 2) suggest that cell growth might not have to be considered in kinetic descriptions of bacterially induced CaCO3 precipitation. However, it is unclear whether (i) CaCO3-encased cells are ureolytically active or (ii) CaCO3 precipitates surrounding the cells effectively act as a barrier to urea reaching the cell or to NH3, OH− or formed by the hydrolysis of urea from diffusing through the CaCO3 to the bulk solution. Therefore, a theoretical analysis of urea diffusion in CaCO3 was performed. The diffusion of oxygen in CaCO3 at high temperatures has been documented (Farver, 1994), but, to the best of our knowledge, information on urea diffusion in CaCO3 at 30 ∘C has not been reported. A number of assumptions were made for the estimates in this study: (1) since urea has a lower diffusion coefficient than oxygen in aqueous solutions at 25 ∘C (Stewart, 2003), it was assumed that this will hold true at other temperatures and through other substances, like CaCO3; (2) since the diffusion coefficient of oxygen through CaCO3 at 400 ∘C and 100 MPa is m2 s−1 (Farver, 1994), and diffusion coefficients generally increase with increasing temperature and pressure, it can be assumed that the diffusion coefficient of urea in CaCO3 at atmospheric pressure and 30 ∘C is smaller than m2 s−1; (3) assuming that the geometry of the CaCO3 is a uniformly thick slab with a thickness of approximately 200 nm, as determined from the TEM images (Fig. 3b), the time it will take to reach 5 % of the bulk urea concentration can be calculated using the relation presented by Carslaw and Jaeger (1959):
where L is the slab thickness, De is the (estimated) effective diffusion coefficient in CaCO3 and t5 is the amount of time it will take to reach 5 % of the bulk concentration. Using the above assumptions, it would take at least 175 d for 5 % of the urea to diffuse through the CaCO3 surrounding the cells. Because CaCO3 precipitation takes place over the course of approximately 1 d, it can safely be assumed that even if the encased cells are still alive, urea is not able to diffuse through the CaCO3 fast enough for them to hydrolyze significant amounts and contribute to the increase in solution alkalinity. Therefore, it is argued that, at least in the systems described here, cell growth does not have to be considered in kinetic expressions describing ureolysis during CaCO3 precipitation. Instead, the biomass at the onset of precipitation, which is equivalent to the initial biomass in the system (Fig. 2), can be used to normalize the observed ureolysis rates to biomass concentration.
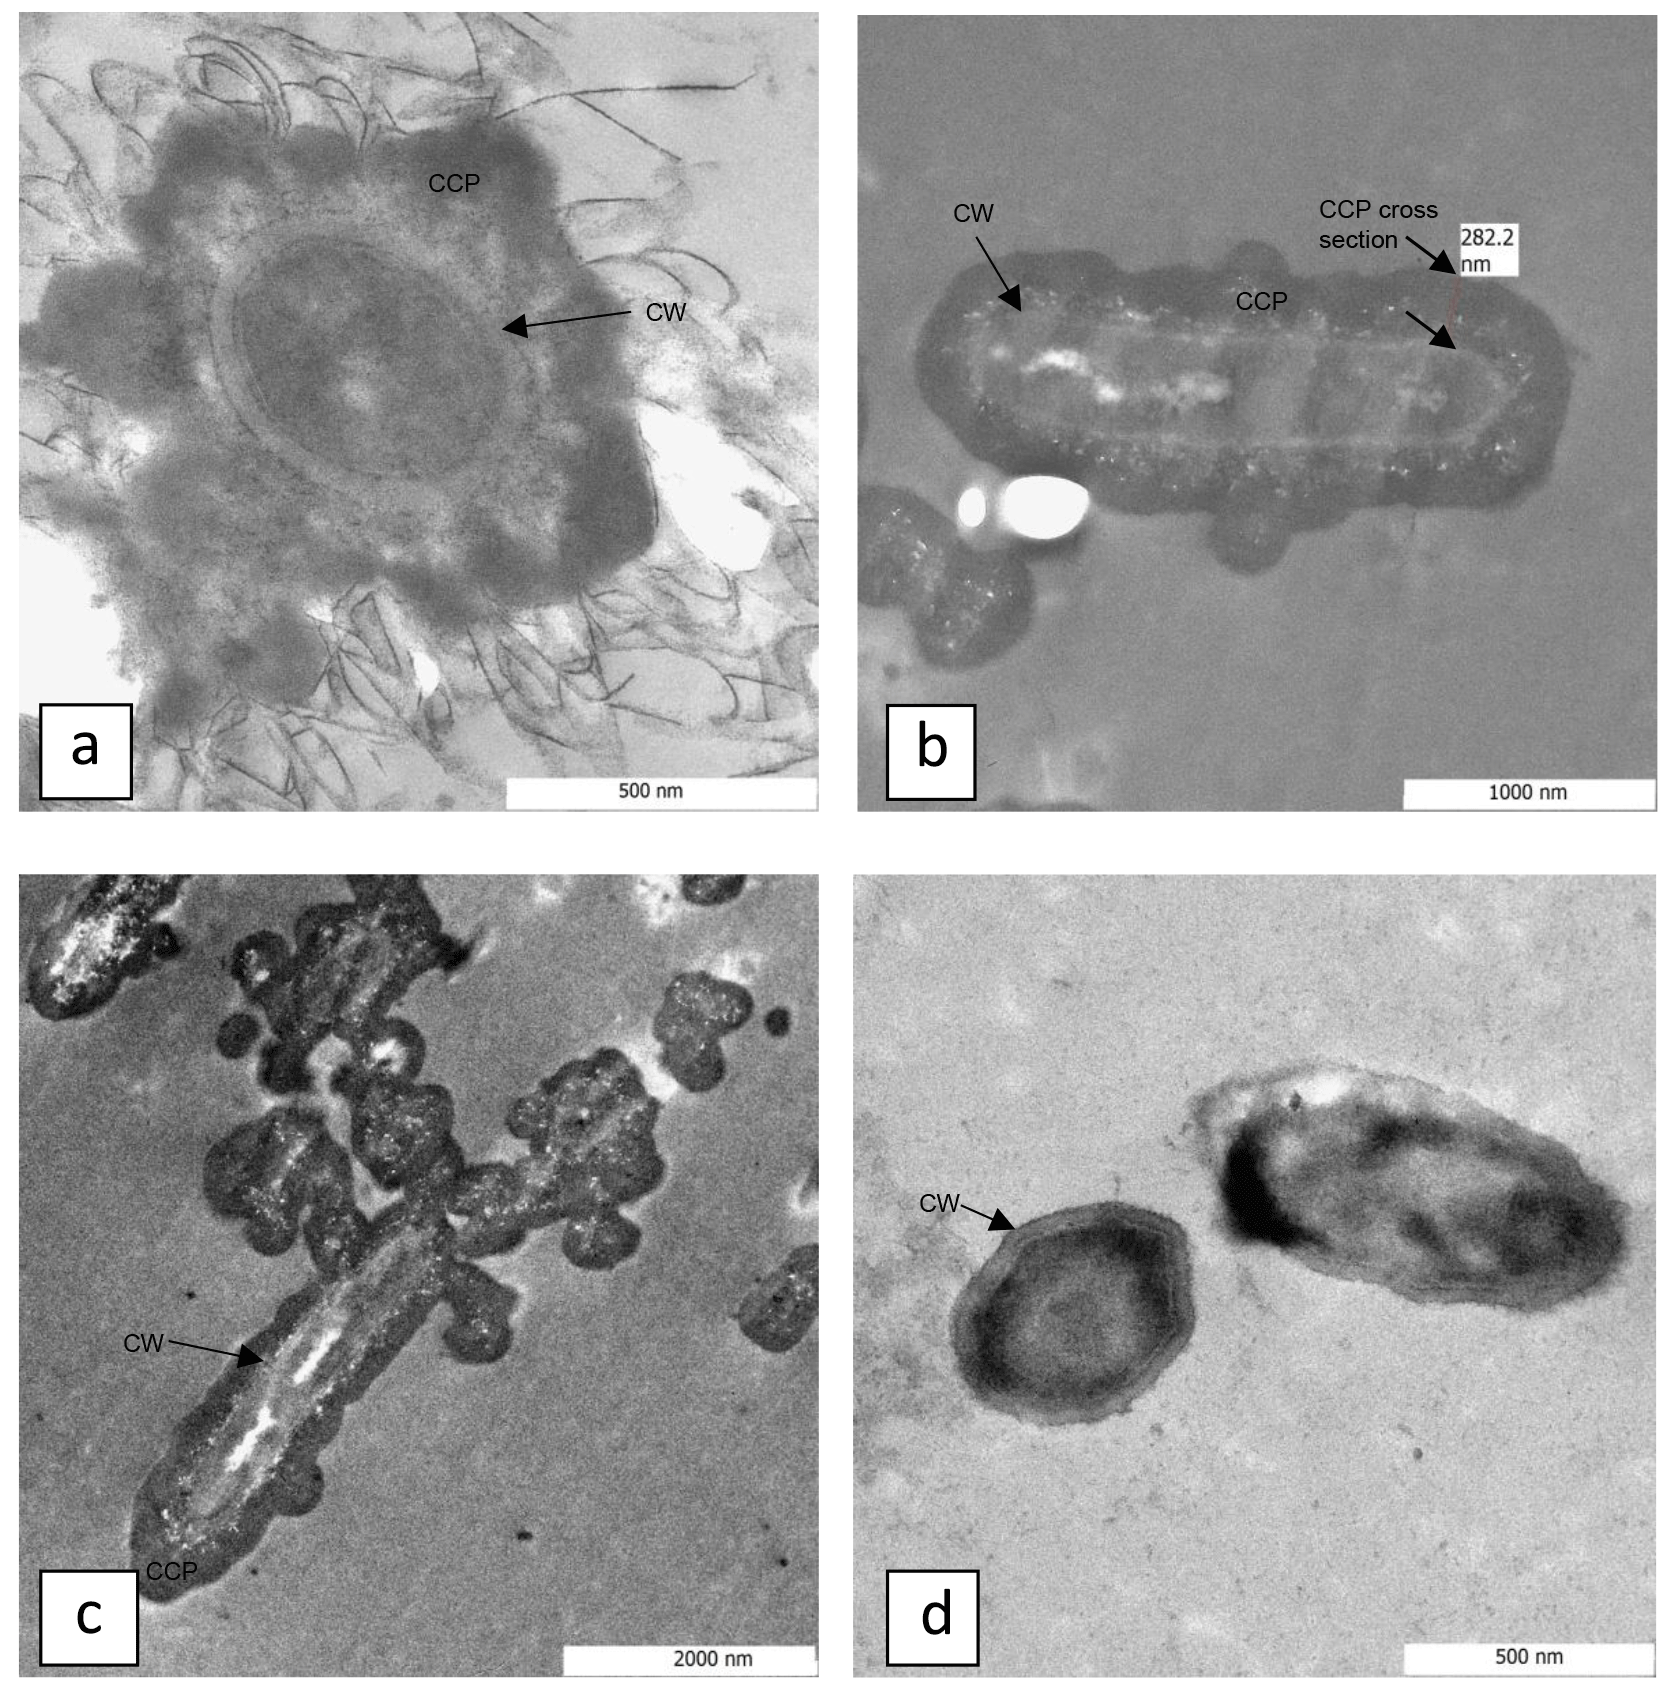
Figure 3Transmission electron microscopy images of S. pasteurii cells in calcium-inclusive (a–c) and calcium-exclusive (d) media with cell walls (CWs) and calcium-containing precipitate (CCP) labeled. Panels (a) and (d) show end cross sections though S. pasteurii cells, with CWs clearly exhibited. A calcium-containing precipitate coverage that encapsulates the cells is exhibited as darker regions beyond the cell wall in (a)–(c). The labeled CCP cross section is measured in (b) and is approximately 280 nm thick.
While a physical association between cells and CaCO3 precipitates is evident, precipitation is likely to occur from a combination of (i) homogeneous nucleation in the bulk solution in alkaline microenvironments around bacterial cells (Schultze-Lam et al., 1996; Stocks-Fischer et al., 1999), and (ii) heterogeneous nucleation on nascent crystals, bottle walls and the bacterial cell surfaces (Rodriguez-Navarro et al., 2012).
3.1.3 Kinetics of ureolysis and CaCO3 precipitation
Kinetic analyses were performed on the individual CMM+ and CMM− experimental data for all bacterial strains (Fig. SI2.1 in the Supplement). A summary of the parameters estimated is shown in Table 2 (for detailed results on individual experiments see Table SI2.1 in the Supplement). kurea values for the bacterial species varied according to the presence (CMM+) or absence (CMM−) of Ca2+ in the medium. S. pasteurii and B. sphaericus 21776 exhibited statistically insignificant differences in kurea values (t test p value = 0.27) from each other in both CMM− and CMM+ systems with kurea values being between 1.6 and 2.5 times higher in the absence of Ca2+ (S. pasteurii: h−1, h−1; B. sphaericus 21776: h−1, h−1). This is likely due to the encasement of cells by CaCO3 and their inactivation in CMM+ experiments. Some data points were excluded for S. pasteurii CMM− kurea calculations because of an estimated increase in urea concentration (based on a decrease in concentration) likely due to significant volatilization of that can occur at pH > 9 (at 34 h; open marker, Fig. SI2.1b). B. sphaericus 21787 exhibited low kurea values in both CMM+ (kurea=0.02 h−1) and CMM− (kurea=0.05 h−1). From triplicate experiments, only one experiment showed values that could be used for kinetic analysis (Fig. S2.1), and some outlying data points were not used for the kinetic calculations; hence, no standard deviations can be provided (Table 2). Thus, rate coefficients obtained for B. sphaericus 21787 are not statistically valid but were estimated for the purpose of comparison to the other studied bacterial strains. B. sphaericus 21787 has been shown to have urease activity about half that of S. pasteurii and B. sphaericus 21776 in the presence of Ca2+, which could explain the low kurea values. However, in the absence of Ca2+, urease activity for B. sphaericus 21787 is about twice that of B. sphaericus 21776 (Hammes et al., 2003a) that does not support our experimental results. This suggests while B. sphaericus 21787 has high potential, they generate comparable rates of urea hydrolysis to the other strains under the experimental conditions used in this study B. sphaericus 21787 exhibits limited ureolytic capabilities.
Table 2Summary of kinetic parameters for urea hydrolysis (kurea) and calcite precipitation (kprecip) in aerobic and anaerobic experiments in calcium-inclusive (CMM+) and calcium-exclusive (CMM−) experiments inoculated with S. pasteurii, B. sphaericus 21776 and B. sphaericus 21787. Anaerobic experiments were incubated with or without nitrate as the terminal electron acceptor (TEA). Results are averages from triplicate experiments unless stated otherwise.
a One experiment used in analysis. b Two experiments used for kinetic analysis. n/a = No data available.
A lag time of 3–5 h before the onset of ureolysis was detectable for all bacterial strains, which was slightly longer for CMM+ experiments (CMM+ = 5 and 4 h; CMM− = 4 h and 3.5 for S. pasteurii and B. sphaericus 21776, respectively). Connolly et al. (2013) observed longer lag times to the onset of ureolysis of ∼15 h for S. pasteurii, ∼6 h for Pseudomonas aeruginosa MJK1 and ∼4 h for Escherichia coli MJK2 when cultivated with 0.16 mM urea in similarly composed CMM−, likely reflecting the lower urea concentrations used that would limit reactant supply to urease and increase the time before urea hydrolysis was detectable. In the present study, kurea values normalized to the initial biomass concentration were higher for B. sphaericus 21776 than S. pasteurii (Table 2) but differences were not statistically significant, suggesting similar cell specific urease activity between the strains. The standard deviations of kurea, initial biomass and lag time were small between replicate experiments with S. pasteurii and B. sphaericus 21776, and R2 values for the fit to Eq. (10) were greater than 0.9 (Table SI2.1).
The kinetic parameters obtained in this study were compared to other parameters previously published (Tobler et al., 2011; Ferris et al., 2004; Fujita et al., 2000; Stocks-Fischer et al., 1999). kurea values of S. pasteurii obtained in this study as well as in previous publications were standardized to the initial cell concentrations (Table 3). Values of kurea were higher in the present study for both S. pasteurii and B. sphaericus 21776 (kurea=0.07 and 0.11 h−1, respectively) than those from S. pasteurii in other studies (kurea=0.005 to 0.095 h−1). This was also apparent once normalized to biomass (this study, B. sphaericus 21776 kurea=8.02 OD h−1 and S. pasteurii 5.251 OD h−1, compared to kurea=0.11 to 2.80 OD h−1 in previous studies). The generally higher kurea values in this study appear to reflect the higher temperature (30 ∘C) used compared to the previous studies, which ranged from 20 to 25 ∘C. Higher temperatures generally increase reaction rates where chemical reactions are advanced through a transient activated complex (Stumm and Morgan, 1996). In urease, the transitional state involves coordination of urea and water at the active catalytic site of the enzyme (Jabri et al., 1995). Formation of such an activated complex tends to impart a greater temperature dependency on the absolute reaction rate than would be encountered if the reactions were mediated solely by collisions arising from molecular diffusion (Ferris et al., 2004; Mitchell and Ferris, 2005).
Table 3Summary of kinetic coefficients and initial growth conditions for aerobic calcium-inclusive experiments performed in this study and previous studies.
a Rate coefficients obtained for this strain are not conclusive and should be taken only as a guide for comparison purposes in this study. b OD600 values were converted to a 1 cm path length equivalent where necessary. – No reported values.
The biomass concentration-normalized kurea values from Fujita et al. (2000) are much lower. This could be due to the highest biomass concentrations (OD600=0.072) used in these studies; very high biomass concentrations could shift the primary kinetic dependency from being catalysts (i.e., enzyme-limited) to substrate-limited. However, this appears to be opposite to what Tobler et al. (2011) reported indicating kurea increased with increasing inoculum density. The rate constants obtained with the three organisms used in the present study are similar to the range of values measured in deeper vadose zone mineral subsoils which were between 0.00375 to 0.07 h−1 (Swensen and Bakken, 1998), suggesting natural levels of ureolytic bacterial activity were reasonably approximated in the aerobic experiments.
On average, B. sphaericus 21776 had the highest kprecip (0.60±0.34 h−1), although considering its high standard deviation, kprecip for S. pasteurii is not significantly different ( h−1; t test p value 0.21). R2 values of the fit to Eq. (12) were relatively high (0.84–0.93) for B. sphaericus 21776 and S. pasteurii (Table 2). The kprecip for B. sphaericus 21787 was lower than the other strains (0.21 h−1); although, as noted, rate constants for this strain are not statistically significant. The lag time for CaCO3 precipitation was 3.3 h for B. sphaericus 21776 and S. pasteurii, which reflects the similar kurea values, and thus the similar time it took to reach CaCO3 saturation and induce precipitation, whereas the longer lag time for B. sphaericus 21776 reflects the significantly lower kurea value. Tobler et al. (2011) observed similar lag times until CaCO3 precipitation (2–3 h) in aerobic experiments (artificial groundwater with no nutrients added, 250–500 mM urea and 50–500 mM Ca) with S. pasteurii, as observed here for B. sphaericus 21776 and S. pasteurii. First-order rate constants for CaCO3 precipitation observed here for B. sphaericus 21776 and S. pasteurii were also higher (0.21 h−1 < kprecip < 0.60 h−1) compared to other studies (0.01 h−1 < kprecip < 0.11 h−1) (Table 3). This is likely associated with the greater kurea values observed in this study than in previous studies. Temperature is unlikely to account for this variation given the modest decrease in calcite solubility (∼27 %) that occurs between 20 and 30 ∘C (Miller, 1952; Stumm and Morgan, 1996). Overall, kurea values are lower than kprecip values in this and previous studies, with the exception of Ferris et al. (2004), indicating urea hydrolysis is the rate limiting step during ureolysis-induced CaCO3 precipitation and that CaCO3 precipitation rates are rapid and controlled by the rate of urea hydrolysis, once the critical supersaturation is exceeded (Mitchell and Ferris, 2005).
3.2 Anaerobic experiments
3.2.1 Anaerobic ureolysis and bacterial growth
Given the potential for anaerobic conditions in subsurface environments, screening experiments were performed to assess the capability of S. pasteurii to grow and/or increase pH in CMM− in the presence of , and Fe3+ as potential TEAs. There are contradicting reports in the literature regarding S. pasteurii's ability to grow and hydrolyze urea in the absence of oxygen; some studies suggest that the anoxic environment does not hinder urease activity (Mortensen et al., 2011; Tobler et al., 2011), whereas other studies report limited microbial growth and poor ureolysis (Martin et al., 2012).
In this study, pH increased (pH > 9.0) in all experiments with and without potential TEAs added (Fig. 4), suggesting ureolysis by S. pasteurii took place in the absence of oxygen. The pH of the abiotic controls did not exceed pH 7, except for the medium containing as the added TEA, which had an initial pH of 7.7 and remained constant throughout the experiments (Fig. 4c). Growth in the CMM− anaerobic experiments quantified by OD600 absorbance was lower than that observed in aerobic experiments regardless of the presence or absence of TEAs (Fig. 4). Although some growth might have occurred during the initial period of the experiments (increased absorbance by ∼20 h), the lack of sustained growth over time suggests the inability of S. pasteurii to grow under anaerobic conditions. These findings are in agreement with those by Martin et al. (2012), who observed limited cell growth in the absence of oxygen. In the present study, once oxygen was allowed to diffuse into the systems (at 120 h), optical density in all inoculated systems increased, indicating that even though no significant growth was observed in the absence of oxygen, the bacteria were still viable after 120 h of oxygen depletion and can be resuscitated.
Figure 4Changes in pH and OD600 over time in anaerobic (square) and aerobic (circle) calcium-exclusive medium for S. pasteurii with (a) , (b) Fe3+ and (c) as terminal electron acceptors (TEAs); experiments without added TEAs are shown in (d). Abiotic controls (triangle) are also shown. Open markers indicate values for time points after the bottles were opened to the environment allowing oxygen to enter the system.
Sustained growth of S. pasteurii in the absence of oxygen does not appear to be feasible which might limit the potential use of S. pasteurii for inducing CaCO3 precipitation in the subsurface to only short-term purposes. However, the potential regrowth of microbes, even after prolonged periods of exposure to oxygen-free conditions, suggests that S. pasteurii could be resuscitated and restimulated through the injection of oxygenated fluids, which could enable bacterial growth and thus ureolytic activity over longer periods of time.
3.2.2 Kinetics of anaerobic ureolysis and CaCO3 precipitation
After the screening experiments with different TEAs, studies were performed to determine the kinetics of ureolysis and CaCO3 precipitation in the absence of oxygen. Since there were similarly low levels of growth in the initial anaerobic screening experiments with different TEAs and no TEA (Fig. 4), kinetic experiments in the absence of oxygen were conducted with no TEA, as well as with as a potential TEA (Fig. 5). Urea was hydrolyzed under all experimental conditions and CaCO3 precipitation was observed in the presence of Ca2+ (Fig. 5). However, ureolysis and CaCO3 precipitation did not occur in all replicates for each experiment, which accounts for the high standard deviations.

Figure 5Changes in urea (triangle markers) and dissolved calcium (circle markers) concentrations over time in anaerobic experiments with S. pasteurii in calcium-inclusive medium with (black solid markers), calcium-exclusive medium with (open markers) and calcium-inclusive medium without added terminal electron acceptor (grey solid markers). Data points are the averages of triplicate experiments; vertical error bars represent the standard deviations of measurements; horizontal error bars indicate standard deviation of the sampling times; error bars are smaller than markers if not visible.
Rate coefficients were estimated as previously described for aerobic experiments (Fig. SI2.2) and a summary of the results is presented in Table 2 (for detailed results for the individual experiments see Table SI2.2). Data points which preceded the onset and completion of ureolysis and calcite precipitation were excluded (Fig. SI2.2) kurea seems to be lowest in CMM+ with ( h−1), followed by CMM− with ( h−1) and CMM+ without TEA (kurea=0.08 h−1). The same relative rates were apparent when kurea values were normalized to biomass (Table 2). The presence of appears to have slightly decreased ureolysis rates. While the reasons for this possible decrease in the ureolytic activity due to the presence of are unclear, it could be perceivable that the ureolytic activity is downregulated in the presence of the alternative nitrogen source . Longer lag times to the onset of ureolysis (ranging from 6.5 to 10 h) were observed in the anaerobic experiments relative to the aerobic ones. Moreover, comparing the experiments containing , the presence of Ca2+ in the medium results in a lower kurea value (Table 2). This could be due to the encasement of cells by CaCO3.
The onset of CaCO3 precipitation occurred after approximately 6 h, which was twice the lag time observed for precipitation under aerobic conditions (Table 2); this was expected, as slower ureolysis was observed in the anaerobic experiments (Table 2). Rate constants (kprecip) for anaerobic CaCO3 precipitation were not statistically different for CMM+ with (0.36 h−1 ± 0.22) and CMM+ without TEA (0.19 h−1 ± 0.05). Tobler et al. (2011) reported a similar kurea value (0.09 h−1) for experiments with S. pasteurii under anoxic conditions in natural groundwater containing comparable concentrations of urea and Ca2+ (250 and 50 mM, respectively); kprecip was not reported due to a poor fit of the data with first-order kinetics. Experiments containing only indigenous bacteria exhibited far lower rates of ureolysis (kurea=0.0016 h−1) and CaCO3 precipitation (kprecip=0.009 h−1) than observed in the present study. Differences in ureolysis and CaCO3 precipitation rates between this study and Tobler et al.'s (2011) study are likely due to the low initial biomass of the indigenous ureolytic population in the natural groundwater.
The comparison of kinetics from aerobic and anaerobic experiments in the present study demonstrates that rates are on the same order of magnitude (Table 2). In CMM+, urea hydrolysis rates for S. pasteurii under aerobic and anaerobic conditions (with or without TEA) were not significantly different (Pvalue=0.274), even when normalized to initial biomass concentrations (OD600 or CFU mL−1). pH increases in these screening experiments suggest anaerobic ureolysis occurred at the same rate as under aerobic conditions (Fig. 4). Similarly, kprecip in aerobic and anaerobic experiments are comparable (0.19 and 0.25 h−1, respectively). This suggests that oxygen-free environments do not significantly impact the rate of ureolysis or CaCO3 precipitation initially but that anaerobic growth cannot be conclusively demonstrated under the conditions of this present study. This supports observations by Tobler et al. (2011), who reported similar rates of ureolysis under both oxic and anoxic conditions when amending natural groundwater with S. pasteurii (kurea0.10 h−1 in oxic conditions, kurea0.097 h−1 in anoxic conditions with 50 mM Ca2+ and 250 mM urea; Table 3). Martin et al. (2012) also observed ureolytic activity by S. pasteurii under anoxic conditions but to a lesser extent compared to the extensive activity reported by Tobler et al. (2011); however, rate constants were not reported. The current study therefore suggests ureolytic activity observed under anoxic conditions corresponds to the urease already present in the cells, as suggested by Martin et al. (2012). S. pasteurii could therefore be used for CaCO3-induced precipitation in the subsurface in the short term, and bacterial growth could be stimulated through multiple injections of bacterial cells or oxygenated medium to re-enable ureolytic activity and thus CaCO3 precipitation. This is supported by our calcite precipitation rate constants under anaerobic conditions, the first to be reported for a ureolytic strain, which are comparable to aerobic rate constants, suggesting anaerobic conditions will not significantly inhibit CaCO3-induced precipitation in the subsurface.
All three ureolytic strains studied, S. pasteurii and B. sphaericus strains 21776 and 21787, were capable of inducing CaCO3 precipitation under aerobic conditions. Data obtained in this study suggest that rates of ureolysis and ureolysis-induced CaCO3 precipitation are affected by differences in the ureolytic species. This information should be considered in subsurface engineering strategies utilizing microbial amendment or stimulation. Specifically, rates of ureolysis and CaCO3 precipitation were highest and comparable for S. pasteurii and B. sphaericus 21776. Although B. sphaericus 21787 showed poor ureolysis, some CaCO3 precipitation was observed, suggesting this strain may enhance precipitation via other mechanisms such as enhanced nucleation on cell surfaces or via organic exudates. When rate coefficients were normalized to cell numbers, B. sphaericus exhibited 21776 higher rates of ureolysis per cell compared to S. pasteurii, but the differences were not statistically significant, suggesting that both of these strains are good candidate species for subsurface augmentation if maximizing rates of ureolysis and precipitation are desirable.
S. pasteurii was capable of ureolysis in anaerobic environments with and without the addition of potential electron acceptors; however, sustained growth of S. pasteurii over time in the absence of oxygen did not appear to be possible. Comparison of kinetics from aerobic and anaerobic experiments demonstrates that rates are on the same order of magnitude, suggesting that oxygen-free environments do not significantly impact the initial rate of ureolysis or CaCO3 precipitation. Apparent rate coefficients for ureolysis were reduced in CMM+ relative to CMM−. The limited increase in cell biomass during the period of CaCO3 precipitation and TEM images reveals that this may be due to the encasement and inactivation of cells. However, populations can recover and regrow once CaCO3 precipitation has ceased. Therefore, ureolysis-induced CaCO3 precipitation is likely to be efficient in aerobic and anaerobic subsurface systems. However, our data and other recent studies under flow conditions demonstrate that if only one injection of microbes is to occur but longer-term ureolysis is desired in subsurface applications, resuscitation and regrowth of microbes, e.g., through the injection of growth media, will be necessary since CaCO3 precipitation greatly inhibits cell growth (Cuthbert et al., 2012; Phillips et al., 2013b).
Raw experimental data is deposited at Dryad repository https://datadryad.org/ (last access: 1 May 2019) at https://doi.org/10.5061/dryad.5r01k2k (Mitchell et al., 2019). Data files: Data Appendix_compiled/.
The supplement related to this article is available online at: https://doi.org/10.5194/bg-16-2147-2019-supplement.
ACM, EJEO, SLP and RG wrote the manuscript. RG, ACM, SLP, AJP and ABC designed experiments. SLP performed experiments.
The authors declare that they have no conflict of interest.
Funding was provided from the US Department of Energy (DOE) Zero Emissions Research Technology Center (ZERT), award no. DE-FC26-04NT42262, DOE EPSCoR award no. DE-FG02-08ER46527, DOE Office of Science, Subsurface Biogeochemical Research (SBR) Program, contract no. DE-FG-02-09ER64758, DOE NETL contract no. DE-FE0004478 and DE-FE0009599, European Union Marie-Curie Reintegration Grant, award no. 277005 (CO2TRAP), National Science Foundation, award no. DMS-0934696, and a Sêr Cymru National Research Network for Low Carbon, Energy and the Environment Grant from the Welsh Government and Higher Education Funding Council for Wales. Support for the Environmental and Biofilm Mass Spectrometry Facility through DURIP, contract no. W911NF0510255 and the MSU Thermal Biology Institute from the NASA Exobiology Program Project NAG5-8807 is acknowledged. TEM images were kindly taken by Susan Brumfield at Montana State University in the Plant Science and Plant Pathology Laboratory.
This paper was edited by Denise Akob and reviewed by two anonymous referees.
Anbu, P., Kang, C.-H., Shin, Y.-J., and So, J.-S.: Formations of calcium carbonate minerals by bacteria and its multiple applications, SpringerPlus, 5, 250, https://doi.org/10.1186/s40064-016-1869-2, 2016.
Carslaw, H. S. and Jaeger, J. C.: Conduction of heat in solids, Oxford University Press, Oxford, 1959.
Connolly, J. M., Jackson, B., Rothman, A. P., Klapper, I., and Gerlach, R.: Estimation of a biofilm-specific reaction rate: kinetics of bacterial urea hydrolysis in a biofilm, Biofilms and Microbiomes, 1, 15014, https://doi.org/10.1038/npjbiofilms.2015.14, 2015.
Cuthbert, M. O., Riley, M. S., Handley-Sidhu, S., Renshaw, J. C., Tobler, D. J., Phoenix, V. R., and Mackay, R.: Controls on the rate of ureolysis and the morphology of carbonate precipitated by S. pasteurii biofilms and limits due to bacterial encapsulation, Ecol. Eng., 41, 32–40, https://doi.org/10.1016/j.ecoleng.2012.01.008, 2012.
Cuthbert, M. O., McMillan, L. A., Handley-Sidhu, S., Riley, M. S., Tobler, D. J., and Phoenix, V. R.: A Field and modeling study of fractured rock permeability reduction using microbially induced calcite precipitation, Environ. Sci. Technol., 47, 13637–13643, https://doi.org/10.1021/es402601g, 2013.
Dick, J., De Windt, W., De Graef, B., Saveyn, H., Van der Meeren, P., De Belie, N., and Verstraete, W.: Bio-deposition of a calcium carbonate layer on degraded limestone by Bacillus species, Biodegradation, 17, 357–367, https://doi.org/10.1007/s10532-005-9006-x, 2006.
Dupraz, S., Parmentier, M., Ménez, B., and Guyot, F.: Experimental and numerical modeling of bacterially induced pH increase and calcite precipitation in saline aquifers, Chem. Geol., 265, 44–53, https://doi.org/10.1016/j.chemgeo.2009.05.003, 2009.
Ebigbo, A., Phillips, A., Gerlach, R., Helmig, R., Cunningham, A. B., Class, H., and Spangler, L. H.: Darcy-scale modeling of microbially induced carbonate mineral precipitation in sand columns, Water Resour. Res., 48, W07519, https://doi.org/10.1029/2011WR011714, 2012.
Farver, J. R.: Oxygen self-diffusion in calcite: Dependence on temperature and water fugacity, Earth Planet. Sc. Lett., 121, 575–587, https://doi.org/10.1016/0012-821X(94)90092-2, 1994.
Ferris, F. G., Stehmeier, L. G., Kantzas, A., and Mourits, F. M.: Bacteriogenic Mineral Plugging, J. Can. Petrol. Technol., 35, PETSOC-96-08-06, https://doi.org/10.2118/96-08-06, 1996.
Ferris, F. G., Phoenix, V., Fujita, Y., and Smith, R. W.: Kinetics of calcite precipitation induced by ureolytic bacteria at 10 to 20 ∘C in artificial groundwater, Geochim. Cosmochim. Ac., 68, 1701–1710, https://doi.org/10.1016/S0016-7037(03)00503-9, 2004.
Fujita, Y., Ferris, F. G., Lawson, R. D., Colwell, F. S., and Smith, R. W.: Calcium carbonate precipitation by ureolytic subsurface bacteria, Geomicrobiol. J., 17, 305–318, https://doi.org/10.1080/782198884, 2000.
Gerlach, R., Field, E. K., Viamajala, S., Peyton, B. M., Apel, W. A., and Cunningham, A. B.: Influence of carbon sources and electron shuttles on ferric iron reduction by Cellulomonas sp. strain ES6, Biodegradation, 22, 983–995, https://doi.org/10.1007/s10532-011-9457-1, 2011.
Hammes, F., Boon, N., de Villiers, J., Verstraete, W., and Siciliano, S. D.: Strain-specific ureolytic microbial calcium carbonate precipitation, Appl. Environ. Microbiol., 69, 4901–4909, https://doi.org/10.1128/AEM.69.8.4901-4909.2003, 2003a.
Hammes, F., Seka, A., de Knijf, S., and Verstraete, W.: A novel approach to calcium removal from calcium-rich industrial wastewater, Water Res., 37, 699–704, https://doi.org/10.1016/S0043-1354(02)00308-1, 2003b.
Jabri, E., Carr, M., Hausinger, R., and Karplus, P.: The crystal structure of urease from Klebsiella aerogenes, Science, 268, 998–1004, https://doi.org/10.1126/science.7754395, 1995.
Lauchnor, E. G., Topp, D. M., Parker, A. E., and Gerlach, R.: Whole cell kinetics of ureolysis by Sporosarcina pasteurii, J. Appl. Microbiol., 118, 1321–1332, https://doi.org/10.1111/jam.12804, 2015.
Martin, D., Dodds, K., Ngwenya, B. T., Butler, I. B., and Elphick, S. C.: Inhibition of Sporosarcina pasteurii under anoxic conditions: implications for subsurface carbonate precipitation and remediation via ureolysis, Environ. Sci. Technol., 46, 8351–8355, https://doi.org/10.1021/es3015875, 2012.
Miller, J. P.: A portion of the system calcium carbonate-carbon dioxide-water, with geological implications, Am. J. Sci., 250, 161–203, 1952.
Mitchell, A. C. and Ferris, F. G.: The coprecipitation of Sr into calcite precipitates induced by bacterial ureolysis in artificial groundwater: Temperature and kinetic dependence, Geochim. Cosmochim. Ac., 69, 4199–4210, https://doi.org/10.1016/j.gca.2005.03.014, 2005.
Mitchell, A. C. and Ferris, F. G.: Effect of strontium contaminants upon the size and solubility of calcite crystals precipitated by the bacterial hydrolysis of urea, Environ. Sci. Technol., 40, 1008–1014, https://doi.org/10.1021/es050929p, 2006a.
Mitchell, A. C. and Ferris, F. G.: The influence of Bacillus Pasteurii on the nucleation and growth of Calcium Carbonate, Geomicrobiol. J., 23, 213–226, 2006b.
Mitchell, A. C., Dideriksen, K., Spangler, L. H., Cunningham, A. B., and Gerlach, R.: Microbially enhanced carbon capture and storage by mineral-trapping and solubility-trapping, Environ. Sci. Technol., 44, 5270–5276, https://doi.org/10.1021/es903270w, 2010.
Mitchell, A. C., Espinosa-Ortiz, E. J., Parks, S. L., Phillips, A., Cunningham, A. B., and Gerlach, R.: Raw experimental data from the microcosm experiments from “Kinetics of calcite precipitation by ureolytic bacteria under aerobic and anaerobic conditions”, Dryad repository, https://doi.org/10.5061/dryad.5r01k2k, 2019.
Mortensen, B. M., Haber, M. J., DeJong, J. T., Caslake, L. F., and Nelson, D. C.: Effects of environmental factors on microbial induced calcium carbonate precipitation, J. Appl. Microbiol., 111, 338–349, https://doi.org/10.1111/j.1365-2672.2011.05065.x, 2011.
Parkhust, D. and Appelo, D.: User's guite to PHREEQC (Verstion2) – A computer program for speciation, batch-reaction, one-dimensional transport, and inverse geochemical calculation, 1999.
Phillips, A. J., Gerlach, R., Lauchnor, E., Mitchell, A. C., Cunningham, A. B., and Spangler, L.: Engineered applications of ureolytic biomineralization: a review, Biofouling, 29, 715–733, https://doi.org/10.1080/08927014.2013.796550, 2013a.
Phillips, A. J., Lauchnor, E., Eldring, J., Esposito, R., Mitchell, A. C., Gerlach, R., Cunningham, A. B., and Spangler, L. H.: Potential CO2 leakage reduction through biofilm-induced calcium carbonate precipitation, Environ. Sci. Technol., 47, 142–149, https://doi.org/10.1021/es301294q, 2013b.
Rodriguez-Navarro, C., Jroundi, F., Schiro, M., Ruiz-Agudo, E., and González-Muñoz, M. T.: Influence of substrate mineralogy on bacterial mineralization of calcium carbonate: implications for stone conservation, Appl. Environ. Microbiol., 78, 4017–4029, https://doi.org/10.1128/aem.07044-11, 2012.
Schultz, L., Pitts, B., Mitchell, A. C., Cunningham, A. B., and Gerlach, R.: Imaging biologically induced mineralization in fully hydrated flow systems, Microscopy Today, 19, 12–15, https://doi.org/10.1017/S1551929511000848, 2011.
Schultze-Lam, S., Fortin, D., Davis, B. S., and Beveridge, T. J.: Mineralization of bacterial surfaces, Chem. Geol., 132, 171–181, https://doi.org/10.1016/S0009-2541(96)00053-8, 1996.
Stewart, P. S.: Diffusion in biofilms, J. Bacteriol., 185, 1485–1491, https://doi.org/10.1128/jb.185.5.1485-1491.2003, 2003.
Stocks-Fischer, S., Galinat, J. K., and Bang, S. S.: Microbiological precipitation of CaCO3, Soil Biol. Biochem., 31, 1563–1571, https://doi.org/10.1016/S0038-0717(99)00082-6, 1999.
Stokes, R.: Thermodynamics of aqueous urea solutions, Aust. J. Chem., 20, 2087–2100, https://doi.org/10.1071/CH9672087, 1967.
Stumm, W. and Morgan, J. J.: Aquatic Chemistry, John Wiley & Sons, New York, 1996.
Swensen, B. and Bakken, L. R.: Nitrification potential and urease activity in a mineral subsoil, Soil Biol. Biochem., 30, 1333–1341, https://doi.org/10.1016/S0038-0717(98)00015-7, 1998.
Teng, H. H., Dove, P. M., and De Yoreo, J. J.: Kinetics of calcite growth: surface processes and relationships to macroscopic rate laws, Geochim. Cosmochim. Ac., 64, 2255–2266, https://doi.org/10.1016/S0016-7037(00)00341-0, 2000.
Tobler, D. J., Cuthbert, M. O., Greswell, R. B., Riley, M. S., Renshaw, J. C., Handley-Sidhu, S., and Phoenix, V. R.: Comparison of rates of ureolysis between Sporosarcina pasteurii and an indigenous groundwater community under conditions required to precipitate large volumes of calcite, Geochim. Cosmochim. Ac., 75, 3290–3301, https://doi.org/10.1016/j.gca.2011.03.023, 2011.
Tobler, D. J., Maclachlan, E., and Phoenix, V. R.: Microbially mediated plugging of porous media and the impact of differing injection strategies, Ecol. Eng., 42, 270–278, https://doi.org/10.1016/j.ecoleng.2012.02.027, 2012.
Tobler, D. J., Cuthbert, M. O., and Phoenix, V. R.: Transport of Sporosarcina pasteurii in sandstone and its significance for subsurface engineering technologies, Appl. Geochem., 42, 38–44, https://doi.org/10.1016/j.apgeochem.2014.01.004, 2014.
van Paassen, L. A., Ghose, R., van der Linden Thomas, J. M., van der Star Wouter, R. L., and van Loosdrecht Mark, C. M.: Quantifying biomediated ground improvement by ureolysis: large-scale biogrout experiment, J. Geotech. Geoenvironm. Eng., 136, 1721–1728, https://doi.org/10.1061/(ASCE)GT.1943-5606.0000382, 2010.
Warren, L. A., Nagina Parmar, P. A. M., and Ferris, F. G.: Microbially mediated calcium carbonate precipitation: implications for interpreting calcite precipitation and for solid-phase capture of inorganic contaminants, Geomicrobiol. J., 18, 93–115, https://doi.org/10.1080/01490450151079833, 2001.