the Creative Commons Attribution 4.0 License.
the Creative Commons Attribution 4.0 License.
 | 29 May 2019
Physically controlled CO2 effluxes from a reservoir surface in the upper Mekong River Basin: a case study in the Gongguoqiao Reservoir
Lin Lin
Xixi Lu
Shaoda Liu
Shie-Yui Liong
Kaidao Fu
Impounding alters the carbon transport in rivers. To quantify this effect, we measured CO2 effluxes from a mountainous valley-type reservoir in the upper Mekong River (known as Lancang River in China). CO2 evasion rates from the reservoir surface were 408±337 mg CO2 m−2 d−1 in the dry season and 305±262 mg CO2 m−2 d−1 in the rainy season much lower than those from the riverine channels (1567±2312 mg CO2 m−2 d−1 at the main stem and 905±1536 mg CO2 m−2 d−1 at the tributary). Low effluxes in the pelagic area were caused by low allochthonous organic carbon (OC) inputs and photosynthetic uptake of CO2. A negative relationship between CO2 efflux and water temperature suggested CO2 emissions at the pelagic area were partly offset by photosynthesis in the warmer rainy season. CO2 emissions from the reservoir outlet and littoral area, which were usually considered hotspots of CO2 emissions, had a low contribution to the total emission because of epilimnion water spilling and a small area of the littoral zones. Yet at the river inlets effluxes were much higher in the dry season than in the rainy season because different mixing modes occurred in the two seasons. When the river joined the receiving waterbody in the dry season, warmer and lighter inflow became an overflow and large amounts of CO2 were released to the atmosphere as the overflow contacted the atmosphere directly. Extended water retention time due to water storage might also help mineralization of OC. In the wet season, however, colder, turbid and heavier inflow plunged into the reservoir and was discharged downstream for hydroelectricity, leaving insufficient time for decomposition of OC. Besides, diurnal efflux variability indicated that the effluxes were significantly higher in the nighttime than in the daytime, which increased the estimated annual emission rate by half.
- Article
(3126 KB) - Full-text XML
-
Supplement
(398 KB) - BibTeX
- EndNote


Supersaturation of CO2 in the inland waters (Cole et al., 1994) resulted in substantial carbon outgassing to the atmosphere (Battin et al., 2009; Cole et al., 2007; Raymond et al., 2013; Tranvik et al., 2009). Loss of carbon to the atmosphere from inland waters has been recognized as an important part of carbon cycling which faced great anthropogenic impacts (Maavara et al., 2017; Regnier et al., 2013). Damming rivers for water supply, irrigation, hydroelectricity and flood controls is one of the most drastic changes in inland waters (Lehner and Döll, 2004; Varis et al., 2012; Yang and Lu, 2014). By flooding large area of forests, soils and different kinds of organic matter, reservoirs have been identified as a large potential carbon source to the atmosphere since last century and have caused a serious perturbation to the global carbon budget (Fearnside, 1997; Kelly et al., 1994; Rudd et al., 1993). Damming rivers not only enlarged the water surface but also produced more greenhouse gases (GHGs), mainly carbon dioxide and methane, than the natural waterbodies (Barros et al., 2011; Deemer et al., 2016; Mendonça et al., 2012a). Most of the carbon was released in the form of carbon dioxide, even though methane made up a bigger part of the warming potential (Deemer et al., 2016; Demarty and Bastien, 2011).
Efforts have been made to evaluate CO2 emissions from reservoir surfaces (Raymond et al., 2013; Varis et al., 2012; Vincent et al., 2000) and accumulated case studies indicated that CO2 emission rates exhibited great seasonal variability and spatial heterogeneity (Barros et al., 2011; Deemer et al., 2016). Quantity and quality of dissolved organic carbon (DOC) and water temperature were considered to be the most important factors that controlled the CO2 fluxes from reservoirs (Mendonça et al., 2012a; Tadonleke et al., 2012). Young tropical reservoirs and the reservoirs with substantial labile organic carbon (OC) tended to have higher emission rates (Barros et al., 2011; Fearnside, 1997). However, in China, country to most reservoirs (89 696 reservoirs) in the world (Yang and Lu, 2014; Yang et al., 2016), analysis on pCO2 indicated that most of the effluxes from reservoir surfaces were much lower than that from tropical and boreal reservoirs (Li and Zhang, 2014; Li et al., 2015; Liu et al., 2016b; Ran et al., 2017). Lower effluxes in the reservoir centre (Gao et al., 2017; Mei et al., 2011; Liu et al., 2016b, 2017) implied that the CO2 at the reservoir surface was subject to photosynthetic uptake by phytoplankton (Ran et al., 2017, 2018). CO2 effluxes and pCO2 in reservoirs were regulated by the balance between respiration and photosynthesis, and sensitive to the monsoon climate due to the seasonal variation in water temperature and hydrological condition (Guo et al., 2011; Mei et al., 2011). For example, in the Three Gorges Dam reservoir, the largest reservoir in China, CO2 emissions from the littoral zone were subjected to seasonal flooding (Chen et al., 2009; Yang et al., 2012), while the carbon uptake of algae in the stagnant tributaries as a result of heavy eutrophication was heavily influenced by the seasonal variation in hydrological condition (Jiang et al., 2012; Guo et al., 2011; Ran et al., 2011; Zhao et al., 2013).
Despite the spatial heterogeneity (Li and Zhang, 2014), previous research mostly focused on the reservoirs in the highly populated eastern plain where waterbodies were suffering from heavy eutrophication (Li and Zhang, 2014; Mei et al., 2011). However, in the less populated southwestern China, where two-thirds of exploitable hydropower is found and many more reservoirs are being built, the dynamics underlying CO2 emissions have been less understood (Hu and Cheng, 2013). Rivers originated from the Tibetan Plateau flow through the mountainous area of southwestern China and receive flows from melted glaciers and rainfall brought by the South Asian monsoon. The precipitation in summer and autumn accounted for 50 % and 27 %, respectively, of the annual rainfall producing high water flow in the warm rainy season. It was supposed that the CO2 emissions of these rivers were more sensitive to the monsoon climate, which regulated rainfall, nutrient availability and water discharge. However, the river flows were also regulated by the dams. In particular, dams completed in the upper basin of the Mekong River (or the Lancang River), one of the most important rivers in Southeast Asia, have already affected the hydrological condition, sediment transportation and CO2 emissions (Lu and Siew, 2006; Lu et al., 2014).
In this study, the Gongguoqiao Reservoir (GGQ), the uppermost reservoir in the Lancang cascading reservoir, was selected as a site for the investigation of the seasonal variation of carbon effluxes. This research aimed at measuring the CO2 evasion with the static chamber method and analysing the spatial heterogeneity, seasonal variation and diurnal variation in the CO2 efflux in order to examine the mechanism that controlled the CO2 effluxes under the monsoon climate and the damming effect on carbon emissions. Considering that there are 7 completed dams in the upper Mekong Basin and another 14 dams are either under construction or planned, clarifying the coupling effect of the monsoon climate and damming on the CO2 emissions would help us understand the role of reservoirs in the global carbon cycle.
2.1 Study area
The GGQ is located in Gongguo town (25∘35′9.87′′ N, 99∘20′5.55′′ E) in Dali Prefecture (Yunnan, China, Fig. 1). With a catchment area of 97 200 km2, around 32 billion m3 of water flowed into the reservoir annually. The monthly water discharge of inflow to the GGQ in 2016 during the study is shown in Fig. 2. Point L (Jiuzhou) was considered the point dividing the upper and middle reach of the Lancang River (Fig. 1). The area was subject to a subtropical monsoon climate; over 80 % of the annual rainfall, 78.6 % of the annual water discharge and 95 % of the annual sediment loads to the reservoir occurred in the rainy season spanning from May to October (He and Tang, 2000; Fig. 2). The annual precipitation was 804.90 mm and the monthly average air temperature ranged from 7.6 to 21.6 ∘C, with an annual average of 17.8 ∘C (Fig. S1 in the Supplement). There were several villages scattered along the riverside. Before the reservoir filling, the average vegetation cover was only 25 % in the steep slope due to intense agricultural activities (Hu, 2010; Xu et al., 2003). The reservoir was filled in September 2011 and had been the uppermost cascading reservoir in the upper Mekong River Basin until the end of 2016 when the Miaowei Reservoir was filled at its upstream part. The outflow from the GGQ feeds the Xiaowan Reservoir at the downstream part. The backwater area stretched 44.3 km along the main stem and 7 km along the tributary, the Bijiang River. The width of the reservoir ranged from 110 to 120 m in the dry season. The normal water level was 1307 m, corresponding to a storage of 0.316 billion m3. The reservoir released the top water (in the epilimnion zone around 4∼5 m deep) for hydropower production and generated 4.041 billion kW h−1 hydroelectricity annually. The reservoir is a daily-operated reservoir due to its small operating capacity (49 million m3). Thus, the water level fluctuated frequently and the average water retention time was 1.4 days. Stratification was found in summer and autumn, but it was generally interrupted by the subsurface flow (unpublished data of this research).
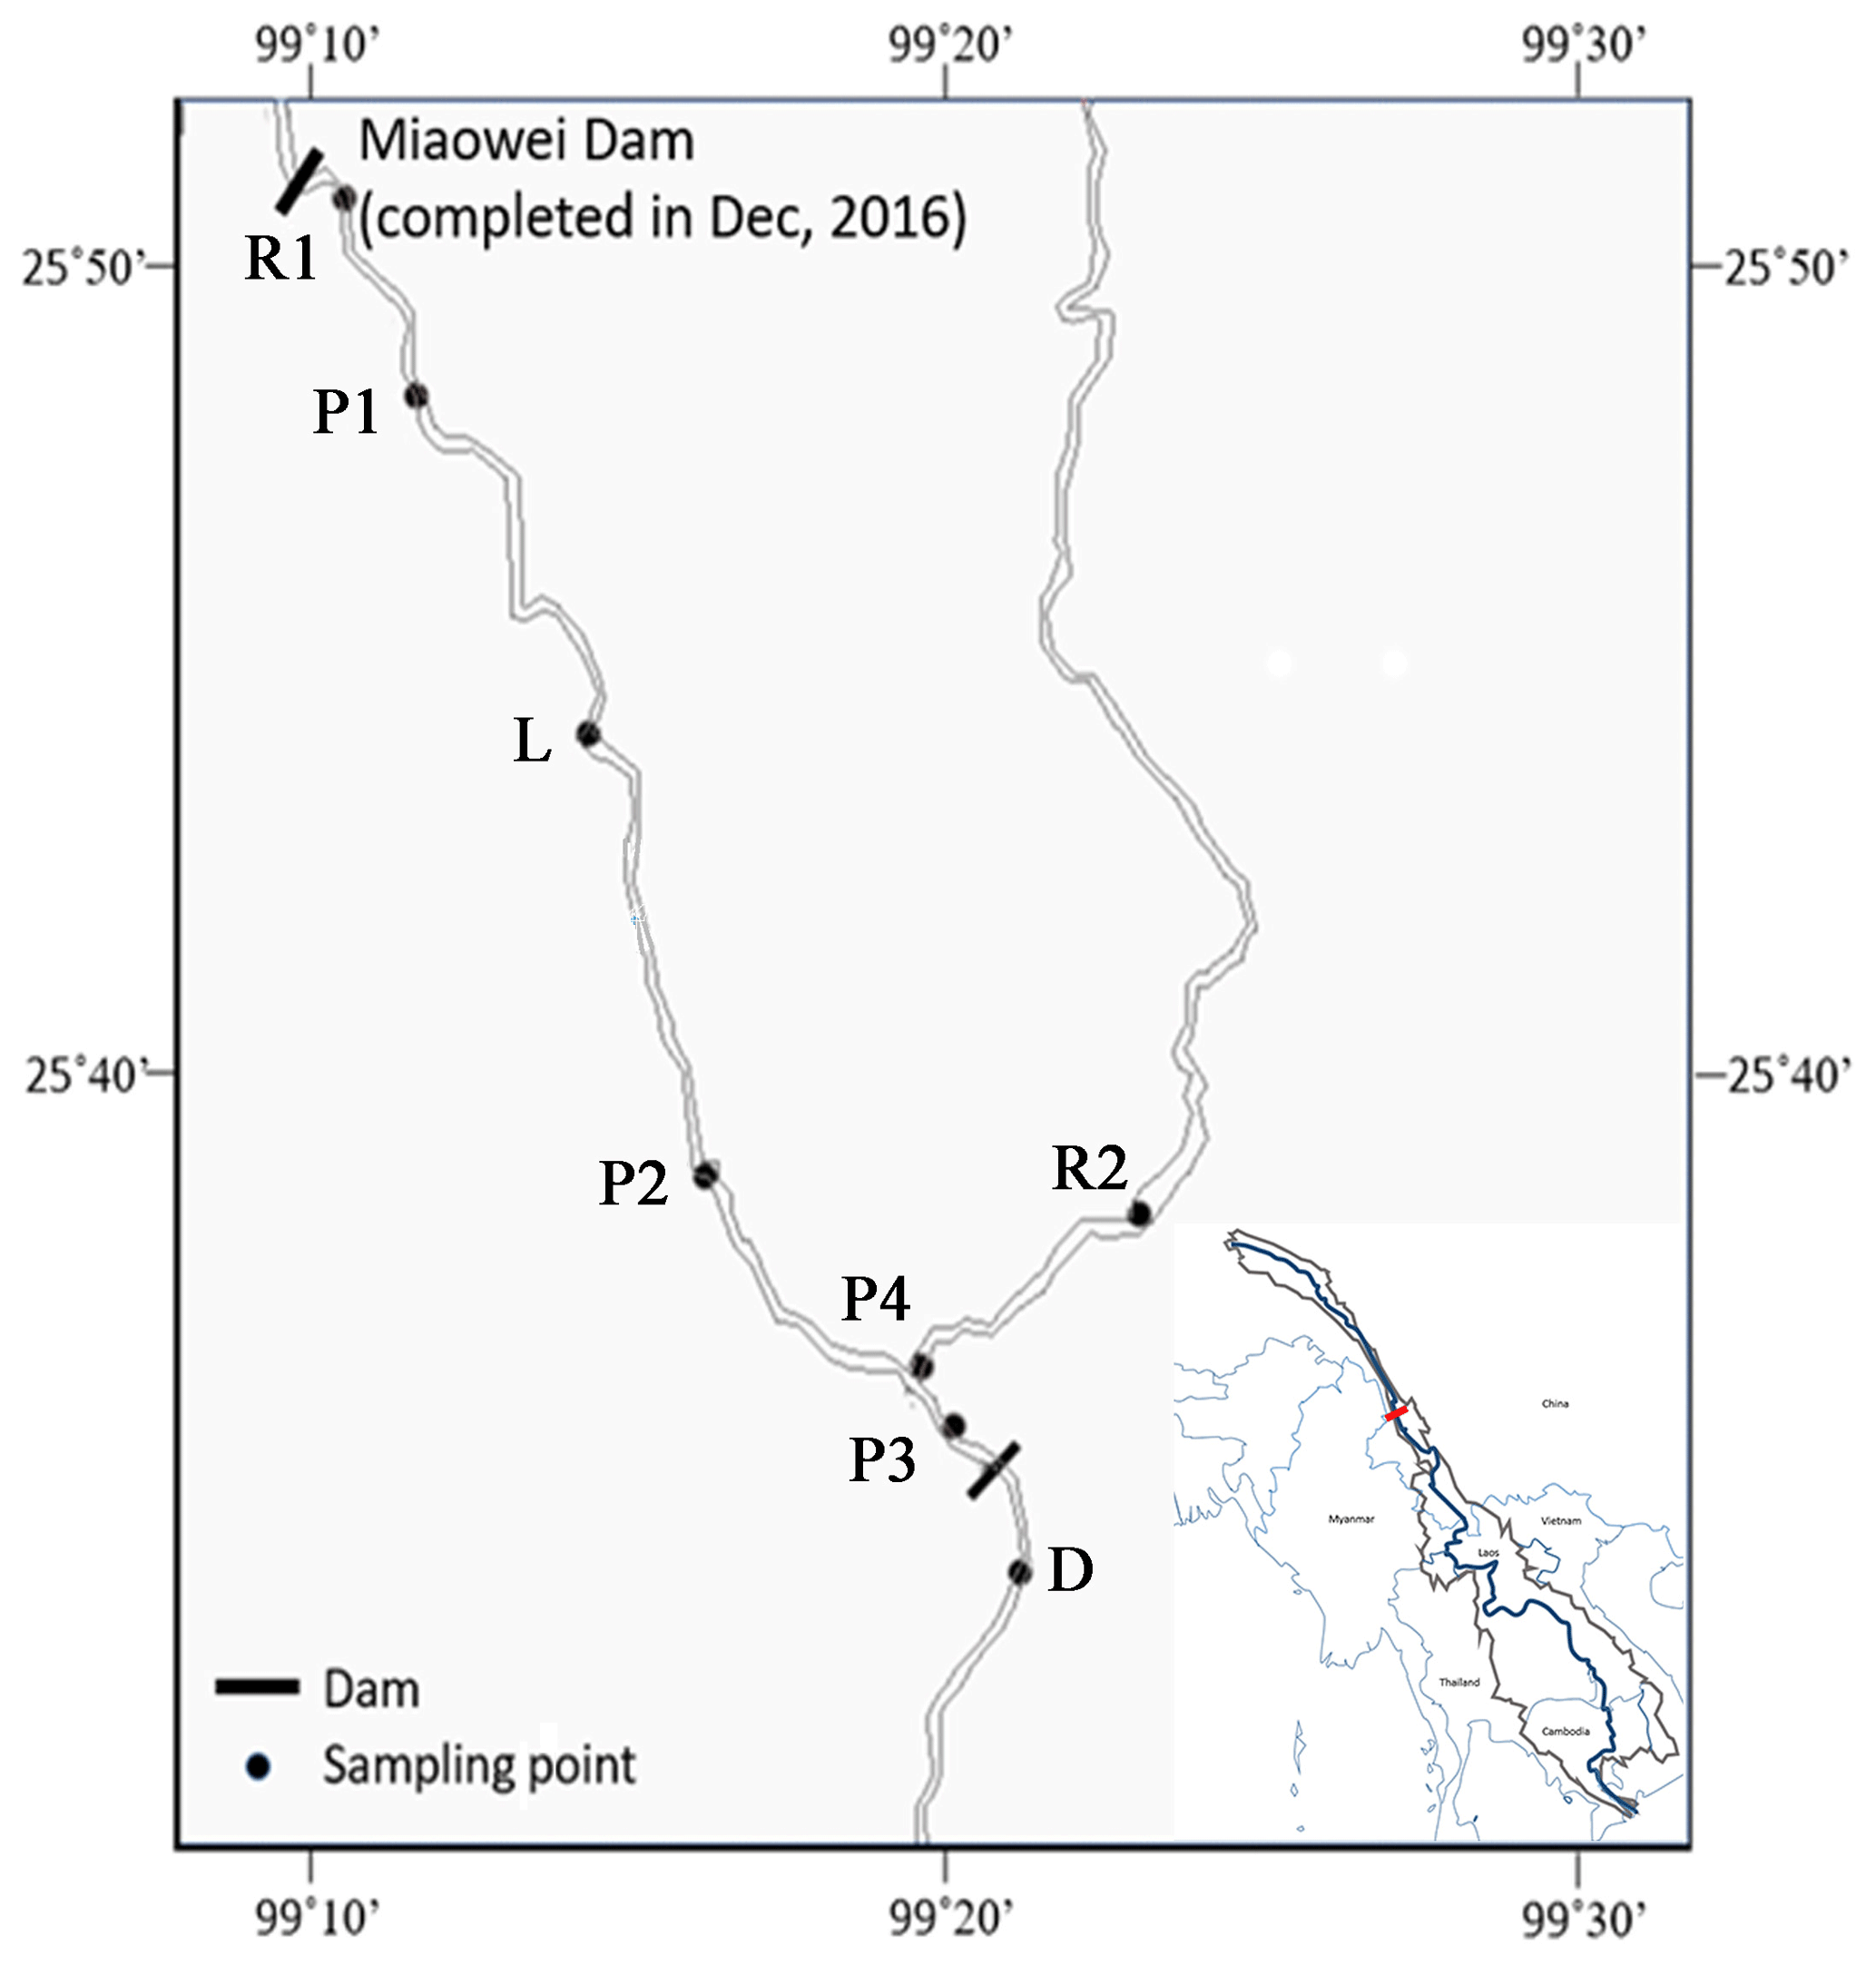
Figure 1Sampling points in the Gongguoqiao Reservoir and its position within the Mekong River Basin. Point R1 is downstream the Miaowei Dam which was completed in December 2016. Points P1, P2 and P3 were in the reservoir without flow velocity and point L was in the littoral zone. Point D was downstream of the reservoir. Points R2 and P4 were in the tributary the Bijiang River while all the other points were in the main stem of Mekong River (or Lancang River).
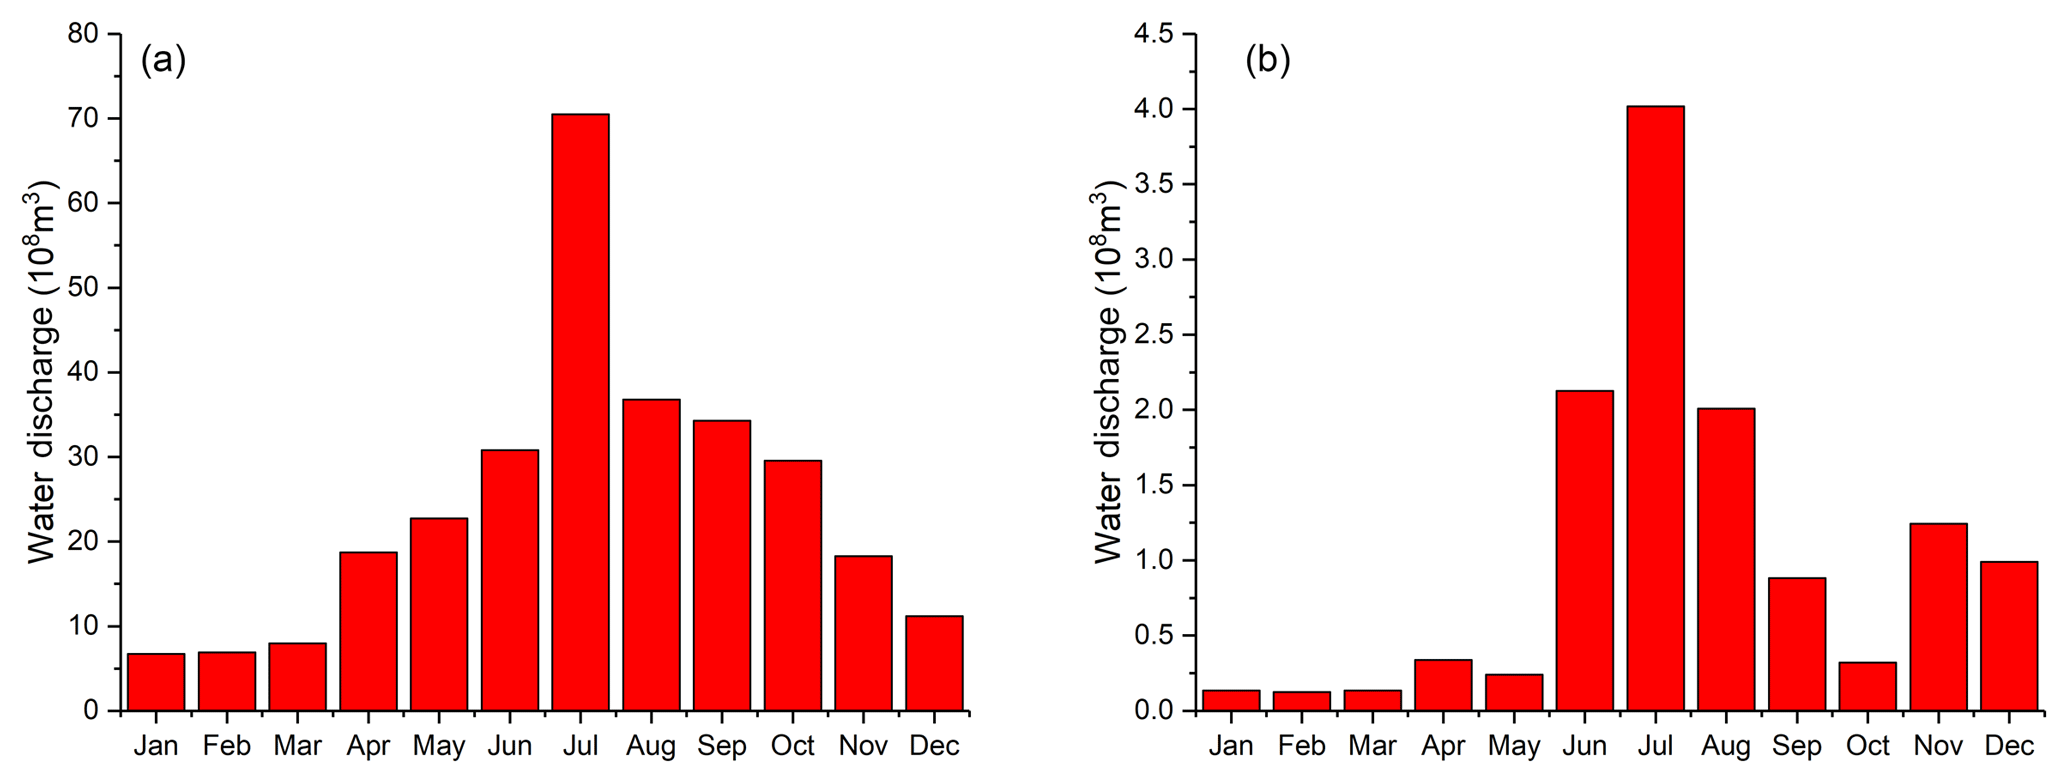
Figure 2Monthly water discharge of the inflow at the main stem (a) and the tributary (the Bijiang River, b) into the GGQ. Notice that the inflow from the tributary was estimated with the instant water discharge (m3 s−1). The instant water discharge was measured at the same time as the sampling campaign at point R2 at the Lanping or Yunlong hydrological gauging station, which was about 30 km away from point R2.
2.2 Study methods
2.2.1 Sampling
Five sampling points were selected along the main stem and two from the Bijiang River, a turbid tributary joining the reservoir about 1km before the dam (Fig. 1). The sampling points where the surface velocity could be detected (v>0 m s−1) were defined as river channels. The average flow velocity was 0.2 and 0.7 m s−1 at points R1 and R2, respectively. Thus the two points were considered river channels and the flows in channels were regarded as the inflows to the reservoir. Even though the Miaowei Reservoir under construction during the sampling period might have affected the deposition processes of the river, since the water was not impounded and regulated by the dam, point R1 was considered to be a pristine river channel. Another point was selected for comparison downstream of the dam (point D) where the flow was regarded as the outflow. The surface flow velocities at all the other points were almost zero and defined as the points in the reservoir. Among the points in the reservoir, points P1–P4 were defined as pelagic points as they were permanently flooded. Point L was defined as a littoral zone with daily flooding and draining owing to the frequent fluctuation of the water level. The point was in a relatively flat wetland formed by the deposited fine sediment.
The sampling campaign started in January 2016. The first two campaigns were carried out in January and March. Samples were collected only in riverine channels, including points R1, R2 and D. The formal campaigns were conducted twice a month from April to December 2016 before the impounding of the Miaowei Reservoir upstream. Samples were collected from 09:00 to 16:00 LT (local time; note that all times in this paper are given in local time) when sunlight was available and each campaign lasted 2 to 3 days. The emission rates were measured following the same order among sampling points. We were not able to collect samples at point L in late October as it was dried out due to a low water level. In total, 127 samples were collected in 16 formal campaigns. For the diurnal variation in fluxes, discontinuous samplings were conducted in the riverine sites during the first sampling campaign in January, while the continuous diel sampling on CO2 effluxes was conducted at a permanently flooded point adjacent to point L before the last sampling campaign.
The effluxes were measured in situ with a floating chamber connected to a non-dispersive infrared CO2 analyser (S157-P 0-2000 ppm, Qubit, Canada) via the LQ-MINI interface (Vernier, USA). The chamber was a polypropylene rectangle translucent box inserted through a diamond-shape Styrofoam collar. Before measurements, it was turned upside down 3 times to mix the gas within the box. The CO2 analyser could detect the partial pressure of CO2 (pCO2) down to 1 ppm and it was calibrated before the sampling campaigns started. The measurement of CO2 concentration did not begin until the reading of the analyser became stable at around 400∼500 ppm. The chamber was fixed to the piles while floating on the water surface.
The calculation of effluxes was based on the slope of a graph of concentration versus time according to the methodology proposed by Tremblay et al. (2005).
where volume refers to the air trapped in the chamber and surface is the surface of the floating chamber over the water. The slope was calculated with the variation curve in pCO2. The emission pulses were excluded, and the slope was accepted only when the fitting curve had a R2 higher than 0.90. Water temperature, pH, conductivity and dissolved oxygen (DO) were measured in situ with a portable multi-parameter meter (Orion Star A321, Thermo Scientific, USA) with a resolution of 0.1 ∘C, 0.01, 0.01 µS cm−1 and 0.01 mg L−1, respectively. All the probes were calibrated before each sampling campaign started according to the manual. Due to a malfunction of the instrument, the DO data were not available from September. Air temperature and wind velocity were measured with a portable anemometer (GM8901, Benetech, China). All the parameters were measured 3 times to reduce systematic error. For quality control, at least three water samples were collected from 0.5 m below the water surface with water bottles. For alkalinity, the water samples were titrated with 2 M hydrochloric acid within 12 h after collection. The acid solution was titrated with NaOH solution. The data of alkalinity, pH and water temperature were used to calculate the pCO2 of water samples with the CO2SYS program (Lewis and Wallace, 1998). The water samples were stored in 50 mL centrifugal tubes and transported to the lab at a low temperature.
2.2.2 Laboratory analysis
The water samples for analysis of chlorophyll concentration were filtered with qualitative filter paper (80∼120 µm), while the water samples for DOC analysis were filtered with 0.7 µm Whatman GF/F filters to remove the sediment. Concentration of chlorophyll was analysed with a Phyto-PAM-II multiple excitation wavelength phytoplankton analyser (Heinz Walz GmbH, Germany). The DOC analysis was conducted on the Vario TOC analyser (Elementar, Germany). The resolutions of the analyser for chlorophyll and DOC were 0.01 µg L−1 and 0.001 ppm, respectively. Unfiltered water samples were analysed with a spectrophotometer (UV5500, Metash, China) after digestion with alkaline potassium persulfate and potassium persulfate for concentration of total nitrogen (TN) and total phosphorous (TP) according to HJ636-2012 (MEP, 2012) and GB11893-89 (MEP, 1989), respectively.
3.1 Spatial and temporal variation in environmental factors
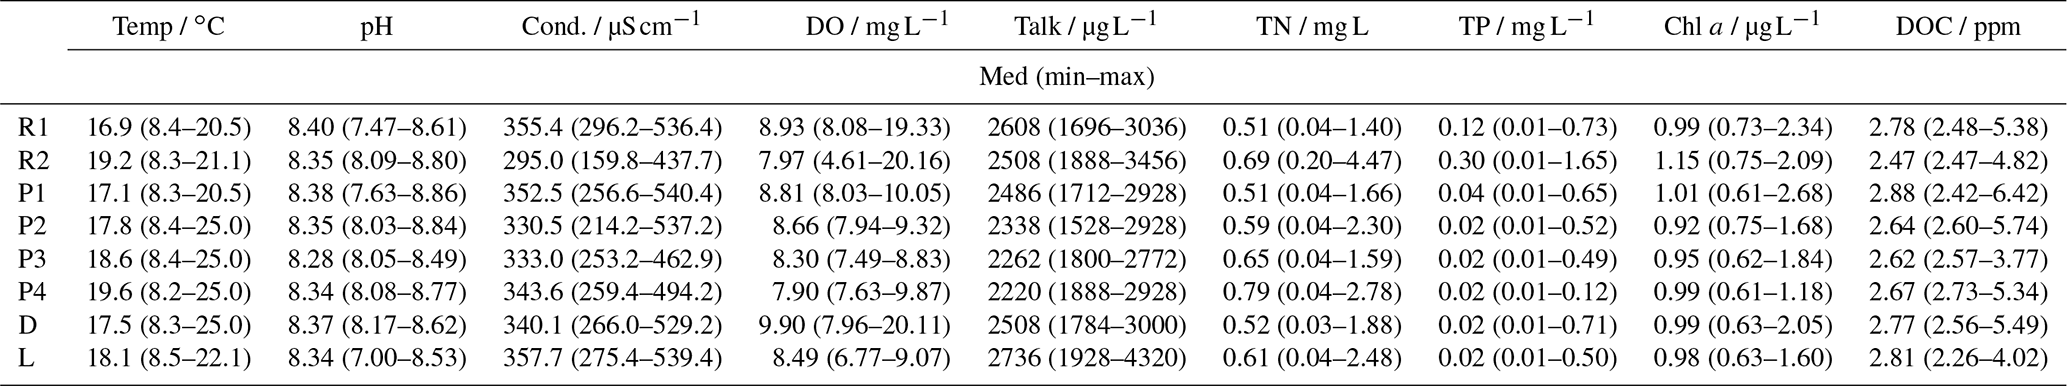
Seasonal variation in temperature and rainfall reflected the characteristics of a monsoon climate (Fig. S1). In winter (from December to February), the air temperature was below 5 ∘C, while the monthly average temperature was all over 25 ∘C in summer (from June to August). The peak discharges of inflows in the main stem and the tributary were both recorded in July, which were 70.50×10⁸ and 4.02×10⁸ m3 s−1. Summer inflows accounted for 47 % and 65 % of the annual discharge in the main stem and the tributary, respectively. The inflow water from main stem was characterized by low temperature, high pH, high conductivity, high total alkalinity and high DO concentration, while the pelagic zone was filled with warm, more acidic and less aerobic water (Table 1). The average water temperature of all the points ranged from 15.6 to 17.4 ∘C, with an average of 16.8 ∘C. The difference in water temperature between riverine zone and pelagic zone was no more than 2 ∘C. Since the epilimnion water was used for hydropower generation, the water temperature downstream of the dam was very close to the surface water upstream of the dam. The pH values were mostly higher than 8.0 (8.46 on average), which suggested that the water in the reservoir was alkaline without any significant spatial heterogeneity. Total alkalinity ranged from 2251 to 2666 µmol L−1, with a mean value of 2441 µmol L−1. Points located upstream had higher alkalinity than in the downstream pelagic area with the maximum recorded in the littoral zone. Ranging from 345 to 388 µS cm−1, conductivity showed a similar variation trend as alkalinity. The DO concentration in the pristine channel was approximately 4 mg L−1, higher than that in the pelagic area. Concentrations of TP and DOC were also significantly higher in the riverine zone than in the pelagic area, but they were quite homogeneous within the reservoir, possibly due to severe deposition. Yet the concentration of TN showed high values in the reservoir, with a mean value of 0.71 mg L−1.
Table 1Median temperature (Temp), pH, total alkalinity (Talk), conductivity (Cond.), dissolved oxygen (DO), concentration of dissolved organic carbon (DOC), concentration of chlorophyll a (Chl a), concentration of total nitrogen (TN) and total phosphorous (TP) of sampling points.
3.2 Spatial and seasonal variation in pCO2
Most of the water samples had pCO2 higher than the atmospheric value (410 µatm; Fig. 3), suggesting that the reservoir was a CO2 source to the atmosphere. The pCO2 of water samples ranged from 237 to 14 764 µatm, with an annual average of 919 µatm and a median of 711 µatm. The values were close to the global average of artificial reservoirs (Raymond et al., 2013).
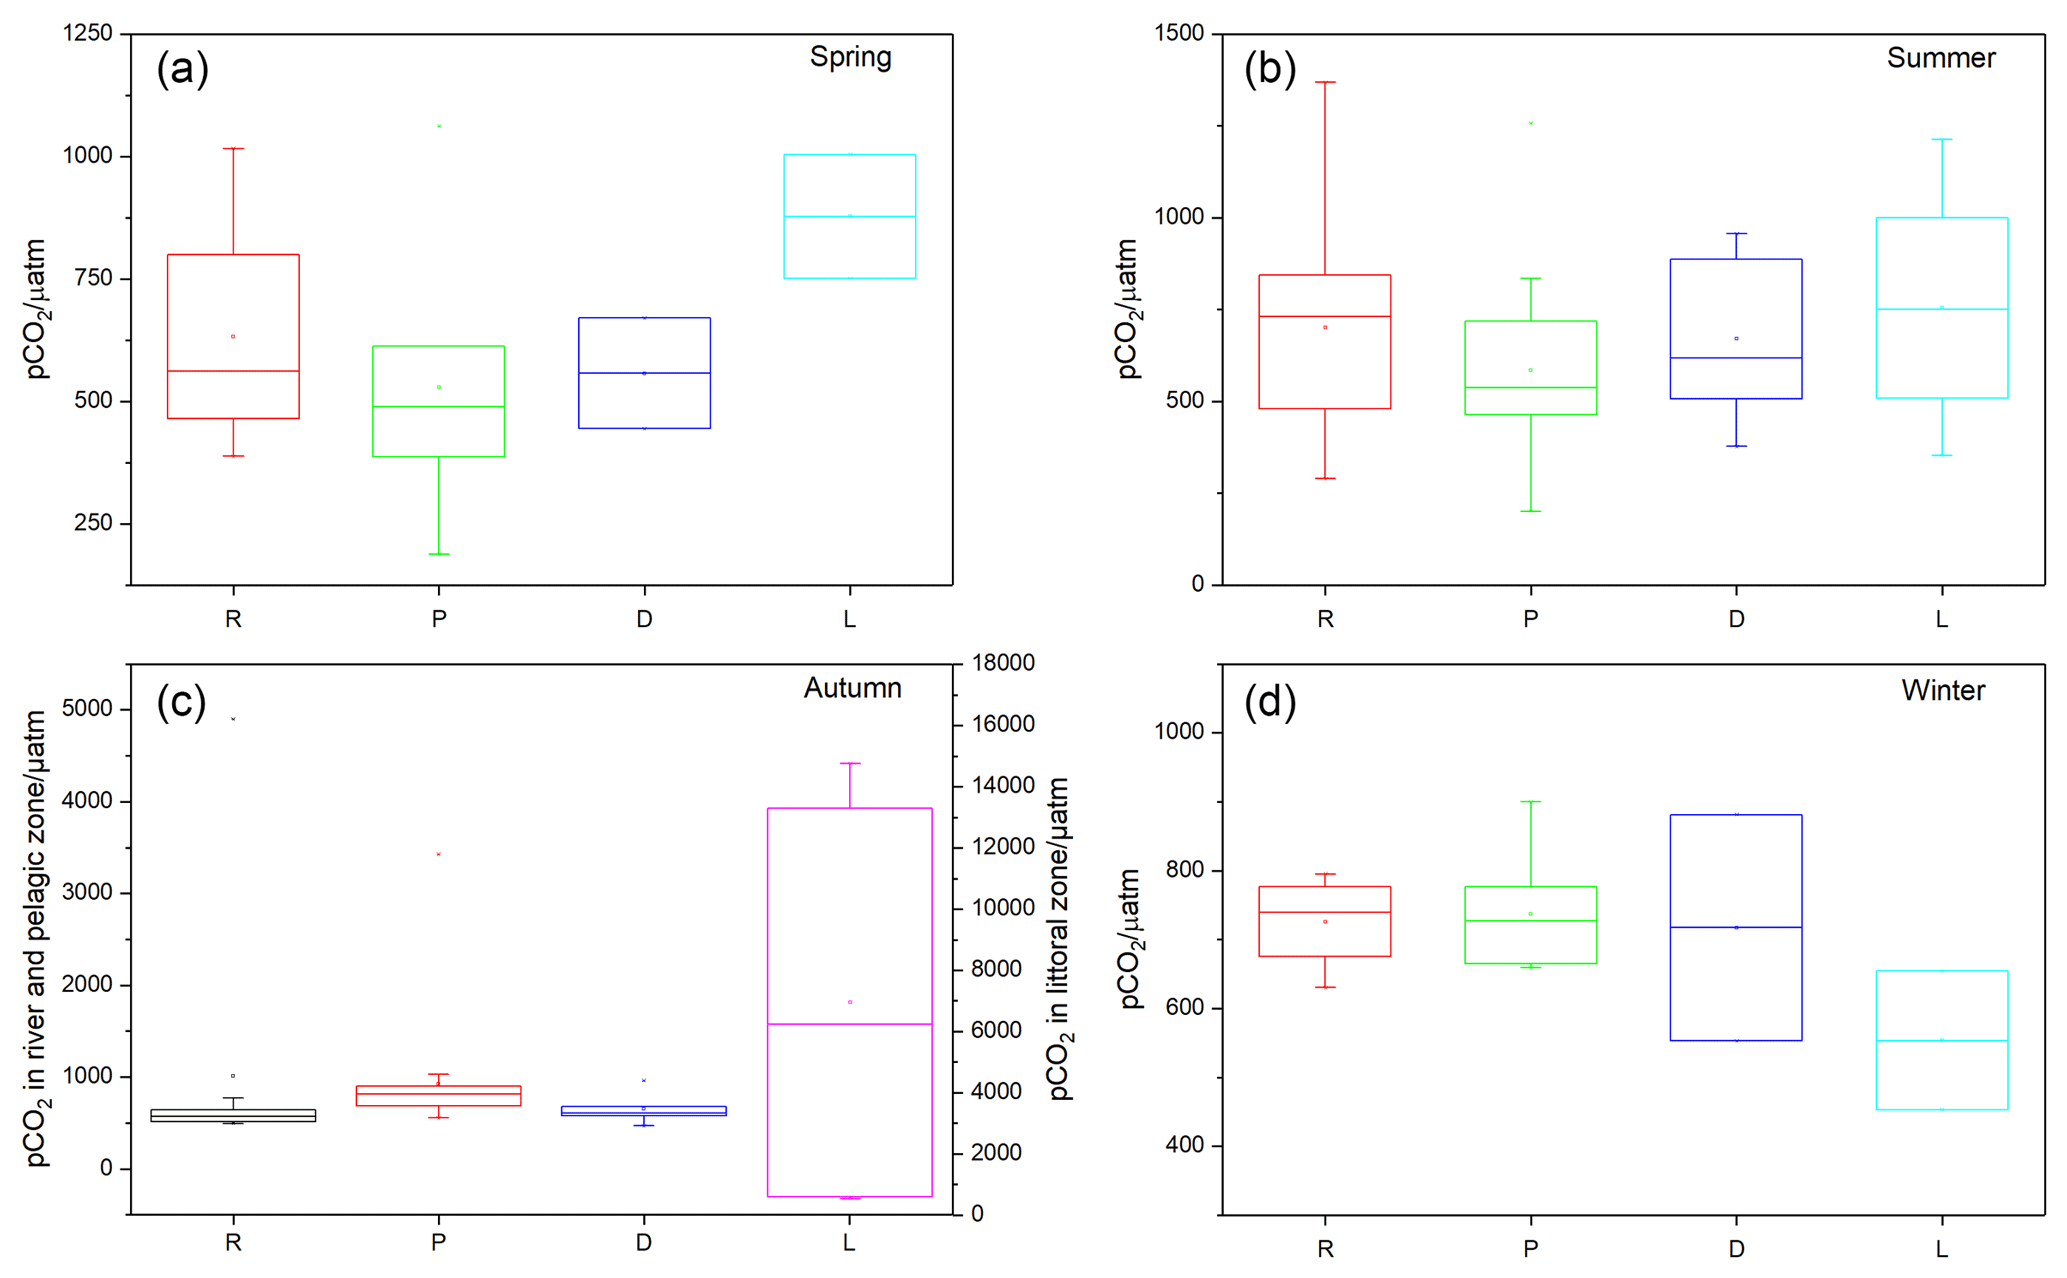
Figure 3Box plots of pCO2 in the rivers (R), permanent flooded area of the reservoir (P), downstream (D) and littoral zone (L) in the spring (a), summer (b), autumn (c) and winter (d). Notice that the scale of pCO2 at the littoral zone in autumn was shown on the scale of right-hand side. The lower and upper bounds of the box refer to the first and third quartiles, respectively, and the vertical line indicates the 1.5 interquartile range. The points outside the range are considered outliers and are represented by a small cross. The horizontal line refers to the median value while the small squares refer to the average values.
Annual mean pCO2 of the reservoir (703±407 µatm) was comparable to the natural lakes in the Yunnan–Guizhou Plateau (639 µatm; Wang et al., 2003) when the pCO2 from the river channel was excluded. The value was much lower than the pCO2 in the lower Mekong River (Li et al., 2013). Although there were no data available from the origin of the Mekong River, the research on the three rivers on the Tibetan Plateau showed a median pCO2 of 864 µatm, which was comparable to the values in the GGQ (Qu et al., 2017).
The pCO2 was 852±1056 and 733±232 µatm in the inflow of the main stem and the tributary, respectively. These values were slightly higher than the pCO2 in the surface water of the pelagic zone, but the difference was insignificant (p>0.05). Since the pH was higher than 8 with little variation, the pCO2 showed no significant spatial heterogeneity in the reservoir in the spring, summer or winter. The pCO2 was below 800 µatm from May to August, while it increased drastically in late August. From September to April, the pCO2 fluctuated between 400 and 1200 µatm.
Variation of the pCO2 was significant (p<0.05) among the four seasons and the pCO2 in autumn was much higher than in the other seasons. When the pCO2 in the riverine area and the pelagic zone recorded their peak values in autumn, a significant decreasing trend toward downstream values was found along the main stem (p<0.05), which could be related to the low pH at the reach from points R1 to L (Fig. 3). Frequent fluctuation of the water level and continued rainfall flushed plenty of deadwood and organic matter to the reservoirs. Decomposition of the deadwood and plants could acidify the water along the bankside, which finally led to much higher pCO2 at points R1, P1 and L. Accumulation of deadwood was most obvious in the littoral zone. The pCO2 in the littoral zone was 14 764 and 11 825 µatm in September and October, respectively. The extremely high pCO2 in the littoral zone indicated that this zone could be a potential hotspot for carbon emissions.
The pCO2 measured downstream of the dam was quite stable throughout the year (p>0.50), with an average of 658±176 µatm. No drastic increase from points P3 to D was found throughout the year. The gradient in pCO2 between P3, the point close to the dam, and D, downstream of the dam, ranged from −247 to 560 µatm. The pCO2 was found to be lower downstream of the dam than upstream from August to November. Unlike the cascade reservoirs on the Maotiao River where higher pCO2 downstream of the dam had been recorded (Wang et al., 2011), the pCO2 downstream of the GGQ rarely reached 10 000 µatm.
3.3 Spatial and seasonal variation in CO2 effluxes
CO2 effluxes displayed large spatial and seasonal variation in the GGQ (p<0.01, Figs. 4 and 5). CO2 effluxes ranged from −44 to 4952 mg CO2 m−2 d−1 with a mean value of 352±587 mg CO2 m−2 d−1. One negative value was found at P4. It confirmed that the reservoir was a carbon source to the atmosphere, but the evasion rate was much lower than the estimated global average (Deemer et al., 2016; Holgerson and Raymond, 2016; Vincent et al., 2000). The annual effluxes at P1, P2, P3 and P4 were 465±529, 331±94, 336±92 and 273±11 mg CO2 m−2 d−1, respectively. Effluxes in the pelagic zone were lower in the summer and autumn than in the winter and spring, but the seasonal variation was not significant (p>0.50).
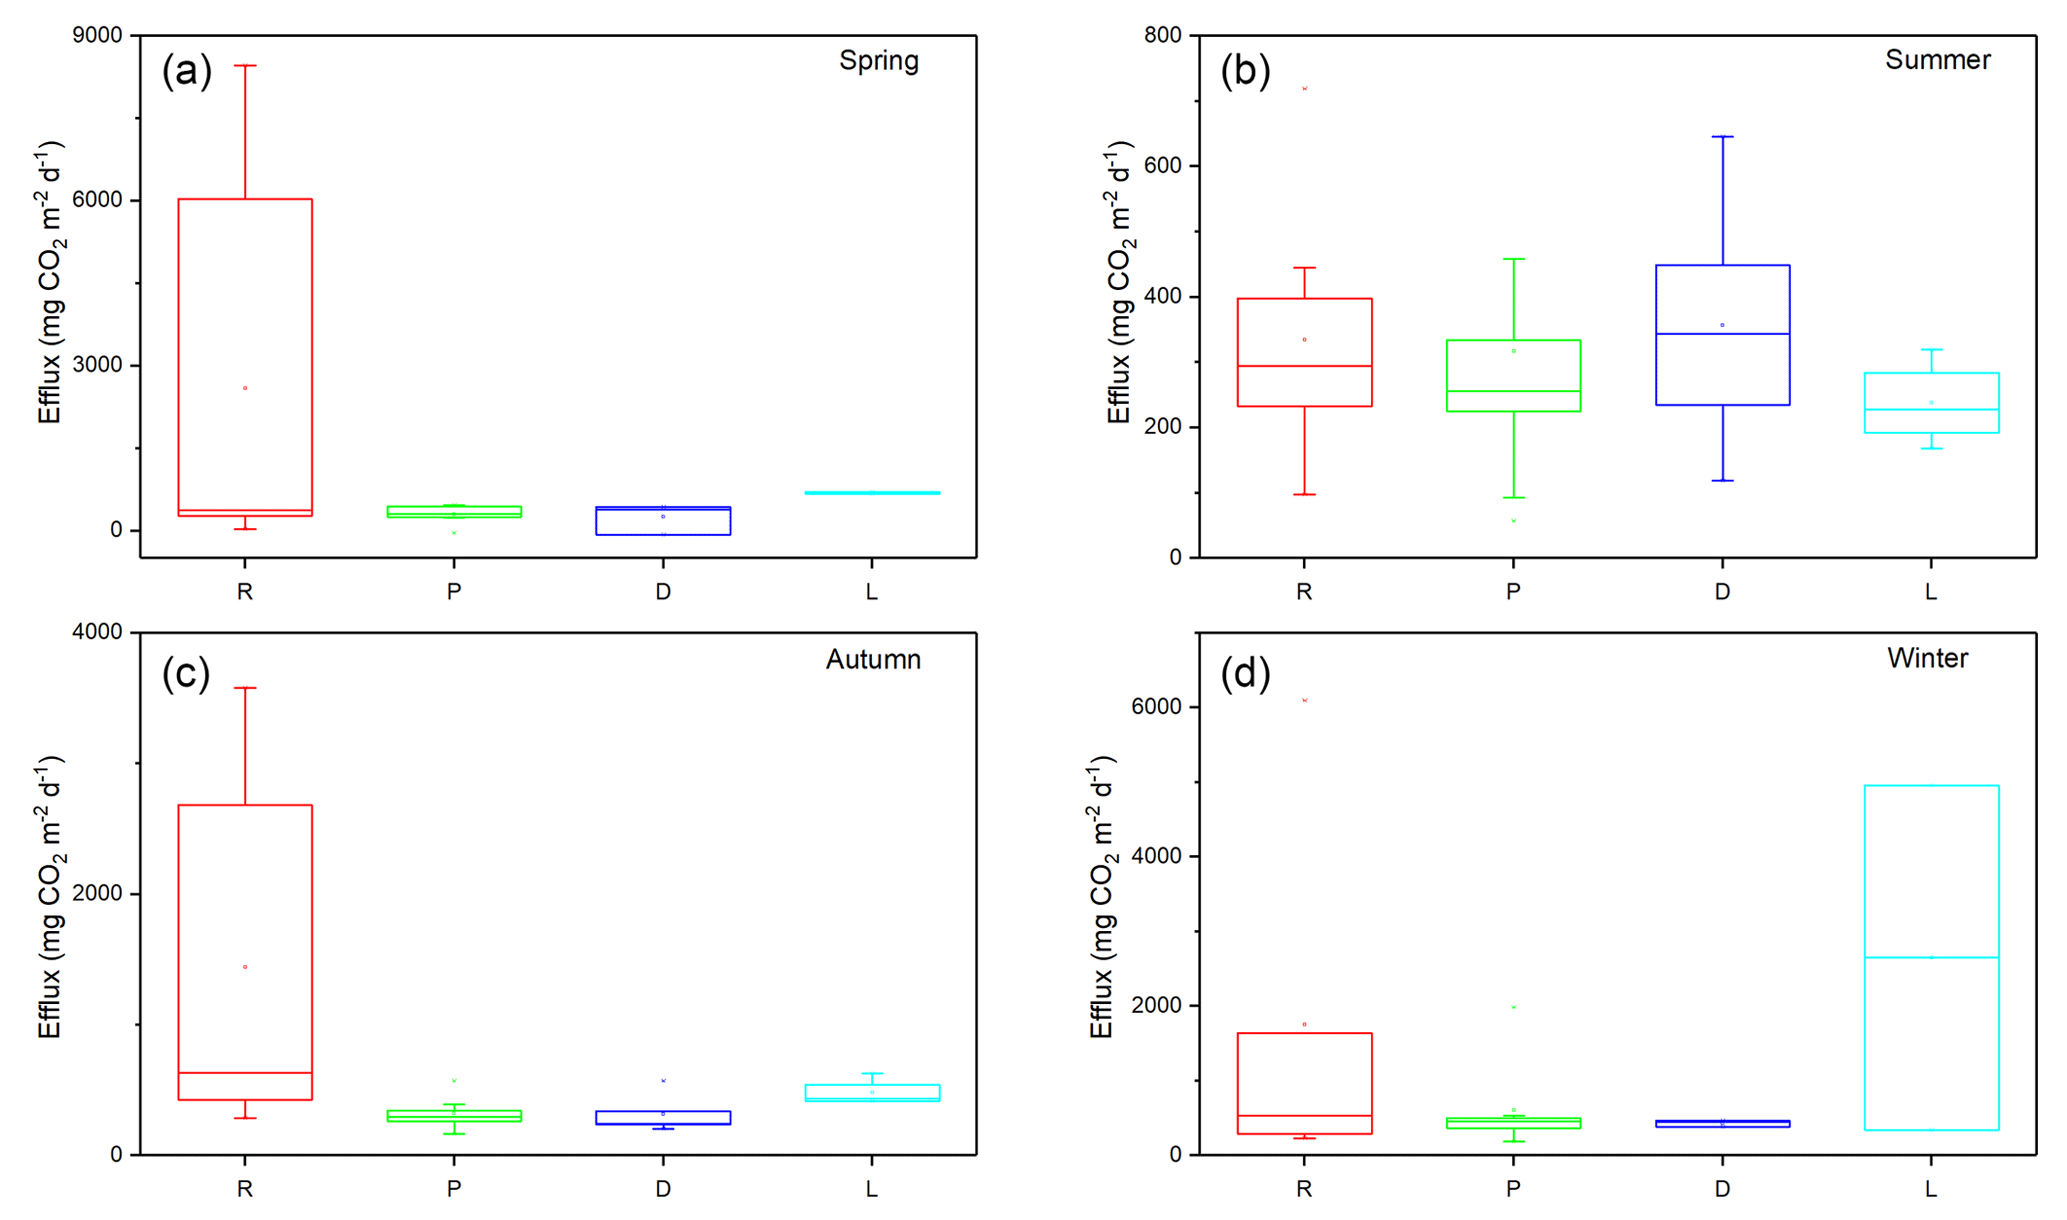
Figure 4Box plots of the measured CO2 effluxes in the spring (a), summer (b), autumn (c) and winter (d). The lower and upper bounds of the box refer to the first and third quartiles, respectively, and the vertical line indicates the 1.5 interquartile range. The points outside the range are considered outliers and are represented by a small cross. The horizontal line refers to the median value while the small squares refer to the average values.
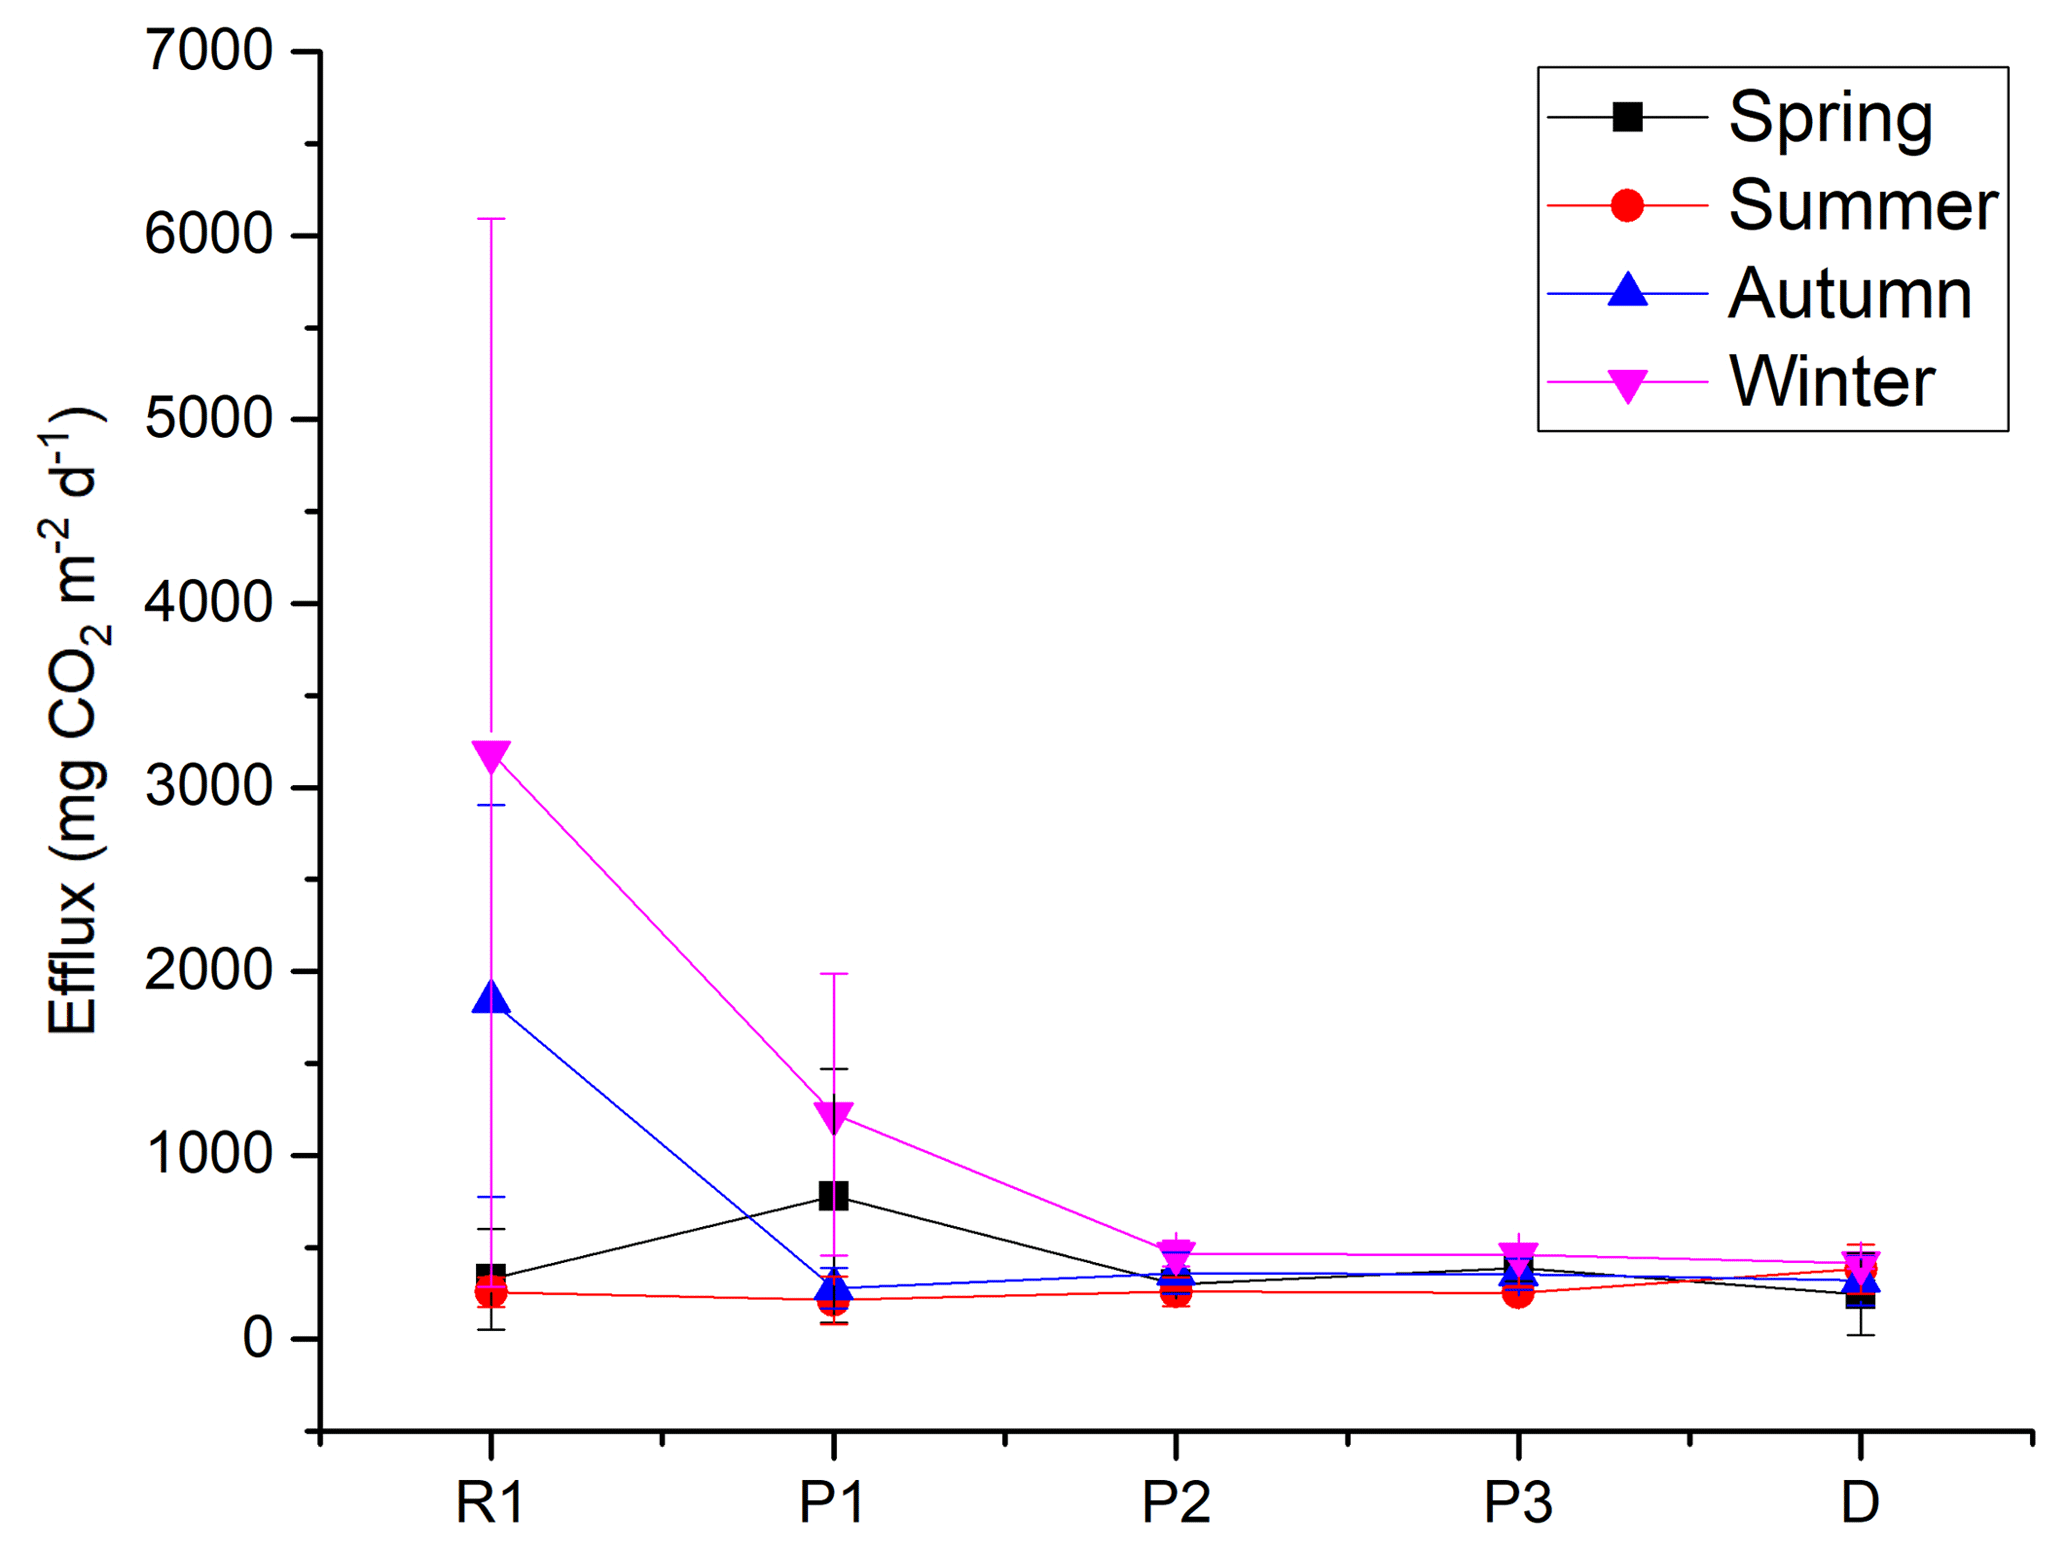
Figure 5Longitudinal variation in effluxes along the main stem in different seasons. The points and error bars refer to mean values and standard deviations, respectively.
Figure 5 displayed a decreasing trend of CO2 efflux toward downstream. The annual efflux from the river channel was 1577 and 905 mg CO2 m−2 d−1 in the main stem and the tributary, respectively, which was significantly higher than that in the reservoir area (p<0.50). The efflux at R1 was very sensitive to the monsoon climate. During the summer the efflux at R1 was no more than 274 mg CO2 m−2 d−1, but it rapidly climbed to 2359 mg CO2 m−2 d−1 at the end of October. The efflux stayed above 6000 mg CO2 m−2 d−1 in the winter and the high rate persisted until the following March. Hence, the difference in efflux between the river and the reservoir was more significant in the dry season than in the wet season.
The average efflux at point D downstream of the dam was similar to that of point P3 (341±158 mg CO2 m−2 d−1), aligned with the results of pCO2 (Fig. 3). The emission rate downstream was higher in the summer and winter but dropped below 300 mg CO2 m−2 d−1 in the spring and oscillated between 200 and 300 mg CO2 m−2 d−1 in the autumn. The low values contradicted the findings for many tropical reservoirs (Abril et al., 2005; Chanudet et al., 2011), but were consistent with the low pCO2 reported for some mountainous reservoirs in eastern China (Zhao et al., 2013). The areal efflux downstream of the dam was consistently lower than that from the epilimnion in the reservoir because degassing could occur when the water passed through the turbine for electricity generation. It suggested that the carbon emission rates downstream of the dam were determined by the position of the water inlet and source layer of the water passing through the turbine.
The littoral zone had the highest emission rates within the reservoir (684±1153 mg CO2 m−2 d−1), although this value was less than one-third of the efflux estimated for the drawdown areas in temperate reservoirs (Aufdenkampe et al., 2011; Li et al., 2015). This was mainly because of the higher pCO2; in autumn the littoral zone had the highest pCO2 and the highest efflux along the reservoir when the water level frequently fluctuated.
3.4 Diurnal variation in CO2 effluxes
In the GGQ water properties exhibited diurnal variations. The water temperature increased from 13:00 to 19:30 but kept decreasing after 22:00. As the air temperature kept decreasing throughout the sampling period, the water was heated before 24:00 and started to lose heat to the atmosphere afterwards. The alkalinity dropped from 15:00 to 19:30 and increased after 20:00. With a mean value of 2904 µg L−1, alkalinity increased slightly in the nighttime. The conductivity varied little with the value ranging from 527.7 to 540.8 µS cm−1. The wind speed was higher in the daytime; the maximum (3.5 m s−1) was recorded at 16:30, while in the nighttime the sampling point was dominated by calm wind conditions.
We also observed a significant diel variation in CO2 efflux (p<0.01). Before 20:00, the efflux was below 400 mg CO2 m−2 d−1, but rose to above 450 mg CO2 m−2 d−1 after 00:30 after midnight. Efflux drastically oscillated from 21:00 to 23:00 between 69 and 712 mg CO2 m−2 d−1. As shown in Fig. 6, the CO2 efflux was 2 times higher in the night (from 19:00 to 07:00: 495±178 mg CO2 m−2 d−1 on average) than in the daytime (from 07:00 to 19:00: 247±171 mg CO2 m−2 d−1 on average). The trend was verified by the discontinuous efflux measurements (Fig. 7); the nocturnal CO2 flux (1012.29±1016.84 mg CO2 m−2 d−1) was higher than the daytime flux (766.87±740.43 mg CO2 m−2 d−1). The efflux was negatively related to air temperature, wind speed and pH, but positively related to conductivity, alkalinity and pCO2 (N=40, p<0.01). The significant relationship between pCO2 and efflux revealed that fluctuation of pCO2 could be an important reason for the diurnal variation in efflux because efflux was largely dependent on the pCO2 gradient between atmosphere and surface water. The pCO2 was also higher at night than that in the daytime, although the difference was insignificant (Fig. 6, p>0.50). The insignificant variation in pCO2 might be attributed to the alkaline environment in the GGQ. High pH (8.22±0.06) and its small variation kept the pCO2 at a low level and limited the variability in pCO2. Thus higher efflux and pCO2 at night might result from dominated respiration in the surface water when light was unavailable for photosynthesis, which was also commonly found in other reservoirs (Liu et al., 2016a; Peng et al., 2012; Schelker et al., 2016).

Figure 6Diurnal variation in the water environment (including conductivity, pH, water temperature and total alkalinity), atmospheric environment (air temperature and wind speed) pCO2 and efflux.

Figure 7Comparison of effluxes between daytime and night via continuous samples (first two boxes) and discontinuous samples (last two boxes). The lower and upper bounds of the boxes refer to the first and third quartiles, respectively, and the vertical line indicates the 1.5 interquartile range. The points outside the range ar considered outliers and are represented by a small cross. Horizontal line refers to the median value while the small squares refer to the average values.
4.1 Damming effect on carbon effluxes in the upper Mekong River
In this study, the CO2 emission rates of the 4-year-old reservoir were low and comparable to those of natural lakes (Xing et al., 2005; Wang et al., 2003). Even in the river channel, the highest effluxes were close to the effluxes from temperate reservoirs (Huttunen et al., 2002) and much lower than those from tropical reservoirs (Abril et al., 2005; Fearnside, 1997; Guérin et al., 2006). There were multiple reasons for the low carbon effluxes. First, the upper Mekong River drains through the Tibetan Plateau and flows within a narrow valley before it reaches the GGQ. Because of poor vegetation in the catchment and intense precipitation during the rainy season, the catchment could not sustain fertile soil or provide abundant OC for decomposition even in the wet seasons. A shortage of substrates for mineralization limited the production of carbon dioxide.
Secondly, damming the river greatly extended the water retention time and the riverine ecosystem gradually evolved into a limnetic ecosystem (Thornton et al., 1990). The extended water retention time in the pelagic zone of reservoirs was suitable for the development of phytoplankton communities. When light and temperature were favourable, intense photosynthesis consumed the CO2 dissolved in surface water and lowered the emission rates (Yu et al., 2009). In extreme cases like algae bloom, the surface water tended to absorb CO2 from the atmosphere (Pacheco et al., 2014). Thus, the valley-type reservoir exhibited a decreasing trend from the river toward the dam in the pCO2 and the outgassing rates (Liu et al., 2009, 2014; Mei et al., 2011). Anthropogenic nutrient input could accelerate the process of eutrophication. With abundant nitrogen and phosphorous input from sewage, the outgassing rates could be decreased to a level as low as in natural lakes or even turned negative (Guo et al., 2011; Ran et al., 2011). The effluxes from the GGQ displayed a negative relation with the water temperature (p<0.01, Fig. 8). The negative relation deviated from the traditional pattern where a warmer climate accelerated bacterial respiration (Åberg et al., 2010; Del Giorgio and Williams, 2005) and decreased the solubility of carbon dioxide, thus enhancing the effluxes. This deviation suggested that a warmer climate could also reduce the CO2 emissions via accelerated photosynthesis.

Figure 8Negative correlations between water temperature and effluxes in the pelagic zone (a, p<0.01) and in the littoral zone (b, p>0.05). Notice that two extreme values were excluded in the linear regression in panel (b).
The seasonal variation in efflux in the pelagic area, however, was less significant (p>0.05) than the variation in the riverine sites of points R1 and R2 (p<0.01). The riverine inlets of the reservoir were identified as a hotspot of CO2 emission in the dry season (from November to April), where the extremely high emission rates were distinguished from the pelagic area (p<0.01). In some large valley-type reservoirs, rainfall brought plenty of OC and increased flow velocity, fuelling CO2 emissions at the main stem channels in the wet season (Li and Zhang, 2014; Zhao et al., 2013). Yet in this case the effluxes at the riverine points were negatively related to the water discharge (Fig. 9), water temperature, and nutrient concentration (Table S1 in the Supplement), suggesting that higher emissions could happen at a lower flow velocity and these colder conditions (Figs. 8, 9).
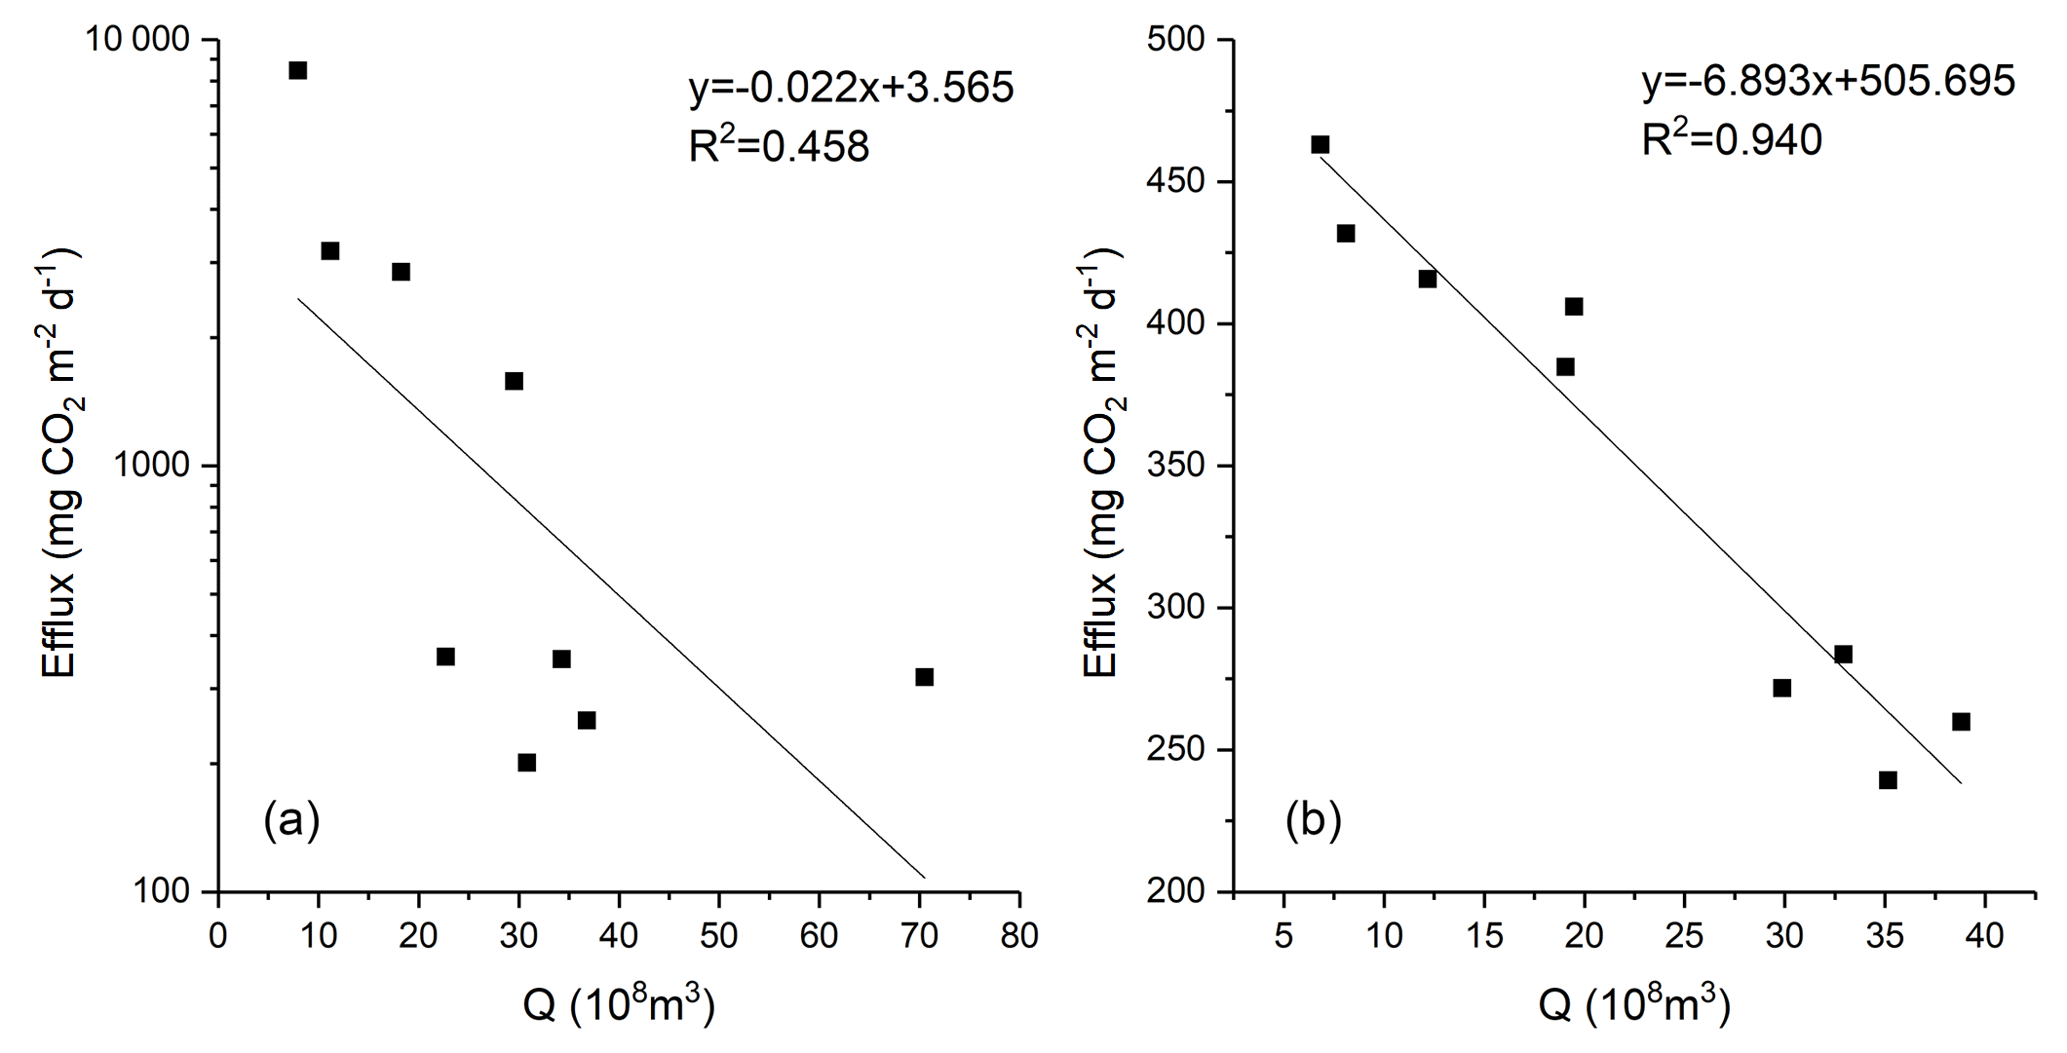
Figure 9The negative correlation between water discharge and CO2 efflux at the riverine inlet (R1, a, p<0.01) and outlet (D, b, p<0.01).
This abnormal results could be explained by different mixing modes occurring at the riverine points when the inflow joined the reservoir, which could be represented by the differences in physical properties like temperature and turbidity (Summerfield, 1991). As shown in Fig. 10, the inlets had higher effluxes when the inflow water was warmer and contained less suspended sediment than the receiving waterbody. It was suggested that the seasonal variation in effluxes was regulated by both flow mixing modes and reservoir management (Striegl and Michmerhuizen, 1998). Even though in the rainy season intense precipitation could bring plenty of sediment with organic matter, the turbid water might be discharged directly downstream for electricity, because of the relatively small storage capacity of the reservoir. The inflow water with high sediment concentration was heavier and colder than the reservoir water, thus it plunged into the water column in the reservoir and became an underflow (hyperpycnal flow, Fig. 10; Summerfield, 1991). The reservoir surface was less affected by the underflow and maintained a relatively low emission rate (Pacheco et al., 2015) as continuous water discharging allowed little time for the mineralization of OC (Assireu et al., 2011; Şentürk, 1994), in spite of the high flow velocity. However, in the dry season the clean inflow water was lighter and warmer than the reservoir water, and thus it joined the reservoir as surface flow (hypopycnal flow, Fig. 10; Summerfield, 1991). The data in Fig. 3 showed that the inflow water in the winter (the dry season) was also richer in CO2 than the turbid inflow in the summer (the wet season). When the water rich in CO2 contacted the atmosphere directly, the gases directly diffused into the air. Because the water kept losing CO2 to the atmosphere, the decreasing trend in effluxes toward downstream was more significant in the winter (Fig. 5).
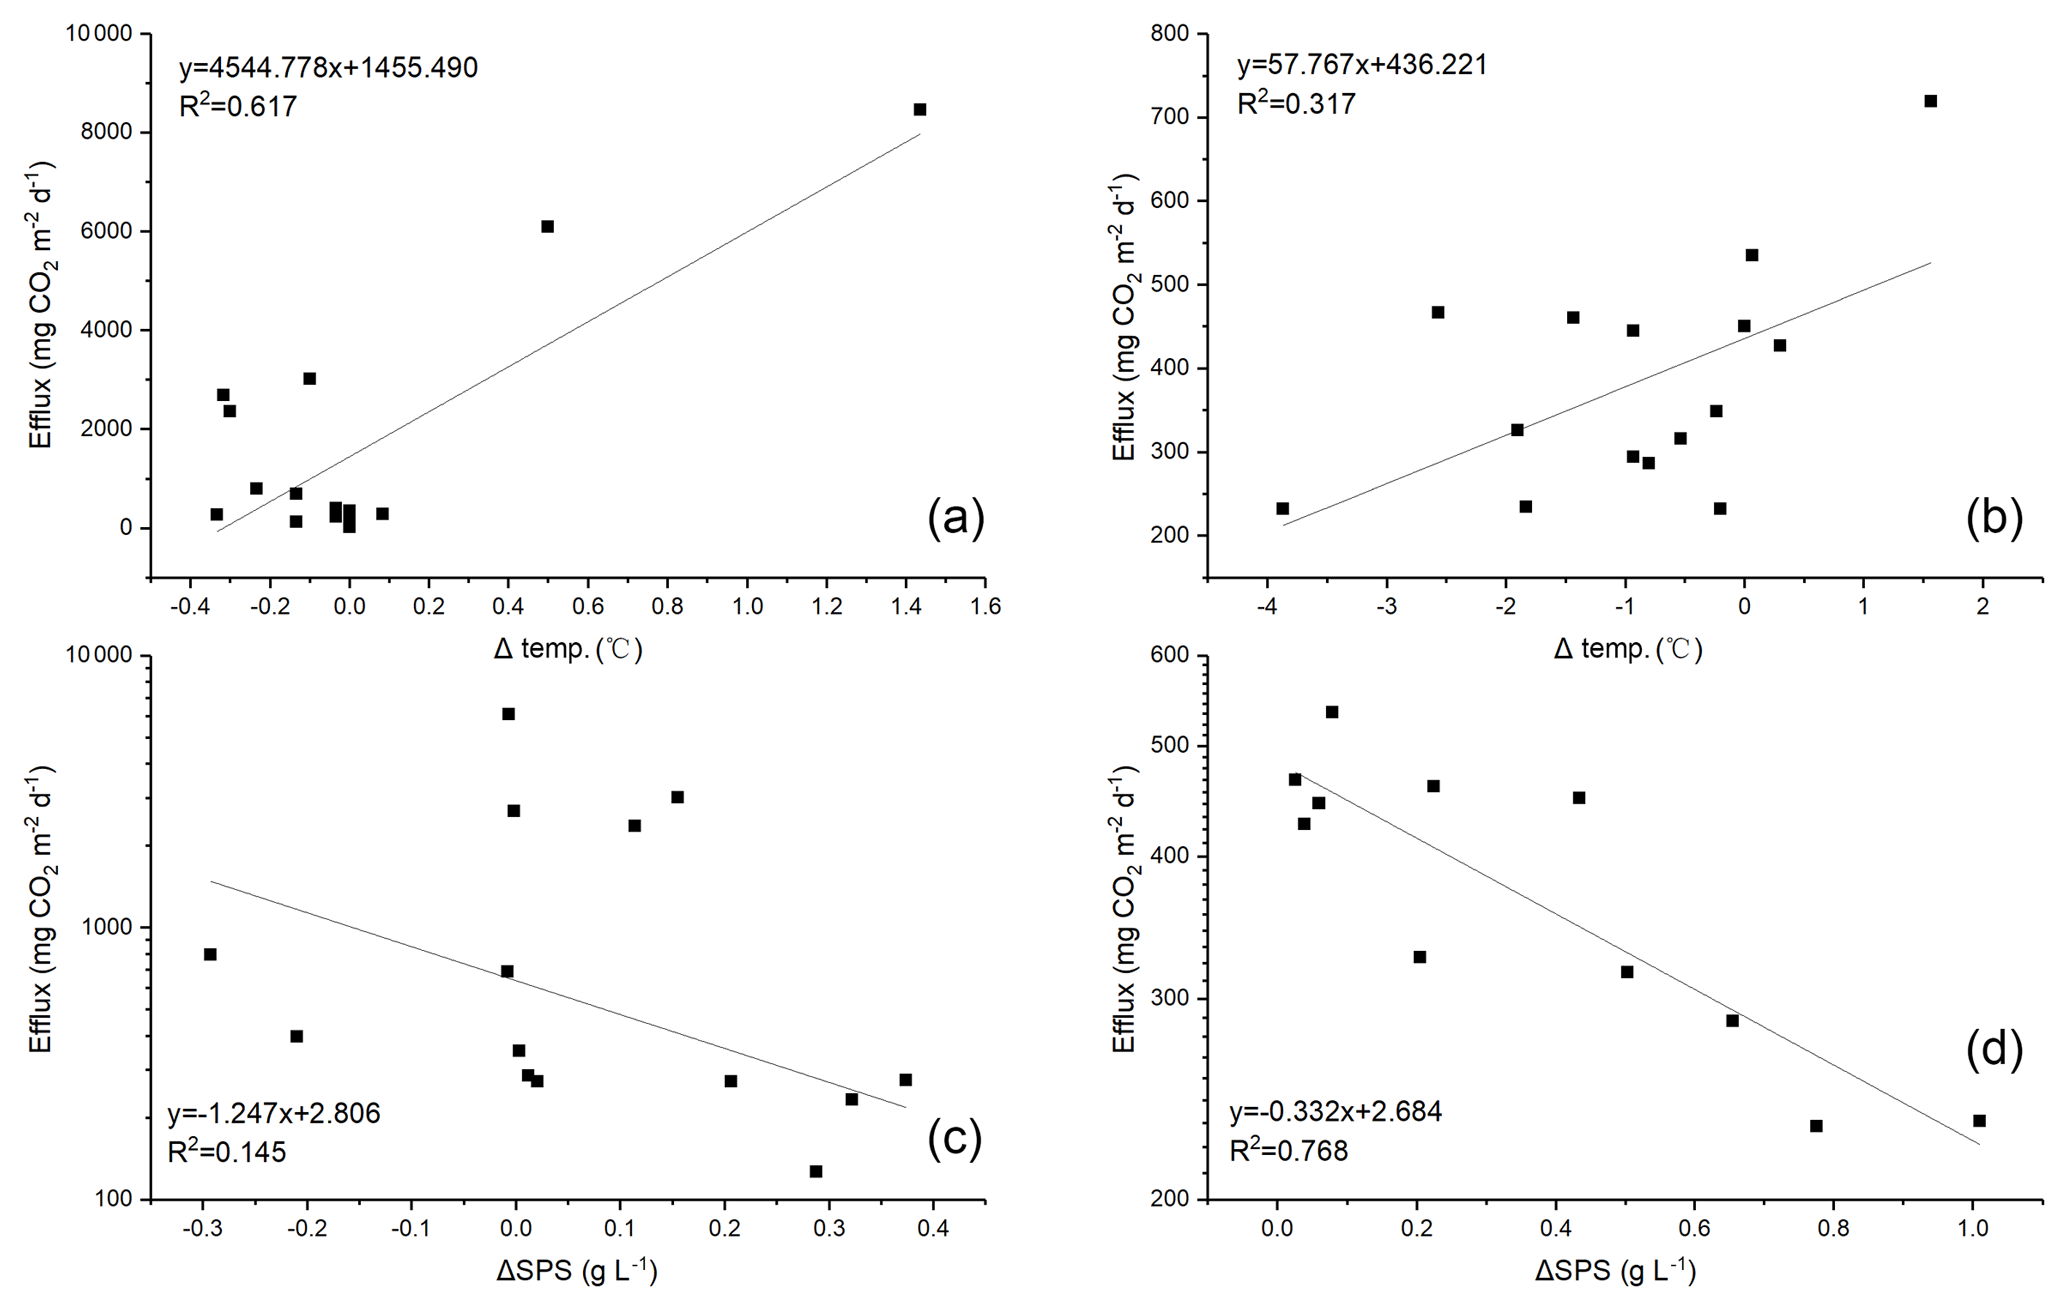
Figure 10Positive correlations between water temperature gradient (TR1-P1 or TR2-P4) and measured effluxes at points R1 (a, p<0.01) and R2 (b, p<0.05), and the negative correlations between suspended sediment (SPS) concentration gradient (SPS R1-P1 or SPS R2-P4) and measured effluxes at R1 (c, p<0.01) and R2 (d, p<0.01). The gradient in water temperature and SPS concentration reflects the difference of properties between inflow and receiving waterbody and determines the mixing mode. Colder and more turbid inflow has a higher density than the receiving water and thus forms an underflow or subsurface flow (hyperpycnal flow). When the inflow was warmer, clearer and lighter than the receiving waterbody, the inflow can form a surface flow (hypopycnal flow) and flow over the reservoir surface, releasing allochthonous carbon to the atmosphere.
Due to this difference in physical mixing modes and availability of CO2, the surface water tended to release more CO2 in the dry season when both inflow and reservoir water became colder (Fig. 4). It was likely that the underflow in the rainy season also mixed and aerated the water in the reservoir and thus impeded the formation of stratification. The efflux in the downstream part was restricted and showed a similar seasonal variation to the reservoir surface water. During stratification, the downstream river channel could have released substantial CO2 amounts if the water from hypolimnion was used to generate electricity (Abril et al., 2005; Guérin et al., 2006; Wang et al., 2011).
The littoral zone (or drawdown area) displayed much higher effluxes than the pelagic zone, especially in the autumn and winter. The littoral zone had often been identified as a hotspot of carbon emission (Chen et al., 2009; Yang et al., 2012; Yang, 2011) since seasonal flooding could trigger anaerobic decomposition of dead macrophytes and produced GHGs. In this case, it was believed that the frequent fluctuation of water level deposited a large amount of sediment as well as deadwood on the relatively flat littoral zones. The decomposition of deadwood tended to release organic acids to the water and lowered the pH. As a result, the pCO2 rose and more gases were degassed out of the air–water interface. Furthermore, nutrient inputs and reduced turbidity facilitated growth of plants and macrophytes (Thornton et al., 1990) and enhanced respiration and CO2 outgassing (Xu, 2013; Fig. S2).
4.2 Extrapolation of the results and implication for future studies
The effluxes from the pelagic zone and from the littoral zone were 352±587 and 684±1153 mg CO2 m−2 d−1, respectively. Assuming the water level fluctuated frequently within 2.5 m and the slope at the bank was 45∘, the drawdown area covered an area of 1.81×10⁵ m2. Hence the littoral zone could contribute 22.59±38.09 t CO2 yr−1 to the atmosphere, assuming it would be flooded for half of the year. We estimated that the permanent flooded area was 5 643 000 m2 in the GGQ and the carbon dioxide evading from this area was 725.01±1209.04 t CO2 yr−1. Compared with the estimated emission, the contribution from the littoral zone was actually negligible for its small area. However, if taking the diurnal variation into account, the annual carbon evasion reached to 1121.41±1209.64 t CO2 yr−1 as nocturnal effluxes were twice the emission in the daytime. Considering its efficiency, the reservoir released 0.28±0.30 kg CO2 MW h−1 when generating hydroelectricity. This estimation was close to the lower bound of the range (0.2∼1994 kg CO2 MW h−1) estimated by Räsänen et al. (2018). However, it must be noted that the CO2 efflux would decrease as the reservoir ages (Abril et al., 2005; Barros et al., 2011). Accelerated eutrophication could possibly fix more CO2 via photosynthesis (Liu et al., 2009).
Several problems have been noticed when computing the annual emission rate from the GGQ. Despite its higher efflux, the drawdown area was negligible although the effluxes from global reservoirs always displayed high spatial heterogeneity (Barros et al., 2011; Roland et al., 2010; Teodoru et al., 2011). On a larger scale, the seasonal variation was also negligible as the efflux in the dry season was only 103 mg CO2 m−2 d−1 higher than in the rainy season. However, the higher effluxes in the nighttime must be taken into consideration. Measurement of the effluxes from the reservoir surface was usually limited by the pCO2 samples collected in the daytime and failed to capture a diurnal variation, though this variation has been fully recognized by a series of studies (Liu et al., 2016a; Peng et al., 2012; Schelker et al., 2016).
The sediment deposition must also be considered when computing the long-term effect of reservoir on the carbon cycle. As the uppermost reservoir along the Lancang River cascades, the GGQ also sequestered most of the sediment from the upstream catchments (Gao et al., 2017; Wang et al., 2011). It is likely that the reservoir cannot be maintained for 100 years due to the heavy silting problem (Fu and He, 2007), even though the sediment concentration has decreased drastically after the upstream Miaowei Dam was completed, enabling the reservoir to bury tons of OC (Mendonça et al., 2012b; Mulholland and Elwood, 1982; Vörösmarty et al., 2003). Meanwhile, the reservoirs could also sequester the nutrients in the rivers (Maavara et al., 2017, 2015). Therefore, in order to evaluate the net effect of impoundments on the carbon cycle, we need to quantify the OC burial within the reservoir and finally build up a robust carbon budget.
The surface water of the GGQ was supersaturated with CO2 and the reservoir was a carbon source to the atmosphere. We estimated that the reservoir released 1121.41±1209.64 t of CO2 to the atmosphere annually. The efflux from the reservoir area was 408±337 and 305±262 mg CO2 m−2 d−1 in the dry season and rainy season, respectively, while the river channel exhibited an efflux of 2168±2547 and 374±184 mg CO2 m−2 d−1 in the two seasons. The CO2 emission from the pelagic zone was limited due to little allochthonous OC input and photosynthetic uptake. Seasonal variation in efflux in the reservoir was subject to the variation in temperature, with lower emission rates occurring in the warmer wet season (May to October) owing to enhanced photosynthesis. Emissions downstream of the dam were also limited as surface water was used for generating electricity. However, the littoral zone suffering frequent flooding and draining was identified as a potential hotspot of CO2 emissions, even though its contribution to the total annual emission was limited due to its small area. The flat topography and daily flooding could lead to accumulation of deadwood and acidification of water, aerate the water and enhance the respiration rate.
This study also highlighted the high emission rates at the river inlets during the colder dry season. The negative relation between efflux and water discharge implied that the mixing modes could be the dominant factor controlling CO2 emissions. In the winter, because inflow was warmer, clearer and lighter than the receiving waterbody, the gas carried by inflow could be more easily released to the atmosphere as the river joined the reservoir as an overflow. Additionally, extended water retention time was also beneficial for decomposition of allochthonous DOC and produced more carbon dioxide. In the wet season, when the inflow plunged into the reservoir, the underflow could be discharged directly to the downstream and left insufficient time for the mineralization of DOC. The physical factors could be an important aspect controlling the CO2 emissions besides the biological factors for hydroelectric reservoirs where the hydrological conditions were regulated by climate and artificial operation. Yet in a daily cycle, the biological factors could cause significant diel variation, as emissions could be offset by carbon absorption via photosynthesis. The total emission from the GGQ increased by half when taking the nocturnal effluxes into account. Hence, the efflux measured in the daytime must be carefully integrated when estimating the total carbon emissions from a reservoir. In this study, the damming effect on the CO2 emission from the waterbody was moderate; but for an overall effect on carbon transportation, a robust carbon budget is required in which the carbon burial in sediment must also be quantified.
The data used in this study can be requested from the corresponding author.
The supplement related to this article is available online at: https://doi.org/10.5194/bg-16-2205-2019-supplement.
All authors contributed significantly to this work. LL and XL conceived the study. LL and KF collected and prepared the data. LL prepared the manuscript. XL, SL and SYL contributed to the writing.
The authors declare that they have no conflict of interest.
This article is part of the special issue “Human impacts on carbon fluxes in Asian river systems”. It is not associated with a conference.
The research reported here has received funding from the National Natural Science
Foundation of China (grant nos. 91547110; 41571032) and financial support from the
National University of Singapore (grant nos. R-109-000-191-646;
R-109-000-227-115).
Edited by: David Butman
Reviewed by: two anonymous referees
Åberg, J., Jansson, M., and Jonsson, A.: Importance of water temperature and thermal stratification dynamics for temporal variation of surface water CO2 in a boreal lake, J. Geophys. Res., 115, G02024, https://doi.org/10.1029/2009JG001085, 2010.
Abril, G., Guérin, F., Richard, S., Delmas, R., Galy-Lacaux, C., Gosse, P., Tremblay, A., Varfalvy, L., Dos Santos, M. A., and Matvienko, B.: Carbon dioxide and methane emissions and the carbon budget of a 10-year old tropical reservoir (Petit Saut, French Guiana), Global Biogeochem. Cy., 19, GB4007, https://doi.org/10.1029/2005GB002457, 2005.
Assireu, A. T., Alcântara, E., Novo, E. M. L. M., Roland, F., Pacheco, F. S., Stech, J. L., and Lorenzzetti, J. A.: Hydro-physical processes at the plunge point: an analysis using satellite and in situ data, Hydrol. Earth Syst. Sci., 15, 3689–3700, https://doi.org/10.5194/hess-15-3689-2011, 2011.
Aufdenkampe, A. K., Mayorga, E., Raymond, P. A., Melack, J. M., Doney, S. C., Alin, S. R., Aalto, R. E., and Yoo, K.: Riverine coupling of biogeochemical cycles between land, oceans, and atmosphere, Front. Ecol. Environ., 9, 53–60, 2011.
Barros, N., Cole, J. J., Tranvik, L. J., Prairie, Y. T., Bastviken, D., Huszar, V. L. M., del Giorgio, P., and Roland, F.: Carbon emission from hydroelectric reservoirs linked to reservoir age and latitude, Nat. Geosci., 4, 593–596, 2011.
Battin, T. J., Luyssaert, S., Kaplan, L. A., Aufdenkampe, A. K., Richter, A., and Tranvik, L. J.: The boundless carbon cycle, Nat. Geosci., 2, 598–600, 2009.
Chanudet, V., Desloux, S., Harby, A., Sundt, H., Hansen, B. H., Brakstad, O., Serca, D., and Guerin, F.: Gross CO2 and CH4 emissions from the Nam Ngum and Nam Leuk sub-tropical reservoirs in Lao PDR, Sci. Total Environ., 409, 5382–5391, 2011.
Chen, H., Wu, Y., Yuan, X., Gao, Y., Wu, N., and Zhu, D.: Methane emissions from newly created marshes in the drawdown area of the Three Gorges Reservoir, J. Geophys. Res., 114, D18301, https://doi.org/10.1029/2009JD012410, 2009.
Cole, J. J., Caraco, N. F., Kling, G. W., and Kratz, T. K.: Carbon dioxide supersaturation in the surface waters of lakes, Science, 265, 1568–1570, 1994.
Cole, J. J., Prairie, Y. T., Caraco, N. F., McDowell, W. H., Tranvik, L. J., Striegl, R. G., Duarte, C. M., Kortelainen, P., Downing, J. A., Middelburg, J. J., Melack, J., and Middelburg, J. J.: Plumbing the global carbon cycle: integrating inland waters into the terrestrial carbon budget, Ecosystems, 10, 172–185, 2007.
Deemer, B. R., Harrison, J. A., Li, S., Beaulieu, J. J., DelSontro, T., Barros, N., Bezerra-Neto, J. F., Powers, S. M., dos Santos, M. A., and Vonk, J. A.: Greenhouse gas emissions from reservoir water surfaces: a new global synthesis, BioScience, 66, 949–964, 2016.
Del Giorgio, P. A. and Williams, P. J. le B.: Respiration in aquatic ecosystems, Oxford University Press, USA, 2005.
Demarty, M. and Bastien, J.: GHG emissions from hydroelectric reservoirs in tropical and equatorial regions: Review of 20 years of CH4 emission measurements, Energ. Policy, 39, 4197–4206, 2011.
Fearnside, P. M.: Greenhouse-gas emissions from Amazonian hydroelectric reservoirs: The example of Brazil's Tucuruí Dam as compared to fossil fuel alternatives, Environ. Conserv., 24, 64–75, 1997.
Fu, K. and He, D.: Analysis and prediction of sediment trapping efficiencies of the reservoirs in the mainstreamof the Lancang River, Chinese Science Bulletin, 52, 134–140, 2007.
Gao, Q., Tao, Z., Zhang, S., Xie, C., Lin, P., and Mao, H.: The Damming Effects on the Dynamics of Riverine Carbon in a Mountainous River: A Case Study in the Zengjiang River, South China, Quaternary Science, 37, 331–342, 2017.
Guérin, F., Abril, G., Richard, S., Burban, B., Reynouard, C., Seyler, P., and Delmas, R.: Methane and carbon dioxide emissions from tropical reservoirs: significance of downstream rivers, Geophys. Res. Lett., 33, 2006.
Guo, J., Jiang, T., Li, Z., Chen, Y., and Sun, Z.: Analysis on partial pressure of CO2 and influencing factors during spring phytoplankton bloom in the backwater area of Xiaojiang River in Three Gorges Reservoir, Advances in Water Science, 22, 829–838, 2011.
He, D. and Tang, Q.: Chinese International Rivers, Science Press, Beijing, China, 2000.
Holgerson, M. A. and Raymond, P. A.: Large contribution to inland water CO2 and CH4 emissions from very small ponds, Nat. Geosci., 9, 222–226, https://doi.org/10.1038/ngeo2654, 2016.
Hu, H.: Geological Hazard Risk Study of the Gongguoqiao Hydropower Station, Master, Lanzhou Univeristy, 2010.
Hu, Y. and Cheng, H.: The urgency of assessing the greenhouse gas budgets of hydroelectric reservoirs in China, Nat. Clim. Change, 3, 708–712, 2013.
Huttunen, J. T., Väisänen, T. S., Hellsten, S. K., Heikkinen, M., Nykänen, H., Jungner, H., Niskanen, A., Virtanen, M. O., Lindqvist, O. V., Nenonen, O., and Martikainen, P. J.: Fluxes of CH4, CO2, and N2O in hydroelectric reservoirs Lokka and Porttipahta in the northern boreal zone in Finland, Global Biogeochem. Cy., 16, 3-1–3-17, 2002.
Jiang, T., Guo, J., Li, Z., Fang, F., Bai, L., and Liu, J.: Air-Water Surface Greenhouse Gas Flux in Pengxi River at Different Operational Stages of the Three Gorges Reservoir, Environmental. Sci., 33, 1463–1470, 2012.
Kelly, C. A., Rudd, J. W., St Louis, V. L., and Moore, T.: Turning attention to reservoir surfaces, a neglected area in greenhouse studies, Eos T. Am. Geophys. Un., 75, 332–333, 1994.
Lehner, B. and Döll, P.: Development and validation of a global database of lakes, reservoirs and wetlands, J. Hydrol., 296, 1–22, 2004.
Lewis, E. and Wallace, D. W. R.: Program developed for CO2 system calculations, ORNL/CDIAC-105, Carbon Dioxide Information Analysis Center, Oak Ridge National Laboratory, U.S., 1998.
Li, S. and Zhang, Q.: Partial pressure of CO2 and CO2 emission in a monsoon-driven hydroelectric reservoir (Danjiangkou Reservoir), China, Ecol. Eng., 71, 401–414, 2014.
Li, S., Zhang, Q., Bush, R. T., and Sullivan, L. A.: Methane and CO2 emissions from China's hydroelectric reservoirs: a new quantitative synthesis, Environ. Sci. Pollut. R., 22, 5325–5339, 2015.
Li, S. Y., Lu, X. X., and Bush, R. T.: CO2 partial pressure and CO2 emission in the Lower Mekong River, J. Hydrol., 504, 40–56, 2013.
Liu, C., Wang, F., Wang, Y., and Wang, B. Response of Aquatic Environment to River Damming, Resources and Environment in the Yangtze Basin, 18, 384–396, 2009.
Liu, H., Zhang, Q., Katul, G. G., Cole, J. J., Chapin III, F. S., and MacIntyre, S.: Large CO2 effluxes at night and during synoptic weather events significantly contribute to CO2 emissions from a reservoir, Environ. Res. Lett., 11, 064001, https://doi.org/10.1088/1748-9326/11/6/064001, 2016a.
Liu, S. D., Lu, X. X., Xia, X. H., Zhang, S. R., Ran, L. S., and Yang, X. K.: Dynamic. biogeochemical controls on river pCO2 and recent changes under aggravating river impoundment: an example of the subtropical Yangtze River, Global Biogeochem. Cy., 30, 880–897, https://doi.org/10.1002/2016GB005388, 2016b.
Liu, S. D., Lu, X X., Xia, X., Yang, X., and Ran, L.: Hydrological and geomorphological control on CO2 outgassing from low-gradient large rivers: An example of the Yangtze River system, J. Hydrol., 550, 26–41, 2017.
Liu, W., Pu, J.-B., Yu, S., Zhang, C., Au, Y.-Y., Yuan, D.-X., Yang, H., and Tang, W.: Preliminary Research on the Feature of Dissolved Inorganic Carbon in Wulixia Reservoir in Summer, Guangxi, China, Environmental Science, 35, 2959–2966, 2014 (in Chinese).
Lu, X. X. and Siew, R. Y.: Water discharge and sediment flux changes over the past decades in the Lower Mekong River: possible impacts of the Chinese dams, Hydrol. Earth Syst. Sci., 10, 181–195, https://doi.org/10.5194/hess-10-181-2006, 2006.
Lu, X. X., Li, S., Kummu, M., Padawangi, R., and Wang, J. J.: Observed changes in the water flow at Chiang Saen in the lower Mekong: Impacts of Chinese dams?, Quatern. Int., 336, 145–157, 2014.
Maavara, T., Parsons, C. T., Ridenour, C., Stojanovic, S., Dürr, H. H., Powley, H. R., and Van Cappellen, P.: Global phosphorus retention by river damming, P. Natl. Acad. Sci. USA, 112, 15603–15608, 2015.
Maavara, T., Lauerwald, R., Regnier, P., and Van Cappellen, P.: Global perturbation of organic carbon cycling by river damming, Nat. Commun., 8, 15347, https://doi.org/10.1038/ncomms15347, 2017.
Mei, H., Wang, F., Yao, C., and Wang, B.: Diffusion Flux of Partial Pressure of Dissolved Carbon Dioxide in Wanan Reservoir in Spring, Environm. Sci., 32, 58–63, 2011.
Mendonça, R., Barros, N., Vidal, L. O., Pacheco, F., Kosten, S., and Roland, F.: Greenhouse Gas Emissions from Hydroelectric Reservoirs: What Knowledge Do We Have and What is Lacking?, in: Greenhouse Gases – Emission, Measurement and Management, edited by: Liu, G., InTech, available at: https://www.intechopen.com/download/pdf/32342 (last access: 14 March 2019), 2012a.
Mendonça, R., Kosten, S., Sobek, S., Barros, N., Cole, J. J., Tranvik, L., and Roland, F.: Hydroelectric carbon sequestration, Nat. Geosci., 5, 838–840, 2012b.
MEP (Ministry of Environmental Protection of People's Republic of China): GB11893-89, in: Water Quality-Determination of total phosphorous: Ammonium molybdate spectrophotometric method, Standards Press of China, Beijing, 1989.
MEP (Ministry of Environmental Protection of People's Republic of China): HJ636-2012, in: Water Quality-Determination of total nitrogen: Alkaline potassium persiflage digestion – UV spectrometric method, Standards Press of China, Beijing, 2012.
Mulholland, P. J. and Elwood, J. W.: The role of lake and reservoir sediments as sinks in the perturbed global carbon cycle, Tellus, 34, 490–499, 1982.
Pacheco, F. S., Roland, F., and Downing, J. A.: Eutrophication reverses whole-lake carbon budgets, Inland waters, 4, 41–48, https://doi.org/10.5268/IW-4.1.614, 2014.
Pacheco, F. S., Soares, M. C. S., Assireu, A. T., Curtarelli, M. P., Roland, F., Abril, G., Stech, J. L., Alvalá, P. C., and Ometto, J. P.: The effects of river inflow and retention time on the spatial heterogeneity of chlorophyll and water–air CO2 fluxes in a tropical hydropower reservoir, Biogeosciences, 12, 147–162, https://doi.org/10.5194/bg-12-147-2015, 2015.
Peng, X., Wang, B., Liu, C., Liu, X., and Wang, F.: Diurnal variations of pCO2 in relation to environmental factors in the cascade reservoirs along the Wujiang River, China, Chinese Journal of Geochemistry, 31, 41–47, 2012.
Qu, B., Aho, K. S., Li, C., Kang, S., Sillanpää, M., Yan, F., and Raymond, P. A.: Greenhouse gases emissions in rivers of the Tibetan Plateau, Scientific Reports, 7, 16573, https://doi.org/10.1038/s41598-017-16552-6, 2017.
Ran, J., Lin, C., Guo, J., Chen, Y., and Jiang, T.: Spatial and temporal variation of carbon dioxide partial pressure over the Xiaojiang River backwater area of the Three Gorges Reservoir, Resource and Environment in the Yangtze Basin, 20, 976–982, 2011.
Ran, L., Tian, M., Fang, N., Wang, S., Lu, X., Yang, X., and Cho, F.: Riverine carbon export in the arid to semiarid Wuding River catchment on the Chinese Loess Plateau, Biogeosciences, 15, 3857–3871, https://doi.org/10.5194/bg-15-3857-2018, 2018.
Ran, L. S., Li, L., Tian, M., Yang, X., Yu, R., Zhao, J., Wang, L., and Lu, X. X.: Riverine CO2 emissions in the Wuding River catchment on the Loess Plateau: Environmental controls and dam impoundment impact, J. Geophys. Res.-Biogeo., 122, 1439–1455, 2017.
Räsänen, T. A., Varis, O., Scherer, L., and Kummu, M.: Greenhouse gas emissions of hydropower in the Mekong River Basin, Environ. Res. Lett., 13, 034030, https://doi.org/10.1088/1748-9326/aaa817, 2018.
Raymond, P. A., Hartmann, J., Lauerwald, R., Sobek, S., McDonald, C., Hoover, M., Butman, D., Striegl, R., Mayorga, E., Humborg, C., Kortelainen, P., Dürr, H., Meybeck, M., Ciais, P., and Guth, P.: Global carbon dioxide emissions from inland waters, Nature, 503, 355–359, 2013.
Regnier, P., Andersson, A. J., Arndt, S., Arnosti, C., Borges, A. V., Dale, A. W., Gallego-Sala, A., Goddéris, Y.,Goossens, N., Hartmann, J., Heinze, C., Ilyina, T., Joos, F., LaRowe, D. E., Leifeld, J., Meysman, F. J. R., Munhoven, G., Raymond, P. A., Spahni, R., Suntharalingam, P., and Thullner, M.: Anthropogenic perturbation of the carbon fluxes from land to ocean, Nature Geoscience, 6, 597–607, https://doi.org/10.1038/ngeo1830, 2013.
Roland, F., Vidal, L. O., Pacheco, F. S., Barros, N. O., Assireu, A., Ometto, J. P. H. B., Cimbleris, A. C. P., and Cole, J. J.: Variability of carbon dioxide flux from tropical (Cerrado) hydroelectric reservoirs, Aquat. Sci., 72, 283–293, https://doi.org/10.1007/s00027-010-0140-0, 2010.
Rudd, J. W., Hecky, R., Harris, R., and Kelly, C.: Are hydroelectric reservoirs significant sources of greenhouse gases, Ambio, 22, 246–248, 1993, 1993.
Schelker, J., Singer, G. A., Ulseth, A. J., Hengsberger, S., and Battin, T. J.: CO2 evasion from a steep, high gradient stream network: importance of seasonal and diurnal variation in aquatic pCO2 and gas transfer, Limnol. Oceanogr., 61, 1826–1838, 2016.
Şentürk, F.: Hydraulics of dams and reservoirs, Water Resources Publications, Highlands Ranch, Colo 1994.
Striegl, R. G. and Michmerhuizen, C. M.: Hydrologic influence on methane and carbon dioxide dynamics at two north-central Minnesota lakes, Limnol. Oceanogr., 43, 1519–1529, 1998.
Summerfield, M. A.: Global geomorphology: an introduction to the study of landforms, Longman Scientific & Technical, Harlow, Essex, England, New York, 1991.
Tadonleke, R. D., Marty, J. M., and Planas, D.: Assessing factors underlying variation of CO2 emissions in boreal lakes vs. reservoirs, FEMS Microbiol. Ecol., 79, 282–297, 2012.
Teodoru, C. R., Prairie, Y. T., and Del Giorgio, P. A.: Spatial Heterogeneity of Surface CO2 Fluxes in a Newly Created Eastmain-1 Reservoir in Northern Quebec, Canada, Ecosystems, 14, 28–46, 2011.
Thornton, K. W., Kimmel, B. L., and Payne, F. E.: Reservoir limnology: ecological perspectives, John Wiley & Sons, New York, 1990.
Tranvik, L. J., Downing, J, A., Cotner, J. B., Loiselle, S. A., Striegl, R. G., Ballatore, T. J., Dillon, P., Finlay, K., Fortino, K., Knoll, L. B., Kortelainen, P. L.,Kutser, T., Larsen, S., Laurion, I., Leech, D. M., McCallister, S. L., McKnight, D. M., Melack, J. M., Overholt, E., Porter, J. A., Prairie, Y., Renwick, W. H., Roland, F., Sherman, B. S., Schindler, D. W., Sobek, S., Tremblay, A., Vanni, M. J., Verschoor, A. M., von Wachenfeldt, E., and Weyhenmeyer, G. A. : Lakes and reservoirs as regulators of carbon cycling and climate, Limnol. Oceanogr., 54, 2298–2314, 2009.
Tremblay, A., Varfalvy, L., Roehm, C., and Garneu, M.: Greenhouse Gas Emissions – Fluxes and Rrocesses, Springer, New York; Berlin, 2005.
Varis, O., Kummu, M., Härkönen, S., and Huttunen, J. T.: Greenhouse gas emissions from reservoirs, in: Impacts of Large Dams: A Global Assessment, Springer, Berlin, Heidelberg, 69–94, 2012.
Vincent, L. S. L., Carol, A. K., Eric, D., John, W. M. R., and David, M. R.: Reservoir surfaces as sources of greenhouse gases to the atmosphere: A global estimate, BioScience, 50, 766–775, 2000.
Vörösmarty, C. J., Meybeck, M., Fekete, B., Sharma, K., Green, P., and Syvitski, J. P.: Anthropogenic sediment retention: major global impact from registered river impoundments, Global Planet. Change, 39, 169–190, 2003.
Wang, B., Wang, Y., Wang, F., Liu, X., Liu, C.-Q., Guan, J., and Yu, Y.: Carbon dioxide emission from surface water in cascade reservoirs–river system on the Maotiao River, southwest of China, Atmos. Environ., 45, 3827–3834, https://doi.org/10.1016/j.atmosenv.2011.04.014, 2011.
Wang, S., Wan, G., Liu, C., Yang, W., Zhu, Z., Xiao, H., and Tao, F.: Geochemical variation of CO2 and its atmospheric effect of lakes on the Yunnan-Guizhou Plateau, Quaternary Science, 23, p. 1, 2003 (in Chinese).
Xing, Y., Xie, P., Yang, H., Ni, L., Wang, Y., and Rong, K.: Methane and carbon dioxide fluxes from a shallow hypereutrophic subtropical Lake in China, Atmos. Environ., 39, 5532–5540, 2005.
Xu, J., Zhang, P., and Wang, Y.: Land use and land cover in Lancang Watershed of Yunnan. Acta Botonica Yunnanica, 25, 145–154, 2003.
Xu, Z.: Study of Carbon Dioxide and nitrous oxide emissions from Ecosystems of Different Elevations in a Typical Water Level Fluctuating Zone in Three Gorges Reservoir, Master thesis, Southwest University, 2013.
Yang, L., Lu, F., Wang, X., Duan, X., Song, W., Sun, B., Chen, S., Zhang, Q., Hou, P., Zheng, F., Zhang, Y., Zhou, X., Zhou, Y., and Ouyang, Z.: Surface methane emissions from different land use types during various water levels in three major drawdown areas of the Three Gorges Reservoir, J. Geophys. Res., 117, D10109, https://doi.org/10.1029/2011JD017362, 2012.
Yang, M.: Spatial-temporal Variation of Greenhouse Gas Flux and Its Environmental Factors at Miyun Water Reservoir [D], Master thesis, Beijing Forestry University, 2011.
Yang, X. K. and Lu, X. X.: Drastic change in China's lakes and reservoirs over the past decades, Scientific Reports, 4, 6041, https://doi.org/10.1038/srep06041, 2014.
Yang, X. K., Lu, X. X., and Ran, L. S.: Sustaining China's large rivers: River development policy, impacts, institutional issues and strategies for future improvement, Geoforum, 69, 1–4, 2016.
Yu, Y., Wang, F., Wang, B., and Li, G.: Response of Dissolved Inorganic Carbon and Its Isotopic Spatial and Temporal Characteristics to the Earlier Reservoir Process: A Case Study on a New Reservoir (Hongjiadu), Acta Mineralogica Sinica, 29, 268–274, 2009 (in Chinese).
Zhao, Y., Wu, B. F., and Zeng, Y.: Spatial and temporal patterns of greenhouse gas emissions from Three Gorges Reservoir of China, Biogeosciences, 10, 1219–1230, https://doi.org/10.5194/bg-10-1219-2013, 2013.