the Creative Commons Attribution 4.0 License.
the Creative Commons Attribution 4.0 License.
 | 25 Jun 2019
The colonization of the oceans by calcifying pelagic algae
Baptiste Suchéras-Marx
Emanuela Mattioli
Pascal Allemand
Fabienne Giraud
Bernard Pittet
Julien Plancq
Gilles Escarguel
The rise of calcareous nannoplankton in Mesozoic oceans has deeply impacted ocean chemistry and contributed to shaping modern oceans. Nevertheless, the calcareous nannoplankton colonization of past marine environments remains poorly understood. Based on an extensive compilation of published and unpublished data, we show that their accumulation rates in sediments increased from the Early Jurassic (∼200 Ma) to the Early Cretaceous (∼120 Ma), although these algae diversified up to the end of the Mesozoic (66 Ma). After the middle Eocene (∼45 Ma), a decoupling occurred between accumulation rates, diversity and coccolith size. The time series analyzed points toward a three-phase evolutionary dynamic. An invasion phase of the open-ocean realms was followed by a specialization phase occurring along with taxonomic diversification, ended by an establishment phase where a few small-sized species dominated. The current hegemony of calcareous nannoplankton in the world ocean results from a long-term and complex evolutionary history shaped by ecological interactions and abiotic forcing.
- Article
(2167 KB) - Full-text XML
-
Supplement
(11764 KB) - BibTeX
- EndNote


Calcifying pelagic algae, also known as calcareous nannoplankton, are an important and globally distributed component of marine biota in terms of both abundance and diversity. Calcareous nannoplankton is today mainly composed of coccolithophores, which are unicellular Haptophyta algae producing microscopic (1–20 µm) calcite platelets, the coccoliths, and occurring in the fossil record since the Late Triassic (∼210 Ma; Gardin et al., 2012). Coccoliths, together with incertae sedis calcite remains, are grouped into calcareous nannofossils, and are abundantly recovered in Mesozoic and Cenozoic marine sediments. Coccoliths are produced inside the coccolithophore cell and are then extruded to form an extracellular, mineralized coccosphere. Although this calcification process requires energy from the cell, the reason why coccolithophores produce coccoliths remains uncertain (Monteiro et al., 2016). In modern surface oceans, coccolithophores perform ∼1 %–10 % of the total organic carbon fixation, in some cases more than 50 %, while calcification of coccolithophores contributes ∼1 %–10 % of the total carbon fixation (Poulton et al., 2007). Nevertheless, their contribution to the carbon flux toward the ocean interior is twofold since calcite also acts as a ballast for the organic carbon (Klaas et al., 2002). Eventually, calcareous nannofossils represent about half of the extant pelagic carbonate sediments in the oceanic realm (Baumann et al., 2004; Broecker and Clark, 2009), and accounted for even more in Neogene sediments despite their small size (Suchéras-Marx and Henderiks, 2014). Conversely, during the early coccolithophore evolution, they only represented a minor contribution to the total calcium carbonate in sediments, with extremely low nannofossil accumulation rates in the Jurassic period (Mattioli et al., 2009; Suchéras-Marx et al., 2012). There is then a transition from Jurassic calcareous nannofossil-poor to Late Cretaceous and Cenozoic calcareous nannofossil-rich oceanic sediments, which has shifted the carbonate accumulation sustained by benthic organisms from neritic environments to an accumulation in pelagic environments supported by planktic organisms. This major carbonate system change is known as the Kuenen event (Roth, 1989), and has been traced to a tectonically mediated intensification of the ocean circulation. This event is concomitant with the development of several planktic groups (e.g., planktic foraminifera, Hart et al., 2003; diatoms, Kooistra et al., 2007), may be seen as a Mesozoic plankton revolution (derived from Vermeij, 1977) and thus is also dramatically related to plankton evolution. The causes and consequences of this biotic revolution have been extensively discussed, but the transition itself remains poorly documented; most interpretations solely rely on species richness (Falkowski et al., 2004; Knoll and Follows, 2016), which does not provide an exhaustive framework to fully appreciate the evolutionary history of calcareous nannoplankton.
Our working hypothesis is that this difference between Jurassic and Cenozoic pelagic carbonate accumulation rates points toward a major change in the nannoplankton evolutionary dynamics through geological time, rather than being merely due to environmental changes. In order to test this hypothesis, we analyzed in this study the ∼200 Myr long evolutionary history of calcareous nannoplankton based on an extensive compilation of both published and unpublished nannofossil accumulation rates (NARs; Table S1, Fig. 1), species richness (Bown, 2005) and coccolith mean size (i.e., at the assemblage level; Aubry et al., 2005; Herrmann and Thierstein, 2012). The novelty of this study is the long-term reconstruction of NAR and its use as a proxy for assessing the evolutionary dynamics of the calcareous nannoplankton. Fossil-based quantification in the sedimentary record is most often overlooked in paleontological studies due to the uneven character of the fossil record, but the continuous and abundant record of calcareous nannofossils and their taphonomic resilience compensates for most preservation and sampling issues. Our approach therefore represents an unprecedented advance in understanding the evolutionary dynamics of a major planktic group. We discuss the resulting pattern with respect to the microplankton evolutionary history and compare it with the long-term global climate, oceanographic and environmental changes known for this time interval.
2.1 Sample preparation of the compiled data
All the published and unpublished data of nannofossil absolute abundance (see Supplement) coming from samples analyzed by the authors result from the preparation technique described by Geisen et al. (1999). All the published data from the literature compiled (except one source) also used the same preparation technique. The preparation consists of a settling method, where a known quantity (m; 10–30 mg) of homogeneous rock powder is diluted in water and settled in the random settling device for 24 h on a cover slide situated at a depth of 2 cm (h) within the random settling device. Water is eventually evacuated from the settling boxes very slowly in order to avoid turbulence and powder remobilization. Finally, cover slides are mounted on microscope slides using Rhodopas B (polyvinyl acetate) and studied under a light-polarized (linear) microscope with ×1000 magnification. Usually a minimum of 300 nannofossils per sample are counted (n) or a minimum of 50 fields of view (fov) is observed, depending on the concentration of particles on the cover slide. The nannofossil absolute abundance is then calculated based on Eq. (1):
where X is the nannofossil absolute abundance (nannofossil ∕ gbulk), n is the number of nannofossils counted, v is the volume of water in the device, m is the mass of sediment in suspension (g), fov is the number of fields of view observed, a is the surface area of one field of view (cm2) and h is the height of the water column above the cover slide (cm).
The only study not using the random settling preparation technique deals with the Polaveno section (Italy; late Berriasian–early Hauterivian) (Erba and Tremolada, 2004), where nannofossils were quantified in thin sections thinned to an average thickness of 7 µm. Absolute abundances were then obtained by counting all nannofossil specimens on 1 mm2 of the thin section in a light polarized microscope with ×1250 magnification.
2.2 Accumulation rate calculation
The nannofossil accumulation rate is calculated using sedimentation rate following Eq. (2):
where NAR is nannofossil accumulation rate (nannofossil m−2 yr−1), NannoAb is the nannofossil absolute abundance (nannofossil ∕ gbulk) and SR is the sedimentation rate (m Myr−1). DBD is the dry bulk density of the rock (g cm−3).
Sedimentation rates have been calculated based on the International Chronostratigraphic Chart 2012 (Gradstein et al., 2012). When cyclostratigraphy was available, we used the cycles provided by authors after re-evaluation of at least one anchor age (commonly a stage limit or a biostratigraphic datum). When cyclostratigraphy was not available, we used anchored ages mostly based on biostratigraphic datums, assuming that the sedimentation rate was constant between two datums. The dry bulk density of rocks is missing in all but one Mesozoic studied sample (Suchéras-Marx et al., 2012). A typical value at 2.7 g cm−3 corresponding to the calcite density was set when density was missing; this value is close to the 2.55 g cm−3 measured for Middle Jurassic rocks (Suchéras-Marx et al., 2012), leading to a negligible difference in nannofossil accumulation rates.
For the Polaveno section samples, the calcareous nannofossil accumulation rates were calculated by the authors per unit area (1 mm2) and time (1 year) (Erba et al., 2004). The latter was derived from sedimentation rates estimated for individual magnetic polarity chrons (Channel et al., 2000).
2.3 Dataset compilation
All data sources but one used the same preparation technique (see details above), limiting the discrepancies due to methodological differences. All the sites considered for nannofossil accumulation rate compilation are presented on a map (Fig. 1). The vast majority of the samples are from the Northern Hemisphere, and almost all samples for Jurassic and Cretaceous times are from western Europe outcrops – a relatively poor quantitative record of nannofossils exists outside Europe and at oceanic sites issued from deep-sea drilling programs. Europe, the North Sea, Greenland and the North Atlantic represent 81.16 % of all compiled samples. Thus, results based on NAR, particularly for the Mesozoic, which represent 84.31 % of all samples compiled, will be mostly based on European and Atlantic localities and thus may describe patterns that occurred mainly in the western Tethys and North Atlantic (see Supplement S3 and Fig. S3). For the Cenozoic, the data are more widely distributed but the samples per million years are less abundant than in the Mesozoic (see Supplement S3 and Fig. S3). All data compiled are provided in an Excel file, with one sheet per site or paper (Table S1 in the Supplement) for a total of 3895 data points across 79 sites or papers. Name, location and associated references for each site are provided in the Supplement.
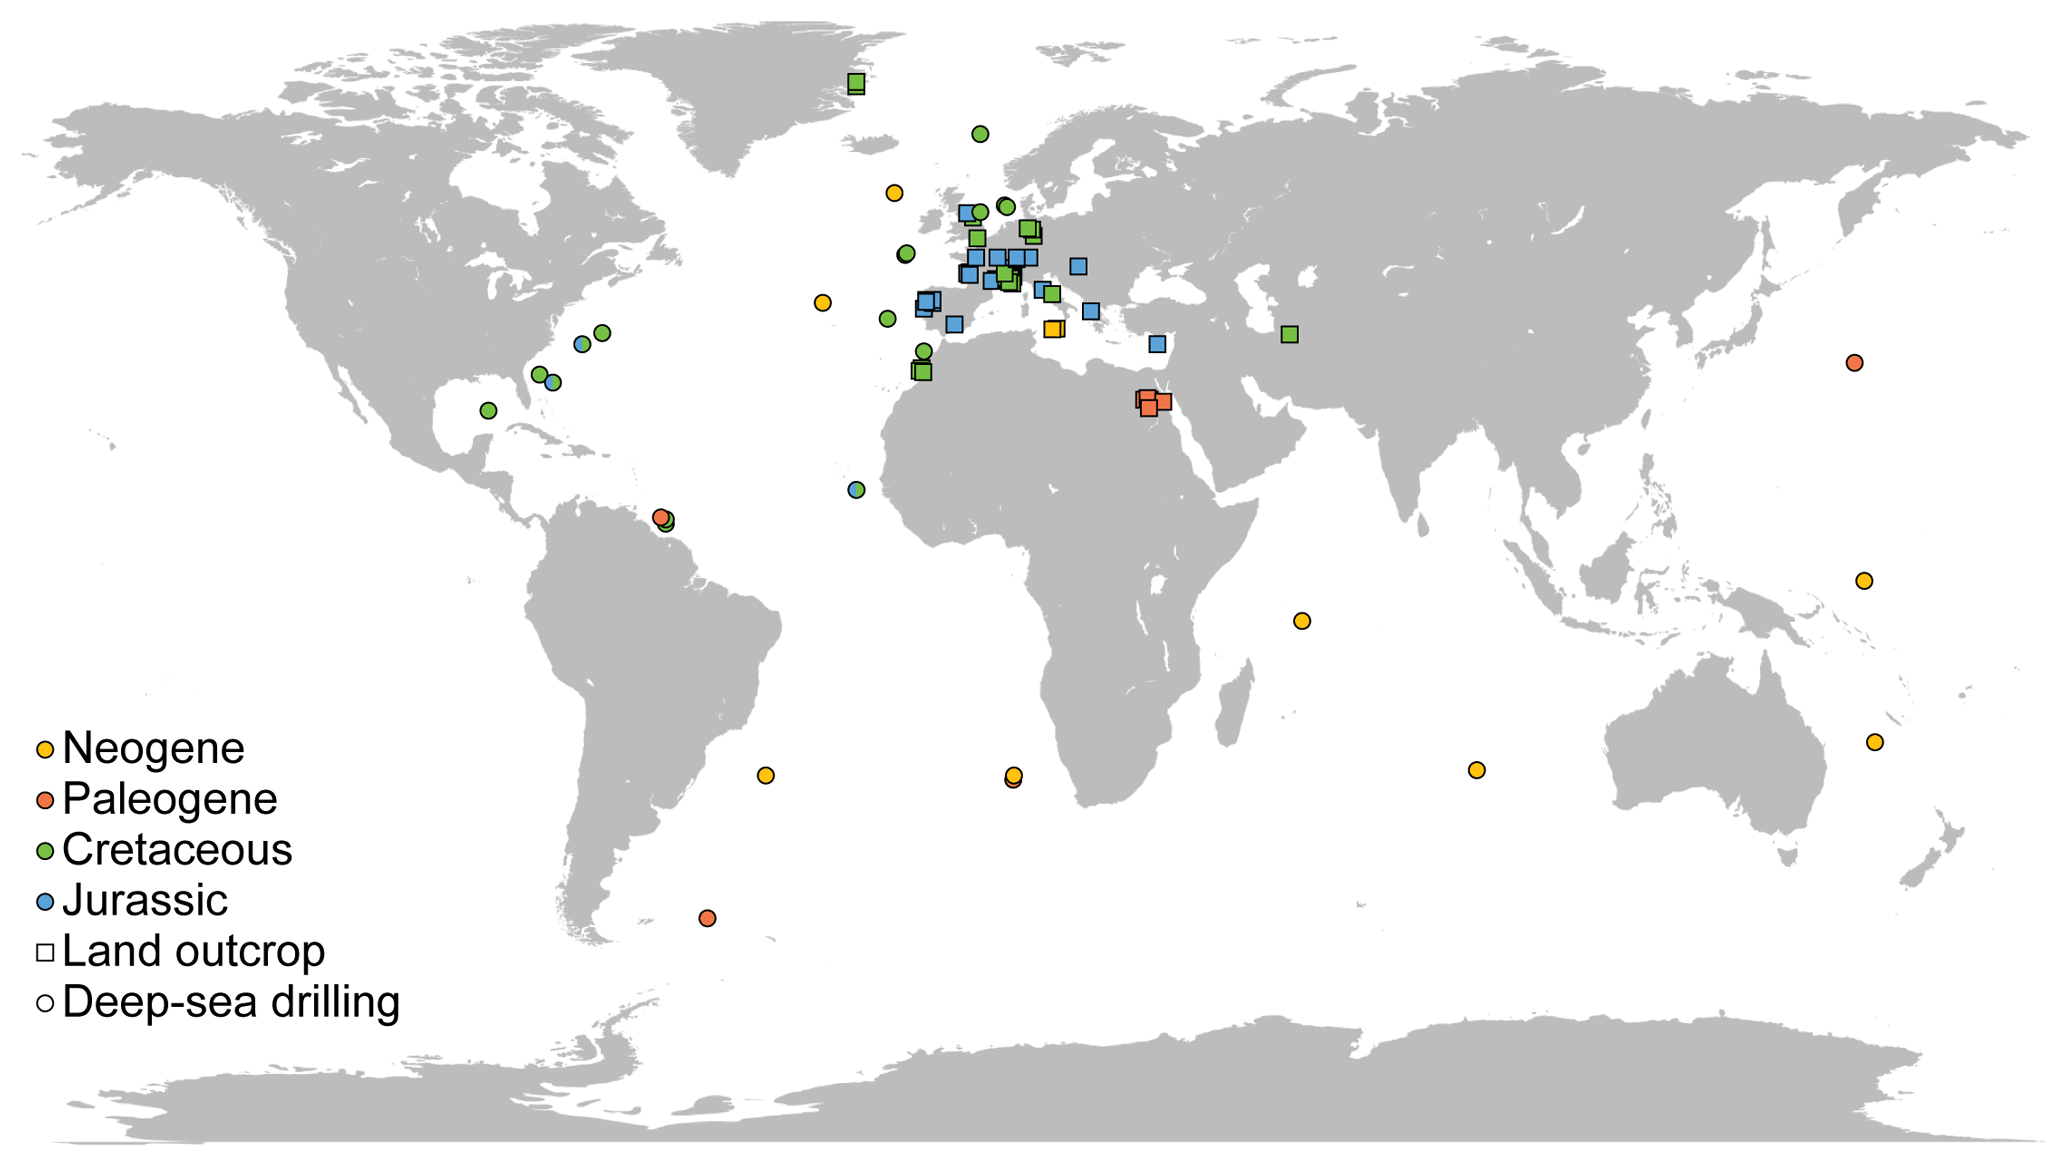
Figure 1Location of the sites compiled for this study. Colors indicate the age of the samples (Neogene, yellow; Paleogene, orange; Cretaceous, green; Jurassic, blue). Squares represent land outcrops and circles represent deep-sea drilling.
2.4 Trend smoothing
For nannofossil accumulation rates and pCO2 values (parts per million and micro-atmospheres; Foster et al., 2017, Witkowski et al., 2018) (Figs. 2, S1–S2, S4), a LOESS smoothed curve was computed in order to capture long-term variations and overlook short-term shifts that are more likely controlled by the number of studied sites, sampling resolution and nannofossil preservation or, alternatively, by local environmental conditions. The data from Mejía et al. (2017) are excluded from the LOESS calculation due to the large uncertainties presented by the authors. See the Supplement for a discussion of the effect of the selected smoothing factor on the inferred trend. The curve was calculated using PAST3.24 (Hammer et al., 2001). The CO2 curve was calculated using a smoothing factor of 0.1, and the nannofossil accumulation rate curve using a smoothing factor of 0.5, both associated with a 95 % bootstrapped confidence interval based on 999 random replicates.
2.5 Nannofossil accumulation rate paleomap construction
Maps of nannofossil accumulation rates (Fig. 3, dataset in Table S2) have been drawn from the linear interpolation of the measurements performed at various sites using the dedicated MATLAB functions. The geographical coordinates of the sites studied were first converted in a sinusoidal projection that preserves distance ratios. The maps were then projected in a conformal Mercator projection in order to be more easily readable. The distance from continental coasts and the existence of islands in the area of interpolation were not taken into account. We used the hypothesis that the islands were small enough not to spatially impact the calcareous nannofossil accumulation rates. Continental coastlines were not used as a limit in the interpolation because they would have generated artificial variations due to the relatively high average distance between sites.
Nannofossil accumulation rate (NAR), expressed as number of specimens per square meter and per year, strongly varies between sites, but also stratigraphically within a single site (Fig. 2). In this study, we used a LOESS smoothing to catch the long-term trend and overlook short-term variations that may be influenced by preservation or local environmental conditions (Figs. 2, S1). Clearly, the resulting time series of smoothed NAR shows two main successive intervals: (i) an increase of 2 orders of magnitude during the Jurassic and Early Cretaceous (i.e., from ∼200 to ∼120 Ma), followed by (ii) a steady-state dynamic equilibrium up to end-Cenozoic times.
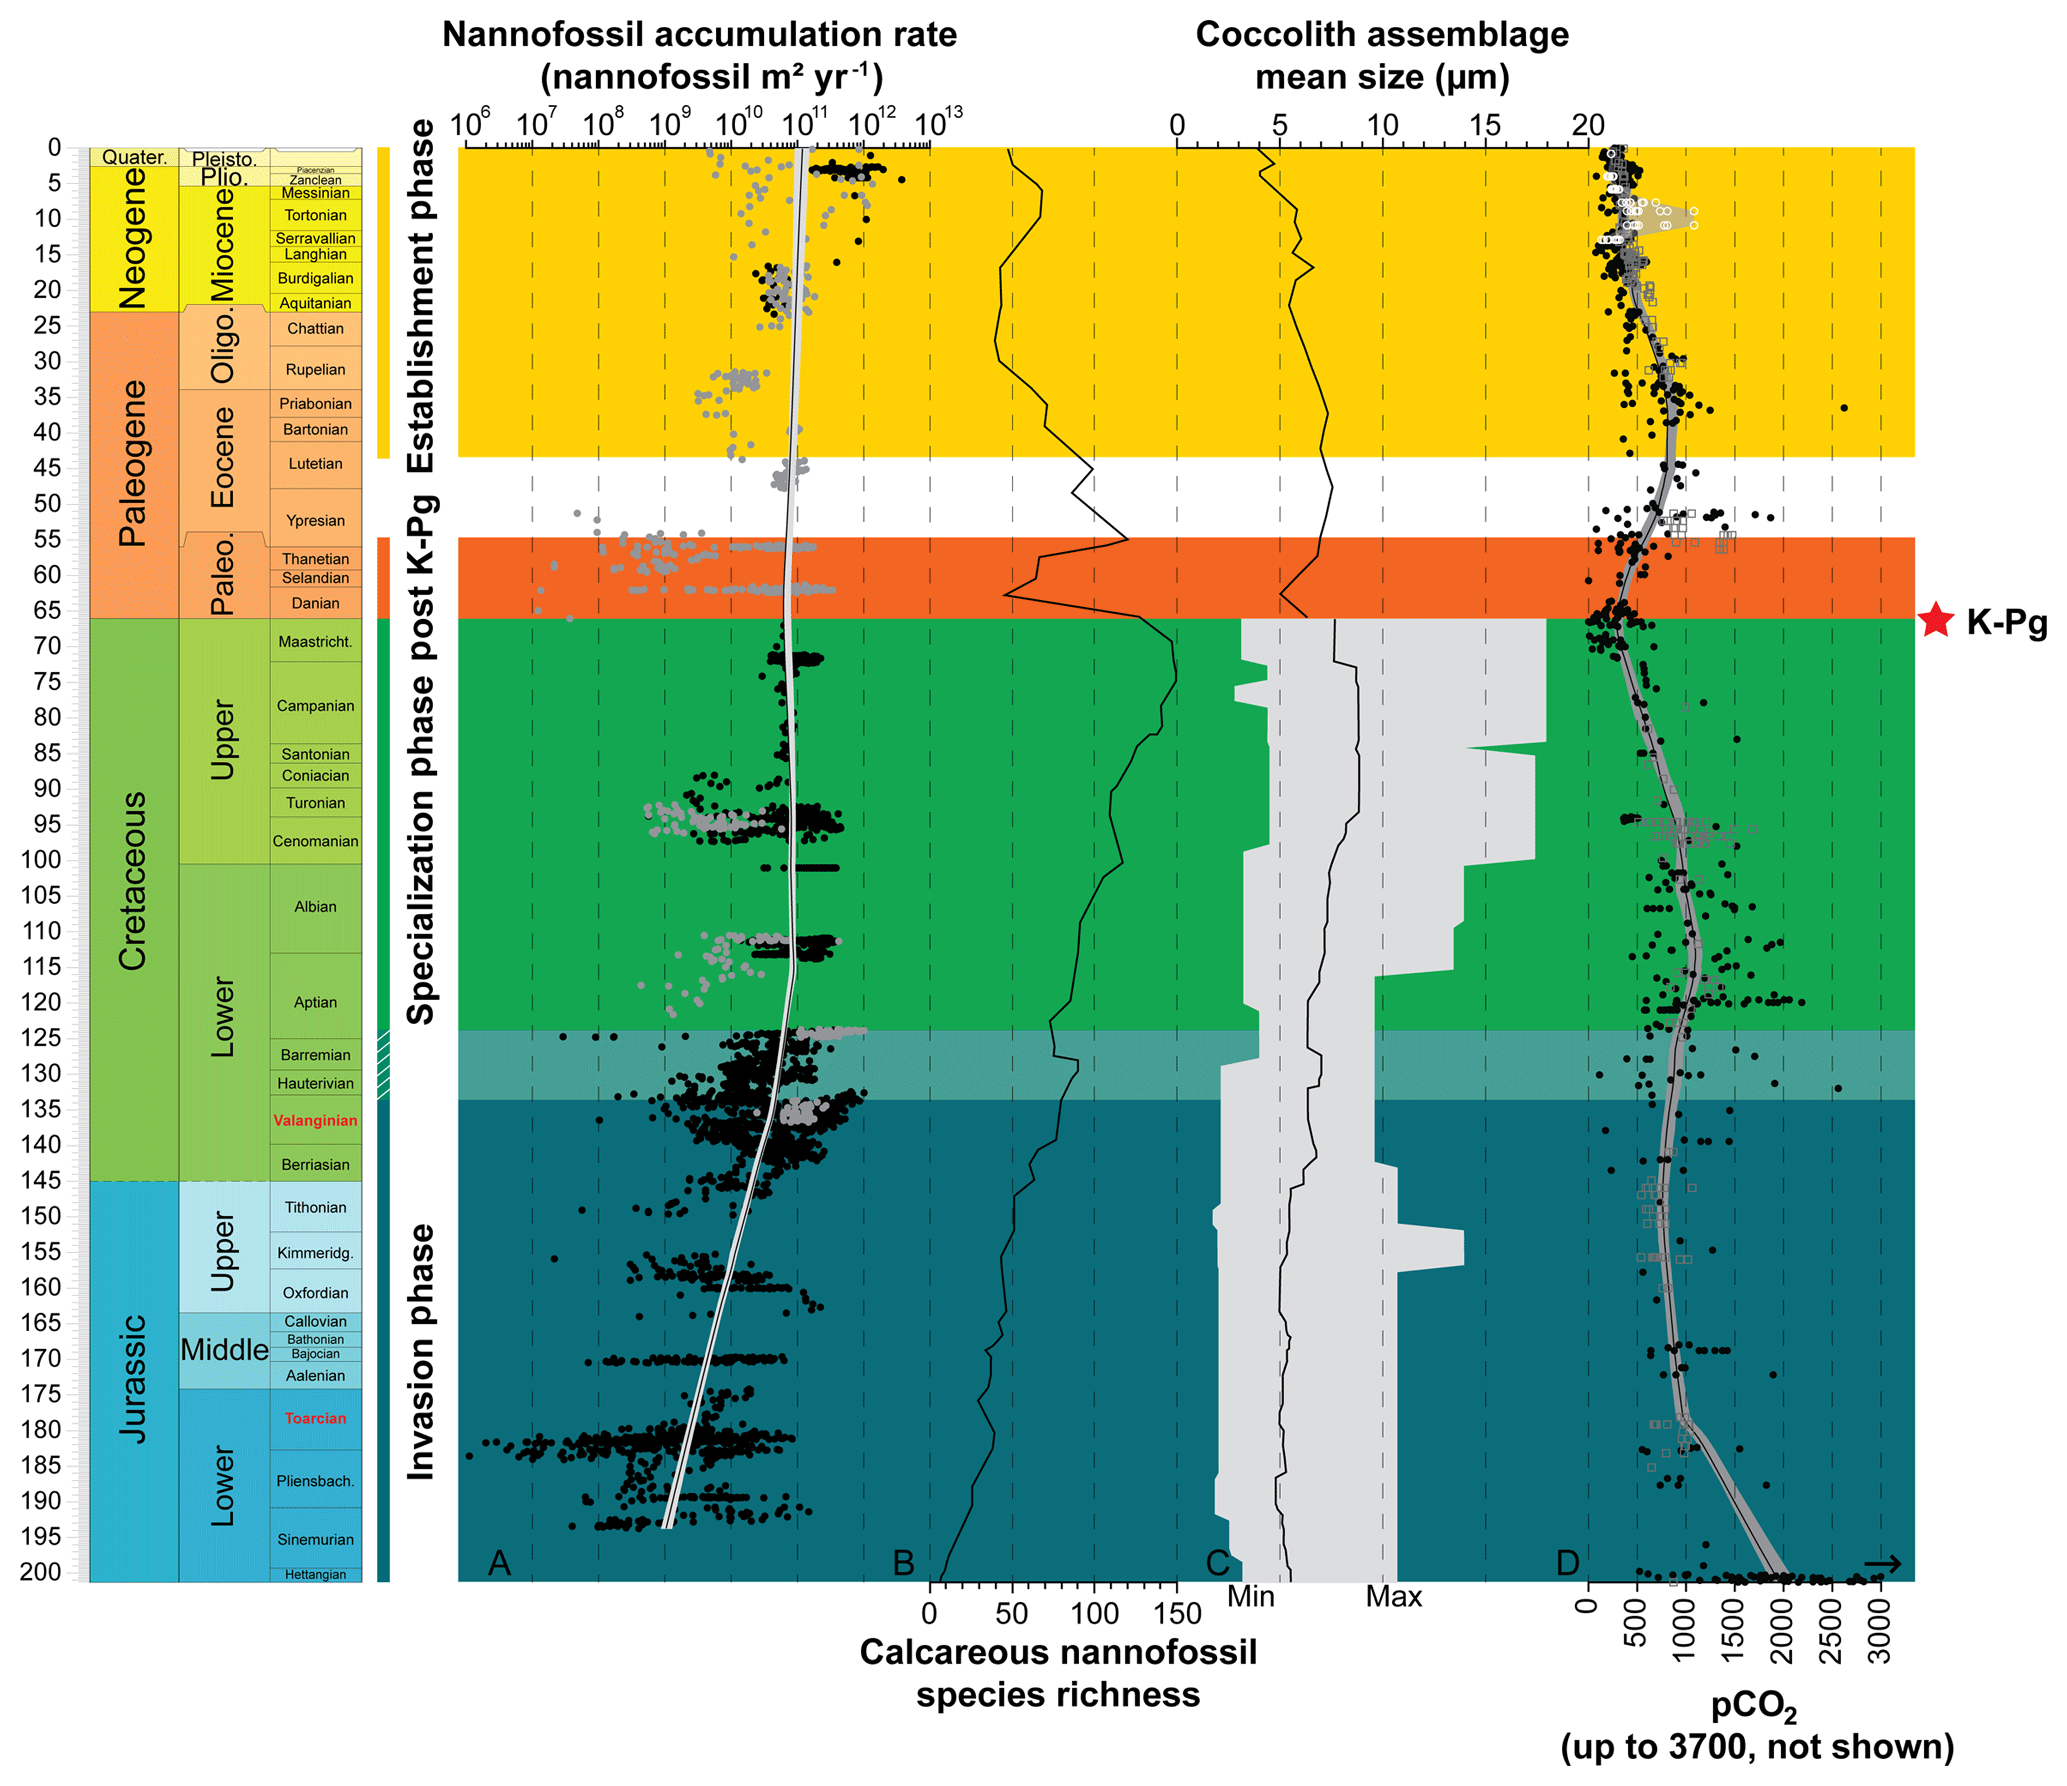
Figure 2Evolution through time of nannofossil accumulation rate, species richness and size. (a) Compiled nannofossil accumulation rate (nannofossil m−2 yr−1). Black circles are samples from Europe, North Sea, Greenland and North Atlantic and grey circles are from the rest of the world. The LOESS trend (sf 0.5) was calculated with all samples. (b) Nannofossil species richness (Bown, 2005). (c) Coccolith mean size at the assemblage level during the Mesozoic (Aubry et al., 2005) and the Cenozoic (Herrmann and Thierstein, 2012). Mesozoic coccolith mean size at the assemblage level is derived from a compilation of species sizes as published in the literature (original taxonomic descriptions), to which the authors have added their own measurements of published material. This record consists of measurements of length and width of 302 species, which is about one-third of all the described Mesozoic coccolith species. The grey area illustrates the minimum and maximum size recorded. Cenozoic coccolith mean size at the assemblage level is derived from measurements of entire coccolith assemblages during the last 66 Myr from a number of globally distributed deep-sea cores using automated scanning electron microscopy and image analysis processing. (d) pCO2 through time with the Foster et al. (2017; in parts per million) compilation represented by black filled circles, Witkowski et al. (2018; in micro-atmospheres) represented by grey open squares and Miocene pCO2 decline from Mejía et al. (2017) in white open circles with the range of possible values in grey. The LOESS trend was calculated on Foster's and Witkowski's data assuming parts per million and micro-atmospheres are equivalent and is represented by a black line and grey envelope representing the 95 % confidence interval around the calculated trend.
Two time intervals are geographically well-documented (Fig. S3), mostly at European sites, the Toarcian (Early Jurassic; ∼183–174 Ma) and the Valanginian (Early Cretaceous; ∼140–133 Ma). NAR paleomaps have been constructed based on averaged NAR values for each site in both time intervals. During the Toarcian, NAR is higher in northern shallow epicontinental seas than in southeastern Tethyan open sea (Fig. 3a). Conversely, during the Valanginian, NAR is higher in tropical open seas than in northeastern European epicontinental seas near the Viking Corridor (i.e., the connection between Boreal and European seas; Westermann, 1993) (Fig. 3b–c). Finally, the highest Toarcian NAR (located in France and Yorkshire) is similar to the lowest Valanginian NAR (located in Greenland, North Sea and France) (Table S2). Compared to nannofossil species richness and coccolith mean size, these results open new insights into the evolution of calcareous nannoplankton over the past ∼200 Myr. Three distinct phases can be observed.
During the Jurassic and Early Cretaceous, the smoothed NAR increased with species richness (Bown, 2005) while coccolith size was steadily small and started to increase at the Jurassic–Cretaceous boundary (Aubry et al., 2005). The beginning of this phase is marked by high calcareous nannoplankton production in epicontinental seas, whereas the end of this phase is marked by greater production in tropical open-ocean environments, as shown by the NAR maps (Fig. 3). Hence, this invasion phase reflects a ∼80 Myr long gradual invasion of the western Tethys and Atlantic oceans by calcareous nannoplankton during the Jurassic–Early Cretaceous time interval. Watznaueria barnesiae (i.e., a cosmopolitan Mesozoic coccolithophore species) coccolith biometric data show only one size population between the western Tethys (La Charce-Vergol, France) and western Panthalassa (ODP1149, Nadezhda basin close to Japan) during the Lower Cretaceous. Thus mixing of coccolithophore populations was effective at that time, testifying for a continuous genetic flux through the Tethys following a circum-global circulation (Gollain et al., 2019). The genetic flux was probably sustained for many calcareous nannoplankton between both regions of the oceans at that time. The Early Cretaceous invasion phase observed in the Atlantic Ocean may have thus happened in all open oceans worldwide, although our restricted European–North Hemisphere dataset cannot corroborate it.
An abrupt change in NAR dynamics, which has been steadily high since the Early Cretaceous (∼120 Ma) according to the LOESS trend, marks the beginning of the second phase. From this point up to the end of the Cretaceous, NAR remained high but the nannofossil species richness and the coccolith mean size have increased since the beginning of the Cretaceous following Cope–Depéret's rule (i.e., increase in coccolith size over evolutionary time; Aubry et al., 2005). As seen in the Valanginian NAR maps (Fig. 3b–c), by this time the shift in calcareous nannoplankton production toward the open seas was already accomplished. This phase corresponds to the specialization phase, where more and more species shared an increasingly filled ecospace through specialization to particular ecological niches.
After the Cretaceous–Paleogene (i.e., K–Pg) mass extinction event, calcareous nannoplankton recovered following the same two phases, namely invasion and specialization, but on a short time interval (less than 4 Myr), although our Paleocene NAR record is too limited to unambiguously confirm this pattern. Finally, a last phase in the calcareous nannoplankton evolution started in the Eocene (Figs. 2, S3) with smoothed NAR steadily high or slightly increasing (Figs. 2, S1) but the nannofossil species richness and coccolith mean size both tending to decrease. This may correspond to an establishment phase where fewer species with smaller sizes predominated. This establishment phase reached a climax in modern oceans with the dominance within the coccolithophore community of the iconic small-sized species Emiliania huxleyi (e.g., Ziveri et al., 2000; Baumann et al., 2004).
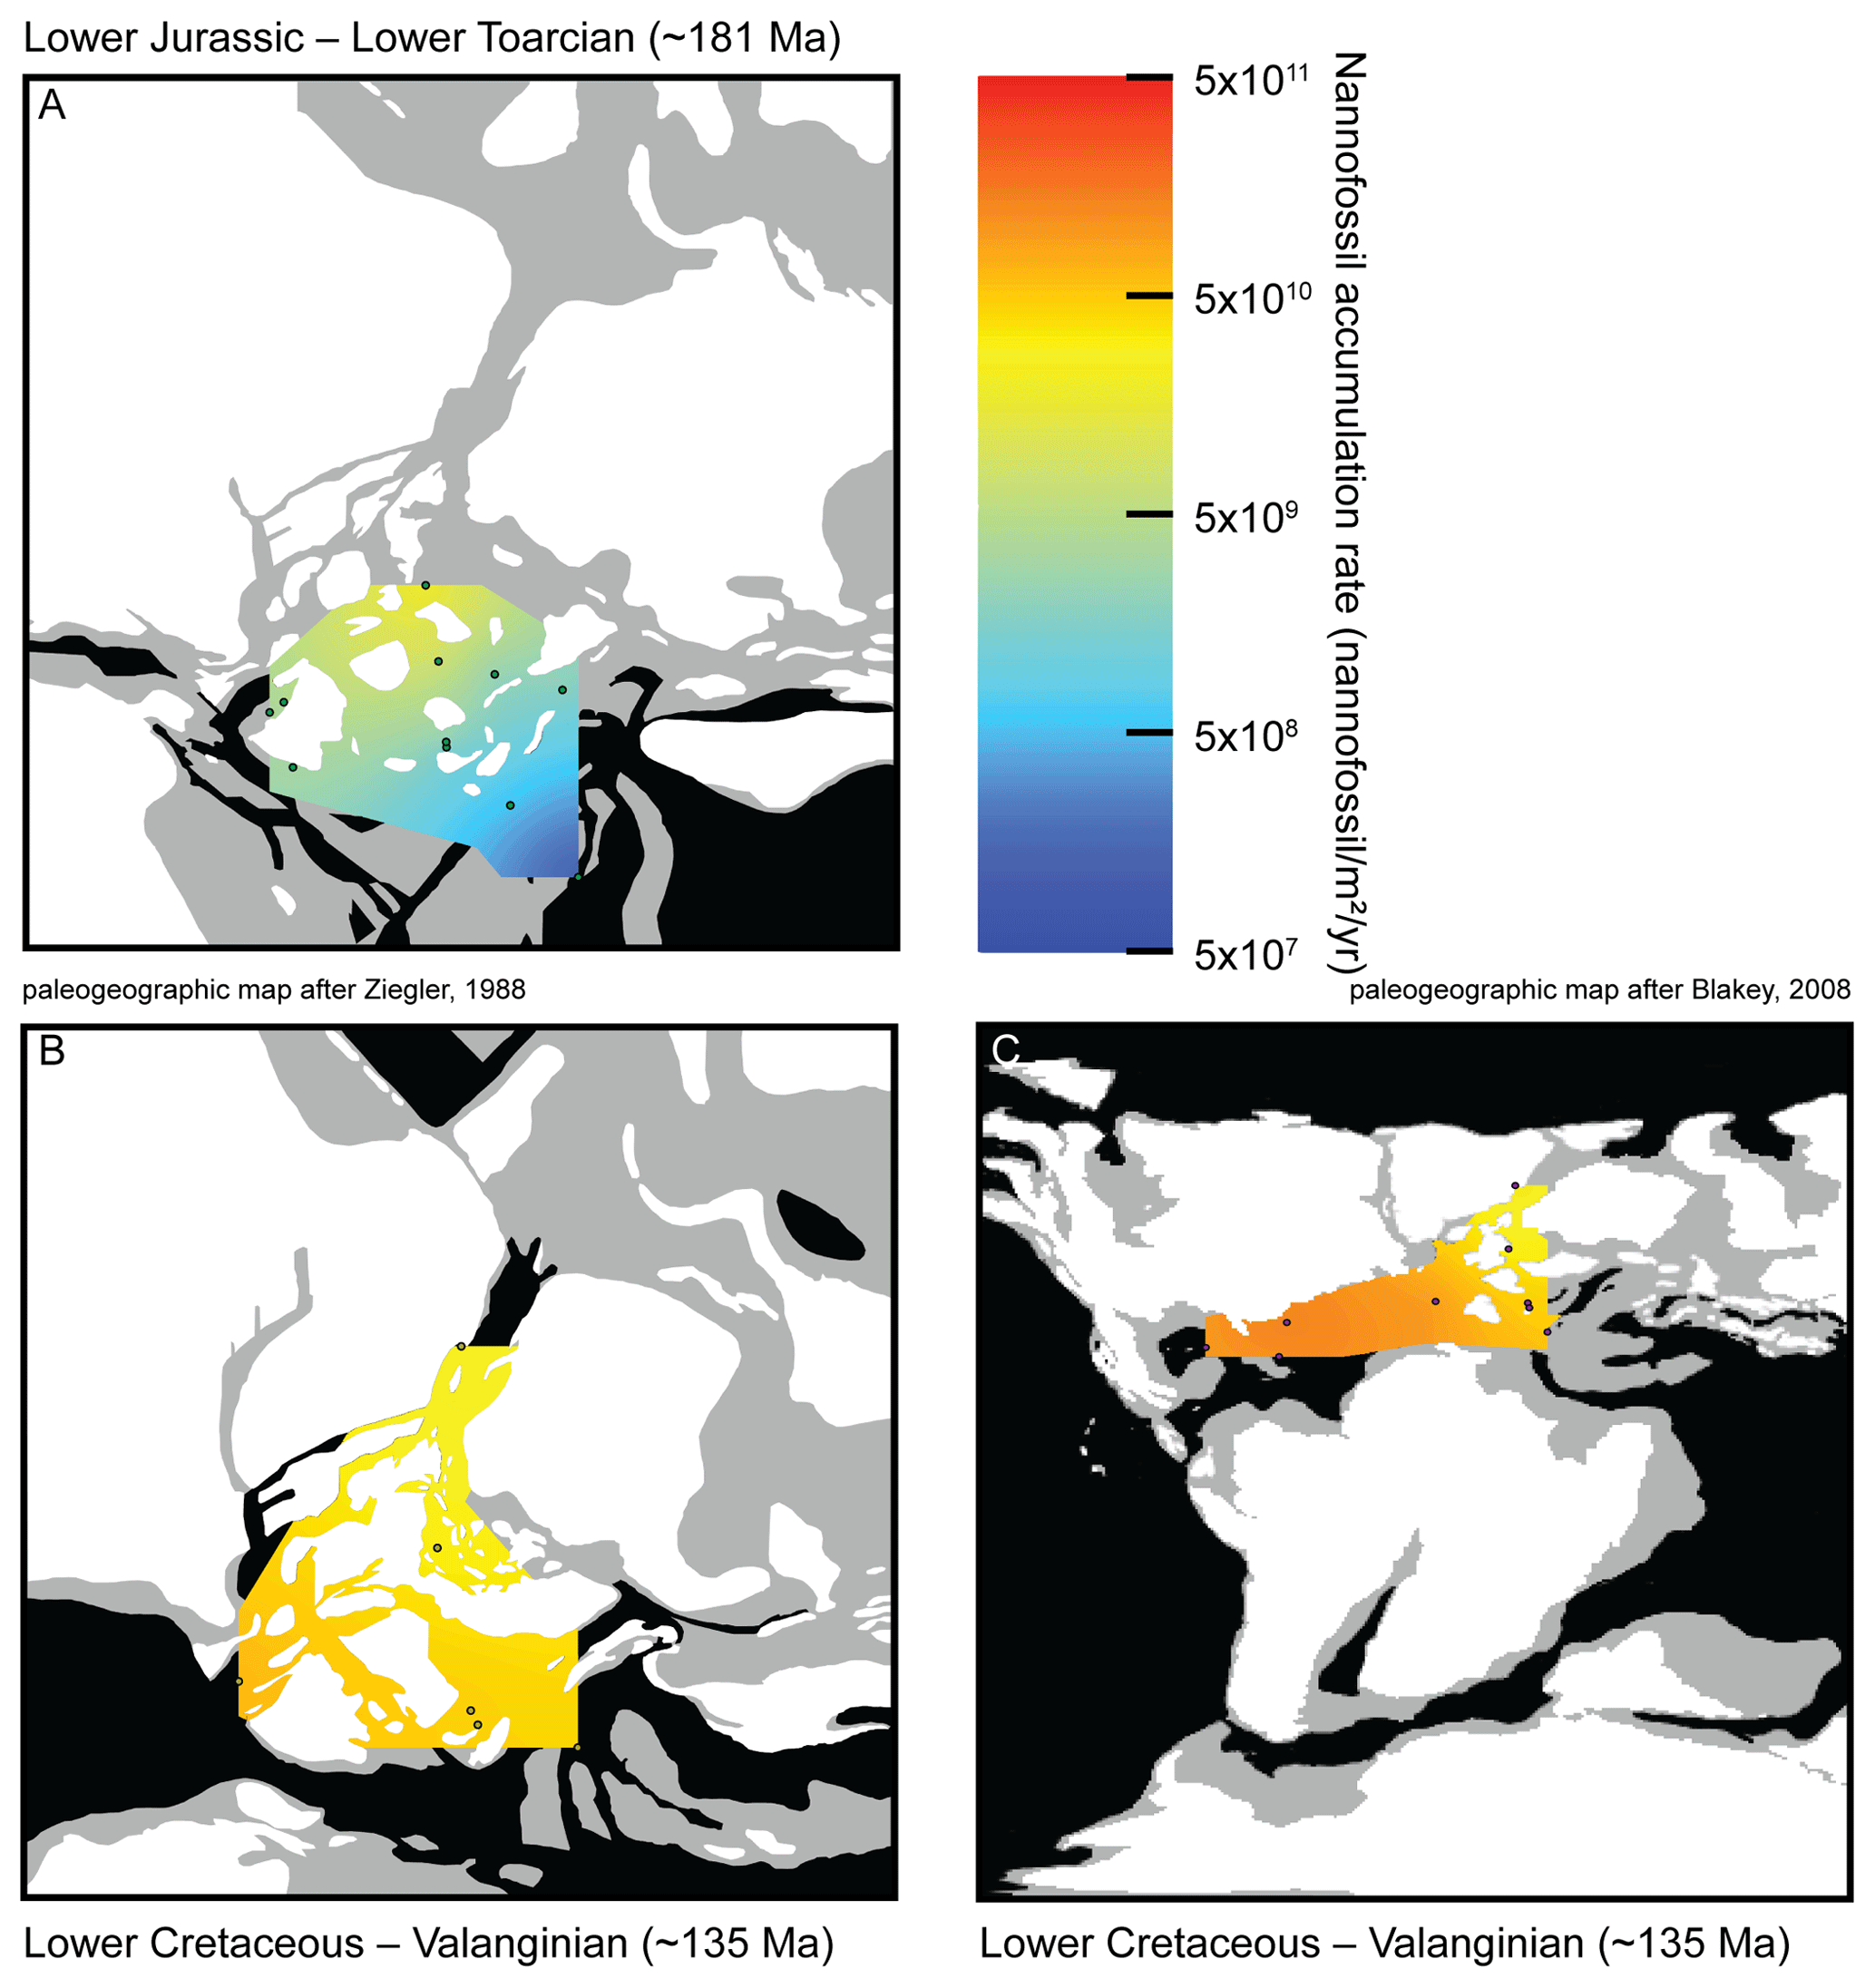
Figure 3Maps of nannofossil accumulation rate (nannofossil m−2 yr−1) drawn from the linear interpolation of the measurements realized at various sites (Table S2). Emerged lands are drawn in white, epicontinental seas are indicated in grey and open oceans are indicated in black. (a) Toarcian in Europe, 11 sites considered, namely Peniche (Portugal), Rabaçal (Portugal), La Cerradura (Spain), HTM-102 (France), Tournadous (France), Saint-Paul-des-Fonts (France), Yorkshire (UK), Dotternhausen (Germany), Somma (Italy), Chionistra (Greece) and Réka Valley (Hungary), for a total of 229 analyzed samples. (b) Valanginian in Europe, six sites considered, namely Perisphinctes ravine (Greenland), ODP638 (North Atlantic), Vergol-La Charce (France), Carajuan (France), BGS 81/43 (North Sea) and Polaveno (Italy), for a total of 371 analyzed samples. (c) Valanginian in Europe and the Atlantic Ocean adding three sites to the European ones: DSDP535 (Mexico Gulf), DSDP534A (North Atlantic) and DSDP603B (North Atlantic), for a total of 517 analyzed samples. Paleogeographic maps modified from Ziegler (1988) and Blakey (2008).
Extant calcareous nannoplankton is neither uniformly nor randomly dispersed in the global ocean (e.g., Winter et al., 1994). Its distribution in ecological niches is shaped by (i) abiotic parameters such as temperature, salinity, pH, and water mixing, but also by the availability of nutrients or light (e.g., Margalef, 1978; Balch, 2004), and (ii) by functional interactions with other organisms such as viruses (Frada et al., 2008), phytoplankton and grazers (Litchman et al., 2006). Extant coccolithophores are commonly viewed as “intermediate” organisms in Margalef's mandala (i.e., Fig. 2 from Margalef, 1978), so basically transitional between K (corresponding to organisms evolving in more stable, predicable and saturated environments, e.g., dinoflagellates) and r (organisms living in unstable, unpredictable and unsaturated environments, e.g., diatoms) strategists (Reznick et al., 2002), living in intermediate nutrient-concentrated waters, turbulence and light availability (Margalef, 1978; Balch, 2004; Tozzi et al., 2004). Thus, the integration of abiotic and biotic parameters explains the macroecological distribution of extant calcareous nannoplankton. Macroecological pattern may change through time due to evolution. And long-term evolution – macroevolution – is influenced by abiotic and biotic drivers that have given two evolutionary models: Red Queen (Van Valen, 1973) and Court Jester (Barnosky, 2001) hypotheses. The former states that biotic interactions drive evolutionary changes, whereas the latter asserts that changes in physical environments initiate evolutionary changes. The different phases observed here could be described in light of macroecological and macroevolutionary models.
The invasion phase during the Jurassic–Early Cretaceous is marked by both increasing NAR and nannoplankton species richness, indicating that the new occurring species increases the NAR without limiting the distribution of already existing species. Hence, the ecology of Jurassic–Early Cretaceous nannoplankton species was closer to the r strategist pole of density-independent selection (Reznick et al., 2002). The invasion phase echoes the beginning of the diversification of various planktic organisms – the Mesozoic plankton revolution. Even if there is an important change in the organization of the plankton community, the invasion phase is likely driven by the Pangaea breakup. This major tectonic event gave rise to newly formed oceanic domains, created perennial connections between the Pacific, Tethys, and Atlantic oceans, and initiated sea-level rise and flooding of continental areas, finally establishing more numerous and heterogeneous ecological niches (Roth, 1989; Katz et al., 2004). The Mesozoic change in ocean chemistry, with increases in Cd, Cu, Mo, Zn and nitrate availability linked to deep-ocean oxygenation, would also have favored the development of the red lineage algae (i.e., using chlorophyll a, with chlorophyll c and fucoxanthin as accessory pigments typical in Haptophyte) such as coccolithophores (Falkowski et al., 2004). Although this Court Jester scenario most likely explains the invasion of the oceans by calcareous nannoplankton, Suchéras-Marx and co-workers pointed out that the increase in NAR during the early Bajocian (Middle Jurassic; ∼170 Ma) could also have resulted from a more efficient exploitation of ecological niches by the newly originated species (Suchéras-Marx et al., 2015).
The following specialization phase is marked by calcareous nannoplankton species having reached the maximum production of platelets (on average, ∼1011 nannofossils m−2 yr−1), but these were produced by an increasing number of species characterized by a higher coccolith size variance than in the previous phase (Fig. 2). This record suggests that more and more species shared an increasingly filled ecospace, therefore becoming more specialized to peculiar ecological niches. This specialization might correspond to an adaptation of different species to a particular ecological niche, variable trophic levels (i.e., oligo- to eutrophic; e.g., Herrle, 2003; Lees et al., 2005), temperature conditions (e.g., Mutterlose et al., 2014), or seasonality and blooming (e.g., Thomsen, 1989). Consequently, late Early and Late Cretaceous species were closer to the K strategist pole of density-dependent selection, corresponding to organisms evolving closer to carrying capacity. This time interval witnessed many drastic short-term climatic and environmental perturbations such as oceanic anoxic events (OAEs), thermal optimums or cooling (Friedrich et al., 2012), but also some relatively stable long-term physical conditions (e.g., sea level; Müller et al., 2008). Despite some major short-term abiotic parameter changes, this macroevolutionary phase is more compatible with the Red Queen model. This time interval is the paroxysm of the Mesozoic plankton revolution with the first occurrence of diatoms, a plateau of marine dinoflagellate species richness and the diversification of planktic foraminifera, which, together with calcareous nannoplankton (Falkowski et al., 2004; Knoll and Follows, 2016), contributed to form massive chalk deposits (Roth, 1986). These various lines of evidence point toward an increase in interaction and competition between plankton organisms. Ultimately, the Mesozoic plankton revolution led to a bottom-up control of plankton on the entire marine ecosystem structure (Knoll and Follows, 2016), as revealed by the diversification of spatangoids echinoids, palaeocorystids crabs, Ancyloceratina ammonites (Fraaije et al., 2018) and many other groups during the Mesozoic plankton revolution (Vermeij, 1977) including highly diverse marine reptiles (Pyenson et al., 2014).
The Court Jester model applies to the K–Pg mass extinction (66 Ma) well. This mass extinction event is related to abiotic perturbation, i.e., the Deccan traps volcanism (Courtillot et al., 1986), and an asteroid impact (Alvarez et al., 1980). This event had a catastrophic impact on calcareous nannoplankton diversity with a species turnover of up to 80 % during the crisis (Bown, 2005). The K–Pg crisis almost shut down pelagic production, with raw NAR values returning to Lower Jurassic ones (107–108 nannofossils m−2 yr−1; Fig. 2) (Hull et al., 2011). Our record of the aftermath of the K–Pg event indicates that the NAR recovered to pre-extinction levels in less than 4 Myr (Fig. 2). Associated with this Paleocene post-crisis NAR increase, which was followed by a steady production for the rest of this Epoch, an increase in coccolith mean size and in species richness is observed (Fig. 2). At a much shorter timescale, the Paleocene therefore appears similar to the Jurassic–Cretaceous interval in that a first invasion phase (the post-crisis biotic recovery) and the origination of new calcareous nannoplankton families (Bown, 2005) is followed by a period of species diversification and ecological specialization – a specialization phase.
Eventually, at the end of the Paleogene and during the Neogene, calcareous nannoplankton experienced a third evolutionary phase – the establishment – characterized by high raw NAR, and lower species richness involving smaller-sized species than in the Cretaceous. This last phase may have been driven by combined abiotic and biotic changes. First, the decrease in pCO2 below a threshold throughout the Neogene could have driven the decrease in coccolithophore cell size (Hannisdal et al., 2012) based on estimation of coccolith size decrease (Bolton et al., 2016). The carbon supply to coccolithophore cells is indeed sustained by CO2 diffusion through the cellular membrane and depends on the cell surface ∕ volume ratio, which is in turn controlled by cell size. In many coccolithophores, there is a linear (isometric) relation between coccolith size and cell size (Henderiks, 2008). Consequently, the fitness decrease in large-sized species related to the pCO2 drawdown led to a reduction in species richness. Secondly, diatoms tremendously diversified due to increase in silicic acid input to the oceans during this time interval (Spencer-Cervato, 1999; Cermeño et al., 2015), locally outcompeting calcareous nannoplankton, and only the most competitive coccolithophore species continued to proliferate. A habitat partitioning resulted, with calcareous nannoplankton dominating the open-ocean oligotrophic areas, whereas diatoms thrived in meso-eutrophic coastal regions (Margalef, 1978). Nevertheless, modern-day calcareous nannoplankton is still more abundant in eutrophic upwelling regions than in open oceans (Baumann et al., 2004), underscoring a complex rearrangement of microplankton community rather than a simple replacement of calcareous nannoplankton by diatoms.
Coccolithophores represent about half of the calcium carbonate in late Holocene deep-sea sediments but they were less abundant at the onset of calcareous nannoplankton evolution. Since the first occurrence of calcareous nannoplankton in the Late Triassic, the colonization of the oceans was a long-lasting and gradual process which can be separated into three successive phases, based on comparison of the nannofossil accumulation rate, species richness and coccolith mean size variations. The first phase from Early Jurassic to Early Cretaceous corresponds to the nannoplankton oceans' invasion. This phase is marked by an increasing NAR trend in species richness along with a steady to slight increase in coccolith mean size. In this time interval, our results suggest that the nannofossil accumulation almost exclusively occurred in epicontinental seas. By the Early Cretaceous, a phase of specialization started. NAR attained the highest values while species richness and coccolith mean size continued to increase. Moreover, NAR became highest in open-ocean tropical environments. During this second phase, an increasing number of species tended to specialize and to more efficiently share the available ecospace. After the K–Pg mass extinction that led to a new and brief invasion and specialization phase, a third and ongoing phase began during the Eocene–Oligocene. It is marked by a steady NAR but reduced species richness and coccolith mean size. A smaller number of species characterized by smaller size produce as many fossil coccoliths as before, pointing toward an increase in absolute abundances, at least for some species. This establishment phase may be simultaneously related to the diversification and competitive interaction of diatoms and to a decrease in atmospheric pCO2. Finally, the long-term calcareous nannoplankton evolution over the past 200 Myr appears as a gradual colonization of almost all marine environments within the world ocean. Such colonization was successively shaped by abiotic and biotic factors ultimately pointing toward the Court Jester and the Red Queen macroevolutionary models as likely scenarios of the invasion and specialization phases, respectively, and both models apply to the more recent establishment phase.
Data are available in the Supplement in two Excel files. Table S1 gathered the dataset of nannofossil accumulation rate in the different settings studied in this work, sorted in chronological order. Each sheet presents the location of the site, the age (relative and absolute), the nannofossil absolute abundance, the sedimentation rate, the nannofossil accumulation rate and other information such as the sample name, height in the section and the published reference. Table S2 gathered the datasets of nannofossil accumulation rate used to construct Fig. 3. The table presents for both considered geological stages (i.e., Toarcian and Valanginian) the location of each site, their mean nannofossil absolute abundance and mean nannofossil accumulation rate, and the number of samples per site. The data used in the paper are available at https://doi.org/10.1594/PANGAEA.902908 (Suchéras-Marx et al., 2019).
Slides made by BSM and EM for the calcareous nannofossil study are curated at the Collections de Géologie de Lyon de l'Université Lyon 1 (collection code FSL).
The supplement related to this article is available online at: https://doi.org/10.5194/bg-16-2501-2019-supplement.
BSM and EM contributed equally to this work. BSM and EM designed the study and compiled the data; BP provided accumulation rates; BSM performed the calculations; PA constructed the maps; EM, FG and JP provided unpublished data; BSM, EM and FG devised the model, with advice from GE. BSM, EM, FG and GE wrote the text, with significant inputs from all other authors.
The authors declare that they have no conflict of interest.
Emanuela Mattioli acknowledges funding from INSU SYSTER 2011–2012 and INTERRVIE 2014–2015. Baptiste Suchéras-Marx kindly thanks Jorijntje Henderiks for constructive comments on a previous version of the dataset. Baptiste Suchéras-Mar thanks the team Climat at Cerege.
This paper was edited by Jack Middelburg and reviewed by Nina Keul and one anonymous referee.
Alvarez, L. W., Alvarez, W., Asaro, F., and Michel, H. V.: Extraterrestrial cause for the Cretaceous-Tertiary extinction, Science, 208, 1095–1108, https://doi.org/10.1126/science.208.4448.1095, 1980.
Aubry, M.-P., Bord, D., Beaufort, L., Kahn, A., and Boyd, S.: Trends in size changes in the coccolithophorids, calcareous nannoplankton, during the Mesozoic: A pilot study, Micropaleontology, 51, 309–318, https://doi.org/10.2113/gsmicropal.51.4.309, 2005.
Balch, W. M.: Re-evaluation of the physiological ecology of coccolithophores, in: Coccolithophores: From molecular processes to global impact, edited by: Thierstein, H. R. and Young, J. R., Springer-Verlag, Heidelberg, Germany, 165–190, https://doi.org/10.1007/978-3-662-06278-4_7, 2004.
Barnosky, A. D.: Distinguishing the effects of the Red Queen and Court Jester on Miocene mammal evolution in the northern Rocky Mountains, J. Vertebr. Paleontol., 21, 172–185, https://doi.org/10.1671/0272-4634(2001)021[0172:DTEOTR]2.0.CO;2, 2001.
Baumann, K.-H., Böckel, B., and Frenz, M.: Coccolith contribution to South Atlantic carbonate sedimentation, in: Coccolithophores: From molecular processes to global impact, edited by: Thierstein, H. R. and Young, J. R., Springer-Verlag, Heidelberg, Germany, 367–402, https://doi.org/10.1007/978-3-662-06278-4_14, 2004.
Blakey, R. C.: Gondwana paleogeography from assembly to breakup – A 500 m.y. odyssey, Geol. Soc. Am. Spec. Paper, 441, 1–28, https://doi.org/10.1130/2008.2441(01), 2008.
Bolton, C. T., Hernandez-Sanchez, M. T., Fuertes, M.-A., Gonzalez-Lemos, S., Abrevaya, L., Mendez-Vicente, A., Flores, J.-A., Probert, I., Giosan, L., Johnson, J., and Stoll, H. M.: Decrease in coccolithophore calcification and CO2 since the middle Miocene, Nat. Commun., 7, 10284, https://doi.org/10.1038/ncomms10284, 2016.
Bown, P. R.: Calcareous nannoplankton evolution: a tale of two oceans, Micropaleontology, 51, 299–308, https://doi.org/10.2113/gsmicropal.51.4.299, 2005.
Broecker, W. S. and Clark, E.: Ratio of coccolith CaCO3 to foraminifera CaCO3 in late Holocene deep sea sediments, Paleoceanography, 24, PA3205, https://doi.org/10.1029/2009PA001731, 2009.
Cermeño, P., Falkowski, P. G., Romero, O. E., Schaller, M. F., and Vallina, S. M.: Continental erosion and the Cenozoic rise of marine diatoms, P. Natl. Acad. Sci. USA, 112, 4239-4244, https://doi.org/10.1073/pnas.1412883112, 2015.
Channel, J. E. T., Erba, E., Muttoni, G., and Tremolada, F.: Early Cretaceous magnetic stratigraphy in the APTICORE drill core and adjacent outcrop at Cismon (Southern Alps, Italy), and the correlation to the proposed Barremian/Aptian boundary stratotype, Geol. Soc. Am. Bull., 112, 1430–1443, 2000.
Courtillot, V., Besse, J., Vandamme, D., Montigny, R., Jaeger, J.-J., and Cappetta, H.: Deccan flood basalts at the Cretaceous/Tertiary boundary?, Earth Planet. Sc. Lett., 80, 361–374, https://doi.org/10.1016/0012-821X(86)90118-4, 1986.
Erba, E. and Tremolada, F.: Nannofossil carbonate fluxes during the Early Cretaceous: phytoplankton response to nutrification episodes, atmospheric CO2, and anoxia, Paleoceanography, 19, PA1008, https://doi.org/10.1029/2003PA000884, 2004.
Falkowski, P. G., Katz, M. E., Knoll, A. H., Quigg, A., Raven, J. A., Schofield, O., and Taylor, F. J. R.: The evolution of modern eukaryotic phytoplankton, Science, 305, 354–360, https://doi.org/10.1126/science.1095964, 2004.
Foster, G. L., Royer, D. L., and Lunt, D. J.: Future climate forcing potentially without precedent in the last 420 million years, Nat. Commun., 8, 14845, https://doi.org/10.1038/ncomms14845, 2017.
Fraaije, R. H. B., Van Bakel, B. W. M., Jagt, J. W. M., and Viegas, P. A.: The rise of a novel, plankton-based marine ecosystem during the Mesozoic: a bottom-up model to explain new higher-tier invertebrate morphotypes, B. Soc. Geol. Mex., 70, 187–200, 2018.
Frada, M., Probert, I., Allen, M. J., Wilson, W. H., and de Vargas, C.: The “Cheshire Cat” escape strategy of the coccolithophore Emiliania huxleyi in response to viral infection, P. Natl. Acad. Sci. USA, 105, 15944–15949, https://doi.org/10.1073/pnas.0807707105, 2008.
Friedrich, O., Norris, R. D., and Erbacher, J.: Evolution of middle to Late Cretaceous oceans-A 55 m.y. record of Earth's temperature and carbon cycle, Geology, 40, 107–110, 2012.
Gardin, S., Krystyn, L., Richoz, S., Bartolini, A., and Galbrun, B.: Where and when the earliest coccolithophores?, Lethaia, 45, 507–523, https://doi.org/10.1111/j.1502-3931.2012.00311.x, 2012.
Geisen, M., Bollmann, J., Herrle, J. O., Mutterlose, J., and Young, J. R.: Calibration of the random settling technique for calculation of absolute abundances of calcareous nannoplankton, Micropaleontology, 45, 437–442, https://doi.org/10.2307/1486125, 1999.
Gollain, G., Mattioli, E., Kenjo, S., Bartolini, A., and Reboulet, S.: Size patterns of the coccolith Watznaueria barnesiae in the lower Cretaceous: Biotic versus abiotic forcing, Mar. Micropaleontol., https://doi.org/10.1016/j.marmicro.2019.03.012, 2019.
Gradstein, F. M., Ogg, J. G., Schmitz, M. D., and Ogg, G. M.: The Geologic Time Scale 2012, Elsevier, Amsterdam, 1144 pp., 2012.
Hammer, Ø., Harper, D. A. T., and Ryan, P. D.: PAST: paleontological statistics software package for education and data analysis, Palaeontol. Electronica, 4, 1–9, 2001.
Hannisdal, B., Henderiks, J., and Liow, L. H.: Long-term evolutionary and ecological responses of calcifying phytoplankton to changes in atmospheric CO2, Glob. Change Biol., 18, 3504–3516, https://doi.org/10.1111/gcb.12007, 2012.
Hart, M. B., Hylton, M. D., Oxford, M. J., Price, G. D., Hudson, W., and Smart, C. W.: The search for the origin of the planktic foraminifera, J. Geol. Soc. London, 160, 341–343, https://doi.org/10.1144/0016-764903-003, 2003.
Henderiks, J.: Coccolithophore size rules – Reconstructing ancient cell geometry and cellular calcite quota from fossil coccoliths, Mar. Micropaleontol., 67, 143–154, https://doi.org/10.1016/j.marmicro.2008.01.005, 2008.
Herrle, J. O.: Reconstructing nutricline dynamics of mid-Cretaceous oceans: evidence from calcareous nannofossils from the Niveau Paquier black shale (SE France), Mar. Micropaleontol., 47, 307–321, 2003
Herrmann, S. and Thierstein, H. R.: Cenozoic coccolith size changes–evolutionary and/or ecological controls?, Palaeogeogr. Palaeocl., 333/334, 92–106, https://doi.org/10.1016/j.palaeo.2012.03.011, 2012.
Hull, P. M., Norris, R. D., Bralower, T. J., and Schueth, J. D.: A role for chance in marine recovery from the end–Cretaceous extinction, Nat. Geosci., 4, 856–860, https://doi.org/10.1038/ngeo1302, 2011.
Katz, M. E., Finkel, Z. V., Grzebyk, D., Knoll, A. H., and Falkowski, P. G.: Evolutionary trajectories and biogeochemical impacts of marine eukaryotic phytoplankton, Annu. Rev. Ecol. Evol. S., 35, 523–556, https://doi.org/10.1146/annurev.ecolsys.35.112202.130137, 2004.
Klaas, C. and Archer, D. E.: Association of sinking organic matter with various types of mineral ballast in the deep sea: Implications for the rain ratio, Global Biogeochem. Cy., 16, 1116, https://doi.org/10.1029/2001GB001765, 2002.
Knoll, A. H. and Follows, M. J.: A bottom-up perspective on ecosystem change in Mesozoic oceans, P. Roy. Soc. B-Biol. Sci., 283, 20161755, https://doi.org/10.1098/rspb.2016.1755, 2016.
Kooistra, W. H. C. F., Gersonde, R., Medlin, L. K., and Mann, D. G.: The origin and evolution of the diatoms: their adaptation to a planktonic existence, in: evolution of primary producers in the sea, edited by: Falkowski, P. G. and Knoll, A. H., Academic Press, Burlington, USA, 207–249, https://doi.org/10.1016/B978-012370518-1/50012-6, 2007.
Lees, J. A., Bown, P. R., and Mattioli, E.: Problems with proxies? Cautionary tales of calcareous nannofossil paleoenvironmental indicators, Micropaleontol., 51, 333–343, 2005.
Litchman, E., Klausmeier, C. A., Miller, J. R., Schofield, O. M., and Falkowski, P. G.: Multi-nutrient, multi-group model of present and future oceanic phytoplankton communities, Biogeosciences, 3, 585–606, https://doi.org/10.5194/bg-3-585-2006, 2006.
Margalef, R.: Life-forms of phytoplankton as survival alternatives in an unstable environment, Oceanol. Acta, 1, 493–509, 1978.
Mattioli, E., Pittet, B., Petitpierre, L., and Mailliot, S.: Dramatic decrease of pelagic carbonate production by nannoplankton across the Early Toarcian anoxic event (T-OAE), Glob. Planet. Change 65, 134–145, https://doi.org/10.1016/j.gloplacha.2008.10.018, 2009.
Mejía, L. M., Méndez-Vicente, A., Abrevaya, L., Lawrence, K. T., Ladlow, C., Bolton, C., Cacho, I., and Stoll, H.: A diatom record of CO2 decline since the late Miocene, Earth Planet. Sc. Lett., 479, 18–33, https://doi.org/10.1016/j.epsl.2017.08.034, 2017.
Monteiro, F. M., Bach, L. T., Brownlee, C., Bown, P. R., Rickaby, R. E. M., Poulton, A. J., Tyrrell, T., Beaufort, L., Dutkiewicz, S., Gibbs, S. J., Gutowska, M. A., Lee, R., Riebesell, U., Young, J. R., and Ridgwell, A.: Why marine phytoplankton calcify, Sci. Adv., 2, e1501822, https://doi.org/10.1126/sciadv.1501822, 2016.
Müller, R. D., Sdrolias, M., Gaina, C., Steinberger, B., and Heine, C.: Long-term sea-level fluctuations driven by ocean basin dynamics, Science, 319, 1357–1362, https://doi.org/10.1126/science.1151540, 2008.
Mutterlose, J., Bottini, C., Schouten, S., and Sinninghe Damsté, J.S.: High sea-surface temperatures during the early Aptian Oceanic Anoxic Event 1a in the Boreal Realm, Geology, 42, 439–442, https://doi.org/10.1130/g35394.1, 2014
Poulton, A. J., Adey, T. R., Balch, W. M., and Holligan, P. M.: Relating coccolithophore calcification rates to phytoplankton community dynamics: Regional differences and implications for carbon export, Deep-Sea Res. Pt. 2, 54, 538–557, https://doi.org/10.1016/j.dsr2.2006.12.003, 2007.
Pyenson, N. D., Kelley, N. P., and Parham, J. F.: Marine tetrapod macroevolution: Physical and biological drivers on 250 Ma of invasions and evolution in ocean ecosystems, Palaeogeogr. Palaeocl., 400, 1–8, 2014
Reznick, D., Bryant, M. J., and Bashey, F.: r- and K-selection revisited: the role of population regulation in life–history evolution, Ecology, 83, 1509–1520, 2002.
Roth, P. H.: Mesozoic paleoceanography of the North Atlantic and Tethys Oceans, in: North Atlantic Paleoceanography, edited by: Summerhayes, C. P. and Shackleton, N. J., Geol. Soc. Spec. Publ. Lond., 21, 299–320, 1986.
Roth, P. H.: Ocean circulation and calcareous nannoplankton evolution during the Jurassic and Cretaceous, Palaeogeogr. Palaeocl., 74, 111–126, https://doi.org/10.1016/0031-0182(89)90022-9, 1989.
Spencer-Cervato, C.: The Cenozoic deep sea microfossil record: explorations of the DSDP/ODP sample set using the Neptune database, Palaeontol. Electronica, 2, 1–270, 1999.
Suchéras-Marx, B. and Henderiks, J.: Downsizing the pelagic carbonate factory: Impacts of calcareous nannoplankton evolution on carbonate burial over the past 17 million years, Glob. Planet. Change, 123, 97–109, https://doi.org/10.1016/j.gloplacha.2014.10.015, 2014.
Suchéras-Marx, B., Guihou, A., Giraud, F., Lécuyer, C., Allemand, P., Pittet, B., and Mattioli, E.: Impact of the Middle Jurassic diversification of Watznaueria (coccolith–bearing algae) on the carbon cycle and δ13C of bulk marine carbonates, Glob. Planet. Change, 86–87, 92–100, https://doi.org/10.1016/j.gloplacha.2012.02.007, 2012.
Suchéras-Marx, B., Giraud, F., Mattioli, E., and Escarguel, G.: Paleoenvironmental and paleobiological origins of coccolithophorid genus Watznaueria emergence during the Late Aalenian–Early Bajocian, Paleobiology, 41, 415–435, https://doi.org/10.1017/pab.2015.8, 2015.
Suchéras-Marx, B., Mattioli, E., Allemand, P., Giraud, F., Pittet, B., Plancq, J., Escarguel, G.: Calcareous nannofossils absolute abundance and accumulation rates, PANGAEA, https://doi.org/10.1594/PANGAEA.902908, last access: 24 June 2019.
Thomsen, E.: Seasonal variation in boreal Early Cretaceous calcareous nannofossils, Mar. Micropaleontol., 15, 123–152, https://doi.org/10.1016/0377-8398(89)90008-X, 1989.
Tozzi, S., Schofield, O. M., and Falkowski, P. G.: Historical climate change and ocean turbulence as selective agents for two key phytoplankton functional groups, Mar. Ecol. Prog. Ser., 274, 123–132, https://doi.org/10.3354/meps274123, 2004.
Van Valen, L. A.: A new evolutionary law, Evol. Theor., 1, 1–30, 1973.
Vermeij, G. J.: The Mesozoic marine revolution: evidence from snails, predators and grazers, Paleobiology, 3, 245–258, https://doi.org/10.1017/S0094837300005352, 1977.
Westermann, G. E. G.: Global bio-events in mid-Jurassic ammonites controlled by seaways, in: The Ammonoidea: environment, ecology and evolutionary change, edited by: House, M. R., The Systematics Association Special Volume, Oxford University Press, UK, 187–226, 1993
Winter, A., Jordan, R. W., and Roth, P. H.: Biogeography of living coccolithophores in ocean waters, in: Coccolithophores, edited by: Winter, A. and Siesser, W. G., Cambridge University Press, Cambridge, UK, 161–178, 1994.
Witkowski, C. R., Weijers, J. W. H., Blais, B., Schouten, S., and Sinninghe Damsté, J. S.: Molecular fossils from phytoplankton reveal secular pCO2 trend over the Phanerozoic, Sci. Adv., 4, eaat4556, https://doi.org/10.1126/sciadv.aat4556, 2018.
Ziegler, P. A.: Evolution of the Arctic–North Atlantic and the Western Tethys, Am. Assoc. Pet. Geol. Memoir, 43, 164–196, 1988.
Ziveri, P., Rutten, A., de Lange, G. J., Thomson, J., and Corselli, C.: Present-day coccolith fluxes recorded in central eastern Mediterranean sediment traps and surface sediments, Palaeogeogr. Palaeocl., 158, 175–195, https://doi.org/10.1016/S0031-0182(00)00049-3, 2000.