the Creative Commons Attribution 4.0 License.
the Creative Commons Attribution 4.0 License.
 | 22 Jan 2019
The post-monsoon carbon biogeochemistry of the Hooghly–Sundarbans estuarine system under different levels of anthropogenic impacts
Manab Kumar Dutta
Sanjeev Kumar
Rupa Mukherjee
Prasun Sanyal
Sandip Kumar Mukhopadhyay
The present study focused on understanding differences in the post-monsoon carbon (C) biogeochemistry of two adjacent estuaries undergoing different levels of anthropogenic stresses by investigating anthropogenically influenced Hooghly estuary and mangrove-dominated estuaries of the Sundarbans in the north-eastern India. The salinity of well-oxygenated estuaries of the Sundarbans (DO: 91 %–104 %) varied over a narrow range (12.74–16.69) relative to the Hooghly estuary (0.04–10.37). A mixing model suggested a combination of processes including freshwater intrusion, carbonate precipitation and carbonate dissolution to be a major factor controlling dissolved inorganic C (DIC) dynamics in the freshwater regime of the Hooghly, whereas phytoplankton productivity and CO2 outgassing dominated in the mixing regime. In the Sundarbans, the removal of DIC (via CO2 outgassing, phytoplankton uptake and export to the adjoining continental shelf region) dominated its addition through mineralization of mangrove-derived organic C. The concentration of dissolved organic C (DOC) in the Hooghly was ∼40 % higher than in the Sundarbans, which was largely due to the cumulative effect of anthropogenic inputs, DOC–POC interconversion and groundwater contribution rather than freshwater-mediated input. The measured δ13CPOC in the Hooghly suggested particulate organic matter contributions from different sources (freshwater runoff, terrestrial C3 plants and anthropogenic discharge), whereas the contribution from C3 plants was dominant at the Sundarbans. The significant departure of δ13CPOC from typical mangrove δ13C in the mangrove-dominated Sundarbans suggested significant particulate organic C (POC) modification due to degradation by respiration. The average pCO2 in the Hooghly was higher by ∼1291 µatm compared to the Sundarbans with surface runoff and organic matter degradation by respiration as dominant factors controlling pCO2 in the Hooghly and Sundarbans, respectively. The entire Hooghly–Sundarbans system acted as a source of CO2 to the regional atmosphere with ∼17 times higher emission from the Hooghly compared to the Sundarbans. Taken together, the cycling of C in estuaries with different levels of anthropogenic influences is evidently different, with significantly higher CO2 emission from the anthropogenically influenced estuary than the mangrove-dominated ones.
- Article
(5268 KB) - Full-text XML
- BibTeX
- EndNote


Situated at the interface of land and sea, estuaries are highly susceptible to anthropogenic inputs and undergo intricate biogeochemical and hydrological processes. Estuaries play an important role in modulating the global carbon (C) cycle and the anthropogenic carbon dioxide (CO2) budget (Bauer et al., 2013; Regnier et al., 2013; Le Quéré et al., 2016). Atmospheric CO2 is sequestered into terrestrial systems through photosynthesis and weathering reactions and is transported to the ocean via rivers and estuaries. Tropical rivers, which constitute ∼66 % of global river water discharge, deliver ∼0.53 Pg C to the estuaries annually (Huang et al., 2012). The majority of this exported C is in dissolved form (dissolved inorganic C (DIC): 0.21 Pg C yr−1 and dissolved organic C (DOC): 0.14 Pg C yr−1) with some contribution as particulate (particulate organic C (POC): 0.13 Pg C yr−1 and particulate inorganic C (PIC): 0.05 Pg C yr−1) (Huang et al., 2012). Although estuaries are only ∼4 % of the continental shelf regions, CO2 emission flux from estuarine surface waters is as high as CO2 uptake in continental shelf regions of the world, albeit with large uncertainty (Borges et al., 2005; Chen and Borges, 2009; Cai et al., 2006; Cai, 2011). This suggests estuaries are not only active pathways for transport of C (Ittekkot and Laane, 1991) but also hotspots for biogeochemical modification of labile organic matter (OM) (Frankignoulle et al., 1998).
Mangroves covering 137 760 km2 along tropical and subtropical estuaries and coastlines (Giri et al., 2011) are among the most productive natural ecosystems in the world with net primary productivity of 218±72 Tg C yr−1 (Bouillon et al., 2008). Fine-root production coupled with litter fall and wood production are primary sources of mangrove-derived C to intertidal forest sediment (Bouillon et al., 2008). The fate of this mangrove-derived C remains poorly understood. Despite taking C burial and CO2 emission flux across mangrove sediment–atmosphere interface into account, estimates of global mangrove C budget showed a significant imbalance between mangrove net primary productivity and its sinks (Bouillon et al., 2008). Earlier studies reported mangroves to be responsible for ∼10 % of the global terrestrial derived POC and DOC exports to the coastal zones (Jennerjahn and Ittekkot, 2002; Dittmar et al., 2006). However, recent studies proposed DIC exchange as a major C export pathway from mangrove forests, which was ∼70 % of the total mineralized C transport from mangrove forests to coastal waters (Maher et al., 2013; Alongi, 2014; Alongi and Mukhopadhyay, 2014). Another study reported groundwater advection from mangroves to be responsible for 93 %–99 % and 89 %–92 % of total DIC and DOC exports to the coastal ocean (Maher et al., 2013). Upon extrapolating these C exports to the global mangrove area, it was found that the calculated C exports were similar to the missing mangrove C sink (Sippo et al., 2016). The remaining C that escapes export gets buried in subsurface sediment layers and participates either in complex anaerobic processes (linked to production of biogenic trace gases like CH4) or undergoes long-term sequestration (Jennerjhan and Ittekkot, 2002; Barnes et al., 2006; Kristensen and Alongi, 2006; Donato et al., 2011; Linto et al., 2014).
Apart from lateral transport of dissolved and particulate C, biogeochemical processes such as primary production, OM mineralization, carbonate precipitation ∕ dissolution and water–atmosphere CO2 exchange occurring in the estuary also regulate the inorganic and organic C biogeochemistry of a mangrove-dominated estuary. These processes largely depend upon pH, nutrient availability and euphotic depth variability, as well as planktonic and bacterial biodiversity and community compositions. The biogeochemical cycling of bioavailable elements, such as C and N, in a mangrove-dominated estuary is largely different from anthropogenically polluted estuary, where much of the OM is derived from domestic, agricultural and industrial waste. In anthropogenically affected estuarine systems, heterotrophy generally dominates over autotrophy (Heip et al., 1995; Gattuso et al., 1998) and a substantial fraction of biologically reactive OM gets mineralized within the system (Servais et al., 1987; Ittekkot, 1988; Hopkinson et al., 1997; Moran et al., 1999). However, this is not always the case, as observed in the Guanabara Bay, Brazil, which acts as a strong CO2 sink enhanced by eutrophication (Cotovicz Jr. et al., 2015). The lack of ample rate measurements of the above-mentioned biogeochemical processes in many regions of the world restrains biogeochemists from an in-depth understanding of these processes in different ecological settings. It also leads to an uncertainty in the estimation of a coastal C budget on a global scale.
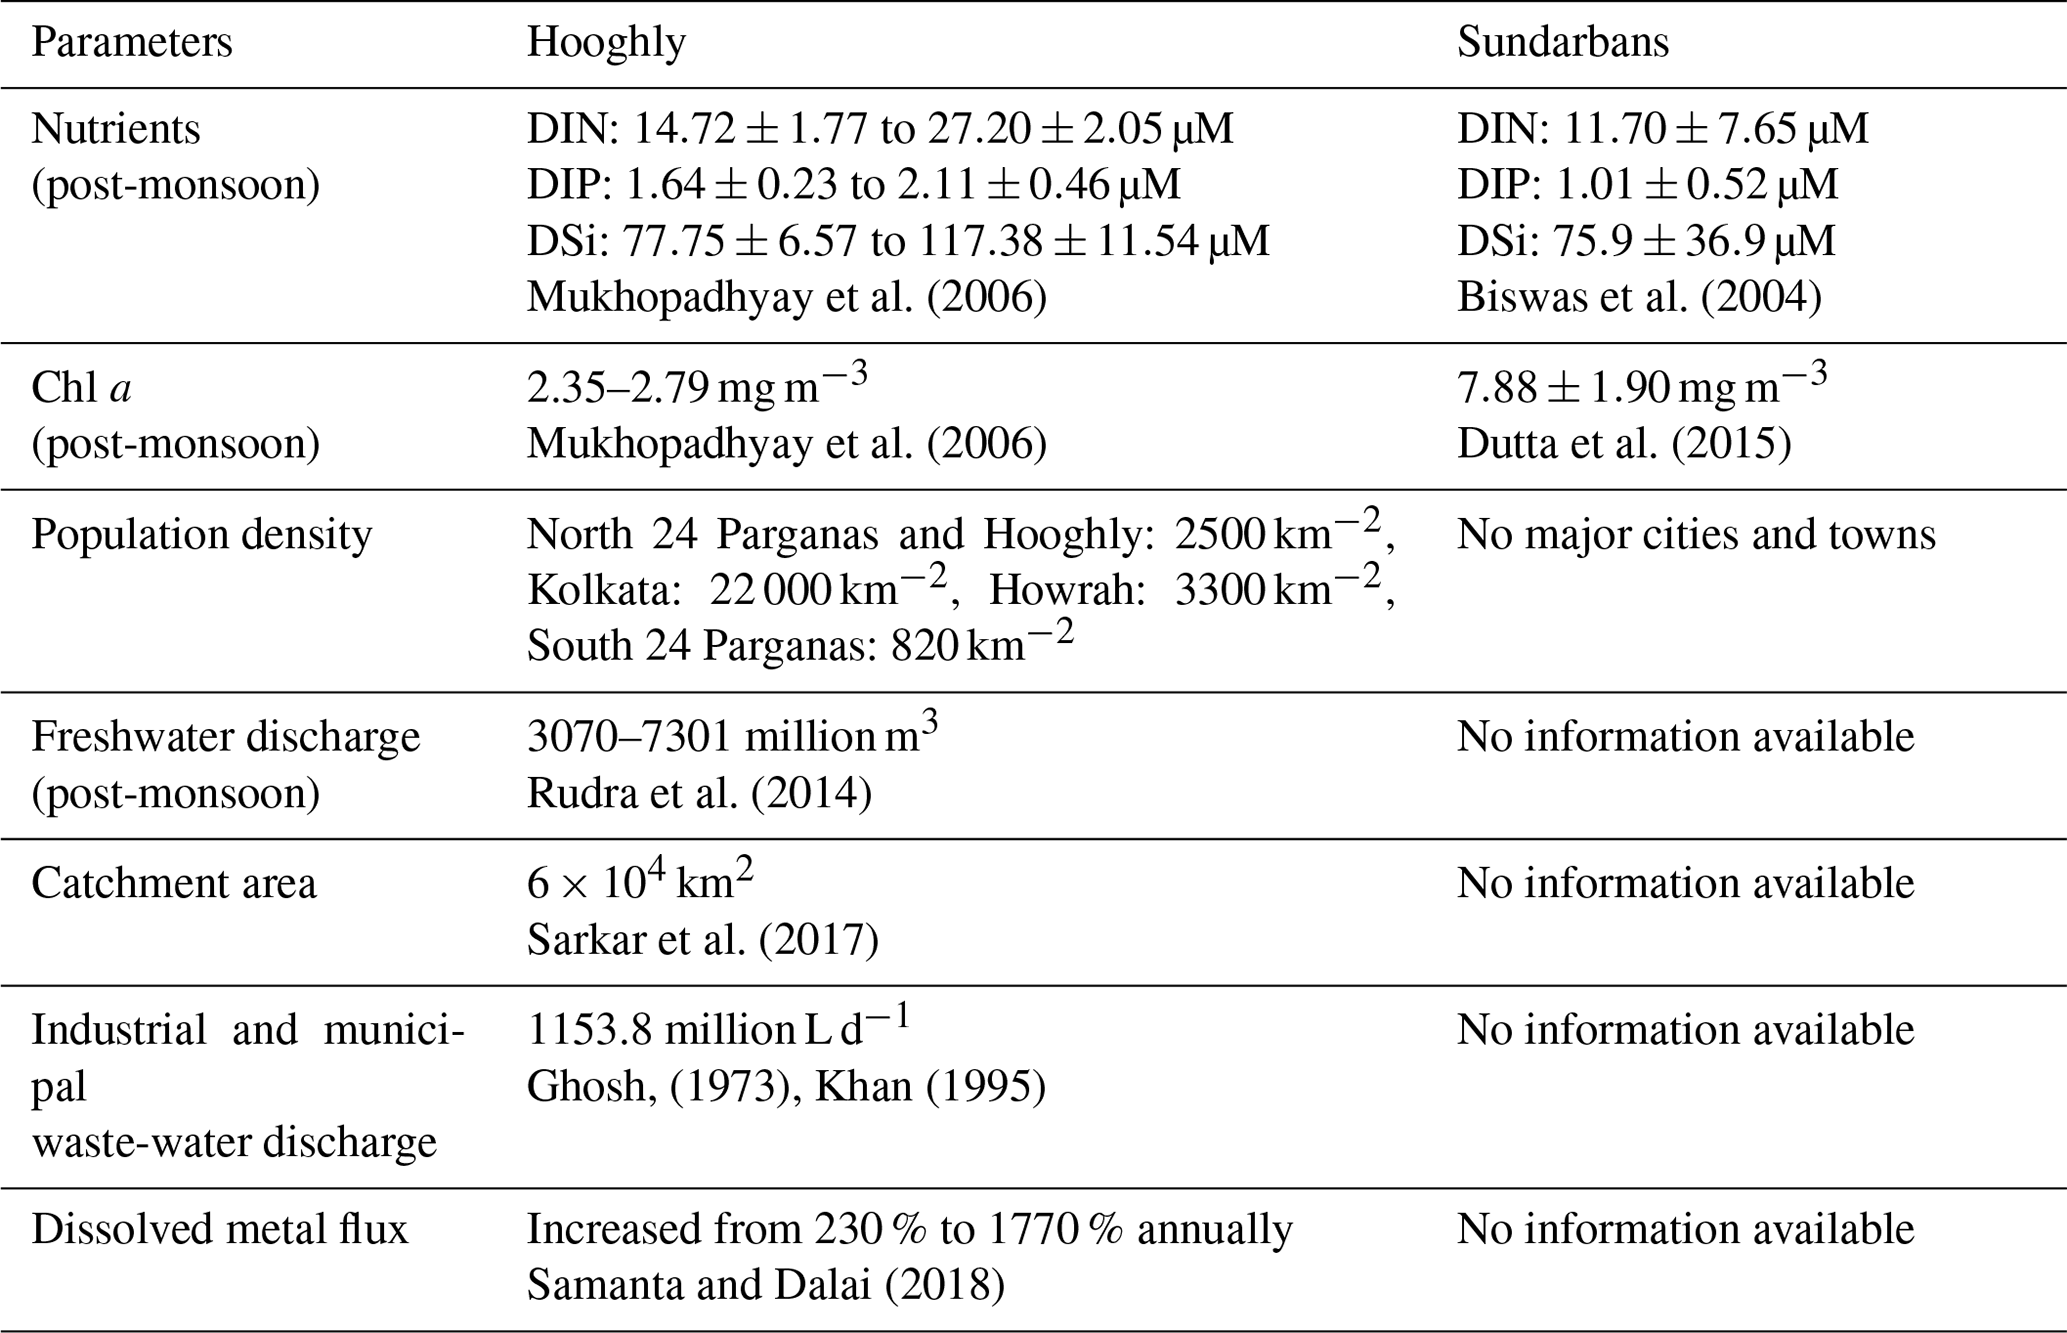
In India, research related to C biogeochemistry of estuarine ecosystems has been in focus since last two decades with an emphasis on estuaries located in southern India (e.g. Bouillon et al., 2003; Sarma et al., 2012, 2014; Bhavya et al., 2017, 2018). The estuaries located in the northern part of India have received limited attention, including the adjacently located Hooghly estuary and the estuaries of the Sundarbans, which are part of the Ganga–Brahmaputra river system (Fig. 1). Characteristically, the Hooghly and the estuaries of the Sundarbans are different from each other. The Hooghly estuary experiences significantly higher anthropogenic influence compared to the mangrove-dominated Sundarbans as evidenced by high nutrient and freshwater inputs (Table 1). The anthropogenic influences largely include a supply of the industrial effluents and domestic sewage on a daily basis from industries and major cities (Kolkata and Howrah) located upstream (Table 1). The industries along the Hooghly are principally jute (Corchorus olitorius)-based, which produce fabrics for packaging a wide range of agricultural and industrial commodities.
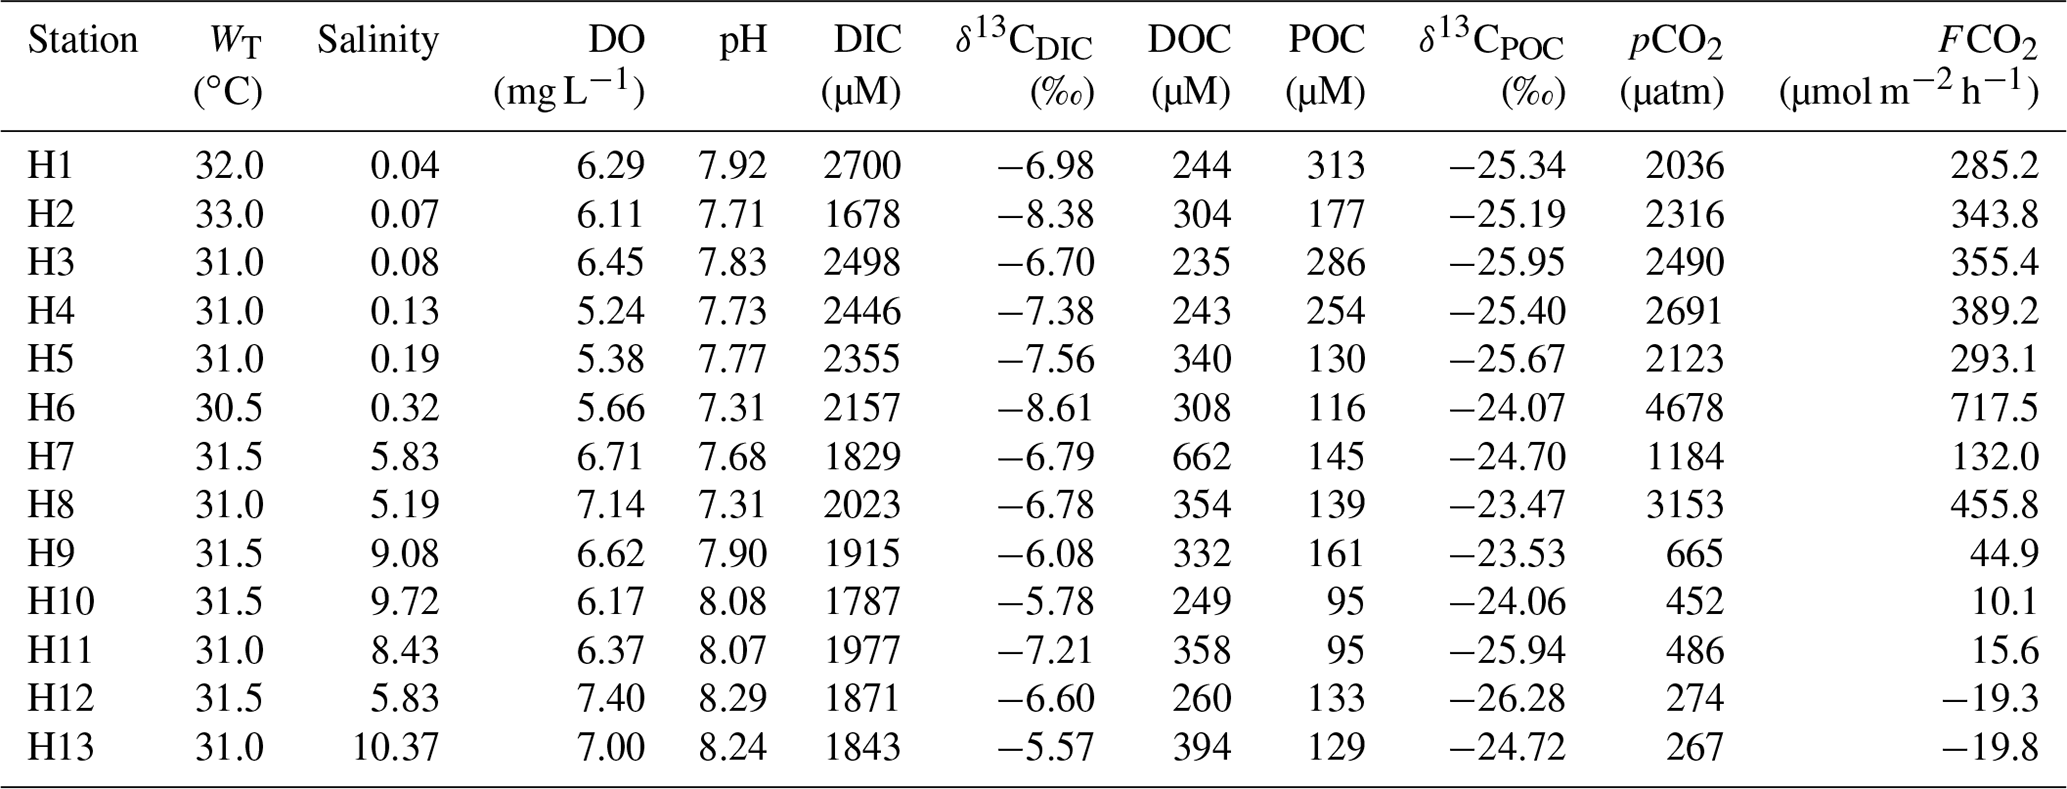
Table 1General characteristics of the Hooghly estuary and the estuaries of the Sundarbans.
Earlier, the major focus of biogeochemical studies in the Hooghly and the estuaries of the Sundarbans had been on the biogeochemistry of trace gases (Mukhopadhyay et al., 2002; Biswas et al., 2004, 2007; Ganguly et al., 2008, 2009; Dutta et al., 2013, 2015, 2017) with the exception of one comprehensive study on nutrient budgets at the Hooghly estuary (Mukhopadhyay et al., 2006). Recently, attempts have been made to understand different aspects of C cycling in these two estuaries (Samanta et al., 2015; Ray et al., 2015, 2018; Akhand et al., 2016). Samanta et al. (2015) comprehensively studied DIC dynamics in the Hooghly estuary, whereas Akhand et al. (2016) focused on DIC and pCO2 at the Hooghly–Matla estuary. Different aspects of C cycling in the Hooghly–Sundarbans system have been reported by Ray et al. (2015, 2018). Barring Samanta et al. (2015), which has wider spatial and temporal coverages with respect to DIC in the Hooghly, other studies are severely limited in spatial coverage with focus on the middle to lower parts of the Hooghly estuary and a few locations in the Sundarbans (one location by Ray et al., 2015, 2018; three locations by Akhand et al., 2016). Given the vast expanse of these estuaries, the extrapolation of data from these studies for the entire ecosystem may lead to overestimation and underestimation.
The primary objective of the present study was to understand differences in varied aspects of the C cycle (DIC, DOC, POC and CO2) of the Hooghly and the estuaries of the Sundarbans during the post-monsoon season with relatively better spatial coverage compared to previous studies. The post-monsoon sampling was chosen because of relatively stable estuarine conditions for wider spatial coverage and peak mangrove leaf litter fall during this season (Ray et al., 2011), which may have an influence on estuarine C dynamics. Considering the different natures and quantities of supplied OM within these two contrasting systems, we hypothesized C metabolism in these two estuaries to be very different with higher CO2 exchange flux from anthropogenically influenced estuary compared to the mangrove-dominated one. Specifically, the major aims of the present study were to investigate (a) factors controlling DIC and DOC dynamics in the region, (b) the sources and fate of POC in these two contrasting systems, and (c) the partial pressure of CO2 (pCO2) and its controlling mechanisms along with exchange across the water–atmosphere interface at the Hooghly–Sundarbans during the post-monsoon period.
2.1 Study area
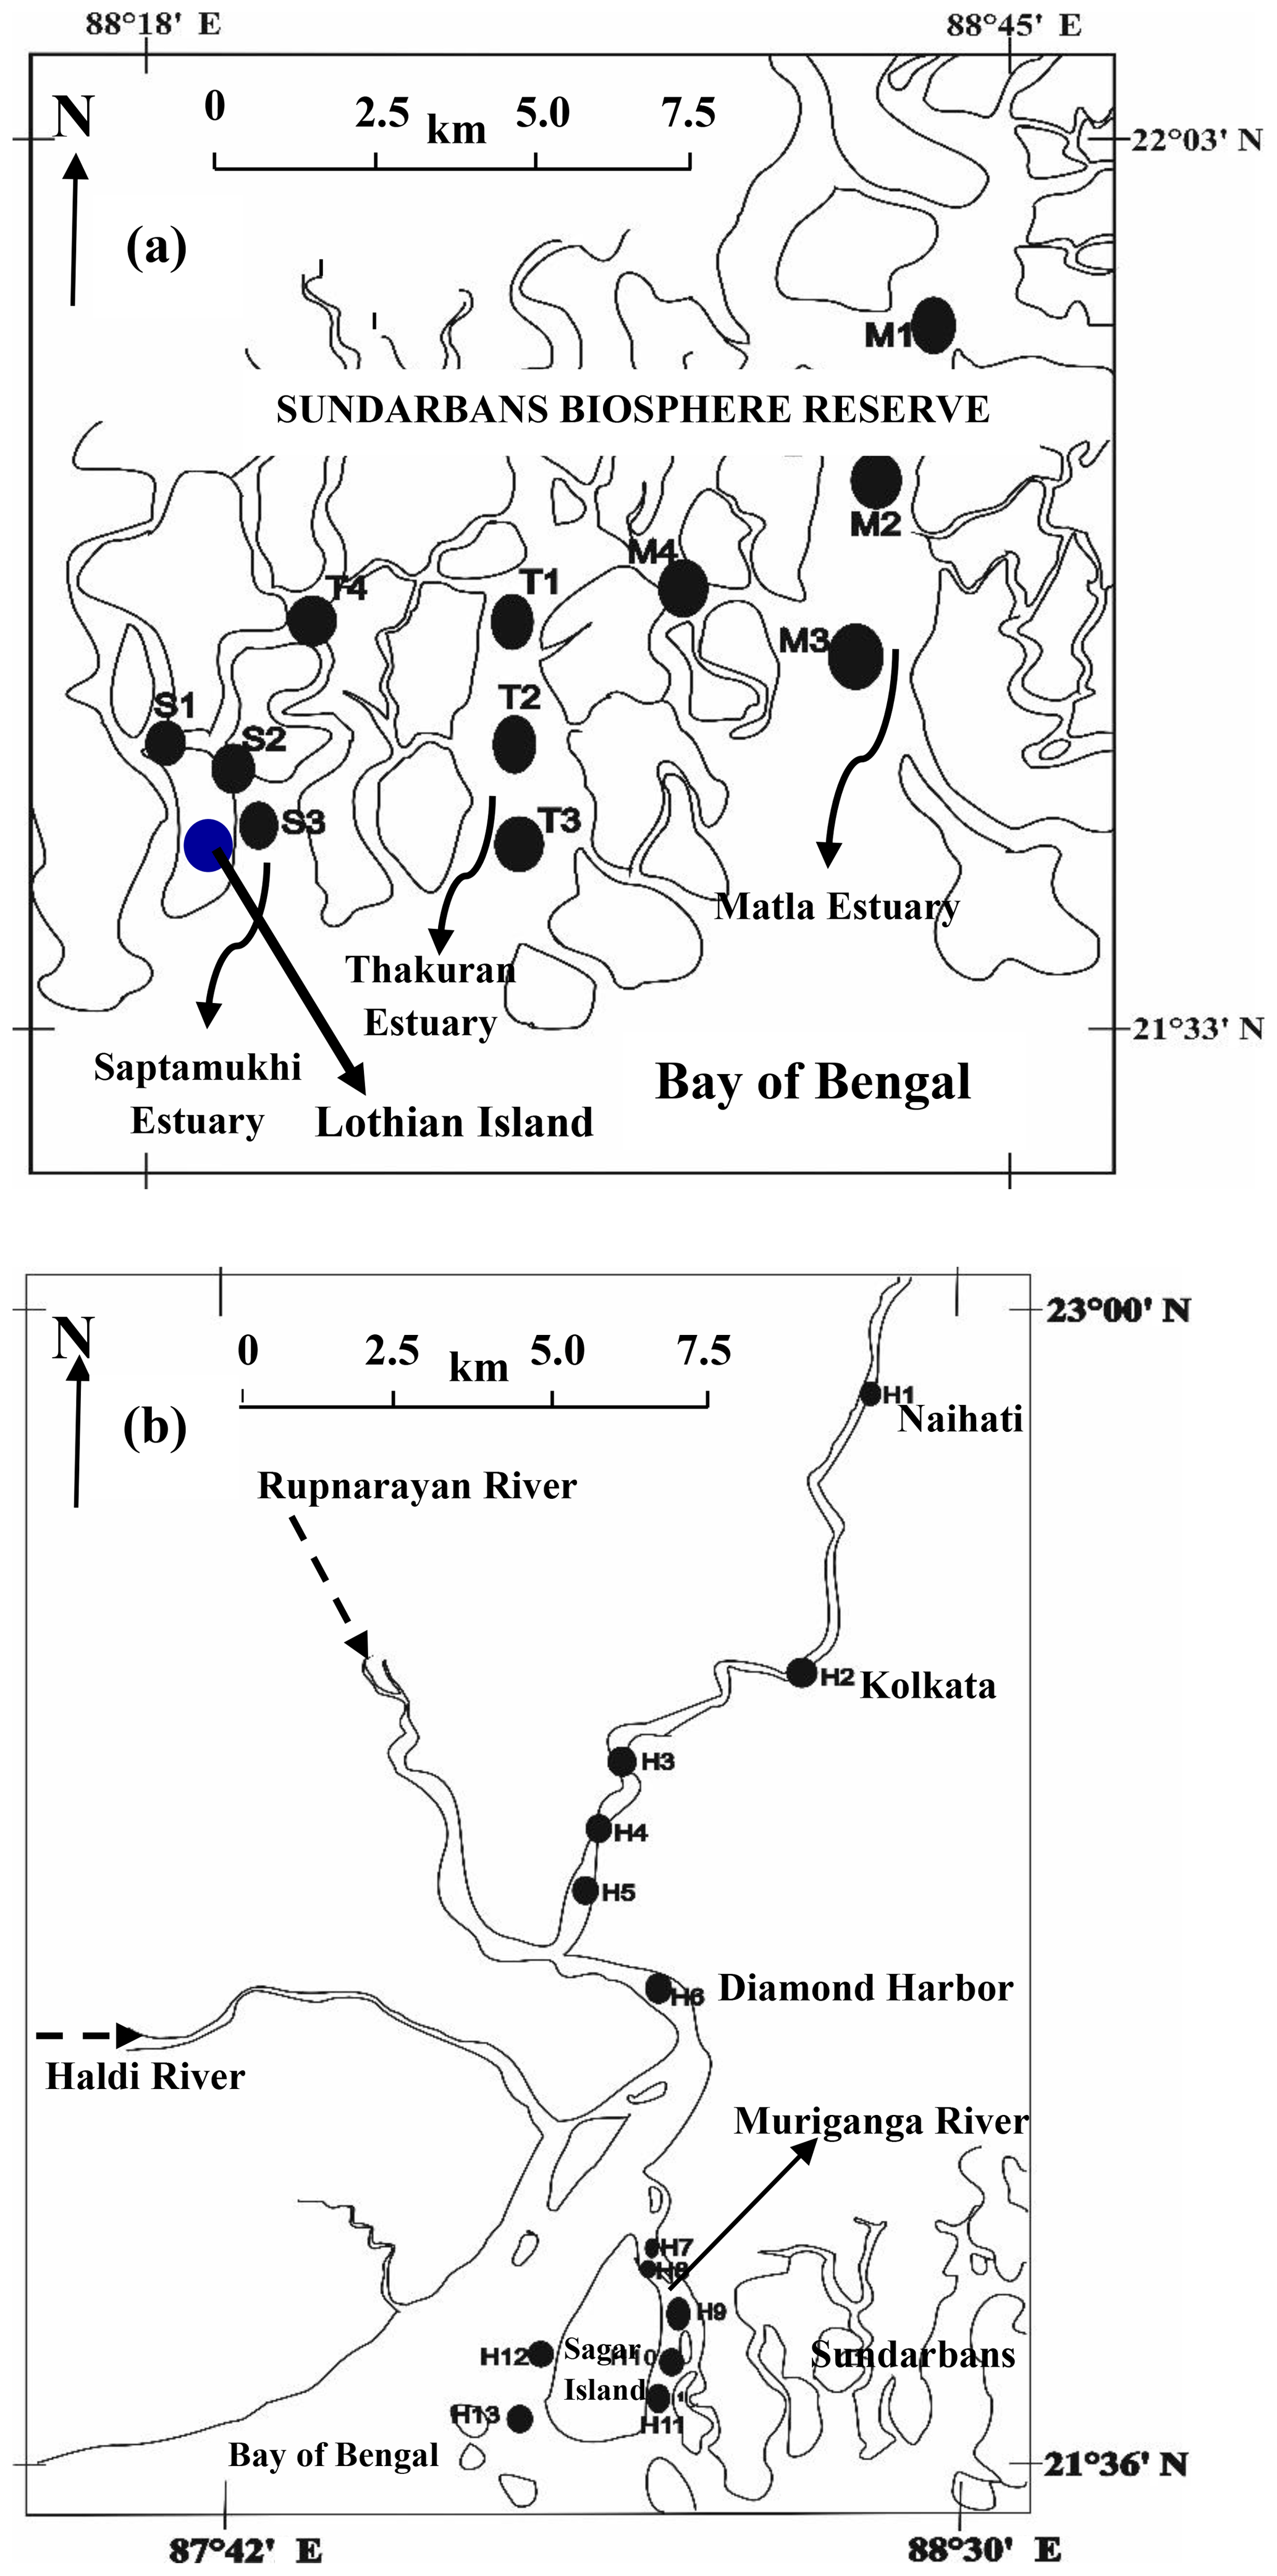
The present study was carried out in the mangrove dominated estuaries of the Indian Sundarbans and anthropogenically dominated Hooghly estuary in northeastern India. The Sundarbans (21∘32′ and 22∘40′ N: 88∘05′ and 89∘ E, Fig. 1a), inscribed as a UNESCO world heritage site, is the largest mangrove forest in the world situated at the land–ocean boundary of the Ganges–Brahmaputra delta and the Bay of Bengal (BOB). Out of the 10 200 km2 area of the Sundarbans, 41 % is in India and the rest is in Bangladesh. The Indian part of Sundarbans (or Sundarbans Biosphere Reserve) contains 4200 km2 of mangrove reserve forest and 1800 km2 of estuarine waterways along with reclaimed areas. The Sundarbans is crisscrossed by several rivers, such as Muriganga, Saptamukhi, Thakuran, Matla, Bidya, Gosaba and Haribhanga, forming a sprawling archipelago of 102 islands covered with thick mangroves mostly composed of Avicennia alba, Avicennia marina and Avicennia officinalis. A semidiurnal tide with a mean depth ∼6 m is a general characteristic of the estuary (Dutta et al., 2015).
The second study site, the Hooghly estuary (21∘31′–23∘20′ N and 87∘45′–88∘45′ E), is the first deltaic offshoot of the Ganges, which ultimately mixes with the northern BOB. Like the estuaries of the Sundarbans, tides are semidiurnal in nature in the Hooghly with variable depth along the channel (∼21 m at Diamond Harbour (H6) to ∼8 m at the mouth of the estuary; Fig. 1b) (CIFRI, 2012). Before mixing with the BOB, the lower estuarine part of the Hooghly divides into two channels, one being a main estuarine stream, which directly mixes with the BOB and another smaller channel known as Muriganga (mean depth ∼6 m; Sadhuram et al., 2005). The width of the river at the mouth of the estuary is ∼25 km (Mukhopadhyay et al., 2006). Both estuarine systems experience a typical tropical climate with three distinct seasons: pre-monsoon (February–May), monsoon (June–September) and post-monsoon (October–January) with ∼80 % rainfall during monsoon.
Covering upper, middle and lower estuarine regions, the present study was carried out during low-tide conditions in three major estuaries of the Indian Sundarbans (Saptamukhi (S1–S3), Thakuran (T1–T3) and Matla (M1–M3); Fig. 1a) along with its related waterways (S4 and M4). The low-tide post-monsoon sampling was preferred as it was the ideal time to evaluate the effect of mangroves on the adjoining estuary due to peak mangrove leaf litter fall (Ray et al., 2011) and groundwater (or porewater) discharge. To compare and bring out the contrast in different components of the C cycle between mangrove-dominated and anthropogenically influenced estuaries, low-tide sampling was also performed at 13 locations (H1–H13, Fig. 1b) in the Hooghly estuary (stretch: ∼150 km).
For the purpose of discussion, henceforth, both the estuarine systems will be described as the “Hooghly–Sundarbans system” and the estuaries of the Sundarbans will be called the “Sundarbans” unless discussed individually.
2.2 Sampling and experimental techniques
During the post-monsoon season (November 2016), estuarine surface water samples were collected in duplicate at different locations of the Hooghly–Sundarbans system using a Niskin bottle (Oceantest equipment; capacity: 5 L). A brief description of the on and off field sampling and experimental techniques used during the present study are described below.
2.2.1 Sample collection and on board measurements
Water temperature and pH of the collected samples were measured on board using a thermometer (±0.1 ∘C) and portable pH meter (Orion Star A211) fitted with a Ross-type combination electrode calibrated (as described by Frankignoulle and Borges, 2001) on the NBS scale (reproducibility: ±0.005 pH units). Salinity (±0.1) and dissolved oxygen (DO: ±0.1 mg L−1) concentrations were measured on board following the Mohr–Knudsen and Winkler titration methods, respectively (Grasshoff et al., 1983). For total alkalinity (TAlk), 50 mL of filtered (Whatman GF/F filter) estuarine water was titrated on board in a closed cell using 0.1 N HCl following the potentiometric titration method (Bouillon et al., 2003). Uncertainty in TAlk measurements was ±1 µmol kg−1 as estimated using certified reference material (Dickson standard: CRM-131-0215).
For DIC and δ13CDIC measurements, estuarine surface waters were collected by gently overfilling glass vials fitted with Teflon septa (Fig. 1). Porewater was also collected from the lower littoral zone of the Lothian Island (one of the virgin islands of the Indian Sundarbans, Fig. 1a) by digging a hole (∼30 cm below the water table). It was not possible to collect porewater samples from the middle and upper littoral zones of the island due to logistic problems. After purging water at least twice in the bore, the sample was collected from the bottom of the bore through a syringe and transferred to the glass vial (Maher et al., 2013). Twelve groundwater samples were collected from the nearby locations of the Hooghly–Sundarbans system via tube pump. After collection, all samples for DIC and δ13CDIC were preserved immediately by adding a saturated HgCl2 solution to arrest the microbial activity.
For both DOC and SPM (suspended particulate matter) measurements, surface water samples were filtered on board through pre-weighted and pre-combusted (500 ∘C for 6 h) Whatman GF/F filters (pore size: 0.7 µm). Filtrates were kept for DOC analysis in brown bottles followed by immediate preservation via addition of H3PO4 (50 µL/15 mL sample) (Bouillon et al., 2003), whereas the residues were kept for particulate matter analysis. Collected DIC, DOC and SPM samples were properly preserved at 4 ∘C during transportation to the laboratory. Additionally, micrometeorological parameters associated with the water–atmosphere CO2 exchange flux computation continuously monitored at 10 m height over the estuary using a portable weather monitor (DAVIS – Vantage Pro2 Plus).
2.2.2 Laboratory measurements
The DIC concentrations were measured using Coulometer (model: UIC. Inc. CM – 5130) with an analytical uncertainty of ±0.8 %. The δ13CDIC were measured using GasBench II attached to a continuous flow mass spectrometer (Thermo Scientific MAT 253) with precision better than 0.10 ‰. The DOC was measured using a high-temperature catalytic oxidation analyzer (Shimadzu-TOC-L CPH), which was calibrated using a potassium hydrogen phthalate (KHP) solution containing 1, 2, 5, 10 and 20 mg L−1 of DOC (Ray et al., 2018). The analytical error for DOC measurement was < 2 %. For SPM measurements, filter paper containing SPM was dried in hot-air oven at 60 ∘C and final weights were noted. The SPM were calculated based on differences between final and initial weights of the filter paper and volumes of water filtered. For measurements of POC and δ13CPOC, filter papers containing SPM were decarbonated (by HCl fumes) and analysed using an Elemental Analyzer (Flash 2000) attached to the continuous flow mass spectrometer (Thermo Scientific MAT 253) via conflo. The δ13CPOC values are reported relative to V-PDB with reproducibility better than ±0.10 ‰, whereas uncertainty for POC was < 10 %.
2.2.3 Computation of air–water CO2 flux and %DO
The pCO2 were calculated based on surface water temperature, salinity, TAlk, pH and dissociation constants calculated following Millero (2013). The uncertainty for estimated pCO2 was ±1 %. The CO2 exchange fluxes (FCO2 in µmol m−2 h−1) across the water–atmosphere boundary of the estuary were calculated as follows:
where solubility. k is the gas transfer velocity, which is highly variable and remains a matter of debate (Raymond and Cole, 2001). The k during the present study was computed as a function of wind velocity following the Liss and Merlivat (1986) parametrization. For the same wind velocity, the parametrization of Liss and Merlivat (1986) provides the lowest k value over other parametrization (Wanninkhof, 1992; Raymond and Cole, 2001; Borges et al., 2004) and therefore the FCO2 presented during this study may be considered to be a conservative estimate. The wind-velocity-based k estimation for the Hooghly–Sundarbans system has been applied in earlier studies as well (Mukhopadhyay et al., 2002; Biswas et al., 2004). Mean global atmospheric CO2 mixing ratio in dry air during 2016 (data source: ftp://aftp.cmdl.noaa.gov/products/trends/co2/co2_annmean_gl.txt, last access: 10 May 2018) was corrected for water vapour partial pressure to calculate pCO2 (atmosphere). The fraction, × [pCO2 (water) − pCO2 (atmosphere)] is the departure of free dissolved CO2 from atmospheric equilibrium that may be termed “excess CO2 (ECO2)” (Zhai et al., 2005).
The percent saturation of DO and apparent oxygen utilization (AOU, departure of dissolved O2 from atmospheric equilibrium) were calculated as follows:
where [O2]Equilibrium is the equilibrium DO concentration calculated at in situ temperature and salinity (Weiss, 1970) and [O2]Measured is the measured DO concentration of surface water.
2.2.4 Mixing model calculation
Considering salinity as a conservative tracer and an ideal indicator for estuarine mixing mechanism (Fry, 2002), the conservative mixing model was applied to the Hooghly estuary to understand the addition or removal of dissolved and particulate C by in situ biogeochemical processes. Concentrations and stable isotopic compositions of dissolved or particulate C (presented as C) during conservative mixing (CCM and δ13CCM) were computed as follows (Carpenter et al., 1975; Mook and Tan, 1991):
Here, S denotes salinity, the suffixes CM, F, M and S denote conservative mixing, freshwater endmember, marine endmember and sample. FF is freshwater fraction is 1 − (SS∕SM) and FM= marine water fraction is (1−FF). CSample > CCM indicates C addition, whereas the reverse indicates removal. For model calculation, means of salinities, C concentrations and δ13C of samples collected at salinity ≤ 0.3 at the Hooghly estuary were considered to be endmember values for freshwater, whereas respective values for marine endmembers were taken from Dutta et al. (2010) and Akhand et al. (2012). Quantitative deviations (ΔC and Δδ13C) of measured C concentrations and δ13C from the respective conservative mixing values were estimated as follows (Alling et al., 2012):
Plots between ΔC and Δδ13C for DIC and POC have been used to understand processes influencing DIC and POC in the Hooghly–Sundarbans system. However, the above model could not be applied to DOC due to the unavailability of δ13CDOC during the present study.
Unlike the Hooghly, direct application of above-mentioned conservative mixing model was not justified for the mangrove-dominated Sundarbans due to the narrow salinity gradient (see later). However, assuming that apart from conservative mixing only mangrove-derived C (ΔCMangrove) contributes to the estuarine C pool, an approach can be taken to quantify ΔCMangrove. Two different mass balance equations used by Miyajima et al. (2009) for estimating ΔDICMangrove was extended to calculate ΔCMangrove during the present study:
For model calculation, δ13CMangrove was taken as −28.4 ‰ for the Sundarbans (Ray et al., 2015) and endmembers were taken to be the same as the Hooghly, as the estuaries of the Sundarbans are an offshoot of the lower Hooghly estuary.
2.2.5 Computation of advective DIC input from mangrove forest to estuary
A first-time baseline value for advective DIC input from mangrove forest sediment to the adjoining estuary (FDIC) via porewater exchange was calculated following Reay et al. (1995):
3.1 Environmental parameters
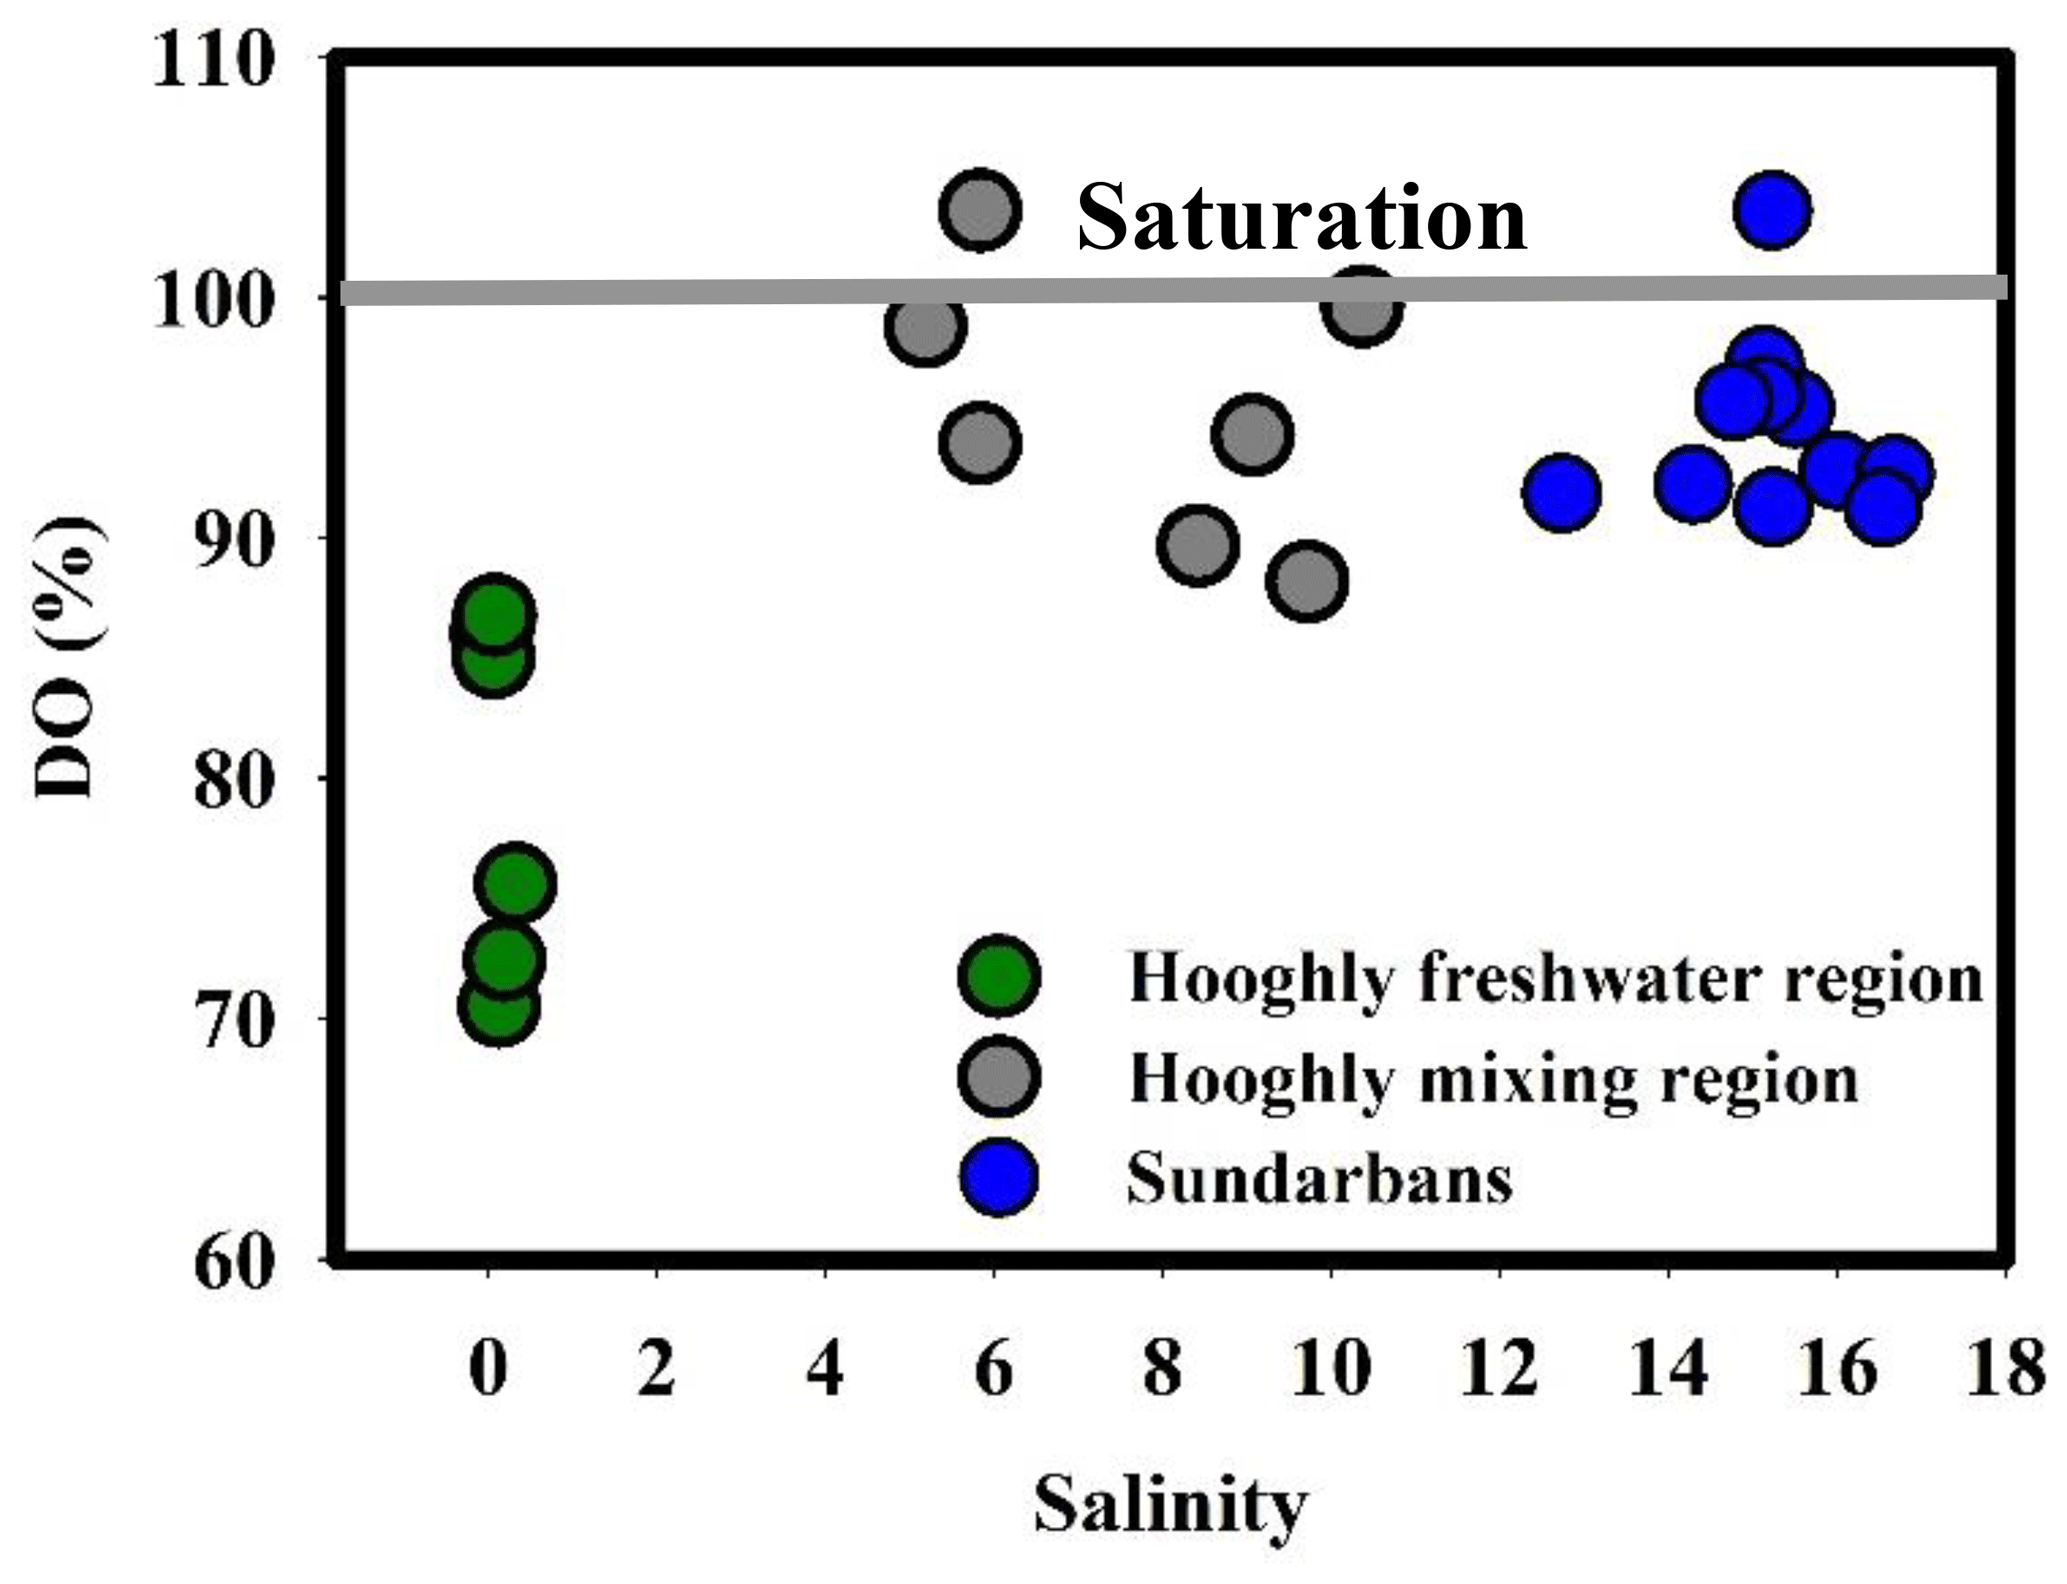
During the present study, the water temperature did not show any distinct spatial trend and varied from 28 to 29 ∘C and 30.5 to 33 ∘C for the Sundarbans (Table 2) and Hooghly (Table 3). Salinity of the estuaries of the Sundarbans varied over a narrow range (12.74 to 16.69; Table 2) with a minimum at the upper estuarine locations throughout. A relatively sharp salinity gradient was noticed at the Hooghly estuary (0.04 to 10.37; Table 3). Based on the observed salinity gradient, the Hooghly estuary can be divided into two major salinity regimes: (a) a freshwater regime (H1–H6) and (b) mixing regime (H7–H13; Fig. 1b). However, due to the narrow salinity range, no such classification was possible for the estuaries of the Sundarbans. The estuaries of the Sundarbans were relatively well-oxygenated (DO = 91 % to 104 %) compared to the Hooghly estuary (DO = 71 % to 104 %; Fig. 2). Both pH and TAlk in the Hooghly estuary (pH: 7.31 to 8.29, TAlk: 1797 to 2862 µeq L−1, Table 3) showed relatively wider variation compared to the estuaries of the Sundarbans (pH: 8.01 to 8.13, TAlk: 2009 to 2289 µeq L−1; Table 2).
Table 2Physicochemical parameters, inorganic and organic C-related parameters and CO2 exchange flux across the water–atmosphere interface at the estuaries of the Sundarbans. Here, WT is water temperature, DO is dissolved oxygen.
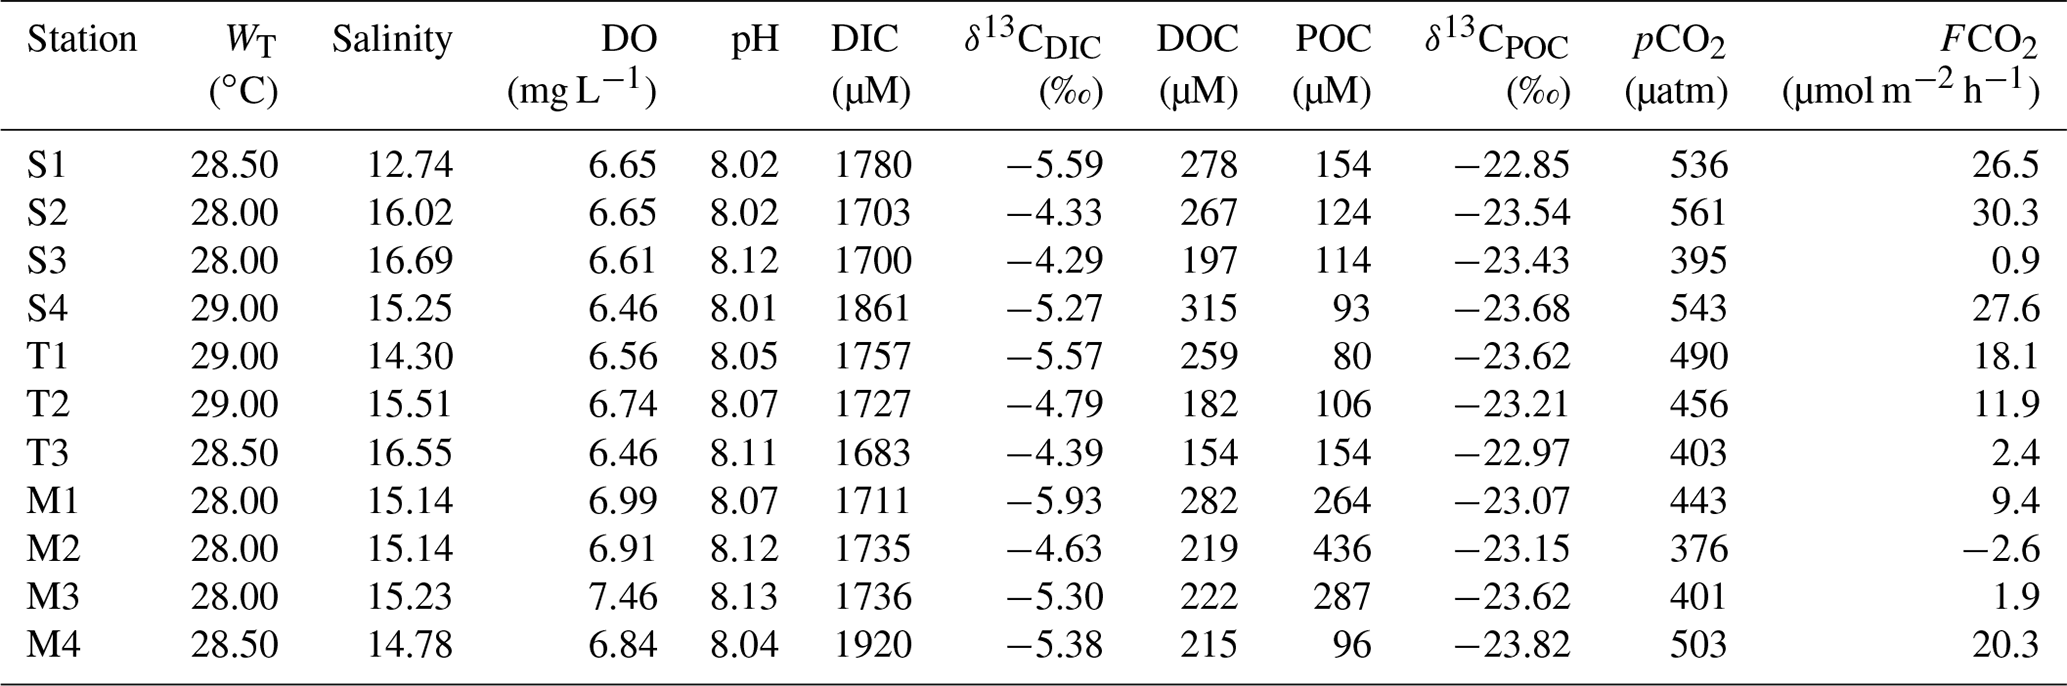
Table 3Physicochemical parameters, inorganic and organic C-related parameters and CO2 exchange flux across the water–atmosphere interface at the Hooghly estuary. Here, WT is water temperature, DO is dissolved oxygen.
3.2 Variability in DIC, δ13CDIC and DOC
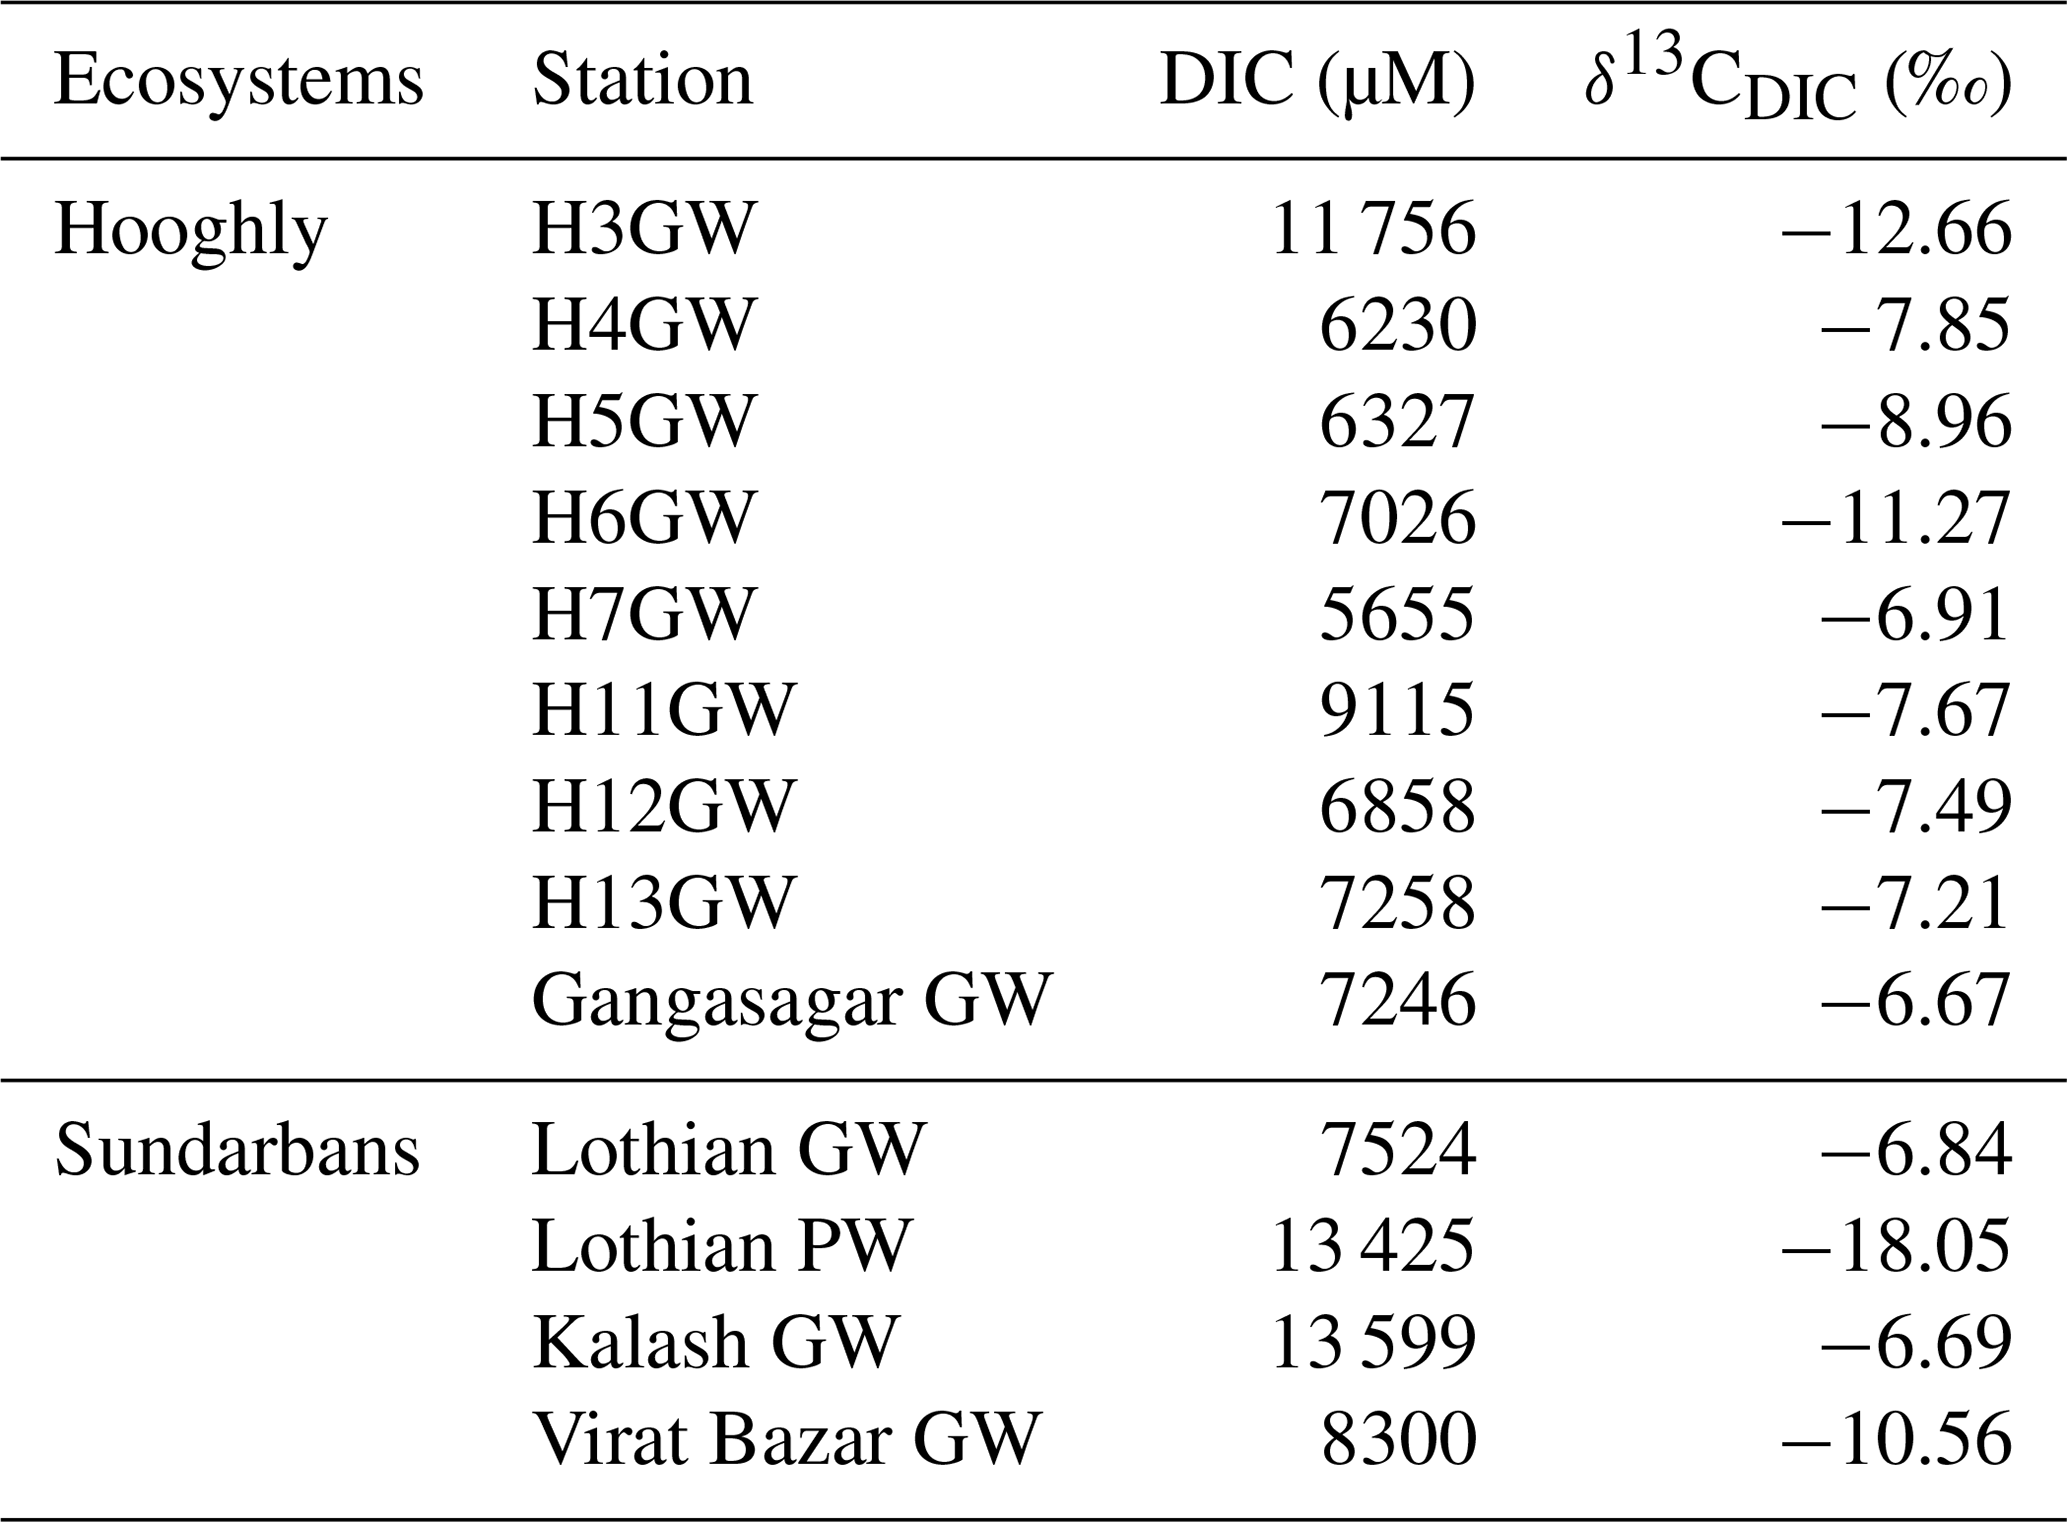
In the Sundarbans, both DIC and δ13CDIC varied over a relatively narrow range (DIC = 1683 to 1920 µM, mean: 1756±73 µM; δ13C ‰ to −4.29 ‰, mean: ‰, Table 2) compared to the Hooghly estuary (DIC = 1678 to 2700 µM, mean: 2083±320 µM; δ13C ‰ to −5.57 ‰, mean: ‰; Table 3). In the Hooghly, DIC was relatively higher in the freshwater regime compared to the mixing regime, whereas reverse was observed for δ13CDIC. Different estuaries of the Sundarbans showed different trends, with Saptamukhi and Thakuran showing maximum and minimum DIC at the upper and lower estuarine regions, with a reverse trend for δ13CDIC. However, for the Matla, no distinct spatial trend was noticed for both DIC and δ13CDIC. In comparison to the estuarine surface waters, markedly higher DIC and lower δ13CDIC were observed for the groundwater (Hooghly: DIC = 5655 to 11 756 µM, δ13C ‰ to −6.67 ‰; Sundarbans: DIC = 7524 to 13 599 µM, δ13C ‰ to −6.69 ‰; Table 4) and porewater samples (Sundarbans: DIC = 13 425 µM; δ13C ‰; Table 4) collected from the Hooghly–Sundarbans system. The DOC in the Sundarbans varied from 154 to 315 µM (mean: 235±49 µM; Table 2) with no distinct spatial variability. In comparison, ∼40 % higher DOC was noticed in the Hooghly (235 to 662 µM; Table 3), reaching a peak in the mixing regime.
Table 4The DIC concentrations and δ13CDIC of groundwater (GW) and porewater (PW) samples collected around the Hooghly–Sundarbans system.
3.3 Variability in particulate matter and δ13CPOC
In the Sundarbans, both SPM and POC varied over a wide range (SPM = 80 to 741 mg L−1, mean: 241±197 mg L−1; POC = 80 to 436 µM, mean: 173±111 µM; Table 2) with no distinct spatial variability. Compared to that, SPM and POC in the Hooghly were relatively lower and varied from 38 to 289 mg L−1 and 95 to 313 µM (Table 3), respectively, reaching maximum at the freshwater regime. The δ13CPOC of the Sundarbans varied from −23.82 ‰ to −22.85 ‰ (mean: ‰), whereas in the Hooghly it varied from −26.28 ‰ to −23.47 ‰ (mean: ‰).
3.4 Variability in pCO2 and FCO2
In the Sundarbans, surface water pCO2 varied from 376 to 561 µatm (mean: 464±66 µatm; Table 2) with no spatial pattern. Compared to the Sundarbans, ∼3.8 times higher pCO2 was estimated in the Hooghly estuary (267 to 4678 µatm; Table 3), reaching its peak in the freshwater regime. Except for one location at the Sundarbans (M2: −42 µM) and two locations in the mixing regime at the Hooghly (H12: −3.26 µM; H13: −3.43 µM), ECO2 values were always positive in the Hooghly–Sundarbans system. The calculated FCO2 at the Hooghly estuary (−19.8 to 717.5 µmol m−2 h−1; mean: 231 µmol m−2 h−1; Table 3) was ∼17 times higher than the mangrove dominated estuaries of the Indian Sundarbans (FCO2: −2.6 to 30.3 µmol m−2 h−1; Table 2). Spatially, in the Hooghly, higher FCO2 was noticed in the freshwater regime (285.2 to 717.5 µmol m−2 h−1) compared to the mixing regime, while no such distinct spatial trend was observed at the Sundarbans.
Based on the results obtained during the present study, below we discuss different aspects of the C cycle within the Hooghly–Sundarbans system.
4.1 Major drivers of DIC dynamics
DIC concentrations observed in this study for the Hooghly were higher than that reported by Samanta et al. (2015) for the same season (DIC: 1700 to 2250 µM), whereas observed δ13CDIC were within their reported range (δ13CDIC: −11.4 ‰ to −4.0 ‰). Statistically significant correlations between DIC–salinity (r2=0.43, p = 0.015) and δ13CDIC–salinity (r2=0.58, p = 0.003) in the Hooghly suggested the potential influence of marine and freshwater mixing on DIC and δ13CDIC in the estuary (Fig. 3a, b), rationalizing the application of a two-endmember mixing models. A two-endmember mixing model to decipher processes influencing DIC chemistry has been applied earlier in the Hooghly estuary (Samanta et al., 2015).
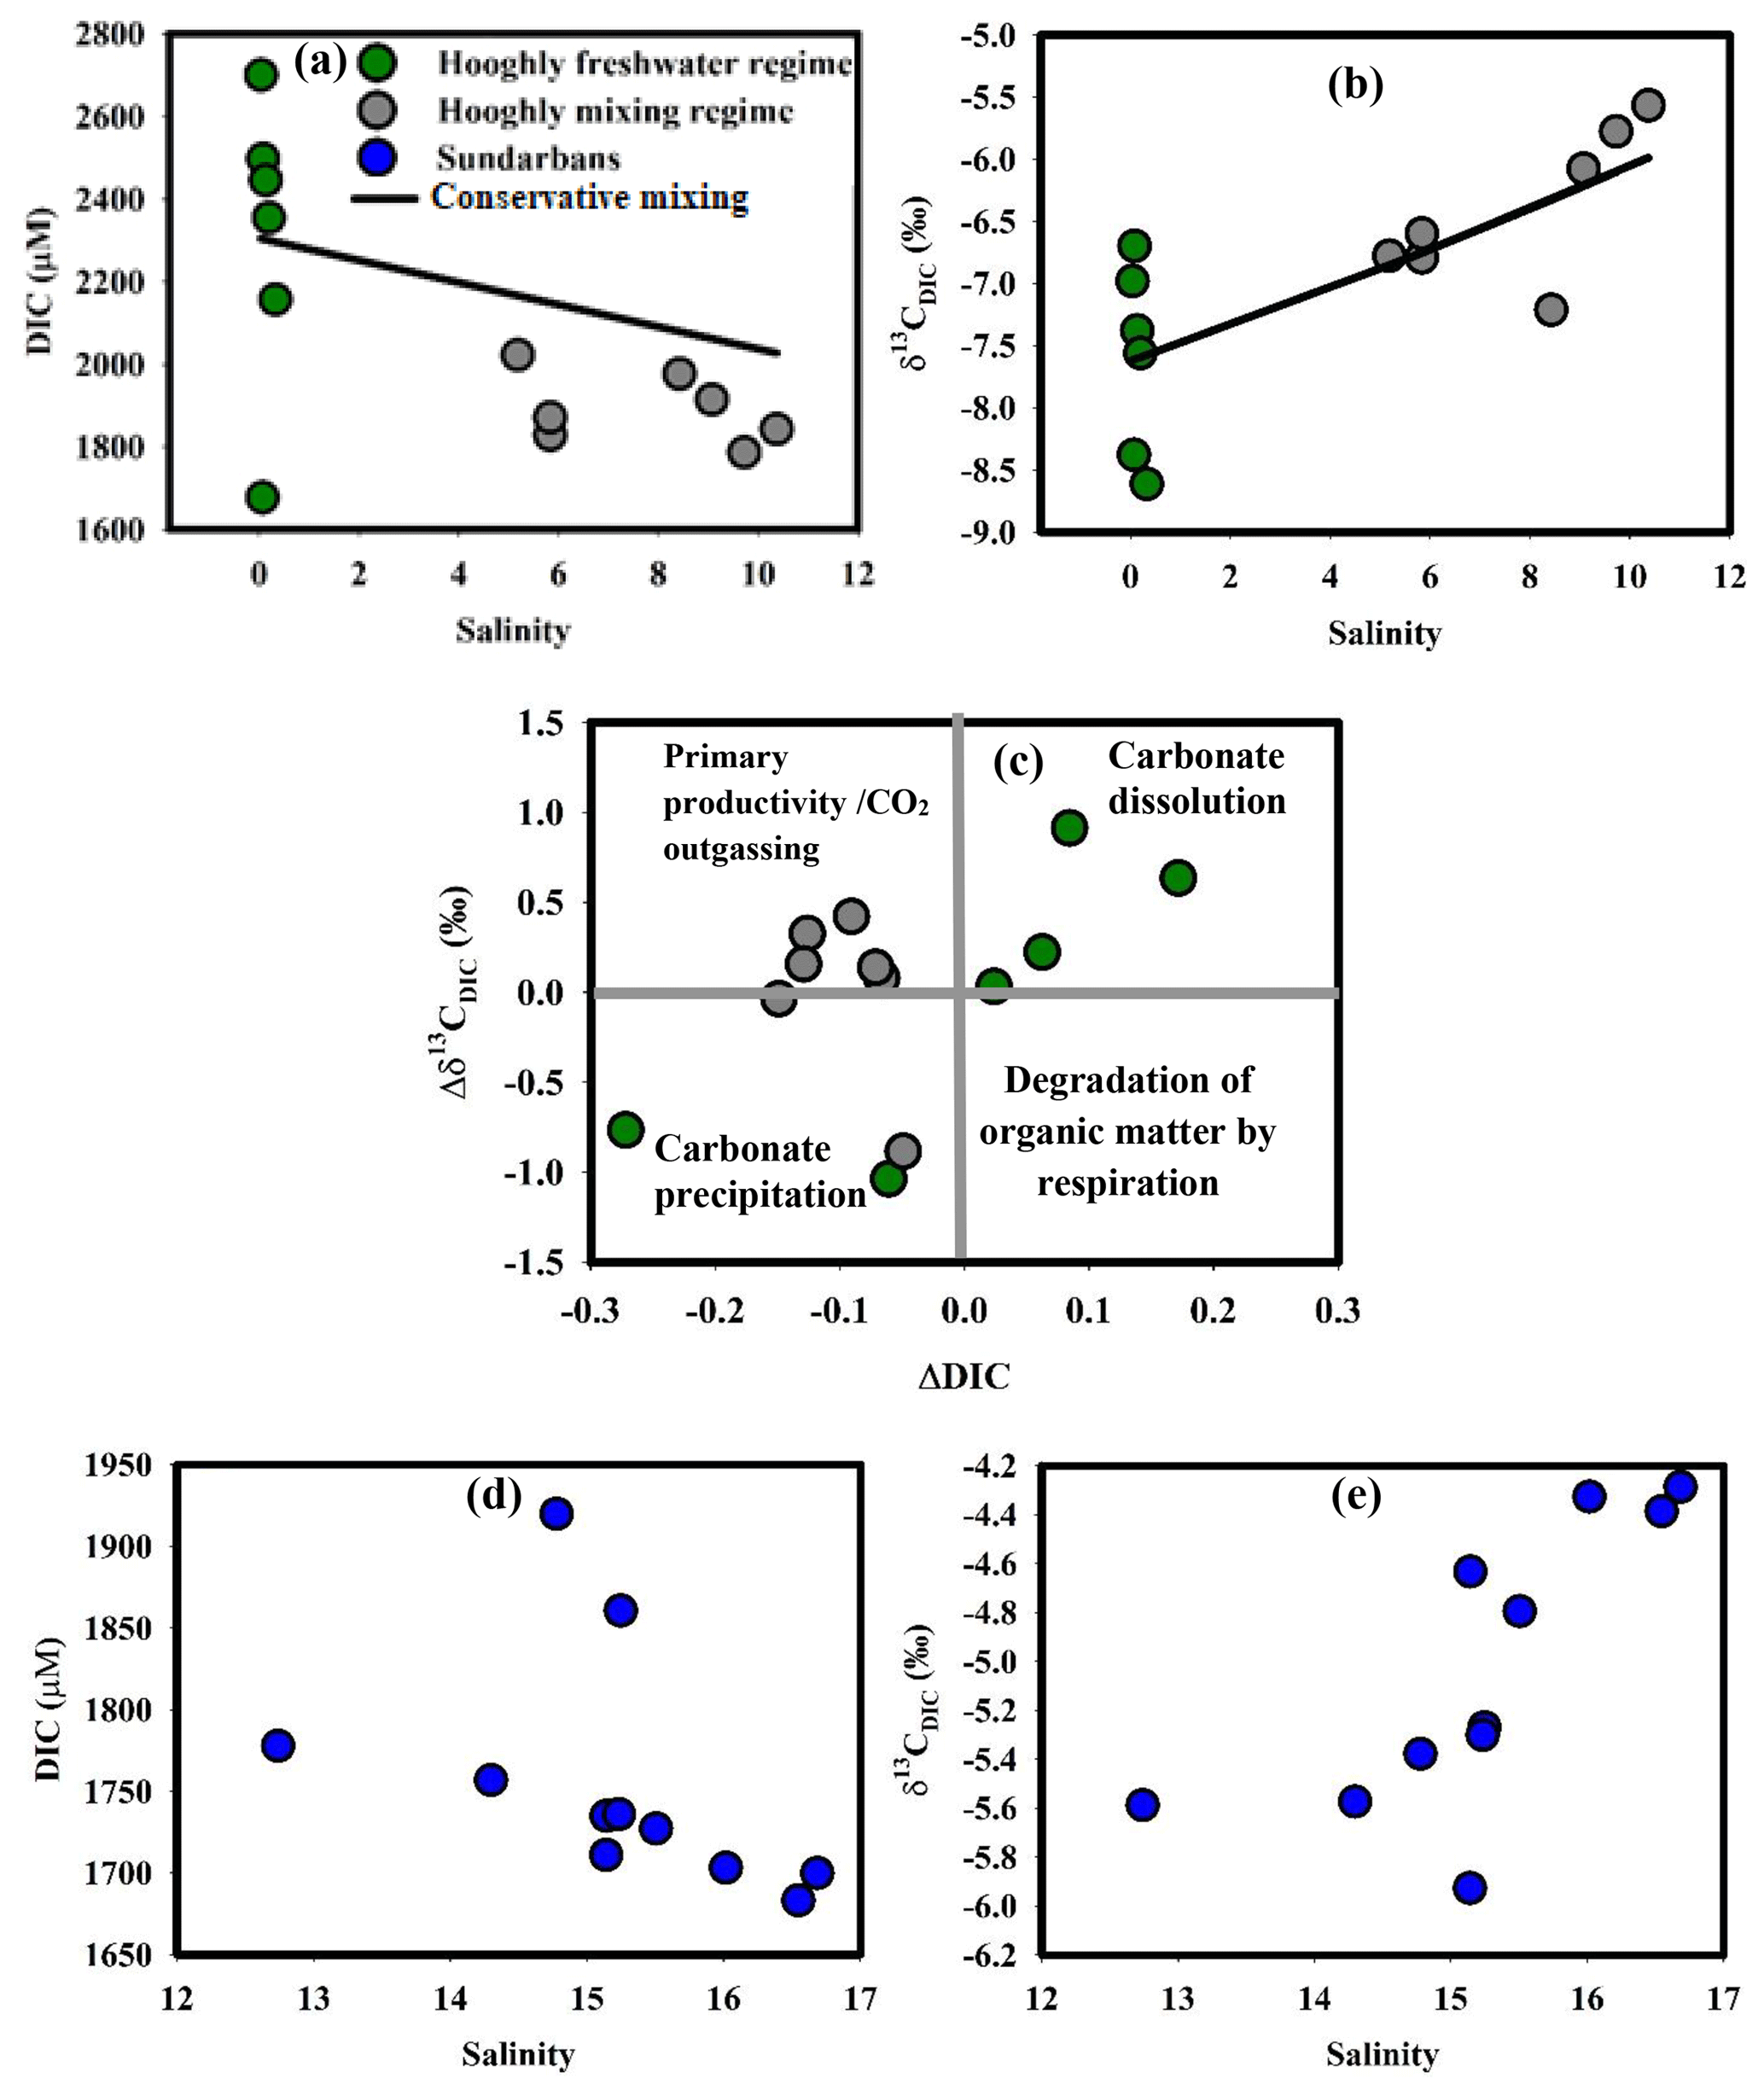
Figure 3(a) DIC–salinity in the Hooghly, (b) δ13CDIC–salinity in the Hooghly, (c) ΔDIC–Δδ13CDIC in the Hooghly, (d) DIC–salinity in the Sundarbans and (e) δ13CDIC–salinity in the Sundarbans.
Based on the methodology discussed earlier, calculated ΔC for DIC (ΔDIC to 0.17) predicted a dominance of DIC addition (n=4) over removal (n = 2) in the freshwater regime of the Hooghly, whereas only removal was evident in the mixing regime. In the case of Δδ13C for DIC (Δδ13CDIC), values were mostly positive (n = 9), i.e. measured δ13CDIC was higher compared to estimated δ13CDIC due to conservative mixing. A deviation plot (ΔDIC vs. Δδ13CDIC; Fig. 3c) for samples of the Hooghly showed the following patterns: (a) a decrease in ΔDIC with increasing Δδ13CDIC (n = 5), indicating phytoplankton productivity and/or outgassing of CO2 across the water–atmosphere interface, (b) a decrease in ΔDIC with decreasing Δδ13CDIC (n = 4), indicating carbonate precipitation and (c) increase of ΔDIC with increasing Δδ13CDIC (n = 4) representing carbonate dissolution within the system.
Based on these calculations, both organic and inorganic processes (productivity, carbonate precipitation and dissolution) along with physical processes (CO2 outgassing across the water–atmosphere interface) appeared to regulate DIC chemistry in the Hooghly estuary. Spatially, phytoplankton productivity and/or outgassing of CO2 appeared to regulate DIC in the mixing regime (n = 5 out of 7) of the Hooghly. Earlier studies have advocated for high phytoplankton productivity in non-limiting nutrient conditions during the post-monsoon season in the Hooghly (Mukhopadhyay et al., 2002., 2006). However, based on the present data, particularly due to a lack of direct primary productivity measurements, it was difficult to spatially decouple individual contributions of primary productivity and CO2 outgassing in the mixing regime. In contrast to the mixing regime, carbonate precipitation and dissolution appeared to be dominant processes affecting DIC chemistry in the freshwater regime of the Hooghly.
In mangrove-dominated estuaries of the Sundarbans, observed δ13CDIC during this study were within the range (δ13CDIC: ‰) reported by Ray et al. (2018), whereas observed DIC concentrations were lower than their estimates (DIC: 2130±100 µmol kg−1). Our data also showed similarity with Khura and Trang rivers, two mangrove-dominated rivers of peninsular Thailand flowing towards the Andaman Sea, although from hydrological prospective these two systems are contrasting in nature (Sundarbans: narrow salinity gradient (12.74 to 16.69) vs. Khura and Trang rivers: sharp salinity gradient (∼0 to 35); Miyajima et al., 2009). Like Hooghly, the δ13CDIC–salinity relationship was statistically significant (r2=0.55, p = 0.009) for the Sundarbans, but the DIC–salinity relationship remained insignificant (p = 0.18) (Fig. 3d, e).
Given the dominance of mangroves in the Sundarbans, the role of mangrove-derived organic carbon (OC) mineralization may be important in regulating DIC chemistry in this ecosystem. Theoretically, ΔCMangrove for DIC (ΔDICMangrove) estimated based on DIC (ΔDICM1) and δ13CDIC (ΔDICM2) should be equal. The negative and unequal values of ΔDICM2 (−41 to 62 µM) and ΔDICM1 (−186 to 11 µM) indicate a large DIC outflux over influx through mineralization of mangrove-derived OC in this tropical mangrove system. The removal mechanisms of DIC include CO2 outgassing across estuarine water–atmosphere boundary, phytoplankton uptake and export to the adjacent continental shelf region (northern BOB, Ray et al., 2018). The evidence for CO2 outgassing was found at almost all locations covered during the present study (10 out of 11 locations covered; see Sect. 4.4). Also, a recent study by Ray et al. (2018) estimated DIC export (∼3.69 Tg C yr−1) from the estuaries of the Sundarbans as the dominant form of C export. Although data for primary productivity is not available for the study period, earlier studies have reported post-monsoon as the peak season for phytoplankton productivity (Biswas et al., 2007; Dutta et al., 2015). Given the evidence for the presence of DIC removal processes in the Sundarbans, a comprehensive study that measures rates of these processes with higher spatial and temporal coverages is desirable to understand the balance between influx and outflux of DIC in the Sundarbans.
Other than biogeochemical processes, factors such as groundwater and porewater exchange to the estuary might also play a significant role in estuarine DIC chemistry (Tait et al., 2016). High pCO2 and DIC, along with low pH and TAlk/DIC are general characteristics of groundwater, especially within carbonate aquifer region (Cai et al., 2003). Although all the parameters of groundwater inorganic C system (like pH, TAlk and pCO2) were not measured during the present study, groundwater DIC was ∼5.57 and ∼3.61 times higher compared to mean surface water DIC in the Sundarbans and Hooghly. The markedly higher DIC in groundwater, as well as the similarity in its isotopic composition with estuarine DIC, may stand as a signal for the influence of groundwater on estuarine DIC, with a possibly greater influence in the Sundarbans than Hooghly as evident from the slope of the TAlk–DIC relationships (Hooghly: 0.98, Sundarbans: 0.03). In the Sundarbans, to the best of our knowledge, no report exists regarding groundwater discharge. Contradictory reports exist for the Hooghly, where Samanta et al. (2015) indicated groundwater contribution at a low-salinity regime (salinity < 10, same as our salinity range) based on Ca measurement, which was not observed based on the Ra isotope measurement in an earlier study (Somayajulu et al., 2002). Porewater DIC in the Sundarbans was ∼7.63 times higher than the estuarine water, indicating the possibility of DIC input from the adjoining mangrove system to the estuary through porewater exchange depending upon changes in hypsometric gradient during tidal fluctuation (i.e. tidal pumping). By using porewater-specific discharge and porosity at 0.008 cm min−1 and 0.58 (Dutta et al., 2013, 2015), respectively, during the post-monsoon season and extrapolating the flux value on a daily basis (i.e. for 12 h as tides are semidiurnal in nature), mean FDIC during the post-monsoon season was calculated as ∼770.4 mmol m−2 d−1. However, the significant impact of porewater on DIC may be limited only in mangrove creek water (samples not collected) as evident from the narrow variability of estuarine TAlk and DIC as well as no significant correlation between them (p = 0.93). A comprehensive investigation that measures rates of ground- and porewater-mediated DIC additions is needed to thoroughly understand their importance in controlling the DIC chemistry of the Hooghly–Sundarbans system.
From the above discussion, it appears that higher DIC in the Hooghly compared to the Sundarbans may be due to cumulative interactions between freshwater content to the individual estuaries as well as the degree of biogeochemical and hydrological processes. A relatively higher freshwater contribution in the Hooghly compared to the Sundarbans (as evident from salinity), as well as significant negative relationship between DIC and salinity, proved the significant impact of freshwater on DIC pool in the Hooghly. However, quantifications of other biogeochemical and hydrological processes are needed to decipher dominant processes affecting DIC dynamics in the Hooghly–Sundarbans system.
4.2 DOC in the Hooghly–Sundarbans
In the Hooghly, DOC concentrations observed during this study was higher than the range (226.9±26.2 to 324±27 µM) reported by Ray et al. (2018), whereas observed DOC in the Sundarbans was comparable with their estimates (262.5±48.2 µM). The marine water and freshwater mixing did not appear to exert major control over DOC in the Hooghly–Sundarbans system as evident from the lack of significant correlations between DOC and salinity (Hooghly freshwater regime: r2=0.33, p = 0.23; Hooghly mixing regime: r2=0.10, p = 0.50; Sundarbans: r2=0.27, p=0.10, Fig. 4a). Our observation showed similarity with other Indian estuaries (Bouillon et al., 2003), with opposite reports from elsewhere (Raymond and Bauer, 2001; Abril et al., 2002). This indicates that DOC in this subtropical estuarine system is principally controlled by processes other than the mixing of two water masses.
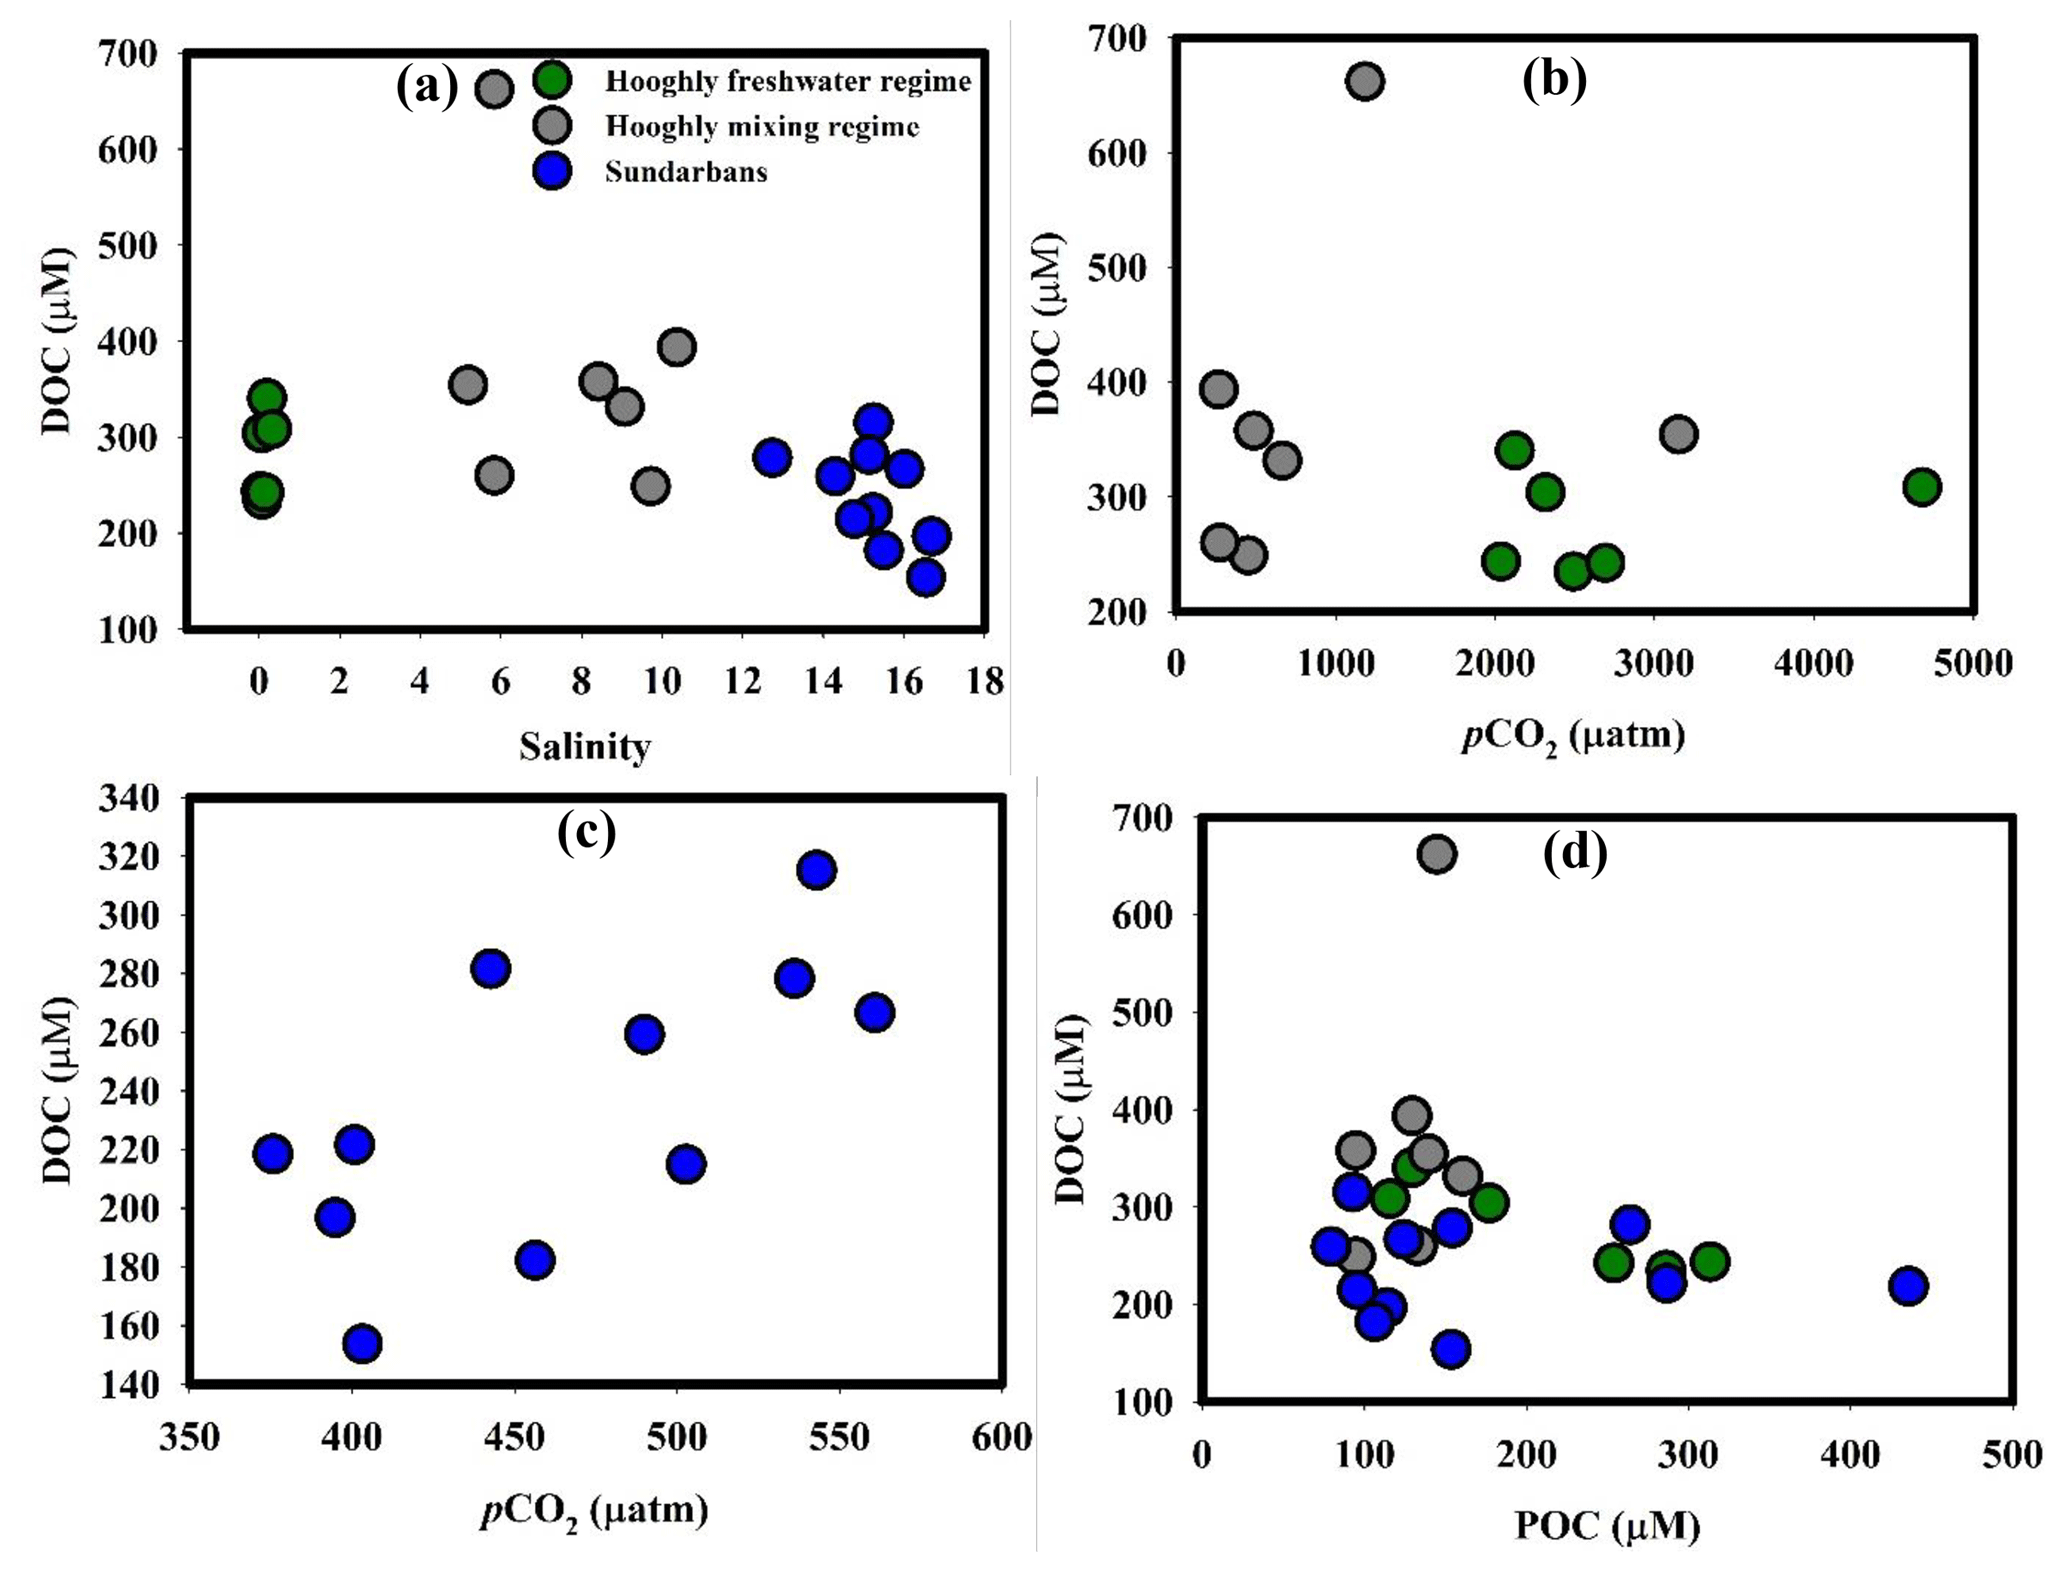
Figure 4(a) DOC–salinity in the Hooghly–Sundarbans system, (b) DOC–pCO2 in the Hooghly, (c) DOC–pCO2 in the Sundarbans and (d) DOC–POC in the Hooghly–Sundarbans system.
Although it is difficult to accurately decipher processes influencing DOC without δ13CDOC data, some insights may be obtained from estimated ΔC of DOC (ΔDOC). The estimated ΔDOC in the Hooghly indicated both net addition (n = 3) and removal (n = 3) of DOC in the freshwater regime (ΔDOC = −0.16 to 0.11), whereas only net addition was evident throughout the mixing regime (ΔDOC = 0.08 to 1.74). In the Sundarbans, except the lower Thakuran (St. T3, Δ DOC µM), net addition of mangrove-derived DOC was estimated throughout (ΔDOCM1=2 to 134 µM).
In an estuary, DOC can be added through in situ production (by benthic and pelagic primary producers), lysis of halophobic freshwater phytoplankton cells and POC dissolution. DOC can be removed through bacterial mineralization, flocculation as POC and photo-oxidation (Bouillon et al., 2006). At the Hooghly–Sundarbans system, no evidence for freshwater phytoplankton (δ13C: −33 ‰ to −40 ‰; Freitas et al., 2001) was found from δ13CPOC, ruling out its potential effect on DOC. Although an indirect signal for phytoplankton productivity was observed in the freshwater regime from the δ13CDIC and POC relationship (r2=0.68, p=0.05), further evaluation of its impact on DOC was not possible due to the lack of direct measurement. Contradictory results exist regarding the influence of phytoplankton productivity on DOC. Some studies did not find a direct link between DOC and primary productivity (Boto and Wellington, 1988), whereas a significant contribution of phytoplankton production to building a DOC pool (∼8 % to 40 %) has been reported by others (Dittmar and Lara, 2001; Kristensen and Suraswadi, 2002).
In a nutrient-rich estuary like Hooghly, the lack of a significant relationship between DOC and pCO2 (freshwater regime: p = 0.69, mixing regime: p = 0.67, Fig. 4b) suggested either inefficient bacterial DOC mineralization or significant DOC mineralization compensated by phytoplankton CO2 uptake. However, a significant positive relationship between these two in the Sundarbans (r2=0.45, p = 0.02, Fig. 4c) indicated an increase in aerobic bacterial activity with increasing DOC. In mangrove ecosystems, leaching of mangrove leaf litter as DOC is as fast as ∼30 % of mangrove leaf litter leaching as DOC is reported within the initial 9 days of degradation (Camilleri and Ribi, 1986). In the Sundarbans, mangrove leaf litter fall peaks during the post-monsoon season (Ray et al., 2011) and its subsequent significant leaching as DOC was evident during the present study from relatively higher DOC compared to POC (DOC : POC = 0.50 to 3.39, mean: 1.79±0.94 %). Our interpretation for Sundarbans corroborated with that reported by Ray et al. (2018) for the same system as well as with Bouillon et al. (2003) for the Godavari estuary, southern India.
Despite high-water residence time in the Hooghly (∼ 40 days during the post-monsoon season; Samanta et al., 2015) and in mangrove ecosystems like the Sundarbans (Alongi et al., 2005; Singh et al., 2016), DOC photo-oxidation may not be so potent due to unstable estuarine conditions in the Hooghly–Sundarbans system (Richardson number < 0.14) having intensive vertical mixing with longitudinal dispersion coefficients of 784 m2 s−1 (Goutam et al., 2015; Sadhuram et al., 2005). The unstable condition may not favour DOC–POC interconversion as well but mediated by charged complexes and repulsion–attraction interactions, the interconversion partly depends upon variation in salinity. More specifically, the interconversion is efficient during initial mixing of freshwater (river) and seawater and the coagulation mostly completes within the salinity range 2–3. This appeared to be the case in the Hooghly, where DOC and POC were negatively correlated in the freshwater regime (r2=0.86, p = 0.007, Fig. 4d) but not in the mixing regime (p = 0.43) or in the Sundarbans (p = 0.84).
Although estimated ΔDOC indicated largely net DOC addition to the Hooghly–Sundarbans system, except leaf litter leaching in the Sundarbans, no significant evidence for other internal sources was found. This suggested a potential contribution from external sources that may include industrial effluents and municipal waste-water discharge (i.e. surface runoff) in the freshwater regime of the Hooghly (Table 1). However, there are no direct DOC influx data available to corroborate the same. Relatively higher amounts of DOC compared to POC (DOC : POC > 1) at some locations (H2, H5, H6) of the freshwater regime may stand as a signal for higher DOC contribution at those locations but it is not prudent to pinpoint its sources due to a lack of isotopic data. Considering significantly high DOC levels in waste water effluent (Katsoyiannis and Samara, 2006, 2007), along with fast degradation of biodegradable DOC (∼80 % within 24 h; Seidl et al., 1998) and residence time of Hooghly water (mentioned earlier), Samanta et al. (2015) suggested the possibility of anthropogenic DOC biodegradation during its transport in the estuary. Although anthropogenic inputs were mostly confined to the freshwater regime, relatively higher DOC in the mixing regime of the Hooghly compared to the freshwater regime suggested DOC input via some additional pathway, possibly groundwater discharge. The contribution of groundwater to the Hooghly estuary within the salinity range observed during the present study has been reported (Samanta et al., 2015). However, there is no report of groundwater-mediated DOC influx to the estuary. For mangrove-dominated ecosystems like the Sundarbans, a recent study by Maher et al. (2013) estimated ∼89 %–92 % of the total DOC export to be driven by groundwater advection. To understand spatial variability of DOC chemistry in the Hooghly–Sundarbans system, a thorough investigation that measures rates of groundwater and surface-runoff-mediated DOC addition is warranted.
Overall, on average, the concentration of DOC in the Hooghly was ∼40 % higher than in the Sundarbans, which appeared to be due to the cumulative effect of contributions from freshwater and groundwater, higher anthropogenic inputs and DOC–POC interconversion. However, DOC inputs via other pathways may be dominant over freshwater-mediated input as evident from the insignificant DOC–salinity relationship during the present study. To quantitatively understand the relative control of the above-mentioned contributors to the DOC pool in the Hooghly–Sundarbans system, the individual components need to be studied in detail.
4.3 Major drivers of particulate organic matter
The average POC during this study was relatively higher than the range (Hooghly: 40.3±1.1 to 129.7±6.7 µM, Sundarbans: 45.4±7.5 µM) reported by Ray et al. (2018) for the Hooghly–Sundarbans system. However, it was within the range (51 to 750 µM; Sarma et al., 2014) reported for a large set of Indian estuaries. No significant SPM–salinity or POC–salinity relationships were observed during the present study (Fig. 5a, b), except for a moderate negative correlation between POC and salinity (r2=0.62, p = 0.06) in the freshwater regime of the Hooghly. This inverse relationship may be linked to freshwater-mediated POC addition. Also, as described earlier, the contribution of POC via surface runoff is also a possibility in this regime due to the presence of several industries and large urban population (St. H2: Megacity Kolkata) that discharge industrial effluents and municipal waste water to the estuary on a regular basis (Table 1). A signal for surface-runoff-mediated POC addition was evident in the freshwater regime where ∼61 % and ∼43 % higher POC were observed at H3 and H4, respectively, compared to an upstream location (St. H2). However, based on the present data, it was not possible to decouple freshwater and surface-runoff-mediated POC inputs to the Hooghly estuary. A relatively lower contribution of POC to the SPM pool of the Sundarbans (0.66 % to 1.23 %) compared to the Hooghly (0.96 % to 4.22 %; Fig. 5c) may be due to low primary production owing to a high SPM load (Ittekkot and Laane, 1991) as observed in the mangrove-dominated Godavari estuary in southern India (Bouillon et al., 2003).

Figure 5(a) SPM–salinity in the Hooghly–Sundarbans system, (b) POC–salinity in the Hooghly–Sundarbans system, (c) % POC ∕ SPM–salinity in the Hooghly–Sundarbans system, (d) ΔPOC–Δδ13CPOC in the Hooghly, (e) POC–pCO2 in the Hooghly and (f) POC–pCO2 in the Sundarbans.
In general, wide ranges for δ13C (rivers ‰ to −25 ‰; marine plankton ‰ to −18 ‰; C3 plant ‰ to −24 ‰; C4 plants ‰ to −10 ‰; freshwater algae and their detritus ‰ to −40 ‰) have been reported in the ecosystem (Smith and Epstein, 1971; Cerling et al., 1997; Bouillon et al., 2003; Bontes et al., 2006; Kohn, 2010; Marwick et al., 2015). In the Hooghly, our measured δ13CPOC suggested an influx of POC via freshwater runoff as well as terrestrial C3 plants. Additionally, the estuary was also anthropogenically stressed during the post-monsoon season with measured δ13CPOC within the range reported for sewage (δ13CPOC ‰ to −14 ‰, Andrews et al., 1998; δ13CDOC ‰, Jin et al., 2018). In the mixing regime of the Hooghly, significantly lower δ13CPOC at H11 and H12 compared to other sampling locations may be linked to localized 13C-depleted organic C influx to the estuary from adjacent mangroves and anthropogenic discharge, respectively.
In the estuaries of the Sundarbans, isotopic signatures of POC showed similarity with terrestrial C3 plants. Interestingly, despite being a mangrove-dominated estuary (salinity: 12.74 to 16.55), no clear signature of either freshwater or mangrove-borne (δ13C: mangrove leaf ‰, soil ‰, Ray et al., 2015, 2018) POC was evident from δ13CPOC values, suggesting the possibility of significant POC modification within the system. Modification of POC within the estuaries of Indian subcontinent has been reported earlier (Sarma et al., 2014). Inter-estuary comparison revealed relatively lower average δ13CPOC at the Hooghly (mean δ13CPOC: ‰) compared to the Sundarbans (mean δ13CPOC: ‰), which appeared to be due to differences in degree of freshwater contribution, anthropogenic inputs (high in Hooghly vs. little/no in Sundarbans), the nature of terrestrial C3 plant material (mangrove in the Sundarbans vs. others in Hooghly), as well as responsible processes for POC modification within the system.
To decipher processes involved in POC modification, estimated ΔC for POC (ΔPOC) in the Hooghly indicated both net addition (n = 3) and removal (n = 3) of POC in the freshwater regime (ΔPOC = −0.45 to 0.48), whereas removal (n = 6) dominated over addition (n = 1) in the mixing regime (ΔPOC = −0.39 to 0.07). In an estuary, POC may be added through freshwater- and surface-runoff-mediated inputs, phytoplankton productivity and DOC flocculation. The removal of POC is likely due to settling at subtidal sediment, export to the adjacent continental shelf region, modification via conversion to DOC and degradation by respiration in the case of an oxygenated estuary.
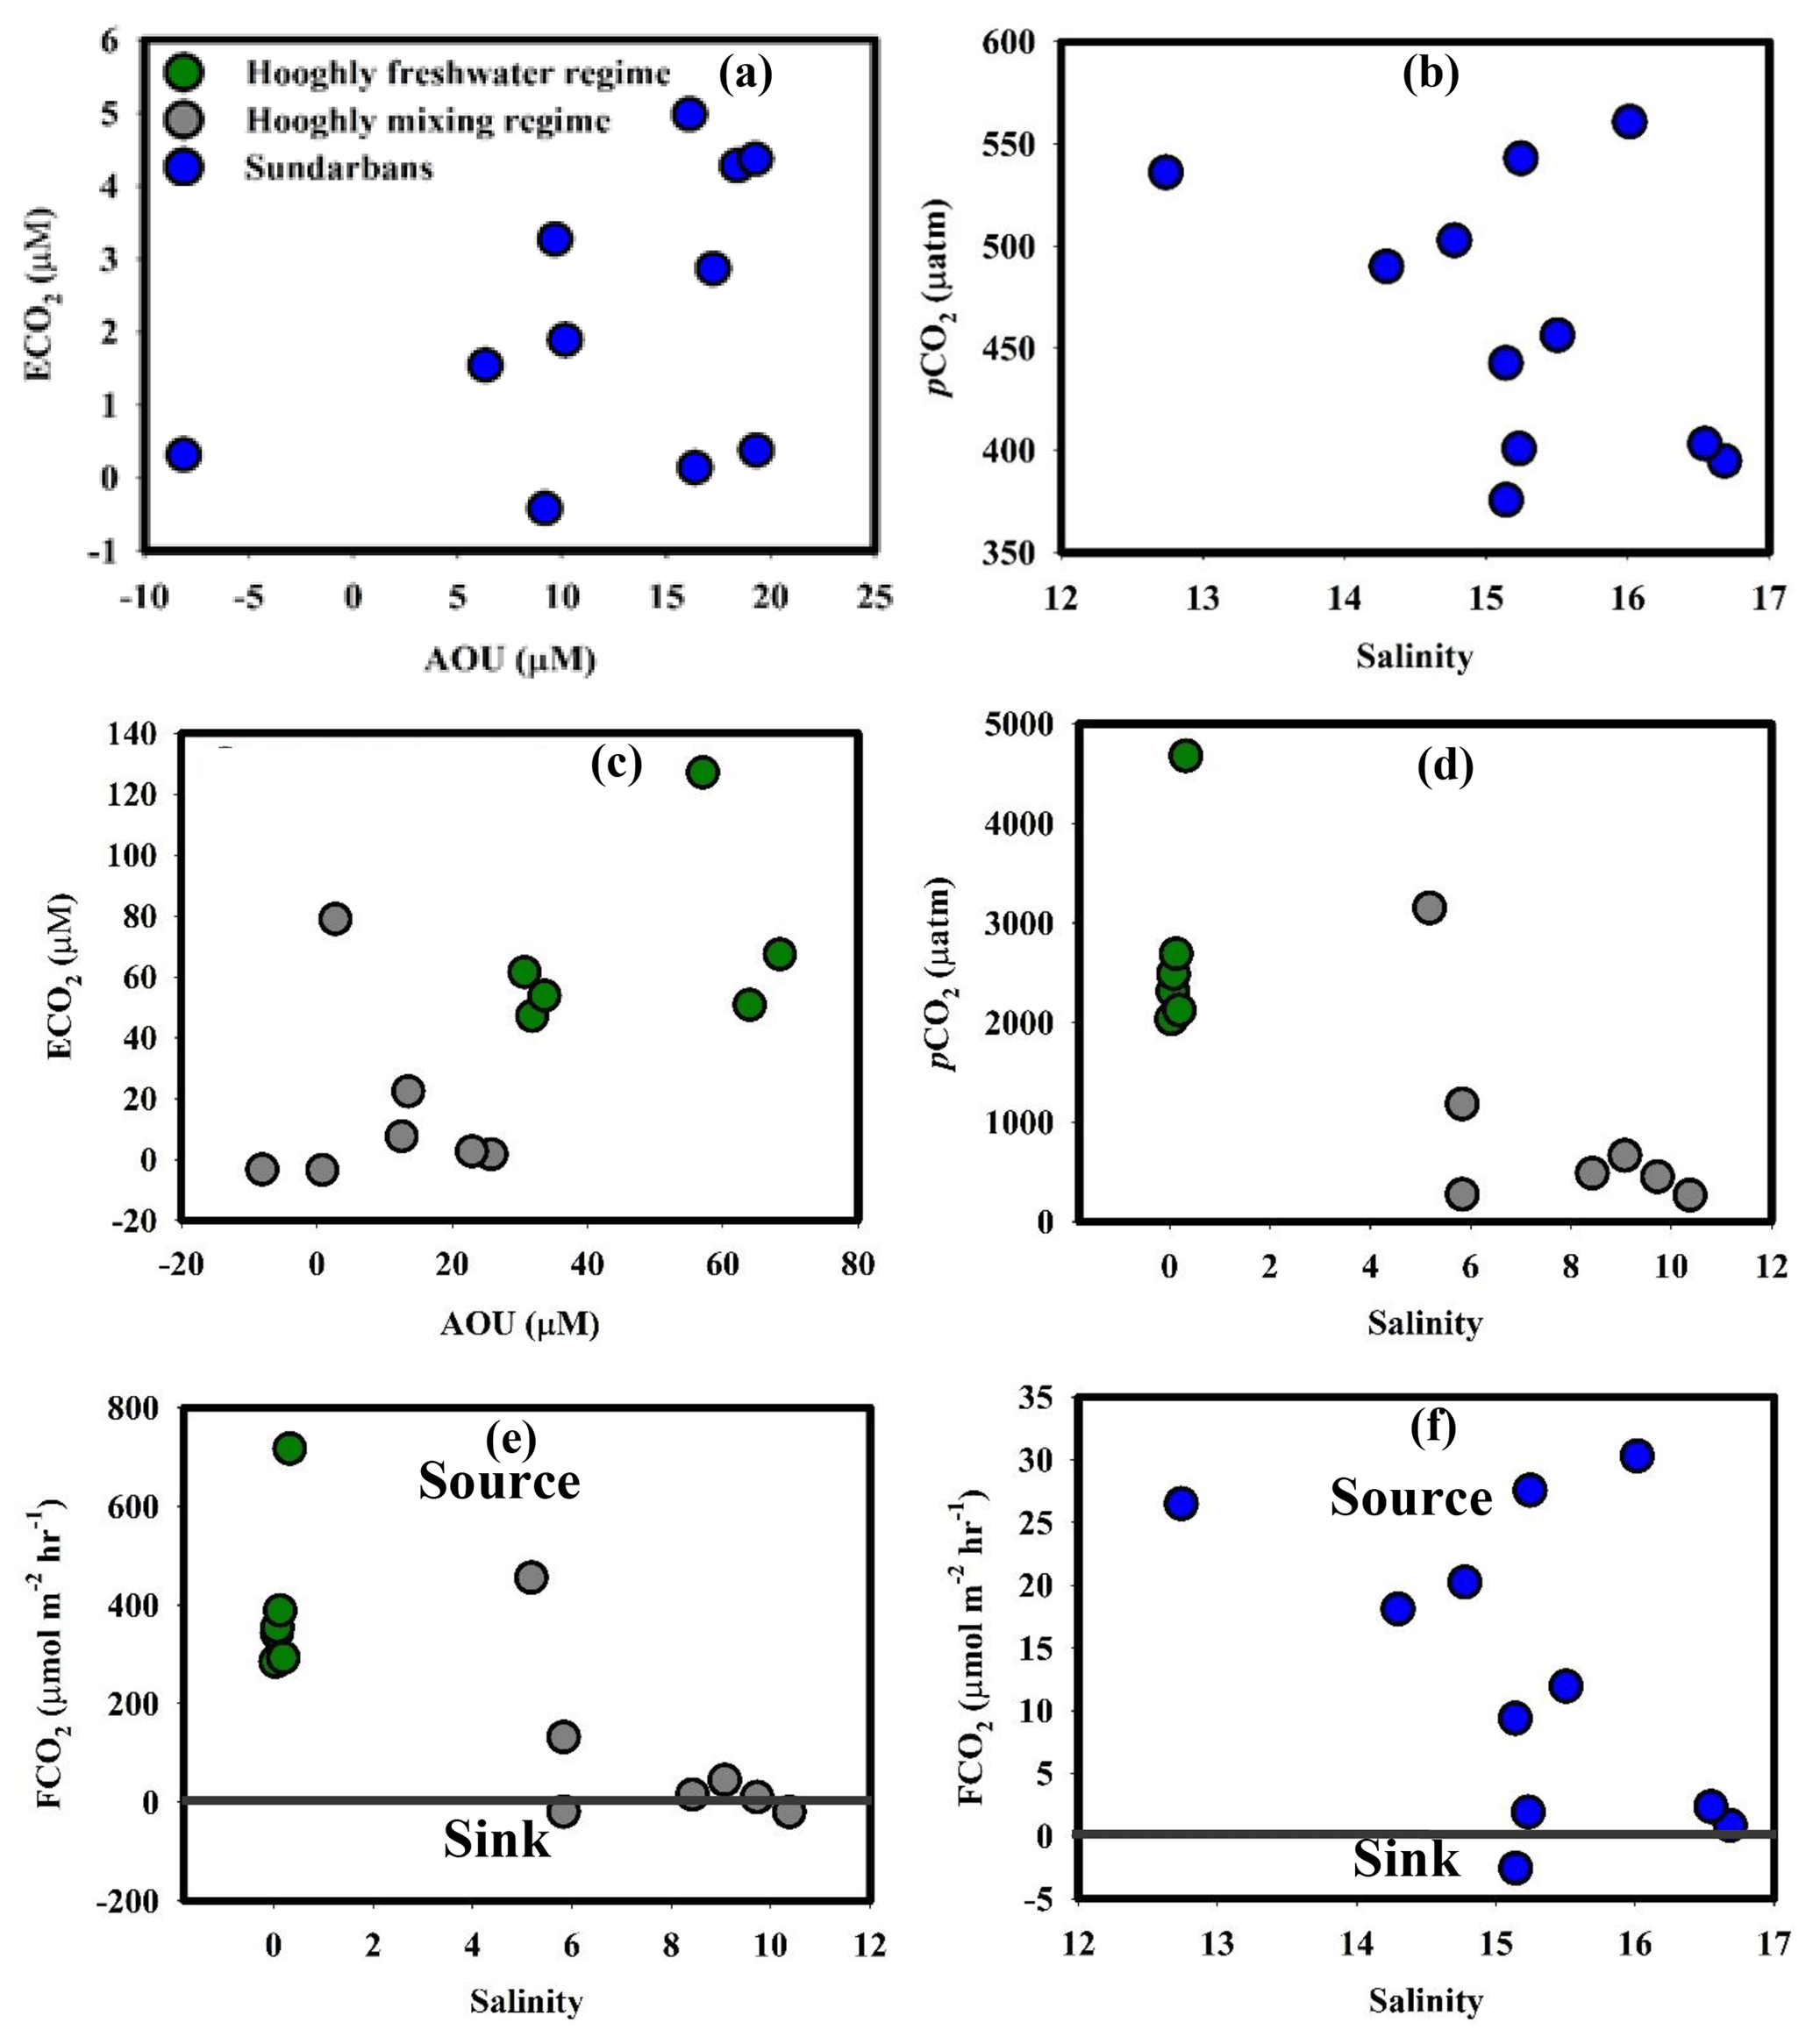
Figure 6(a) ECO2–AOU in the Sundarbans, (b) pCO2–salinity in the Sundarbans, (c) ECO2–AOU in the Hooghly, (d) pCO2–salinity in the Hooghly, (e) FCO2–salinity in the Hooghly and (f) FCO2–salinity in the Sundarbans.
The plot between Δδ13C for POC (Δδ13CPOC) and ΔPOC (Fig. 5d) indicated that different processes are active in different regimes of the Hooghly estuary. The decrease in ΔPOC with an increase in Δδ13CPOC (n = 4 for the mixing regime and n = 1 for the freshwater regime) suggested degradation of POC by respiration. This process did not appear to significantly impact the estuarine CO2 pool as evident from the POC–pCO2 relationship (freshwater regime: p = 0.29, mixing regime: p = 0.50; Fig. 5e). A decrease in both ΔPOC and Δδ13CPOC (n = 2 for mixing regime and n = 2 for freshwater regime) supported the settling of POC to subtidal sediment. Despite high-water residence time, this process may not be effective in the Hooghly due to unstable estuarine conditions (described earlier). An increase in ΔPOC with a decrease in Δδ13CPOC (n = 2 for the freshwater regime) indicated POC inputs via surface and freshwater runoff as well as phytoplankton productivity. An increase in both ΔPOC and Δδ13CPOC (n = 1 for the mixing regime and n = 1 for the freshwater regime) may be linked to DOC-to-POC conversion by flocculation.
In the Sundarbans, negative and lower ΔPOCM2 (−209 to −28 µM) compared to ΔPOCM1 (−35 to 327 µM) suggested DIC-like behaviour, i.e. simultaneous removal or modification along with the addition of mangrove-derived POC. No evidence for in situ POC–DOC exchange was found based on the POC–DOC relationship; however, the signal for degradation of POC by respiration was evident in the Sundarbans from the POC–pCO2 relationship (r2=0.37, p = 0.05, Fig. 5f). Similarly to the Hooghly, despite high-water residence time in mangroves (Alongi et al., 2005; Singh et al., 2016), unstable estuarine conditions may not favour efficient settlement of POC at subtidal sediment. The export of POC from the Hooghly–Sundarbans system to the northern BOB, without significant in situ modification, is also a possibility. This export has been estimated to be ∼0.02 to 0.07 and ∼0.58 Tg annually for the Hooghly and Sundarbans, respectively (Ray et al., 2018).
4.4 pCO2 and FCO2 in the Hooghly–Sundarbans
The estimated pCO2 values for the Hooghly–Sundarbans system during this study were in the range (Cochin estuary: 150 to 3800 µatm, Gupta et al., 2009; Mandovi–Zuari estuary: 500 to 3500 µatm, Sarma et al., 2001) reported for other tidal estuaries of India. In the Sundarbans, barring three locations (S3, T3 and M2), a significant negative correlation between pCO2 and percent saturation of DO (r2= 0.76, p = 0.005; figure not given) suggested the presence of processes, such as degradation of OM by respiration, responsible for controlling both CO2 production and O2 consumption in the surface estuarine water. Furthermore, significant positive correlation between ECO2 and AOU (ECO2= 0.057 AOU + 1.22, r2= 0.76, p = 0.005, n = 8; Fig. 6a) confirmed the effect of OM degradation by respiration on CO2 distribution, particularly in the upper region of the Sundarbans. Our observations were in agreement with a previous study in the Sundarbans (Akhand et al., 2016) as well as another subtropical estuary, Pearl River estuary, China (Zhai et al., 2005). However, a relatively lower slope for ECO2–AOU relationship (0.057) compared to the slope for Redfield respiration in a -rich environment ((CH2O)106(NH3)16H3PO4 + + ; ΔCO2: (−ΔO2) = 124∕138 = 0.90, Zhai et al., 2005) suggested lower production of CO2 than expected from Redfield respiration. This may be linked to the formation of low molecular weight OM instead of the final product (CO2) during aerobic OM respiration (Zhai et al., 2005). Moreover, the pCO2–salinity relationship (p = 0.18, Fig. 6b) confirmed no significant effect of freshwater and marine water contribution on variability of pCO2 in the Sundarbans. Other potential sources of CO2 to the mangrove-dominated Sundarbans could be groundwater (or pore water) exchange across the intertidal mangrove sediment–water interface. Although based on our own data set, it is not possible to confirm the same. However, relatively higher pCO2 levels during low tide compared to high tide at the Matla estuary in the Sundarbans (Akhand et al., 2016) as well as in other estuarine mangrove systems worldwide (Bouillon et al., 2007; Call et al., 2015; Rosentreter et al., 2018) suggested groundwater (or pore water) exchange to be a potential CO2 source in such systems.
Unlike the Sundarbans, the ECO2–AOU relationship did not confirm the significant impact of OM degradation by respiration on CO2 in either freshwater (p = 0.50) or mixing regimes (p = 0.75) of the Hooghly (Fig. 6c). Overall, pCO2 in the freshwater regime of the Hooghly was significantly higher compared to the mixing regime (Table 3), which may be linked to additional CO2 supply in the freshwater regime via freshwater or surface runoff from adjoining areas (Table 1). Inter-estuary comparison of pCO2 also revealed higher average pCO2 in the Hooghly by ∼1291 µatm compared to the Sundarbans, which was largely due to significantly higher pCO2 in the freshwater regime of the Hooghly (Tables 2 and 3). A lack of negative correlation between pCO2 and salinity in freshwater regime (Fig. 6d) of the Hooghly suggested a limited contribution of CO2 due to freshwater input. Therefore, CO2 supply via surface runoff may be the primary reason for higher pCO2 in the Hooghly estuary.
Positive mean FCO2 clearly suggested the Hooghly–Sundarbans system to be a net source of CO2 to the regional atmosphere post-monsoon (Fig. 6e, f). Specifically, from regional climate and environmental change perspectives, the anthropogenically influenced Hooghly estuary was a relatively greater source of CO2 to the regional atmosphere compared to the mangrove-dominated Sundarbans ([FCO2]Hooghly: [FCO2]Sundarbans= 17). However, despite being a CO2 source, FCO2 measured for the estuaries of the Sundarbans were considerably lower compared to global mean FCO2 reported for the mangrove-dominated estuaries (∼43 to 59 mmol C m−2 d−1; Call et al., 2015). Similarly, FCO2 measured for the Hooghly estuary were relatively lower compared to some Chinese estuarine systems (Pearl River inner estuary: 46 mmol m−2 d−1, Guo et al., 2009; Yangtze River estuary: 41 mmol m−2 d−1, Zhai et al., 2007).
The difference in FCO2 between the Hooghly and Sundarbans may be due to variability in pCO2 level as well as micrometeorological and physicochemical parameters controlling gas transfer velocity across the water–atmosphere interface. Quantitatively, the difference in k values for the Hoogly and Sundarbans were not large (kSundarbans−kHooghly ∼ 0.031 cm h−1). Therefore, large difference in FCO2 between these two estuarine systems may be due to a difference in pCO2. Taken together, supporting our hypothesis, it appears that differences in land use and degrees of anthropogenic influence have the potential to alter the C biogeochemistry of aquatic ecosystems with anthropogenically stressed aquatic systems acting as a relatively greater source of CO2 to the regional atmosphere than mangrove-dominated ones.
The present study focused on investigating different aspects of C biogeochemistry of the anthropogenically affected Hooghly estuary and mangrove dominated estuaries of the Sundarbans during the post-monsoon season. Considering the different natures and quantities of supplied organic matter within these two contrasting systems, it was hypothesized in this study that C metabolism in these two estuaries was different with higher CO2 exchange flux from the anthropogenically influenced estuary compared to the mangrove-dominated one. The results obtained during the study supported this hypothesis with significant differences in physicochemical parameters and active biogeochemical processes in these two estuaries. While freshwater intrusion, along with inorganic and organic C metabolisms, appeared to shape DIC dynamics in the Hooghly, significant DIC removal (via CO2 outgassing, phytoplankton uptake as well as export to adjoining continental shelf regions) and the influence of groundwater were noticed in the Sundarbans. Relatively higher DOC concentration in the Hooghly compared to the Sundarbans was due to cumulative interactions among anthropogenic inputs, DOC–POC interconversion and groundwater contribution. Freshwater runoff, terrestrial C3 plants and anthropogenic inputs contributing to the POC pool in the Hooghly, whereas a contribution from C3 plants was dominant at the Sundarbans. Surface runoff from adjoining areas in the Hooghly and degradation of OM by respiration in the Sundarbans largely controlled pCO2 in the system. Overall, the entire Hooghly–Sundarbans system acted as a source of CO2 to the regional atmosphere with ∼17 times higher emission from the Hooghly compared to the Sundarbans, suggesting a significant role played by an anthropogenically stressed estuarine system from regional climate change perspectives.
Data used in the manuscript are presented in tables (Tables 2, 3 and 4) of the manuscript.
MKD and SK designed the study. MKD collected and analysed samples with RM and PS. MKD and SK interpreted the data and drafted the manuscript. SKM provided a facility with which to measure basic physicochemical parameters and DOC.
The authors declare that they have no conflict of interest.
This article is part of the special issue “Human impacts on carbon fluxes in Asian river systems”. It is not associated with a conference.
MKD is thankful to Physical Research Laboratory (PRL) postdoctoral fellowship
programme for providing fellowship. Authors are thankful to ISRO-GBP for
financial support and Sundarbans Biosphere Reserve for their permission to
carry out the sampling. Thanks to Rishmita Mukherjee and Avanti Acharya for
their help during field observations. We also thank two anonymous reviewers
and the associate editor for valuable comments, which significantly improved
the quality of the manuscript.
Edited by:
Ji-Hyung Park
Reviewed by: two anonymous referees
Abril, G., Nogueira, E., Hetcheber, H., Cabeçadas, G., Lemaire, E., and Brogueira, M. J.: Behaviour of organic carbon in nine contrasting European estuaries, Estuar. Coast. Shelf Sci., 54, 241–262, https://doi.org/10.1006/ecss.2001.0844, 2002.
Akhand, A., Chandra, A., Dutta, S., and Hazra, S.: Air- water carbon dioxide exchange dynamics along the estuarine transition zone of Sunderban, northern Bay of Bengal, India, Indian J. Geo-Mar. Sci. 41, 111–116, 2012.
Akhand, A., Chanda, A., Manna, S., Das, S., Hazra, S., Roy, R., Choudhury, S. B., Rao, K. H., Dadhwal, V. K., Chakraborty, K., and Mostofa, K. M. G.: A comparison of CO2 dynamics and air-water fluxes in a river dominated estuary and a mangrove dominated marine estuary, Geophys. Res. Lett., 43, 11726–11735, https://doi.org/10.1002/2016GL070716, 2016.
Alling, V., Porcelli, D., Morth, C.-M., Anderson, L. G., Sanchez- Garcia, L., Gustafsson, O., Andersson, P. S., and Humborg, C.: Degradation of terrestrial organic carbon, primary production and out-gassing of CO2 in the Laptev and East Siberian Seas as inferred from δ13C values of DIC, Geochim. Cosmochim. Ac., 95, 143–159, https://doi.org/10.1016/j.gca.2012.07.028, 2012.
Alongi, D. M.: Carbon cycling and storage in mangrove forests, Ann. Rev. Mar. Sci., 6, 195–219, https://doi.org/10.1146/annurev-marine-010213-135020, 2014.
Alongi, D. M. and Mukhopadhyay, S. K.: Contribution of mangroves to coastal carbon cycling in low latitude seas, Agr. Forest Meteorol., 213, 266–272, https://doi.org/10.1016/j.agrformet.2014.10.005, 2014.
Alongi, D. M., Ramanathan, A. L., Kannan, L., Tirendi, F., Trott, L. A., and Prasad, M. B. K.: Human induced disturbance on benthic microbial metabolism in the Pichavaram mangroves, Vellar Coleroon estuarine complex, India, Mar. Biol., 147, 1033–1044, https://doi.org/10.1007/s00227-005-1634-5, 2005.
Andrews, J. E., Greenway, A. M., and Dennis, P. F.: Combined carbon isotope and C/N ratios as indicators of source and fate of organic matter in a poorly flushed, tropical estuary, Hunts Bay, Kingston Harbour, Jamaica, Estuar. Coast. Shelf Sci., 46, 743–456, https://doi.org/10.1006/ecss.1997.0305, 1998.
Barnes, J., Ramesh, R., Purvaja, R., Nirmal Rajkumar, A., Senthil Kumar, B., and Krithika, K.: Tidal dynamics and rainfall control N2O and CH4 emissions from a pristine mangrove creek, Geophys. Res. Lett., 33, L15405, https://doi.org/10.1029/2006GL026829, 2006.
Bauer, J. E., Cai, W. J., Raymond, P. A., Bianchi, T. S., Hopkinson, C. S., and Regnier, P. A. G.: The changing carbon cycle of the coastal ocean, Nature, 504, 61–70, https://doi.org/10.1038/nature12857, 2013.
Bhavya, P. S., Kumar, S., Gupta, G. V. M., and Sudheesh, V.: Carbon uptake rates in the Cochin estuary and adjoining coastal Arabian Sea, Estuar. Coast., 40, 447–456, https://doi.org/10.1007/s12237-016-0147-4, 2017.
Bhavya, P. S., Kumar, S., Gupta, G. V. M., Sudharma, K. V., and Sudheesh, V.: Spatial-temporal variation in δ13CDIC of a tropical eutrophic estuary (Cochin estuary, India), Cont. Shelf Res., 153, 75–85, https://doi.org/10.1016/j.csr.2017.12.006, 2018.
Biswas, H., Mukhopadhyay, S. K., De, T. K., Sen, S., and Jana, T. K.: Biogenic controls on the air-water carbon dioxide exchange in the Sundarban mangrove environment, northeast coast of Bay of Bengal, India, Limnol. Oceanogr., 49, 95–101, https://doi.org/10.4319/lo.2004.49.1.0095, 2004.
Biswas, H., Mukhopadhyay, S. K., Sen, S., and Jana, T. K.: Spatial and temporal patterns of methane dynamics in the tropical mangrove dominated estuary, NE Coast of Bay of Bengal, Indian J. Mar. Syst., 68, 55–64, https://doi.org/10.1016/j.jmarsys.2006.11.001, 2007.
Bontes, B. M., Pel, R., Ibelings, B. W., Boschker, H. T. S., Middelburg, J. J., and Van Donk, E.: The effects of biomanipulation on the biogeochemistry, carbon isotopic composition and pelagic food web relations of a shallow lake, Biogeosciences, 3, 69–83, https://doi.org/10.5194/bg-3-69-2006, 2006.
Borges, A. V., Delille, B., Schiettecatte, L.-S., Gazeau, F., Abril, G., and Frankignoulle, M.: Gas transfer velocities of CO2 in three European estuaries (Randers Fjord, Scheldt and Thames), Limnol. Oceanogr., 49, 1630–1641, https://doi.org/10.4319/lo.2004.49.5.1630, 2004.
Borges, A. V., Delille, B., and Frankignoulle, M.: Budgeting sinks and sources of CO2 in the coastal ocean: Diversity of ecosystems counts, Geophys. Res. Lett., 32, L14601, https://doi.org/10.1029/2005gl023053, 2005.
Boto, K. G. and Wellington, J. T.: Seasonal variations in concentrations and fluxes of dissolved organic and inorganic materials in a tropical, tidally dominated waterway, Mar. Ecol. Prog. Ser., 50, 151–160, 1988.
Bouillon, S., Frankignoulle, M., Dehairs, F., Velimirov, B., Eiler, A., Etcheber, H., Abril, G., and Borges, A. V.: Inorganic and organic carbon biogeochemistry in the Gautami Godavari estuary (Andhra Pradesh, India) during pre-monsoon: the local impact of extensive mangrove forests, Global Biogeochem. Cy., 17, 1114, https://doi.org/10.1029/2002GB002026, 2003.
Bouillon, S., Korntheuer, M., Baeyens, W., and Dehairs, F.: A new automated setup for stable isotope analysis of dissolved organic carbon, Limnol. Oceanogr., 216–226, https://doi.org/10.4319/lom.2006.4.216, 2006.
Bouillon, S., Dehairs, F., Velimirov, B., Abril, G., and Borges, A. V.: Dynamics of organic and inorganic carbon across contiguous mangrove and seagrass systems (Gazi Bay, Kenya), J. Geophys. Res., 112, G02018, https://doi.org/10.1029/2006JG000325, 2007.
Bouillon, S., Borges, A. V., Castañeda-Moya, E., Diele, K., Dittmar, T., Duke, N. C., Kristensen, E., Lee, S. Y., Marchand, C., Middelburg, J. J., Rivera-Monroy, V. H., Smith, T. J., and Twilley, R. R.: Mangrove production and carbon sinks: A revision of global budget estimates, Global Biogeochem. Cy., 22, GB2013, https://doi.org/10.1029/2007GB003052, 2008.
Cai, W.-J.: Estuarine and coastal ocean carbon paradox: CO2 sinks or sites of terrestrial carbon incineration?, Annu. Rev. Mar. Sci., 3, 123–145, 2011.
Cai, W.-J., Wang, Y., Krest, J., and Moore, W. S.: The geochemistry of dissolved inorganic carbon in a surficial groundwater aquifer in North Inlet, South Carolina and the carbon fluxes to the coastal ocean, Geochim. Cosmochim. Ac., 67, 631–637, https://doi.org/10.1016/S0016-7037(02)01167-5, 2003.
Cai, W.-J., Dai, M., and Wang, Y.: Air-sea exchange of carbon dioxide in ocean margins: A province-based synthesis, Geophys. Res. Lett., 33, 2–5, 2006.
Call, M., Maher, D. T., Santos, I. R., Ruiz-Halpern, S., Mangion, P., and Sanders, C. J., Erler, D. V., Oakes, J. M., Rosentreter, J., Murry, R., and Eyre, B. D: Spatial and temporal variability of carbon dioxide and methane fluxes over semidiurnal and spring–neap–spring timescales in a mangrove creek, Geochim. Cosmochim. Ac., 150, 211–225, https://doi.org/10.1016/j.gca.2014.11.023, 2015.
Camilleri, J. C. and Ribi, G.: Leaching of dissolved organic carbon (DOC) from dead leaves, formation of flakes from DOC, and feeding on flakes by crustaceans in mangroves, Mar. Biol., 91, 337–344, 1986.
Carpenter, I. H., Bradford, W. L., and Grant, V.: Processes affecting the composition of estuarine waters, in: Estuarine Research, 1, edited by: Cronin, L. E., Academic, 188–214, 1975.
Cerling, T. E., Harris, J. H., MacFadden, B. J., Leakey, M. G., Quadek, J., Eisenmann, V., and Ehleringer, J. R.: Global vegetation change through the Miocene/Pliocene boundary, Nature, 389, 153–158, https://doi.org/10.1038/38229, 1997.
Chen, C.-T. A. and Borges, A. V.: Reconciling opposing views on carbon cycling in the coastal ocean: Continental shelves as sinks and near-shore ecosystems as sources of atmospheric CO2, Deep-Sea. Res. Pt. II, 56, 578–590, 2009.
CIFRI: Present status of Hilsa in Hooghly – Bhagirathi river, Central Inland Fisheries Research Institute, available at: http://cifri.ernet.in/Bulletins/Bulletin_No.179.pdf (last access: 10 May 2018), 2012.
Cotovicz Jr., L. C., Knoppers, B. A., Brandini, N., Costa Santos, S. J., and Abril, G.: A strong CO2 sink enhanced by eutrophication in a tropical coastal embayment (Guanabara Bay, Rio de Janeiro, Brazil), Biogeosciences, 12, 6125–6146, https://doi.org/10.5194/bg-12-6125-2015, 2015.
Dittmar, T. and Lara, R. J.: Driving forces behind nutrient and organic matter dynamics in a mangrove tidal creek in north Brazil, Estuar. Coast. Shelf Sci., 52, 249–259, https://doi.org/10.1006/ecss.2000.0743, 2001.
Dittmar, T., Hertkorn, N., Kattner, G., and Lara, R. J.: Mangroves, a major source of dissolved organic carbon to the oceans, Global Biogeochem. Cy., 20, GB1012, https://doi.org/10.1029/2005gb002570, 2006.
Donato, D. C., Kauffman, J. B., Kurnianto, S., Stidham, M., and Murdiyarso, D.: Mangroves among the most carbon-rich forests in the tropics, Nat. Geosci., 4, 293–297, https://doi.org/10.1038/NGEO1123, 2011.
Dutta, K., Ravi Prasad, G. V., Ray, D. K., and Raghav, K.: Decadal changes of Radiocarbon in the surface Bay of Bengal: Three decades after GEOSECS and one decade after WOCE, Radiocarbon, 52, 1191–1196, 2010.
Dutta, M. K., Chowdhury, C., Jana, T. K., and Mukhopadhyay, S. K.: Dynamics and exchange fluxes of methane in the estuarine mangrove environment of Sundarbans, NE coast of India, Atmos. Environ., 77, 631–639, https://doi.org/10.1016/j.atmosenv.2013.05.050, 2013.
Dutta, M. K., Mukherkjee, R., Jana, T. K., and Mukhopadhyay, S. K.: Biogeochemical dynamics of exogenous methane in an estuary associated to a mangrove biosphere; the Sundarbans, NE coast of India, Mar. Chem., 170, 1–10, https://doi.org/10.1016/j.marchem.2014.12.006, 2015.
Dutta, M. K., Bianchi, T. S., and Mukhopadhyay, S. K.: Mangrove methane biogeochemistry in the Indian Sundarbans: a proposed budget, Front. Mar. Sci., 4, 187, https://doi.org/10.3389/fmars.2017.00187, 2017.
Frankignoulle, M. and Borges, A. V.: Direct and indirect pCO2 measurements in a wide range of pCO2 and salinity values (the Scheldt estuary), Aquat. Geochem., 7, 267–273, https://doi.org/10.1023/A:1015251010481, 2001.
Frankignoulle, M., Abril, G., Borges, A., Bourge, I., Canon, C., Delille, B., Libert, E., and Théate, J.-M.: Carbon dioxide emission from European estuaries, Science, 282, 434–436, https://doi.org/10.1126/science.282.5388.434, 1998.
Freitas, H. A., Pessenda, L. C. R., Aravena, R., Gouveia, S. E. M., Ribeiro, A. S., and Boulet, R.: Late quaternary vegetation dynamics in the southern Amazon Basin inferred from carbon isotopes in soil organic matter, Quaternary Res., 55, 39–46, https://doi.org/10.1006/qres.2000.2192 2001.
Fry, B.: Conservative mixing of stable isotopes across estuarine salinity gradients: a conceptual framework for monitoring watershed influences on downstream fisheries production, Estuaries, 25, 264–271, https://doi.org/10.1007/BF02691313, 2002.
Ganguly, D., Dey, M., Mandal, S. K., De, T. K., and Jana, T. K.: Energy dynamics and its implication to biosphere-atmosphere exchange of CO2, H2O and CH4 in a tropical mangrove forest canopy, Atmos. Environ., 42, 4172–4184, 2008.
Ganguly, D., Dey, M., Sen, S., and Jana, T. K.: Biosphere-atmosphere exchange of NOx in the tropical mangrove forest, J. Geophys. Res., 114, G04014, https://doi.org/10.1029/2008JG000852, 2009.
Gattuso, J.-P., Frankignoulle, M., Bourge, I., Romaine, S., and Buddemeier, R. W.: Effect of calcium carbonate saturation of seawater on coral calcification, Global Planet. Change, 18, 37–46, https://doi.org/10.1016/S0921-8181(98)00035-6, 1998.
Ghosh, B. B., Ray, P., and Gopalakrishnan, V.: Survey and characterization of waste water discharged into the Hooghly Estuary, J. Inland Fishery Soc. India, 4, 2–10, 1973.
Giri, C., Ochieng, E., Tieszen, L., Zhu, Z., Singh, A., Loveland, T., Masek, J., and Duke, N.: Status and distribution of mangrove forests of the world using earth observation satellite data, Glob. Ecol. Biogeogr., 20, 154–159, 2011.
Goutam, K. S., Tanaya, D., Anwesha, S., Sharanya, C., and Meenakshi, C.: Tide and mixing characteristics in Sundarbans Estuarine River system, Hydrol. Current Res., 6, 204, https://doi.org/10.4172/2157-7587.1000204, 2015.
Grasshoff, K., Ehrharft, M., and Kremling, K.: Methods of Seawater Analysis, 2nd Edn., Weinheim, Verlag Chemie, 1983.
Guo, X., Dai, M., Zhai, W., Cai, W.-J., and Chen, B.: CO2 flux and seasonal variability in a large subtropical estuarine system, the Pearl River Estuary, China J. Geophys. Res., 114, G03013, https://doi.org/10.1029/2008JG000905, 2009.
Gupta, G. V. M., Thottathil, S. D., Balachandran, K. K., Madhu, N. V., Madeswaran, P., and Nair, S.: CO2 supersaturation and net heterotrophy in a tropical estuary (Cochin, India): influence of anthropogenic effect, Ecosystems, 12, 1145–1157, https://doi.org/10.1007/s10021-009-9280-2, 2009.
Heip, C. H. R., Goosen, N. K., Herman, P. M. J., Kromkamp, J., Middelburg, J. J., and Soetaert, K.: Production and consumption of biological particles in temperate tidal estuaries, Oceanogr. Mar. Biol. Annu. Rev., 33, 1–149, 1995.
Hopkinson, C. S., Fry, B., and Nolin, A.: Stoichiometry of dissolved organic matter dynamics on the continental shelf of the Northeastern USA, Cont. Shelf Res., 17, 473–489, https://doi.org/10.1016/S0278-4343(96)00046-5, 1997.
Huang T.-H., Fu Y.-H., Pan P.-Y., and Arthur Chen, C.-T.: Fluvial carbon fluxes in tropical rivers, Curr. Opin. Env. Sust., 4, 162–169, https://doi.org/10.1016/j.cosust.2012.02.004, 2012.
Ittekkot, V.: Global trends in the nature of organic matter in river suspensions, Nature, 332, 436–438, 1988.
Ittekkot, V. and Laane, R. W. P. M.: Fate of riverine particulate organic matter, in: Biogeochemistry of major world rivers, edited by: Degens, E. T., Kemp, S., and Richey, J. E., Chichester, Wiley, 233–243, 1991.
Jennerjahn, T. and Ittekkot, C. V.: Organic matter in sediments in the mangrove areas and adjacent continental margins of Brazil: I. Amino acids and hexosamines, Oceanol. Acta, 20, 359–369, 1997.
Jin, H., Yoon, T. K., Begum, M. S., Lee, E. J., Oh, N. H., Kang, N., and Park, J. H.: Longitudinal discontinuities in riverine greenhouse gas dynamics generated by dams and urban wastewater, Biogeosciences, 15, 6349–6369, https://doi.org/10.5194/bg-15-6349-2018, 2018.
Katsoyiannis, A. and Samara, C.: Ecotoxicological evaluation of the wastewater treatment process of the sewage treatment plant of Thessaloniki, Greece, J. Hazard. Mater., 141, 614–621, https://doi.org/10.1016/j.jhazmat.2006.07.038, 2006.
Katsoyiannis A. and Samara C.: The Fate of Dissolved Organic Carbon (DOC) in the wastewater treatment process and its importance in the removal of wastewater contaminants, Environ. Sci. Pollut. Res., 14, 284–292, https://doi.org/10.1065/espr2006.05.302, 2007.
Khan, R. A.: The pollution problem of Hooghly estuarine system; Estuarine Ecosystem Series, Zoological survey of India, Part 2, 497–542, 1995.
Kohn, M. J.: Carbon isotope compositions of terrestrial C3 plants as indicators of (paleo) ecology and (paleo) climate, P. Natl. Acad. Sci. USA, 107, 19691–19695, 2010.
Kristensen, E. and Alongi, D. M.: Control by fiddler crabs (Ucavocans) and plant roots (Avicennia marina) on carbon, iron, and sulphur biogeochemistry in mangrove sediment, Limnol. Oceanogr., 51, 1557–1571, https://doi.org/10.4319/lo.2006.51.4.1557, 2006.
Kristensen, E. and Suraswadi, P.: Carbon, nitrogen and phosphorus dynamics in creek water of a Southeast Asian mangrove forest, Hydrobiologia, 474, 197–211, 2002.
Le Quéré, C., Andrew, R. M., Canadell, J. G., Sitch, S., Korsbakken, J. I., Peters, G. P., Manning, A. C., Boden, T. A., Tans, P. P., Houghton, R. A., Keeling, R. F., Alin, S., Andrews, O. D., Anthoni, P., Barbero, L., Bopp, L., Chevallier, F., Chini, L. P., Ciais, P., Currie, K., Delire, C., Doney, S. C., Friedlingstein, P., Gkritzalis, T., Harris, I., Hauck, J., Haverd, V., Hoppema, M., Klein Goldewijk, K., Jain, A. K., Kato, E., Körtzinger, A., Landschützer, P., Lefèvre, N., Lenton, A., Lienert, S., Lombardozzi, D., Melton, J. R., Metzl, N., Millero, F., Monteiro, P. M. S., Munro, D. R., Nabel, J. E. M. S., Nakaoka, S.-I., O'Brien, K., Olsen, A., Omar, A. M., Ono, T., Pierrot, D., Poulter, B., Rödenbeck, C., Salisbury, J., Schuster, U., Schwinger, J., Séférian, R., Skjelvan, I., Stocker, B. D., Sutton, A. J., Takahashi, T., Tian, H., Tilbrook, B., van der Laan-Luijkx, I. T., van der Werf, G. R., Viovy, N., Walker, A. P., Wiltshire, A. J., and Zaehle, S.: Global Carbon Budget 2016, Earth Syst. Sci. Data, 8, 605–649, https://doi.org/10.5194/essd-8-605-2016, 2016.
Linto N., Barnes, J., Ramachandran, R., Divia, J., Ramachandran, P., and Upstill-Goddard, R. C.: Carbon dioxide and methane emissions from mangrove-associated waters of the Andaman Islands, Bay of Bengal, Estuar. Coast., 37, 381–398, https://doi.org/10.1007/s12237-013-9674-4, 2014.
Liss, P. S. and Merlivat, L.: Air sea gas exchange rates: introduction and synthesis, in: The Role of Air Sea Exchange in Geochemical Cycling, edited by: Buat-Menard, P., Hingham, M. A, and Reidel, D., 113–129, 1986.
Maher, D., Santos, I., Golsby-Smith, L., Gleeson, J., and Eyre, B.: Groundwater-derived dissolved inorganic and organic carbon exports from a mangrove tidal creek: The missing mangrove carbon sink?, Limnol. Oceanogr., 58, 475–488, https://doi.org/10.4319/lo.2013.58.2.0475, 2013.
Marwick, T. R., Tamooh, F., Teodoru, C.R., Borges, A.V., Darchambeau, F., and Bouillon, S.: The age of river-transported carbon: A global perspective, Global Biogeochem. Cy., 29, 122–137, https://doi.org/10.1002/2014GB004911, 2015.
Millero, F. J.: Chemical Oceanography, 4th edn., CRC press, Taylor and Francis Group, 2013.
Miyajima T., Tsuboi Y., Tanaka Y., and Koike, I.: Export of inorganic carbon from two Southeast Asian mangrove forests to adjacent estuaries as estimated by the stable isotope composition of dissolved inorganic carbon, J. Geophys. Res., 114, G01024, https://doi.org/10.1029/2008JG000861, 2009.
Mook, W. G. and Tan, T. C.: Stable carbon isotopes in rivers and estuaries, in: Biogeochemistry of Major World Rivers, SCOPE, edited by: Degens, E. T., Kempe, S., and Richey, J. E., John Wiley and Sons Ltd., 245–264, 1991.
Moran, M. A., Sheldon Jr., W. M., and Sheldon, J. E.: Biodegradation of riverine dissolved organic carbon in five estuaries of the south United States, Estuaries, 22, 55–64, 1999.
Mukhopadhyay, S. K., Biswas, H., De, T. K., Sen, S., and Jana, T. K.: Seasonal effects on the air–water carbon dioxide exchange in the Hooghly estuary, NE coast of Bay of Bengal, India, J. Environ. Monit., 36, 629–638, https://doi.org/10.1039/b201614a, 2002.
Mukhopadhyay, S. K., Biswas, H., De, T. K., and Jana, T. K.: Fluxes of nutrients from the tropical river Hooghly at the land-ocean boundary of Sundarbans, NE coast of Bay of Bengal, India, J. Marine Syst., 62, 9–21, https://doi.org/10.1016/j.jmarsys.2006.03.004, 2006.
Ray, R., Ganguly, D., Chowdhury, C., Dey, M., Das, S., Dutta, M. K., Mandal, S. K., Majumder, N., De, T. K., Mukhopadhyay, S. K., and Jana, T. K.: Carbon sequestration and annual increase of carbon stock in a mangrove forest, Atmos. Environ., 45, 5016–5024, https://doi.org/10.1016/j.atmosenv.2011.04.074, 2011.
Ray, R., Rixen, T., Baum, A., Malik, A., Gleixner, G., and Jana, T. K.: Distribution, sources and biogeochemistry of organic matter in a mangrove dominated estuarine system (Indian Sundarbans) during the pre-monsoon, Estuar. Coast. Shelf Sci. 167, 404–413, https://doi.org/10.1016/j.ecss.2015.10.017, 2015.
Ray, R., Baum, A., Rixen, T., Gleixner, G., and Jana, T. K.: Exportation of dissolved (inorganic and organic) and particulate carbon from mangroves and its implication to the carbon budget in the Indian Sundarbans, Sci. Total Environ., 621, 535–547, https://doi.org/10.1016/j.scitotenv.2017.11.225, 2018.
Raymond, P. A. and Bauer, J. E.: DOC cycling in a temperate estuary: a mass balance approach using natural 14C and 13C, Limnol. Oceanogr., 46, 655–667, https://doi.org/10.4319/lo.2001.46.3.0655, 2001.
Raymond, P. A. and Cole, J. J.: Gas exchange in rivers and estuaries: Choosing a gas transfer velocity, Estuaries, 24, 312–317, https://doi.org/10.2307/1352954, 2001.
Reay, W. G., Gallagher, D., and Simmons, G. M.: Sediment water column nutrient exchanges in Southern Chesapeake Bay near shore environments, Virginia Water Resources Research Centre, Bulletin – 181b, 1995.
Regnier, P., Friedlingstein, P., Ciais, P., Mackenzie, F. T., Gruber, N., Janssens, I. A., Laruelle, G. G., Lauerwald, R., Luyssaert, S., Andersson, A. J., Arndt, S., Arnosti, C., Borges, A. V., Dale, A. W., Gallego-Sala, A., Godderis, Y., Goossens, N., Hartmann, J., Heinze, C., Ilyina, T., Joos, F., LaRowe, D. E., Leifeld, J., Meysman, F. J. R., Munhoven, G., Raymond, P. A., Spahni, R., Suntharalingam, P., and Thullner, M.: Anthropogenic perturbation of the carbon fluxes from land to ocean, Nat. Geosci., 6, 597–607, https://doi.org/10.1038/ngeo1830, 2013.
Rosentreter, J. A., Maher, D. T., Erler, D. V., Murray, R., and Eyre, B. D.: Seasonal and temporal CO2 dynamics in three tropical mangrove creeks – A revision of global mangrove CO2 emissions, Geochim. Cosmochim. Ac., 222, 729–745, https://doi.org/10.1016/j.gca.2017.11.026, 2018.
Rudra, K.: Changing river courses in the western part of the ganga-Brahmaputra delta, Geomorphology, 227, 87–100, https://doi.org/10.1016/j.geomorph.2014.05.013, 2014.
Sadhuram, Y., Sarma, V. V., Ramana Murthy, T. V., and Prabhakara Rao, B.: Seasonal variability of physicochemical characteristics of the Haldia channel of Hooghly estuary, Indian J. Earth Syst. Sci., 114, 37–49, https://doi.org/10.1007/BF02702007, 2005.
Samanta, S. and Dalai, T. K.: Massive production of heavy metals in the Ganga (Hooghly) River Estuary, India: global importance of solute-particle interaction and enhanced metal fluxes to the oceans, Geochim. Cosmochim. Ac., 228, 243–258, https://doi.org/10.1016/j.gca.2018.03.002, 2018.
Samanta, S., Dalai, T. K., Pattanaik, J. K., Rai, S. K., and Mazumdar, A.: Dissolved inorganic carbon (DIC) and its δ13C in the Ganga (Hooghly) River estuary, India: Evidence of DIC generation via organic carbon degradation and carbonate dissolution, Geochim. Cosmochim. Ac., 165, 226–248, https://doi.org/10.1016/j.gca.2015.05.040, 2015.
Sarkar, S. K., Mondal, P., Ok, Y. S., and Rinklebe, J.: Trace metal in surface sediments of the Hooghly (Ganges) estuary: distribution and contamination risk assessment, Environ. Geochem. Health, 39, 1245–1258, https://doi.org/10.1007/s10653-017-9952-3, 2017.
Sarma, V. V. S. S., Kumar, M. D., and Manerikar, M.: Emission of carbon dioxide from a tropical estuarine system, Goa, Indian Geophys. Res. Lett., 28, 1239–1242, https://doi.org/10.1029/2000GL006114, 2001.
Sarma, V. V. S. S., Viswanadham, R., Rao, G. D., Prasad, V. R., Kumar, B. S. K., Naidu, S. A., Kumar, N. A., Rao, D. B., Sridevi, T., Krishna, M. S., Reddy, N. P. C., Sadhuram, Y., and Murty, T. V. R.: Carbon dioxide emissions from Indian monsoonal Estuaries, Geophys. Res. Lett., 39, L03602, https://doi.org/10.1029/2011GL050709, 2012.
Sarma, V. V. S. S., Krishna, M. S., Prasad, V. R., Kumar, B. S. K., Naidu, S. A., Rao, G. D., Viswanadham, R., Sridevi, T., Kumar, P. P., and Reddy, N. P. C.: Sources and transformation of particulate organic matter in the Indian monsoonal estuaries during discharge period, J. Geophys. Res.-Biogeo., 119, 2095–2111, https://doi.org/10.1029/2011GL050709, 2014.
Seidl, M., Servais, P., and Mouchel, J. M.: Organic matter transport and degradation in the river Seine (France) after a combined sewer overflow, Water Res., 32, 3569–3580, https://doi.org/10.1016/S0043-1354(98)00169-9, 1998.
Servais, P., Billen, G., and Hascoet, M. C.: Determination of the biodegradable fraction of dissolved organic matter in waters, Water Res., 21445–21450, https://doi.org/10.1016/0043-1354(87)90192-8, 1987.
Singh, G., Ramanathan, A. L., Santra, S. C., and Rajan, R. K.: Tidal control on the nutrient variability in Sundarban mangrove ecosystem, J. Appl. Geochem., 18, 495–503, 2016.
Sippo, J. Z., Maher, D. T., Tait, D. R., Holloway, C., and Santos, I. R.: Are mangroves drivers or buffers of coastal acidification? Insights from alkalinity and dissolved inorganic carbon export estimates across a latitudinal transect, Global Biogeochem. Cy., 30, 753–766. https://doi.org/10.1002/2015GB005324, 2016.
Somayajulu B. L. K., Rengarajan R., and Jani R. A.: Geochemical cycling in the Hooghly estuary, Indian Mar. Chem., 79, 171–183, https://doi.org/10.1016/S0304-4203(02)00062-2, 2002.
Smith, B. N. and Epstein, S.: Two categories of 13C∕12C ratios for higher plants, Plant Physiol., 47, 380–384, https://doi.org/10.1104/pp.47.3.380, 1971.
Tait, D. R., Maher, D. T., Macklin, P. A., and Santos, I. R.: Mangrove pore water exchange across a latitudinal gradient, Geophys. Res. Lett., 43, 3334–3341, https://doi.org/10.1002/2016GL068289, 2016.
Wanninkhof, R.: Relationship between wind speed and gas exchange over the ocean, J. Geophys. Res., 97, 7373–7382, https://doi.org/10.1029/92JC00188, 1992.
Weiss, R. F.: The solubility of nitrogen, oxygen and argon in water and seawater, Deep-Sea Res. Oceanogr. Abstracts, 17, 721–735, https://doi.org/10.1016/0011-7471(70)90037-9, 1970.
Zhai, W. D., Dai, M. H., Cai, W. J., Wang, Y. C., and Wang, Z. H.: High partial pressure of CO2 and its maintaining mechanism in a subtropical estuary: The Pearl River estuary, China, Mar. Chem., 93, 21–32, https://doi.org/10.1016/j.marchem.2004.07.003, 2005.
Zhai, W., Dai, M., and Guo, X.: Carbonate system and CO2 degassing fluxes in the inner estuary of Changjiang (Yangtze) River, China, Mar. Chem., 107, 342–356, https://doi.org/10.1016/j.marchem.2007.02.011, 2007.