the Creative Commons Attribution 4.0 License.
the Creative Commons Attribution 4.0 License.
 | 01 Aug 2019
Assessing shaded-leaf effects on photochemical reflectance index (PRI) for water stress detection in winter wheat
Xin Yang
Shishi Liu
Yinuo Liu
Xifeng Ren
Hang Su
The photochemical reflectance index (PRI) has emerged to be a pre-visual indicator of water stress. However, whether the varying shaded-leaf fractions, which may be caused by multiple view angles or the changing crop density in the field, affect the performance of PRI in detecting water stress of crops is still uncertain. This study evaluated the impact of the varying shaded-leaf fractions on estimating relative water content (RWC) across growth stages of winter wheat using seven formulations of PRI. Results demonstrated that for the control treatment the mean PRI of sunlit leaves was slightly higher than those of shaded leaves, but the difference between PRI of sunlit and shaded leaves increased as water resources became more limiting. Despite the difference between PRI of sunlit and shaded leaves, the significance of the linear relationship between RWC and most studied formulations of PRI did not show obvious variations with shadow fractions, except for the 100 % shaded-leaf condition. Among the studied formulations of PRI, PRI3 based on reflectance at 512 nm as the reference band provided the most accurate estimates of RWC with varying shaded-leaf fractions, except for the 100 % shaded-leaf condition. The slope and the intercept of linear regression models with PRI3 also showed minimized variations with shaded-leaf fractions. We then applied a uniform RWC prediction model to the data of varying shaded-leaf fractions and found that the accuracy of RWC predictions was not significantly affected in the mixture of sunlit and shaded leaves. However, RWC estimated with PRI of the 100 % shaded-leaf condition had the highest root mean square error (RMSE), implying that PRI of the pure shaded leaves may yield inaccurate estimates of plant water status.
- Article
(1962 KB) - Full-text XML
- BibTeX
- EndNote


Agriculture consumes about 80 %–90 % of freshwater worldwide (Gonzalez-Dugo et al., 2010). Water stress is one of the most critical abiotic stressors limiting plant growth and crop production (Chaves et al., 2003). Climate change, increasing worldwide shortages of water, and frequent droughts are exacerbating the agricultural water crisis and putting global food security at risk (Hirich et al., 2016; Lei et al., 2016). The assessment of water status in crops is critical for precision irrigation practices, balancing crop production with water supply and sustainable farming.
Remote sensing provides a unique tool to unobtrusively, efficiently, and quantitatively assess water status in crops. Water stress induces plants' stomatal closure, leading to the increasing leaf temperature due to the decreasing evaporative cooling. Remotely monitoring the change in canopy temperature provides information on instantaneous transpiration status, and hence thermal remote sensing has served as an effective tool in detecting water stress for decades (Idso et al., 1981; Sayago et al., 2017). However, thermal remote sensing of water stress has limitations in both physiological and operational aspects. The physiological relationship between canopy temperature and stress is not clear for some crops (Villalobos et al., 2009). Due to the technical reasons, the spatial resolution of thermal imaging sensors is generally coarser than the visible and infrared sensors, limiting its applications at local scales.
In a recent decade, the photochemical reflectance index (PRI) has emerged to be a pre-visual indicator of water stress. PRI is a normalized difference of reflectance at 531 nm and reflectance at a reference band (e.g., 570 nm) in the visible domain. It was initially proposed as an indicator of the de-epoxidation state of xanthophyll pigments, which is related to photosynthesis (Gamon et al., 1992). When the light absorbed by the plants exceeds the photosynthetic demand, de-epoxidation of xanthophyll cycle pigments occurs, leading to the downregulation of photosynthesis (Gamon et al., 1992). Multiple abiotic stressors, including nutrient deficiency (Shrestha et al., 2012; Magney et al., 2016), excessive heat (Dobrowski et al., 2005), and water deficit (Muller, 2001; Sun et al., 2008; Sarlikioti et al., 2010; Zarco-Tejada et al., 2013; Magney et al., 2016), have been shown to trigger the xanthophyll cycle, resulting in the apparent drop in reflectance at 531 nm.
As a promising alternative to thermal remote sensing for monitoring plant water stress, several previous studies have investigated the feasibility of assessing plant water status at leaf level and canopy level using PRI. At leaf level, a number of studies demonstrate a close relationship between PRI and physiological indicators of water stress (Thenot et al., 2002; Shahenshah et al., 2010), but some other studies report a poorer relationship due to the confounding environmental factors (Sarlikioti et al., 2010) or the changes in pigment pools (Sun et al., 2008). At canopy level, studies show stronger correlations between changes in physiological indicators of water stress and PRI, in comparisons with the other indices (e.g., normalized difference vegetation index, NDVI) (Suárez et al., 2008; Rossini et al., 2013; Zarco-Tejada et al., 2013). However, the performance of canopy PRI in the water stress detection is affected by canopy structure, canopy cover, and viewing geometry (Rossini et al., 2013; Panigada et al., 2014). Particularly, at seasonal and interannual timescales, physiological changes, such as relative water content and pigment pools, concurrently occur with structural changes, such as leaf area index (LAI). Canopy PRI is sensitive to the structural changes during the growth season (Gitelson et al., 2017). To minimize the impact of canopy structures on PRI, transformations of PRI are developed using the band insensitive to the canopy structure (Hernández-Clemente et al., 2011), the structural vegetation indices for the normalization (Zarco-Tejada et al., 2013; Gitelson et al., 2017), or the radiative transfer modeling results (Hernández-Clemente et al., 2011).
PRI is primarily driven by the xanthophyll cycle at a short timescale (e.g., a few hours, 2–3 d), but shaded leaves may not experience de-epoxidation of the xanthophyll cycle as the sunlit leaves do. As PRI is expected to be applied to monitoring water stress at a large scale, canopy PRI derived from satellite data includes contributions from both the sunlit leaves and shaded leaves. Hall et al. (2008) and Hilker et al. (2010) found that canopy PRI was strongly dependent on canopy shadow fractions, because the xanthophyll cycle status was affected by incident PAR, which was in turn affected by the level of self-shading within a canopy. Cheng et al. (2009) examined the contributions of variable sunlit ∕ shaded canopy ratios to the simulation of canopy PRI with the two-layer Markov chain analytical canopy reflectance model, confirming the importance of adding shaded leaves to the simulation. Takala and Mõttus (2016) demonstrated that the illumination-induced shadowing effects explained the observed dynamic range of apparent canopy PRI derived from the high-spatial-resolution airborne imaging spectroscopy data. Zhou et al. (2017) examined PRI of rice leaves and panicles in sunlit and shaded portions of canopies, and they found that the correlations between canopy chlorophyll content and PRI of shaded leaves were much higher than those of sunlit leaves.
Previous studies have shown that within-canopy shadowing effects directly affect PRI of a canopy, but whether the proportion of shaded leaves further influences the performance of detecting water stress in the growth season of a crop using PRI is still uncertain. The objective of this study is to analyze the impact of varying shaded-leaf fractions on the performance of canopy PRI in detecting water stress during the growth season of winter wheat using a hyperspectral imager. To accomplish this objective, we conducted water stress experiments on winter wheat for 2 consecutive years. Reflectance of shaded and sunlit leaves derived from hyperspectral imagery was mixed with varying fractions to quantify the impacts of shaded leaves on different formulations of PRI in detecting water stress during the growth season.
2.1 Study site and experimental design
During the growth seasons of 2016 and 2017, two water stress experiments were conducted in the facilities at Huazhong Agricultural University, China (30∘28′ N, 114∘22′ E). The mean annual temperature is approximately 17.0 ∘C, and the mean annual total precipitation is around 1256 mm. The seeds of cultivar “Zheng 9023”, which is widely planted in central China, were used in the experiment. Seeds were sown on 2 November 2015 and 26 November 2016, respectively, in a rectangular plastic pot (L 70 cm ×W 40 cm ×H 35 cm) with the density of approximately 250–300 seeds per pot. The soil was silt loam, with a volumetric water content of 26 % at the field capacity. Sufficient nitrogen–phosphorus–potassium (NPK) () fertilizers were applied in the soil before sowing. The experiments consisted of 28 pots in 2015–2016 and 15 pots in 2016–2017. Pest and disease control were conducted in the same time during the growth period, in order to avoid additional stress other than different levels of water stress.
Seedlings were grown outdoor under the natural condition before the water stress experiments started. Soil water content was measured every 4–5 d using time domain reflectometry (TDR300, Spectrum Technology Inc., USA), and tap water was supplied if soil water content was 70 % off field capacity. Water stress treatments started at the end of February, which was during the tiller initiation stage. Pots were moved to a rain-out shelter to prevent external water supply. In 2015–2016, 28 pots were divided into five groups. A group of four pots was used as the control, which had sufficient water supplies throughout the experiment. The other four groups (with six pots for each group) stopped watering on 24 February, 6, 28 March, and 8 April, respectively. In 2016–2017, 15 pots were divided into five groups. A group of three pots was used as the control, which had sufficient water supplies throughout the experiment. The other four groups (with three pots for each group) stopped irrigation on 15, 22, 29 March, and 12 April, respectively. After irrigation stopped, soils of the treated pots were left to dry as analogs for the natural drought condition. In 2016, measurements were taken every 2–5 d depending on the weather conditions until immature senescence occurred. For the water treatment group, three pots of winter wheat were used for capturing hyperspectral images, and the other three pots were used to collect samples. In 2017, measurements were taken every 4–6 d until immature senescence occurred. For the water treatment groups, one pot of winter wheat was used for capturing hyperspectral images, and the other two pots were used to collect samples. In both years, physiological and spectral measurements were taken in control groups during the whole experiment.
2.2 Physiological measurements
In this study, we used relative water content (RWC) as the indicator of water stress, because RWC was recommended by previous studies as an effective physiological indicator of water status (Hewitt et al., 1985; Siddique et al., 2000). We randomly chose three plants in the sampled pot, and top three leaves of the sampled plants were cut from the stem. Leaves were cut into 10 small round pieces with a puncher and put into a zip-lock bag. Leaf samples were enclosed in a cooler and brought to the laboratory to measure RWC. In the laboratory, fresh weight was measured with an electronic balance. The leaf samples were immersed in distilled water for 16–18 h. We dried the surface moisture and weighed the turgid weight. Afterward, all samples were put into aluminum boxes to dry in the oven at 105 ∘C for 15–20 min and then dried at 80 ∘C for about 10 h when a constant dry weight was reached. The RWC of leaf samples was calculated as
where WF is the fresh weight, WT is the turgid weight, and WD is the dry weight.
2.3 Spectral data
2.3.1 Hyperspectral image acquisition
Hyperspectral images were recorded in situ using the SOC710VP portable hyperspectral imager (Surface Optics Corporation, SOC, USA). The imager has 640×640 px and 128 bands in the range of 379–1039 nm, with a spectral resolution of 4.6875 nm and a 25∘ field of view. The transparent shed was open half an hour before measuring began. The imager was set up with a nadir view angle and approximately 1.5 m above the canopy, resulting in the spatial resolution of approximately 1 mm. Hyperspectral images were recorded under sunny and cloudless conditions around midday (12:00–14:00 LT). According to Magney et al. (2016)'s study on white spring wheat, PRI showed pronounced diurnal variations, but PRI measured during peak irradiance, which was approximately between 12:00 and 14:00 LT, showed minimal variations. A reference spectral panel was placed on the pot for each measurement. Spectra of the panel were used to correct radiation variations due to differences in solar illumination. The spectral data were acquired by LuCam Software camera drivers and the HyperScanner software platform. After image acquisition, radiometric calibration was performed using the SOC's Spectral Radiance Analysis Toolkit (SRAnal), converting the raw digital number (DN) values of the hyperspectral image to reflectance.
2.3.2 Spectral reflectance extraction and preprocessing
We manually selected regions of interest (ROIs) of the most deeply shaded leaves and the brightest sunlit leaves in each image using ENVI 5.1 (the Environment for Visualizing Images) (Fig. 1). Reflectance within ROIs were averaged and used as reflectance of sunlit and shaded leaves, respectively. Based on the assumption of the linear mixture of shadow and sunlit leaves, we mixed different fractions of shaded-leaf reflectance with sunlit-leaf reflectance to evaluate the impact of shaded leaves on detecting water stress with PRI.
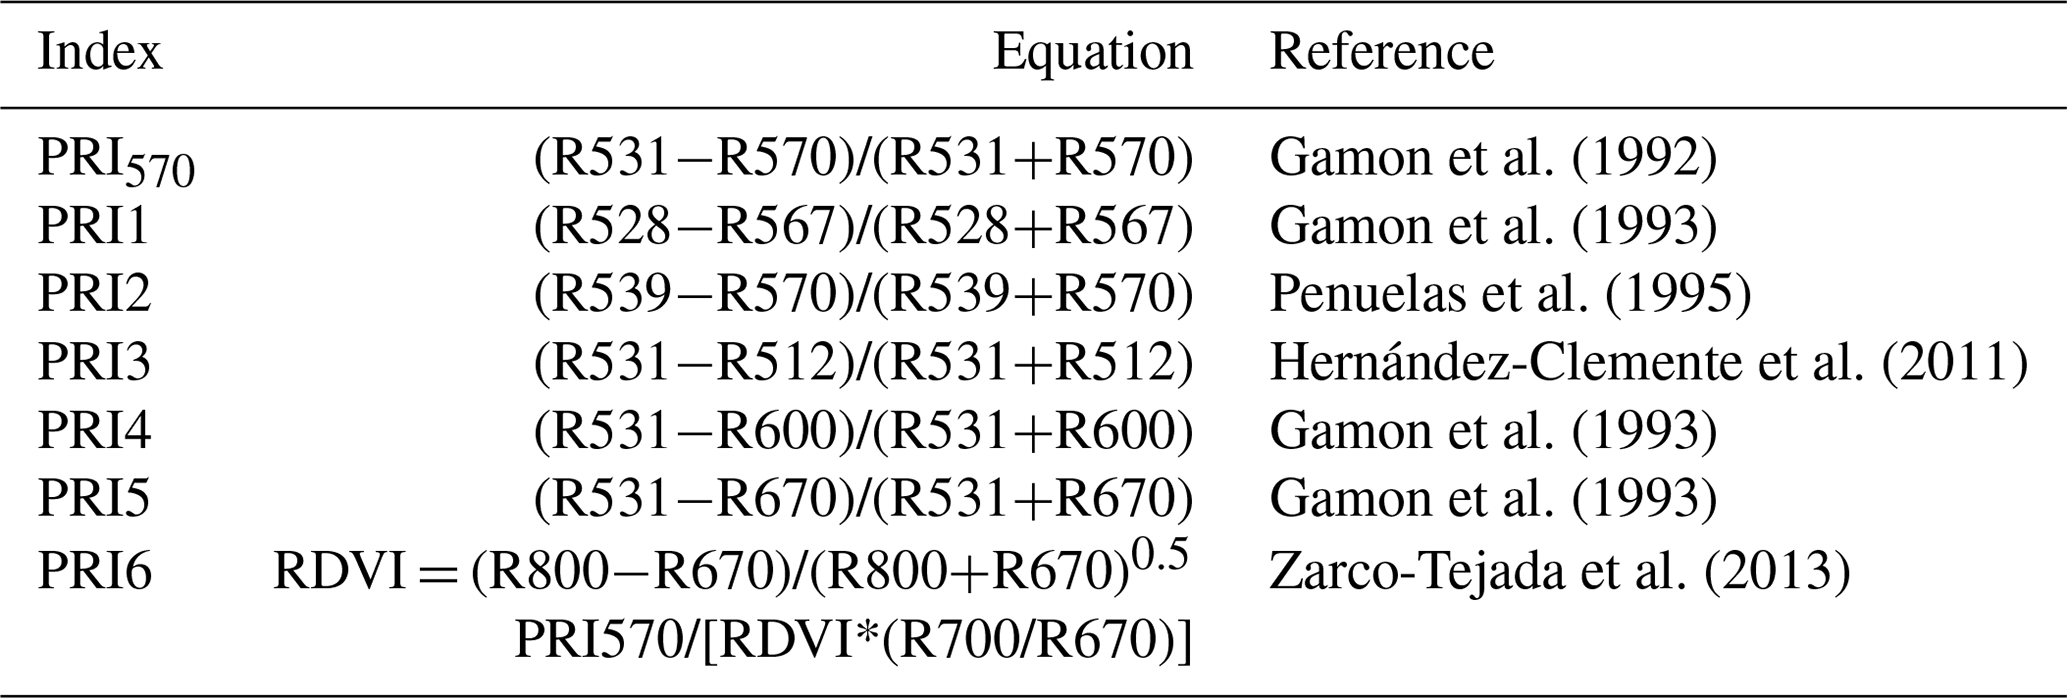
The derived spectral data were interpolated to 1 nm band width using the cubic spline interpolation function in MATLAB (R2011a) software. Overall, seven formulations of PRI were calculated for both sunlit leaves and shaded leaves (Table 1). In addition, we calculated the difference (ΔPRI) between PRI of sunlit leaves (PRI_sunlit) and PRI of shaded leaves (PRI_shaded):
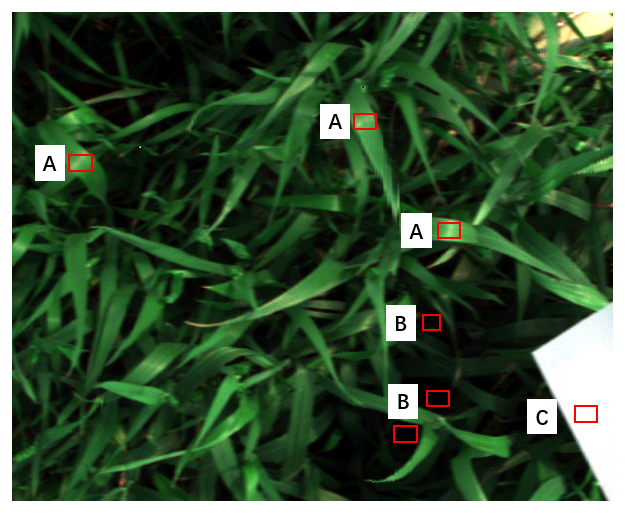
Figure 1The original hyperspectral image shown as an RGB image. Region of interest (ROI) A is the sunlit leaves, ROI B is the shaded leaves, and ROI C is the reference spectral panel.
Table 1Seven PRI formulations used in this study. R is the reflectance at the specified wavelength in nanometers. RDVI is the renormalized difference vegetation index.
2.4 Statistical analysis
Measurements taken from pots that had the same water treatments were averaged and used in the analysis. The maximum, minimum, coefficient of variation (CV), and standard deviation were used to describe the range and the variation of observations. To analyze the variations of PRI in sunlit and shaded leaves during the water stress treatment, we divided all the data into seven groups according to RWC values (RWC ranges of 0.2–0.3, 0.3–0.4, 0.4–0.5, 0.5–0.6, 0.6–0.7, 0.7–0.8, and > 0.8). The mean and the standard deviation were calculated to evaluate the variations of PRI against RWC. The least-square linear regression model was established to estimate RWC with PRI of sunlit leaves and shaded leaves. The quadratic function was used to describe the relationships between shaded-leaf fractions and the slope/intercept of the linear regression model between PRI and RWC. R2 was used to evaluate the significance of the regression model, and the root mean square error (RMSE) was used to measure the actual average differences between measurements and predictions. Statistical analyses were performed in MATLAB (R2011a) software.
3.1 PRI of sunlit leaves and shaded leaves
The spectra of sunlit leaves and shaded leaves are presented in Fig. 2. The reflectance of the shaded leaves was lower than that of the sunlit leaves. Unlike the spectra of sunlit leaves, the green peak of shaded leaves was not obvious.
We calculated the difference (ΔPRI) between PRI of sunlit leaves and shaded leaves for the control treatment and water stress treatment separately (Table 2). For both the control treatment and water stress treatment, the positive mean value of ΔPRI indicated that PRI of sunlit leaves was higher than those of shaded leaves, but the mean ΔPRI was much larger for the water stress treatment. Take PRI570 as an example: PRI570 of sunlit leaves and shaded leaves declined as water resources became limiting after irrigation stopped (Fig. 3). ΔPRI570 became pronounced at RWC smaller than 0.5, and ΔPRI570 was minimized at RWC higher than 0.8.
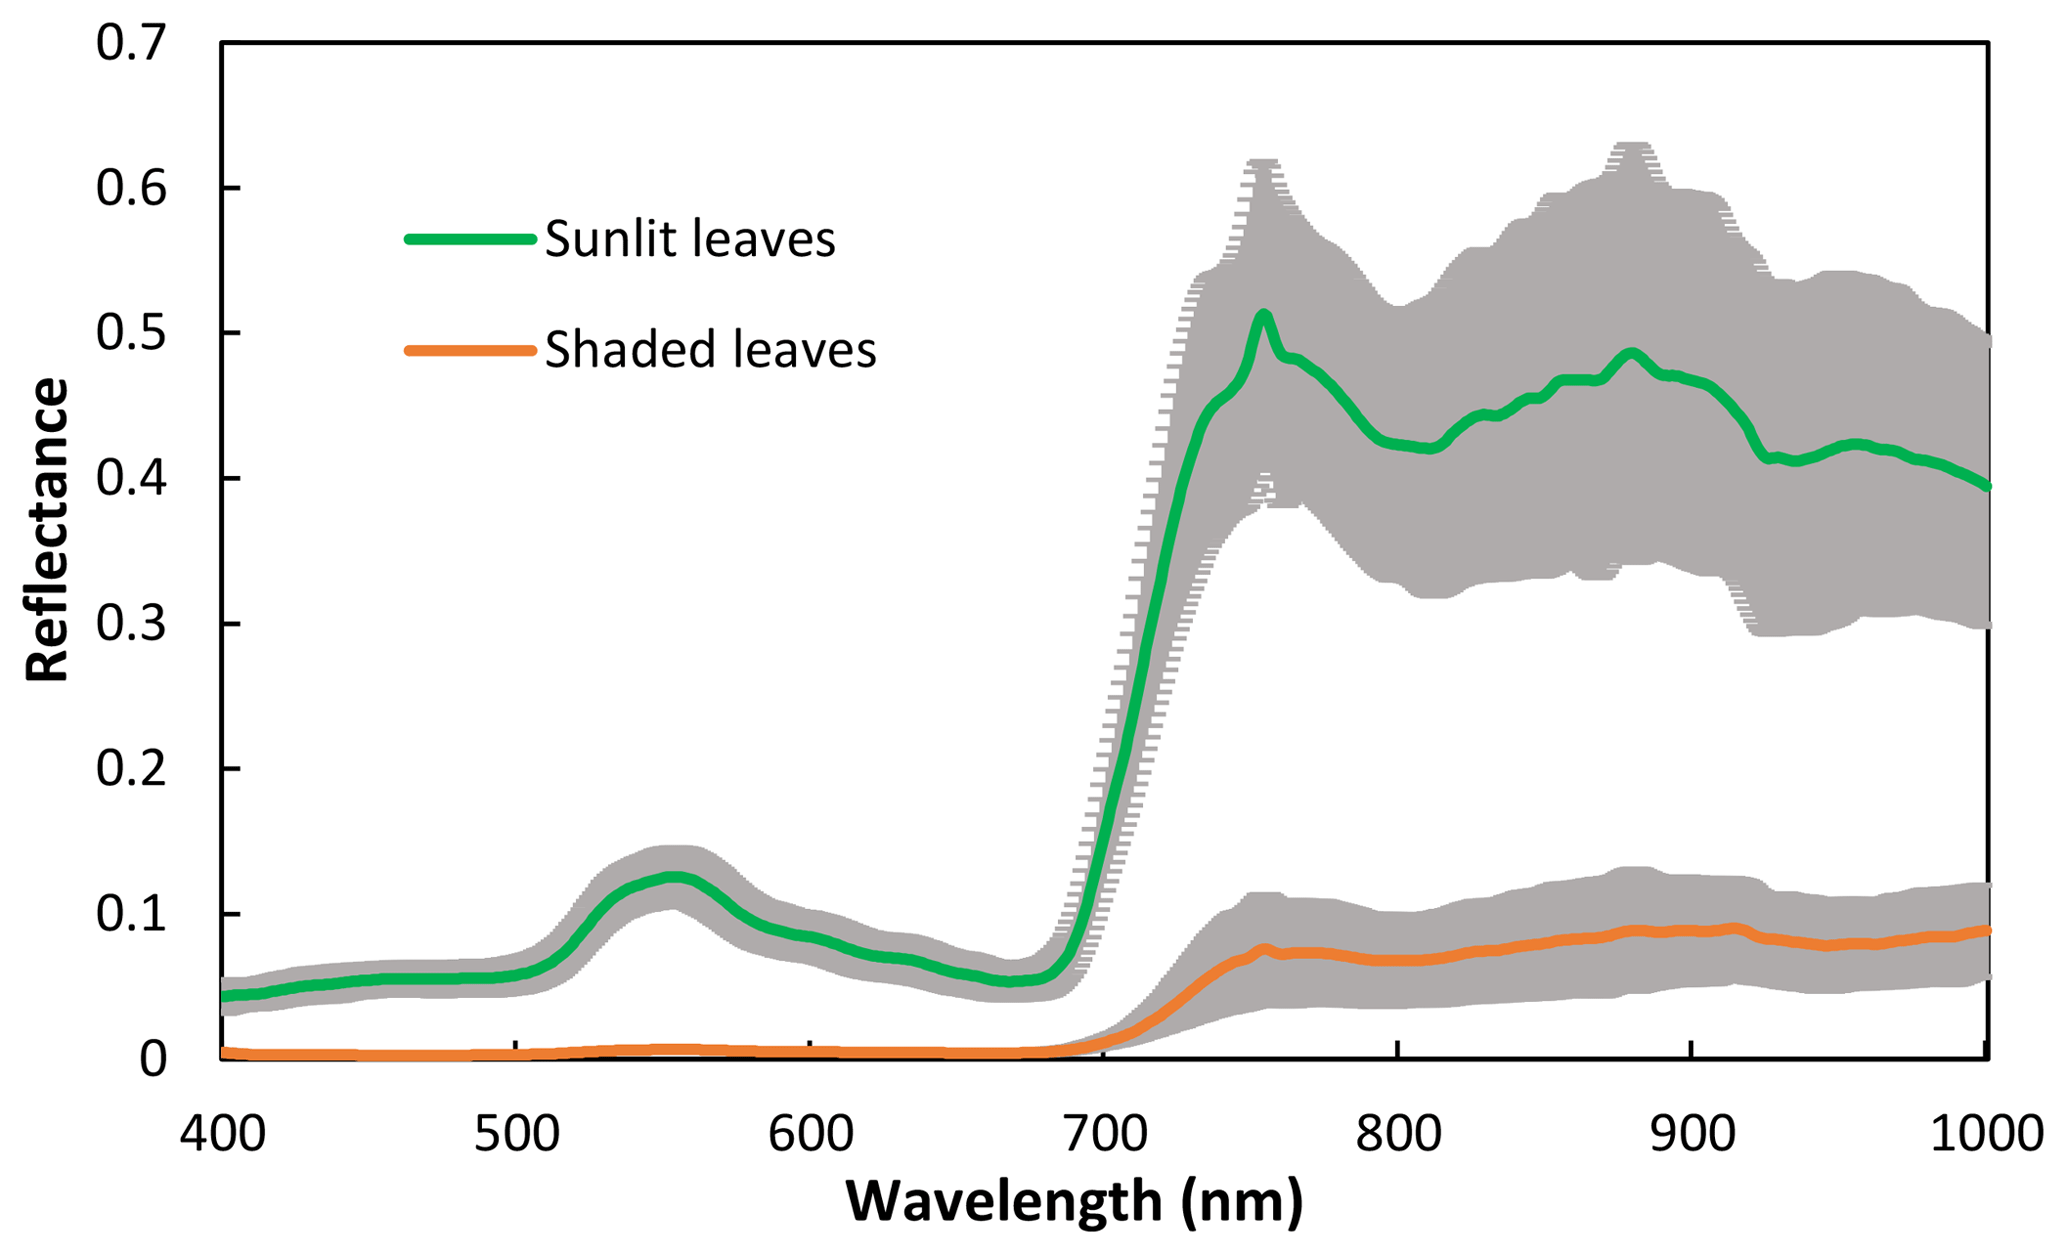
Figure 2Spectra of sunlit and shaded leaves. The solid lines are the mean reflectance of the samples and the shadings are the standard deviation.
Table 2The maximum, minimum, mean, CV and range of the difference (ΔPRI) between PRI of sunlit leaves and PRI of shaded leaves for the control treatment (a) and the water stress treatment (b).
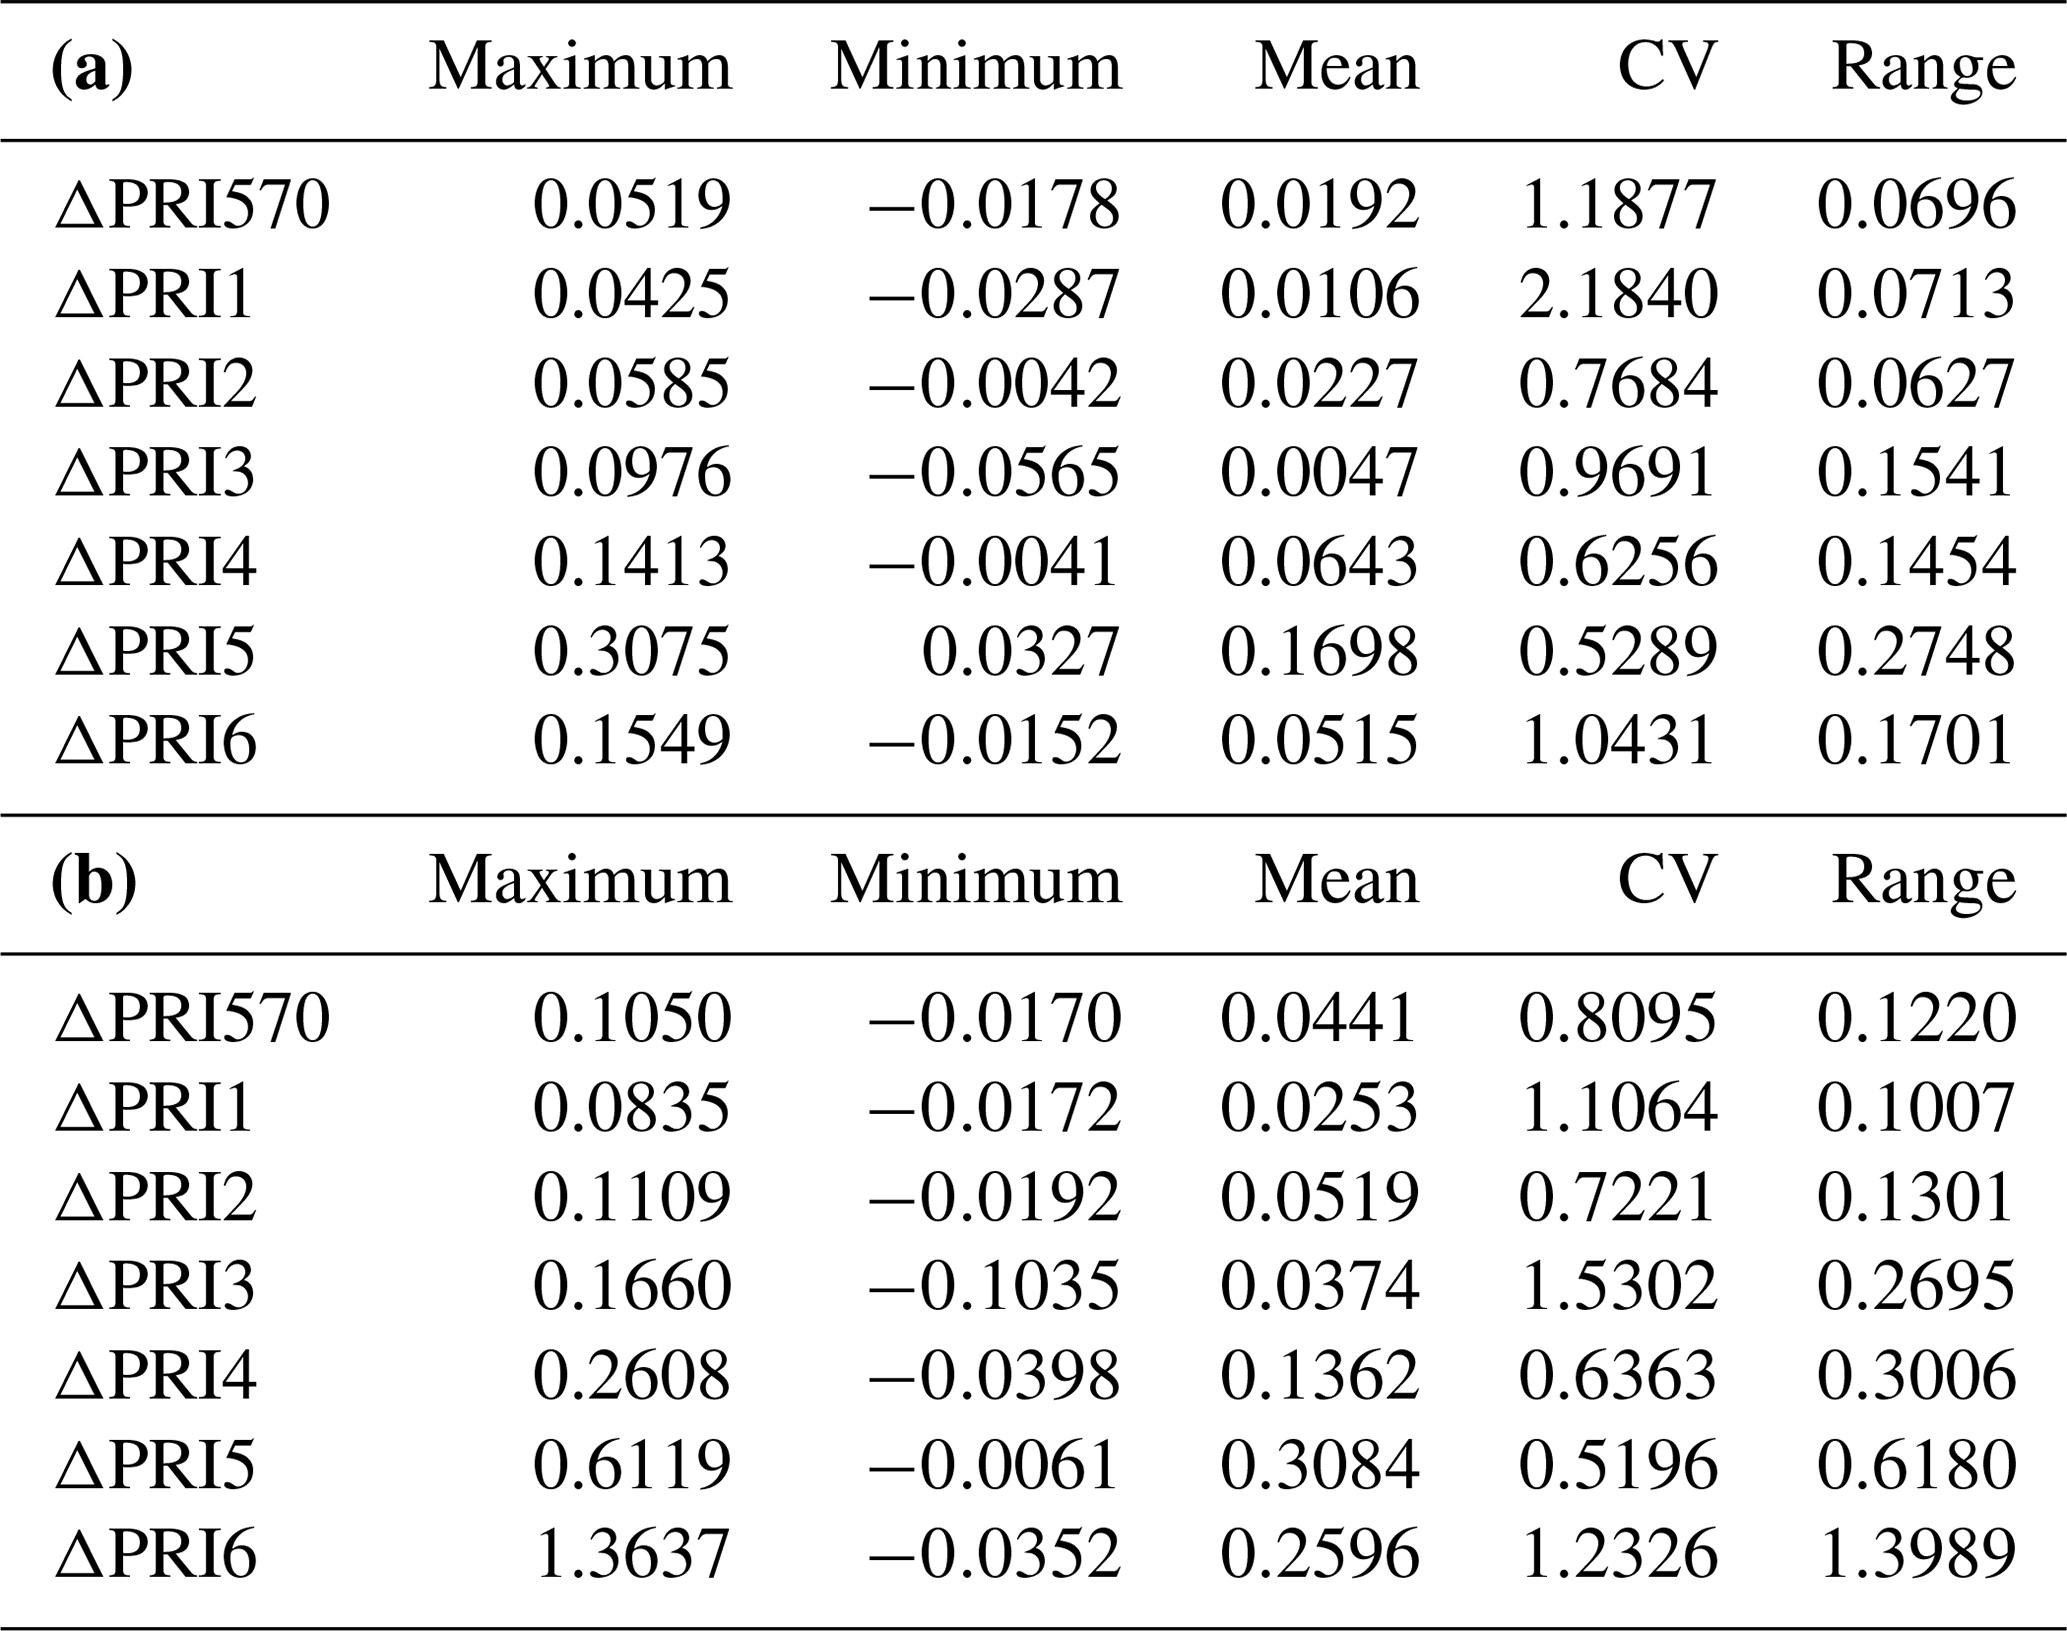
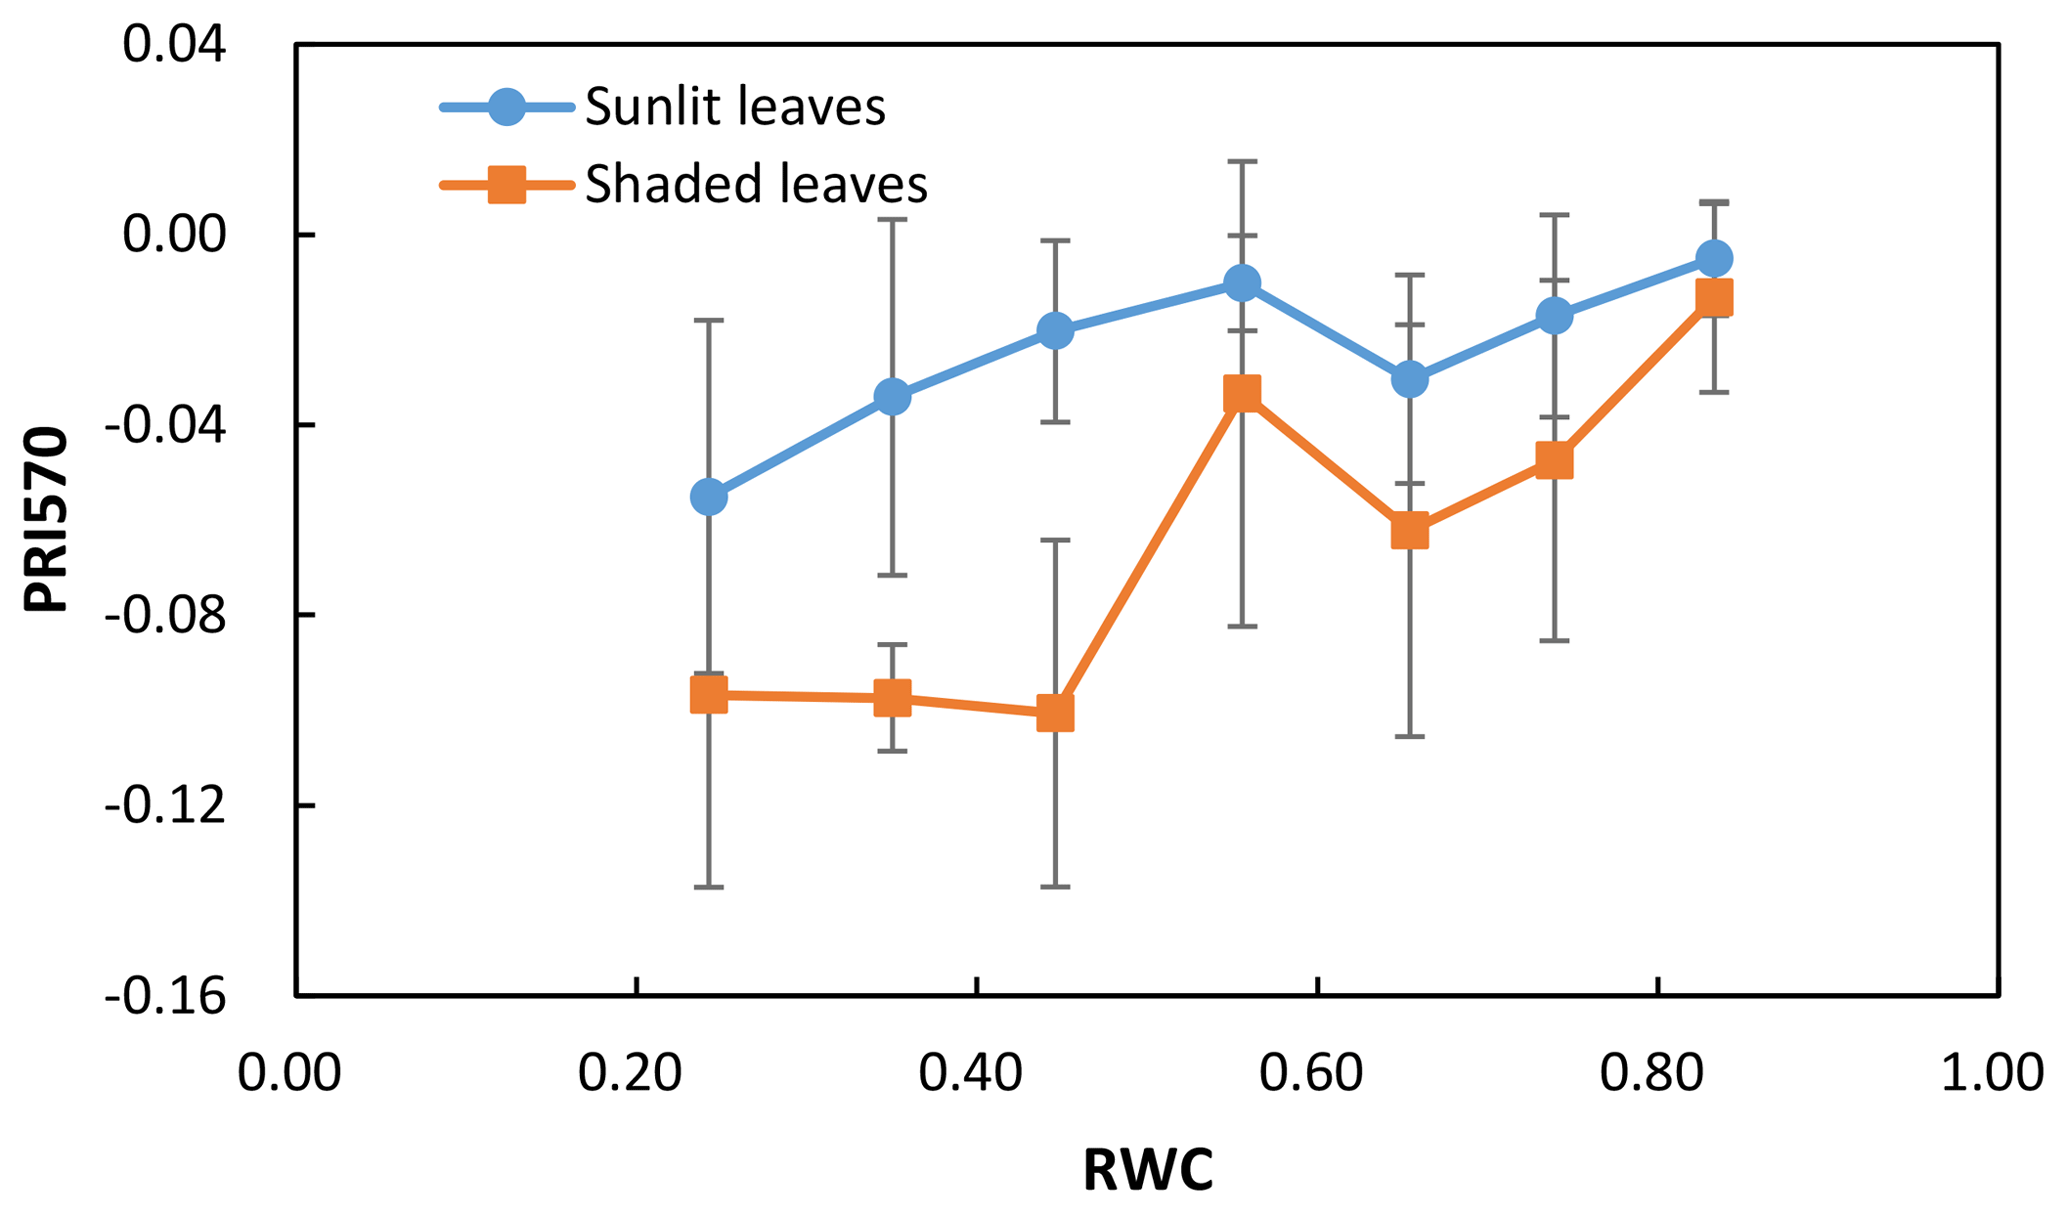
Figure 3The mean and the standard deviation of PRI570 in sunlit leaves and shaded leaves against RWC. Data were divided into seven groups according to RWC values (RWC ranges of 0.2–0.3, 0.3–0.4, 0.4–0.5, 0.5–0.6, 0.6–0.7, 0.7–0.8, and > 0.8).
3.2 The impact of shaded leaves on water stress detection
To assess the impact of shaded leaves on detecting water stress with PRI, we mixed different fractions of shaded-leaf reflectance with sunlit-leaf reflectance and analyzed the relationship between RWC and PRI calculated from the mixed reflectance of shaded and sunlit leaves. Different formulations of PRI were all positively correlated with RWC (Table 3). Among the studied formulations, PRI2, PRI3, PRI4, and PRI6 showed significant correlations with RWC in winter wheat with the varying shaded-leaf fractions, except for the 100 % shaded-leaf condition. R2 of the linear regression models between RWC and PRI2, PRI3, PRI4, and PRI6 did not show pronounced differences with varying shaded-leaf fractions. For PRI570, PRI1, and PRI5, R2 increased slightly with the increasing shaded-leaf fraction. Figure 4 illustrated examples of the significant relationships between RWC and PRI of sunlit leaves and shaded leaves, respectively.
We further analyzed the impact of shaded-leaf fractions on the slope and intercept of the linear regression model between PRI and RWC. The slope and intercept of the linear regression models between different formulations of PRI and RWC were strongly correlated with fractions of shaded leaves (Table 4). The quadratic function was applied to describe the non-linear relationship between shaded-leaf fractions and the slope/intercept. Examples of non-linear relationships for PRI570 and PRI3 are shown in Fig. 5. For all the studied formulations of PRI, the intercept remained relatively stable under different shaded-leaf fractions, except for the 100 % shaded-leaf fraction. The slope increased non-linearly with shaded-leaf fractions for most of the studied PRI, but PRI3 did not show obvious variations in the slope under the shaded-leaf fractions below 70 % (Fig. 5d).
To evaluate if these changes in the values of linear regression parameters affected the accuracy of RWC estimates, we applied the linear regression model derived from the PRI of the generally applicable sunlit ∕ shaded leaves ratio of 50∕50 to detect water stress using PRI of the varying sunlit leaves ∕ shadow ratio. We also evaluated the accuracy of RWC estimated with the linear regression models geared towards the known shaded-leaf fractions. Given the known shaded-leaf fractions, the slope and intercept of the linear regression models were estimated with the quadratic functions shown in Fig. 5. Results showed that RMSE of RWC estimates did not vary significantly with shaded-leaf fractions, except for PRI1 (Fig. 6). RMSE in RWC estimated with PRI1 was decreased with the increased shaded-leaf fractions, probably because the reference band (567 nm) in PRI1 was more sensitive to the change in the chlorophyll content of shaded leaves. However, for all the studied formulations of PRI, RWC estimated with PRI of 100 % shaded leaves had the highest RMSE, implying that PRI of the pure shaded leaves may yield inaccurate estimates of plant water status.

Figure 4Examples of the linear relationship between PRI of sunlit leaves (PRI2, a), PRI3, b) and RWC, and the linear relationship between PRI of shaded leaves (PRI2, c, PRI3, d) and RWC.
Table 3R2 of the linear relationship between RWC and different formulations of PRI calculated by reflectance of varying the ratio of sunlit leaves to shaded leaves in winter wheat during the study period.
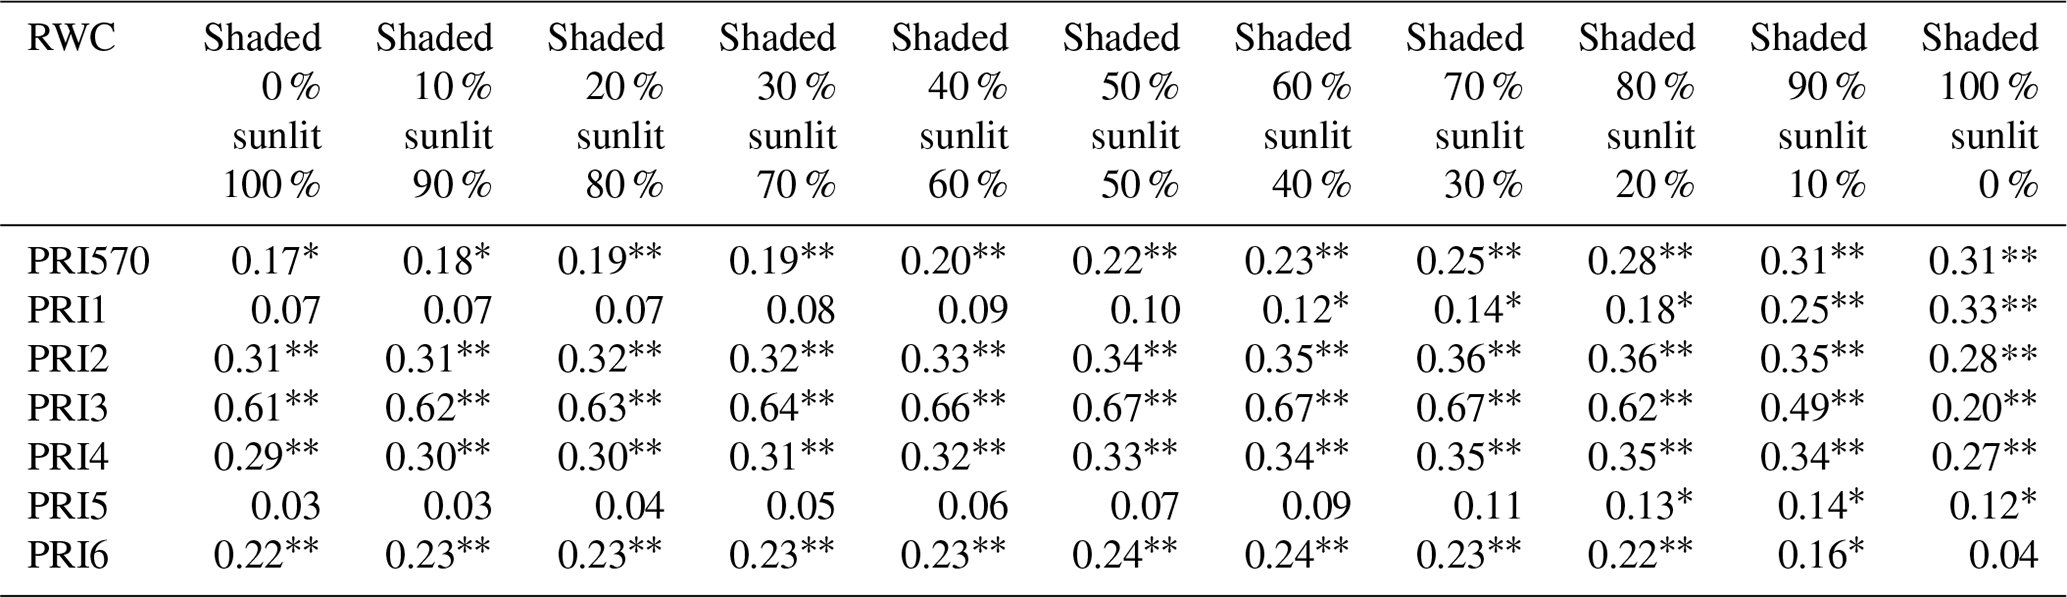
Correlation coefficient significant at p < 0.01. * Correlation coefficient significant at p < 0.05.
Table 4R2 of the quadratic function between shaded-leaf fractions and the slope and intercept of the linear regression models that are used to estimate RWC with different formulations of PRI.

Correlation coefficient significant at p < 0.01. * Correlation coefficient significant at p < 0.05.
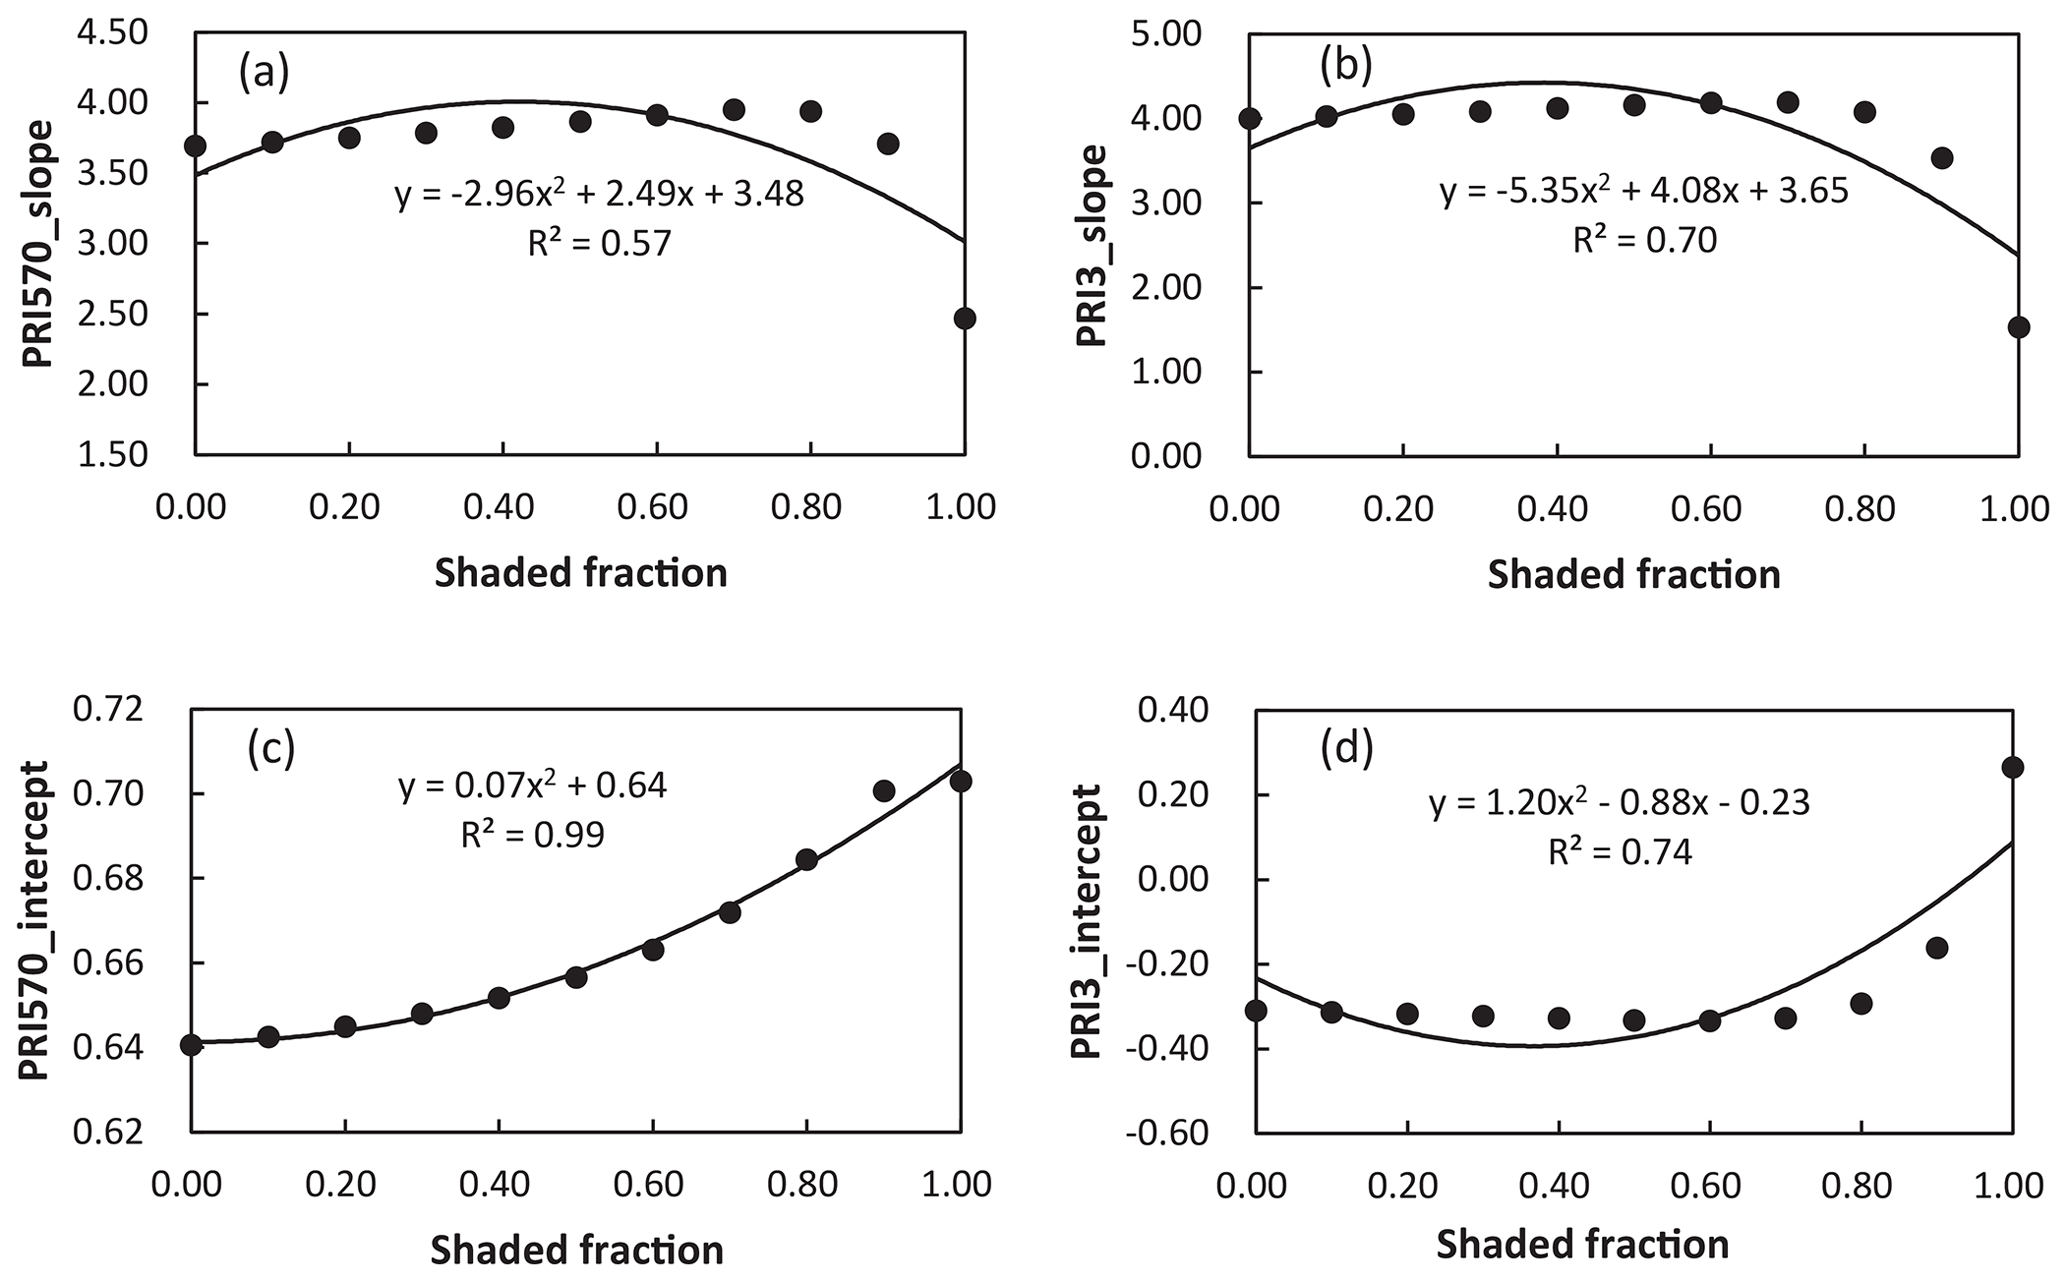
Figure 5Relationships between shaded-leaf fractions and the slope of the linear regression models of RWC and PRI570 (a) and PRI3 (b); and relationships between shaded-leaf fractions and the intercept of the linear regression models of RWC and PRI570 (c) and PRI3 (d).
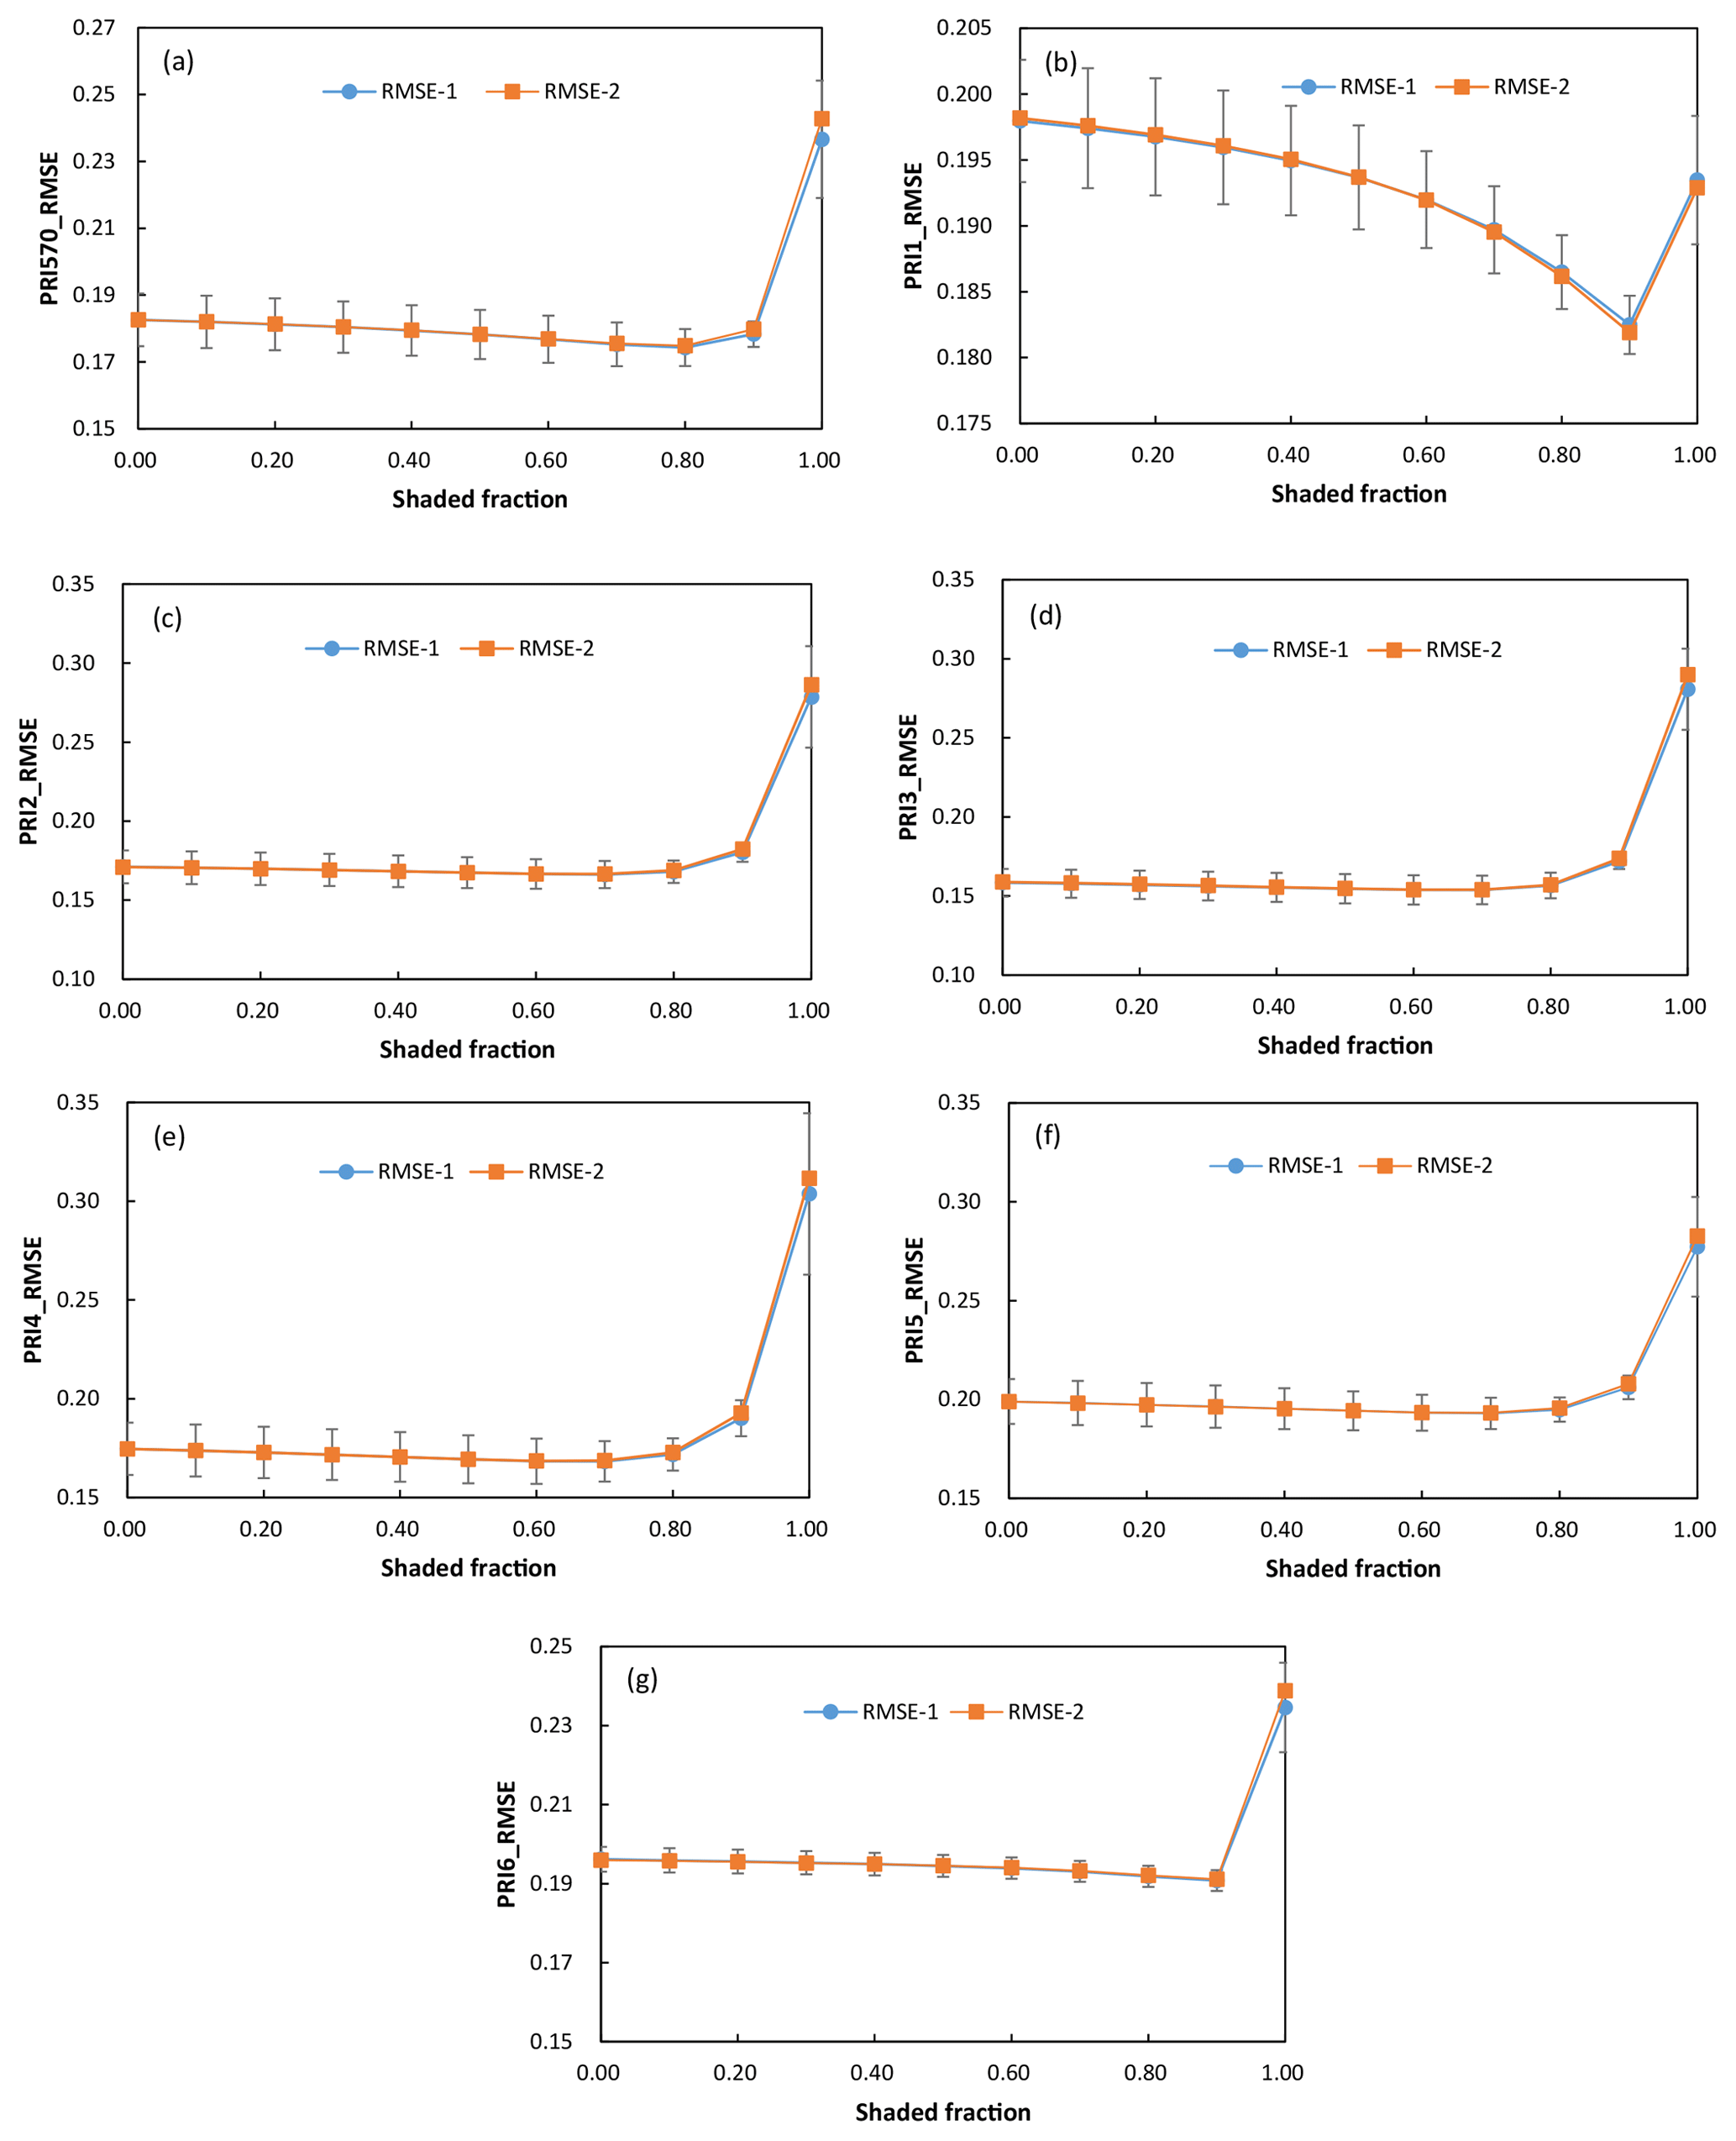
Figure 6RMSE of RWC estimated with PRI570 (a), PRI1 (b), PRI2 (c), PRI3 (d), PRI4 (e), PRI5 (f), and PRI6 (g) under different shaded-leaf fractions. RMSE-1 means RMSE of RWC estimated with the linear regression model derived from the PRI of the sunlit ∕ shaded leaves ratio of 50∕50; RMSE-2 means RMSE of RWC estimated with the linear regression models geared towards the known shaded-leaf fractions. Given the known shaded-leaf fractions, the slope and intercept of the linear regression models were estimated with the quadratic functions.
Theoretically, sunlit leaves are more likely to experience high light-induced environmental stress than shaded leaves (Hilker et al., 2008; Middleton et al., 2009; Cheng et al., 2012). Data from previous field samplings and model simulations, although limited, confirmed the impact of shaded-leaf fractions on PRI values (Middleton et al., 2009; Cheng et al., 2012; Takala and Mõttus, 2016). While interests of detecting plant water stress with PRI are increasing, studies rarely analyzed the impact of shaded leaves on the performance of PRI in water stress detection. This study quantified the differences between PRI of sunlit and shaded leaves in winter wheat under control and water stress conditions, and investigated the impact of varying shaded-leaf fractions on water stress detection during the growth season, using different formulations of PRI derived from hyperspectral images.
Our results showed that for the control treatment the mean PRI of sunlit leaves was slightly higher than that of shaded leaves. Take PRI570, for example. ΔPRI570 ranged from −0.0178 to 0.0519 and roughly agreed with results presented in previous studies. Takala and Mõttus (2016) reported the range of ΔPRI without a shadow correction was −0.01–0.10 at the boreal forest. Middleton et al. (2009) reported ΔPRI of −0.035 at a Douglas fir forest in Canada. Cheng et al. (2012) demonstrated that the average PRI values varied from −0.008 to 0.005 for sunlit leaves and from 0.002 to 0.022 for shaded leaves measured in the corn field. Mõttus et al. (2015) presented the difference between canopy PRI (including PRI of shaded leaves) and PRI of sunlit leaves ranging from −0.025 to 0.073 for pine, spruce, and birch. In summary, both positive values and negative values of ΔPRI570 can be found in previous studies (Hilker et al., 2008; Middleton et al., 2009; Cheng et al., 2012), but the difference between PRI of sunlit leaves and shaded leaves was small for healthy vegetation.
Interestingly, our results showed that ΔPRI was much higher for the water stress treatment than the control treatment. ΔPRI increased as water resources became more limiting, but it then decreased when prolonged drought caused premature senescence. The increased ΔPRI might be due to the more severe chlorophyll degradation on old leaves, induced by a sustained water stress deficit (Bolhar-Nordenkampf et al., 1991; Ciganda et al., 2012; Liu et al., 2015). As several studies proved that PRI was related to the pigment content (Suárez et al., 2009; Gitelson et al., 2017), the early degradation of chlorophyll content in the bottom shaded leaves may influence their photosynthetic potential and thus lead to the non-synchronous change in PRI values between the top sunlit leaves and the bottom shaded leaves. The weaker correlation between PRI of shaded leaves and RWC (Fig. 5) also supported the hypothesis of the non-synchronous change in PRI values between the sunlit and shaded leaves. Both the sunlit and shaded leaves eventually wilted after the prolonged water stress, resulting in the decreased range in ΔPRI at the end of the water stress treatment.
Although the PRI of shaded leaves was different from PRI of sunlit leaves under both control and water stress conditions, the effect of the varying fractions of shaded leaves did not lead to the substantial change in the significance of the relationship between PRI and RWC. We hypothesized it was because the shallow soil in the pot experiment caused the quick wilting during the water stress treatment, and thus the changes in leaf area and pigment content intertwined with physiological responses. Among the studied formulations of PRI proven to minimize the effect of structural change in canopies in previous studies (Hernández-Clemente et al., 2011; Zarco-Tejada et al., 2013), PRI3 that used reflectance at 512 nm as the reference band provided the most accurate estimates of RWC with varying shaded-leaf fractions, except for the 100 % shaded-leaf fraction. PRI3 was originally developed for the needle tree based on the evidence that reflectance at 512 nm was not responsive to the change in xanthophyll epoxidation state (Hernández-Clemente et al., 2011). In their study, PRI3 showed the highest correlation with the stomatal conductance and water potential at the canopy level and the lowest sensitivity to canopy structure, in comparison with PRI570 and NDVI. Our results also showed the superior performance of PRI3 to the other formulations of PRI in estimating RWC, implying that for winter wheat the 512 nm band might be a better reference band that could maximize the physiological responses of the 531 nm band. Unfortunately, we could not provide direct evidence of PRI3's superior sensitivity to the change in xanthophyll epoxidation state due to the lack of measurements of the xanthophyll epoxidation state and leaf area index.
Magney et al. (2016) used the difference between the midday PRI and early morning PRI (PRI0) to disentangle the facultative (diurnally changing) and the constitutive (seasonally changing) components of the PRI signal, based on the assumption that the early morning PRI represented a “steady state” prior to the xanthophyll cycle de-epoxidation. They found the stronger seasonal responses of PRI–PRI0 to vapor pressure deficit, suggesting that PRI–PRI0 was mainly facilitated by short-term changes in the xanthophyll cycle as opposed to longer-term pigment changes. Hwang et al. (2017) found that the ratio (sPRI) of sunlit canopy PRI (backward direction images) to shaded canopy PRI (forward direction images) captured drought signals in a temperate deciduous forest. Inspired by these studies, we tried to use ΔPRI and PRI_sunlit/PRI_shaded to disentangle the facultative and constitutive components. However, the correlation between RWC and ΔPRI or PRI_sunlit/PRI_ shaded was not significant, and thus results were not shown in the paper.
This study evaluated the impact of the varying shaded-leaf fractions on seasonal water stress detection in winter wheat using different formulations of PRI. Results demonstrated that for the control treatment the mean PRI of sunlit leaves was slightly higher than those of shaded leaves, but the difference between PRI of sunlit and shaded leaves increased as water resources became more limiting. Despite the difference between PRI_shadow and PRI_leaf, the significance of the linear relationship between RWC and different formulations of PRI did not show obvious variations with shadow fractions, except for the 100 % shaded-leaf condition. Among the studied formulations of PRI, PRI3 based on reflectance at 512 nm as the reference band provided the most accurate estimates of RWC with varying shaded-leaf fractions, except for the 100 % shaded-leaf condition. Furthermore, we applied the linear regression model derived from the PRI of the generally applicable sunlit ∕ shaded leaves ratio of 50∕50 to detect water stress using PRI of the varying shaded-leaf fractions and found that the accuracy of RWC estimates did not vary significantly with shaded-leaf fractions. However, RWC estimated with PRI of 100 % shaded leaves had the highest RMSE, implying that PRI of the pure shaded leaves may yield inaccurate estimates of plant water status. This study provides useful information on remote detection of water stress for accurate irrigation scheduling and yield forecast. Further research is indeed needed to investigate the shaded-leaf effect on PRI and water stress detection, especially for crops with different canopy geometries from winter wheat.
All data included in this study are available upon request by contact with the corresponding author (carol.shishi@gmail.com).
XY participated in the data collection, conducted data preprocessing and statistical analysis, and wrote methods and results sections. SL designed the experiment with XR, participated in the data collection, and wrote introduction, discussion, and conclusion sections. YL, XR, and HS participated in the data collection and provided valuable suggestions to the manuscript.
The authors declare that they have no conflict of interest.
We greatly appreciate comments and suggestions from the anonymous reviewers.
This research has been supported by the National Natural Science Foundation of China (grant no. 41501367), National Key Research and Development Program of China (grant no. 2017YFD0100802), and the Fundamental Research Funds for the Central Universities (grant no. 2662018YJ018).
This paper was edited by Christopher Still and reviewed by two anonymous referees.
Bolhar-Nordenkampf, H. R., Hofer, M., and Lechner, E. G.: Analysis of Light-Induced Reduction of the Photochemical Capacity in Field-Grown Plants, Evidence for Photoinhibition?, Photosynth. Res., 27, 31–39, https://doi.org/10.1007/BF00029974, 1991.
Chaves, M. M., Maroco, J. P., and Pereira, J. S.: Understanding Plant Responses to Drought – from Genes to the Whole Plant, Funct. Plant Biol., 30, 239–264, https://doi.org/10.1071/FP02076, 2003.
Cheng, Y.-B., Middleton, E. M., Hilker, T., Coops, N. C., Black, T. A., and Krishnan, P.: Dynamics of Spectral Bio-Indicators and Their Correlations with Light Use Efficiency Using Directional Observations at a Douglas-Fir Forest, Meas. Sci. Technol., 20, 095107, https://doi.org/10.1088/0957-0233/20/9/095107, 2009.
Cheng, Y.-B., Middleton, E. M., Zhang, Q., Corp, L. A., Dandois, J., and Kustas, W. P.: The Photochemical Reflectance Index from Directional Cornfield Reflectances: Observations and Simulations, Remote Sens. Environ., 124, 444–453, https://doi.org/10.1016/j.rse.2012.05.030, 2012.
Ciganda, V. S., Gitelson, A. A., and Schepers, J.: How Deep Does a Remote Sensor Sense? Expression of Chlorophyll Content in a Maize Canopy, Remote Sens. Environ., 126, 240–47, https://doi.org/10.1016/j.rse.2012.08.019, 2012.
Dobrowski, S., Pushnik, J., Zarcotejada, P., and Ustin, S: Simple Reflectance Indices Track Heat and Water Stress-Induced Changes in Steady-State Chlorophyll Fluorescence at the Canopy Scale, Remote Sens. Environ., 97, 403–414, https://doi.org/10.1016/j.rse.2005.05.006, 2005.
Gamon, J. A., Peñuelas, J., and Field, C. B.: A Narrow-Waveband Spectral Index That Tracks Diurnal Changes in Photosynthetic Efficiency, Remote Sens. Environ., 41, 35–44, https://doi.org/10.1016/0034-4257(92)90059-S, 1992.
Gamon, J. A., Filella, A., and Penuelas, J.: The Dynamic 531-Nanometer Ä Reflectance Signal: A Survey of Twenty Angiosperm Species, In Photosynthetic Responses to the Environment, American Society of Plant Physiologists, Rockville, MD, USA, 172–177, 1993.
Gitelson, A. A., Gamon, J. A., and Solovchenko, A.: Multiple Drivers of Seasonal Change in PRI: Implications for Photosynthesis 2. Stand Level, Remote Sens. Environ., 190, 198–206, https://doi.org/10.1016/j.rse.2016.12.015, 2017.
Gonzalez-Dugo, V., Durand, J.-L., and Gastal, F.: Water Deficit and Nitrogen Nutrition of Crops, A Review, Agron. Sustain. Dev., 30, 529–544, https://doi.org/10.1051/agro/2009059, 2010.
Hall, F. G., Hilker, T., Coops, N. C., Lyapustin, A., Huemmrich, K. F., Middleton, E., Margolis, H., Drolet, G., and Black, T. A.: Multi-Angle Remote Sensing of Forest Light Use Efficiency by Observing PRI Variation with Canopy Shadow Fraction, Remote Sens. Environ., 112, 3201–3211, https://doi.org/10.1016/j.rse.2008.03.015, 2008.
Hernández-Clemente, R., Navarro-Cerrillo, R. M., Suárez, L., Morales, F., and Zarco-Tejada, P. J.: Assessing Structural Effects on PRI for Stress Detection in Conifer Forests, Remote Sens. Environ., 115, 2360–2375, https://doi.org/10.1016/j.rse.2011.04.036, 2011.
Hewitt, F., Hough, T., O'Neill, P., Sasse, J. M., Williams, E. G., and Rowan, K. S.: Who Taught Plants Thermodynamics? The Unfulfilled Potential of Plant Water Potential, Aust. J. Plant Physiol., 12, 213–217, https://doi.org/10.1071/PP9850213, 1985.
Hilker, T., Coops, N. C., Hall, F. G., Black, T. A., Wulder, M. A., Nesic, Z., and Krishnan, P.: Separating Physiologically and Directionally Induced Changes in PRI Using BRDF Models, Remote Sens. Environ., 112, 2777–2788, https://doi.org/10.1016/j.rse.2008.01.011, 2008
Hilker, T., Hall, F. G., Coops, N. C., Lyapustin, A., Wang, Y., Nesic, Z., Grant, N., Black, T. A., Wulder, M. A., and Kljun, N.: Remote Sensing of Photosynthetic Light-Use Efficiency across Two Forested Biomes: Spatial Scaling, Remote Sens. Environ., 114, 2863–2674, https://doi.org/10.1016/j.rse.2010.07.004, 2010.
Hirich, A., Fatnassi, H., Ragab, R., and Choukr-Allah, R.: Prediction of Climate Change Impact on Corn Grown in the South of Morocco Using the Saltmed Model: Prediction of Climate Change Impact on Corn, Irrig. Drain., 65, 9–18, https://doi.org/10.1002/ird.2002, 2016
Hwang, T., Gholizadeh, H., Sims, D. A., Novick, K. A., Brzostek,E. R., Phillips, R. P., Roman, D. T., Robeson, S. M., and Rahman, A. F.: Capturing Species-Level Drought Responses in a Temperate Deciduous Forest Using Ratios of Photochemical Reflectance Indices between Sunlit and Shaded Canopies, Remote Sens. Environ., 199, 350–359, https://doi.org/10.1016/j.rse.2017.07.033, 2017.
Idso, S. B., Jackson, R. D., Pinter, P. J., Reginato, R. J., and Hatfield, J. L.: Normalizing the Stress-Degree-Day Parameter for Environmental Variability, Agr. Meteorol., 24, 45–55, https://doi.org/10.1016/0002-1571(81)90032-7, 1981.
Lei, Y., Zhang, H., Chen, F., and Zhang, L.: How Rural Land Use Management Facilitates Drought Risk Adaptation in a Changing Climate – A Case Study in Arid Northern China, Sci. Total Environ., 550, 192–199, https://doi.org/10.1016/j.scitotenv.2016.01.098, 2016.
Liu, S., Peng, Y., Du, W., Le, Y., and Li, L.: Remote Estimation of Leaf and Canopy Water Content in Winter Wheat with Different Vertical Distribution of Water-Related Properties, Remote Sens., 7, 4626–4650, https://doi.org/10.3390/rs70404626, 2015.
Magney, T. S., Vierling, L. A., Eitel, J. U. H., Huggins, D. R., and Garrity, S. R.: Response of High Frequency Photochemical Reflectance Index (PRI) Measurements to Environmental Conditions in Wheat, Remote Sens. Environ., 173, 84–97, https://doi.org/10.1016/j.rse.2015.11.013, 2016.
Middleton, E. M., Cheng, Y.-B., Hilker, T., Black, T. A., Krishnan, P., Coops, N. C., and Huemmrich, K. F.: “Linking Foliage Spectral Responses to Canopy-Level Ecosystem Photosynthetic Light-Use Efficiency at a Douglas-Fir Forest in Canada”, Can. J. Remote Sens., 35, 166–188, https://doi.org/10.5589/m09-008, 2009.
Mõttus, M., Takala, T. L. H., Stenberg, P., Knyazikhin, Y., Yang, B., and Nilson, T.: Diffuse Sky Radiation Influences the Relationship between Canopy PRI and Shadow Fraction, ISPRS-J. Photogramm., 105, 54–60, https://doi.org/10.1016/j.isprsjprs.2015.03.012, 2015.
Muller, P.: Non-Photochemical Quenching, A Response to Excess Light Energy, Plant Physiol., 125, 1558–66, https://doi.org/10.1104/pp.125.4.1558, 2001.
Panigada, C., Rossini, M., Meroni, M., Cilia, C., Busetto, L., Amaducci, S., Boschetti, M., Cogliati, S., Picchi, V., Pinto, F., Marchesi, A., and Colombo, R.: Fluorescence, PRI and Canopy Temperature for Water Stress Detection in Cereal Crops, Int. J. Appl. Earth Obs., 30, 167–178, https://doi.org/10.1016/j.jag.2014.02.002, 2014.
Penuelas, J., Filella, I., and Gamon, J. A.: Assessment of Photosynthetic Radiation-Use Efficiency with Spectral Reflectance, New Phytol., 131, 291–296, https://doi.org/10.1111/j.1469-8137.1995.tb03064.x, 1995.
Rossini, M., Fava, F., Cogliati, S., Meroni, M., Marchesi, A., Panigada, C., Giardino, C., Busetto, L., Migliavacca, M., Amaducci, S., and Colombo, R.: Assessing Canopy PRI from Airborne Imagery to Map Water Stress in Maize, ISPRS-J. Photogramm. Remote Sens., 86, 168–177, https://doi.org/10.1016/j.isprsjprs.2013.10.002, 2013.
Sarlikioti, V., Driever, S. M., and Marcelis, L. F. M.: Photochemical Reflectance Index as a Mean of Monitoring Early Water Stress, Ann. Appl. Biol., 157, 81–89, https://doi.org/10.1111/j.1744-7348.2010.00411.x, 2010.
Sayago, S., Ovando, G., and Bocco, M.: Landsat Images and Crop Model for Evaluating Water Stress of Rainfed Soybean, Remote Sens. Environ., 198, 30–39, https://doi.org/10.1016/j.rse.2017.05.008, 2017.
Shahenshah, Y. Y., Li, M.-S., and Akihiro, I.: Assessment of Photochemical Reflectance Index as a Tool for Evaluation of Chlorophyll Fluorescence Parameters in Cotton and Peanut Cultivars Under Water Stress Condition, Agr. Sci. China, 9, 662–670, https://doi.org/10.1016/S1671-2927(09)60141-3, 2010.
Shrestha, S., Brueck, H., and Asch, F.: Chlorophyll Index, Photochemical Reflectance Index and Chlorophyll Fluorescence Measurements of Rice Leaves Supplied with Different N Levels, J. Photoch. Photobio. B, 113, 7–13, https://doi.org/10.1016/j.jphotobiol.2012.04.008, 2012.
Siddique, M. R. B., Hamid, A., and Islam, M. S.: Drought Stress Effects on Water Relations of Wheat, Bot. Bull. Acad. Sinica, 41, 35–39, 2000.
Suárez, L., Zarco-Tejada, P. J., Sepulcre-Cantó, G., Pérez-Priego, O., Miller, J. R., Jiménez-Muñoz, J. C., and Sobrino, J.: Assessing Canopy PRI for Water Stress Detection with Diurnal Airborne Imagery, Remote Sens. Environ., 112, 560–575, https://doi.org/10.1016/j.rse.2007.05.009, 2008.
Suárez, L., Zarco-Tejada, P. J., Berni, J. A. J., González-Dugo, V., and Fereres, E.: Modelling PRI for Water Stress Detection Using Radiative Transfer Models, Remote Sens. Environ., 113, 730–744, https://doi.org/10.1016/j.rse.2008.12.001, 2009.
Sun, P., Grignetti, A., Liu, S., Casacchia, R., Salvatori, R., Pietrini, F., Loreto, F., and Centritto, M.: Associated Changes in Physiological Parameters and Spectral Reflectance Indices in Olive (Olea Europaea L.) Leaves in Response to Different Levels of Water Stress, Int. J. Remote Sens., 29, 1725–1743, https://doi.org/10.1080/01431160701373754, 2008.
Takala, T. L. H. and Mõttus, M.: Spatial Variation of Canopy PRI with Shadow Fraction Caused by Leaf-Level Irradiation Conditions, Remote Sens. Environ., 182, 99–112, https://doi.org/10.1016/j.rse.2016.04.028, 2016.
Thenot, F., Méthy, M., and Winkel, T.: The Photochemical Reflectance Index (PRI) as a Water-Stress Index, Int. J. Remote Sens., 23, 5135–5139, https://doi.org/10.1080/01431160210163100, 2002.
Villalobos, F. J., Testi, L., and Moreno-Perez, M. F.: Evaporation and Canopy Conductance of Citrus Orchards, Agr. Water Manage., 96, 565–573, https://doi.org/10.1016/j.agwat.2008.09.016, 2009.
Zarco-Tejada, P. J., González-Dugo, V., Williams, L. E., Suárez, L., Berni, J. A. J., Goldhamer, D., and Fereres, E.: A PRI-Based Water Stress Index Combining Structural and Chlorophyll Effects: Assessment Using Diurnal Narrow-Band Airborne Imagery and the CWSI Thermal Index, Remote Sens. Environ., 138, 38–50, https://doi.org/10.1016/j.rse.2013.07.024, 2013.
Zhou, K., Deng, X., Yao, X., Tian, Y., Cao, W., Zhu, Y., Ustin, S., and Cheng, T.: Assessing the Spectral Properties of Sunlit and Shaded Components in Rice Canopies with Near-Ground Imaging Spectroscopy Data, Sensors, 17, 578–594, https://doi.org/10.3390/s17030578, 2017.