the Creative Commons Attribution 4.0 License.
the Creative Commons Attribution 4.0 License.
 | 02 Aug 2019
Rates and drivers of Red Sea plankton community metabolism
Daffne C. López-Sandoval
Katherine Rowe
Paloma Carillo-de-Albonoz
Carlos M. Duarte
Susana Agustí
Resolving the environmental drivers shaping planktonic communities is fundamental for understanding their variability, in the present and the future, across the ocean. More specifically, addressing the temperature-dependence response of planktonic communities is essential as temperature plays a key role in regulating metabolic rates and thus potentially defining the ecosystem functioning. Here we quantified plankton metabolic rates along the Red Sea, a uniquely oligotrophic and warm environment, and analysed the drivers that regulate gross primary production (GPP), community respiration (CR), and net community production (NCP). The study was conducted on six oceanographic surveys following a north–south transect along the Saudi Arabian coast. Our findings revealed that GPP and CR rates increased with increasing temperature (R2=0.41 and 0.19, respectively; p<0.001 in both cases), with a higher activation energy (Ea) for GPP (1.20±0.17 eV) than for CR (0.73±0.17 eV). The higher Ea for GPP than for CR resulted in a positive relationship between NCP and temperature. This unusual relationship is likely driven by the relatively higher nutrient availability found towards the warmer region (i.e. southern Red Sea), which favours GPP rates above the threshold that separates autotrophic from heterotrophic communities (1.7 mmol O2 m−3 d−1) in this region. Due to the arid nature, the basin lacks riverine and terrestrial inputs of organic carbon to subsidise a higher metabolic response of heterotrophic communities, thus constraining CR rates. Our study suggests that GPP increases steeply with increasing temperature in the warm ocean when relatively high nutrient inputs are present.
- Article
(3925 KB) - Full-text XML
- BibTeX
- EndNote


The balance between gross primary production and community respiration, which involves both autotrophic and heterotrophic metabolic activity (Williams, 1993; Cullen, 2001; Ducklow and Doney, 2013), sets the metabolic status of an ecosystem by defining the carbon available to fuel pelagic food webs and determining whether plankton communities act as a source or sink of CO2 (Del Giorgio et al., 1997; Williams, 1998). Whereas gross primary production (GPP) typically satisfies the respiratory demands within the food web across productive waters, the oligotrophic ocean often requires allochthonous inputs of organic carbon to meet the metabolic requirements of heterotrophic organisms (Smith and Mackenzie, 1987). Due to comparatively higher carbon consumption relative to the production, planktonic communities in low-productivity systems are in close metabolic balance, i.e. net community production (NCP) = 0 or GPP is equal to community respiration (CR), or experience a net metabolic imbalance (i.e. NCP < 0, GPP < CR) (Smith and Hollibaugh, 1993; Duarte and Agustí, 1998; Duarte et al., 2013).
In tropical and subtropical oligotrophic regions, the high temperatures may amplify the metabolic imbalances in plankton communities as CR tends to increase faster than GPP (Harris et al., 2006; Regaudie-de-Gioux and Duarte, 2012) if the allochthonous sources of organic carbon are enough to subsidise their carbon demand. These allochthonous inputs may be delivered from land through riverine discharge, from the atmosphere through atmospheric deposition of dust and volatile organic carbon (Jurado et al., 2008), or are exported from productive coastal habitats (Duarte et al., 2013; Barrón and Duarte, 2015).
The Red Sea is a semi-enclosed highly oligotrophic basin (Acker et al., 2008; Raitsos et al., 2013). It is known as one of the warmest tropical seas, with maximum sea surface temperatures ranging from 33.0 to 33.9 ∘C during summer (Chaidez et al., 2017; Osman et al., 2018), and up to 34–35 ∘C in certain parts of the basin (Rasul et al., 2015; Garcias-Bonet and Duarte, 2017; Almahasheer et al., 2018). Due to the prevailing arid conditions, the Red Sea experiences large evaporation rates (nearly 2 cm yr−1 of freshwater from the surface layers) while the lack of river runoff and low precipitation rates make this system one of the saltiest seas on the planet (Sofianos, 2002; Sofianos and Johns, 2015; Zarokanellos et al., 2017). Two wind patterns govern the region: in the northern part, the wind coming from the northwest remains relatively constant throughout the year, while in the southern area, the Indian monsoon system regulates the wind dynamics (Sofianos, 2002; Sofianos and Johns, 2015). During the winter monsoon the wind changes direction, and this wind reversal along with the thermohaline forces drives the overall circulation and favours the exchange of water with the Indian Ocean (Sofianos, 2002; Zarokanellos et al., 2017).
Due to the almost negligible terrestrial inputs, the intrusion of nutrient-rich waters from the Indian Ocean through the Bab el Mandeb Strait (Sofianos and Johns, 2007; Raitsos et al., 2015; Kürten et al., 2016), together with aeolian dust and aerosol deposition (Chen et al., 2007; Engelbrecht et al., 2017), represents the primary source of nutrients into the basin. Thus, nutrient availability in the Red Sea follows a latitudinal pattern that is opposite to the one of salinity, but parallel to the thermal gradient, with nutrient-richer and warmer waters towards the southern Red Sea compared to the cooler and more oligotrophic northern Red Sea (Sofianos, 2002; Raitsos et al., 2015).
Studies based on ocean colour data revealed that chlorophyll a (Chl a) concentrations decline from the southern Red Sea to the northern Red Sea (Raitsos et al., 2013; Kheireddine et al., 2017; Qurban et al., 2017) and depict a clear seasonality. During wintertime, when the maximum exchange of water with the Indian Ocean takes place, Chl a concentration peaks, decreasing towards the summer period when the water column is mostly stratified (Sofianos, 2002). Measurements of primary production also revealed that phytoplankton photosynthetic rates follow the same south-to-north gradient as Chl a and nutrient concentration (Qurban et al., 2017; López-Sandoval et al., 2019). However, reports regarding the metabolic balance of the plankton communities are scarce, mostly focus on the contribution of the autotrophic community via photosynthetic processes (Levanon-Spanier et al., 1979; Qurban et al., 2014; Rahav et al., 2015), or are restricted to specific regions (Tilstra et al., 2018).
Based on available evidence, we hypothesise that the high gross primary production expected in the southern Red Sea may be counterbalanced by a higher respiratory demand in these warm waters and that NCP might decline towards the relatively unproductive waters of the northern Red Sea. With the expected decrease in GPP towards the northern region, planktonic metabolism might be driven mainly by heterotrophic communities (Duarte and Agustí, 1998; Duarte et al., 2013). However, the absence of significant allochthonous subsidies in the basin may hamper the metabolic response of the heterotrophic plankton communities. Hence, it remains unclear what the metabolic balance of plankton communities is and whether a south to north latitudinal gradient in NCP exists in the Red Sea.
Here we report the variability of plankton community metabolism (GPP, CR, and NCP) along a latitudinal gradient in the Red Sea and examine if the temperature dependence of planktonic metabolic rates in this basin is consistent with those reported for the global ocean (López-Urrutia et al., 2006; Regaudie-de-Gioux and Duarte, 2013; García-Corral et al., 2017). We did so by conducting measurements as part of six surveys along the south–north latitudinal gradient in the Saudi Arabian economic exclusive zone in the Red Sea waters. Specifically, we determined plankton metabolic rates between winter 2016 and spring 2018, thus allowing us to (1) delineate the seasonal variability of the gross primary production and community respiration along the Red Sea, (2) quantify changes in the metabolic balance (net community production), and (3) test the hypothesised roles of productivity gradients and temperature in driving NCP.
2.1 Field sampling
We conducted six oceanographic surveys: two during autumn (October and November 2016), two during winter (February 2016 and January 2017), one in summer (August 2017), and one in spring (March 2018) on board the R/V Thuwal and R/V Al Azizi. Sampling was conducted following a latitudinal transect along the Red Sea within a region limited by coordinates 17.25 to 27.82∘ N and 34.83 to 41.39∘ E (Fig. 1). At each station, vertical profiles of temperature and salinity were obtained with a Sea-Bird SBE 911plus CTD profiler (Sea-Bird Electronics, Bellevue, WA, USA), equipped with additional sensors to measure the attenuation of photosynthetically active radiation (PAR) (Li-cor biospherical PAR sensor), in vivo fluorescence (WetLabs ECO-FL fluorometer), and dissolved oxygen concentration (Sea-Bird SBE 43 dissolved oxygen sensor). Water samples for chemical and biological measurements were collected between 07:00 and 09:00 local time, using a rosette sampler equipped with 12 Teflon Niskin bottles (12 L) that were provided with silicone O-rings and seals.
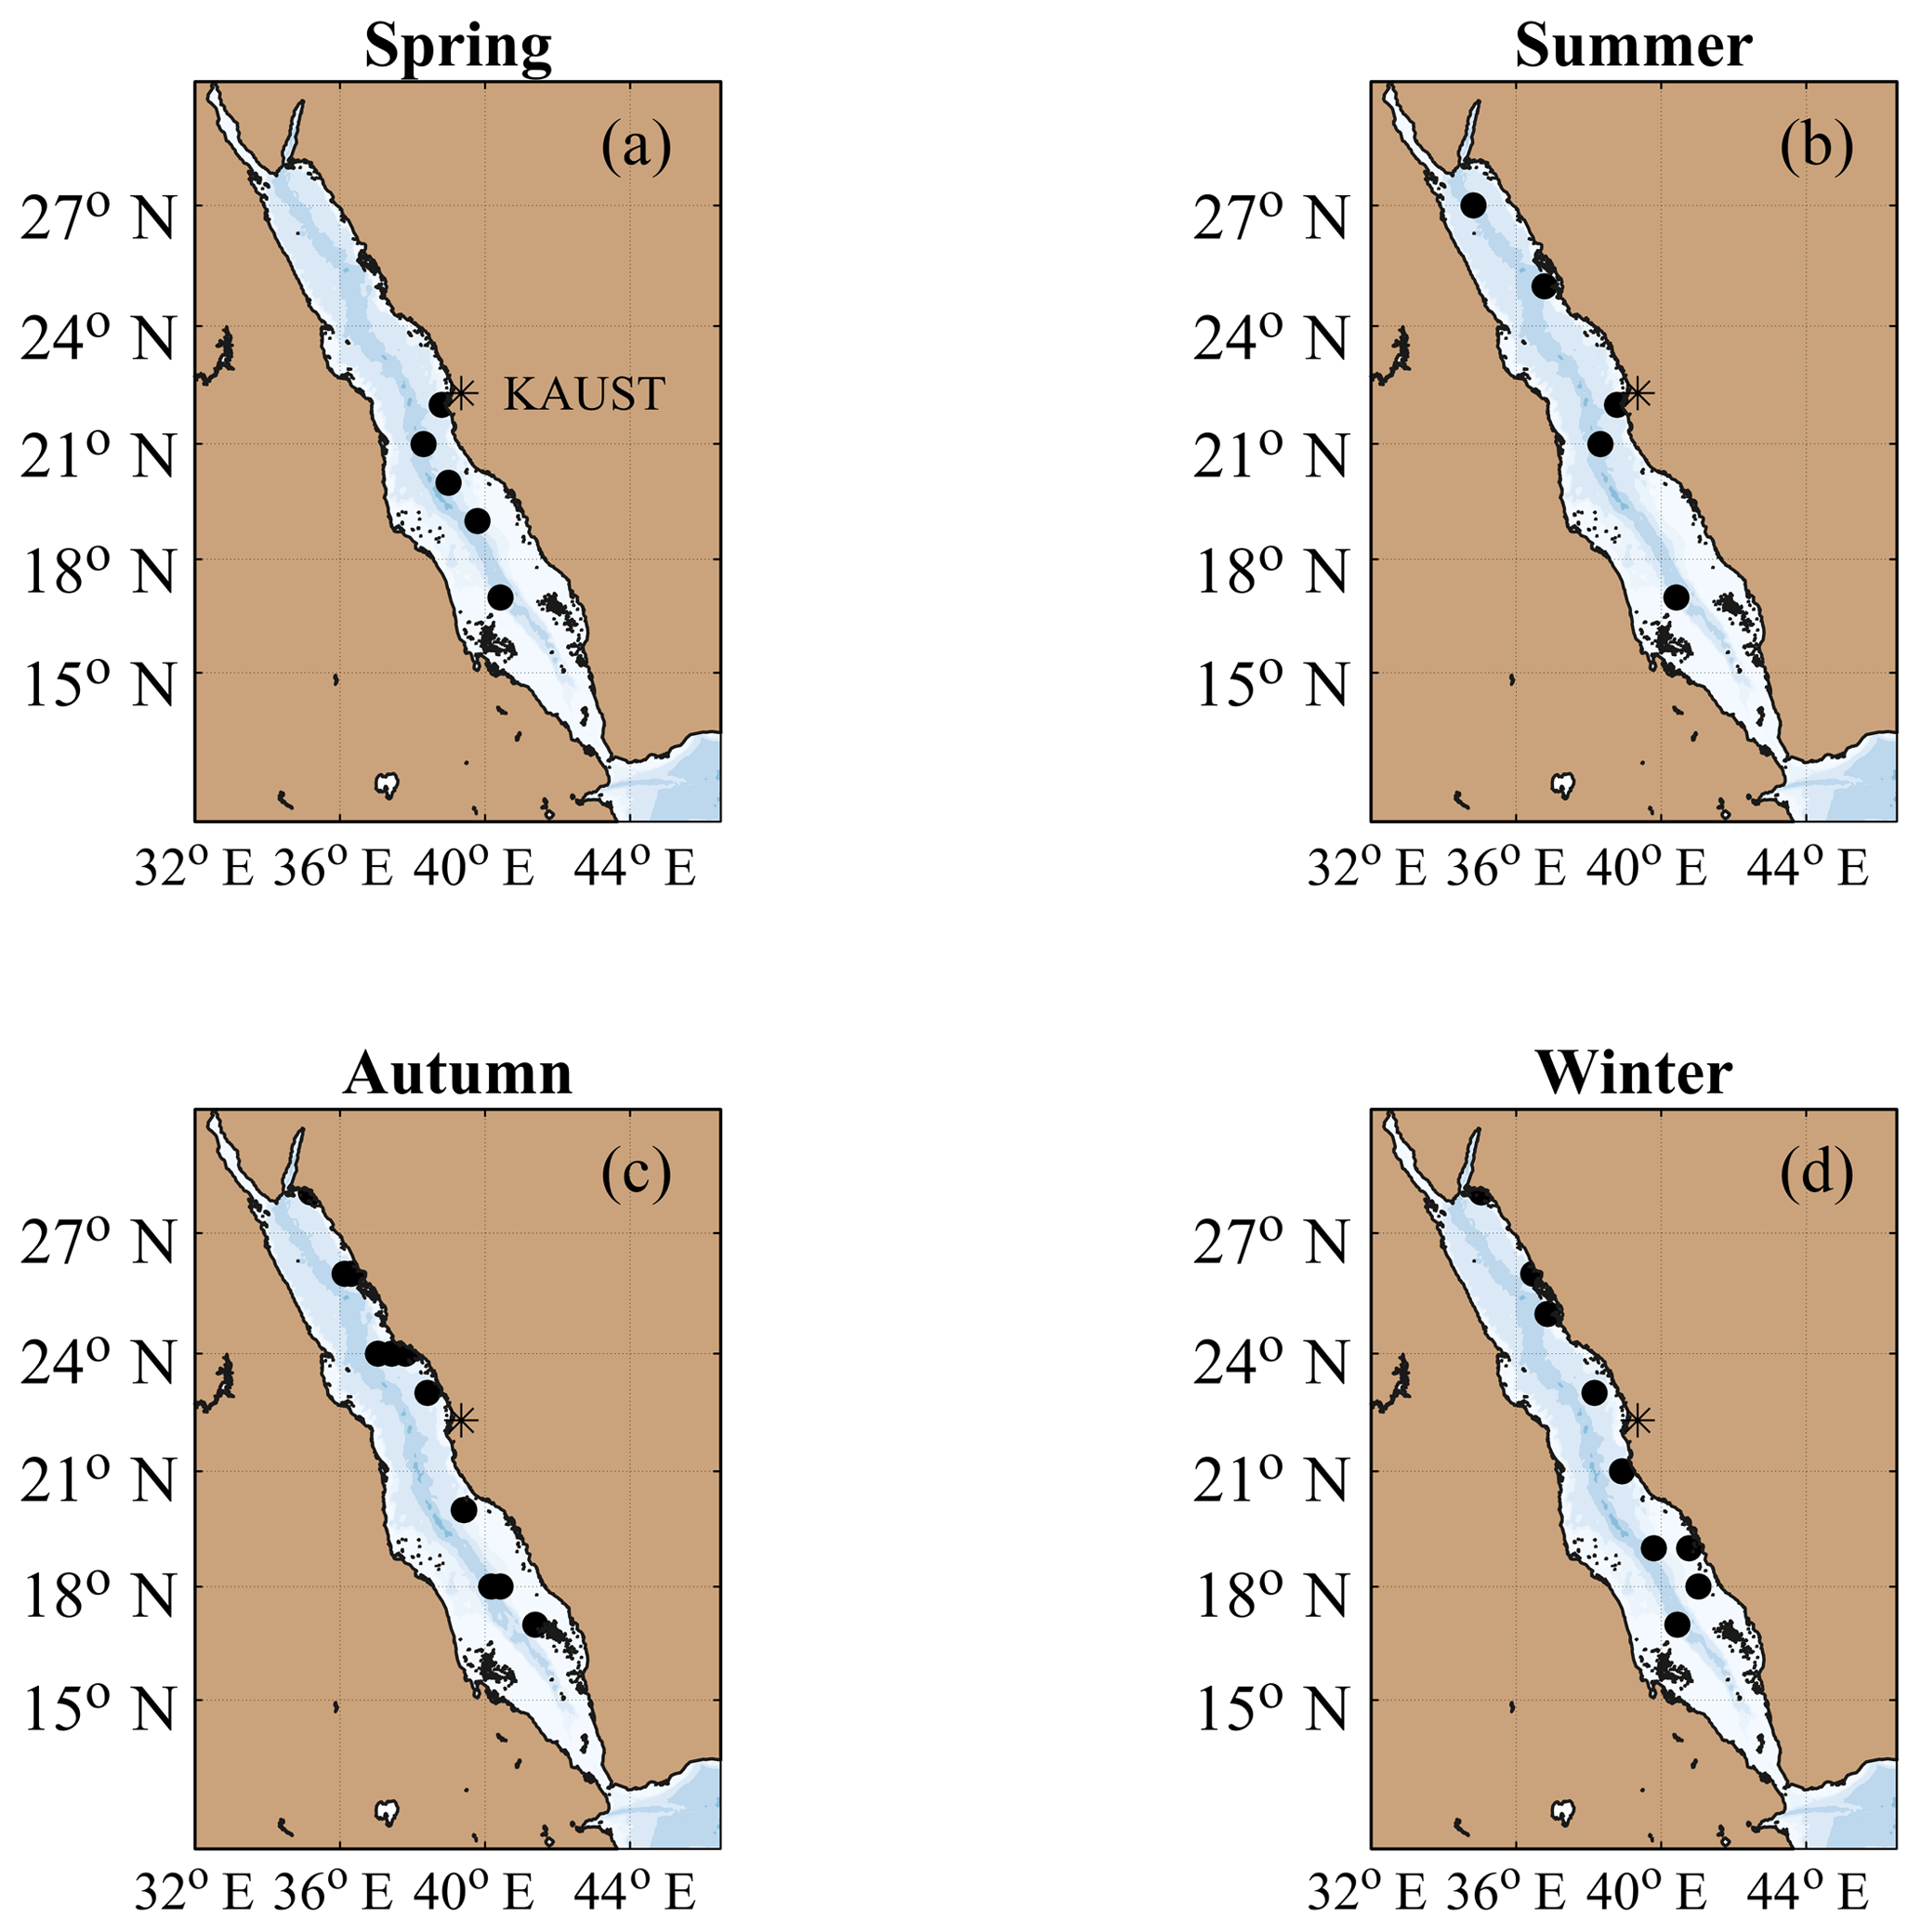
Figure 1Stations sampled along the Red Sea during (a) spring 2018, (b) summer 2018, (c) autumn 2016, and (d) winter 2016 and 2017.
2.2 Inorganic nutrients and chlorophyll a concentration
Water samples for nutrient analyses were collected in 50 mL polyethylene bottles and kept frozen (−20 ∘C) until further processing. Inorganic nutrient concentration was determined with a SEAL AA3 segmented flow analyser (SEAL Analytical Inc., WI, USA) using standard methods (Hansen and Koroleff, 1999). The detection limits were 0.05 µM for nitrate, 0.01 µM for nitrite, 0.01 µM for phosphate, and 0.08 µM for silicate. For the chlorophyll a analysis, 200 mL samples were taken at 10 discrete depths (between 5 and 200 m) and filtered through Whatman GF/F filters. The filters were kept frozen (−20 ∘C) until further analysis. Pigments were extracted for 24 h using 90 % acetone and left overnight in the dark at 4 ∘C. The Chl a concentration was estimated with the non-acidification technique using a Trilogy fluorometer equipped with a CHL-NA module (Turner Designs, San Jose, USA), previously calibrated with pure Chl a.
2.3 Net community metabolism, community respiration, and gross primary production
Plankton metabolic rates were determined in vitro by measuring the changes in dissolved oxygen concentration after 24 h light–dark bottle (Winkler) incubations (Carpenter, 1965). This methodology, commonly used to determine plankton metabolic rates (Williams et al., 1979; Duarte and Agustí, 1998; Bender et al., 1999; Robinson and Williams, 1999; Ducklow et al., 2000; Serret et al., 2001, 2009; Robinson et al., 2002; García-Martín et al., 2017), allows the diel cycle of oxygen and carbon fluxes derived from photosynthetic mechanisms (light-dependent reactions) and also those linked to the acquisition of energy by both autotrophic and heterotrophic microorganisms (light- and dark-dependent reactions)(Robinson and Williams, 2005; Williams and del Giorgio, 2005) to be accounted for .
Water samples were collected at three different optical depths (ζ) through the water column. One at the surface (100 %–80 % of incident PAR), another towards the bottom of the photic layer (8 %–1 % of incident PAR), and one intermediate sample at a depth of the chlorophyll maximum (Chl a max). In case the Chl a max was sampled at the surface or bottom layers, the intermediate sample was taken between 1.5 and 2.3 ζ (i.e. 22 %–10 % of incident PAR). Seawater was collected directly from the Niskin bottles to fill a total of 21 (100 mL) Winkler bottles. The bottles were carefully filled using silicone tubing, and the water was allowed to overflow during the filling, taking special care to avoid the formation of air bubbles. Surface samples were collected in 100 mL quartz bottles. From each depth, seven of the bottles were immediately fixed with manganese sulfate (MnSO4) and potassium hydroxide ∕ potassium iodide solution (KI ∕ KOH) to determine the initial oxygen concentration while the other 14 bottles, 7 light and 7 black, were incubated on deck in surface water flow-through tanks. Due to the difference in temperature between the surface and deep waters, particularly during the summer and autumn surveys, we decided to include in our analyses only those samples collected above the thermocline. Changes in temperature and PAR in the incubation tanks were recorded with HOBO Pendant® data loggers (Onset, Massachusetts, USA).
Before the incubation, the bottles were covered with neutral mesh to reduce the incident PAR according to the sampled depth. At the end of the incubation period, light and dark bottles from each depth were fixed to determine final O2 concentrations. The oxygen concentration was measured by automated high-precision Winkler titration with a potentiometric end-point detection (Oudot et al., 1988) using a Mettler Toledo T50 Titration Excellence auto-titrator attached to an InMotion autosampler. NCP was calculated as the difference in the oxygen concentration between the light bottles after the 24 h incubation period ([O2]L−24 h) and the oxygen concentration measured before the incubation ([O2]Tzero) (i.e. NCP = ([O2] L−24 h − [O2]Tzero). CR rates (mmol O2 m−3 d−1) were calculated as the difference of the oxygen concentration after the 24 h incubation period in the dark bottles ([O2]D−24 h) and the initial oxygen concentration ([O2]Tzero) (i.e. CR = [O2]Tzero − ([O2]D−24 h). GPP (mmol O2 m−3 d−1) was calculated as the sum of NCP and CR.
Due to the consistent relationship existing between plankton metabolism and temperature across diverse marine regions (Regaudie-de-Gioux and Duarte, 2012; García-Corral et al., 2014), we examined how plankton metabolic rates covariate with temperature in the Red Sea, a system whose temperature range is higher than previously encountered in marine planktonic metabolism research. We determined the relationship between metabolic rates and temperature by fitting an ordinary least squares linear regression equation to the relationship between the natural logarithm of the Chl a-specific metabolic rates (B0) and the inverse of the absolute temperature × k (i.e. 1∕kT), where k is the Boltzmann's constant ( eV K−1) (Gillooly et al., 2001; Brown et al., 2004):
In these so-called Arrhenius plots, the slope of this relationship represents the average activation energy (Ea = negative slope), characterising the extent of thermal dependence of metabolic processes.
2.4 Statistical analyses
Statistical analyses and figures were done using the statistical and machine learning toolbox in MATLAB version R2018b (Mathworks Inc, Natick, MA, USA) and with the R statistical computing package using RStudio 1.1419. Pearson correlation tests were used (corrplot function in R) to determine the relationship between environmental variables (temperature, nitrate + nitrite (NOx), phosphate, and silicate concentration) and their latitudinal distribution, and to determine the relationship between volumetric measurements of GPP, CR, NCP, and environmental variables (temperature, NOx concentration, Chl a, and latitude). We used ordinary least squares (OLS) simple regression models (fitlm function in MATLAB) to describe the potential relationships between different planktonic metabolic rates and between metabolic rates and environmental variables, and to predict the response of the Chl a-normalised GPP (and CR) to temperature (Arrhenius plots described in Sect. 2.3). To test if the activation energies (obtained from the Arrhenius plots) were significantly different, we performed an analysis of covariance (ANCOVA) by using the aoctool in MATLAB. The variability of planktonic metabolic rates between cruises was statistically analysed using non-parametric Kruskal–Wallis tests. Mean values and their standard error (SE) are reported throughout the text.
3.1 Latitudinal variability of physicochemical properties and Chl a concentration
Hydrographic (temperature and salinity) and chemical variables (nutrient concentrations) depicted a marked latitudinal gradient typical of the Red Sea. At the southern-most area, sea surface temperature (SST) fluctuated between 28 ∘C (winter–spring) and 32 ∘C (summer), while at the far-northern sampling site SST ranged between 23 ∘C (winter) and 27–28 ∘C (summer–autumn) (Fig. 2). Overall, all macronutrients observed a significant inverse correlation with latitude (Pearson correlation coefficients r<−0.4, p<0.05) (Fig. 3). Nitrite + nitrate (NOx) decreased from 6.1±0.9 µM in the southern region to 2.9±0.3 µM towards the northern Red Sea, while on average, phosphate concentration ranged from 0.5±0.01 µM in the south of the Red Sea to 0.1±0.01 µM towards the northern stations (data not shown). Phytoplankton biomass (measured as Chl a concentration) also decreased significantly towards the north of the Red Sea (Pearson's correlation, r = −0.4, p<0.001, and n = 77) (Table 1). We found the highest autotrophic biomass during the autumn and winter cruises. During this period, surface Chl a ranged from 0.6 to 0.8 mg m−3 in the southern region and ranged from 0.2 to 0.3 mg m−3 in the north (Fig. 2). In general, our results confirm that all variables correlated significantly with latitude, highlighting the prevalence of the south–north gradient in temperature, salinity, nutrient availability, and chlorophyll a concentration across the Red Sea.
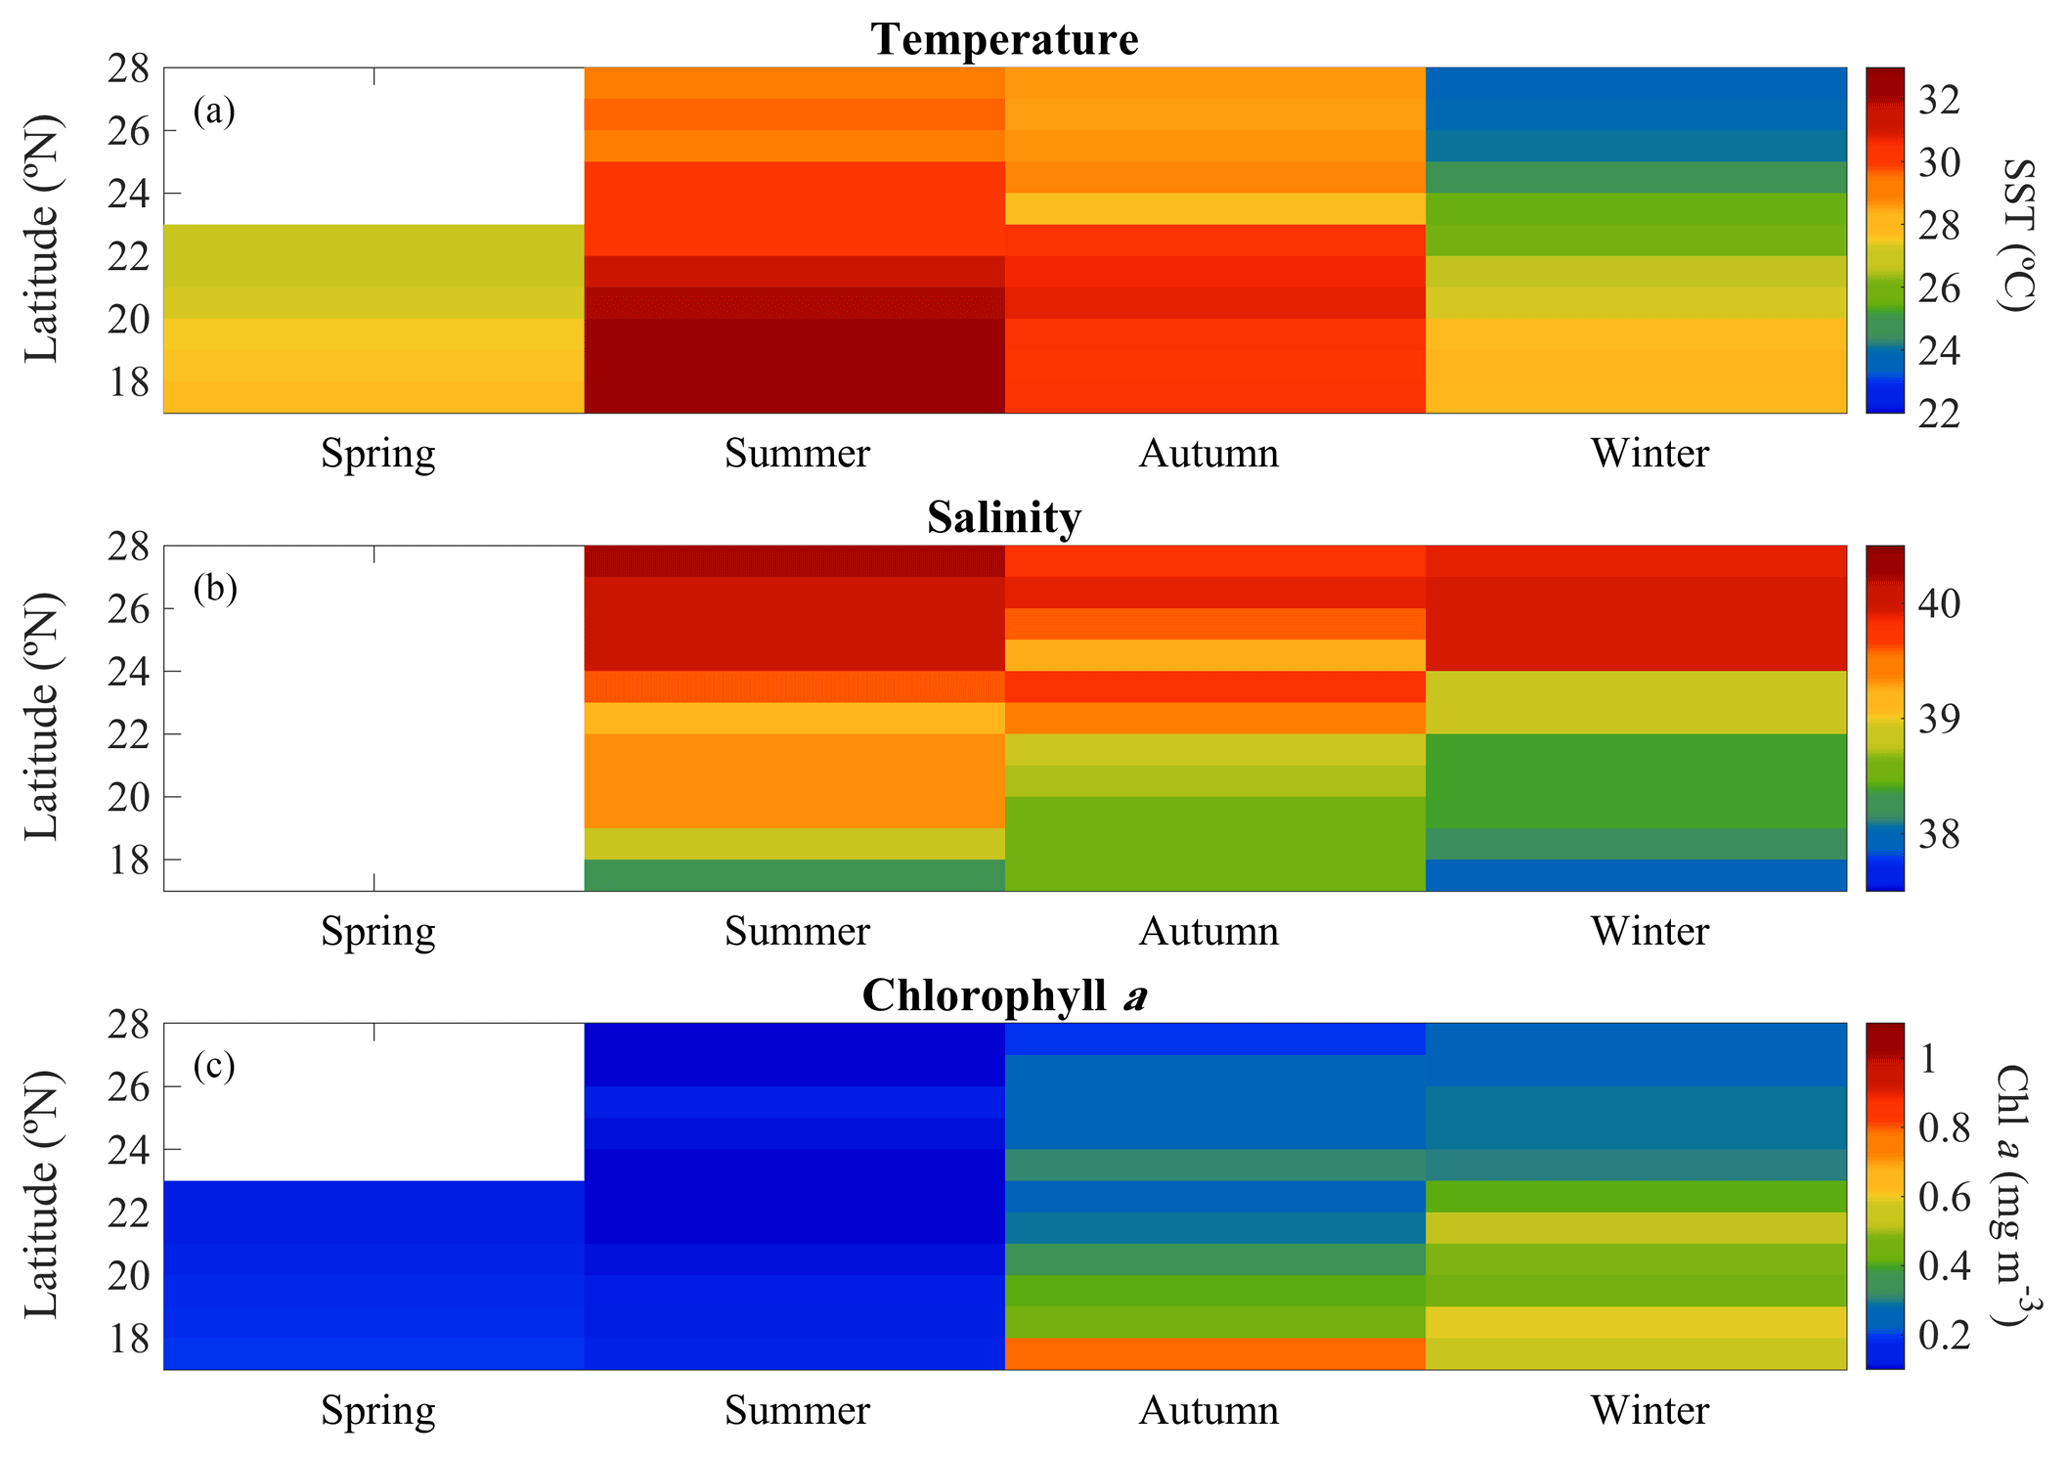
Figure 2Overall seasonal and latitudinal variability of surface (a) temperature (SST), (b) salinity, and (c) chlorophyll a concentration (Chl a) measured during spring 2018, summer 2017, autumn 2016, and winter 2016 and 2017 cruises along the Red Sea (∼100 % of incident photosynthetically active radiation, PAR).

Figure 3Pearson correlations between environmental variables (temperature and the concentrations of nitrate + nitrite [NOx], phosphate, and silicate) and their latitudinal distribution measured at selected depths: (a) the first optical depth (from the surface down to 37 % of incident PAR) and (b) at the bottom of the photic layer (between 1 % and 0.1 % of incident PAR values). The size of the squares is the magnitude, and the colour indicates the direction (green for positive correlations and purple for negative correlations). The value of the correlation coefficient (r) is shown in the colour bar below the graphs. Non-significant correlations are denoted with a “×”.
3.2 Variability of plankton metabolism measured along the Red Sea
Analogous to the environmental variability, planktonic metabolism followed the same significant north–south decreasing pattern with latitude (Fig. 4). The inverse correlation of GPP rates with latitude was highly significant (Pearson correlation coefficient r = −0.6, p<0.001, n = 77) (Table 1), as found for autotrophic biomass, thus explaining the strong correlation observed between GPP and Chl a concentration (Pearson correlation coefficient r = 0.7, n = 77) (Table 1). GPP rates decreased on average by 79 %, from 4.1±0.5 mmol O2 m−3 d−1 (≈49.2 mgC m−3 d−1, assuming the photosynthetic quotient (PQ) = 1) at the southernmost station of the Red Sea to 0.9±0.1 (≈ 10 mgC m−3 d−1; PQ = 1) at the northern site, while CR decreased on average by 73 %, from 3±0.4 mmol O2 m−3 d−1 (≈36 mgC m−3 d−1, assuming the respiratory quotient (RQ) = 1) in the south to 0.8±0.1 in the north (≈9.6 mgC m−3 d−1; RQ = 1) (Fig. 4). We did not find any significant correlation between NOx availability and GPP (Pearson correlation coefficient, p>0.05, n = 56), CR (Pearson correlation coefficient, r = 0. 2, p>0.05), or NCP rates (Pearson correlation coefficient, r = −0.2, p>0.05, n = 56) (Table 1); however, all metabolic rates were positively correlated with temperature (Table 1).
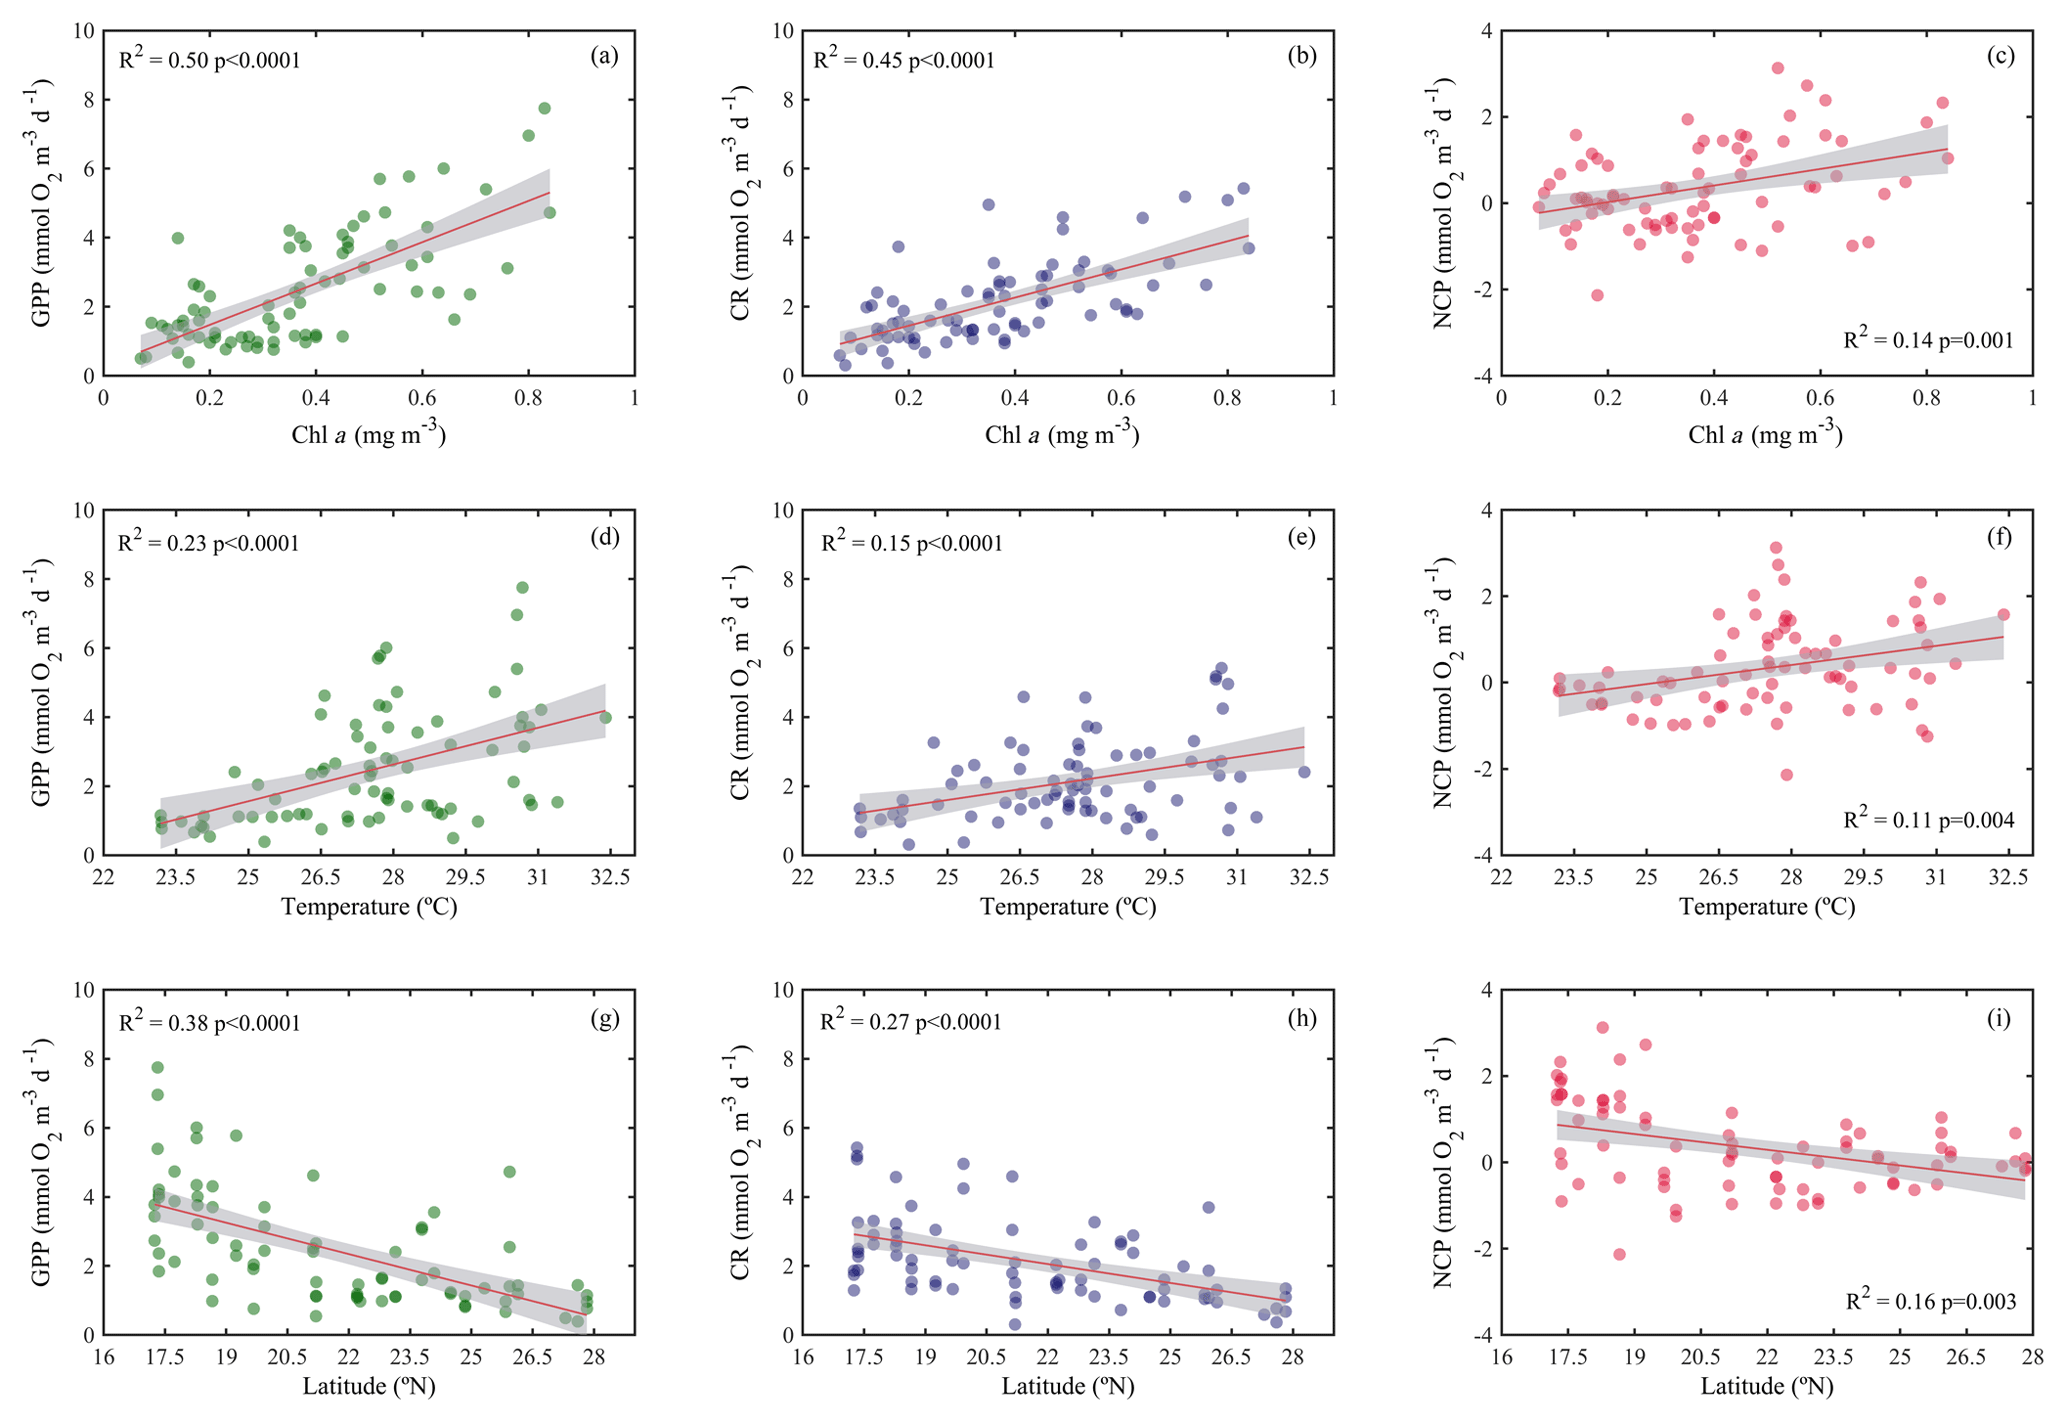
Figure 4Ordinary least squares linear regression between gross primary production (GPP), planktonic community respiration (CR), and net community production rates (NCP) with (a, b, c) chlorophyll a concentration (Chl a), (d, e, f) temperature, and (g, h, i) latitude. The solid red line is the linear least square fit, while the shaded grey area represents the 95 % confidence intervals. The coefficient of determination and the statistical significance are indicated for each regression.
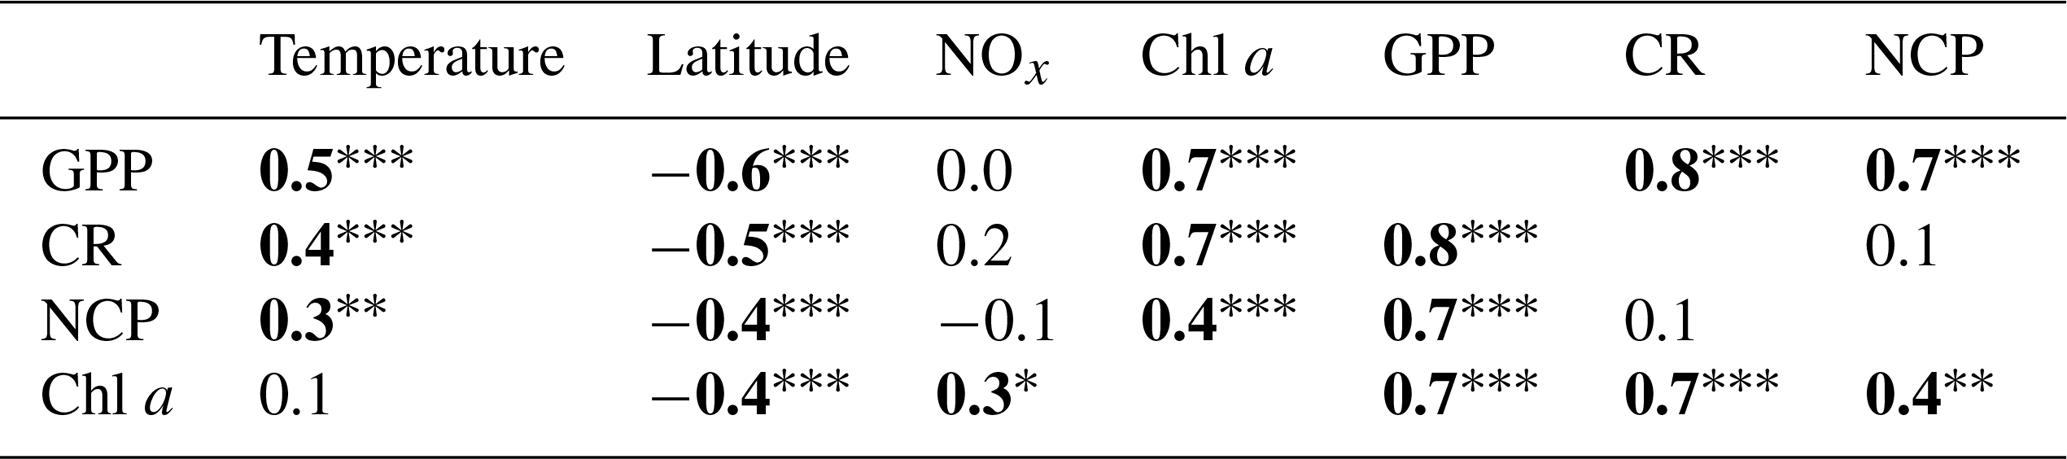
Table 1Pearson correlation matrix between volumetric gross primary production (GPP), planktonic community respiration (CR), and net community production (NCP) with environmental variables (temperature; latitude; nitrite + nitrate, NOx; chlorophyll a concentration, Chl a). Bold numbers indicate significant relationships and the significance levels are indicated by * p<0.05, p<0.01, and p<0.001.
The highest GPP and CR rates measured along the Red Sea came from data collected during the autumn and winter cruises, when GPP and CR rates reached values above 6 and 4 mmol O2 m−3 d−1, respectively (Fig. 5), and when the mean values were the highest (GPPautumn-winter = 2.9±0.3–2.3±0.3 mmol O2 m−3 d−1; CRautumn-winter= 2.5±0.3–2±0.2) (Fig. 5). However, despite the overall variability between autumn–winter and spring–summer seasons, when all data are considered together, planktonic GPP and CR rates were not significantly different between seasons (Kruskal–Wallis H test: χ2=6.83, p = 0.08; χ2=4.14, p = 0.25, respectively). Furthermore, the balance between planktonic autotrophic production (GPP) and respiratory losses (due to the heterotrophic and autotrophic metabolism, CR) (i.e. NCP rates) revealed that NCP rates also decreased towards the northern region (by 94 %). From 1.1±0.3 mmol O2 m−3 d−1 at the southern stations to 0.1±0.1 mmol O2 m−3 d−1 above 26∘ N (Fig. 4). The average NCP measured during our cruises was 0.3±0.1 mmol O2 m−3 d−1 (Fig. 5), which indicates an overall prevalence of autotrophic communities (Fig. 5). However, a closer look at our data revealed the mean NCP rate in spring was mmol O2 m−3 d−1 (Fig. 5), while during summer, NCP rates in the northern region ranged from −0.6 to −0.1 mmol O2 m−3 d−1, which provides evidence that planktonic metabolism was governed by heterotrophic communities during both spring and summer in the northern region.

Figure 5Seasonal variability of (a) gross primary production (GPP), (b) community respiration (CR), and (c) net community production (NCP) measured along the Red Sea. Boxplots indicate the 95 % confidence intervals (in lighter colour) with ±1 SD (dark shaded). The central horizontal white lines in the box mark the mean value for each season. The red dashed lines represent the overall mean while the red dotted line in (c) defines the limit between autotrophic and heterotrophic communities (NCP = 0). Values inside the doughnut plots (c) indicate the percentage of heterotrophy (NCP < 0) for each season.
When we evaluated the relationship of GPP with CR and NCP, the analysis showed that both CR and NCP increased significantly with GPP (R2=0.62 and 0.49, respectively; p<0.001) (Fig. 6). From the functional relationships between GPP with CR and NCP, we calculated the threshold of GPP for metabolic equilibrium for the region. By solving for GPP = CR and for NCP = 0 (from the relationship describing NCP as a function of GPP), and by using the slope and intercept shown in Fig. 6a and b, we determined that the GPP threshold that separates autotrophic from heterotrophic planktonic communities in the Red Sea is 1.7 mmol O2 m−3 d−1 (range 1.2–1.9 mmol O2 m−3 d−1).
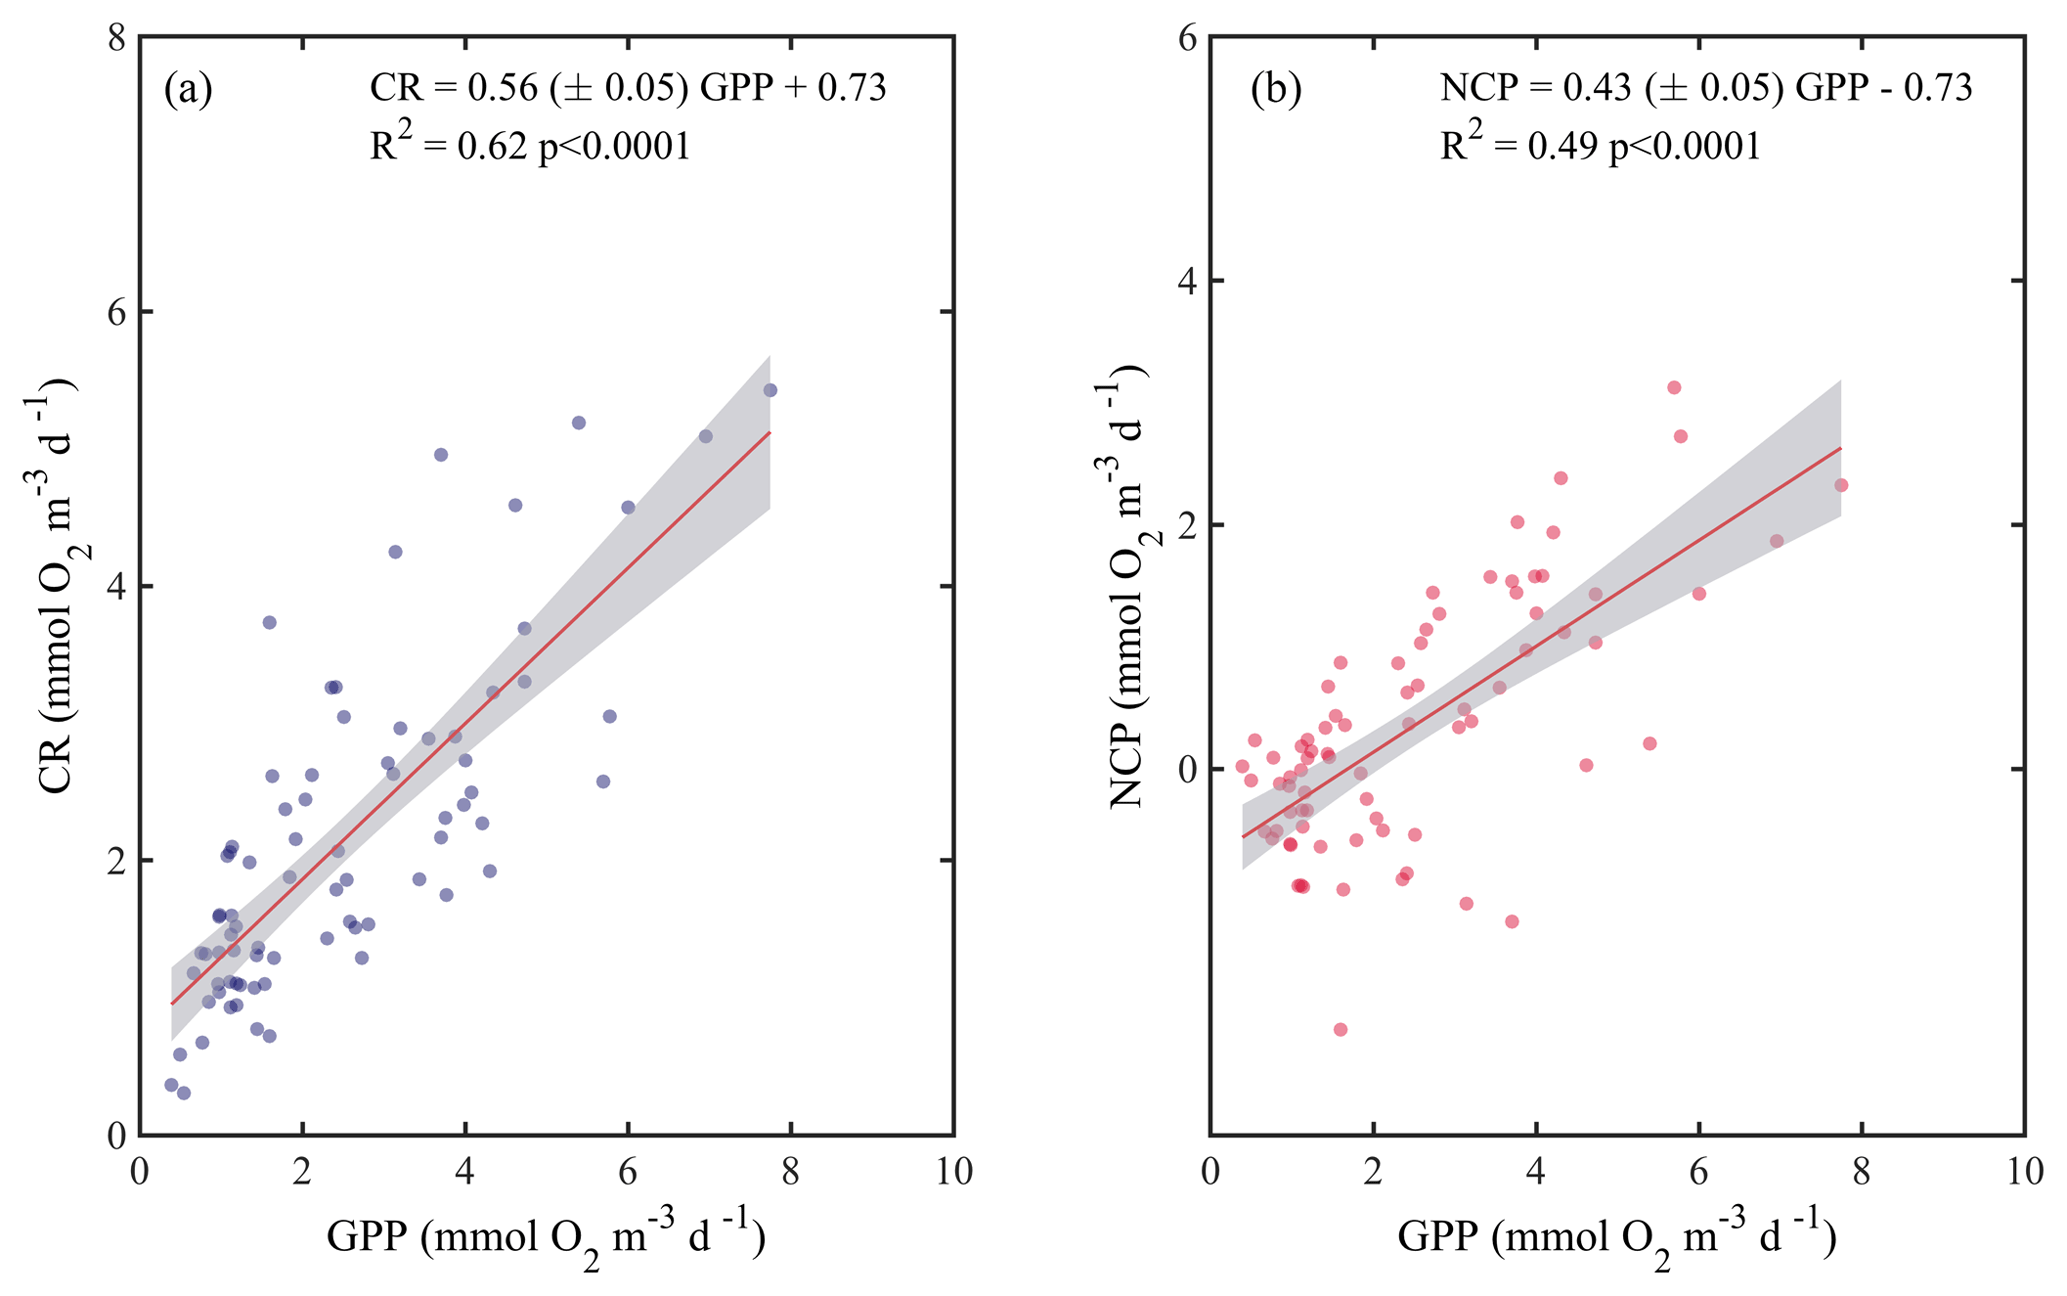
Figure 6Ordinary least square linear regression between (a) planktonic community respiration and (b) net community production (NCP) with gross primary production (GPP) rates measured along the Red Sea. The ordinary least square regression parameters (slope and intercept) and the statistical significance of each regression are indicated. The solid red line represents the linear least square fit and the shaded grey area represents the 95 % confidence interval.
3.3 Metabolic rates and temperature
Due to the pervasive influence of temperature in regulating metabolic rates, we further explored the temperature dependence of GPP and CR by analysing the relationship between chlorophyll a-specific metabolic rates and temperature. Our analysis revealed that both GPP and CR tended to increase with temperature albeit with different activation energies, i.e. Ea was significantly higher for GPP (1.20±0.17 eV) than for CR rates (0.73±0.17 eV) (ANCOVA, F = 3.96, p = 0.04) (Fig. 7). We also tested whether the temperature-dependence response was consistent between cruises (Fig. 8). Our results indicated a relatively higher activation energy for GPP during the summer cruise (2.31±0.75 eV) and for CR in spring (2.60±0.85 eV). However, the observed differences in the activation energies for GPP were not significantly different between seasons (ANCOVA, F = 0.38, p = 0.8).
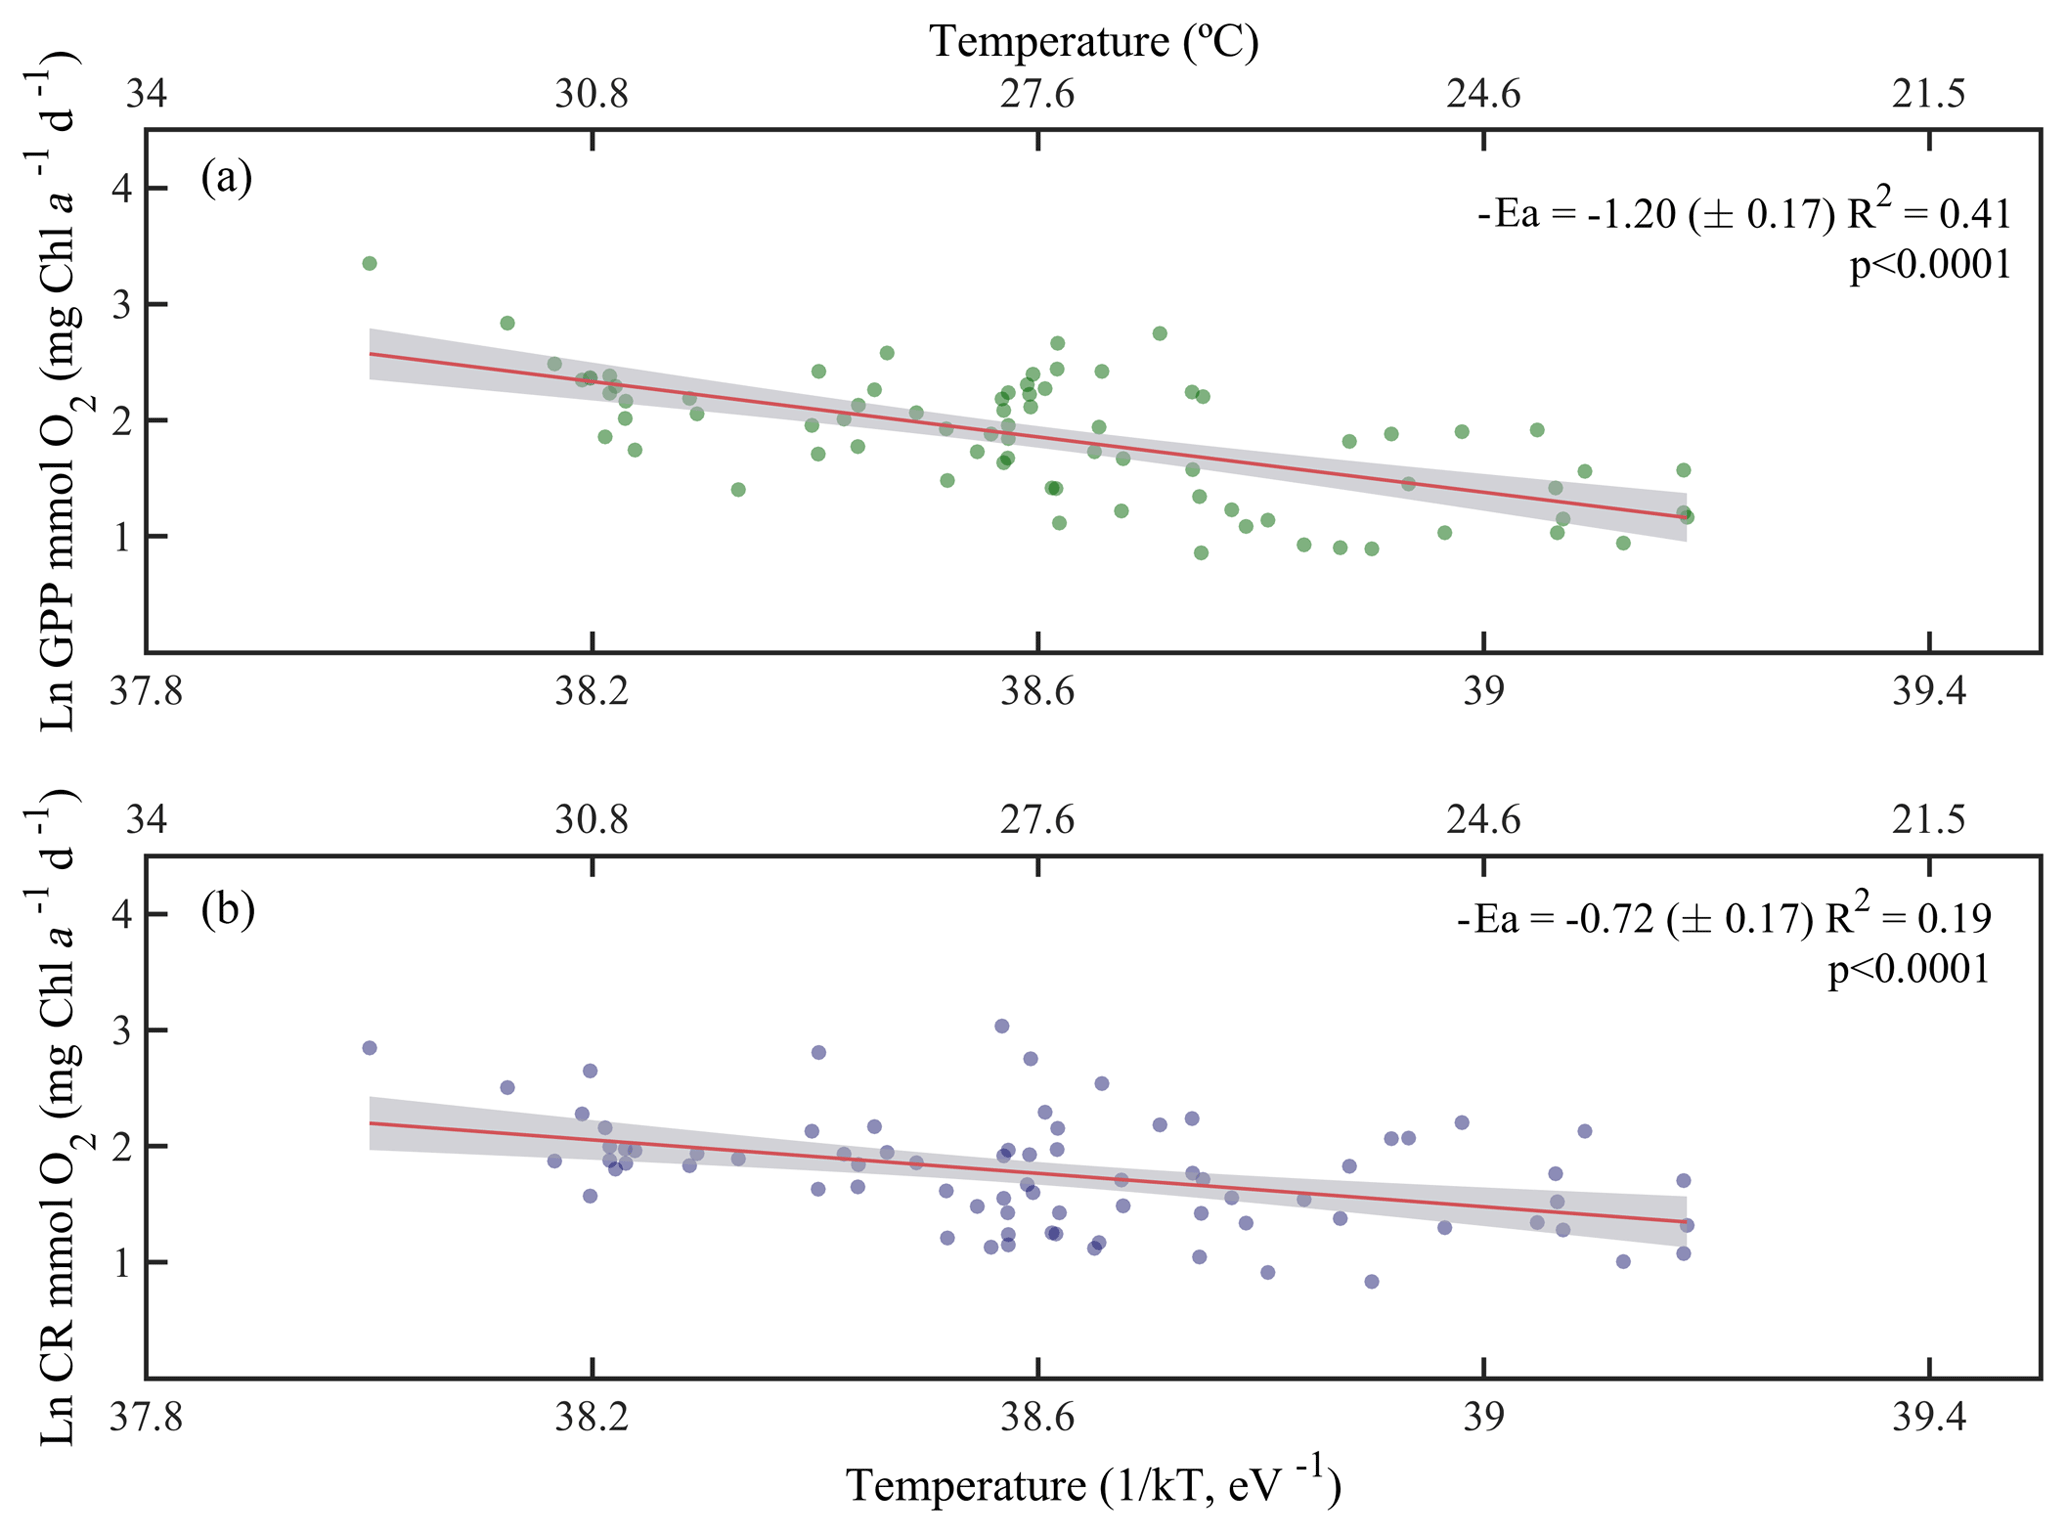
Figure 7Arrhenius plots indicating temperature dependence of planktonic metabolic rates plotted as the relationship between the natural logarithm of (a) chlorophyll a-normalised gross primary production and (b) chlorophyll a-normalised planktonic community respiration with temperature as a function of 1∕kT (lower axis), where k is the Boltzmann's constant ( eV K−1), and T denotes the absolute temperature (K). The corresponding temperatures in degree Celsius are shown in the upper axis for each graph. The solid red line is the linear least square fit and the shaded grey area represents the 95 % confidence interval. Ea represents the activation energy (Ea= negative slope).
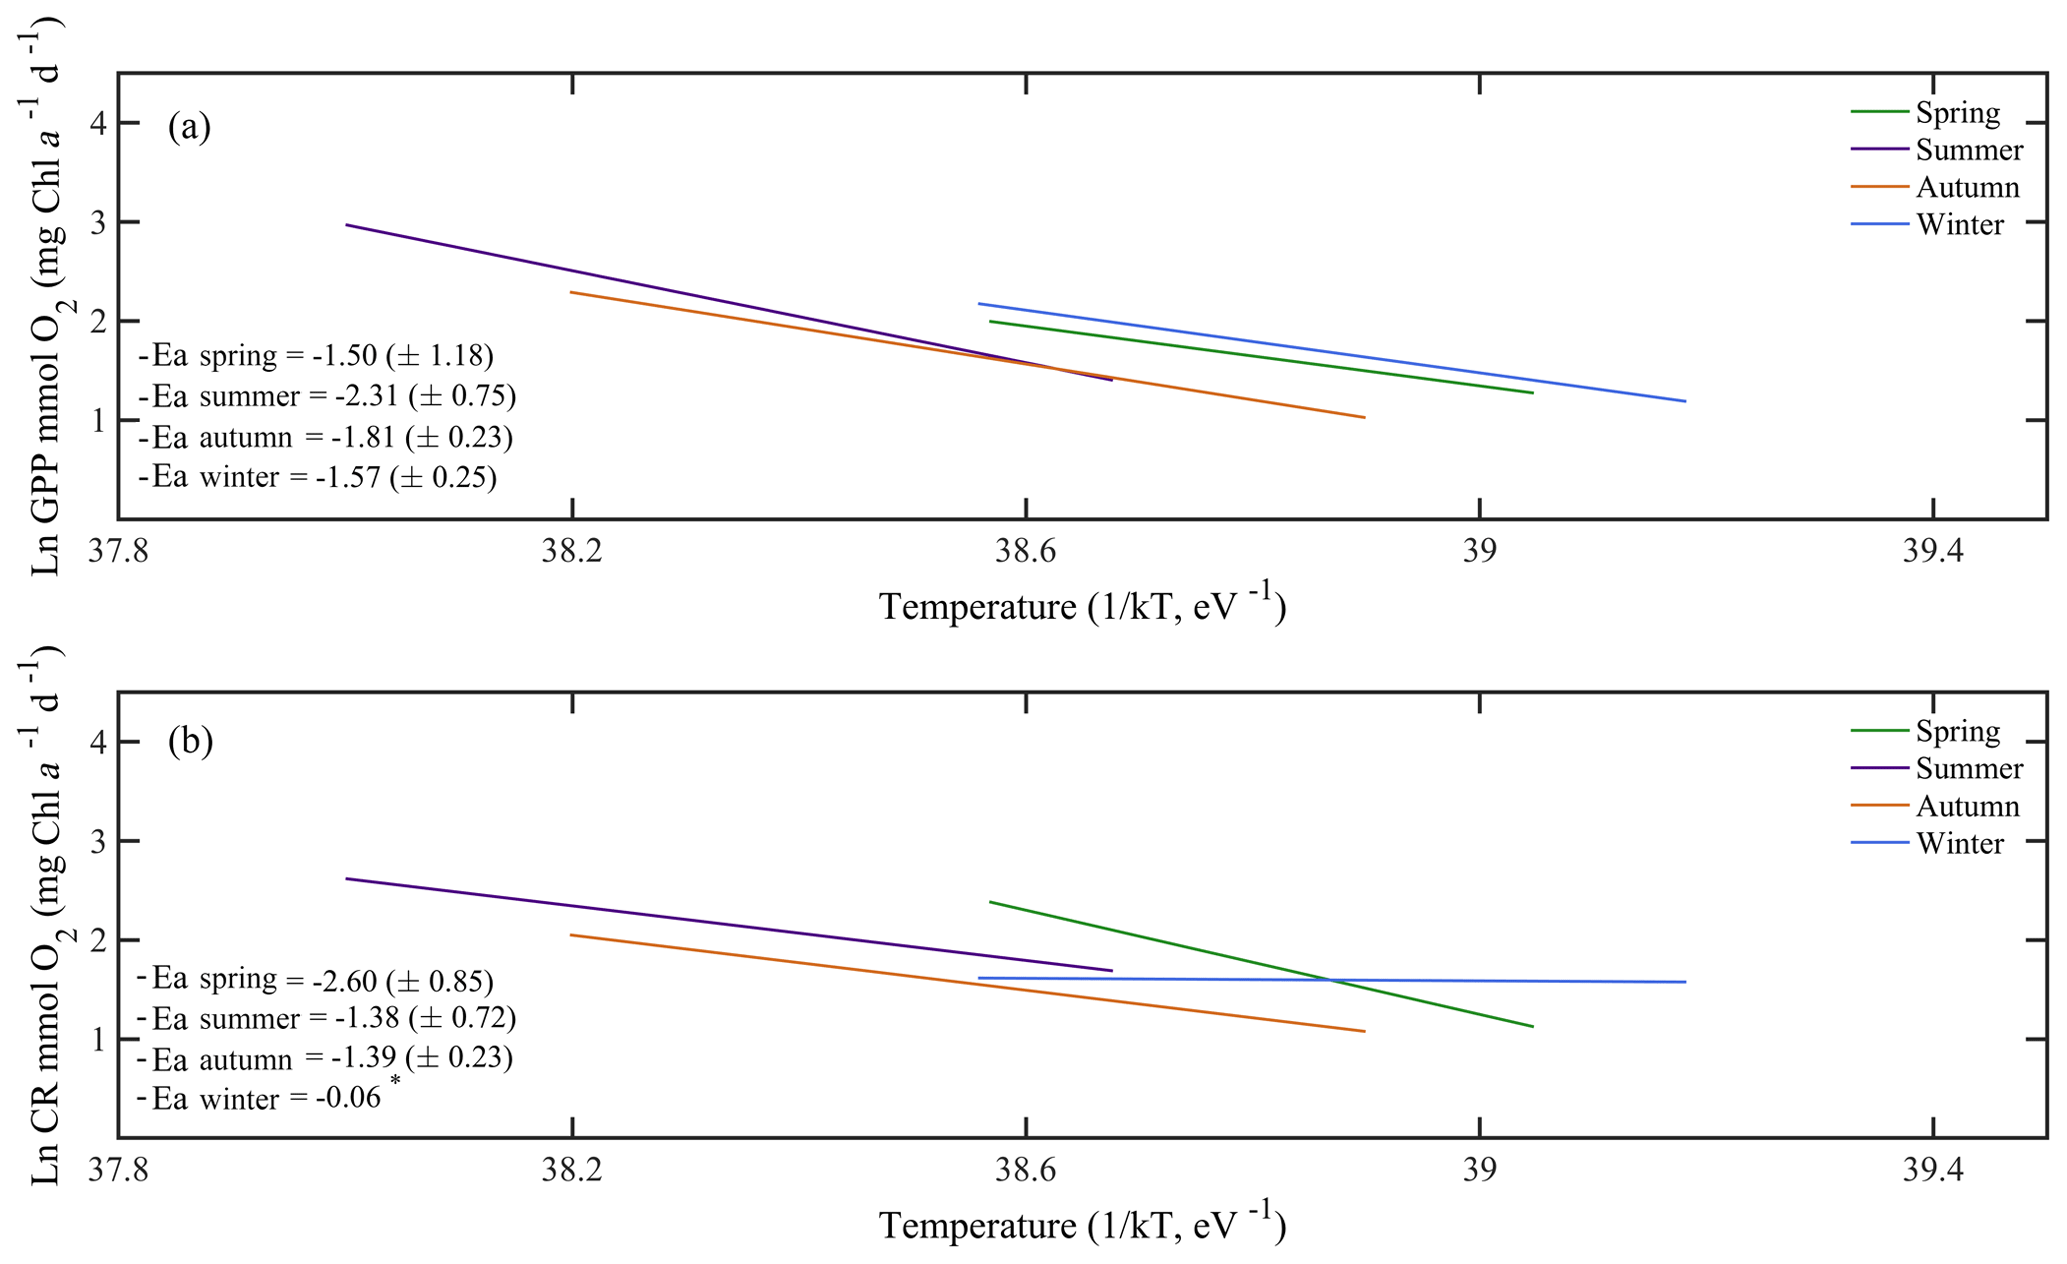
Figure 8Arrhenius plots indicating the seasonal temperature dependence of planktonic metabolic rates plotted as the relationship between the natural logarithm of (a) chlorophyll a-normalised gross primary production and (b) planktonic community respiration with temperature as a function of 1∕kT (lower axis), where k is the Boltzmann's constant ( eV K−1), and T denotes the absolute temperature (K). Each line represents the linear least square fit. Ea represents the activation energy (Ea= negative slope).
4.1 Variability of plankton community metabolic rates along the Red Sea
Our results demonstrate that planktonic metabolic rates are markedly different between the southern and northern regimes of the Red Sea, with a northward increase in the overall mean GPP and CR by factors of 5 and 4, respectively (i.e. an absolute increase in GPP rates of 3.2 mmol O2 m−3 d mgC m−3 d−1, while absolute CR rates increased by 2.2 mmol O2 m−3 d mgC m−3 d−1). Although, sensu stricto, the overall balance between autotrophic metabolism and planktonic community respiration (i.e. NCP) indicated a prevalence of autotrophic communities during our samplings along the Red Sea. Heterotrophic communities prevailed during the spring, and in the northern stations during the summer, which highlights the shift in the trophic conditions in the basin. Consistent with these findings, our data revealed that the GPP threshold that separated autotrophic from heterotrophic communities in the Red Sea (1.7 mmol O2 m−3 d−1) is similar to that reported across oceanic communities elsewhere (Duarte and Agustí, 1998; Duarte and Regaudie-de-Gioux, 2009), agreeing with the oligotrophic characteristics that govern the basin at certain periods or locations. The latitudinal differences depicted in our results mirror the increasing north–south pattern in Chl a concentration and photosynthetic carbon fixation rates previously reported for the Red Sea (Acker et al., 2008; Raitsos et al., 2013; Qurban et al., 2014; Kheireddine et al., 2017), which are supported by the presence of different planktonic communities (Al-aidaroos et al., 2016; Pearman et al., 2016; Robitzch et al., 2016; Kheireddine et al., 2017; Kottuparambil and Agusti, 2018).
The lower productivity of the northern section of the Red Sea explains the dominance of heterotrophic communities therein. Still, sustaining heterotrophy in oligotrophic regions requires an allochthonous source of organic matter (Duarte et al., 2011, 2013). The arid nature of the northern Red Sea, with the watershed consisting mostly of deserts, leads to the absence of rivers and significant organic carbon inputs to the sea. Dust inputs are important, however, and whereas they have shown no effect on primary production (Torfstein and Kienast, 2018), they are a source of organic carbon (Jurado et al., 2009) that can partially supply the organic matter required to sustain heterotrophic communities. Moreover, the Red Sea supports highly productive coral reefs, mangrove forests, seagrass meadows, and algal communities in its extensive shallow coastal areas (Rasul et al., 2015; Almahasheer et al., 2016), which may export significant organic carbon to the pelagic compartment, thereby helping to sustain heterotrophic plankton communities in the northern Red Sea.
4.2 Temperature and metabolic balance in the Red Sea
Temperature is a master variable that regulates many components of ocean dynamics, such as vertical stratification and most aspects of organismal biology, from setting boundaries in the distribution of organisms (Clarke, 1996) to controlling biochemical reactions that constrain the energy for metabolic processes (Gillooly et al., 2001). Hence, temperature is likely a significant driver of metabolic processes in the Red Sea, one of the warmest tropical marine ecosystems (Raitsos et al., 2011; Chaidez et al., 2017). Indeed, our results showed a positive response of planktonic metabolism to temperature. Moreover, the functional relationships between metabolic rates with temperature suggested that both GPP and CR were positively enhanced with increasing temperature but at a different pace.
The metabolic theory of ecology (MTE) relates the metabolic rate of an organism with its mass and temperature. This theory hypothesises that individual metabolic rates relate to temperature with a relatively constant activation energy (Ea ∼0.63 eV) for a wide range of taxa, from unicellular organisms to plants and animals (Gillooly et al., 2001; Brown et al., 2004). For aerobic respiration, Ea values vary between 0.41 and 0.74 eV at temperatures between 0 and 40 ∘C (Gillooly et al., 2005), while for photosynthetic processes the predicted Ea is lower, ∼0.32 eV (Allen et al., 2005). From a thorough compilation of data obtained for a wide range of marine systems (from polar to subtropical and tropical oceanic regions), Regaudie-de-Gioux and Duarte (2012) found that overall, the activation energies for photosynthetic production (GPP) varied between 0.29 and 0.32 eV, and for respiratory processes (CR) between 0.65 and 0.66 eV.
The Ea for GPP (1.20±0.17 eV) obtained for the Red Sea was higher than the overall value predicted by the MTE, while the Ea values for CR were below those for GPP (0.72±0.17 eV) unlike those observed elsewhere in open oceanic waters (Regaudie-de-Gioux and Duarte, 2011; García-Corral et al., 2017). Furthermore, these Ea values imply that GPP rates increased faster (5.1-fold) than CR rates (2.7-fold), in the Red Sea's thermal range (22–32.5 ∘C). These findings differ with the expected double increase in heterotrophic respiration (regarding photosynthetic processes) with temperature (Harris et al., 2006) but are closer to the results obtained by García-Corral et al. (2017), who recently reported Ea values for GPP of 0.86 , 1.48, and 1.07 eV for the Atlantic, Indian, and Pacific oceans, respectively, while the Ea values for CR found in the Atlantic, Indian, and the Pacific oceans were 0.77, 0.57, and 0.82 eV, respectively.
The apparent contradiction between our findings and the general patterns predicted by the MTE is, however, not surprising. In their model, Allen et al. (2005) predict the activation energy of photosynthesis per chloroplast (for temperatures between 0 and 30 ∘C) using the temperature-dependence parameters obtained by Bernacchi et al. (2001) for RuBisCO carboxylation rates in one species (tobacco leaves). Although the temperature range selected by Allen et al. (2005) comprises the optimum temperatures of growth rates for a wide range of functional groups of marine primary producers (Chen, 2015; Thomas et al., 2016), the temperature observed in the Red Sea exceeded this range. Due to the fast generation times of microbes (Collins, 2010), we can expect that photosynthetic planktonic communities are acclimated or even locally adapted to the thermal conditions they experience. So by favouring certain photosynthetic or thermal traits, they can enhance their metabolism and growth to the ambient temperature, up to their thermal optimum (Galmés et al., 2015; Thomas et al., 2016). Therefore, it is likely that the acclimation or local adaptation (in the long term) of photosynthetic traits in Red Sea plankton optimises the metabolic response at the high temperatures reached, resulting in a steeper response to temperature than predicted by the MTE. Moreover, as the trait responses to temperature vary among phylogenetic groups (Galmés et al., 2015, 2016; Thomas et al., 2016), we anticipated a certain degree of discrepancy if we characterise the photosynthetic response (GPP) of planktonic communities by considering only one trait (i.e. RuBisCO carboxylation) of one species.
However, we must bear in mind that the metabolic response of individuals is not only temperature dependent, and that resource supply also plays an essential role (Brown et al., 2004; Allen and Gillooly, 2009). Our results provide evidence that the increased response of planktonic metabolism towards warmer temperatures was mostly confined to the southern half of the Red Sea, which receives the direct inflow of the enriched Intermediate Water coming from the Gulf of Aden during the winter monsoon (Raitsos et al., 2015; Wafar et al., 2016). Recent findings have demonstrated that mass-specific carbon fixation rates of phytoplankton communities can be enhanced with increasing temperature when nutrients are not limiting their growth (Marañón et al., 2014, 2018). Therefore, it is likely that the intertwined effect of both the warmer temperatures and the higher nutrient availability towards the south of the Red Sea are key drivers regulating the metabolic response of planktonic communities. Thus, unlike the global ocean, where nutrient concentration is inversely correlated with temperature (e.g. Agawin et al., 2000), in the Red Sea nutrient concentration and temperature are positively correlated. This anomaly may explain the steep increase in Ea for GPP, as primary producers in the warmer region are being supported by the inflow of nutrient-enriched waters from the Indian Ocean.
The elevated Ea for GPP compared to CR in Red Sea plankton is also an anomaly, likely associated with the lack of allochthonous nutrient supply due to the absence of rivers and vegetation in the arid watershed of the Red Sea. The warm oligotrophic ocean is characterised by plankton communities that are in metabolic balance or net metabolically imbalanced (Duarte and Agusti, 2008; Duarte et al., 2013). In contrast, the warm southern Red Sea tends to support autotrophic metabolism, sustained by the input of nutrient-enriched waters while low allochthonous carbon inputs may constrain CR. As a result, NCP tends to increase, rather than decrease with increasing temperature (Regaudie-de-Gioux and Duarte, 2011; García-Corral et al., 2017). These patterns in plankton metabolism in the oligotrophic and warm Red Sea deviate from those characterising the subtropical and tropical gyres of the open ocean, but it provides an opportunity to explore the mechanistic basis for patterns in plankton metabolism with temperature, which would otherwise remain obscured by the underlying prevalent negative relationship with nutrient concentrations.
Our results show that plankton metabolism in the Red Sea presents a remarkably different pattern compared to other warm and oligotrophic marine systems (e.g. the subtropical and tropical gyres). In this region, autotrophic plankton communities prevailed and are supported by relatively high GPP rates, which are above the threshold separating heterotrophic low-productivity communities from autotrophic ones. Metabolically balanced or net heterotrophic plankton communities dominated in the northern Red Sea, whereas autotrophic communities were predominant in the south supported by nutrient inputs from the Gulf of Aden. Elevated temperatures contributed to the enhanced metabolic activity of planktonic organisms due to the increase in kinetic energy (favouring enzymatic reactions) with temperature. Plankton communities in the Red Sea, however, displayed activation energies for GPP that were higher than those for CR, resulting in a positive relationship between NCP and temperature. Those findings represent anomalies in the relationship between metabolic rates and temperature compared to the warm, oligotrophic open ocean. These anomalies are likely related to the higher nutrient supply from nutrient-rich Indian Ocean waters in the warm southern Red Sea, suggesting that GPP can respond strongly to the temperature in the warm ocean when supported by high nutrient inputs, relative to those in the subtropical gyres.
The authors declare that the data supporting the findings are available within the article and from the authors upon request.
DCLS, CMD, and SA designed the study; KR and PCdA obtained the data and provided technical support; DCLS analysed the data; DCLS wrote the article with substantial contributions from CMD and SA. All authors discussed the results and commented on the article.
The authors declare that they have no conflict of interest.
The authors thank the editor and the reviewers for their thorough revision and constructive comments that helped to greatly improve the paper.
This research has been supported by the King Abdullah University of Science and Technology (grant nos. BAS/1/1071-01-01 assigned to CMD, BAS/1/1072-01-01 assigned to SA, and FCC/1/1973-21-01 assigned to RSRC).
This paper was edited by Stefano Ciavatta and reviewed by two anonymous referees.
Acker, J., Leptoukh, G., Shen, S., Zhu, T., and Kempler, S.: Remotely-sensed chlorophyll a observations of the northern Red Sea indicate seasonal variability and influence of coastal reefs, J. Marine Syst., 69, 191–204, https://doi.org/10.1016/j.jmarsys.2005.12.006, 2008.
Agawin, N. S., Duarte, C. M., and Agustí, S.: Nutrient and temperature control of the contribution of picoplankton to phytoplankton biomass and production, Limno. Oceanogr., 45, 591–600, 2000.
Al-aidaroos, A. M., Karati, K. K., El-sherbiny, M. M., Devassy, R. P., and Kürten, B.: Latitudinal environmental gradients and diel variability influence abundance and community structure of Chaetognatha in Red Sea coral reefs, Syst. Biodivers., 15, 35–48, https://doi.org/10.1080/14772000.2016.1211200, 2016.
Allen, A., Gillooly, J., and Brown, J.: Linking the global carbon cycle to individual metabolism, Funct. Ecol., 19, 202–213, 2005.
Allen, A. P. and Gillooly, J. F.: Towards an integration of ecological stoichiometry and the metabolic theory of ecology to better understand nutrient cycling, Ecol. Lett., 12, 369–384, https://doi.org/10.1111/j.1461-0248.2009.01302.x, 2009.
Almahasheer, H., Abdulaziz, A., and Duarte, C. M.: Decadal stability of Red Sea mangroves, Estuar. Coast. Shelf Sci., 169, 164–172, 2016.
Almahasheer, H., Duarte, C. M., and Irigoien, X.: Leaf Nutrient Resorption and Export Fluxes of Avicennia marina in the Central Red Sea Area, Front. Mar. Sci., 5, 204, https://doi.org/10.3389/fmars.2018.00204, 2018.
Barrón, C. and Duarte, C. M.: Dissolved organic carbon pools and export from the coastal ocean, Global Biogeochem. Cy., 29, 1725–1738, 2015.
Bender, M., Orchardo, J., Dickson, M.-L., Barber, R., and Lindley, S.: In vitro O 2 fluxes compared with 14C production and other rate terms during the JGOFS Equatorial Pacific experiment, Deep-Sea Res. Pt. I, 46, 637–654, 1999.
Bernacchi, C., Singsaas, E., Pimentel, C., Portis Jr., A., and Long, S.: Improved temperature response functions for models of Rubisco-limited photosynthesis, Plant Cell Environ., 24, 253–259, 2001.
Brown, J. H., Gillooly, J. F., Allen, A. P., Savage, V. M., and West, G. B.: Toward a metabolic theory of ecology, Ecology, 85, 1771–1789, 2004.
Carpenter, J. H.: The accuracy of the Winkler method for dissolved oxygen analysis, Limnol. Oceanogr., 10, 135–140, 1965.
Chaidez, V., Dreano, D., Agusti, S., Duarte, C. M., and Hoteit, I.: Decadal trends in Red Sea maximum surface temperature, Sci. Rep., 7, 8144, https://doi.org/10.1038/s41598-017-08146-z, 2017.
Chen, B.: Patterns of thermal limits of phytoplankton, J. Plankton Res., 37, 285–292, https://doi.org/10.1093/plankt/fbv009, 2015.
Chen, Y., Mills, S., Street, J., Golan, D., Post, A., Jacobson, M., and Paytan, A.: Estimates of atmospheric dry deposition and associated input of nutrients to Gulf of Aqaba seawater, J. Geophys. Res.-Atmos., 112, D04309, https://doi.org/10.1029/2006JD007858, 2007.
Clarke, A.: The influence of climate change on the distribution and evolution of organisms, in: Animals and Temperature. Phenotypic and Evolutionary Adaptation, edited by: Johnston, I. A., and Bennett, A. F., Soceity for Experimental Biology seminar series, Cambridge University Press, Cambridge 377–407, 1996.
Collins, S.: Many Possible Worlds: Expanding the Ecological Scenarios in Experimental Evolution, Evol. Biol., 38, 3–14, https://doi.org/10.1007/s11692-010-9106-3, 2010.
Cullen, J.: Primary production methods, in: Encyclopedia of Ocean Sciences, edited by: Steele, J. H., Academic Press, 2001.
Del Giorgio, P. A., Cole, J. J., and Cimbleris, A.: Respiration rates in bacteria exceed phytoplankton production in unproductive aquatic systems, Nature, 385, 148–151, 1997.
Duarte, C. M. and Agustí, S.: The CO2 balance of unproductive aquatic ecosystems, Science, 281, 234–236, 1998.
Duarte, C. M. and Regaudie-de-Gioux, A.: Thresholds of gross primary production for the metabolic balance of marine planktonic communities, Limnol. Oceanogr., 54, 1015–1022, 2009.
Duarte, C. M., Regaudie-de-Gioux, A., Arrieta, J. M., Delgado-Huertas, A., and Agustí, S.: The Oligotrophic Ocean Is Heterotrophic, Annu. Rev. Mar. Sci., 5, 551–569, https://doi.org/10.1146/annurev-marine-121211-172337, 2013.
Ducklow, H. W., Dickson, M.-L., Kirchman, D. L., Steward, G., Orchardo, J., Marra, J., and Azam, F.: Constraining bacterial production, conversion efficiency and respiration in the Ross Sea, Antarctica, January–February, 1997, Deep-Sea Res. Pt. II, 47, 3227–3247, 2000.
Ducklow, H. W. and Doney, S. C.: What is the metabolic state of the oligotrophic ocean? A debate, Ann. Rev. Mar. Sci., 5, 525–533, https://doi.org/10.1146/annurev-marine-121211-172331, 2013.
Engelbrecht, J. P., Stenchikov, G., Prakash, P. J., Lersch, T., Anisimov, A., and Shevchenko, I.: Physical and chemical properties of deposited airborne particulates over the Arabian Red Sea coastal plain, Atmos. Chem. Phys., 17, 11467–11490, https://doi.org/10.5194/acp-17-11467-2017, 2017.
Galmés, J., Kapralov, M., Copolovici, L., Hermida-Carrera, C., and Niinemets, Ü.: Temperature responses of the Rubisco maximum carboxylase activity across domains of life: phylogenetic signals, trade-offs, and importance for carbon gain, Photosynt. Res., 123, 183–201, 2015.
Galmés, J., Hermida-Carrera, C., Laanisto, L., and Niinemets, Ü.: A compendium of temperature responses of Rubisco kinetic traits: variability among and within photosynthetic groups and impacts on photosynthesis modeling, J. Exp. Bot., 67, 5067–5091, 2016.
García-Corral, L. S., Barber, E., Regaudie-de-Gioux, A., Sal, S., Holding, J. M., Agustí, S., Navarro, N., Serret, P., Mozetič, P., and Duarte, C. M.: Temperature dependence of planktonic metabolism in the subtropical North Atlantic Ocean, Biogeosciences, 11, 4529–4540, https://doi.org/10.5194/bg-11-4529-2014, 2014.
García-Corral, L. S., Holding, J. M., Carrillo-de-Albornoz, P., Steckbauer, A., Pérez-Lorenzo, M., Navarro, N., Serret, P., Gasol, J. M., Morán, X. A. G., Estrada, M., Fraile-Nuez, E., Benítez-Barrios, V., Agusti, S., and Duarte, C. M.: Temperature dependence of plankton community metabolism in the subtropical and tropical oceans, Global Biogeochem. Cy., 31, 1141–1154, https://doi.org/10.1002/2017gb005629, 2017.
García-Martín, E. E., Daniels, C. J., Davidson, K., Davis, C. E., Mahaffey, C., Mayers, K. M. J., McNeill, S., Poulton, A. J., Purdie, D. A., Tarran, G. A., and Robinson, C.: Seasonal changes in plankton respiration and bacterial metabolism in a temperate shelf sea, Prog. Oceanogr., https://doi.org/10.1016/j.pocean.2017.12.002, 2017.
Garcias-Bonet, N. and Duarte, C. M.: Methane Production by Seagrass Ecosystems in the Red Sea, Front. Mar. Sci., 4, 304, https://doi.org/10.3389/fmars.2017.00340, 2017.
Gillooly, J. F., Brown, J. H., West, G. B., Savage, V. M., and Charnov, E. L.: Effects of size and temperature on metabolic rate, Science, 293, 2248–2251, 2001.
Gillooly, J. F., Allen, A. P., West, G. B., and Brown, J. H.: The rate of DNA evolution: effects of body size and temperature on the molecular clock, P. Natl. Acad. Sci. USA, 102, 140–145, 2005.
Hansen, H. P. and Koroleff, F.: Determination of nutrients, in: Methods of seawater analysis, edited by: Grasshoff, K., Kremling, K., and M., Ehrhardt, Wiley-VCH Verlag, Weinheim, Germany, 159–228, 1999.
Harris, L. A., Duarte, C. M., and Nixon, S. W.: Allometric laws and prediction in estuarine and coastal ecology, Estuar. Coast., 29, 340–344, 2006.
Jurado, E., Dachs, J., Duarte, C. M., and Simo, R.: Atmospheric deposition of organic and black carbon to the global oceans, Atmos. Environ., 42, 7931–7939, 2008.
Kheireddine, M., Ouhssain, M., Claustre, H., Uitz, J., Gentili, B., and Jones, B.: Assessing pigment-based phytoplankton community distributions in the Red Sea, Front. Mar. Sci., https://doi.org/10.3389/fmars.2017.00132, 2017.
Kottuparambil, S. and Agusti, S.: PAHs sensitivity of picophytoplankton populations in the Red Sea, Environ. Poll., 239, 607–616, 2018.
Kürten, B., Al-Aidaroos, A. M., Kürten, S., El-Sherbiny, M. M., Devassy, R. P., Struck, U., Zarokanellos, N., Jones, B. H., Hansen, T., Bruss, G., and Sommer, U.: Carbon and nitrogen stable isotope ratios of pelagic zooplankton elucidate ecohydrographic features in the oligotrophic Red Sea, Prog. Oceanogr., 140, 69–90, https://doi.org/10.1016/j.pocean.2015.11.003, 2016.
Levanon-Spanier, I., Padan, E., and Reiss, Z.: Primary production in a desert-enclosed sea – the Gulf of Elat (Aqaba), Red Sea, Deep-Sea Res. Pt. A, 26, 673–685, 1979.
López-Sandoval, D. C., Delgado-Huertas, A., Carrillo-de-Albornoz, P., Duarte, C. M., and Agustí, S.: Use of cavity ring-down spectrometry to quantify 13C-primary productivity in oligotrophic waters, Limnol. Oceanogr., 17, 137–144, https://doi.org/10.1002/lom3.10305, 2019.
López-Urrutia, Á., San Martin, E., Harris, R. P., and Irigoien, X.: Scaling the metabolic balance of the oceans, P. Natl. Acad. Sci. USA, 103, 8739–8744, 2006.
Marañón, E., Cermeño, P., Huete-Ortega, M., López-Sandoval, D. C., Mouriño-Carballido, B., and Rodríguez-Ramos, T.: Resource supply overrides temperature as a controlling factor of marine phytoplankton growth, PloS one, 9, e99312, https://doi.org/10.1371/journal.pone.0099312, 2014.
Marañón, E., Lorenzo, M. P., Cermeño, P., and Mouriño-Carballido, B.: Nutrient limitation suppresses the temperature dependence of phytoplankton metabolic rates, The ISME journal, 12, 1836–1845, 2018.
Osman, E. O., Smith, D. J., Ziegler, M., Kürten, B., Conrad, C., El-Haddad, K. M., Voolstra, C. R., and Suggett, D. J.: Thermal refugia against coral bleaching throughout the northern Red Sea, Glob. Change Biol., 24, 474–484, 2018.
Oudot, C., Gerard, R., Morin, P., and Gningue, I.: Precise shipboard determination of dissolved oxygen (Winkler procedure) for productivity studies with a commercial system1, Limnol. Oceanogr., 33, 146–150, 1988.
Pearman, J. K., Kürten, S., Sarma, Y., Jones, B., and Carvalho, S.: Biodiversity patterns of plankton assemblages at the extremes of the Red Sea, FEMS Microbiol. Ecol., 92, fiw002, https://doi.org/10.1093/femsec/fiw002, 2016.
Qurban, M. A., Balala, A. C., Kumar, S., Bhavya, P. S., and Wafar, M.: Primary production in the northern Red Sea, J. Marine Syst., 132, 75–82, https://doi.org/10.1016/j.jmarsys.2014.01.006, 2014.
Qurban, M. A., Wafar, M., Jyothibabu, R., and Manikandan, K. P.: Patterns of primary production in the Red Sea, J. Marine Syst., 169, 87–98, https://doi.org/10.1016/j.jmarsys.2016.12.008, 2017.
Rahav, E., Herut, B., Mulholland, M. R., Belkin, N., Elifantz, H., and Berman-Frank, I.: Heterotrophic and autotrophic contribution to dinitrogen fixation in the Gulf of Aqaba, Mar. Ecol. Prog. Ser., 522, 67–77, 2015.
Raitsos, D. E., Hoteit, I., Prihartato, P. K., Chronis, T., Triantafyllou, G., and Abualnaja, Y.: Abrupt warming of the Red Sea, Geophys. Res. Lett., 38, L14601, https://doi.org/10.1029/2011gl047984, 2011.
Raitsos, D. E., Pradhan, Y., Brewin, R. J., Stenchikov, G., and Hoteit, I.: Remote sensing the phytoplankton seasonal succession of the Red Sea, PLoS One, 8, e64909, https://doi.org/10.1371/journal.pone.0064909, 2013.
Raitsos, D. E., Yi, X., Platt, T., Racault, M.-F., Brewin, R. J. W., Pradhan, Y., Papadopoulos, V. P., Sathyendranath, S., and Hoteit, I.: Monsoon oscillations regulate fertility of the Red Sea, Geophys. Res. Lett., 42, 855–862, https://doi.org/10.1002/2014gl062882, 2015.
Rasul, N. M., Stewart, I. C., and Nawab, Z. A.: Introduction to the Red Sea: its origin, structure and environment, in: The Red Sea, edited by: Rasul, N. M. and Stewart, I. C., Springer, Berlin, 1–28, 2015.
Regaudie-de-Gioux, A. and Duarte, C. M.: Temperature dependence of planktonic metabolism in the ocean, Global Biogeochem. Cy., 26, GB1015, https://doi.org/10.1029/2010GB003907, 2012.
Regaudie-de-Gioux, A. and Duarte, C. M.: Global patterns in oceanic planktonic metabolism, Limnol. Oceanogr., 58, 977–986, https://doi.org/10.4319/lo.2013.58.3.0977, 2013.
Robinson, C. and Williams, P. J. l. B.: Plankton net community production and dark respiration in the Arabian Sea during September 1994, Deep-Sea Res. Pt. II, 46, 745–765, 1999.
Robinson, C. and Williams, P. l. B.: Respiration and its measurement in surface marine waters, in: Respiration in aquatic ecosystems, edited by: del Giorgio, P. and Williams, P., Oxford University Press, Oxford, 147–180, 2005.
Robinson, C., Serret, P., Tilstone, G., Teira, E., Zubkov, M. V., Rees, A. P., and Woodward, E. M. S.: Plankton respiration in the eastern Atlantic Ocean, Deep-Sea Res. Pt. I, 49, 787–813, 2002.
Robitzch, V. S., Lozano-Cortes, D., Kandler, N. M., Salas, E., and Berumen, M. L.: Productivity and sea surface temperature are correlated with the pelagic larval duration of damselfishes in the Red Sea, Mar. Pollut. Bull., 105, 566–574, https://doi.org/10.1016/j.marpolbul.2015.11.045, 2016.
Serret, P., Robinson, C., Fernández, E., Teira, E., and Tilstone, G.: Latitudinal variation of the balance between plankton photosynthesis and respiration in the eastern Atlantic Ocean, Limnol. Oceanogr., 46, 1642–1652, 2001.
Serret, P., Robinson, C., Fernández, E., Teira, E., Tilstone, G., and Pérez, V.: Predicting plankton net community production in the Atlantic Ocean, Deep-Sea Res. Pt. II, 56, 941–953, 2009.
Smith, S., and Mackenzie, F.: The ocean as a net heterotrophic system: implications from the carbon biogeochemical cycle, Global Biogeochem. Cy., 1, 187–198, 1987.
Smith, S. and Hollibaugh, J.: Coastal metabolism and the oceanic organic carbon balance, Rev. Geophys., 31, 75–89, 1993.
Sofianos, S. S.: An Oceanic General Circulation Model (OGCM) investigation of the Red Sea circulation, 1. Exchange between the Red Sea and the Indian Ocean, J. Geophys. Res., 107, 3196, https://doi.org/10.1029/2001jc001184, 2002.
Sofianos, S. S. and Johns, W. E.: Observations of the summer Red Sea circulation, J. Geophys. Res., 112, C06025, https://doi.org/10.1029/2006jc003886, 2007.
Sofianos, S. S. and Johns, W. E.: Water mass formation, overturning circulation, and the exchange of the Red Sea with the adjacent basins, in: The Red Sea, Springer, 343–353, 2015.
Thomas, M. K., Kremer, C. T., and Litchman, E.: Environment and evolutionary history determine the global biogeography of phytoplankton temperature traits, Glob. Ecol. Biogeogr., 25, 75–86, https://doi.org/10.1111/geb.12387, 2016.
Tilstra, A., van Hoytema, N., Cardini, U., Bednarz, V. N., Rix, L., Naumann, M. S., Al-Horani, F. A., and Wild, C.: Effects of water column mixing and stratification on planktonic primary production and dinitrogen fixation on a northern Red Sea coral reef, Front. Microbiol., 9, 2351, https://doi.org/10.3389/fmicb.2018.02351, 2018.
Torfstein, A. and Kienast, S.: No Correlation Between Atmospheric Dust and Surface Ocean Chlorophyll-a in the Oligotrophic Gulf of Aqaba, Northern Red Sea, J. Geophys. Res.-Biogeo., 123, 391–405, 2018.
Wafar, M., Qurban, M. A., Ashraf, M., Manikandan, K., Flandez, A. V., and Balala, A. C.: Patterns of distribution of inorganic nutrients in Red Sea and their implications to primary production, J. Marine Syst., 156, 86–98, 2016.
Williams, P.: On the definition of plankton production terms, ICES marine science symposia, La Rochelle, 9–19, 1993.
Williams, P., Raine, R. C. T., and Bryan, J. R.: Agreement between the c-14 and oxygen methods of measuring phytoplankton production-reassessment of the photosynthetic quotient, Oceanol. Acta, 2, 411–416, 1979.
Williams, P. l. B.: The balance of plankton respiration and photosynthesis in the open oceans, Nature, 394, 55–57, 1998.
Williams, P. l. B. and del Giorgio, P. A.: Respiration in aquatic ecosystems: history and background, in: Respiration in aquatic ecosystems, edited by: del Giorgio, P. and Williams, P., Oxford University Press, Oxford, 1–17, 2005.
Zarokanellos, N., Papadopoulos, V. P., Sofianos, S., and Jones, B.: Physical and biological characteristics of the winter-summer transition in the Central Red Sea, J. Geophys. Res.-Ocean., 122, 6355–6370, https://doi.org/10.1002/2017jc012882, 2017.