the Creative Commons Attribution 4.0 License.
the Creative Commons Attribution 4.0 License.
 | 29 Aug 2019
Attribution of N2O sources in a grassland soil with laser spectroscopy based isotopocule analysis
Benjamin Wolf
Eliza Harris
Rainer Gasche
Longfei Yu
Ralf Kiese
Sarah Eggleston
Klaus Butterbach-Bahl
Matthias Zeeman
Béla Tuzson
Lukas Emmenegger
Johan Six
Stephan Henne
Joachim Mohn
Nitrous oxide (N2O) is the primary atmospheric constituent involved in stratospheric ozone depletion and contributes strongly to changes in the climate system through a positive radiative forcing mechanism. The atmospheric abundance of N2O has increased from 270 ppb (parts per billion, 10−9 mole mole−1) during the pre-industrial era to approx. 330 ppb in 2018. Even though it is well known that microbial processes in agricultural and natural soils are the major N2O source, the contribution of specific soil processes is still uncertain. The relative abundance of N2O isotopocules (14N14N16N, 14N15N16O, 15N14N16O, and 14N14N18O) carries process-specific information and thus can be used to trace production and consumption pathways. While isotope ratio mass spectroscopy (IRMS) was traditionally used for high-precision measurement of the isotopic composition of N2O, quantum cascade laser absorption spectroscopy (QCLAS) has been put forward as a complementary technique with the potential for on-site analysis. In recent years, pre-concentration combined with QCLAS has been presented as a technique to resolve subtle changes in ambient N2O isotopic composition.
From the end of May until the beginning of August 2016, we investigated N2O emissions from an intensively managed grassland at the study site Fendt in southern Germany. In total, 612 measurements of ambient N2O were taken by combining pre-concentration with QCLAS analyses, yielding δ15Nα, δ15Nβ, δ18O, and N2O concentration with a temporal resolution of approximately 1 h and precisions of 0.46 ‰, 0.36 ‰, 0.59 ‰, and 1.24 ppb, respectively. Soil δ15N- values and concentrations of and were measured to further constrain possible N2O-emitting source processes. Furthermore, the concentration footprint area of measured N2O was determined with a Lagrangian particle dispersion model (FLEXPART-COSMO) using local wind and turbulence observations. These simulations indicated that night-time concentration observations were largely sensitive to local fluxes. While bacterial denitrification and nitrifier denitrification were identified as the primary N2O-emitting processes, N2O reduction to N2 largely dictated the isotopic composition of measured N2O. Fungal denitrification and nitrification-derived N2O accounted for 34 %–42 % of total N2O emissions and had a clear effect on the measured isotopic source signatures. This study presents the suitability of on-site N2O isotopocule analysis for disentangling source and sink processes in situ and found that at the Fendt site bacterial denitrification or nitrifier denitrification is the major source for N2O, while N2O reduction acted as a major sink for soil-produced N2O.
- Article
(4534 KB) - Full-text XML
-
Supplement
(1850 KB) - BibTeX
- EndNote


Nitrous oxide (N2O) is the third most important greenhouse gas (GHG), accounting for 6 % of the total anthropogenic radiative forcing (Myhre et al., 2013), and is thus far the dominant stratospheric-ozone-depleting substance emitted in the 21st century (Ravishankara et al., 2009). Its globally averaged atmospheric concentration has increased since the pre-industrial era from approximately 270 ppb (parts per billion, 10−9 mole mole−1) at an average rate of 0.2 % yr−1–0.3 % yr−1 and reached 328.9±0.1 ppb in 2016 (Prinn et al., 2016; WMO and GAW, 2017). While it is well known that natural and agricultural soils are the major N2O sources on a global scale, the relative contributions of individual microbial and abiotic N2O production and consumption pathways remain largely uncertain because different N2O-producing and N2O-consuming processes are active simultaneously in a soil. Until now, there were no direct methods that allowed for the attribution of an emitted amount of N2O to a given process in the field (IPCC, 2007; Billings, 2008; Butterbach-Bahl et al., 1997, 2013). However, a detailed understanding of the temporal and spatial variations in N2O emissions and controlling processes is required to develop mitigation strategies and to better achieve emission reduction targets (Nishina et al., 2012; Cavigelli et al., 2012; Herrero et al., 2016; Decock et al., 2015).
Atmospheric N2O isotopic composition provides important information about N2O production and consumption processes because distinct microbial and abiotic process pathways exhibit characteristic isotopic signatures (Toyoda et al., 2017; Decock and Six, 2013b; Verhoeven et al., 2019; Denk et al., 2017). Apart from 14N14N16O, representing 99 % of total atmospheric N2O, the three most abundant N2O isotopocules are 14N15N16O (15N at central α position), 15N14N16O (15N at terminal β position), and 14N14N18O (Toyoda and Yoshida, 1999; Kato et al., 1999). Abundances of isotopocules are usually reported in the δ notation in per mil (‰) as δ15Nα, δ15Nβ, and δ18O, calculated according to Eq. (1):
where X denotes 15Nα, 15Nβ, or 18O and R refers to 14N15N16O∕14N14N16O, 15N14N16O∕14N14N16O, or 14N14N18O∕14N14N16O, respectively, in a sample or standard (Toyoda and Yoshida, 1999; Brenninkmeijer and Röckmann, 1999; Werner and Brand, 2001). The international isotope reference scale for 15N∕14N is atmospheric N2 (AIR-N2) and for 18O∕16O Vienna Standard Mean Ocean Water (VSMOW). Thermal decomposition of isotopically characterized ammonium nitrate (NH4NO3) has been suggested as an approach to link the position-dependent nitrogen isotopic composition of N2O to AIR-N2 (Toyoda and Yoshida, 1999; Mohn et al., 2016). The total 15N content is usually reported as bulk 15N content (δ15Nbulk) according to Eq. (2):
while the site preference (SP) is used to denote the intramolecular 15N distribution according to Eq. (3):
The established technique for the analysis of N2O isotopic composition is isotope ratio mass spectrometry (IRMS) (Toyoda and Yoshida, 1999), which is very sensitive and capable of providing highly precise analytical results (Toyoda and Yoshida, 2016). However, IRMS instruments are usually not suitable for field deployment. Recently, quantum cascade laser absorption spectroscopy (QCLAS) (Waechter et al., 2008; McManus et al., 2015), cavity ring-down spectroscopy (CRDS; Erler et al., 2015), and off-axis cavity output spectroscopy (OA-ICOS; Wassenaar et al., 2018) have been introduced as alternatives for greenhouse gas (GHG) stable isotope analysis, with the capability for real-time, on-site analysis even at remote locations (Tuzson et al., 2011; Wolf et al., 2015; Eyer et al., 2016; Röckmann et al., 2016). Another advantage of spectroscopic techniques is their ability for direct selective analysis of intra-molecular isotopic isomers (isotopomers) such as 14N15N16O and 15N14N16O, while the determination of the SP using IRMS is only possible via a detour of measuring δ15N-NO+ in combination with δ15Nbulk and a correcting for scrambling (Toyoda et al., 1999). Several studies have successfully applied QCLAS and CRDS for N2O isotope analysis in laboratory and field incubation experiments (Koster et al., 2013; Yamamoto et al., 2014; Erler et al., 2015; Mohn et al., 2013; Winther et al., 2018) and more recently to analyse diurnal and seasonal isotopic variations in ambient N2O (Mohn et al., 2012; Toyoda et al., 2013; Wolf et al., 2015; Harris et al., 2017). The isotopic composition of N2O emitted from soils can be extracted from ambient air measurements using traditional two endmember mixing models, i.e. the “Keeling plot” approach (Keeling, 1961) or the Miller–Tans approach. While the Keeling plot approach requires stable background conditions, the Miller–Tans approach is also applicable if the stable background requirement is violated (Miller and Tans, 2003). However, the spatial attribution of the extracted N2O isotopic composition has to date been neglected because atmospheric transport and turbulence needs to be considered.
The bulk isotopic composition of N2O produced by biogeochemical source processes, i.e. δ15Nbulk and δ18O, is controlled by fractionation during N2O production, the isotopic composition of N2O precursors (i.e. , , , and H2O), and N2O reduction. In contrast, the difference in 15N substitution between the central and terminal position within the N2O molecule (SP) is independent of the precursor's isotopic composition and characteristic of specific reaction mechanisms or enzymatic pathways (Sutka et al., 2006). Therefore, SP provides distinct process information, which can be determined by pure culture studies and chemical reactions under laboratory conditions (Heil et al., 2014; Wei et al., 2017b; Toyoda et al., 2005). Decock and Six (2013a) and Toyoda et al. (2017) summarized that N2O from hydroxylamine (NH2OH) oxidation, fungal denitrification, and abiotic N2O production on the one hand and N2O originating from nitrifier denitrification and denitrification on the other hand display distinct SP values of 32.8±4.0 ‰ and ‰, respectively. Accordingly, SP values of N2O from mixed microbial communities or abiotic processes may display large variations depending on the prominent reaction pathway and the respective study conditions.
With this study, we aim to improve the understanding of the temporal dynamics of N2O isotopic composition, and to identify the relative contribution of the dominant N2O producing and consuming microbial processes under field conditions. To achieve this, we (i) applied a revised coupled TRace gas EXtractor (TREX) and a QCLAS-based instrumentation (TREX-QCLAS; Ibraim et al., 2018) for the first time during a field campaign for in situ analysis of N2O isotopocules from ambient air samples, (ii) compared two approaches for the calculation of the isotopic composition of N2O emitted from soils, namely the Keeling plot versus the Miller–Tans approach, (iii) include the isotopic composition of an N2O precursor, nitrate (), to support the identification of dominant processes, and (iv) use local turbulence and wind profile measurements to outline the spatial extent for which the determined isotopic compositions of soil-emitted N2O are representative.
2.1 Characterization of the research site Fendt
2.1.1 Study site
The TERENO pre-Alpine Observatory (Kiese et al., 2018) research site Fendt (De-Fen), a typical montane grassland south of Munich (Germany) is situated at 595 m a.s.l. and has an annual mean temperature of 8.9 ∘C with 960 mm mean annual precipitation. The site is intensively managed, which includes up to five cuttings per year for fodder production followed by manure application as well as occasional cattle grazing (Zeeman et al., 2017). Soil characteristics of the site are given in Table 1. These measurements were carried out between 29 May and 3 August 2016 as part of the ScaleX 2016 campaign (Wolf et al., 2017; https://scalex.imk-ifu.kit.edu/, last access: 14 August 2019). During the measurement period, management activities included one cut (4 July 2016) and one manure application event (12 July 2016) with a load of 43.7 kg N ha−1, of which 20 and 23.7 kg were in the form of organic and ammonium N, respectively (Raiffeisen Laborservice, Ormont, Germany). The average footprint area for N2O flux and isotope measurements is given in Fig. 7.
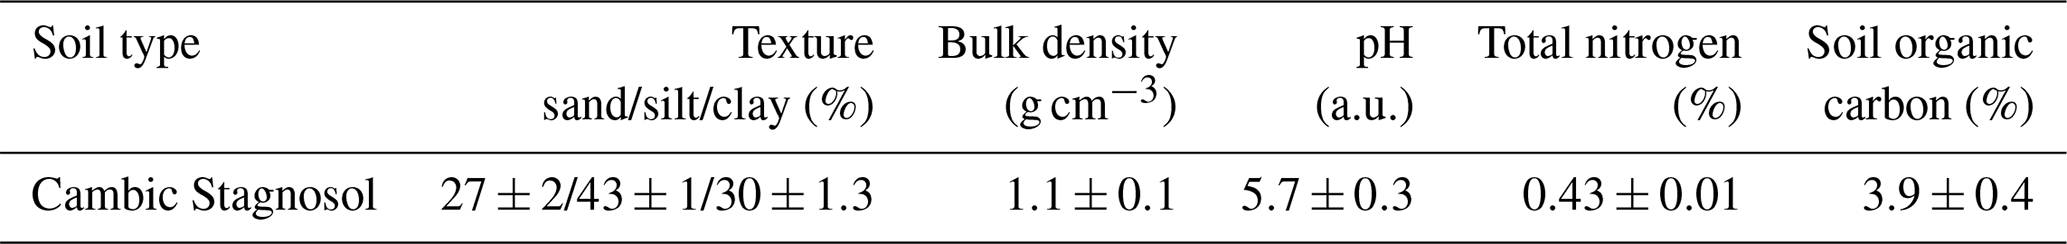
Table 1Soil characterization of the research site Fendt. Values are given for the topsoil (0–10 cm) according to Kiese et al. (2018).
2.1.2 Environmental conditions
Rainfall was determined using four precipitation gauges (rain collector, Davis instruments, Hayward, CA) as indicated in Fig. 1 with triangles. The soil temperature was monitored at three locations across De-Fen (red squares in Fig. 1) at three depths (5, 10, and 15 cm) using PT100 sensors (IMKO, Ettlingen, Germany). Soil water content was determined within the area (locations are indicated by the dashed square in Fig. 1) with five ThetaML2x probes (Delta-T Devices, Cambridge, UK), which integrate soil water content over a soil depth of 0–6 cm. Water-filled pore space (WFPS) was calculated based on measured volumetric water contents and soil characteristics (Kiese et al., 2018). The atmospheric turbulence statistics were determined using the permanently installed micrometeorological instrumentation (Kiese et al., 2018) and additional sonic anemometers installed at 6 and 9 m above ground level (m a.g.l.). Vertical wind profiles were determined up to 1000 m above the ground at 20 m intervals using Doppler wind-lidar systems (StreamLine, Halo Photonics, Worcestershire, United Kingdom).
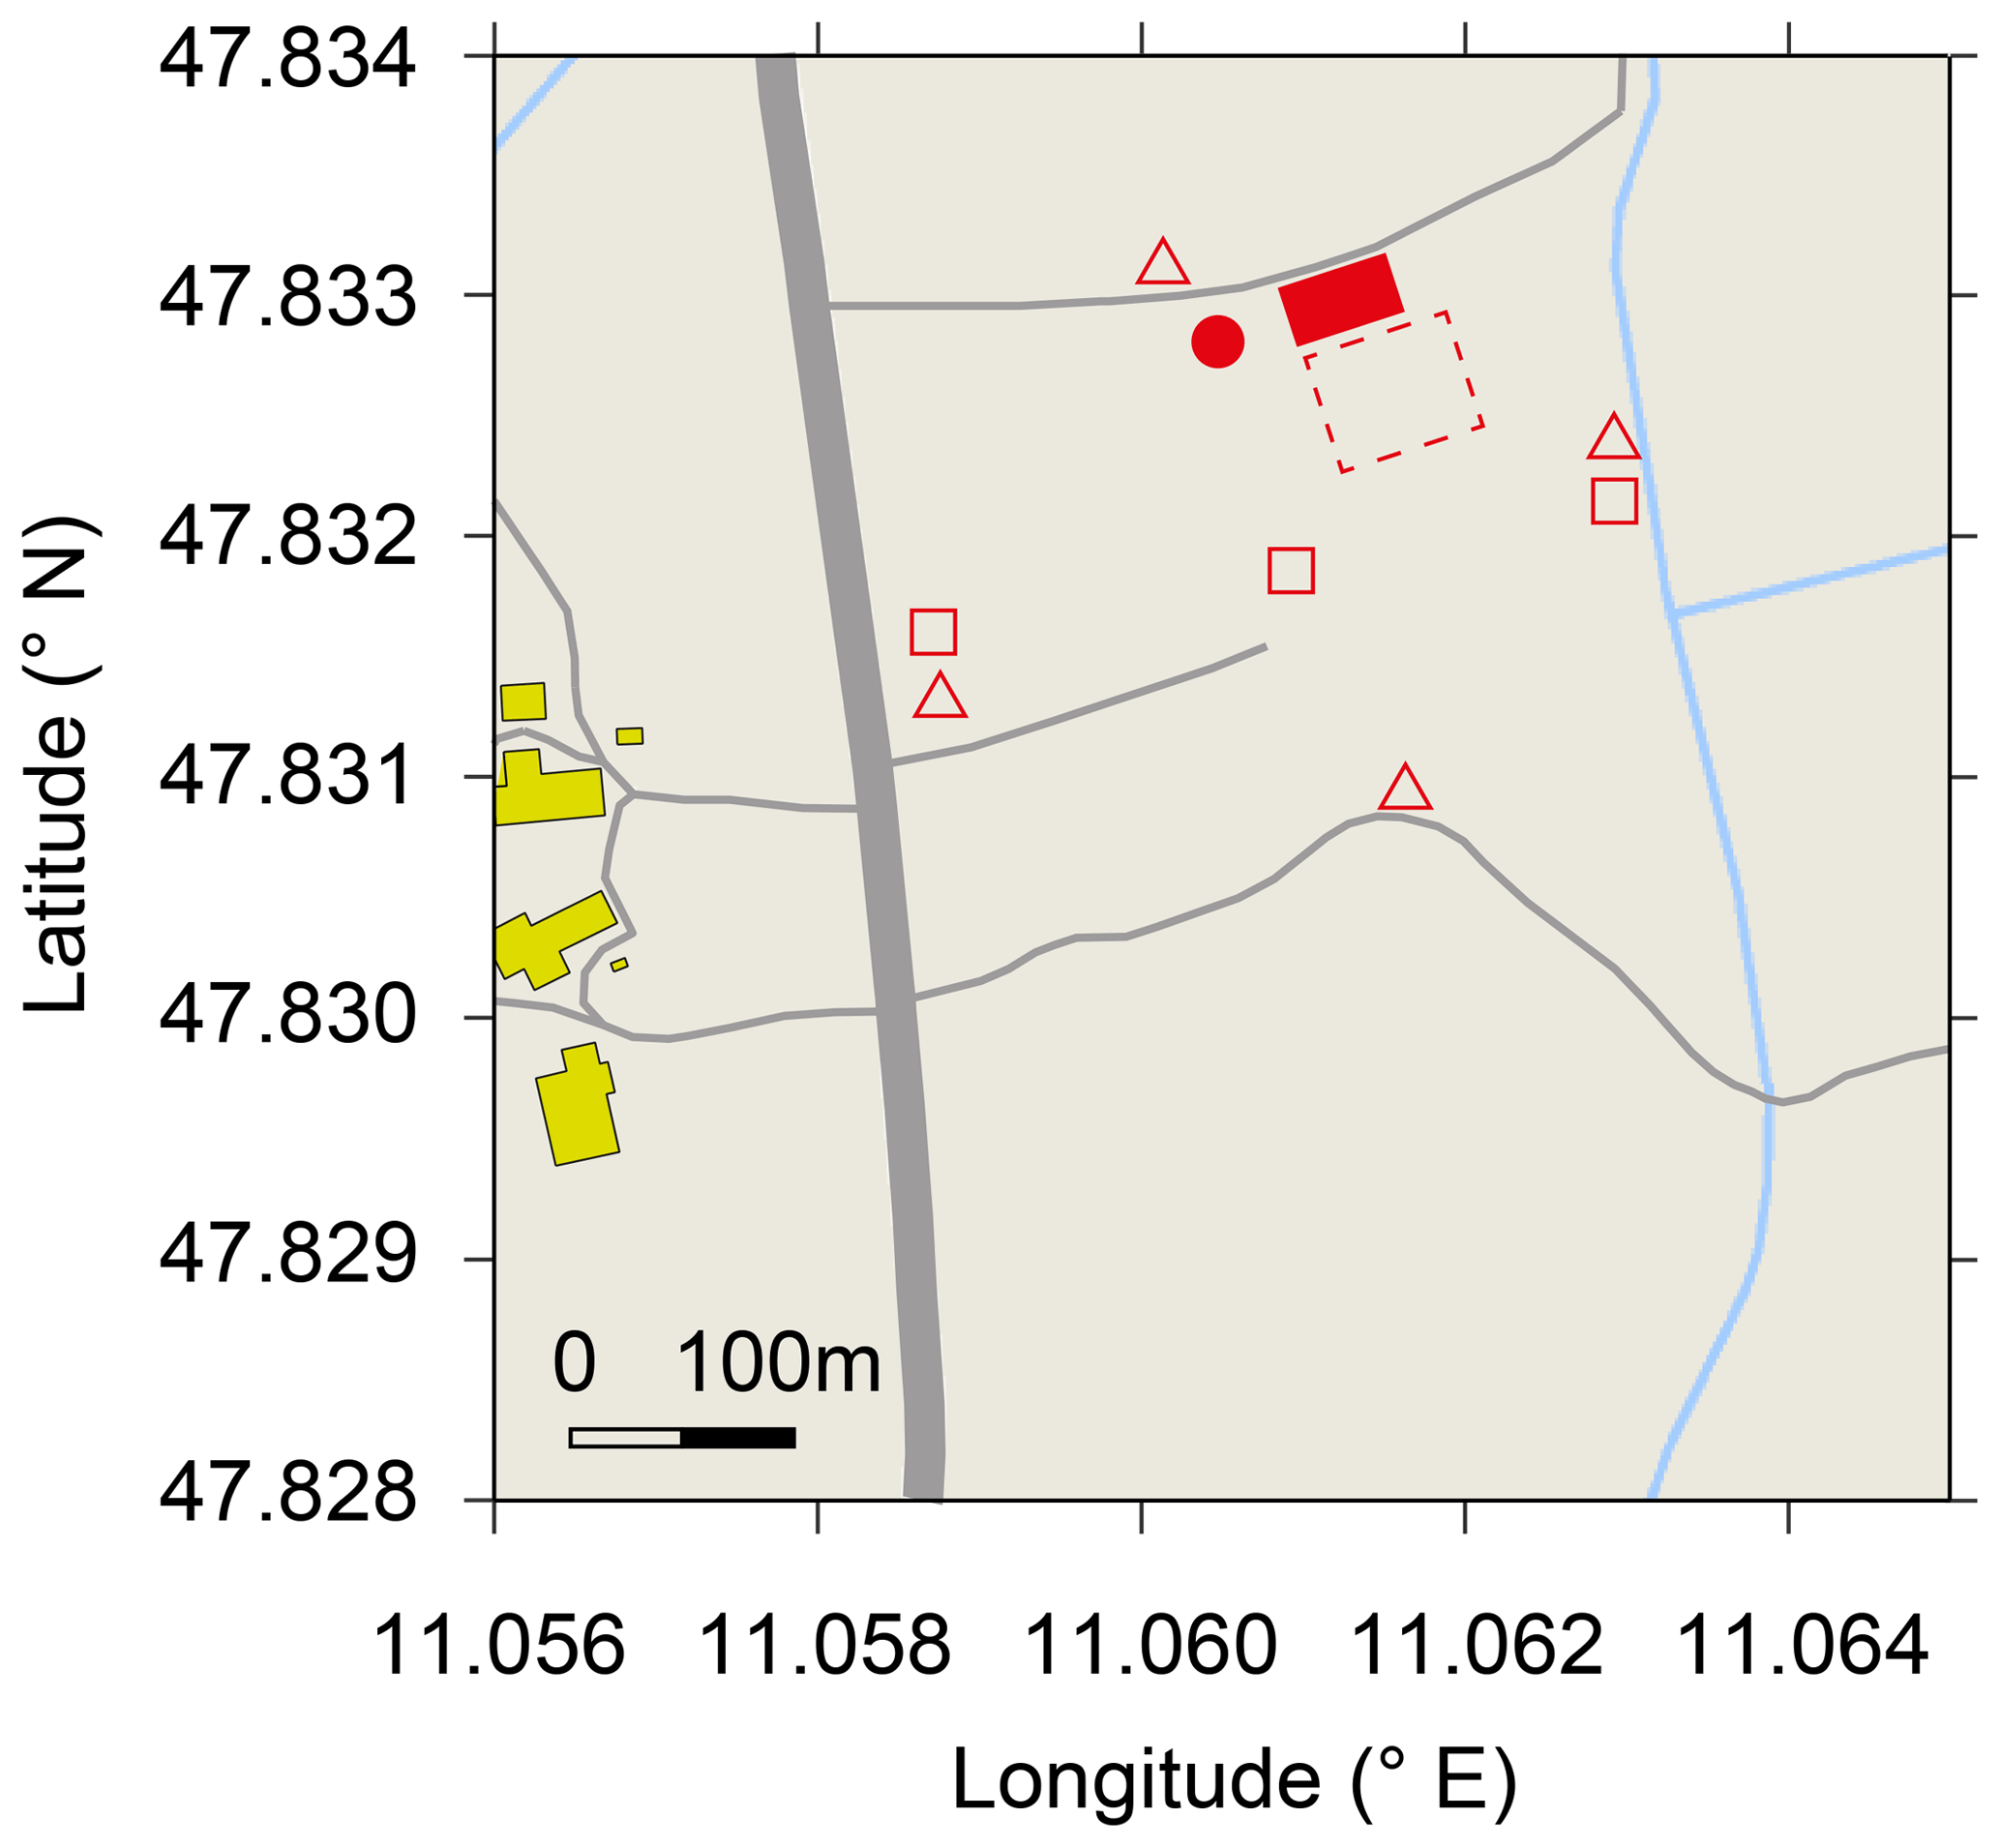
Figure 1Map of research site De-Fen with nearby farm buildings (yellow), streets and country lanes (grey) , ditches (blue), the mobile laboratory (filled red square), 2 m sample inlet for TREX-QCLAS measurements, (red dot), area of flux chambers and soil water content measurements (dashed red square), precipitation gauges (open triangles), and location of PT-100 sensors (open squares). © OpenStreetMap contributors 2019. Distributed under a Creative Commons BY-SA License.
2.1.3 Concentrations of soil extracted and and δ15N-
Soil samples (approx. 150 g, 2–7 cm depth) were collected twice per week in a sampling grid (mesh size 70 m) spanning the whole measuring area at the De-Fen site (dashed square Fig. 1; Wolf et al., 2017), extracted with 1 M potassium chloride (KCl; Merck KGaA, Darmstadt, Germany) and stored at −18 ∘C. After the manure application, sampling was increased to daily time intervals (12–15 July 2016), followed by further sampling on 19, 21, and 27 July 2016. The concentrations of and were determined colorimetrically using a spectrophotometer (AGROLAB Agrarzentrum GmbH, Germany).
For 116 out of 298 soil extracts described above, δ15N- was also analysed. This subset of samples was collected at the sampling nodes in the vicinity of the flux chambers and the TREX-QCLAS sample inlet. Soil extracts and 14 KCl blanks were analysed for δ15N- at the Stable Isotope Facility of the University of California Davis, USA using the bacterial denitrification assay (Sigman et al., 2001; Casciotti et al., 2002). The reference materials USGS 32, USGS 34, and USGS 35, as supplied by NIST (National Institute of Standards and Technology, Gaithersburg, MD), were used for data correction, and additional laboratory reference materials were included to monitor and correct for instrumental drift and linearity. The standard deviation for repeated measurements of reference material was <0.2 ‰.
2.2 Measurements of soil N2O fluxes
Soil N2O flux rates (f(N2O)) were obtained using five replicated opaque static flux chambers coupled with a gas chromatograph with an electron capture detector (GC-ECD) and operated according to a pre-defined schedule. A detailed description of the method can be found for example in Rosenkranz et al. (2006). The chambers were alternately closed and opened for 60 min, and each chamber was sampled every 15 min, resulting in four headspace air measurements per chamber closure time. The chamber dimensions were 50×50 cm2 and either 15 or 50 cm in height, depending on vegetation height. All flux chambers were deployed south of the mobile laboratory within the dashed square in Fig. 1. N2O fluxes were calculated from the concentration increase over time according to Rosenkranz et al. (2006), taking into account local air pressure and the chamber headspace temperature.
2.3 Analysis of N2O isotopocule by TREX-QCLAS
2.3.1 Analytical procedure
The TREX-QCLAS setup used in this study for the N2O isotope measurements was developed and described in detail by Ibraim et al. (2018), based on a previous system developed for CH4 isotope analysis by Eyer et al. (2014, 2016). In brief, N2O from 5 L of ambient air is extracted using the TREX device and purged into the multipass (76 m) cell of the spectrometer (CW-QC-TILDAS-76-CS; Aerodyne Research Inc., Billerica, USA) by means of a low flow of synthetic air (20.5 % O2, 79.5 % N2; Messer Schweiz AG, Switzerland). This approach is capable of measuring the four most abundant N2O isotopic species (14N14N16N, 14N15N16O, 15N14N16O, and 14N14N18O) at approx. 90 ppm with an Allan deviation of <0.1 ‰.
The TREX-QCLAS was operated in an air-conditioned mobile laboratory (22–30 ∘C) situated at the north end of De-Fen (Fig. 1). Ambient air was continuously sampled at a flow rate of approx. 900 mL min−1 from 2 m above the ground at the eddy covariance (EC) tower and transported to the mobile laboratory using a SERTOflex tube (∼20 m length, 6 mm OD; SERTO AG, Switzerland). Then the sample gas was dried using a Nafion drier (PermaPure Inc., USA) and subsequently pressurized to 4.5 bars using a membrane pump (PM25032-022, KNF Neuberger, Switzerland). Downstream of the pump the air was passed through a chemical trap for carbon dioxide (CO2) and residual H2O removal. After this pretreatment, the air was passed into the TREX device for N2O pre-concentration following the procedure as described in Ibraim et al. (2018).
Maintenance demand during field application was minimized by successively using a multi-position valve (Valco Instruments Inc., Switzerland) to switch between eight chemical traps for CO2 and H2O removal (Fig. 2). Each of the traps consisted of a stainless steel tube (12 mm OD, 350 mm length) filled with 12 g Ascarite (10–35 mesh; Fluka, Switzerland), bracketed with magnesium perchlorate (Mg(ClO4)2, 2×1.5 g; Fluka, Switzerland) and silane-treated glass wool (Sigma-Aldrich Chemie GmbH, Switzerland). The CO2 extraction capacity of the Ascarite traps was found to be sufficient for >500 L at ambient CO2 concentrations (Ibraim Erkan, unpublished data). To avoid CO2 breakthrough and particularly clogging of the trap under varying CO2 and residual H2O concentrations, the chemical trap was changed every day.

Figure 2Instrumental setup for semicontinuous analysis of N2O isotopes by coupled pre-concentration laser spectroscopy (TREX-QCLAS) (Ibraim et al., 2018), including peripherals for the conditioning of the sample gas. Consecutive sample gas treatments include dehumidification by permeation drying, adjustment of sample gas pressure with a pressure release valve after the membrane pump, and CO2 or H2O removal using Ascarite or Mg(ClO4)2 traps and filtering for particles using a sintered metal filter. An automized multiposition valve enables us to switch between eight different Ascarite traps and thus reduces the maintenance effort to one visit per 8 d. The indicated gases are target gas (T), synthetic air (SA), standard gas 1 (S1), and standard gas 2 (S2). CO is removed from the analyte gases using a Sofnocat catalyst (type 423, Molecular Products LTD). At the top right, a full measurement cycle is given. Letters on the y axis correspond to different gas types: standard 1 (S1) and standard 2 (S2) sample (S) and target (T) gases. The x axis gives the elapsed time in minutes. The full measurement cycle lasts approx. 4 h, which results in a frequency of approx. one per hour for ambient air measurements.
2.3.2 Calibration strategy and data processing
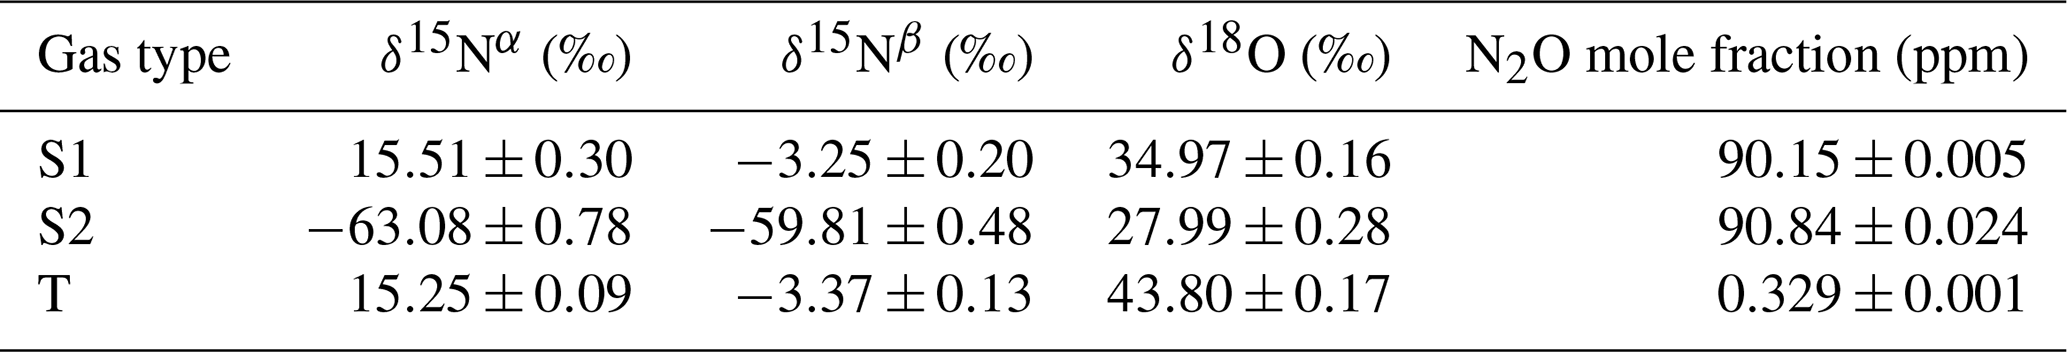
The isotopic composition of ambient air was referenced against a set of standard gases (Table 2) that were periodically measured (Fig. 2) to ensure long-term repeatability. The measurement routine was implemented using a customized LabVIEW programme. Initially, two standard gases (S1, S2) were analysed for a two-point delta calibration and a target (T) gas was measured to monitor the data quality (Table 2). While S1 and S2 cover the range of δ15Nα and δ15Nβ values of the sample gas, for δ18O this is currently confined by the non-availability of suitable standard gases. Nonetheless, the implemented calibration procedure presents current best practice in particular as the linearity of the delta scale for QCLAS measurements was demonstrated already in 2008 (Waechter et al., 2008). This phase was followed by a series of four alternating S1 and ambient air sample (S) measurements. A full analytical cycle yielded 13 measurements, including four ambient air analyses, and required approx. 4 h, corresponding to a measurement frequency of approx. one ambient air sample per hour.
Table 2Mole fractions and isotopic compositions of standard 1 (S1), standard 2 (S2), and target (T) gas cylinders that were used in this study. N2O mole fractions were analysed at Empa against standards from commercial suppliers (S1, S2) or from the National Oceanic and Atmospheric Administration, Earth System Research Laboratory, Global Monitoring Division (NOAA/ESRL/GMD) (T). N2O isotopic composition was also analysed at Empa against standards previously analysed by Sakae Toyoda, Tokyo Institute of Technology. The standard gas S1 is used for drift correction and standard gas S2 for a span correction of measured δ values. The indicated error is 1 standard deviation for replicate sample measurements and does not include the uncertainties of the calibration chain.
Data processing was conducted as previously described by Harris et al. (2017) using Matlab (MathWorks, Inc., USA). Abundances of the four isotopocules (14N14N16O, 14N15N16O, 15N14N16O, and 14N14N18O) were obtained with TDL Wintel (Aerodyne Research Inc., Billerica, USA), and isotope ratios were drift-corrected for changes observed in S1. Specifically, the isotope ratios of S1 were linearly fitted to cell pressure, cell temperature, and goodness of the TDL fit. If this linear fit was significant (p value <0.05) the correction was applied to all data. These corrections were always relatively small and within the range of 0.05 ‰–0.2 ‰. In addition, a concentration correction was performed using a linear regression curve determined with S1 diluted in synthetic air. The concentration corrections were −0.20 ‰ ppm−1, 0.32 ‰ ppm−1, and −0.24 ‰ ppm−1 for δ15Nα, δ15Nβ, and δ18O, respectively. Finally, delta values were calculated from isotope ratios using the two-point delta calibration based on S1 and S2. Since no international standards were available for N2O isotopes, S1 and S2 were analysed against N2O standards for which the isotopic composition was assigned at Tokyo Institute of Technology (Tokyo Tech) according to Toyoda and Yoshida (1999). In addition, past and ongoing inter-laboratory comparison measurements on pressurized air indicated very good agreement with Tokyo Tech results (Mohn et al., 2014; Ostrom et al., 2018).
2.4 Source signatures of soil-emitted N2O
Source signatures of soil-emitted N2O were interpreted using the Keeling plot approach (Keeling, 1958). Each analysis started at 19:00 on day n and lasted until 06:00 on the consecutive day n+1 local time (UTC + 1). This procedure yielded 30 Keeling-plot-derived source signatures. The uncertainty of the source signatures was assessed based on the measured isotope delta values and N2O concentrations using a Monte Carlo model with 200 iterations. A benchmark value of 10 ‰ for the SP standard deviation was chosen as a criterion to distinguish valid measurements, finally leading to 12 N2O accumulation events.
For comparison, the source signatures were also calculated with the Miller and Tans (2003) approach. An in-depth description of the implementation of the Miller–Tans method is provided by Harris et al. (2017). In brief, first, a baseline is determined by averaging the data points in the lowest 5 % of the diurnal N2O concentrations with a 5 d moving window (see Fig. S3 in the Supplement). The same measurement points are also used to find the baseline of the isotope delta values – isotope values are not used to flag the baseline since deviations can be both positive and negative. Subsequently, the Miller–Tans equation (Eq. 2 in Harris et al., 2017) is used to derive the source isotope signatures based on a simple linear regression within a 24 h moving window. The uncertainty in source isotopic composition is calculated by first propagating measurement errors into all terms used in the Miller–Tans equation and then running 200 iterations assuming a normal distribution of error in all terms.
2.5 Footprint analysis with FLEXPART – COSMO simulations
The Lagrangian particle dispersion model FLEXPART (Stohl et al., 2005) was adapted for input from the numerical weather prediction model COSMO (Brunner et al., 2012; Oney et al., 2015; Henne et al., 2016) and was used on a site scale to determine the concentration footprint of our observations. For this purpose the model was adapted by locally nudging wind profiles and micrometeorological observations at De-Fen into the COSMO model output. The latter was taken from the operation analysis and forecast runs by MeteoSwiss with a spatial resolution of approximately 1 km × 1 km. Into these model fields observed profiles of the wind vector (composite of 2.5 and 9 m sonic anemometer) were locally nudged using a tricubic nudging kernel with a width of 3 km, hence influencing approximately three grid cells around the observational site (further related information is provided by Wolf et al., 2017). Turbulence statistics (friction velocity, Monin–Obukhov length) required by FLEXPART were taken from the observations and locally replaced the COSMO-simulated values. The effect of the nudging procedure was strongest at night and under stable boundary layer conditions, which COSMO often fails to reproduce correctly. FLEXPART was run in backward mode, tracing released model particles 24 h and generating hourly surface source sensitivities (τ50 (s m3 kg−1); also called concentration footprint) for the location of the N2O isotope observations. Source sensitivities were calculated on a regular longitude–latitude grid around the De-Fen site (47.825–47.845∘ N and 11.50–11.51∘ E) with a resolution of approximately 50 m × 50 m and for model particles from the surface to 50 m above the ground, the latter of which was also the defined minimum of the model boundary layer height. Multiplication of the source sensitivities with a surface flux and summation over the whole model domain and time of the backward integration yields the concentration increment during the period of simulation. The map of source sensitivities was used as an indicator of the extent of the observed N2O source. Average source sensitivities were calculated for the 12 accumulation events between 18:00 and 06:00 the next day.
3.1 N2O fluxes and soil parameters
The initial phase of the measurement campaign (10 May–21 June 2016) was characterized by low ambient air and soil temperatures (13.5 and 15.6 ∘C, respectively) along with high precipitation and high WFPS values (>5 mm d−1 and >95 %, respectively, between 10 and 21 June; Fig. 3). Soil extracted and values in this period were 0.27 to 8.32 and 0.12 to 3.15 mg N L−1, respectively. This period was also characterized by the lowest N2O flux rates (f(N2O)), i.e. the mean f(N2O) of all five chambers was below 70 µg N m−2 h−1. After 21 June the N2O fluxes increased, reaching a maximum of approx. 450 µg N m−2 h−1 on 24 and 25 June. f(N2O) followed a diurnal pattern with slightly higher emissions during the day but also higher nocturnal f(N2O) values compared to the initial phase of the campaign. Thereafter f(N2O) decreased to around 200 µg N m−2 h−1 on 29 June before it began to steadily rise from 30 June to 12 July. After the cutting event on 4 July, concentrations increased, while remained unaffected. In contrast, after the manure application on 12 July, the concentration of increased immediately, while only accumulated slowly over the course of the following week. In this period N2O daytime emissions also peaked at >900 µg N m−2 h−1 followed by a period of variable N2O fluxes with very low but also very high emission rates, for example 17 and 24 July at 290 and 2400 µg N m−2 h−1, respectively. Two weeks after the manure application the concentrations of and and N2O fluxes were comparable to the period prior to manure application and cutting.
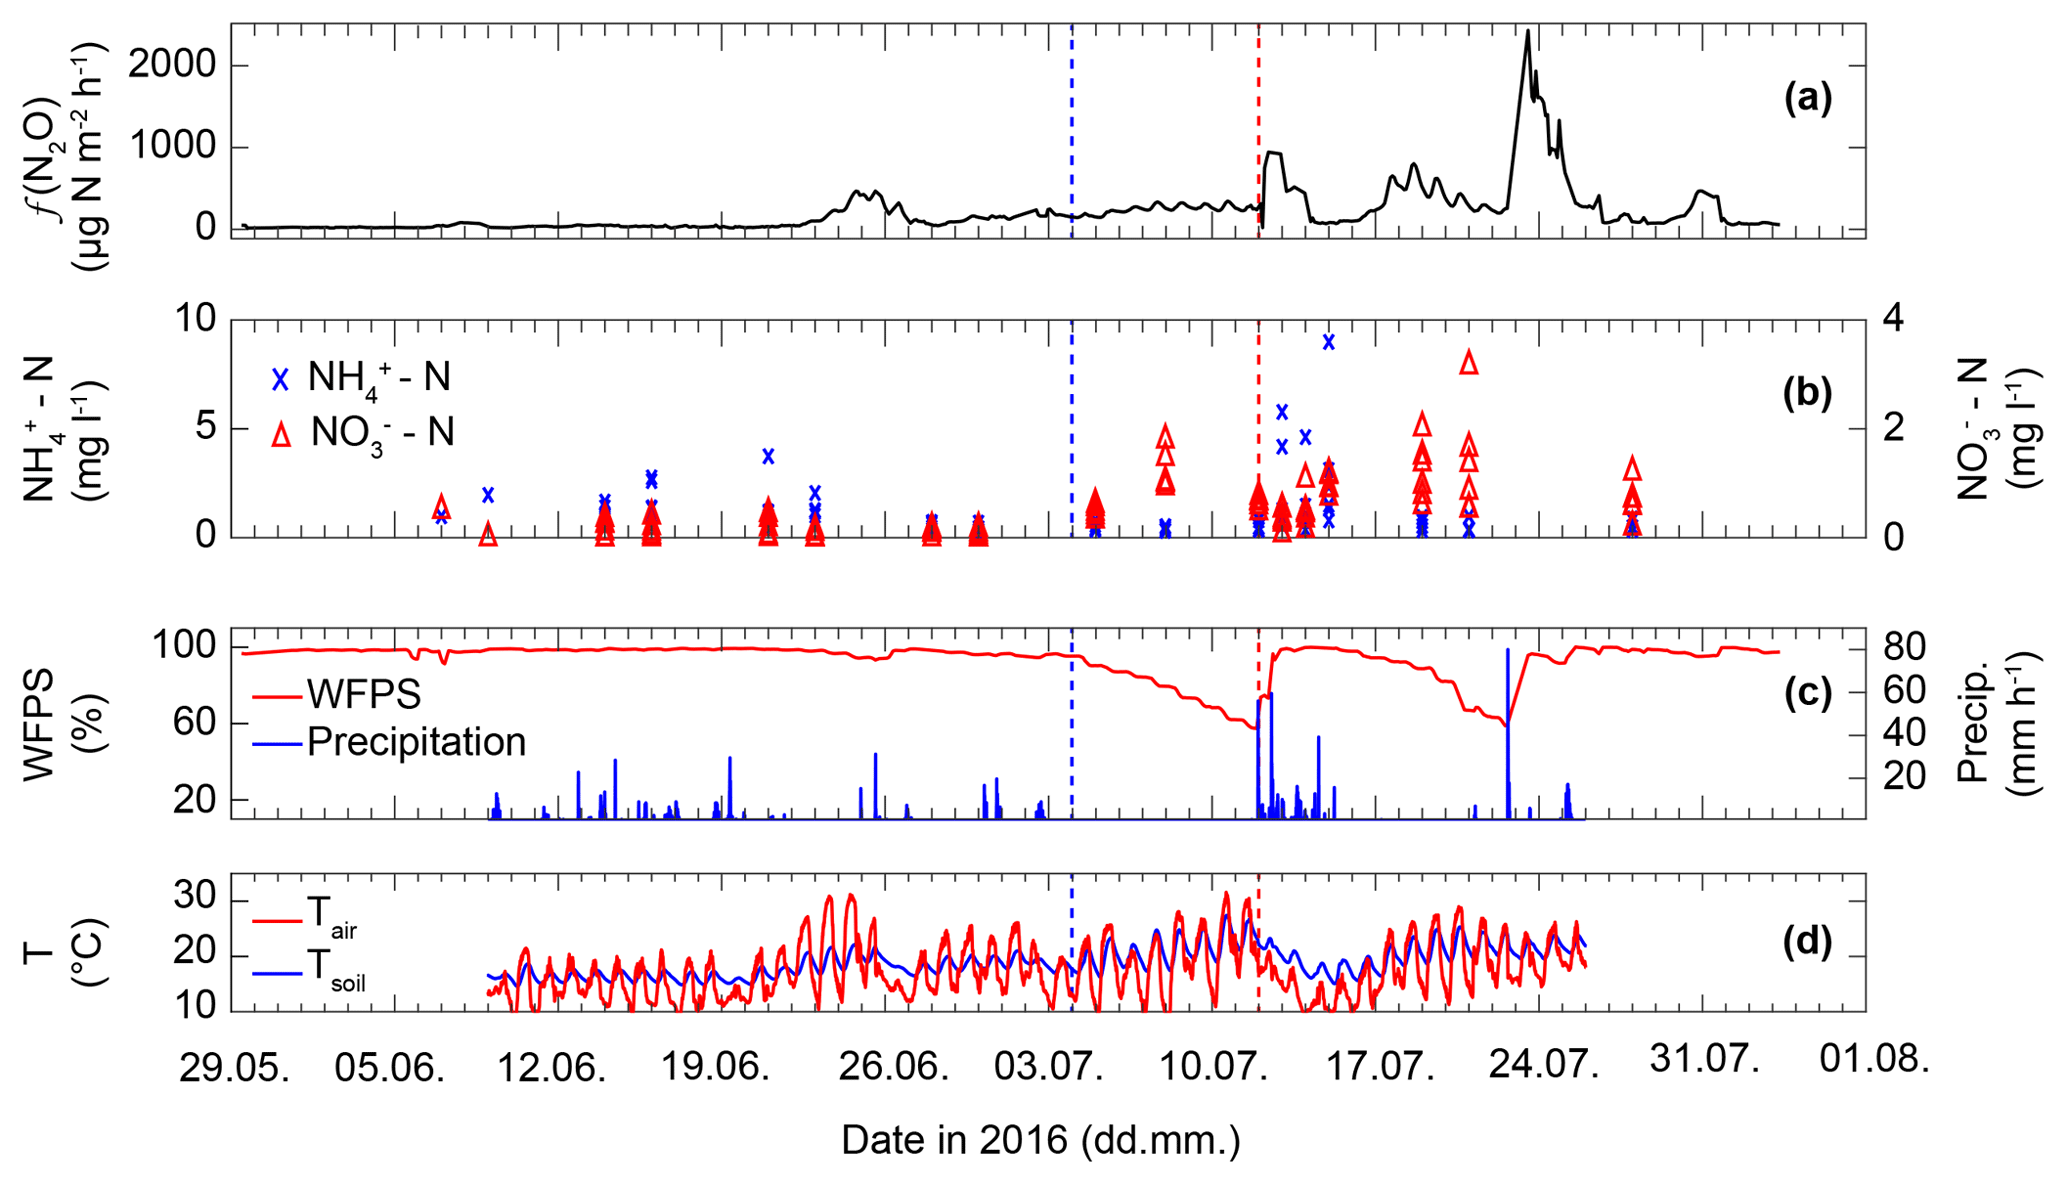
Figure 3(a) Average N2O flux (f(N2O)) as measured by five replicate flux chambers coupled to a GC-ECD. (b) Concentration of -N and -N. Up to eight nodes across the De-Fen site were sampled twice per week, except in the week of fertilization, when sampling frequency was increased. Therefore, variability within a sampled day refers to spatial variability across the De-Fen site on the given day. (c) Observed WFPS (red) and precipitation (blue). (d) Observed ambient (2 m a.g.l.) and soil (2–6 cm below ground) temperature. The blue dashed line indicates a cutting event and the red line indicates manure application.
3.2 Ambient N2O concentrations and isotopic variations
Figure 4 shows N2O concentrations and isotopic composition (δ15Nα, δ15Nβ, δ18O) analysed between 9 June and 23 July in ambient air 2 m above the ground. In total, 612 air sample measurements (S), 150 target gas (T), 1783 anchor gas (S1), and 164 calibration gas (S2) measurements were performed (concentrations and isotopic composition of T, S1, and S2 are given in Table 2). The data gap between 27 June and 8 July was caused by a hard disk failure of the system computer. The standard deviation for repeated in situ T measurements (undergoing identical treatment compared to S) was 0.46 ‰, 0.36 ‰, 0.59 ‰, and 1.24 ppb, for δ15Nα, δ15Nβ, δ18O, and N2O concentrations, respectively.
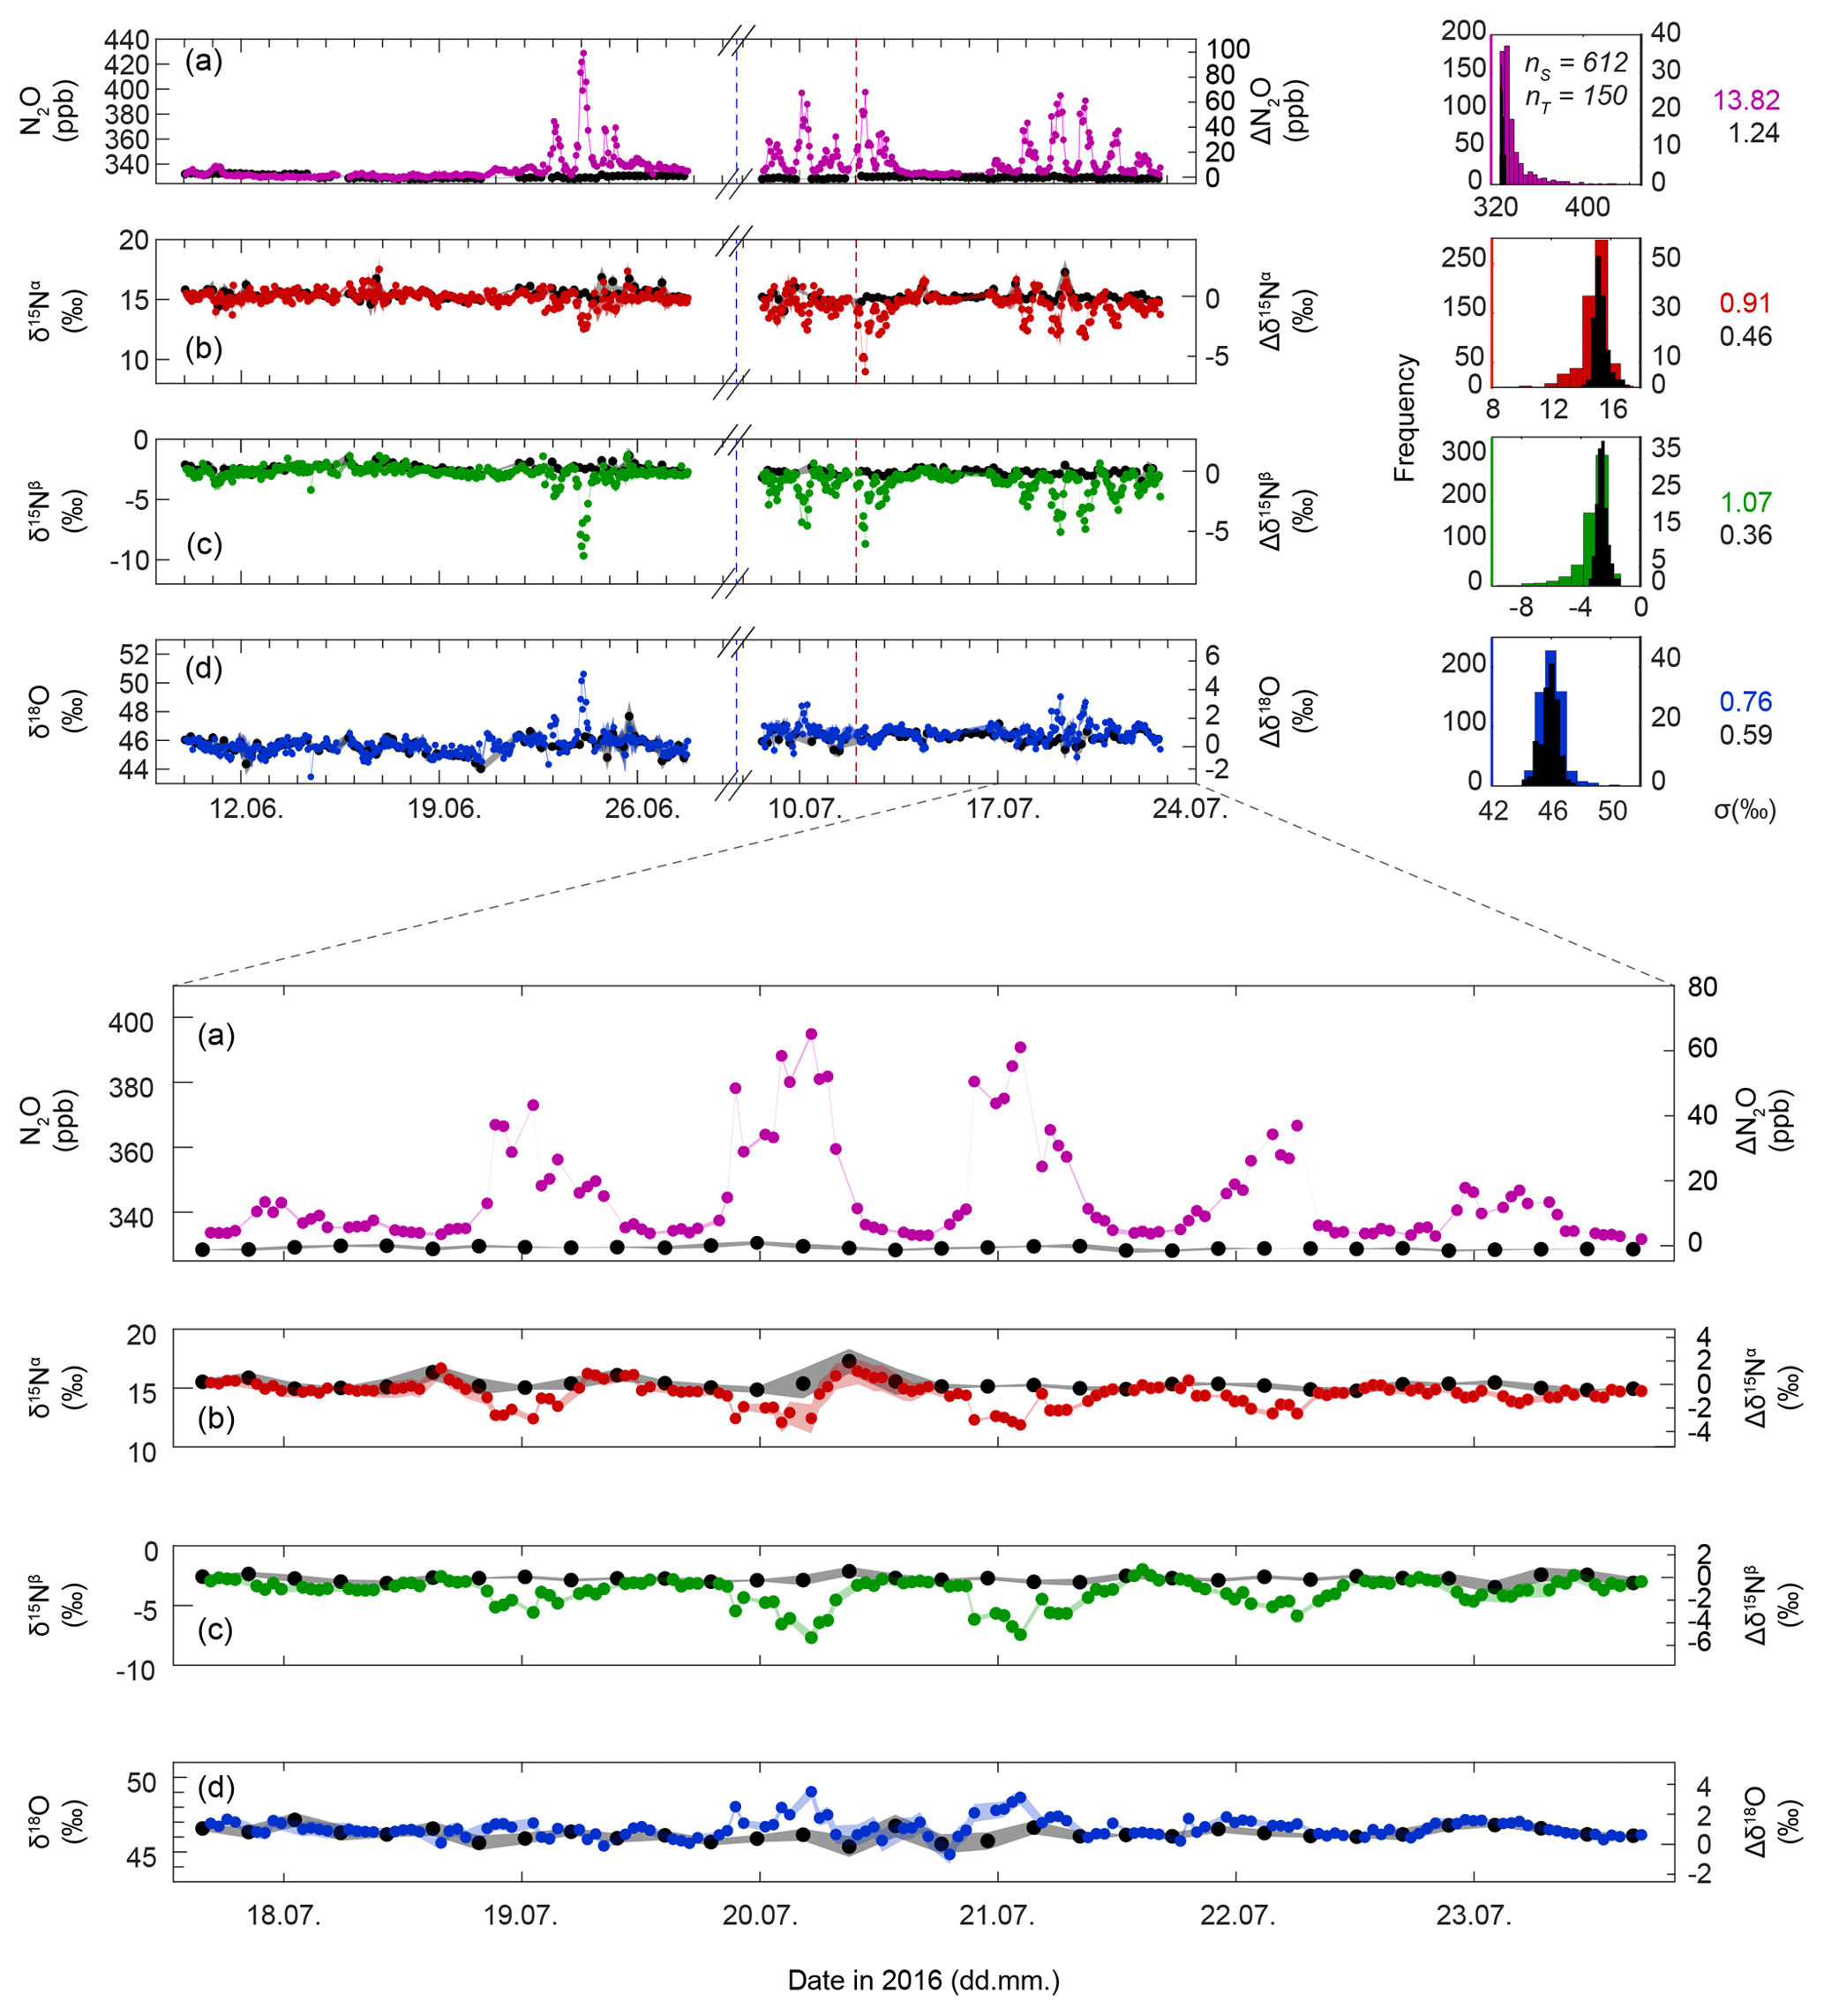
Figure 4Time series of N2O concentrations (a), δ15Nα (b), δ15Nβ (c), and δ18O (d), respectively. The left axes give concentrations and isotope delta values on the respective scales, while the right axes depict the difference to background values (, where X refers to N2O, δ15Nα, δ15Nβ or δ18O). At the top right, histogram plots of the four quantities are given. Coloured symbols indicate ambient air samples (S) from 2 m a.g.l., and black symbols refer to the corresponding measurements of the target gas (T; Table 2). Shaded areas indicate 1 standard deviation (σ) as calculated for three consecutive measurements of T. Standard deviations for the complete measurement period are given on the right, in coloured font for S and in black for T. The vertical blue dashed line indicates a cutting event on 4 July 2016, while the red dashed line indicates manure application on 12 July 2016.
Apart from a small nocturnal N2O concentration increase on 11 June, no clear variations in ambient N2O were observed in the first 3 weeks of the campaign, which is in accordance with the lowest soil N2O fluxes, as described above. On 21 June the onset of a diurnal pattern with nocturnally enhanced N2O concentrations accompanied by co-varying δ15Nα, δ15Nβ, and δ18O values was observed. Mean N2O concentrations were 331.62±1.41 ppb during the day and elevated at night with a maximum of 429 ppb observed on 23 June. During the day, mixed surface layer isotopic compositions of N2O were 15.22±0.42 ‰, ‰, and 45.88±0.43 ‰ for δ15Nα, δ15Nβ, and δ18O, respectively, thus yielding SP and δ15Nbulk values of 17.95±0.15 ‰ and 6.28±0.30 ‰, respectively.
The nocturnal increase in N2O concentrations was accompanied by a decrease in δ15Nα and δ15Nβ, while δ18O values generally increased at higher N2O concentrations but also showed the opposite behaviour for some events. The most extreme δ values were 8.98 ‰, −9.66 ‰, and 50.61 ‰ for δ15Nα, δ15Nβ, and δ18O. Compared to the background values, this results in a difference of 6.24 ‰, 6.88 ‰, and 4.73 ‰ for δ15Nα, δ15Nβ, and δ18O, respectively.
3.3 Source signature of soil-emitted N2O and precursors
Source signatures of soil-emitted N2O at De-Fen were calculated using the Keeling plot method (Keeling, 1961, 1958) and the Miller–Tans method (Miller and Tans, 2003), as shown in Fig. 5. For periods complying with the quality criteria defined for the Keeling plot analysis, results of the two independent techniques agreed reasonably well, as shown in the correlation diagrams in Fig. 5. Keeling-plot-derived δ15Nbulk, δ18O, and SP values varied between −32.5 ‰ and −1.2 ‰, 38.0 ‰ and 65.0 ‰, and 8.4 ‰ and 36.8 ‰, respectively; the Miller–Tans analysis resulted in similar source signatures of −29.6 ‰ to 20.3 ‰ (δ15Nbulk), 40.7 ‰ to 84.9 ‰ (δ18O), and 5.1 ‰ to 35.0 ‰ (SP) for the same period. The results of the Miller–Tans method were rather scattered for periods when small changes in N2O concentrations and N2O isotopic composition precluded Keeling plot analysis (i.e. prior to 22 June). Values of individual Keeling-plot-derived source signatures can be found in Table 3.
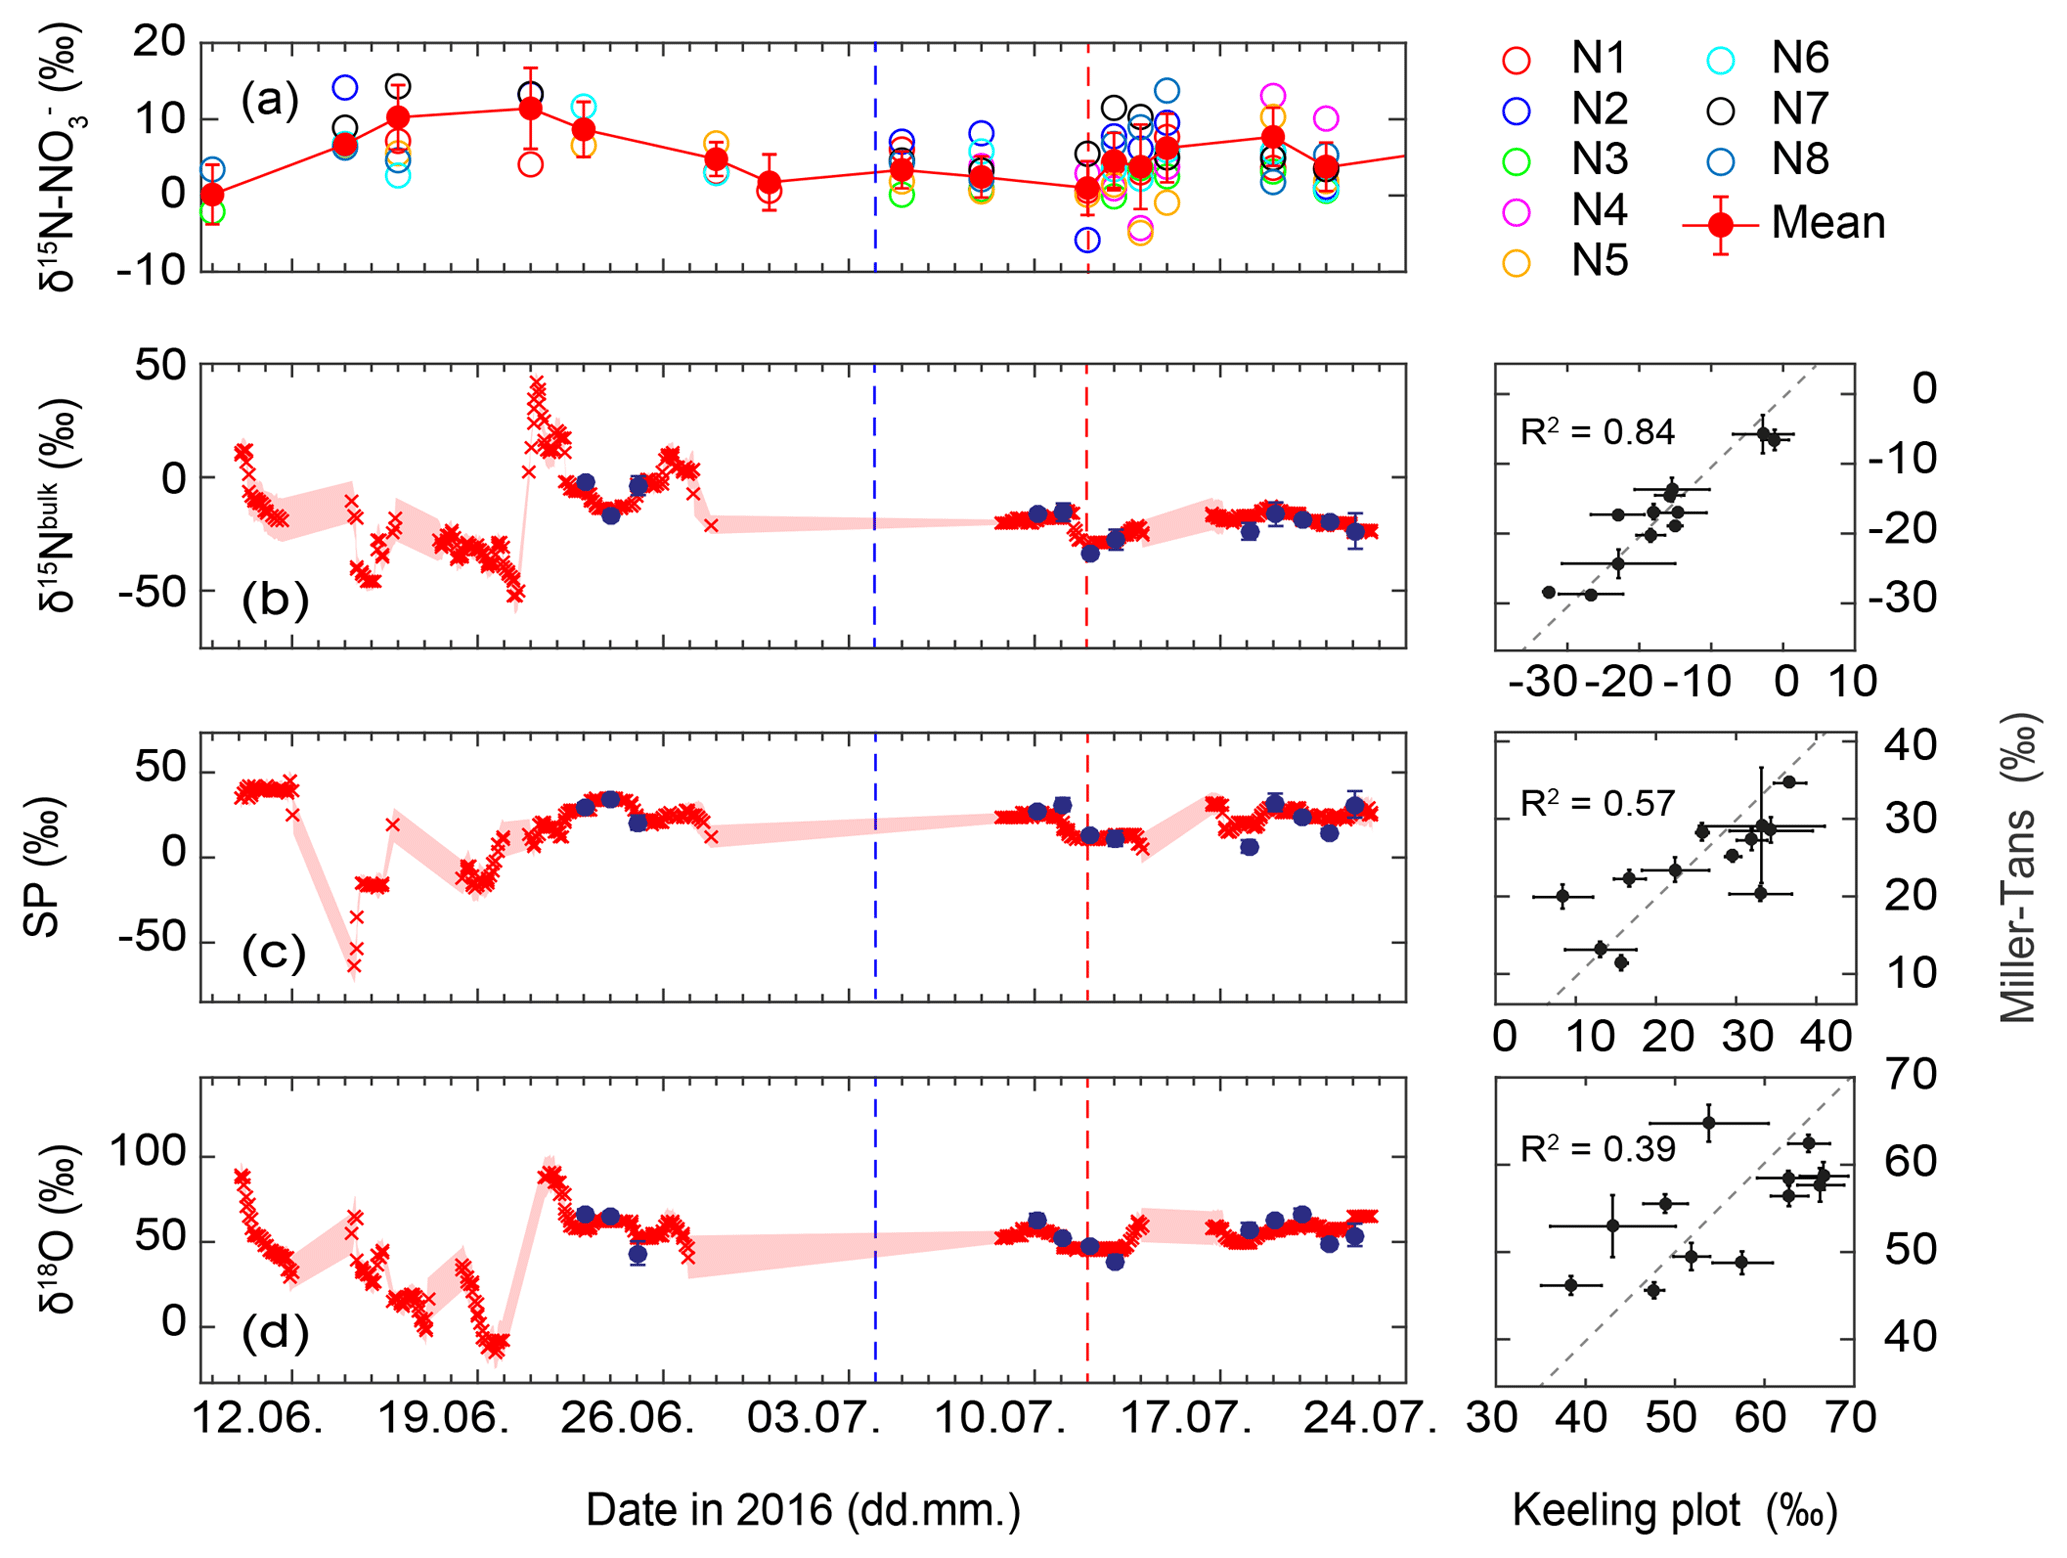
Figure 5Temporal trend of δ15N of soil-extracted at eight different nodes (N1–N8) near the N2O flux and isotope measurements at De-Fen, indicating large spatial variability. In (a), concentration-weighted average values (red filled symbols) and their uncertainty (1 standard deviation) are given. Source signatures (b) δ15Nbulk, (c) SP and (d) δ18O of soil-emitted N2O derived from the Miller and Tans (2003) approach (red crosses) and the Keeling (1961, 1958) plot approach (blue filled symbols) are given. Uncertainties are indicated as pale red shaded areas for the Miller–Tans approach and error bars for the Keeling plot approach (1 standard deviation with a Monte Carlo model). The blue dashed line shows the cutting event, while the red dashed line indicates the manure application. Three panels on the right: correlation diagram of results derived from the Miller and Tans (2003) and the Keeling (1961, 1958) plot approaches. The dashed line corresponds to the 1:1 slope.
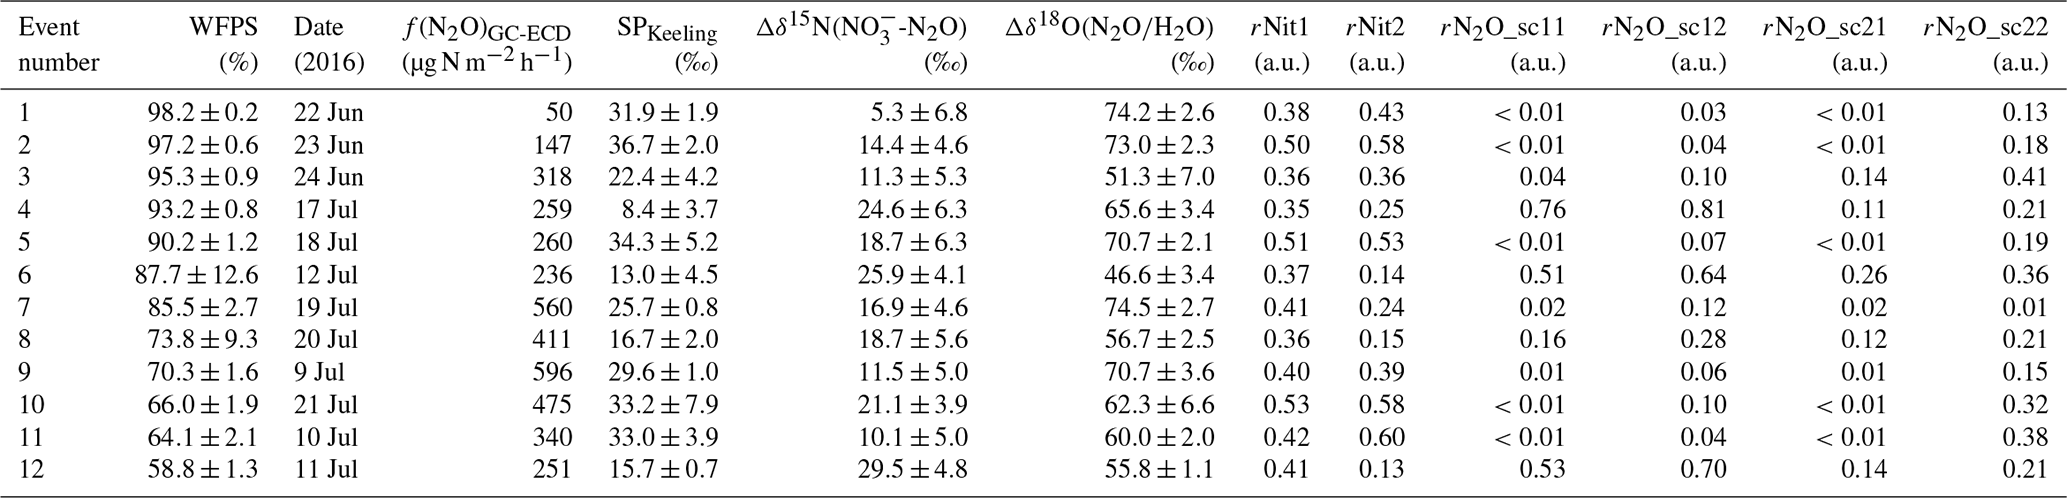
Table 3Characterization of the accumulation events. Columns refer to date, water-filled pore space (WFPS), observed N2O fluxes (f(N2O)GC-ECD), Keeling-plot-derived SP values, obtained net isotope effect for Δδ15N(NO3-N2O), obtained net isotope effect for Δδ18O(N2O∕H2O), fraction of remaining N2O after N2O reduction (rN2O: sc11 = SP vs. Δδ15N(NO3-N2O) approach scenario 1, sc12 = SP vs. Δδ15N(NO3–N2O) approach scenario 2, sc21 = SP vs. Δδ18O(N2O∕H2O) approach scenario 1, and sc22 = SP vs. Δδ18O(N2O∕H2O) approach scenario 2). Results are sorted by descending WFPS.
The δ15N- values ranged from 0.13 ‰ to 11.42 ‰. Spatial variations in δ15N- across the De-Fen site were relatively large (Fig. 5). In the first week of June δ15N- was rather variable with very low values on 9 June but higher δ15N- in the second week. Thereafter it decreased slowly from approx. 10 ‰ to values close to 0 ‰. After the manure application on 12 July a continuous increase in δ15N- was observed, reaching a maximum of approx. 8 ‰ around 24 July.
4.1 N2O fluxes and WFPS
Throughout the measurement campaign, the N2O flux rates were between 70 and 2400 µg N m−2 h−1 at De-Fen and thus of a similar order of magnitude as reported earlier for other intensively fertilized grasslands (Merbold et al., 2014; Wolf et al., 2015; Schäfer et al., 2012). f(N2O) showed a clear dependence on the soil water content, with maximum emissions at 90 % WFPS (Fig. 6). While for drier soils (WFPS < 60 %) lower but still substantial N2O fluxes were detected, fluxes declined to their lowest values near water saturation, i.e. when WFPS was close to 100 %. The observed relationship between f(N2O) and WFPS (R2=0.92) can be best described with an exponential function with two terms as given by Eq. (4):
where the coefficients are best approximated by , b=0.19, c=15.86, and d=0.04. This relationship is a strong indicator that the activity of the main source process increases with the soil water content, which is characteristic of denitrification and nitrifier denitrification (Wrage et al., 2004; Decock and Six, 2013a). Furthermore, the decline in N2O fluxes at very high WFPS values is in line with this interpretation because the last step of the denitrification pathway, N2O reduction to N2, is only active under anoxic conditions. This shift from nitrification-dominated to denitrification-dominated N2O production with increasing WFPS should be reflected in the isotopic signature of the residual N2O. Indeed, there is a tendency towards high SP values under low (indicating higher nitrification contribution) and high WFPS values (indicating higher N2O reduction to N2 rates) (Fig. 6). The peak f(N2O) was observed on 23 July, a day after a severe precipitation event. The N2O emission rate of this peak event was 2415 µg N m−2 h−1 (average of five replicate flux chambers). Unfortunately, this event cannot be discussed in terms of N2O isotopocules due to termination of TREX-QCLAS measurements after 22 July 2016.
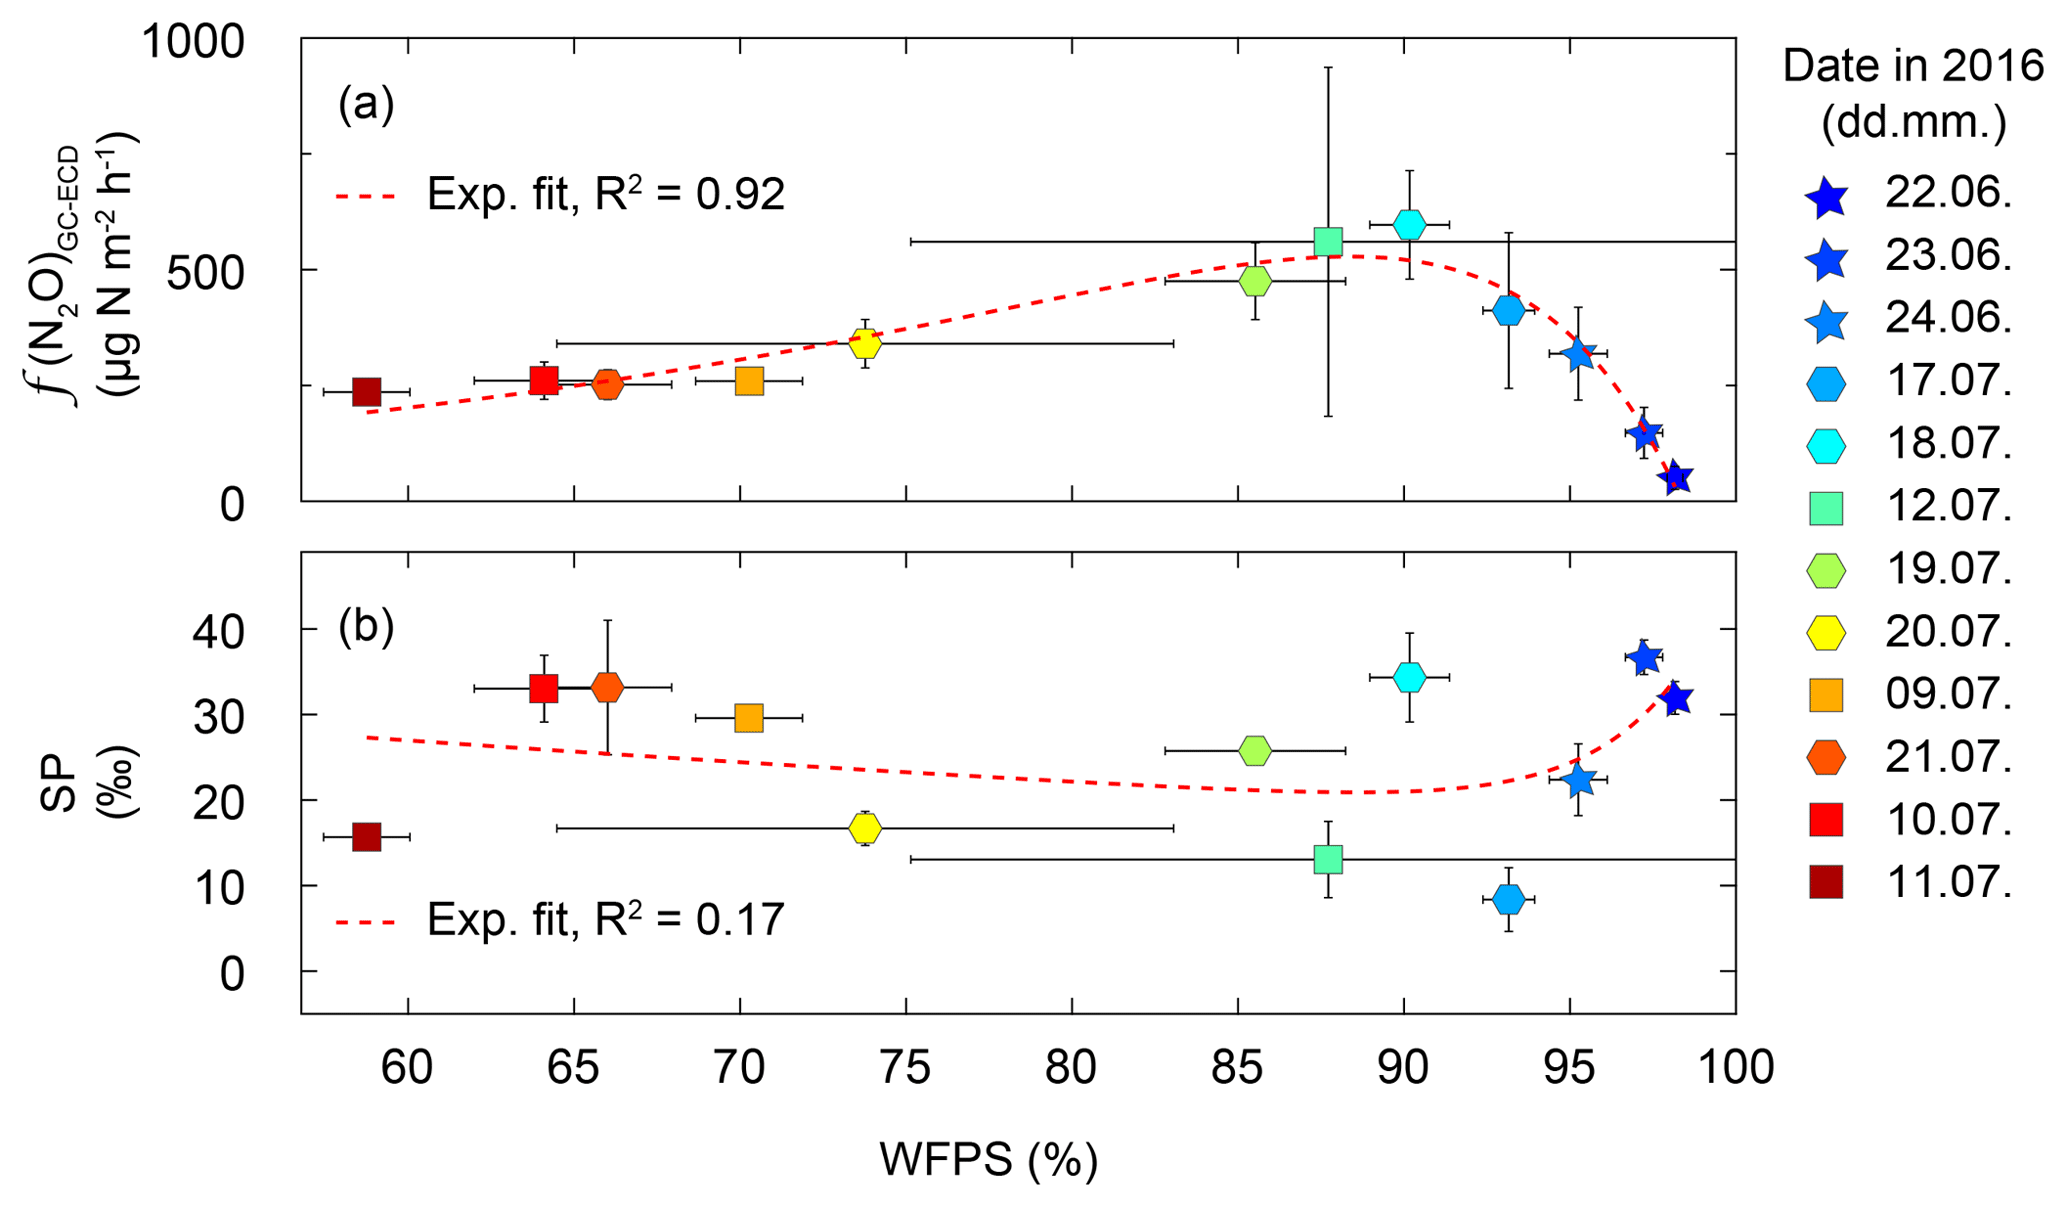
Figure 6(a) Noon-to-noon average N2O flux rates f(N2O) versus water-filled pore space (WFPS) from the grassland site De-Fen. Indicated uncertainties represent variations in f(N2O) and WFPS within 1 d. Results for individual chambers are given in Fig. S1. N2O fluxes were highest at 85 %–92 % WFPS. The red dashed line corresponds to a two-term exponential fit of the data shown here. (b) SP as a function of WFPS. Lowest SP values were found in the range of 85 %–95 % WFPS, which corresponds to the highest N2O fluxes. The red dashed line depicts a double exponential fit of the data shown here (this fit was not significant). The model used to fit the data corresponds to (coefficients a, b, c, and d are given in the main text).
4.2 On-site performance of TREX-QCLAS
The short-term repeatability over 10 target gas (T) measurements was 0.25 ‰, 0.31 ‰, 0.30 ‰, and 0.25 ppb for δ15Nα, δ15Nβ, δ18O, and N2O concentration, respectively. This is sufficient to track changes in ambient N2O close to emission sources as described in this study and superior to most IRMS and laser spectrometer systems (Mohn et al., 2014) but slightly inferior to laboratory experiments using the same system (Ibraim et al., 2018) or earlier versions of pre-concentration-QCLAS-based approaches (Mohn et al., 2012; Harris et al., 2014; Wolf et al., 2015). The slightly lower repeatability was due to a more compact spectrometer design, which allowed for the integration of the system in a 19 in. rack at the cost of a higher optical noise level and larger drifts due to the harsher conditions in the mobile lab, i.e. higher temperature variations and vibrations.
4.3 Variability of N2O concentrations and isotopic composition above De-Fen
During the day, the atmospheric boundary layer (ABL) and the lowest part of the ABL (surface layer) are well mixed due to turbulence arising from buoyancy and wind shear (Ibbetson, 1994). At night, stable stratification attenuates vertical mixing processes, also leading to generally lower horizontal wind speeds. Both entail accumulation of local soil-emitted N2O in the surface layer. For this reason, daytime N2O concentrations and isotopic composition mostly reflect the atmospheric background, while the night-time accumulation reflects the influence of soil-emitted N2O.
Variations in N2O, SP, δ15Nbulk, and δ18O follow a diurnal pattern that is in agreement with the variations in N2O concentrations depicted in Fig. 4. Accordingly, average daytime N2O concentrations, δ15Nbulk, SP, and δ18O of 331.6±1.41 ppb, 6.28±0.30 ‰, 17.95±0.15 ‰, and 45.54±0.27 ‰, respectively, are in agreement with background measurements at other sites, such as Dübendorf, Switzerland (N2O: 325.8±3.3 ppb; δ15Nbulk: 6.53±0.14 ‰; SP: 17.95±0.40 ‰; δ18O: 44.41±0.13 ‰; Harris et al., 2017) or Hateruma Island, Japan (decadal mean values for the Northern Hemisphere of δ15Nbulk: 6.65 ‰; SP: 18.44 ‰; δ18O: 44.21 ‰; Toyoda et al., 2013). Observed changes in N2O concentrations and isotopic composition at night are within the range of previous studies from agricultural sites (Wolf et al., 2015; Toyoda et al., 2011) but clearly higher than variations measured at 13 or 95 m a.g.l. in an urban or suburban environment (Harris et al., 2014, 2017).
4.3.1 N2O footprints
At night, within a stable nocturnal boundary layer, vertical wind speeds and hence tracer transport are low, while lateral wind speeds can be high and constituents like N2O can be transported over larger distances. As a result, N2O emissions from other land uses or land cover have contributed to the observed N2O isotopic composition. To assess the influence of other land use or land cover, the concentration footprint calculated with FLEXPART-COSMO was assessed for periods where the Keeling plot and Miller–Tans approaches were applied. The FLEXPART-COSMO simulations indicate that between 15 % and 45 % of the source sensitivity originates from areas within approximately 300 to 700 m distance to the sample inlet, respectively (isolines in Fig. 7). Highest source sensitivities which amounted to 30 % of the total sensitivity were calculated for areas predominately covered by grassland or pasture. Although sources outside this local area contributed more than half of the total emissions and included other land cover such as arable land and forest, the impact of individual source areas was smaller by several orders of magnitude, hence having much less impact on the isotopic source signature. While more than 95 % of the area covered by the 15 % isopleth (bold isolines in Fig. 7) corresponds to grasslands, the residual 5 % belongs to a wetland to the northeast of the De-Fen (Fig. 7). Furthermore, the 30 % and 45 % isopleth's surfaces include approximately 20 % of mixed forest and 5 % wetland along with around 75 % under grassland, underlining further that sensitivities were highest for grassland-emitted N2O.
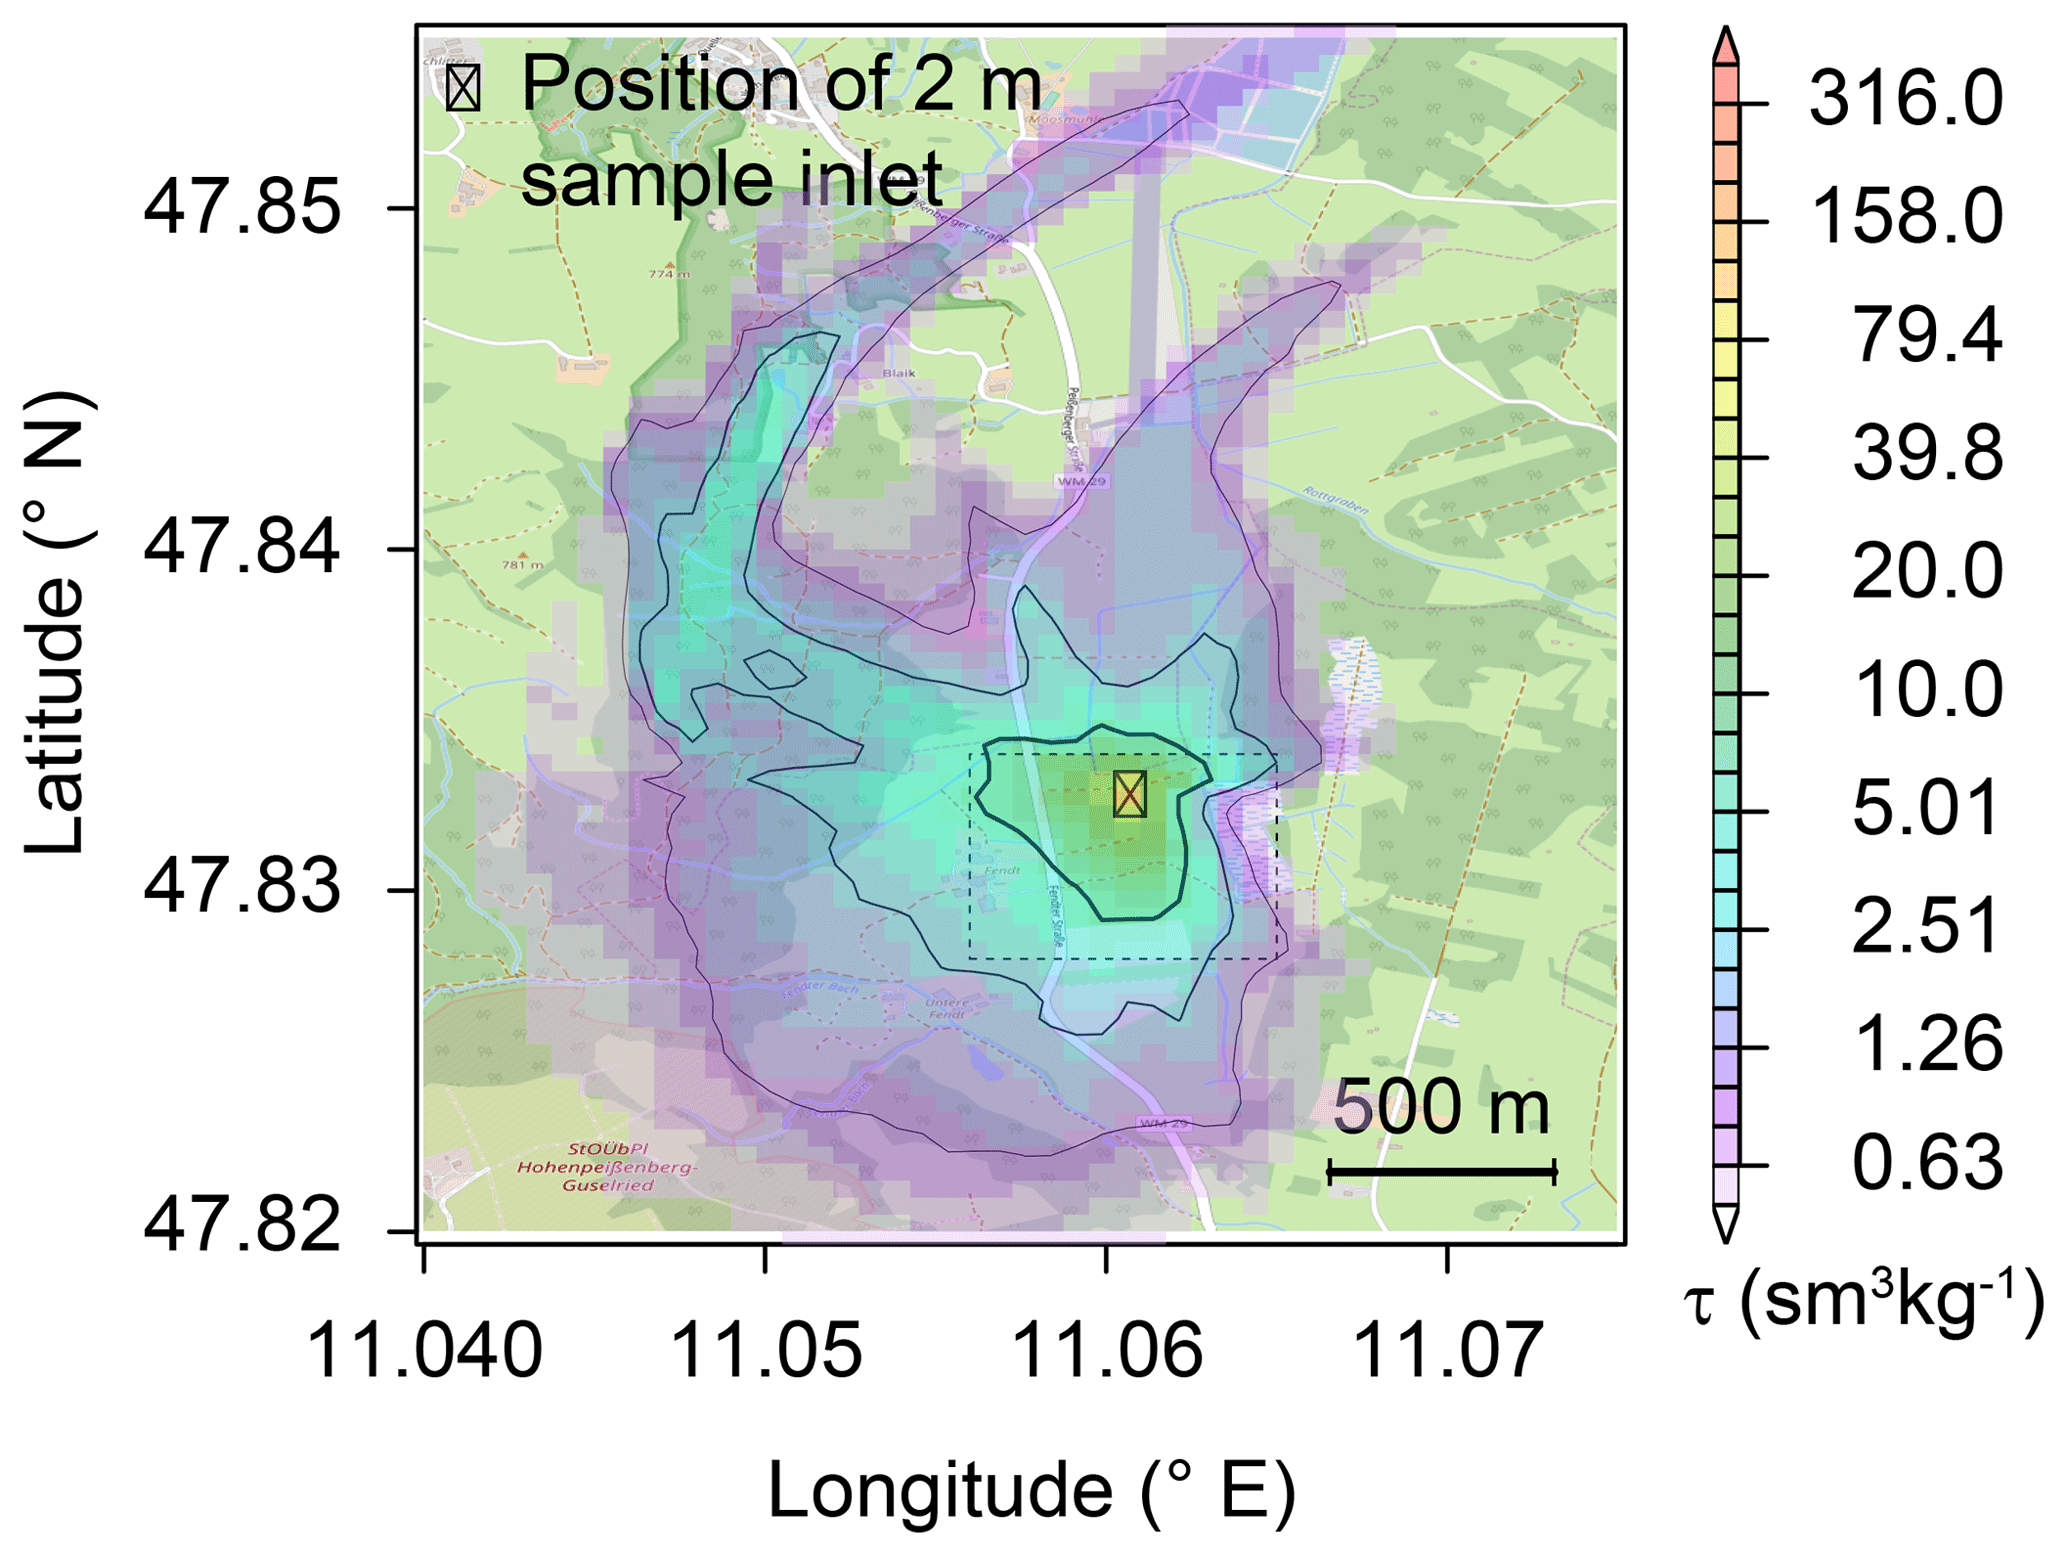
Figure 7The average footprint area as calculated by the FLEXPART-COSMO model. The model was driven with local wind vectors and observed N2O flux rates and indicates a major contribution of soils south-west of the ambient air inlet. The source sensitivities tau (τ) are given as the product of residence time (in seconds) and inverse atmospheric density (in m3 kg−1). Isolines enclose the areas of largest source sensitivities summing up to 15 %, 30 %, and 45 % (decreasing thickness of lines) of the total simulated source sensitivity. The dashed rectangle indicates the area depicted in Fig. 1. Individual source signatures for the 12 events are provided in the Supplement (Fig. S11). © OpenStreetMap contributors 2019. Distributed under a Creative Commons BY-SA License.
In addition to the N2O footprint, the temporal trend of the N2O concentration at the sampling point was simulated using individual source sensitivities and assuming a homogeneous N2O flux identical to measured local N2O fluxes (see Sect. 2.2). Simulated N2O concentrations were in very good agreement with N2O concentrations measured by the TREX-QCLAS (Fig. S10), indicating that the simulated footprint, attributing a substantial part of the emissions to the De-Fen grassland, is representative of the measurement site. Furthermore, N2O concentration measurements obtained with TREX-QCLAS were in a good agreement with the local N2O flux measurements (Fig. 2).
4.4 N2O source signatures and implicated processes
4.4.1 Comparison Miller–Tans and Keeling plot techniques
Figure 5 shows the temporal trends of the N2O source signatures, illustrating the potential of this quasi-continuous dataset to identify process changes induced by management events or changing environmental parameters. The dataset also enables a direct comparison of two approaches for extracting the isotopic composition of N2O emitted from soils based on surface layer measurements, namely the Keeling plot and the Miller–Tans approach. In the first 3 weeks of the campaign, i.e. under conditions of low N2O fluxes, the Keeling plot results did not pass the quality criterion, and the source signatures, i.e. the calculated isotopic composition of N2O emitted from soil (δ15Nbulk, SP, δ18O) derived from the Miller–Tans method, showed relatively large uncertainties and amounted to 2.8 ‰–9.8 ‰, 2.3 ‰–10.6 ‰, and 4.6 ‰–12.9 ‰, respectively (shaded areas in Fig. 5). Thereafter, N2O source signatures as estimated with the Keeling plot and Miller–Tans approaches show a comparable trend and mostly agree within the indicated uncertainties without systematic deviations. Overall, the agreement (R2 value) between the Miller–Tans and Keeling plot results is best for δ15Nbulk (0.84), intermediate for SP (0.57), and weakest for δ18O (0.39) (Fig. 5). The weaker correlation for δ18O-N2O can be explained by a lower analytical data quality as compared to δ15Nbulk and SP, exemplified by a higher standard deviation for repeated measurements of the target gas (0.59 ‰ for δ18O and 0.41 ‰ for δ15Nbulk and SP). The reasoning behind this effect might be that the calibrated range of δ18O values (S1, S2) does not cover the isotopic composition of the target and sample gases because no suitable calibration gas was available. A difference of 7 ‰ in δ18O between the two calibration gases is rather small, leading to a relatively high uncertainty in the respective calibration factors.
The base calculation for both the Keeling plot and Miller–Tans is identical and the two methods would yield identical results if every term was known perfectly. However, the uncertainty term is treated differently in the two approaches. The Miller–Tans approach calculates source signatures for individual sample gas measurements (Fig. S3) and, thus, may be the better choice when the source process or the background N2O isotopic composition changes rapidly, i.e. during a 24 h period. However, the large fluctuations in the source signatures (up to 100 ‰, Fig. 5) extracted by the Miller–Tans approach prior to 22 June indicate that the uncertainty estimated for the Miller–Tans approach is too optimistic and needs to be reassessed. In addition, it is noteworthy that the Keeling plot approach as presented here implicitly considers changes in background N2O concentration from day to day, since one Keeling plot (comprising both N2O background and N2O variations) was carried out per day. Therefore, we conclude that the Keeling plot method remains a robust way of estimating source signatures of N2O emitted from a predominantly agricultural landscape as the one presented here, where variations in background N2O compared to source contributions can be neglected and changes in source processes generally occur only on long timescales as a response to changes in environmental conditions (e.g. WFPS).
4.4.2 Range of N2O source signatures
Typical source signatures of biologically produced N2O are approx. −40 ‰ to 0 ‰ and 0 ‰ to 40 ‰ for δ15Nbulk and SP, respectively, while δ18O-N2O are around 40 ‰ and 70 ‰ for N2O emitted through grasslands or wetlands, respectively (Toyoda et al., 2017). Accordingly, the δ15Nbulk values found in our study are well within literature values of grassland-emitted N2O, while the SP values are rather high. Interestingly, the obtained δ18O values were strongly elevated on some occasions and close to those found by Ostrom et al. (2007) in a pure culture experiment in which approx. 80 % of produced N2O was reduced to N2. A correlated increase in the SP, δ15Nbulk, and δ18O values, with SP values potentially larger than the endmember value of 32.8±4 ‰, can be explained by N2O reduction to N2, which is particularly active under wet and anaerobic soil conditions (Wrage et al., 2004; Lewicka-Szczebak et al., 2017). Thus, isotopic fractionation during partial N2O reduction must be taken into account in order to apportion isotopic source signatures of soil-emitted N2O (Lewicka-Szczebak et al., 2017; Verhoeven et al., 2019). The fractionation factors ε18O/ε15Nbulk, ε18O/εSP, and ε15Nbulk∕εSP have been determined in a number of incubation experiments, and it has been suggested that their ratios (2.4, 2.8, and 1.2, respectively) may be indicators of N2O reduction (Koba et al., 2009). It has to be mentioned, however, that fractionation factors may deviate depending on environmental conditions (Koster et al., 2013) or even over the course of a single experiment due to multiple reaction steps involved (Haslun et al., 2018). Furthermore, δ18O-N2O of denitrification is affected by oxygen exchange between reaction intermediates (, ) and soil water as a function of WFPS (Well et al., 2008; Kool et al., 2011).
4.4.3 N2O source partitioning using SP and Δδ15Nbulk
An SP-versus-Δδ15Nbulk (Fig. 8a) mapping approach as originally presented by Koba et al. (2009) was used to interpret the Keeling-plot-derived source signatures with respect to the possible underlying N2O producing and consuming processes. Here, Δδ15Nbulk denotes the δ15N difference between the product N2O and its substrate (). While Koba et al. (2009) applied this approach in the framework of a groundwater study where was the only available N2O substrate, the grassland research site De-Fen showed rather high concentrations (Fig. 3b). Therefore, the N2O substrate at De-Fen might be either for N2O emitted by nitrification (N) and nitrifier denitrification (ND) or from fungal denitrification (FD) and bacterial denitrification (BD). Within the framework of this study, it was assumed that δ15N- and δ15N- values were in a similar range, i.e. approx. 0 ‰–15 ‰, in agreement with the literature (Mook, 2002; Holland, 2011). We thus used only the δ15N- values for the substrate isotopic composition. For periods where N2O emissions were present but no δ15N- values were obtained, the δ15N- values were approximated by linear interpolation. In addition, the concept of Koba et al. (2009) was modified for the two N2O-emitting domains FD/N (fungal denitrification and/or nitrification) and BD/ND (bacterial denitrification and/or nitrifier denitrification) using literature values as provided in Table 4. For simplicity, in the remaining part of this section the flux-weighted average values of SP and Δδ15Nbulk are discussed, while values of individual events can be found in Table 4. Plotting SP vs. Δδ15Nbulk revealed that there was a trend of increasing SP with decreasing Δδ15Nbulk values. As indicated in Fig. 8 with orange crosses, the flux-averaged SP, Δδ15Nbulk, and δ18O values were 23.4 ‰, 19.0 ‰, and 62.3 ‰, respectively. The slope of the SP-versus-Δδ15Nbulk linear regression line of −0.85 (solid red arrow in Fig. 8a) is in agreement with literature values (−0.83 and −1.1) given by Koba et al. (2009) and Toyoda et al. (2017) for partial N2O-to-N2 reduction. This observed negative slope, which is in contrast with the grey shaded area anticipated for mixing of N2O produced by BD/ND and FD/N indicates a major contribution of BD/ND and N2O reduction to N2, the final reaction step in the anoxic reduction of to N2. The suspected predominance of denitrification agrees with previous field studies presented by Opdyke et al. (2009), Wolf et al. (2015), and Mohn et al. (2012). Figure S9 illustrates contributions of FD/N to the total N2O emissions for individual accumulation events.
Table 4Characterization of lower and upper SP, Δδ15N, and Δδ18O boundaries for the two N2O-emitting domains fungal denitrification and/or nitrification (FD/N) and bacterial denitrification and/or nitrifier denitrification (BD/ND) according to the literature. All values are given in per mil (‰).
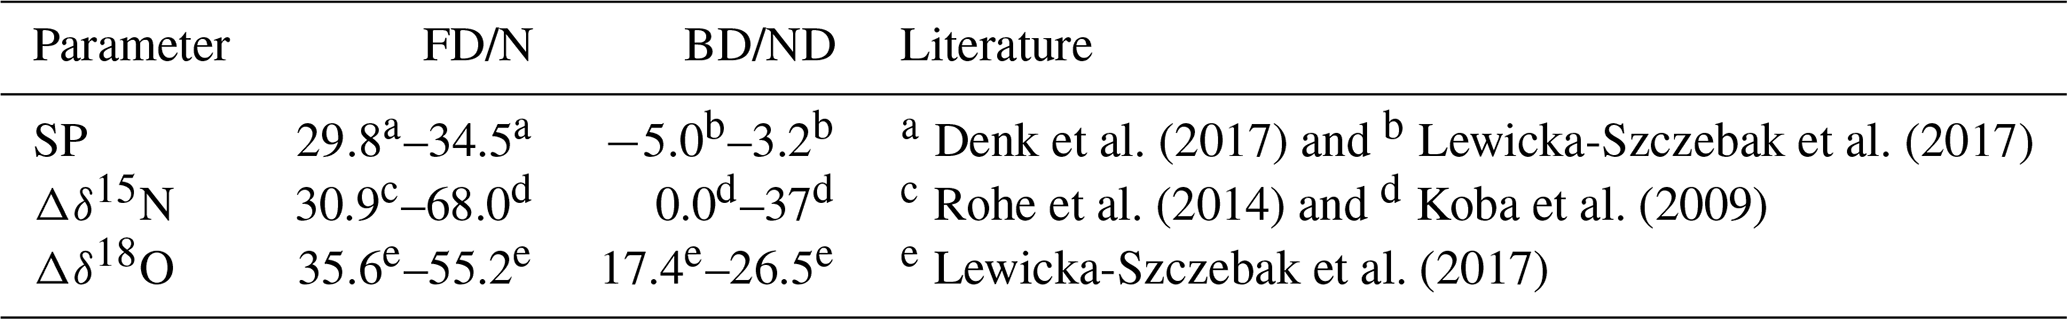
a The numbers 29.8 and 34.5 refer to the 0.25 and 0.75 quantiles of all values compiled by Denk et al. (2017) in Table S12 for the indices 1–3. c Lowest absolute isotope effect (η) of reduction to N2O by fungal denitrification as found by Rohe et al. (2014). d Taken from Koba et al. (2009) (referring to Yoshida, 1988).
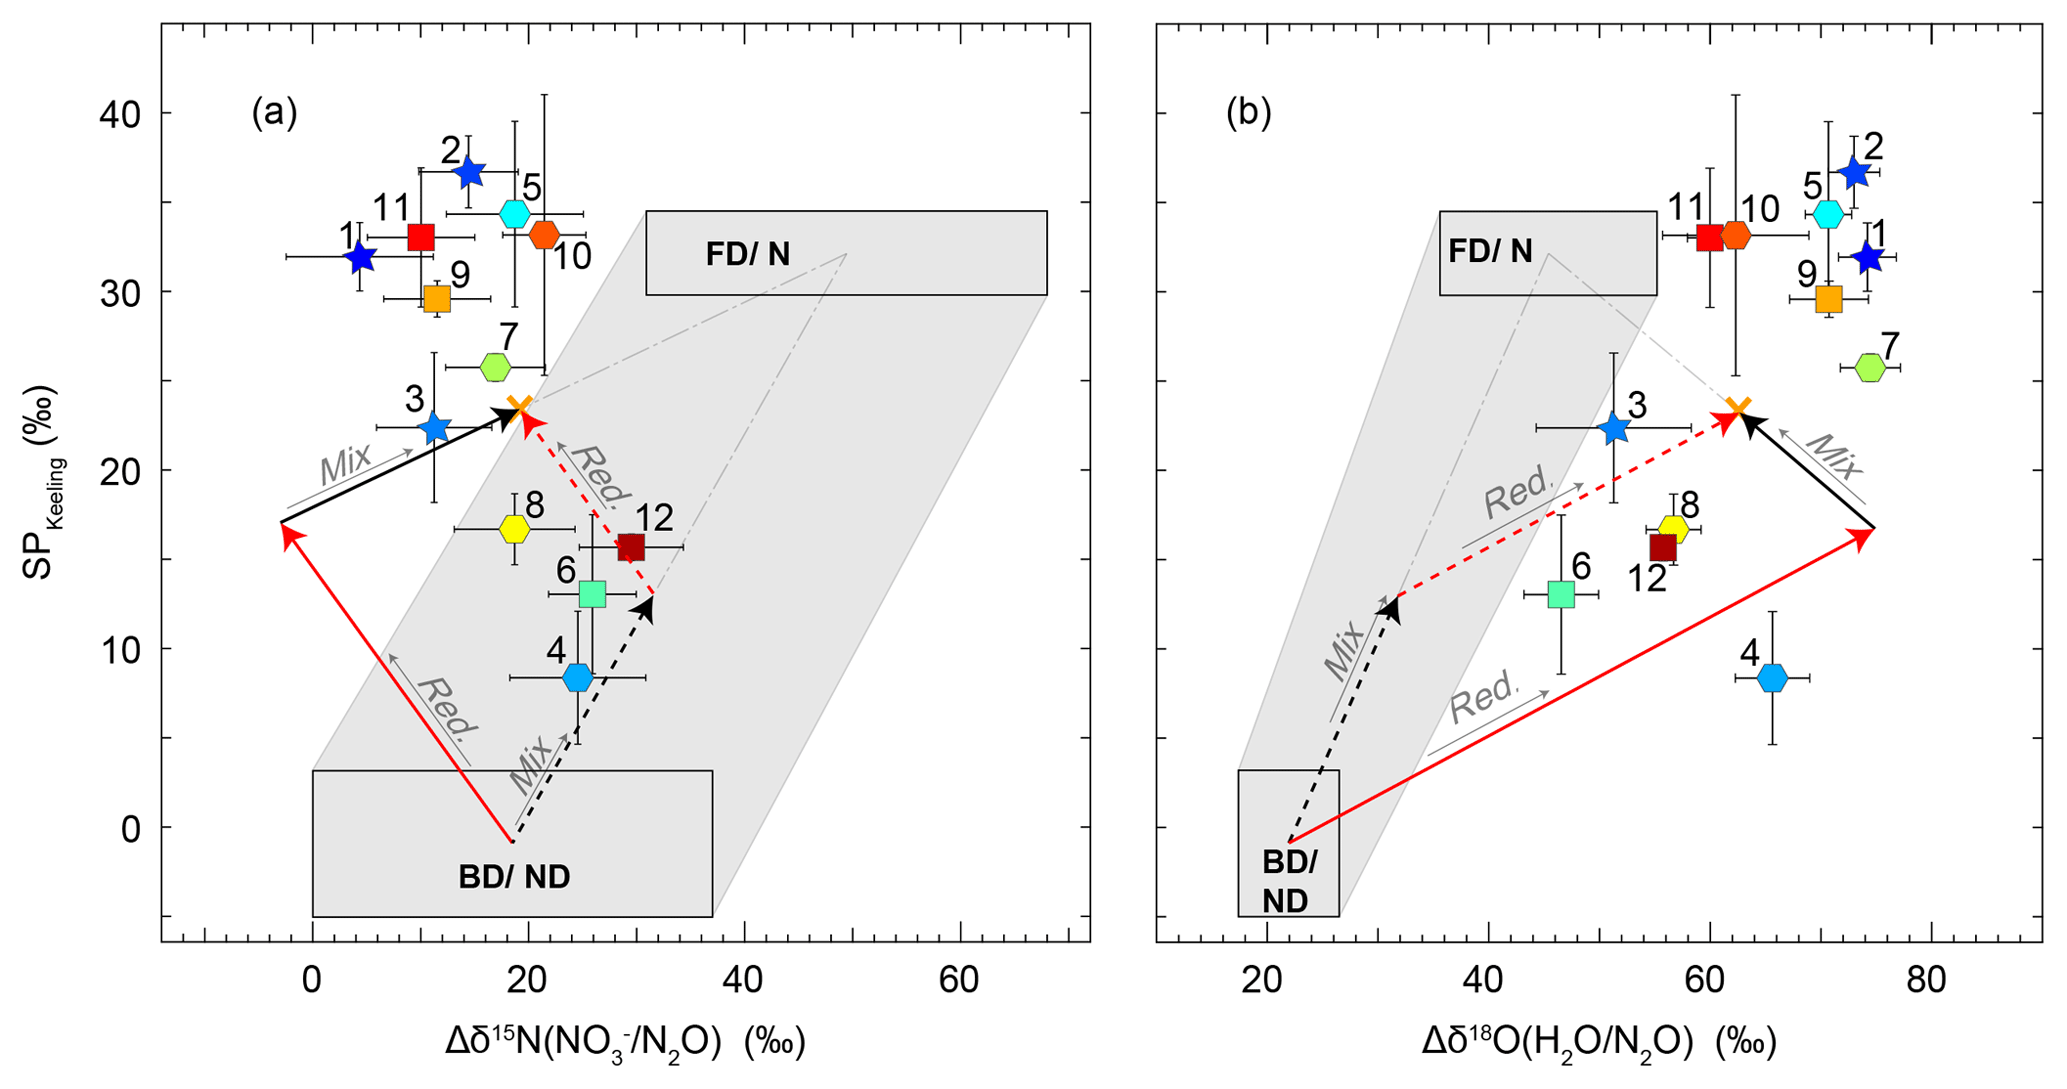
Figure 8Source signatures of soil-emitted N2O for 22 to 24 June (stars 1–3), 9 to 12 July (squares 6, 9, 11, and 12), and 17 to 21 July (hexagons 4, 5, 7, 8, and 10). The colour coding of the symbols refers to WFPS, where blue corresponds to high and red corresponds to low WFPS (exact values in Table 3). The source signatures of fungal denitrification- and/or nitrification-derived N2O (FD/N) and bacterial-denitrification- and/or nitrifier-denitrification-derived N2O (BD/ND) are highlighted with rectangles according to the values given in Table 4, and the shaded area represents the mixing region of the two domains. The orange cross indicates the flux-averaged values of the respective source signatures. Red arrows denote the path of partial N2O reduction to N2, while black arrows indicate the direction of mixing with FD/N-derived N2O. Solid arrows indicate scenario 1 (first reduction, then mixing), while dashed arrows indicate scenario 2 (first mixing, then reduction). (a) SP versus Δδ15N map according to Koba et al. (2009), where . (b) SP versus Δδ18O of soil-emitted N2O according to Lewicka-Szczebak et al. (2017), where , the isotope effect between soil water, and formed N2O. Δδ18O for BD/ND is considered to be constant because of the high oxygen exchange between soil water and reaction intermediates at high WFPS. An exemplary illustration is provided in the Supplement (Fig. S4).
A semi-quantitative source partitioning can be calculated assuming average SP (−0.9 ‰) and Δδ15Nbulk (18.5 ‰) values for N2O production by BD/ND and a fixed SP ∕ Δδ15Nbulk ratio of −0.83 for N2O reduction to N2 (Fig. 8a). Correspondingly, the simultaneous SP increase and Δδ15Nbulk decrease during N2O reduction to N2 can be interpreted in terms of the product ratio using the Rayleigh fractionation approach of Mariotti et al. (1981). Accordingly, a 90 % reduction of N2O translates into an increase in SP by 13.6 ‰ assuming an SP fractionation factor (εSP) of −5.9 ‰ in accordance with Ostrom et al. (2007). Using a single ε(SP) value is a simplification, however, as fractionation factors might vary, e.g. depending on WFPS (Jinuntuya-Nortman et al., 2008) and product ratio (Lewicka-Szczebak et al., 2015). A deviation of source signatures from the SP ∕ Δδ15Nbulk line can then be interpreted in terms of an addition of N2O produced by additional processes, e.g. FD/N. This interpretation is supported by the relationship between SP and WFPS (Fig. 6). Accordingly, the lowest SP values were found at intermediate to high soil water contents (80 %–90 % WFPS) along with maximum N2O fluxes, while SP values increased towards lower WFPS values, due to the increasing contribution of nitrification, and towards higher WFPS values, due to increasing N2O reduction to N2. Furthermore, the fraction of FD/N-derived N2O increased with fertilization, also in agreement with the literature (Toyoda et al., 2011; Koster et al., 2011).
A semi-quantitative interpretation of isotope signatures can be done assuming average source signature values (SP and Δδ15Nbulk) and considering two scenarios (see also Fig. S4): in scenario 1, BD/ND-produced N2O is partially reduced to N2 and the residual N2O (rN2O; remaining N2O after N2O reduction to N2) is then mixed with N2O derived from FD/N (path of solid arrows in Fig. 8a). In scenario 2, N2O from BD/ND is mixed with FD/N-derived N2O before a part of the mixed N2O is reduced to N2 (path of dashed arrows in Fig. 8a). While these scenarios result in equal source signatures, they assign different relative contributions of the processes involved. The respective N2O to N2 reduction rates can be calculated based on the associated shift in SP, which corresponds to the y component of each of the red arrows in Fig. 8a.
For convenience, here we only discuss the reduction rates and source partitioning of the two scenarios for flux-averaged SP and Δδ15Nbulk values (23.4 and 19.0, respectively), while those of individual events could be estimated analogously (related results given in Table 3). Assuming scenario 1, the SP shift caused by N2O reduction is equal to 18.0 ‰, resulting in a reduction rate of approx. 95 % assuming ‰. The remaining 5.4 ‰ SP shift can be explained as the result of mixing the rN2O with FD/N-derived N2O. A 5.4 ‰ SP shift corresponds to an approx. 38 % contribution of FD/N-derived N2O with the residual N2O emitted by BD/ND. Note that the FD/N contribution is less than 1 % when accounting for the total N2O production, i.e. the N2O before partial reduction to N2. In contrast, in scenario 2, the FD/N-derived N2O is mixed with BD/ND-derived N2O first. This mixing induces an SP shift of approx. 13.0 ‰, which is given by the y coordinate of the intersection of the mixing line and the reduction line of the mean source signatures. However, since no N2O reduction to N2 has occurred yet at this point, this shift corresponds to a 39 % contribution of FD/N to total N2O production. The remaining 10.4 ‰ SP shift is then subject to reduction of N2O to N2, corresponding to an approx. 83 % reduction of N2O to N2.
4.4.4 N2O source partitioning using SP and Δδ18O(N2O∕H2O)
The identification of the processes producing and consuming N2O was also done using an adapted SP-versus-Δδ18O(N2O∕H2O) mapping approach (Fig. 8b) as previously presented by Lewicka-Szczebak et al. (2017). This approach was suggested because the values of δ18O-N2O from BD/ND and FD/N are less variable than those of δ15N-N2O. The lower variability is indicated by the smaller BD/ND and FD/N boxes in Fig. 8b compared to Fig. 8a; thus, using this approach reduces the uncertainty of the calculated relative contributions of the different processes as the boxes are used to span the mixing line. Δδ18O(N2O∕H2O) for denitrification is considered to be constant (Lewicka-Szczebak et al., 2016), in particular under high WFPS associated with close to 100 % oxygen exchange between soil water and reaction intermediates (Kool et al., 2011). The approach was slightly modified using the values presented in Table 4 to match the FD/N and the BD/ND domains according to Fig. 8a with regard to SP values. In this approach, Δδ18O(N2O∕H2O) represents the difference between the δ18O values of the product (N2O) and the substrate (H2O). Since no measurements for δ18O-H2O were available, we used a value of −8 ‰ in accordance with Xiahong et al. (2009). Values obtained for Δδ18O(N2O∕H2O) were clearly higher than previously observed in grassland soils (Wrage et al., 2004; Wolf et al., 2015; Snider et al., 2012) but particularly close to Δδ18O(N2O∕H2O) values from studies related to wetland ecosystems (Toyoda et al., 2017; Snider et al., 2009), likely reflecting the fact that the study site was in the vicinity of a wetland (see Sect. 4.3.1 and Wolf et al., 2017) and often flooded due to extraordinary precipitation events throughout the measurement period.
In the mapping approach suggested by Lewicka-Szczebak et al. (2017), two scenarios are considered to estimate the shift in N2O isotopic composition due to N2O reduction to N2. In Fig. 8b, the y component of the red arrows represents the SP shift that was caused by N2O reduction to N2. Knowledge of the degree to which SP has been changed due to fractionation during N2O reduction is a prerequisite for determining the relative contributions of the process groups BD/ND and FD/N using a simple mixing model and the SP values given in Table 4. Scenario 1 assumes that BD/ND-derived N2O is partly reduced to N2 before mixing with N2O originating from FD/N, while scenario 2 assumes the reverse order (i.e. first mixing, then N2O reduction). The two scenarios yield different reduction rates and proportions of BD/ND- versus FD/N-derived N2O, although final N2O source signatures are identical. A quantitative estimate of source contributions was conducted for the flux-averaged mean values of 23.4 ‰ and 62.3 ‰ for SP and Δδ18O(N2O/H2O) as follows: using scenario 1 (depicted with solid arrows in Fig. 8b), N2O reduction to N2 has led to an SP shift of approx. 17.3 ‰, which corresponds to an approx. 95 % N2O reduction. The residual SP shift of 6.1 ‰ would be caused by the mixing of FD/N-derived N2O with the rN2O, corresponding to approx. 19 % FD/N-derived N2O compared to BD/ND. The 19 % mentioned here only accounts for the mixing with the rN2O but not for the initially produced N2O. Taking into account that 95 % of the N2O initially produced was reduced to N2 reveals that the FD/N contribution to total N2O production was below 1 %. In contrast, in scenario 2, the FD/N-derived N2O is mixed into the N2O pool before N2O reduction to N2 has occurred. Therefore, approx. 29 % FD/N-derived N2O is needed to account for a 16 ‰ SP shift in the produced N2O. In this case, the residual SP shift of 9 ‰ is due to N2O reduction, corresponding to a 79 % reduction rate with ‰.
4.4.5 Comparison of the results obtained with the SP-vs.-Δδ15Nbulk and SP-vs.-Δδ18O(N2O∕H2O) approaches
In summary, the two scenarios lead to different calculated relative amounts of N2O produced by BD/ND and FD/N as well as the emissions ratio of N2O to N2. The average contribution of FD/N to the N2O emissions was 42 % and 34 % according to the SP-vs.-Δδ15Nbulk and SP-vs.-Δδ18O(N2O∕H2O) approaches, respectively (distributions given in Fig. S8, temporal trend given in Fig. S9). However, regardless of the approach and scenario, the obtained rN2O values were very low, indicating that N2O reduction played a major role. The median of the rN2O values obtained with the SP-vs.- approach was 0.02 for scenario 1 and 0.10 for scenario 2. Utilizing the SP-vs.-Δδ18O(N2O∕H2O) approach, those values were even slightly lower and corresponded to 0.01 in scenario 1 and 0.02 in scenario 2 (Fig. S5). Interestingly, the two rN2O values calculated for scenario 1 with the two approaches were highly correlated, while those for scenario 2 were not correlated (Fig. S5). This indicates that scenario 1 more likely occurred at our site.
The rN2O values were also compared to the WFPS (Fig. S6) and to the ambient temperature (Fig. S7). A positive correlation should be expected between WFPS and the N2O reduction rates, resulting in a negative correlation between WFPS and rN2O values. However, observed rN2O values did not reflect this hypothesis. Similarly, one could expect a positive correlation between rNit (the fraction of measured N2O originating from fungal denitrification or nitrification, therefore with high SP values) and rN2O, since the contributions of fungal denitrification and nitrification should be higher under conditions that are disadvantageous for N2O reduction. However, this hypothesis was also refuted by these results.
Our findings confirm that natural abundance isotope studies of N2O provide a way to trace N2O production or destruction pathways, in particular when combined with supportive parameters or isotope modelling approaches (Denk et al., 2017). However, the complexity of N2O production pathways could not be fully accounted for, in particular abiotic processes; for example, N2O production by NH2OH oxidation (Heil et al., 2014) or reduction (Wei et al., 2017a) were not considered. These reactions yield N2O with high (34 ‰–35 ‰) or variable (8 ‰–12 ‰) SP and might therefore be falsely interpreted as nitrification-derived N2O. In addition, the approach cannot resolve individual processes with high SP, i.e. fungal denitrification versus nitrification, or low SP, i.e. heterotrophic versus nitrifier denitrification, due to overlapping source signature regions. Furthermore, nitrite () and nitric oxide (NO) could have acted as the substrate instead of , leading to different fractionation factors from those incorporated for .
4.4.6 Effect of manure application on the source signatures
In addition to the mapping approaches discussed above, N2O source signatures can be interpreted with respect to management events. After the manure application on 12 July and rainfall events in the days thereafter a strong shift to lower SP and δ15Nbulk values was observed (Fig. 5). The negative shift in δ15Nbulk might be explained by changes in the isotopic composition of the applied precursors, by an enhanced fractionation due to higher substrate availability or changes in process conditions (e.g. WFPS, see sections above). However, since SP is considered to be process-specific and substrate-independent (Yoshida and Toyoda, 2000), it should not change as a response to a change in the substrate isotopic composition or by enhanced fractionation. There are two alternative explanations for the lower SP and δ15Nbulk values. The increase in concentration after manure application was followed by an increase in concentration. This indicates a stimulation of nitrification. An increase in N2O production due to nitrification would be associated with higher SP values. However, the nitrate produced during nitrification may have been used as a substrate for denitrification, given the increase in WFPS due to intensive rainfall events. While N2O is an obligatory product of denitrification, and only a by-product of nitrification, the N2O yield of denitrification may have been higher and the increase in SP due to nitrification may have been outweighed by the decrease in SP due to denitrification. Secondly, N2O reduction to N2 could be slightly reduced due to an elevated availability (Wang et al., 2013). A parallel increase in WFPS and N2O flux rates after the manure application combined with low FD/N fraction in the period 17 to 22 July supports the hypothesis that both effects might have contributed to a decrease in SP values.
Real-time and in situ N2O concentration and isotope measurements were successfully performed at a temperate humid grassland site in southern Germany with a coupled pre-concentration technique and quantum cascade laser absorption spectroscopy (TREX-QCLAS) based method in a 2-month period between June and July 2016. Replicate in situ measurements of a pressurized air tank demonstrated a short-term repeatability of the TREX-QCLAS system of 0.25 ‰, 0.31 ‰, 0.30 ‰, and 0.25 ppb for δ15Nα, δ15Nβ, δ18O, and N2O concentration, respectively. The accuracy of results was ensured using a two point calibration that entirely spanned the range of obtained δ15Nα and δ15Nβ values but did not fully cover the range of obtained δ18O values. This is current best practice, as no suitable reference gases are available, but might lead to a somewhat larger uncertainty for δ18O-N2O. Concentrations of soil-extracted , , and δ15N- values were taken into account to interpret the N2O measurements. This study provides new insights into the isotopic composition of grassland-emitted N2O under changing soil environmental and management conditions. Our results support previous observations that bacterial denitrification and/or nitrifier denitrification (BD/ND) is the dominant N2O-emitting domain in permanent grassland soils. The measured N2O isotopic composition, in particular the intramolecular isotopic composition, or site preference (SP), can be explained by taking into account partial N2O reduction to N2. Two distinct approaches were used to estimate the relative contributions of BD/ND and FD/N as well as the N2O reduction rates. The average FD/N contribution to the total N2O emissions was 42 % and 34 % with the SP-vs.-Δδ15Nbulk and SP-vs.-Δδ18O approaches, respectively, indicating that denitrification dominated the N2O emissions. N2O reduction rates were estimated by calculating the residual N2O fractions (rN2O), i.e. the fraction of remaining N2O after N2O reduction to N2 has occurred. Two distinct scenarios were considered for each of the two approaches, resulting in the four rN2O values of 0.02, 0.10, 0.02, and 0.01. The low values underline both the dominant role of denitrification in N2O production at the grassland site and the large extent to which N2O reduction occurred during the measurement period.
This study demonstrates the suitability of the TREX-QCLAS for in situ analysis of the isotopic composition of soil-emitted N2O in terrestrial ecosystems. While the observations presented here integrate N2O fluxes and thus source processes at the plot scale, the interpretation of source processes in future studies will be resolved at smaller spatial scales, for example by a combination of TREX-QCLAS with static flux chambers and the implementation of an isotopic biogeochemical soil model. In particular, an approach based on the combination of the TREX-QCLAS method with static flux chambers would allow us to distinguish between the two scenarios (reduction then mixing vs. mixing then reduction) discussed in this study.
Data are available at https://doi.org/10.17605/OSF.IO/QPRJZ (Ibraim et al., 2019).
The supplement related to this article is available online at: https://doi.org/10.5194/bg-16-3247-2019-supplement.
EI prepared and carried out field work, data analysis, and preliminary paper writing. BW was a consultant during field work, responsible for N2O flux measurements with GC-ECD. EH carried out the Miller–Tans simulations. RG carried out soil moisture measurements. JW, LY, and SE provided technical and analytical support. RK was responsible for the project conception and paper writing. KBB was responsible for the project conception and paper writing. MZ provided wind data for the FLEXPART-COSMO simulations. BT provided support for custom adaptations related to the QCLAS. LE provided technical support related to TREX-QCLAS and was responsible for the project conception and paper writing. JS was responsible for the project conception and paper writing. SH carried our FLEXPART-COSMO simulations. JM supervised Erkan Ibraim throughout the whole project and was responsible for the project conception and paper writing.
The authors declare that they have no conflict of interest.
This article is part of the special issue “The 10th International Carbon Dioxide Conference (ICDC10) and the 19th WMO/IAEA Meeting on Carbon Dioxide, other Greenhouse Gases and Related Measurement Techniques (GGMT-2017) (AMT/ACP/BG/CP/ESD inter-journal SI)”. It is a result of the 19th WMO/IAEA Meeting on Carbon Dioxide, Other Greenhouse Gases, and Related Measurement Techniques (GGMT-2017), Empa Dübendorf, Switzerland, 27–31 August 2017.
This project was financially supported by the Swiss National Science Foundation within the grant number 200021L_150237 and 200020L_172585/1 and the German Research Foundation, grant number BU 1173/15-1 and ZE 1006/2-1. The TERENO pre-Alpine Observatory infrastructure is funded by the Helmholtz Association and the Federal Ministry of Education and Research. Pietro Ferretti is acknowledged for his technical support in constructing the chemical trap module. We would like to thank the anonymous reviewers of this article.
This research has been supported by the Schweizerischer Nationalfonds zur Förderung der Wissenschaftlichen Forschung (grant nos. 200021L_150237 and 200020L_172585/1) and the Deutsche Forschungsgemeinschaft (grant nos. BU 1173/15-1 and ZE 1006/2-1).
This paper was edited by Fortunat Joos and reviewed by Nathaniel Ostrom and one anonymous referee.
Billings, S. A.: Nitrous oxide in flux, Nature, 456, 888–889, https://doi.org/10.1038/456888a, 2008.
Brenninkmeijer, C. A. M. and Röckmann, T.: Mass spectrometry of the intramolecular nitrogen isotope distribution of environmental nitrous oxide using fragment-ion analysis, Rapid Commun. Mass Sp., 13, 2028–2033, https://doi.org/10.1002/(SICI)1097-0231(19991030)13:20<2028::AID-RCM751>3.0.CO;2-J, 1999.
Brunner, D., Henne, S., Keller, C. A., Vollmer, M. K., Reimann, S., and Buchmann, B.: Estimating European halocarbon emissions using lagrangian backward transport modeling and in situ measurements at the Jungfraujoch high-alpine site, Geophysical Monograph Series, https://doi.org/10.1029/2012gm001258, American Geophysical Union, 2012.
Butterbach-Bahl, K., Gasche, R., Breuer, L., and Papen, H.: Fluxes of NO and N2O from temperate forest soils: impact of forest type, N deposition and of liming on the NO and N2O emissions, Nutr. Cycl. Agroecosys., 48, 79–90, https://doi.org/10.1023/a:1009785521107, 1997.
Butterbach-Bahl, K., Baggs, E. M., Dannenmann, M., Kiese, R., and Zechmeister-Boltenstern, S.: Nitrous oxide emissions from soils: how well do we understand the processes and their controls?, Philos. T. Roy. Soc. B, 368, 23713120, https://doi.org/10.1098/rstb.2013.0122, 2013.
Casciotti, K. L., Sigman, D. M., Hastings, M. G., Böhlke, J. K., and Hilkert, A.: Measurement of the Oxygen Isotopic Composition of Nitrate in Seawater and Freshwater Using the Denitrifier Method, Anal. Chem., 74, 4905–4912, https://doi.org/10.1021/ac020113w, 2002.
Cavigelli, M. A., Del Grosso, S. J., Liebig, M. A., Snyder, C. S., Fixen, P. E., Venterea, R. T., Leytem, A. B., McLain, J. E., and Watts, D. B.: US agricultural nitrous oxide emissions: context, status, and trends, Front. Ecol. Environ., 10, 537–546, https://doi.org/10.1890/120054, 2012.
Decock, C. and Six, J.: How reliable is the intramolecular distribution of N-15 in N2O to source partition N2O emitted from soil?, Soil Biol. Biochem., 65, 114–127, https://doi.org/10.1016/j.soilbio.2013.05.012, 2013a.
Decock, C. and Six, J.: On the potential of δ18O and δ15N to assess N2O reduction to N2 in soil, Eur. J. Soil Sci., 64, 610–620, https://doi.org/10.1111/ejss.12068, 2013b.
Decock, C., Lee, J., Necpalova, M., Pereira, E. I. P., Tendall, D. M., and Six, J.: Mitigating N2O emissions from soil: from patching leaks to transformative action, SOIL, 1, 687–694, https://doi.org/10.5194/soil-1-687-2015, 2015.
Denk, T. R. A., Mohn, J., Decock, C., Lewicka-Szczebak, D., Harris, E., Butterbach-Bahl, K., Kiese, R., and Wolf, B.: The nitrogen cycle: A review of isotope effects and isotope modeling approaches, Soil Biol. Biochem., 105, 121–137, https://doi.org/10.1016/j.soilbio.2016.11.015, 2017.
Erler, D. V., Duncan, T. M., Murray, R., Maher, D. T., Santos, I. R., Gatland, J. R., Mangion, P., and Eyre, B. D.: Applying cavity ring-down spectroscopy for the measurement of dissolved nitrous oxide concentrations and bulk nitrogen isotopic composition in aquatic systems: Correcting for interferences and field application, Limnol. Oceanogr.-Meth., 13, 391–401, https://doi.org/10.1002/lom3.10032, 2015.
Eyer, S., Stadie, N. P., Borgschulte, A., Emmenegger, L., and Mohn, J.: Methane preconcentration by adsorption: a methodology for materials and conditions selection, Adsorption, 20, 657–666, https://doi.org/10.1007/s10450-014-9609-9, 2014.
Eyer, S., Tuzson, B., Popa, M. E., van der Veen, C., Röckmann, T., Rothe, M., Brand, W. A., Fisher, R., Lowry, D., Nisbet, E. G., Brennwald, M. S., Harris, E., Zellweger, C., Emmenegger, L., Fischer, H., and Mohn, J.: Real-time analysis of δ13C- and δD-CH4 in ambient air with laser spectroscopy: method development and first intercomparison results, Atmos. Meas. Tech., 9, 263–280, https://doi.org/10.5194/amt-9-263-2016, 2016.
Harris, E., Nelson, D. D., Olszewski, W., Zahnise, M., Potter, K. E., McManus, B. J., Whitehill, A., Prinn, R. G., and Ono, S.: Development of a Spectroscopic Technique for Continuous Online Monitoring of Oxygen and Site-Specific Nitrogen Isotopic Composition of Atmospheric Nitrous Oxide, Anal. Chem., 86, 1726–1734, https://doi.org/10.1021/ac403606u, 2014.
Harris, E., Henne, S., Hüglin, C., Zellweger, C., Tuzson, B., Ibraim, E., Emmenegger, L., and Mohn, J.: Tracking nitrous oxide emission processes at a suburban site with semicontinuous, in situ measurements of isotopic composition, J. Geophys. Res.-Atmos., 122, 1850–1870, https://doi.org/10.1002/2016JD025906, 2017.
Haslun, J. A., Ostrom, N. E., Hegg, E. L., and Ostrom, P. H.: Estimation of isotope variation of N2O during denitrification by Pseudomonas aureofaciens and Pseudomonas chlororaphis: implications for N2O source apportionment, Biogeosciences, 15, 3873–3882, https://doi.org/10.5194/bg-15-3873-2018, 2018.
Heil, J., Wolf, B., Brüggemann, N., Emmenegger, L., Tuzson, B., Vereecken, H., and Mohn, J.: Site-specific 15N isotopic signatures of abiotically produced N2O, Geochim. Cosmochim. Ac., 139, 72–82, https://doi.org/10.1016/j.gca.2014.04.037, 2014.
Henne, S., Brunner, D., Oney, B., Leuenberger, M., Eugster, W., Bamberger, I., Meinhardt, F., Steinbacher, M., and Emmenegger, L.: Validation of the Swiss methane emission inventory by atmospheric observations and inverse modelling, Atmos. Chem. Phys., 16, 3683–3710, https://doi.org/10.5194/acp-16-3683-2016, 2016.
Herrero, M., Henderson, B., Havlík, P., Thornton, P. K., Conant, R. T., Smith, P., Wirsenius, S., Hristov, A. N., Gerber, P., Gill, M., Butterbach-Bahl, K., Valin, H., Garnett, T., and Stehfest, E.: Greenhouse gas mitigation potentials in the livestock sector, Nat. Clim. Change, 6, 452, https://doi.org/10.1038/nclimate2925, 2016.
Holland, H. D.: Isotope geochemistry : from the treatise on geochemistry, Elsevier Academic Press, Amsterdam, 2011.
Ibbetson, A.: The atmospheric boundary layer. By J.R. Garratt, Cambridge University Press, 1992. Pp. 316. Price £50.00 (hardback). ISBN 0 521 38052 9, Q. J. Roy. Meteor. Soc., 120, 1428–1429, https://doi.org/10.1002/qj.49712051919, 1994.
Ibraim, E., Harris, E., Eyer, S., Tuzson, B., Emmenegger, L., Six, J., and Mohn, J.: Development of a field-deployable method for simultaneous, real-time measurements of the four most abundant N2O isotopocules, Isotopes Environ. Health Stud., 54, 1–15, https://doi.org/10.1080/10256016.2017.1345902, 2018.
Ibraim, E., Wolf, B., Harris, E., Gasche, R., Wei, J., Yu, L., Kiese, R., Eggleston, S., Butterbach-Bahl, K., Zeeman, M., Tuzson, B., Emmenegger, L., Six, J., Henne, S., and Mohn, J.: Attribution of N2O sources in a grassland soil with laser spectroscopy based isotopocule analysis, https://doi.org/10.17605/OSF.IO/QPRJZ, 2019.
IPCC: Climate Change 2007: The Physical Science Basis, edited by: Solomon, S., Qin, D., Manning, M., Chen, Z., Marquis, M., Averyt, K. B., Tignor, M., and Miller, H. L., Cambridge and New York, 2007.
Jinuntuya-Nortman, M., Sutka, R. L., Ostrom, P. H., Gandhi, H., and Ostrom, N. E.: Isotopologue fractionation during microbial reduction of N2O within soil mesocosms as a function of water-filled pore space, Soil Biol. Biochem., 40, 2273–2280, https://doi.org/10.1016/j.soilbio.2008.05.016, 2008.
Kato, S., Akimoto, H., Braeunlich, M., Rockmann, T., and Brenninkmeijer, C. A. M.: Measurements of stable carbon and oxygen isotopic compositions of CO in automobile exhausts and ambient air from semi-urban Mainz, Germany, Geochem. J., 33, 73–77, https://doi.org/10.2343/geochemj.33.73, 1999.
Keeling, C. D.: The Concentration and Isotopic Abundances of Atmospheric Carbon Dioxide in Rural Areas, Geochim. Cosmochim. Ac., 13, 322–334, https://doi.org/10.1016/0016-7037(58)90033-4, 1958.
Keeling, C. D.: The Concentration and Isotopic Abundances of Carbon Dioxide in Rural and Marine Air, Geochim. Cosmochim. Ac., 24, 277–298, https://doi.org/10.1016/0016-7037(61)90023-0, 1961.
Kiese, R., Fersch, B., Baessler, C., Brosy, C., Butterbach-Bahl, K., Chwala, C., Dannenmann, M., Fu, J., Gasche, R., Grote, R., Jahn, C., Klatt, J., Kunstmann, H., Mauder, M., Rödiger, T., Smiatek, G., Soltani, M., Steinbrecher, R., Völksch, I., Werhahn, J., Wolf, B., Zeeman, M., and Schmid, H. P.: The TERENO-preAlpine Observatory: integrating meteorological, hydrological and biogeochemical measurements and modelling, Vadose Zone J., 17, 180060, https://doi.org/10.2136/vzj2018.03.0060, 2018.
Koba, K., Osaka, K., Tobari, Y., Toyoda, S., Ohte, N., Katsuyama, M., Suzuki, N., Itoh, M., Yamagishi, H., Kawasaki, M., Kim, S. J., Yoshida, N., and Nakajima, T.: Biogeochemistry of nitrous oxide in groundwater in a forested ecosystem elucidated by nitrous oxide isotopomer measurements, Geochim. Cosmochim. Ac., 73, 3115–3133, https://doi.org/10.1016/j.gca.2009.03.022, 2009.
Kool, D. M., Wrage, N., Oenema, O., Van Kessel, C., and Van Groenigen, J. W.: Oxygen exchange with water alters the oxygen isotopic signature of nitrate in soil ecosystems, Soil Biol. Biochem., 43, 1180–1185, https://doi.org/10.1016/j.soilbio.2011.02.006, 2011.
Koster, J. R., Cardenas, L., Senbayram, M., Bol, R., Well, R., Butler, M., Muhling, K. H., and Dittert, K.: Rapid shift from denitrification to nitrification in soil after biogas residue application as indicated by nitrous oxide isotopomers, Soil Biol. Biochem., 43, 1671–1677, https://doi.org/10.1016/j.soilbio.2011.04.004, 2011.
Koster, J. R., Well, R., Tuzson, B., Bol, R., Dittert, K., Giesemann, A., Emmenegger, L., Manninen, A., Cardenas, L., and Mohn, J.: Novel laser spectroscopic technique for continuous analysis of N2O isotopomers – application and intercomparison with isotope ratio mass spectrometry, Rapid Commun. Mass Sp., 27, 216–222, https://doi.org/10.1002/rcm.6434, 2013.
Lewicka-Szczebak, D., Well, R., Bol, R., Gregory, A. S., Matthews, G. P., Misselbrook, T., Whalley, W. R., and Cardenas, L. M.: Isotope fractionation factors controlling isotopocule signatures of soil-emitted N2O produced by denitrification processes of various rates, Rapid Commun. Mass Sp., 29, 269–282, https://doi.org/10.1002/rcm.7102, 2015.
Lewicka-Szczebak, D., Dyckmans, J., Kaiser, J., Marca, A., Augustin, J., and Well, R.: Oxygen isotope fractionation during N2O production by soil denitrification, Biogeosciences, 13, 1129–1144, https://doi.org/10.5194/bg-13-1129-2016, 2016.
Lewicka-Szczebak, D., Augustin, J., Giesemann, A., and Well, R.: Quantifying N2O reduction to N2 based on N2O isotopocules – validation with independent methods (helium incubation and 15N gas flux method), Biogeosciences, 14, 711–732, https://doi.org/10.5194/bg-14-711-2017, 2017.
Mariotti, A., Germon, J. C., Hubert, P., Kaiser, P., Letolle, R., Tardieux, A., and Tardieux, P.: Experimental-Determination of Nitrogen Kinetic Isotope Fractionation – Some Principles – Illustration for the Denitrification and Nitrification Processes, Plant Soil, 62, 413–430, https://doi.org/10.1007/Bf02374138, 1981.
McManus, J. B., Zahniser, M. S., Nelson, D. D., Shorter, J. H., Herndon, S. C., Jervis, D., Agnese, M., McGovern, R., Yacovitch, T. I., and Roscioli, J. R.: Recent progress in laser-based trace gas instruments: performance and noise analysis, Appl. Phys. B, 119, 203–218, https://doi.org/10.1007/s00340-015-6033-0, 2015.
Merbold, L., Werner, E., Jacqueline, S., Mark, Z., David, N., and Nina, B.: Greenhouse gas budget (CO2, CH4 and N2O) of intensively managed grassland following restoration, Glob. Change Biol., 20, 1913–1928, https://doi.org/10.1111/gcb.12518, 2014.
Miller, J. B. and Tans, P. P.: Calculating isotopic fractionation from atmospheric measurements at various scales, Tellus B, 55, 207–214, https://doi.org/10.1034/j.1600-0889.2003.00020.x, 2003.
Mohn, J., Tuzson, B., Manninen, A., Yoshida, N., Toyoda, S., Brand, W. A., and Emmenegger, L.: Site selective real-time measurements of atmospheric N2O isotopomers by laser spectroscopy, Atmos. Meas. Tech., 5, 1601–1609, https://doi.org/10.5194/amt-5-1601-2012, 2012.
Mohn, J., Steinlin, C., Merbold, L., Emmenegger, L., and Hagedorn, F.: N2O emissions and source processes in snow-covered soils in the Swiss Alps, Isotopes Environ. Health Stud., 49, 520–531, https://doi.org/10.1080/10256016.2013.826212, 2013.
Mohn, J., Wolf, B., Toyoda, S., Lin, C. T., Liang, M. C., Bruggemann, N., Wissel, H., Steiker, A. E., Dyckmans, J., Szwec, L., Ostrom, N. E., Casciotti, K. L., Forbes, M., Giesemann, A., Well, R., Doucett, R. R., Yarnes, C. T., Ridley, A. R., Kaiser, J., and Yoshida, N.: Interlaboratory assessment of nitrous oxide isotopomer analysis by isotope ratio mass spectrometry and laser spectroscopy: current status and perspectives, Rapid Commun. Mass Sp., 28, 1995–2007, https://doi.org/10.1002/rcm.6982, 2014.
Mohn, J., Gutjahr, W., Toyoda, S., Harris, E., Ibraim, E., Geilmann, H., Schleppi, P., Kuhn, T., Lehmann, M. F., Decock, C., Werner, R. A., Yoshida, N., and Brand, W. A.: Reassessment of the NH4NO3 thermal decomposition technique for calibration of the N2O isotopic composition, Rapid Commun. Mass Sp., 30, 2487–2496, https://doi.org/10.1002/rcm.7736, 2016.
Mook, W. G.: Environmental isotopes in the hydrological cycle, Principles and applications, International Atomic Energy Agency and United Nations Educational, Scientific and Cultural Organization, Paris/Vienna, 2002.
Myhre, G., Shindell, D., Bréon, F.-M., Collins, W., Fuglestvedt, J., Huang, J., Koch, D., Lamarque, J.-F., Lee, D., Mendoza, B., Nakajima, T., Robock, A., Stephens, G., Takemura, T., and Zhang, H.: Anthropogenic and Natural Radiative Forcing, in: Climate Change 2013: The Physical Science Basis. Contribution of Working Group I to the Fifth Assessment Report of the Intergovernmental Panel on Climate Change, edited by: Stocker, T. F., Qin, D., Plattner, G.-K., Tignor, M., Allen, S. K., Boschung, J., Nauels, A., Xia, Y., Bex, V., and Midgley, P. M., Cambridge University Press, Cambridge, UK and New York, NY, USA, 659–740, 2013.
Nishina, K., Akiyama, H., Nishimura, S., Sudo, S., and Yagi, K.: Evaluation of uncertainties in N2O and NO fluxes from agricultural soil using a hierarchical Bayesian model, J. Geophys. Res.-Biogeo., 117, G04008, https://doi.org/10.1029/2012jg002157, 2012.
Oney, B., Henne, S., Gruber, N., Leuenberger, M., Bamberger, I., Eugster, W., and Brunner, D.: The CarboCount CH sites: characterization of a dense greenhouse gas observation network, Atmos. Chem. Phys., 15, 11147–11164, https://doi.org/10.5194/acp-15-11147-2015, 2015.
Opdyke, M. R., Ostrom, N. E., and Ostrom, P. H.: Evidence for the predominance of denitrification as a source of N2O in temperate agricultural soils based on isotopologue measurements, Global Biogeochem. Cy., 23, GB4018, https://doi.org/10.1029/2009GB003523, 2009.
Ostrom, N. E., Pitt, A., Sutka, R., Ostrom, P. H., Grandy, A. S., Huizinga, K. M., and Robertson, G. P.: Isotopologue effects during N2O reduction in soils and in pure cultures of denitrifiers, J. Geophys. Res.-Biogeo., 112, G02005, https://doi.org/10.1029/2006jg000287, 2007.
Ostrom, N. E., Gandhi, H., Coplen, T. B., Toyoda, S., Böhlke, J. K., Brand, W. A., Casciotti, K. L., Dyckmans, J., Giesemann, A., Mohn, J., Well, R., Yu, L., and Yoshida, N.: Preliminary assessment of stable nitrogen and oxygen isotopic composition of USGS51 and USGS52 nitrous oxide reference gases and perspectives on calibration needs, 32, 1207–1214, https://doi.org/10.1002/rcm.8157, 2018.
Prinn, R. G., Weiss, R. F., Krummel, P. B., O'Doherty, S., Fraser, P. J., Muhle, J., Reimann, S., Vollmer, M. K., Simmonds, P. G., Maione, M., Arduini, J., Lunder, C. R., Schmidbauer, N., Young, D., Wang, H. J., Huang, J., Rigby, M., Harth, C. M., Salameh, P. K., Spain, T. G., Steele, L. P., Arnold, T., Kim, J., Hermansen, O., Derek, N., Mitrevski, B., and Langenfelds, R.: The ALE/GAGE AGAGE Network, Carbon Dioxide Information Analysis Center (CDIAC), Oak Ridge National Laboratory (ORNL), U.S. Department of Energy (DOE), 2016.
Ravishankara, A. R., Daniel, J. S., and Portmann, R. W.: Nitrous Oxide (N2O): The Dominant Ozone-Depleting Substance Emitted in the 21st Century, Science, 326, 123–125, https://doi.org/10.1126/science.1176985, 2009.
Röckmann, T., Eyer, S., van der Veen, C., Popa, M. E., Tuzson, B., Monteil, G., Houweling, S., Harris, E., Brunner, D., Fischer, H., Zazzeri, G., Lowry, D., Nisbet, E. G., Brand, W. A., Necki, J. M., Emmenegger, L., and Mohn, J.: In situ observations of the isotopic composition of methane at the Cabauw tall tower site, Atmos. Chem. Phys., 16, 10469–10487, https://doi.org/10.5194/acp-16-10469-2016, 2016.
Rohe, L., Anderson, T.-H., Braker, G., Flessa, H., Giesemann, A., Lewicka-Szczebak, D., Wrage-Mönnig, N., and Well, R.: Dual isotope and isotopomer signatures of nitrous oxide from fungal denitrification – a pure culture study, Rapid Commun. Mass Sp., 28, 1893-1903, https://doi.org/10.1002/rcm.6975, 2014.
Rosenkranz, P., Brüggemann, N., Papen, H., Xu, Z., Seufert, G., and Butterbach-Bahl, K.: N2O, NO and CH4 exchange, and microbial N turnover over a Mediterranean pine forest soil, Biogeosciences, 3, 121–133, https://doi.org/10.5194/bg-3-121-2006, 2006.
Schäfer, K., Böttcher, J., Weymann, D., von der Heide, C., and Duijnisveld, W. H. M.: Evaluation of a Closed Tunnel for Field-Scale Measurements of Nitrous Oxide Fluxes from an Unfertilized Grassland Soil, J. Environ. Qual., 41, 1383–1392, https://doi.org/10.2134/jeq2011.0475, 2012.
Sigman, D. M., Casciotti, K. L., Andreani, M., Barford, C., Galanter, M., and Bohlke, J. K.: A bacterial method for the nitrogen isotopic analysis of nitrate in seawater and freshwater, Anal. Chem., 73, 4145–4153, https://doi.org/10.1021/ac010088e, 2001.
Snider, D. M., Schiff, S. L., and Spoelstra, J.: N-15/N-14 and O-18/O-16 stable isotope ratios of nitrous oxide produced during denitrification in temperate forest soils, Geochim. Cosmochim. Ac., 73, 877–888, https://doi.org/10.1016/j.gca.2008.11.004, 2009.
Snider, M. D., Venkiteswaran, J. J., Schiff, S. L., and Spoelstra, J.: Deciphering the oxygen isotope composition of nitrous oxide produced by nitrification, Glob. Change Biol., 18, 356–370, https://doi.org/10.1111/j.1365-2486.2011.02547.x, 2012.
Stohl, A., Forster, C., Frank, A., Seibert, P., and Wotawa, G.: Technical note: The Lagrangian particle dispersion model FLEXPART version 6.2, Atmos. Chem. Phys., 5, 2461–2474, https://doi.org/10.5194/acp-5-2461-2005, 2005.
Sutka, R. L., Ostrom, N. E., Ostrom, P. H., Breznak, J. A., Gandhi, H., Pitt, A. J., and Li, F.: Distinguishing nitrous oxide production from nitrification and denitrification on the basis of isotopomer abundances, Appl. Environ. Microb., 72, 638–644, https://doi.org/10.1128/Aem.72.1.638-644.2006, 2006.
Toyoda, S. and Yoshida, N.: Determination of Nitrogen Isotopomers of Nitrous Oxide on a Modified Isotope Ratio Mass Spectrometer, Anal. Chem., 71, 4711–4718, https://doi.org/10.1021/ac9904563, 1999.
Toyoda, S. and Yoshida, N.: Development of automated preparation system for isotopocule analysis of N2O in various air samples, Atmos. Meas. Tech., 9, 2093–2101, https://doi.org/10.5194/amt-9-2093-2016, 2016.
Toyoda, S., Mutobe, H., Yamagishi, H., Yoshida, N., and Tanji, Y.: Fractionation of N2O isotopomers during production by denitrifier, Soil Biol. Biochem., 37, 1535–1545, https://doi.org/10.1016/j.soilbio.2005.01.009, 2005.
Toyoda, S., Yano, M., Nishimura, S. i., Akiyama, H., Hayakawa, A., Koba, K., Sudo, S., Yagi, K., Makabe, A., Tobari, Y., Ogawa, N. O., Ohkouchi, N., Yamada, K., and Yoshida, N.: Characterization and production and consumption processes of N2O emitted from temperate agricultural soils determined via isotopomer ratio analysis, Global Biogeochem. Cy., 25, GB2008, https://doi.org/10.1029/2009GB003769, 2011.
Toyoda, S., Kuroki, N., Yoshida, N., Ishijima, K., Tohjima, Y., and Machida, T.: Decadal time series of tropospheric abundance of N2O isotopomers and isotopologues in the Northern Hemisphere obtained by the long-term observation at Hateruma Island, Japan, J. Geophys. Res.-Atmos., 118, 3369–3381, https://doi.org/10.1002/jgrd.50221, 2013.
Toyoda, S., Yoshida, N., and Koba, K.: Isotopocule analysis of biologically produced nitrous oxide in various environments, Mass Spectrom. Rev., 36, 135–160, https://doi.org/10.1002/mas.21459, 2017.
Tuzson, B., Henne, S., Brunner, D., Steinbacher, M., Mohn, J., Buchmann, B., and Emmenegger, L.: Continuous isotopic composition measurements of tropospheric CO2 at Jungfraujoch (3580 m a.s.l.), Switzerland: real-time observation of regional pollution events, Atmos. Chem. Phys., 11, 1685–1696, https://doi.org/10.5194/acp-11-1685-2011, 2011.
Verhoeven, E., Barthel, M., Yu, L., Celi, L., Said-Pullicino, D., Sleutel, S., Lewicka-Szczebak, D., Six, J., and Decock, C.: Early season N2O emissions under variable water management in rice systems: source-partitioning emissions using isotope ratios along a depth profile, Biogeosciences, 16, 383–408, https://doi.org/10.5194/bg-16-383-2019, 2019.
Waechter, H., Mohn, J., Tuzson, B., Emmenegger, L., and Sigrist, M. W.: Determination of N2O isotopomers with quantum cascade laser based absorption spectroscopy, Opt. Express, 16, 9239–9244, https://doi.org/10.1364/Oe.16.009239, 2008.
Wang, R., Feng, Q., Liao, T., Zheng, X., Butterbach-Bahl, K., Zhang, W., and Jin, C.: Effects of nitrate concentration on the denitrification potential of a calcic cambisol and its fractions of N2, N2O and NO, Plant Soil, 363, 175–189, https://doi.org/10.1007/s11104-012-1264-x, 2013.
Wassenaar, L. I., Douence, C., Altabet, M. A., and Aggarwal, P. K.: N and O isotope (N-15, N-15, O-18, O-17) analyses of dissolved and by the Cd-azide reduction method and N2O laser spectrometry, Rapid Commun. Mass Sp., 32, 184–194, https://doi.org/10.1002/rcm.8029, 2018.
Wei, J., Amelung, W., Lehndorff, E., Schloter, M., Vereecken, H., and Brüggemann, N.: N2O and NOx emissions by reactions of nitrite with soil organic matter of a Norway spruce forest, Biogeochemistry, 132, 325–342, https://doi.org/10.1007/s10533-017-0306-0, 2017a.
Wei, J., Zhou, M. H., Vereecken, H., and Bruggemann, N.: Large variability in CO2 and N2O emissions and in N-15 site preference of N2O from reactions of nitrite with lignin and its derivatives at different pH, Rapid Commun. Mass Sp., 31, 1333–1343, https://doi.org/10.1002/rcm.7912, 2017b.
Well, R., Flessa, H., Xing, L., Ju, X. T., and Romheld, V.: Isotopologue ratios of N2O emitted from microcosms with fertilized arable soils under conditions favoring nitrification, Soil Biol. Biochem., 40, 2416–2426, https://doi.org/10.1016/j.soilbio.2008.06.003, 2008.
Werner, R. A. and Brand, W. A.: Referencing strategies and techniques in stable isotope ratio analysis, Rapid Commun. Mass Sp., 15, 501–519, https://doi.org/10.1002/rcm.258, 2001.
Winther, M., Balslev-Harder, D., Christensen, S., Priemé, A., Elberling, B., Crosson, E., and Blunier, T.: Continuous measurements of nitrous oxide isotopomers during incubation experiments, Biogeosciences, 15, 767–780, https://doi.org/10.5194/bg-15-767-2018, 2018.
WMO and GAW: Greenhouse Gas Bulletin, The State of Greenhouse Gases in the Atmosphere Based on Global Observations through 2016, WMO, available at: https://library.wmo.int/index.php?lvl=notice_display&id=3030#.XVqVv3vgpaQ (last access: 28 August 2019), 2017.
Wolf, B., Merbold, L., Decock, C., Tuzson, B., Harris, E., Six, J., Emmenegger, L., and Mohn, J.: First on-line isotopic characterization of N2O above intensively managed grassland, Biogeosciences, 12, 2517–2531, https://doi.org/10.5194/bg-12-2517-2015, 2015.
Wolf, B., Chwala, C., Fersch, B., Garvelmann, J., Junkermann, W., Zeeman, M. J., Angerer, A., Adler, B., Beck, C., Brosy, C., Brugger, P., Emeis, S., Dannenmann, M., De Roo, F., Diaz-Pines, E., Haas, E., Hagen, M., Hajnsek, I., Jacobeit, J., Jagdhuber, T., Kalthoff, N., Kiese, R., Kunstmann, H., Kosak, O., Krieg, R., Malchow, C., Mauder, M., Merz, R., Notarnicola, C., Philipp, A., Reif, W., Reineke, S., Rodiger, T., Ruehr, N., Schafer, K., Schron, M., Senatore, A., Shupe, H., Volksch, I., Wanninger, C., Zacharias, S., and Schmid, H. P.: THE SCALEX CAMPAIGN Scale-Crossing Land Surface and Boundary Layer Processes in the TERENO-preAlpine Observatory, B. Am. Meteorol. Soc., 98, 1217–1234, https://doi.org/10.1175/Bams-D-15-00277.1, 2017.
Wrage, N., Lauf, J., del Prado, A., Pinto, M., Pietrzak, S., Yamulki, S., Oenema, O., and Gebauer, G.: Distinguishing sources of N2O in European grasslands by stable isotope analysis, Rapid Commun. Mass Sp., 18, 1201–1207, https://doi.org/10.1002/rcm.1461, 2004.
Xiahong, F., M., F. A., and S., P. E.: Seasonality of isotopes in precipitation: A global perspective, J. Geophys. Res.-Atmos., 114, D08116, https://doi.org/10.1029/2008JD011279, 2009.
Yamamoto, A., Uchida, Y., Akiyama, H., and Nakajima, Y.: Continuous and unattended measurements of the site preference of nitrous oxide emitted from an agricultural soil using quantum cascade laser spectrometry with intercomparison with isotope ratio mass spectrometry, Rapid Commun. Mass Sp., 28, 1444–1452, https://doi.org/10.1002/rcm.6916, 2014.
Yoshida, N.: 15N-depleted N2O as a product of nitrification, Nature, 335, 528, https://doi.org/10.1038/335528a0, 1988.
Yoshida, N. and Toyoda, S.: Constraining the atmospheric N2O budget from intramolecular site preference in N2O isotopomers, Nature, 405, 330–334, https://doi.org/10.1038/35012558, 2000.
Zeeman, M. J., Mauder, M., Steinbrecher, R., Heidbach, K., Eckart, E., and Schmid, H. P.: Reduced snow cover affects productivity of upland temperate grasslands, Agr. Forest Meteorol., 232, 514–526, https://doi.org/10.1016/j.agrformet.2016.09.002, 2017.