the Creative Commons Attribution 4.0 License.
the Creative Commons Attribution 4.0 License.
 | 30 Sep 2019
Effects of eutrophication on sedimentary organic carbon cycling in five temperate lakes
Longhui Deng
Anja Michel
Philip Eickenbusch
Xingguo Han
Lorenzo Lagostina
Rong Zhu
Michael Sander
Martin H. Schroth
Stefano M. Bernasconi
Nathalie Dubois
Mark A. Lever
Even though human-induced eutrophication has severely impacted temperate lake ecosystems over the last centuries, the effects on total organic carbon (TOC) burial and mineralization are not well understood. We study these effects based on sedimentary records from the last 180 years in five Swiss lakes that differ in trophic state. We compare changes in TOC content and modeled TOC accumulation rates through time to historical data on algae blooms, water column anoxia, wastewater treatment, artificial lake ventilation, and water column phosphorus (P) concentrations. We furthermore investigate the effects of eutrophication on rates of microbial TOC mineralization and vertical distributions of microbial respiration reactions in sediments. Our results indicate that the history of eutrophication is well recorded in the sedimentary record. Overall, eutrophic lakes have higher TOC burial and accumulation rates, and subsurface peaks in TOC coincide with past periods of elevated P concentrations in lake water. Sediments of eutrophic lakes, moreover, have higher rates of total respiration and higher contributions of methanogenesis to total respiration. However, we found strong overlaps in the distributions of respiration reactions involving different electron acceptors in all lakes regardless of lake trophic state. Moreover, even though water column P concentrations have been reduced by ∼ 50 %–90 % since the period of peak eutrophication in the 1970s, TOC burial and accumulation rates have only decreased significantly, by ∼ 20 % and 25 %, in two of the five lakes. Hereby there is no clear relationship between the magnitude of the P concentration decrease and the change in TOC burial and accumulation rate. Instead, data from one eutrophic lake suggest that artificial ventilation, which has been used to prevent water column anoxia in this lake for 35 years, may help sustain high rates of TOC burial and accumulation in sediments despite water column P concentrations being strongly reduced. Our study provides novel insights into the influence of human activities in lakes and lake watersheds on lake sediments as carbon sinks and habitats for diverse microbial respiration processes.
- Article
(2262 KB) - Full-text XML
-
Supplement
(2172 KB) - BibTeX
- EndNote


Lake sediments play an important role in the global carbon cycle despite covering only about 1 % of the Earth's surface area (Cole et al., 2007; Battin et al., 2009). Estimates of global carbon dioxide (CO2) net fluxes from lake systems range from 60 to 580 Tg C yr−1 (Raymond et al., 2013; Holgerson and Raymond, 2016). Methane (CH4) fluxes are much smaller (6 to 36 Tg C; Bastviken et al., 2004), but are also globally important given that CH4 has a 28 to 36 times higher global warming potential than CO2 on a timescale of about 100 years (Cubasch et al., 2014). Besides being important sources of CO2 and CH4, lakes are also important sinks of organic C (OC). Global storage of C in lake sediments for the entire Holocene is estimated to be ∼820 Pg C (Einsele et al., 2001; Mendonca et al., 2017).
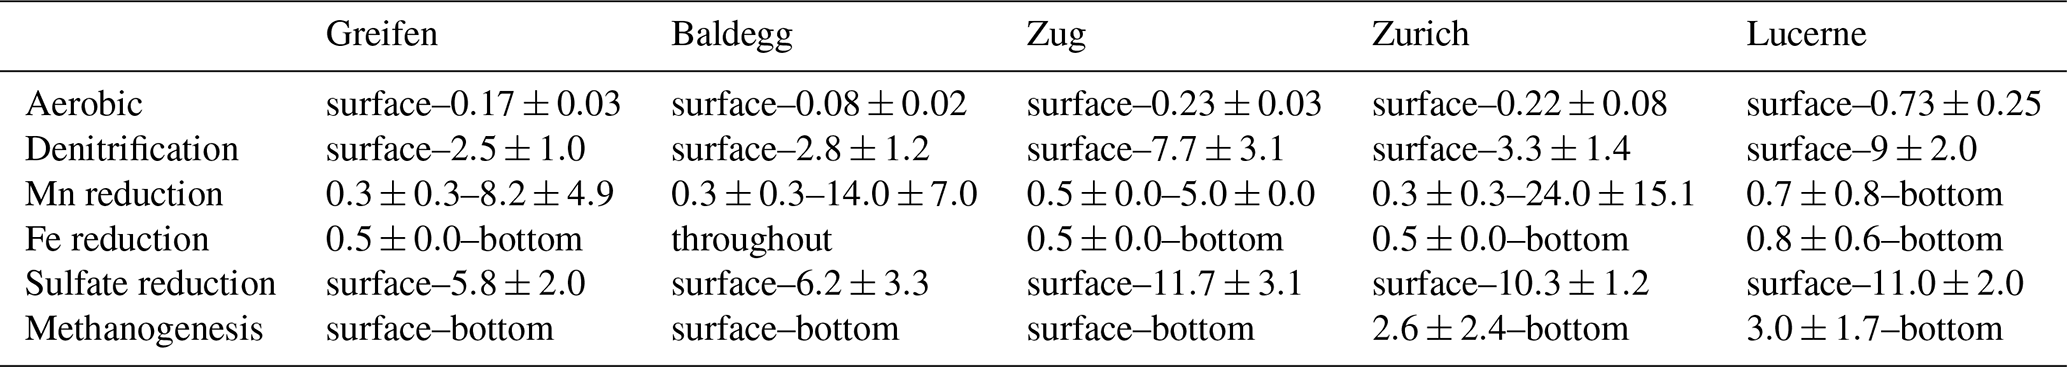
Whether OC in lake sediments is buried and preserved over geologic time or degraded to CO2 and CH4 is partially controlled by sediment microorganisms, which break down OC for energy conservation and biosynthesis (Nedwell, 1984). In a first step, microorganisms enzymatically hydrolyze organic macromolecules, e.g., proteins, nucleic acids, lipids, and polysaccharides, extracellularly into sufficiently small components that can be taken up across the cell membrane (Canfield et al., 2005). If oxygen (O2) is available as an electron acceptor, organisms performing initial hydrolysis are often capable of oxidizing hydrolysis products all the way to CO2. In the absence of O2, OC is degraded to CO2 or CH4 by multiple groups of more specialized microorganisms (Canfield et al., 2005). Primary fermenters carry out the initial extracellular hydrolysis and subsequently gain energy from the intracellular disproportionation of hydrolysis products to smaller molecules such as H2, short-chain organic acids, and alcohols. In some cases, an intermediary secondary fermentation step takes place whereby the organic acids and alcohols produced by primary fermenters are disproportionated to H2, acetate, and C1 compounds (Capone and Kiene, 1988; Schink, 1997). The products of primary and secondary fermentation are subsequently converted to CO2 or CH4 by respiring organisms using – in order of energy yields from high to low – nitrate (), manganese(IV) (Mn(IV)), ferric iron (Fe(III)), sulfate (), and CO2 as electron acceptors (Froelich et al., 1979; Drake et al., 2006). The differences in energy yields can result in a vertical zonation (“redox zonation”) of respiration reactions, with reduction (denitrification) occurring near the sediment surface, as soon as O2 is depleted, CO2 reduction via methanogenesis dominating in deeper layers, where all other electron acceptors have been depleted, and Mn(IV), Fe(III), and reduction taking place in distinct sediment intervals between the zones of denitrification and methanogenesis (Lovley and Goodwin, 1988; Hoehler et al., 1998; Canfield et al., 2005; Jørgensen and Kasten, 2006; Canfield and Thamdrup, 2009).
A complex set of interacting variables determines whether microorganisms break down sedimentary organic compounds and thus whether organic carbon is stored in sediment in the long term or returns to the hydrosphere and atmosphere as CO2 and methane over shorter timescales. Aerobic respiration results in the breakdown of a larger fraction of the sedimentary organic carbon pool compared to anaerobic processes (Lehmann et al., 2002; Sobek et al., 2009; Katsev and Crowe, 2015). The O2 exposure time, i.e., the time each organic molecule is present under oxic conditions, is also positively correlated with organic matter degradation. This O2 exposure time is affected by the presence of sediment macrofauna, which physically transport sediment from deeper anoxic layers to the surface or pump O2 into deeper anoxic layers (Kristensen, 2000; Meysman et al., 2006; Kristensen et al., 2012; Middelburg, 2018). Macrofauna also mineralize OC through their own feeding activities and stimulate the microbial mineralization of organic matter by breaking large organic particulates into smaller ones with a larger surface area for microbial colonization. The chemical composition and structure of the OC also affect OC preservation. OC of terrestrial plants is typically more resistant to microbial attack than OC of phytoplankton due to the presence of biologically resistant polymers, e.g., lignin, waxes, and resins, that are absent in phytoplankton (Burdige, 2007). Abiotic processes, e.g., condensation reactions (e.g., Burdige, 2007), incorporation of sedimentary Fe(III) (Lalonde et al., 2012) or sulfur compounds (Werne et al., 2000, 2008; Hebting et al., 2006), and physical protection by adsorption or encapsulation can also significantly decrease rates of microbial OC degradation (reviewed in Hedges et al., 2000).
Besides these natural factors, the burial of C in lake sediment is also largely influenced by anthropogenic activities, such as agriculture, wastewater input, and urbanization (Heathcote and Downing, 2012; Anderson et al., 2013). OC burial rates may increase due to increased water column primary production resulting from increased nutrient input, especially P (Dean and Gorham, 1998; Maerki et al., 2009; Heathcote and Downing, 2012; Anderson et al., 2013, 2014), which is the limiting nutrient for primary production in most lake water columns (Correll, 1999; Conley et al., 2009). Hereby increased OC loading (eutrophication), mainly due to stimulation of water column primary production, enhances OC sedimentation rates and O2 consumption (Valiela et al., 1997; Gontikaki et al., 2012). The resulting (seasonal) water column hypoxia or anoxia negatively impact ecosystem functioning as well as commercial and recreational uses (Valiela et al., 1997; McGlathery, 2001; Breitburg, 2002). Strategies to manage eutrophication include restrictions on terrestrial P use, agriculture-free buffer zones, wastewater treatment with P precipitation systems, and artificial water column mixing and aeration (Schindler, 2006; Conley et al., 2009). These remediation strategies can lead to substantial reductions in P concentrations (Müller et al., 1990; Liechti, 1994). However, there are still open questions regarding the influence of these mitigation strategies on OC burial, in part due to P retention and release from lake sediments (Gachter and Muller, 2003; Moosmann et al., 2006).
Here we investigate OC burial through time across five temperate lakes that differ in eutrophication history over the past 180 years. We test the hypothesis that (i) OC burial rates have historically increased in response to anthropogenic eutrophication and that (ii) increased P concentrations, through their influence on water column primary production and O2 concentrations, are the main driver of this increased OC burial. We furthermore examine the hypothesis that increased OC input to eutrophic lake sediments results in (iii) higher microbial respiration rates, (iv) changes in the vertical zonations and relative contributions of dominant respiration reactions, and (v) increases in both microbial population size and cell-specific C turnover. Our results indicate that anthropogenic eutrophication during the latter half of the 20th century, which was largely driven by increased wastewater inputs, indeed increased OC burial, OC respiration rates, especially methanogenesis rates, and cell-specific microbial C turnover. However, we observe no clear impacts of eutrophication on the zonation of microbial respiration reactions relative to each other or on microbial population size. Furthermore, despite strong decreases in water column P concentrations in recent years, total organic carbon (TOC) burial rates remain above pre-eutrophication levels. To our knowledge, this is the first study to provide a detailed historic record and reconstruction of how recent anthropogenic eutrophication has impacted OC burial, OC mineralization rates, and the distributions of microbial respiration reactions in lacustrine sediments.
2.1 Study sites and their eutrophication history
We sampled sediments from three water depths in five lakes in central Switzerland: Lake Lucerne, Lake Zurich, Lake Zug, Lake Baldegg, and Lake Greifen (Fig. S1 in the Supplement). All five lakes undergo strong seasonal changes in primary production, thermal stratification, and sedimentation (Teranes et al., 1999a, b; Buergi and Stadelmann, 2000; Naeher et al., 2013), but differ in land use and in histories of anthropogenic eutrophication and eutrophication mitigation (Fig. 1; for further information, see Fig. S2 and Text S1 “Extended Lake description” in the Supplement). Based on total P concentrations in surface water today, Lake Lucerne is oligotrophic, Lake Zurich is mesotrophic, and the other three lakes are all highly eutrophic.
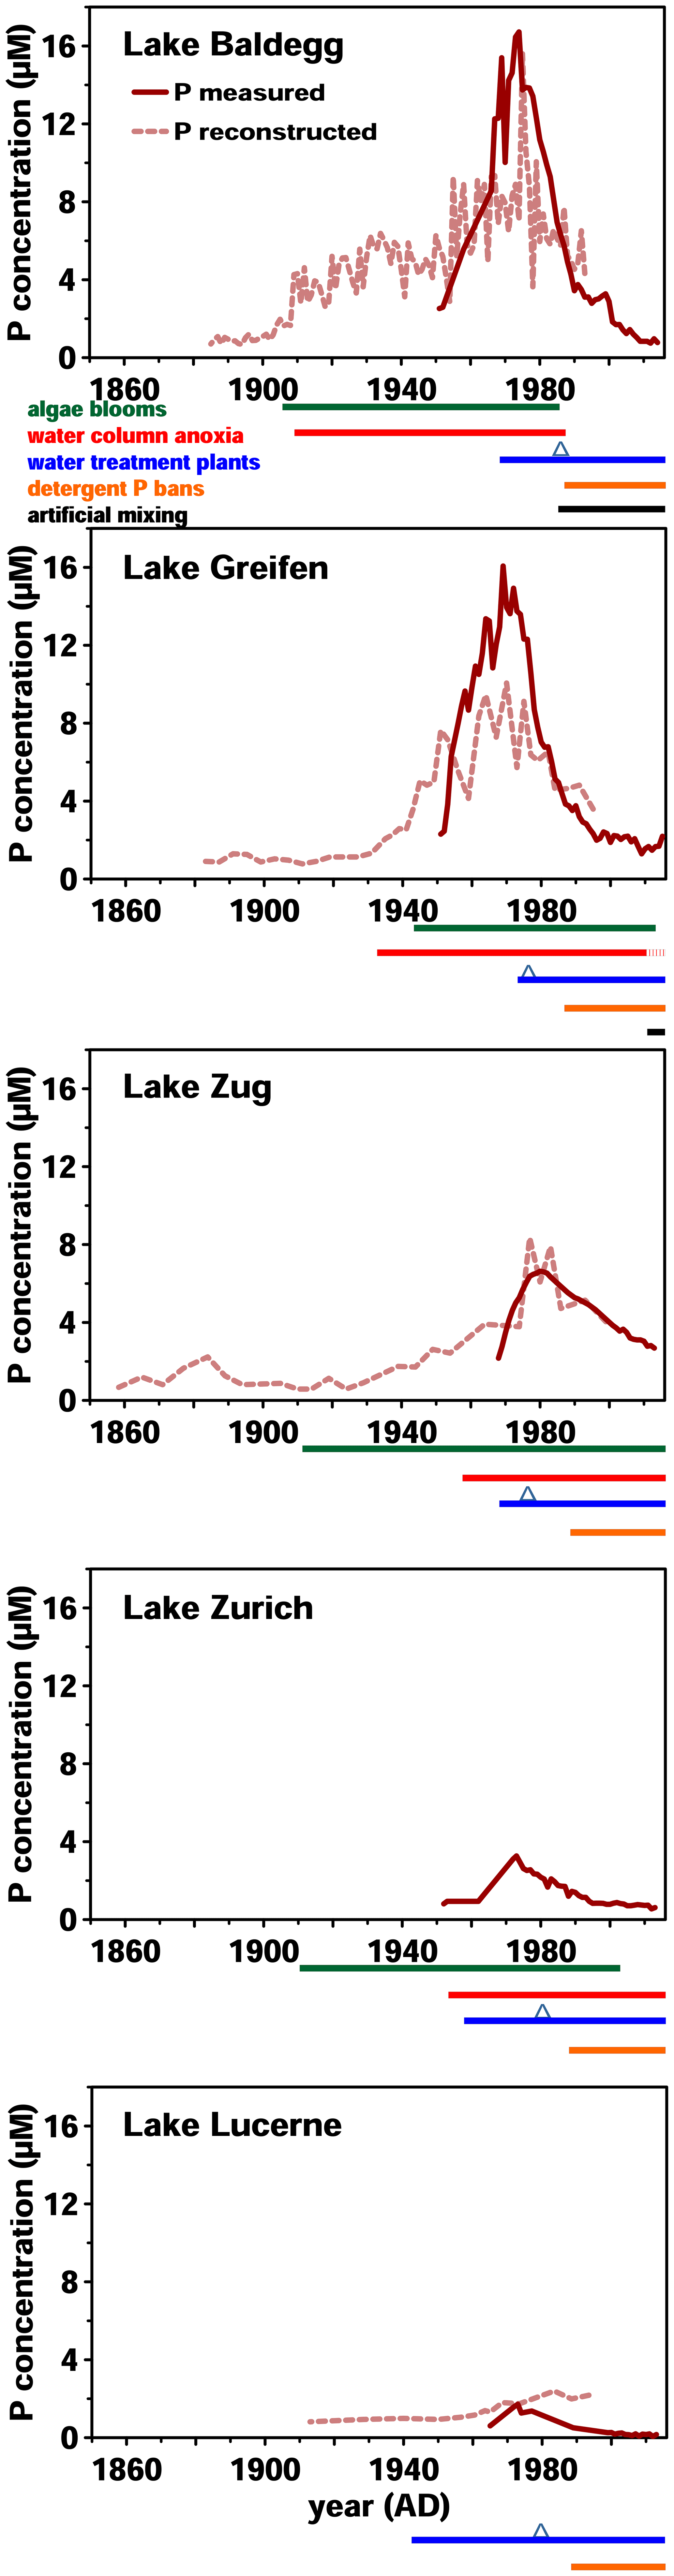
Figure 1Historical data on surface water P concentrations and eutrophication since 1860. P concentration monitoring was started between 1950 and 1970. Reconstructed P concentrations were modeled based on sedimentary records of diatom assemblages. Below each graph, timelines of algae bloom and anoxic event occurrence, wastewater treatment, and artificial mixing are shown. P bans were implemented in 1986 and are marked by blue triangles. All data from the Swiss Federal Office of the Environment (BAFU, 2013), except reconstructed P concentrations (Lake Lucerne: Lotter, 2001; Lake Baldegg: Lotter, 1998; Lake Zug: Aquaplus, AquaPlus, 2001; Lake Greifen: AquaPlus, 2004b; no data exist for Lake Zurich).
Over the past 180 years, these five lakes have shown similar but distinct trends in eutrophication history (Fig. 1). In Lake Baldegg, strong P concentration increases, coinciding with algal blooms and water column anoxia already starting around 1890. Similarly dramatic changes occurred in Lake Greifen from 1920 onwards, and to a lesser extent in Lake Zug starting in the 1930s. For Lake Zurich no reconstructed P concentrations are available; however, measured concentrations indicate relatively low and steady P levels from 1950 to 1960, followed by an increase from thereon. In Lake Lucerne reconstructed P concentrations indicate low and relatively steady concentrations until a small, temporary increase started in the 1960s.
In all five lakes, the strongest increases in P concentrations occurred between ∼ 1950 and 1970, yet the magnitude of these increases differed (Fig. 1). Annual P concentration maxima in Lake Greifen (16.1 µM, 1969) and Lake Baldegg (15.4 µM, 1969) were ∼2.5-fold higher than in Lake Zug (6.6 µM, 1980), ∼5-fold higher than in Lake Zurich (3.3 µM, 1973), and ∼9-fold higher than in Lake Lucerne (1.7 µM, 1973). Since then, remediation measures, such as wastewater treatment, and P detergent bans have strongly decreased water column P concentrations.
2.2 Sampling
All sampling took place in June and July 2016. Three sublittoral stations differing in water depth and bottom water O2 concentrations were sampled (Table 1). All sites were bioturbated, based on the presence of infaunal chironomid larvae and/or oligochaete worms, except the deepest station in the hypoxic basin of Lake Zurich (137 m water depth).
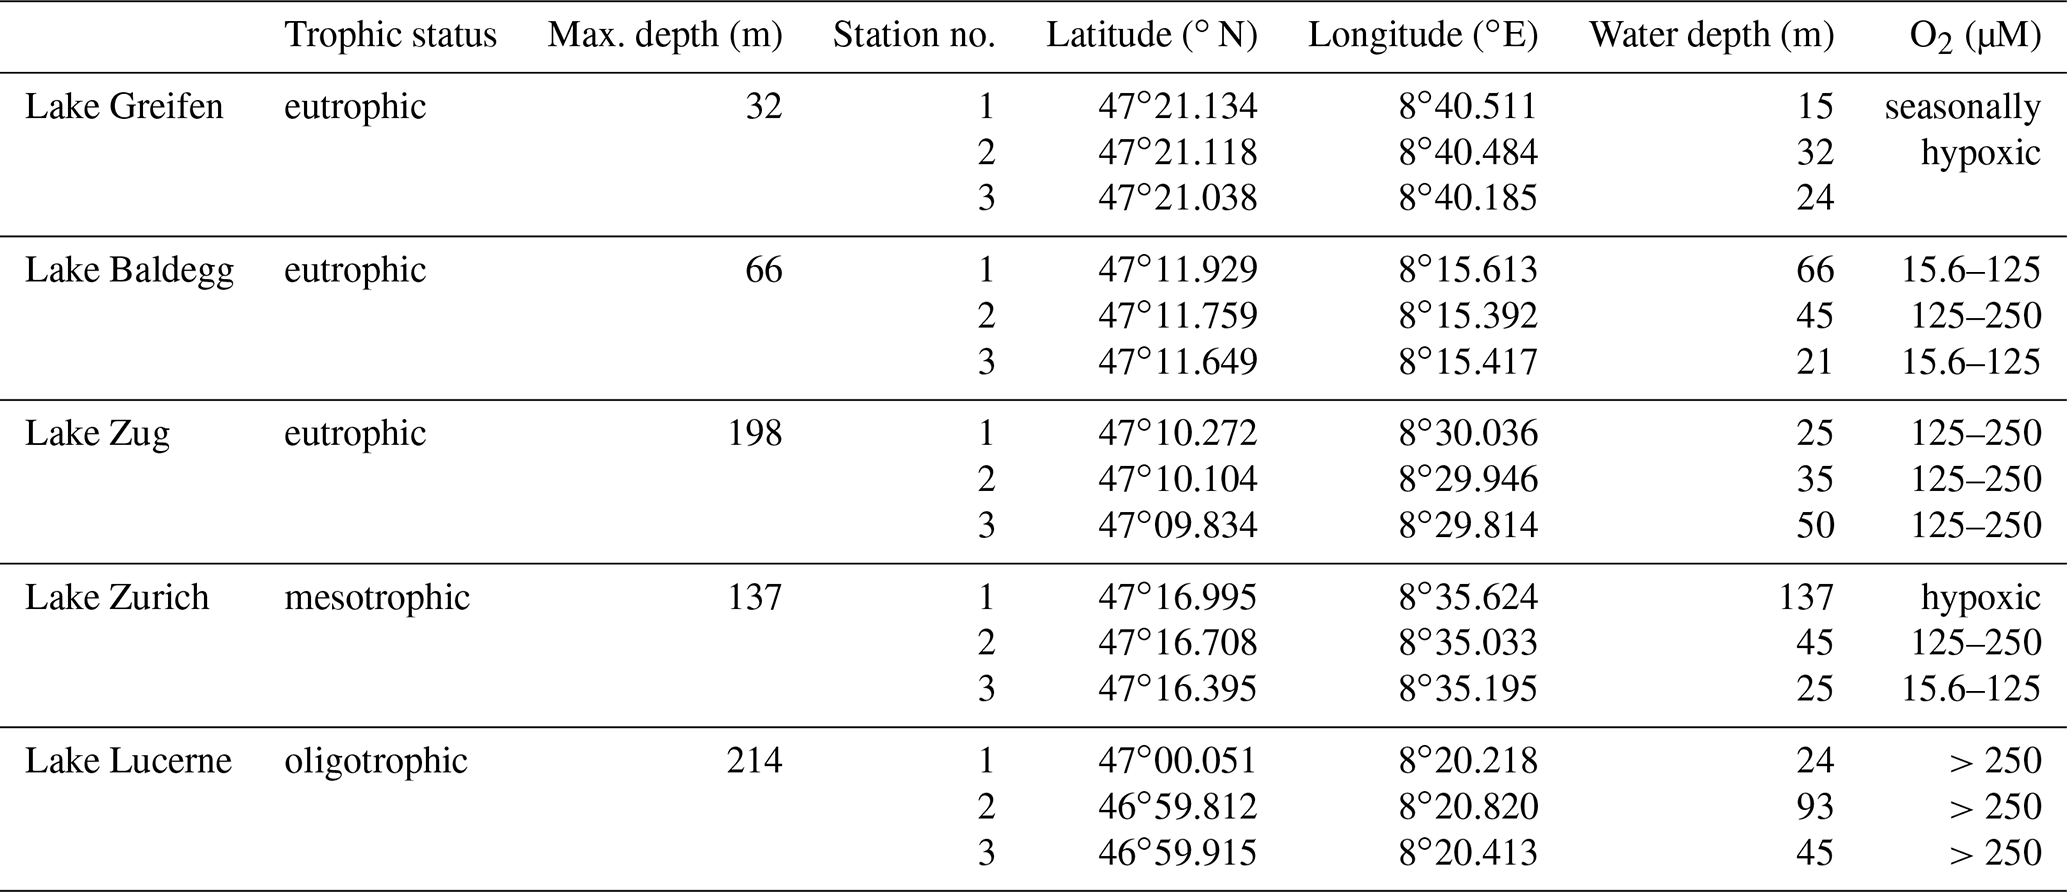
Table 1Overview of sampled lakes, their trophic status, and maximum water depths (from BAFU, 2013), as well as the geographic coordinates, water depths, and bottom water dissolved O2 concentrations of the stations that were sampled. O2 concentrations ≤15.6 µM are termed “hypoxic”.
Per each lake station, one 60 mm diameter and three to four 150 mm diameter gravity cores (UWITEC, AT) were taken from boats or motorized platforms. The thin cores were used for analyses of radionuclides, X-ray fluorescence, grain size, and archiving (one-half) (for core photos, see Fig. S3). Wide cores underwent a brief lithostratigraphic description and were then used as follows: the core with the least disturbed sediment surface was used for microsensor measurements (O2, pH). Sediment porewater samples were obtained by rhizons (0.2 µm pore size, Rhizosphere) from a designated core with pre-drilled holes that were taped during coring. The initial dead spaces of syringes, stop cocks, and rhizons were flushed twice with the first 2–3 mL of porewater to remove any air (O2), enabling anoxic sampling. The porewater was then sampled for downstream analyses on dissolved anions and cations including redox-sensitive elements, such as dissolved iron (Fe2+) and hydrogen sulfide (HS−). Sediment samples for cell counts, methane concentration analyses, and physical property determinations (porosity, bulk density, dry density, water content) were taken from a third core using sterile cut-off syringes. Samples for solid-phase carbon analyses (TOC, total inorganic carbon – TIC) were also taken from this core. Macrofauna were collected by sieving a fourth core or the core previously used for microsensor analyses through 400 and 200 µm meshed sieves and was preserved in 70 % ethanol.
2.3 Analyses
2.3.1 Microsensor analyses
To determine the distribution of aerobic microbial activity and pH conditions in surface sediments, triplicated depth profiles of dissolved [O2] and pH were measured with 100 µm Clark-type microelectrodes using a field multimeter system and micromanipulator (Unisense, DK). Cores were fixed in tall plastic boxes that had been filled with lake water and maintained at their original temperatures, which had been measured immediately after core retrieval. Measurements were performed as soon as possible after retrieval. Overlying water was gently bubbled with air throughout the measurements to prevent establishment of anoxic conditions. Therefore O2 profiles in overlying water do not accurately reflect in situ concentrations. By contrast, O2 concentrations in sediments were not altered by bubbling, as indicated by a high degree of reproducibility in O2 gradients during three successive measurements.
2.3.2 [Fe2+] and [Mn2+]
Porewater concentration profiles of Fe2+ and Mn2+ were measured to determine the distributions of microbial Fe and Mn reduction; 3–5 mL of porewater was fixed with 50 µL of 30 % HCl and kept at 4 ∘C until measurement by inductively coupled plasma-optical emission spectroscopy (ICP-OES) (5100, Agilent Technologies) after dilution with Milli-Q water. Standards were made using ICP-multi element standards (solution IV, MERCK, Certipur). Dissolved Fe2+ was also determined spectrophotometrically (Plate Reader Biotek, Synergy HT) at 562 nm absorption using a ferrozine assay (Stookey, 1970; Braunschweig et al., 2012). Standards were made from FeCl2 (Sigma, analytical quality) and verified using ICP-OES. Both methods show good general agreement (Fig. S4); however, values obtained by spectrophotometry were often slightly lower than those measured by ICP-OES. Tests involving different ferrozine concentrations, spiked samples, and various centrifugation treatments showed that ICP-OES data were less prone to matrix effects and were overall more robust. We thus only discuss the Fe2+ data measured by ICP-OES from here on.
2.3.3 [HS−]
Porewater concentrations of HS− were measured to detect sulfate-reducing microbial activity and potential coupling between microbial sulfate and metal reduction; 1 mL of porewater was fixed with 1 mL of 5 % zinc acetate and frozen at −20 ∘C until photometric determination on a plate reader (Synergy HT, BioTek) with diamine reagent (methylene blue method; Cline, 1969). Standards were prepared from a zinc sulfide stock solution made from sodium sulfide diluted in 1 % zinc acetate solution under precipitation of zinc sulfide. HS− concentrations were then determined by titration with 25 mM sodium thiosulfate.
2.3.4 Inorganic ions
Concentrations of the inorganic anions (sulfate () and nitrate ()) and the cation ammonium () were quantified to determine the distribution of microbial sulfate reduction and N cycling (denitrification, breakdown of N-containing organic matter). For each analysis 3 mL of porewater was sampled; 5 µL of NaOH (2 M) and 5 µL of HCl (2 M) were added for anion and cation analyses, respectively, to increase or lower the pH by 2–3 units. Samples were kept on ice in the field and frozen at −20 ∘C until measurement by ion chromatography (DIONEX DX-320 for anions, DX-ICS-1000 for cations). Standards were prepared by dissolving analytical quality sodium nitrate, sodium sulfate, and ammonium chloride in Milli-Q water. The DX-320 was equipped with an AERS 500, a 4 mm suppressor, a guard column (AG11-HC), and a main column (AS11-HC). The eluent, potassium hydroxide (10 mM), was generated by an eluent generator cartridge. The DX-ICS-1000 was equipped with an SCRS Ultra II, a 4 mm suppressor, a CG 12 A guard column, and a CS 12 A main column. The eluent used was methanosulfonic acid (20 mM) and was prepared fresh on every measurement day.
2.3.5 Dissolved inorganic carbon (DIC)
DIC concentration profiles were measured to determine distribution and rates of OC mineralization. Porewater was filled headspace-free into 1.5 mL borosilicate vials and stored at 4 ∘C for up to 4 weeks. Samples were analyzed along with standards, produced by dissolving sodium bicarbonate in Milli-Q, on a GasBench II (Thermo Fisher Delat V and TC/EA) coupled to MS after acidification with 85 % phosphoric acid.
2.3.6 [CH4]
Concentration profiles of CH4 were measured to determine the distribution and rates of microbial methanogenesis; 2 cm3 of sediment was transferred to 20 mL crimp vials containing 2.51 g NaCl and 5 mL Milli-Q water, crimped, thoroughly homogenized by shaking, and stored on ice until analysis by gas chromatography (GC). The GC was equipped with an autosampler (PAL GC-xt, CTC Analytics AG) and a flame ionization detector (FID) (Thermo Scientific™ TRACE™ Ultra Gas Chromatograph). The working conditions for the measurement were prep flow 10 pounds per square inch (psi), GC flow 14 psi, and CO2 reference gas 25 psi.
2.3.7 Solid-phase iron pools
For extraction of biologically available particulate Fe(II) and Fe(III), 2 cm3 of sediment was transferred to 20 mL crimp vials, immediately flushed with N2, and stored cool at 4 ∘C until measurement. Extraction from 0.2 to 0.6 g of wet sediment was performed with 5 mL 0.5 M HCl. The extract was split into two subsamples. To determine Fe(II), 40 µL of extract was mixed with 2 mL of 0.02 % ferrozine in 50 mM HEPES at pH 7 (Stookey, 1970; Lovley and Phillips, 1987) and then quantified photometrically on a Plate Reader (Synergy HT, BioTek). For total Fe, 1 mL of extract was mixed with 0.2 mL hydroxylamine (1.5 M) to reduce Fe(III) to Fe(II) and then measured as above. Fe(III) concentrations were the difference of total Fe and Fe(II). Standards consisted of dilution series of 100 mL 100 mM FeSO4 in 0.5 M HCl.
2.3.8 Redox state of sediment
Total electron accepting and donating capacities of the sediment were determined by mediated electrochemical reduction and oxidation, respectively (Kluepfel et al., 2014; Klupfel et al., 2014; Sander et al., 2015). Samples were treated as for solid-phase Fe extraction and analyzed inside an anoxic glove box. Before measurement, each sample was diluted into a slurry by adding 10 mL of O2-free Milli-Q water. Further details can be found in Text S2: “Detailed description of redox state analysis of the sediment”.
2.3.9 TOC
TOC was measured to determine OC accumulation and burial over time; 5–10 g of frozen sediment was freeze-dried in glass vials, homogenized, and split into three subsamples. One subsample was decarbonized with 6 M HCl, oven-dried, and homogenized for TOC analyses with an elemental analyzer (Thermo Fisher Flash EA 1112) coupled to an isotope-ratio-mass spectrometer (Thermo Fisher Delta V Plus) (EA-IRMS). The second subsample was analyzed directly by EA-IRMS to determine total carbon (TC) content in order to calculate TOC as the difference of TC minus TIC. Standards consisted of known amounts of peptone, atropine, and nicotinamide. The third subsample was used to determine TIC by coulometry (5011 CO2 coulometer). Some TC measurements could not be used due to high sulfur contents in the samples; therefore, TOC was back-calculated from TOC of the decarbonized fraction using an acidification factor derived from TIC measurements for all samples. To check that these calculations were correct, TOC was also calculated as the difference between TC minus TIC for those samples where TC measurements were available. All TOC data were expressed in weight % (wt %) of dry sediment.
2.3.10 Cell counts
Cell counts were performed on 0.5 cm3 of sediment after cell extraction by combined sonication and fluoric acid treatment followed by flow cytometric quantification following the method of Deng et al. (2019).
2.3.11 Physical property analyses
Porosity, water content, bulk density, and dry density of sediment samples were determined by weighing 2 cm3 of wet sample before and after oven drying at 60 ∘C for at least 48 h.
2.3.12 Determination of sedimentation rates
Analyses of unsupported 210Pb (half-life: 22.3 years) and 137Cs (30.2 years) were performed by gamma spectroscopy on 2–20 g of dry sediment subsamples on a high-purity germanium well detector. Calibrations were performed using the National Institute of Standards and Technology NG7 standard (246 kBq). Raw data were processed using the GENIE2K 3.2.1 software. Sedimentation rates based on 210Pb were calculated according to Binford (1990). Sedimentation rates 137Cs (cm yr−1) were calculated using the distinct peaks from bomb testings (1954, 1963) and the Chernobyl accident (1986). Surface sediments were assigned the year 2016, as confirmed by the short-lived radionuclide beryllium-7 (half-life: 53.3 d). Sedimentation rate estimates based on 137Cs and 210Pb were similar throughout the dataset (the coefficient of variation for all stations was <10 %; the mean coefficient of variation was ∼3 %). However, in a few cases, i.e., Lake Lucerne stations 1 and 2 and Lake Baldegg station 3, 210Pb profiles scattered more than 137Cs. Thus, in Lake Baldegg, varve counting was used for additional verification and showed good agreement with rates based on 210Pb and 137Cs. Sedimentation rates based on 210Pb were then used to calculate mass accumulation rates (MAR; g m−2 yr−1) according to
Here the slope is the change in ln 210Pb (Bq g−1) as a function of cumulative dry mass (g cm−2) and dw and ww refer to sediment dry and wet weight, respectively. Thickness is the vertical thickness of each sampled sediment interval.
2.3.13 Modeling of OC burial and accumulation rates through time
The first-order decay of TOC was calculated using the power model of Middelburg (1989), which is a function of time (t), and an age-specific, empirically derived decay constant k:
Under the assumption of constant TOC accumulation (input) at the sediment surface, the Middelburg power model has proven to be a good predictor of TOC content changes due to mineralization over time across diverse marine and lacustrine sediments (Burdige, 2007; Katsev and Crowe, 2015). Since lakes undergoing eutrophication are likely to experience changes in TOC accumulation and burial over time (Anderson et al., 2013, 2014), and thus cannot be described by the power model, we instead used the power model to provide an approximation for what TOC age profiles in sediment would be under the assumption that TOC accumulation had remained constant at today's values in the past. We then compare measured TOC values (TOCmeasured) in deeper layers to TOC predicted for these layers by the decay curve (TOCmodeled). Accordingly, subsurface TOCmeasured values that are higher (lower) than TOCmodeled indicate higher (lower) TOC accumulation and burial rates than predicted by the power model. We calculate TOC burial rates according to
Assuming that changes in TOC accumulation rate, e.g., due to changes in water column primary productivity over time, are the main driver of differences between TOCmeasured and TOCmodeled, we use the decay function of the power model – for each sampled sediment horizon – to reconstruct past TOC values (wt %) for when this horizon was located at the sediment surface (TOCreconstructed):
Here TOC loss (t) is the amount of TOC lost over time since the initial accumulation at the sediment surface. This was calculated based on the cumulative annual TOC loss predicted by k. We next reconstruct historic TOC accumulation rates for each sediment horizon when it was located at the sediment surface based on the following equation:
2.3.14 Modeling of respiration rates
In addition to examining eutrophication-related changes in organic carbon pool sizes over time, we investigated relationships between trophic state and total OC total respiration (mineralization) rates (RRtotal). Here RRtotal was defined as the sum of respiration rates to DIC (RRDIC) and respiration rates to methane (methanogenesis) (RR), where RRDIC and RR were modeled based on porewater concentration profiles of DIC and CH4. DIC profiles were corrected for dissolution and precipitation of calcium carbonate using the Ca2+ porewater profiles (Fig. S5; measured during the same run on IC as ) (Hyun et al., 2017). Profiles of CH4 and DIC were modeled using a power function with the formula
where Ccal is the calculated concentration of the model output, C0 is the concentration of DIC at the sediment surface (0–1 cm) or of CH4 in the shallowest sample of the methanogenesis zone, z is the depth in centimeters, and a and b are variables shaping the curve. The modeled concentrations where used to calculate a slope (mM cm−1), which was calculated as follows:
From this slope the flux (f) was calculated:
where Deff is the effective diffusion of DIC or CH4 in water and where n is porosity. The effective diffusion at a specific temperature was corrected for the formation factor according to the formula
where D is the diffusion coefficient and T2 is a factor calculated by multiplying porosity by the formation factor (F). This formation factor was calculated using the formula
where n is porosity, 1.02 is a unity factor (close to 1 means unity, i.e., the same size and shape of particles), and 1.81 is an empirical factor. Based on a study in Lake Zug from Maerki et al. (2004), the unity factor was set to 1.02 and the empirical factor to 1.81. Diffusion coefficients (Deff) as a function of temperature were calculated as ( cm2 s−1) = 0.0439⋅T (∘C) + 0.76 for CH4 (Witherspoon and Saraf, 1965; Gruca-Rokosz, 2018) and as ( cm2 s−1) = 0.0002⋅T2 (∘C) + 0.0172T (∘C) + 0.5463 for DIC (Zeebe, 2011).
The RRDIC and RR were then calculated from the flux (mmol m−2 h−1) for each depth interval (sediment depth z in centimeters) as follows:
In addition to determining RRtotal, RRDIC, and RR, we calculated the ratio of DIC to CH4 production rates () as a proxy for the contribution of methanogenesis to total respiration by dividing RRDIC by RR (dimensionless). Furthermore, we divided RRtotal by the cell counts in each depth layer to estimate mean cell-specific respiration rates (RRcell).
In the first part of this section we document the impact of eutrophication, driven by water column P concentrations, on OC burial. In the second part we examine how these effects cascade further to alter respiration rates and distributions of respiration pathways in sediments.
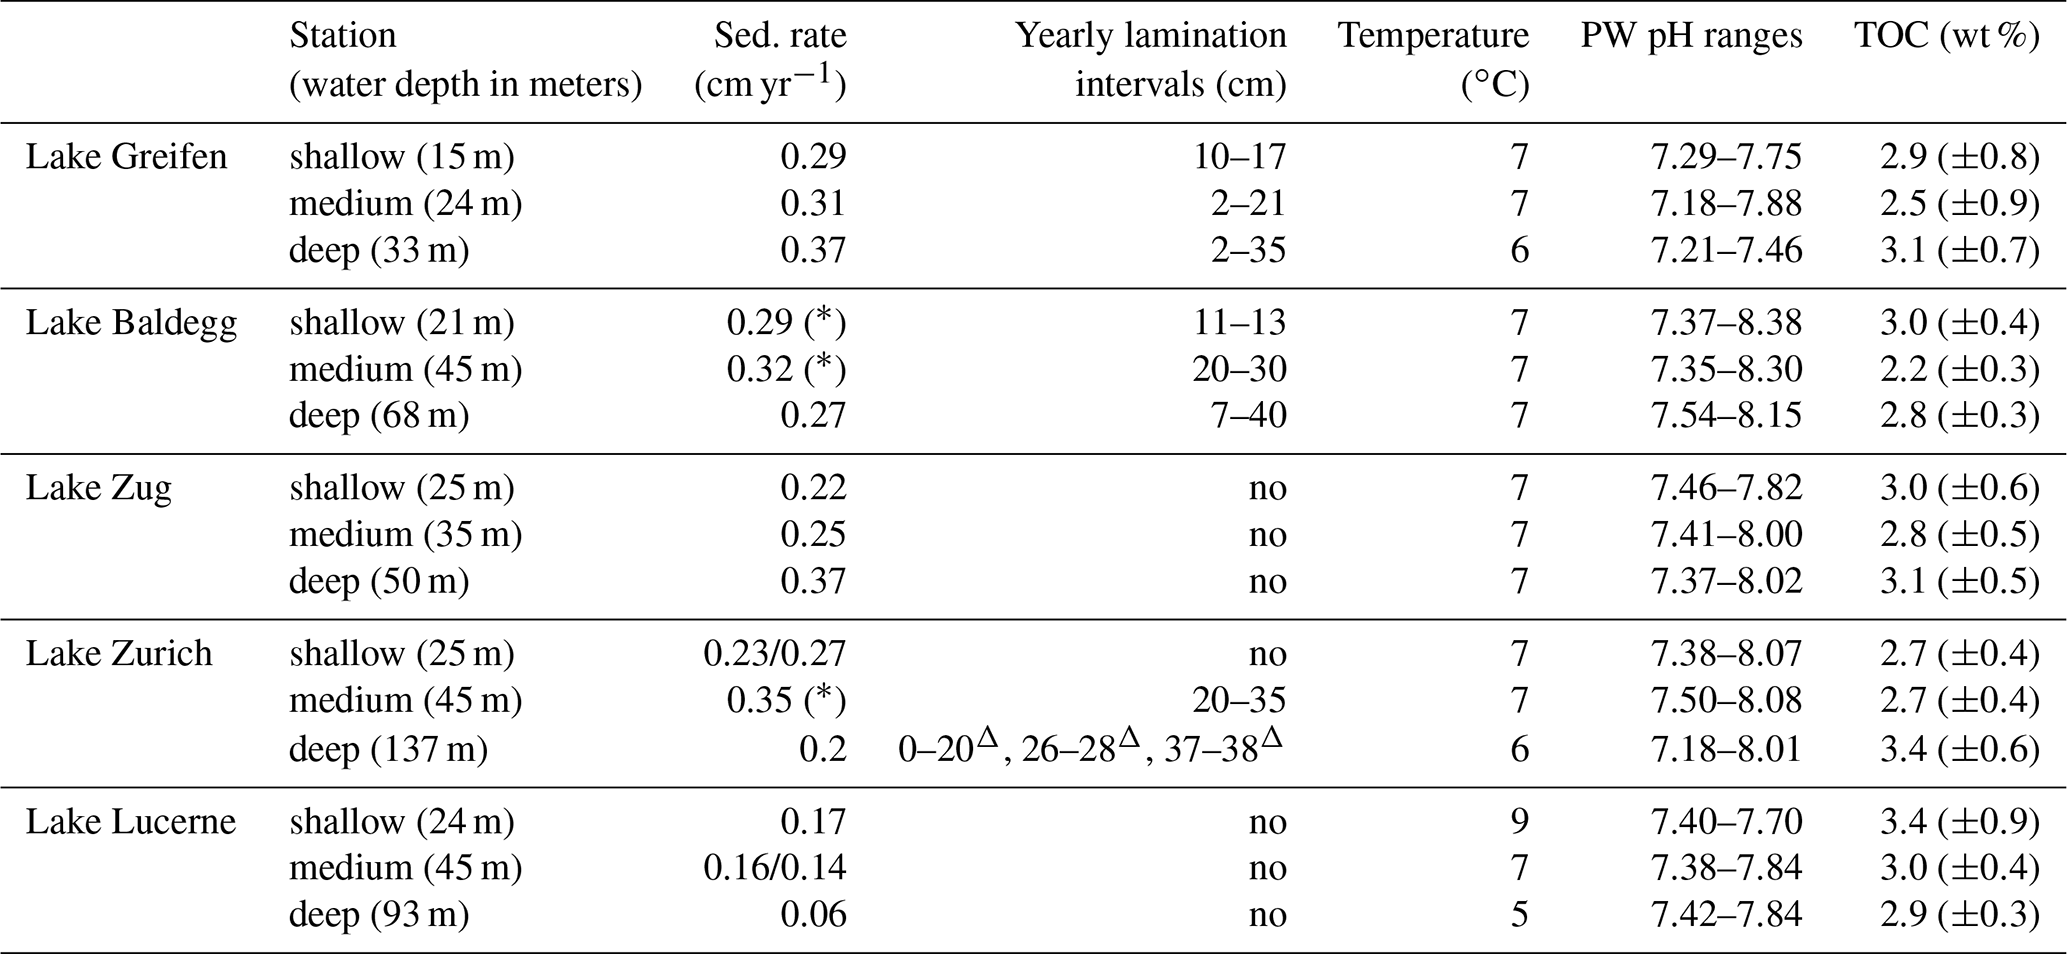
Table 2Sedimentation rates, depth distributions of laminated layers, bottom water temperature, porewater pH, and average % TOC (± standard deviation (SD); 1920–2016) across stations in each lake. Triangles indicate laminations with the presence of turbidites. Stars indicate sediments without clear 137Cs peaks. Sedimentation rates changed in Lake Zurich (25 m), from 0.23 cm yr−1 in the top 7 to 0.27 cm yr−1 below and in Lake Lucerne (45 m) from 0.16 cm yr−1 in the top 5 cm to 0.14 cm yr−1 below.
3.1 Basic sediment parameters
An overview of the sedimentation rates, lamination intervals, bottom water temperatures, sediment porewater pH, and TOC content (TOCmeasured) at each station is shown in Table 2. Average sedimentation rates (in cm yr−1, ± standard deviation) in the eutrophic lakes (Lake Greifen: 0.32±0.04; Lake Zug: 0.28±0.08; Lake Baldegg: 0.29±0.03) are slightly higher than in the mesotrophic Lake Zurich (0.23±0.03) and considerably higher than in the oligotrophic Lake Lucerne (0.13±0.06). Yearly laminations, indicating absence of significant macrofaunal sediment mixing, are present in several depth intervals at stations in Lake Greifen, Lake Baldegg, and Lake Zurich, but are absent from all stations in Lake Lucerne and Lake Zug (also see core photos in Fig. S3). These laminations mainly occur from the mid–upper to mid–bottom halves of cores. The deep station of Lake Baldegg is an exception, in that laminations occur all the way to the bottom of the core. Bottom water temperatures at the time of sampling were between 5 and 9 ∘C. The pH in all sediment cores was close to neutral, and the average TOC contents were similar across all lakes, showing no relationship with trophic state.
3.2 Relationships between TOC and sediment depth
TOCmeasured in all five lakes ranges mostly from 2 % to 4 % (total range: 1.1 %–5.3 %), with all stations showing a decrease with sediment depth (Fig. 2, Table 2). Despite this decrease, most lakes show local subsurface peaks between 10 and 30 cm depth, in particular the three eutrophic lakes. While TOC values between lakes show strong overlaps in the upper halves of cores, low TOC in deeper sediment layers suggests that historically two of the lakes, Lake Greifen and Lake Zug, were oligotrophic. This is confirmed by core images, which indicate that the deeper parts of the Lake Greifen and Lake Zug cores are dominated by organic-poor, calcium carbonate-rich clay (“Seekreide”) (Fig. S3).

Figure 2TOC (solid black line), TOCmodeled (solid green line), and TOCreconstructed (grey dashed line). Water depth (m) for each station is indicated at the top of each subplot; cm b.l.f.: centimeters below lake floor.
TOCmodeled profiles, based on first-order decay of OC that was fitted to TOCmesured in surface sediments, compare to TOCmeasured as follows (Fig. 2): in the three eutrophic lakes, TOCmodeled (locally) underestimates TOCmeasured in the top 10–30 cm, but matches or overestimates TOCmeasured data in lower parts of cores. In Lake Zurich, the model matches the measured data well, with only slight local underestimations of TOCmeasured in the upper halves of all three stations. In Lake Lucerne, the model generally matches TOCmeasured in the top ∼15 cm, but consistently overestimates TOCmeasured in deeper layers.
Reconstructed past TOC accumulation rates at the sediment surface (TOCreconstructed) suggest that sediment layers of the three eutrophic lakes that are at depths of 10–30 cm today in many cases received higher inputs of OC when they were located at the sediment surface than does today's sediment surface. By contrast, the TOCreconstructed data in Lake Zurich and Lake Lucerne do not indicate past periods of consistently higher TOC input to surface sediments than today. Irrespective of today's trophic state, the TOCreconstructed from all lake stations suggest that, on average, the TOC content at the sediment surface was lowest at the time that the deepest (and oldest) layers of sediment were deposited.
3.3 TOC burial and accumulation rates over time in relation to P concentrations
The correlation between trophic state and TOC burial becomes clearer when plotted against time (Fig. 3). Reflecting the higher sedimentation rates and similar TOCmeasured (Table 2), TOC burial rates increase with trophic state, being highest in the eutrophic Lake Baldegg and Lake Greifen and lowest in the oligotrophic Lake Lucerne (Fig. 3). Reflecting the depth trends in TOC %, TOC burial rates overall decrease with sediment age, but show distinct peaks in layers deposited from 1940 to 1990. The reconstructed TOC accumulation rates support this observation and suggest that peak TOC accumulation rates occurred between 1960 and 1980 in the eutrophic lakes. In addition, two stations in Lake Baldegg (21 and 45 m water depth) have a later peak in TOC accumulation rate that dates to the turn of the 21st century.
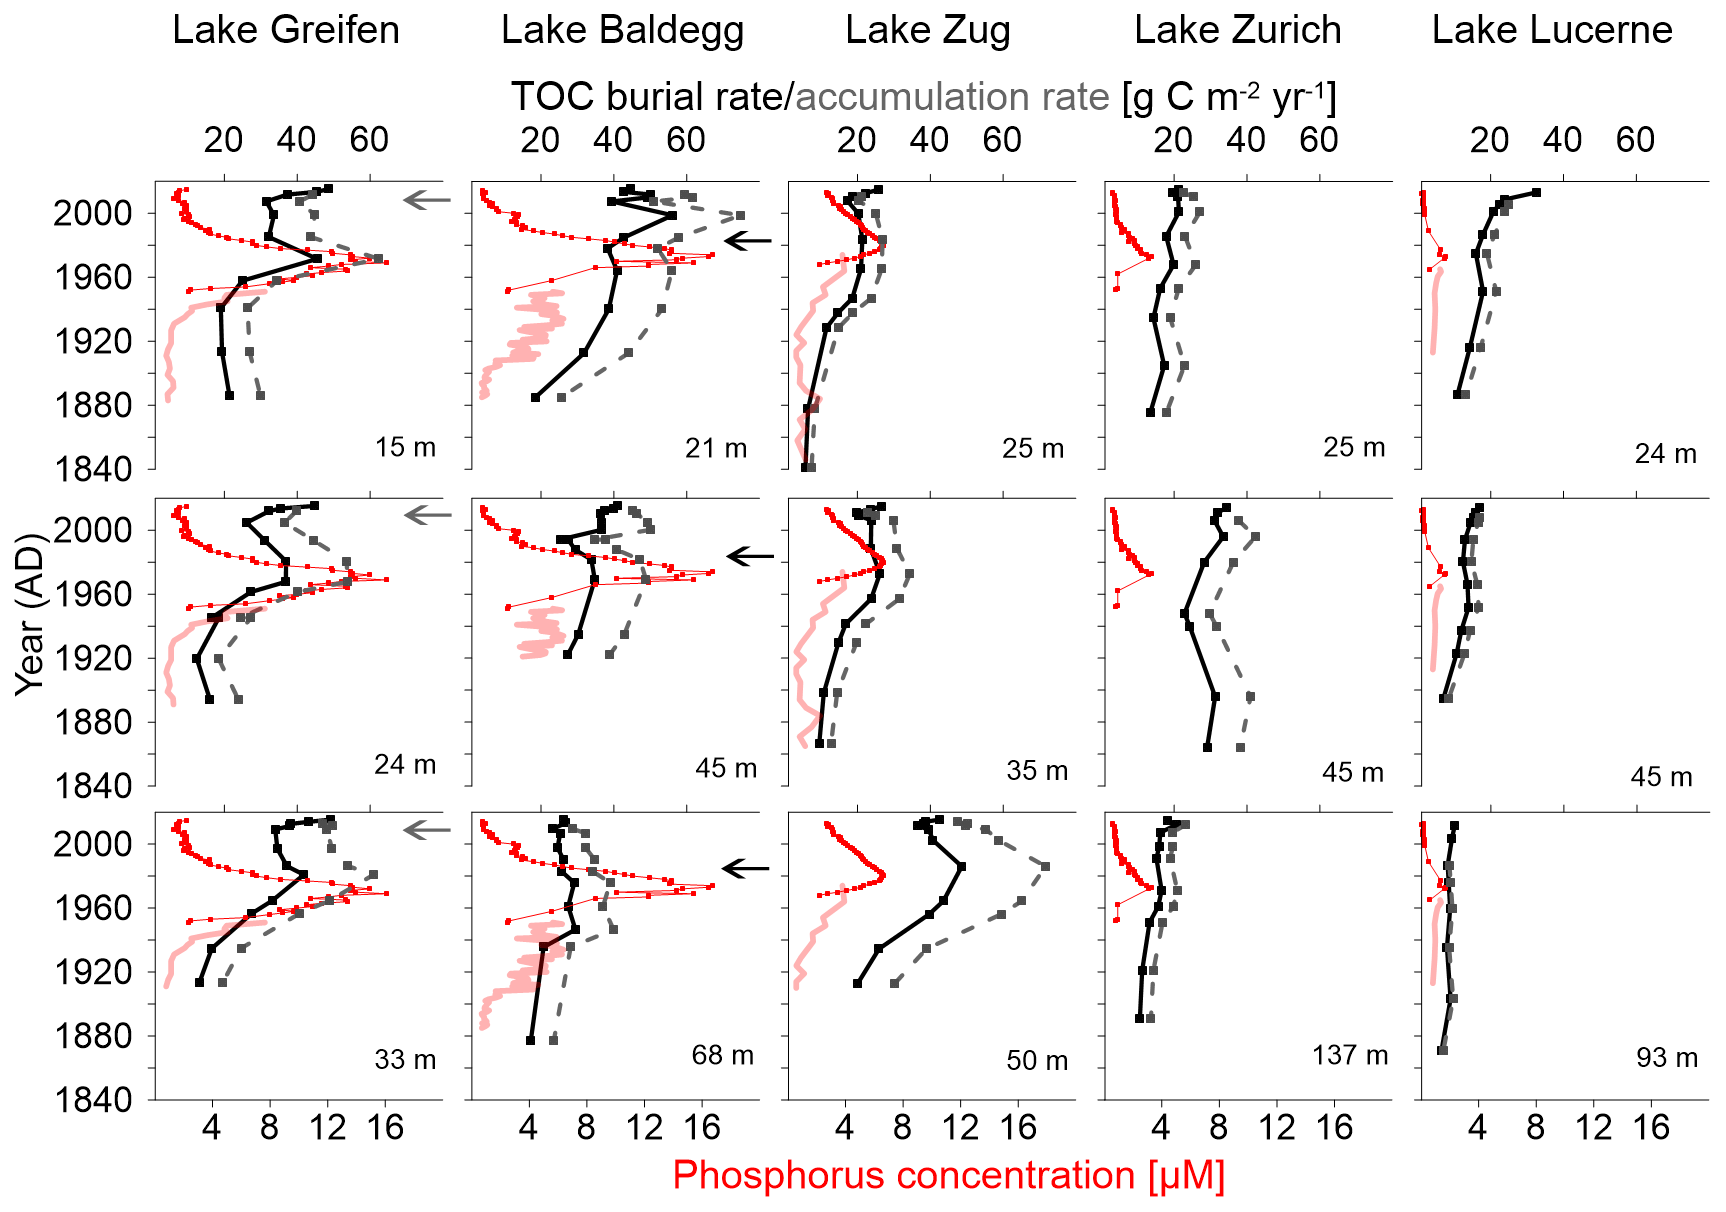
Figure 3TOC burial rates (black solid lines), reconstructed TOC accumulation rates (dashed grey lines), measured water column total P concentrations (red solid lines), and reconstructed water column total P concentrations (red dotted lines), all plotted against sediment age at various lakes and lake stations.
In Lake Greifen and Lake Zug increases in TOC burial and accumulation rate took place later than in Lake Baldegg, occurring mainly from 1920 onward, whereas in Lake Baldegg TOC burial and TOC accumulation rates were already increasing in the late 19th century. Incorporating changes in water column P concentrations from Fig. 1 into Fig. 3 shows that in the eutrophic Lake Greifen, Lake Baldegg, and Lake Zug increases in water column P concentrations occurred during the same time that TOC burial and accumulation rates increased during the 20th century. Peak P concentrations were measured between 1960 and 1980, when the highest TOC accumulation rates were also determined. Recent, strong decreases in water column P concentrations match significant albeit less marked decreases in TOC accumulation rates in Lake Greifen and Lake Zug. Comparing the time period of peak P concentrations to the time period from 2000 to 2014, P concentrations decrease by ∼87 % and 49 % in Lake Greifen and Lake Zug, whereas average TOC accumulation rates only decrease by 24±11 % and 22±5 %, respectively. By contrast, in Lake Baldegg, where the decrease in P concentrations was the greatest during this time (∼91 %), there was no significant decrease in TOC accumulation rate (6±14 %). In contrast to the eutrophic lakes, TOC accumulation rates in Lake Zurich and Lake Lucerne show no clear response to the (minor) temporary increases in water column P concentrations during the 20th century. Similarly, though P concentrations have decreased by ∼75 % (Lake Zurich) and ∼89 % (Lake Lucerne) between the time of the P concentration peak and 2000–2014, TOC accumulation rates have not changed significantly (Lake Zurich: 0±4 %) or in fact increased, albeit insignificantly (Lake Lucerne: 11±17 %).
Correlation analyses suggest that across all five lakes there is a highly significant (p<0.001), positive correlation between TOC accumulation rates and P concentrations (Fig. 4). For the entire time period from 1840 to 2016 considerable scatter and a low coefficient of determination (R2=0.28) indicate that P concentrations only account for a minor portion of the observed variation in TOC accumulation rates (Fig. 4a). This changes, however, if only data from until the P peak are taken into account. Pairing these TOC accumulation rates with corresponding modeled and measured P concentrations (Fig. 4b) increases the R2 to 0.54. When only TOC accumulation rates and measured P concentrations until the P peak are plotted (Fig. 4c), this R2 increases further to 0.72. By contrast, the scatter increases (R2=0.23), and the slope of the trend line decreases, when only TOC accumulation rates from after the P peak are correlated with measured P concentrations (Fig. 4a, d). Nonetheless, even during these recent decades, the correlation between TOC accumulation rates and P concentrations remains highly significant.
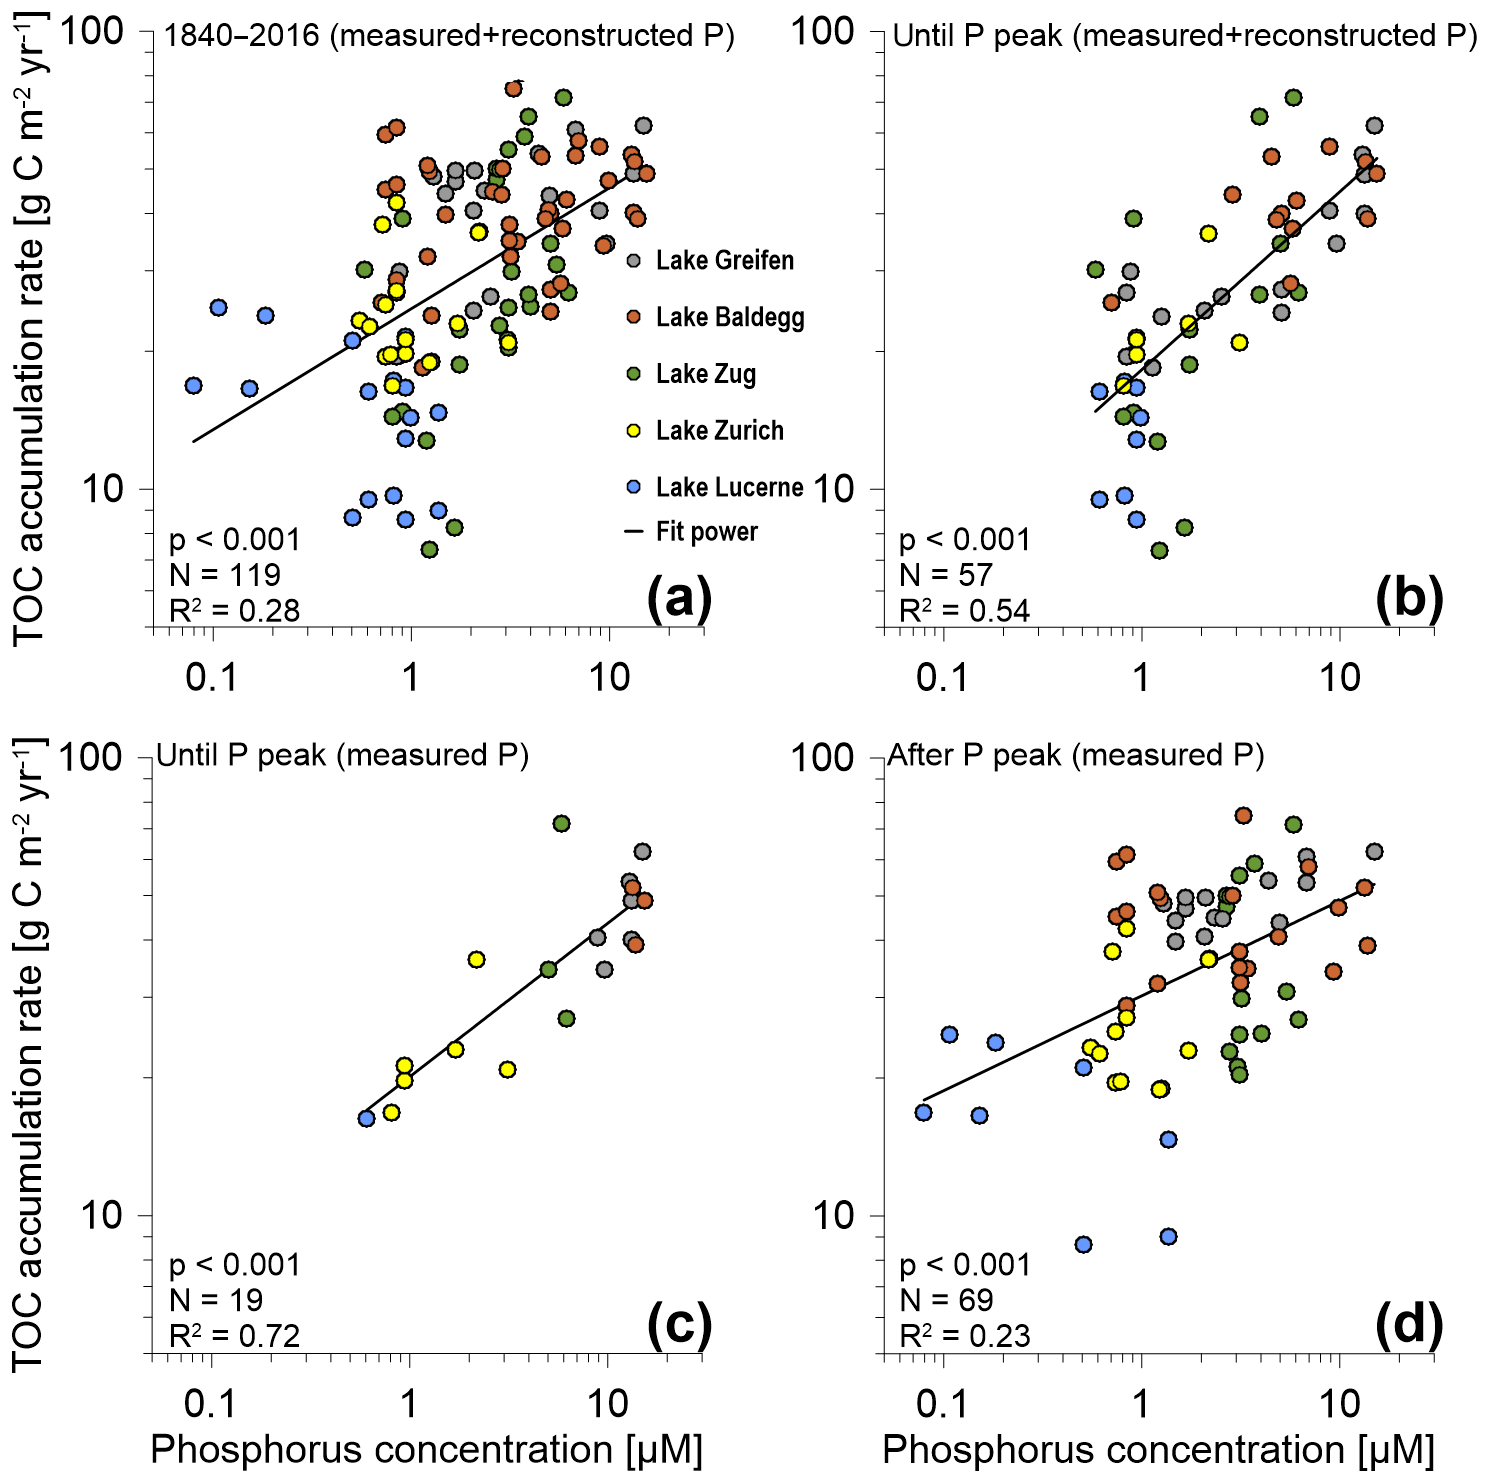
Figure 4TOC accumulation rates (g C m−2 yr−1) vs. P concentrations for (a) the entire P dataset (1840–2016), (b) measured and reconstructed P concentrations until the P concentration peak in the 1960s and 1970s (includes the peak), (c) only measured P concentrations for the time period until the P concentration peak (includes the peak), and (d) measured P concentrations for the time period after the P concentration peak. N is the number of data points included in each graph. Coefficients of determination (R2) values are based on best-fit power trend lines. P values are based on two-sided Spearman rank correlation tests. (Note: for Lake Zurich, only measured P data were available. Furthermore, in (a) and (b), for data points where both measured and reconstructed P concentrations were available, we only included measured values.)
3.4 Distribution of microbial respiration reactions and microbial population size
Porewater and solid-phase concentrations of electron acceptors and end products of microbial respiration are presented in this section. These concentrations provide insights into the distributions and rates of different OC respiration reactions.
3.4.1 O2
At all stations, O2 concentrations decrease in a consistent, concave down-fashion, indicating high rates of O2 consumption in the absence of significant O2 production (Fig. 5, first row). Average O2 penetration depths are lowest in Lake Baldegg and Lake Greifen (Table 3), indicating the highest rates of aerobic respiration. Penetration depths increase with less eutrophic conditions in Lake Zug and Lake Zurich and are greatest in Lake Lucerne, suggesting the lowest rates of aerobic respiration in the latter. Not surprisingly, the deep station from the hypoxic deep basin in Lake Zurich shows lower O2 penetration than the shallower stations. In Lake Lucerne O2 penetration increases from the shallow station to the deep station. By contrast, the other three lakes show no trends related to water depth and are less variable in O2 penetration depths.
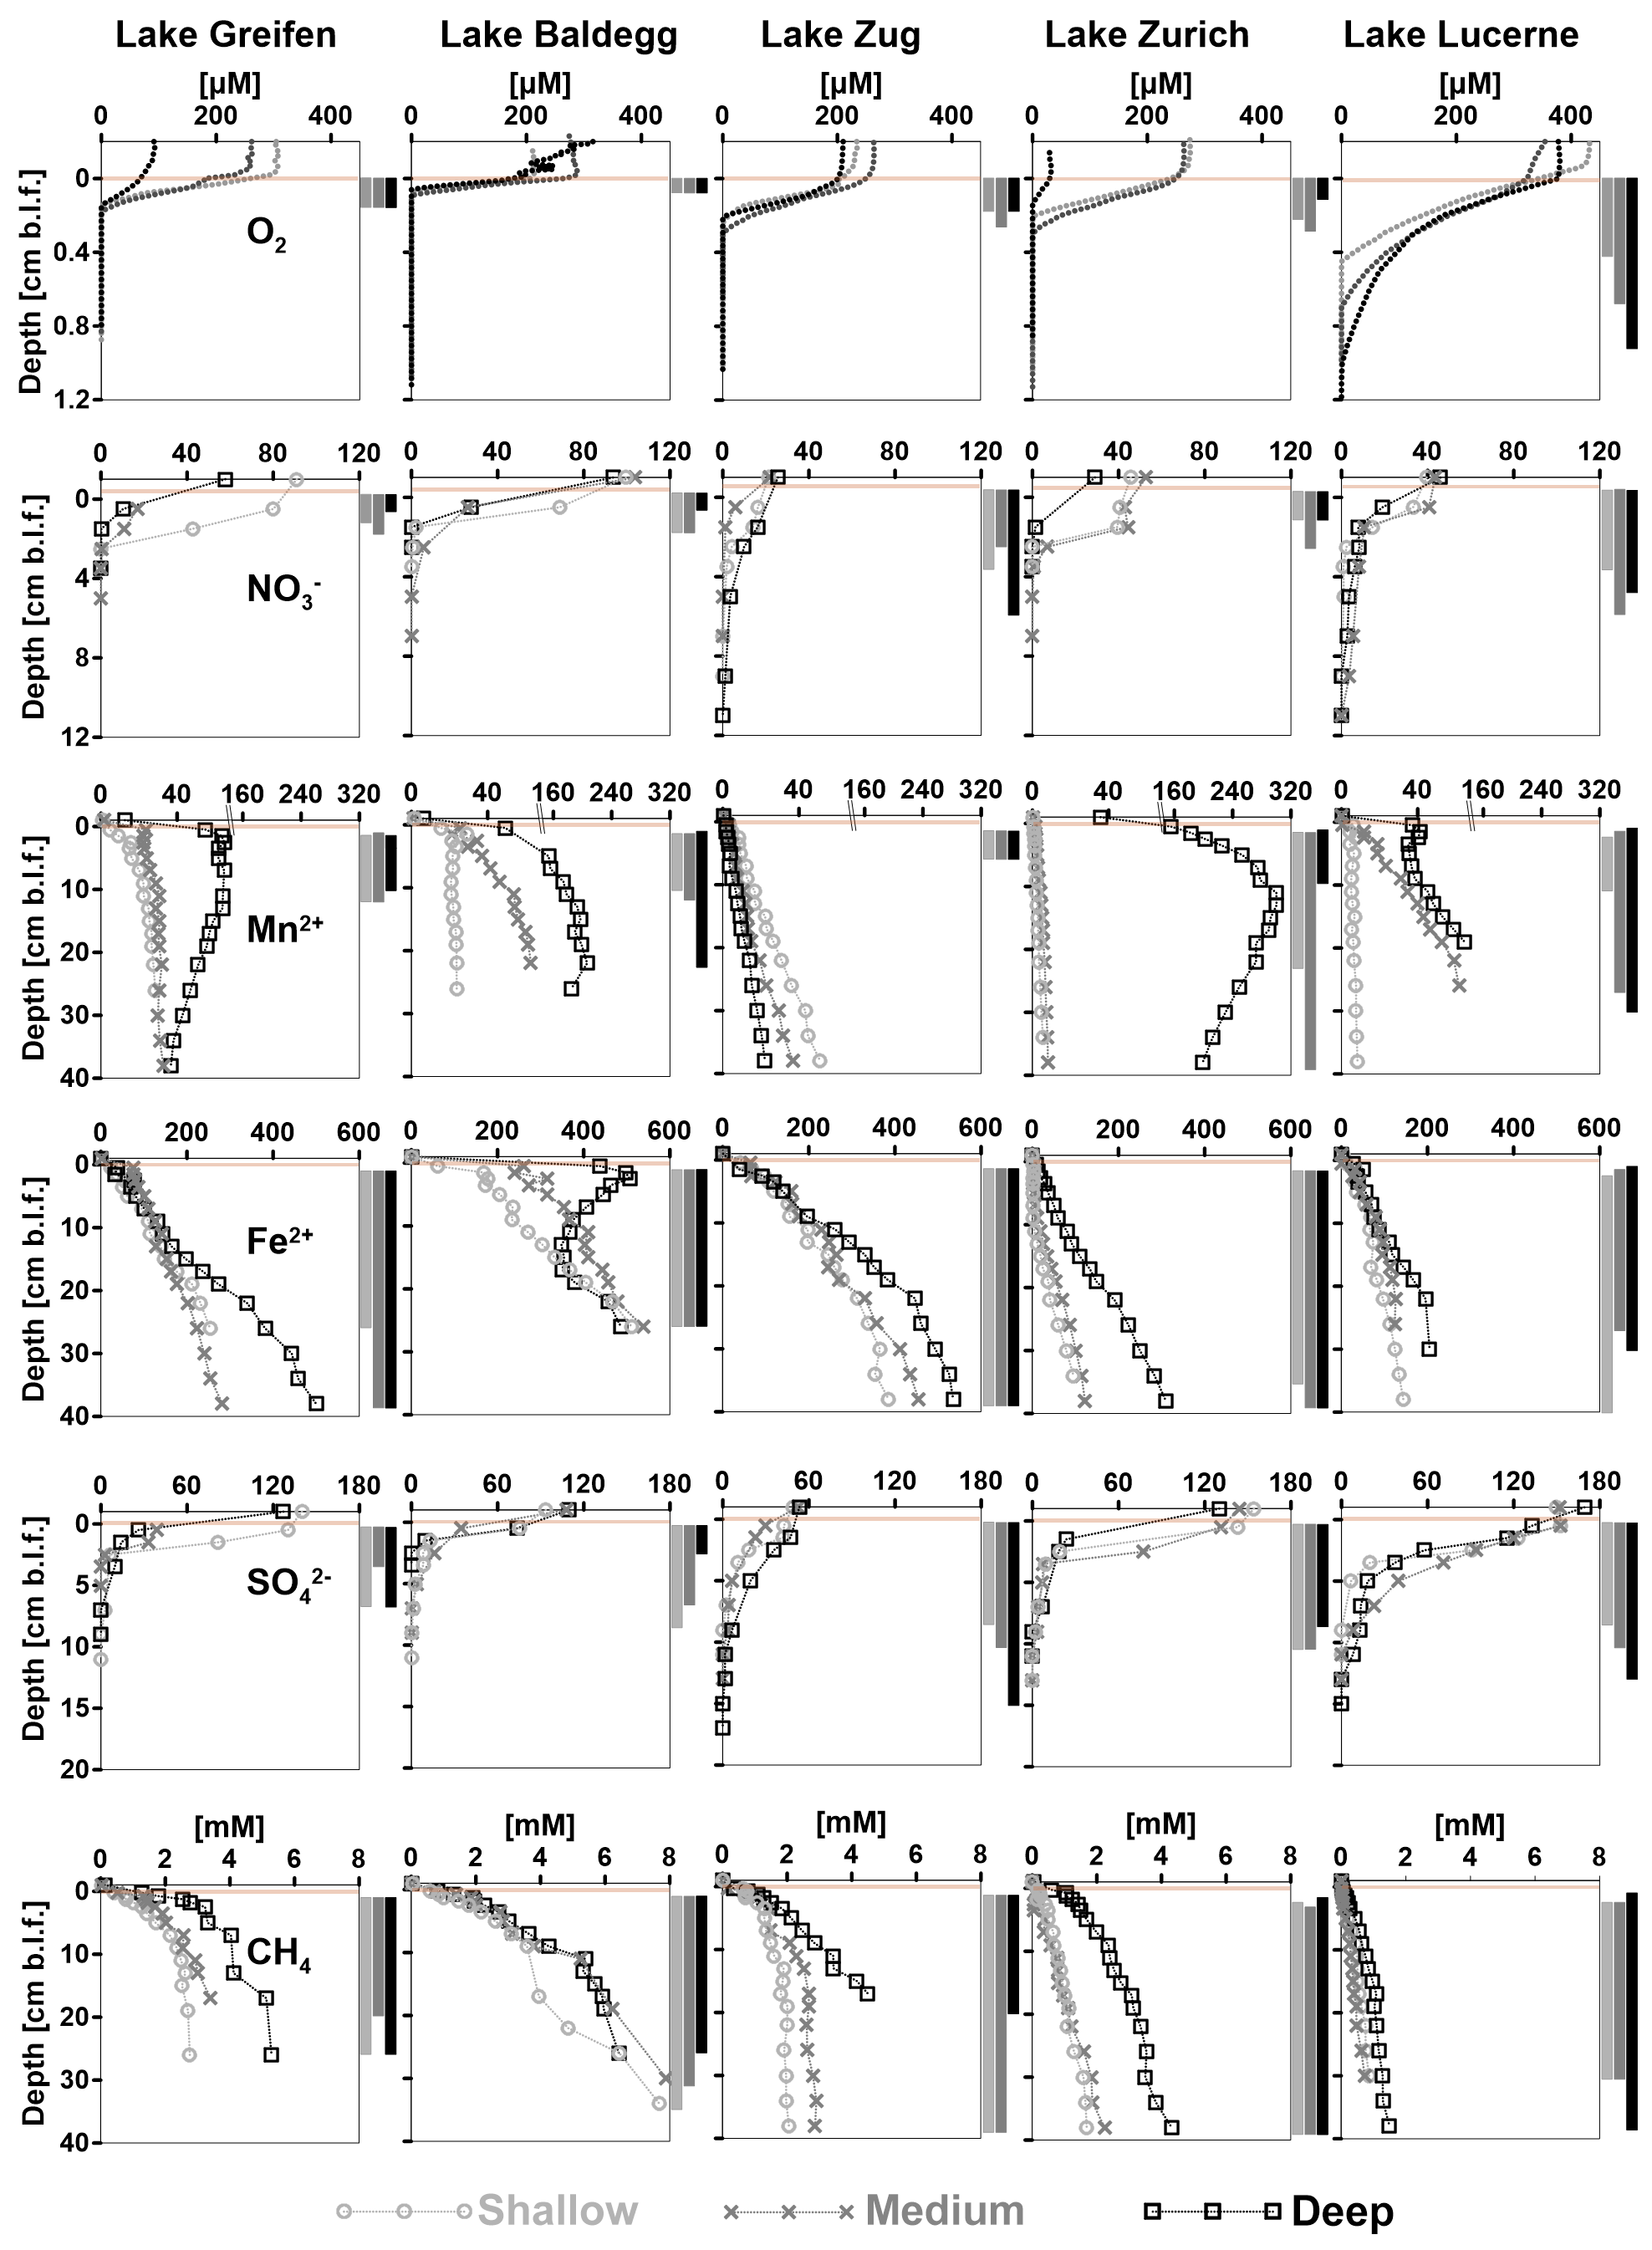
Figure 5Concentration profiles of O2, , Mn2+, Fe2+, , and CH4 vs. sediment depth (cm b.l.f.) organized by analyte and lake. Each graph shows concentration profiles of all three stations per lake. Light brown horizontal bars indicate the depth of the sediment–water interface. CH4 measurements with significant outgassing during sampling were omitted. The inferred depth distributions of respiration reactions are indicated by vertical bars to the right of each graph. Notes: (1) depth ranges on y axes vary between analytes; (2) analyte concentration ranges on x axes vary with analytes. (3) Please note that there is no BW sample available for and at the Lake Greifen medium station.
Table 3Average ± SD depth distributions (cm b.l.f.) of microbial respiration reactions in each lake.
3.4.2
Bottom water concentrations of are higher in Lake Greifen (57–100 µM) and Lake Baldegg (93–103 µM) than in Lake Zurich (29–45 µM), Lake Lucerne (39–45 µM), or Lake Zug (21–25 µM) (Fig. 5, second row). The penetration depths are lowest in Lake Greifen and Lake Baldegg. This combined with the high concentrations of nitrate indicate that denitrification rates are highest in these two eutrophic lakes. penetration depths increase in Lake Zurich, Lake Zug, and Lake Lucerne (Table 3). Combined with the water column concentrations, this indicates that denitrification rates are next highest in Lake Zurich, followed by Lake Zug and Lake Lucerne. The wide ranges in bottom water concentrations in Lake Greifen and Lake Zurich, which have lower concentrations at the medium and deep stations, and at the deep station compared to shallower stations, respectively, suggest water column denitrification in the (seasonally) hypoxic deeper parts of these lakes. Shallow and medium stations in Lake Greifen, Lake Zurich, and Lake Lucerne show concave-up profiles in the top 1–2 cm of sediment, suggesting microbial production by nitrification in this layer.
3.4.3 Mn2+
Dissolved Mn2+ was absent in significant concentrations in the bottom water of all the lakes, except the hypoxic deep station in Lake Zurich (35 µM) and the deepest stations in Lake Greifen (12 µM) and Lake Baldegg (6 µM) (Fig. 5, third row). At all stations, [Mn2+] increases in the upper sediment layers, suggesting microbial Mn(IV) reduction. Microbial Mn reduction occurs at lower rates than microbial Fe reduction, as indicated by lower [Mn2+] than [Fe2+], except in the deep station in Lake Zurich, where [Mn2+] > [Fe2+] in the upper 30 cm. In all the lakes except Lake Zug porewater [Mn2+] increases from shallow to deep stations, suggesting enhanced microbial Mn reduction rates from shallow to deep sediments. At most stations [Mn2+] increases in a concave-down fashion with depth, indicating continuous albeit decreasing Mn2+-reduction rates throughout the cores. However, reliable interpretations of the lower depth limit of Mn-reducing microbial activity are in some places confounded by local [Mn2+] peaks, by strong [Mn2+] decreases, and/or near-linear increases in [Mn2+] profiles in subsurface layers (deep stations in Lake Greifen, Lake Zurich, and Lake Lucerne, all stations in Lake Zug). Therefore, as indicated in Fig. 5 and Table 3, the lower depth limits of Mn reduction are associated with considerable uncertainty.
3.4.4 Fe2+
[Fe2+] is low (<2 µM) or absent in bottom water and increases in porewater of surface sediment due to microbial Fe reduction (Fig. 5, fourth row). At all stations, the highest porewater [Fe2+] was present in the core bottoms, suggesting that the Fe reduction zone extends beyond the depth sampled (Table 3). In the eutrophic lakes, [Fe2+] accumulates rapidly, reaching 200–400 µM (Lake Baldegg), 60–100 µM (Lake Greifen), and 120–160 µM (Lake Zug) in the top 5 cm. Below, concentrations continue to increase, reaching 500–540 µM (Lake Baldegg), 250–500 µM (Lake Greifen), and 380–530 µM (Lake Zug) at the core bottoms. An exception is the deep station in Lake Baldegg, where the [Fe2+] has a local subsurface minimum at ∼16 cm b.l.f. (centimeters below lake floor). Compared to the eutrophic lakes, Lake Zurich and Lake Lucerne appear to have lower microbial Fe-reducing activity, as evidenced by lower [Fe2+] concentration maxima (Lake Zurich: 95–310 µM; Lake Lucerne: 120–200 µM). Furthermore, Lake Zurich has divergent [Fe2+] profiles, having – within the upper 8 cm – consistently low (<4 µM) concentrations (shallow and medium stations) or a near-linear concentration increase (deep station). Thus, porewater [Fe2+] profiles that clearly indicate Fe reduction are not established until depths >8 cm (also see “Solid-phase Fe pools and EAC/EDC” in this section).
3.4.5
Bottom water concentrations of differ significantly between lakes, but show no trend in relation to trophic state. The oligotrophic Lake Lucerne (150–170 µM), mesotrophic Lake Zurich (130–150 µM), and eutrophic Lake Greifen (130–140 µM) have comparable concentrations that clearly exceed those in the eutrophic Lake Baldegg (90–110 µM) and Lake Zug (48–53 µM) (Fig. 5, fourth row). At all stations, porewater [] decreases steeply from the sediment surface downward, indicating significant microbial [] reduction in surface sediment, but penetrates deeper than . penetration depths are shallowest in the eutrophic Lake Greifen and Lake Baldegg and deepest in the oligotrophic Lake Lucerne (Table 3).
3.4.6 CH4
At all stations, [CH4] increase with depth to the core bottom, suggesting microbial methanogenesis beyond the cored intervals (Fig. 5, fifth row; Table 3). The highest [CH4] are reached in sediments of lakes Baldegg and Greifen (∼8 and ∼6 mM, respectively) and suggest higher methanogenesis rates than in sediments of the other lakes. Lake Zug reaches a maximum [CH4] of 2–4.5 mM at the core bottom. In Lake Zurich, the shallow and medium stations reach [CH4] of 1.7 and 2.2 mM, respectively, whereas [CH4] at the deep station reach 4 mM. In Lake Lucerne, [CH4] remain <1.5 mM, indicating the lowest methanogenesis rates among all five lakes. Strong increases in [CH4] and δ13C-DIC (data not shown) in the three eutrophic lakes and the deep station of Lake Zurich suggest that the methanogenesis zone already begins within the top 1 cm of sediment. By contrast, absence of significant [CH4] accumulation and decreases in δ13C-DIC (data not shown) indicate minimal methanogenesis, and instead significant rates of methane oxidation, in the top 2–3 cm of all Lake Lucerne stations and the shallow and medium stations in Lake Zurich.
3.4.7 Solid-phase bioavailable Fe pools and EAC/EDC
Bioavailable Fe(III) scatters between 0 and 5 mM in all lakes except in surface sediment of Lake Lucerne, where concentrations up to 25 mM were measured in a ∼2 cm thick, oxidized surface layer (Fig. S6). Despite the absence of a clear decrease in bioavailable Fe(III), bioavailable Fe(II) increases with depth at all stations, from 5 to 10 mM at the surface to 30–50 mM in deeper layers, consistent with microbial reduction of Fe(III), which is apparently not limited to the “bioavailable” fraction, to the bottom of all cores (Fig. S6). The steepest increase in Fe(II) typically occurs in the top ∼5 cm, suggesting that iron reduction rates are highest in surface sediments. The electrochemical measurements confirm the trends in bioavailable Fe(II) and Fe(III), with a greater EDC than EAC everywhere except in the oxidized surface layer of Lake Lucerne, strong scatter in the EAC throughout all cores, and a general increase in EDC with depth (Fig. S6).
3.5 Total and cell-specific microbial respiration activity
At all stations, DIC concentrations increase with depth in a typical concave-down fashion that indicates the highest rates of total respiration in surface sediments and a decrease in microbial respiration rates with depth (Fig. 6, first column).
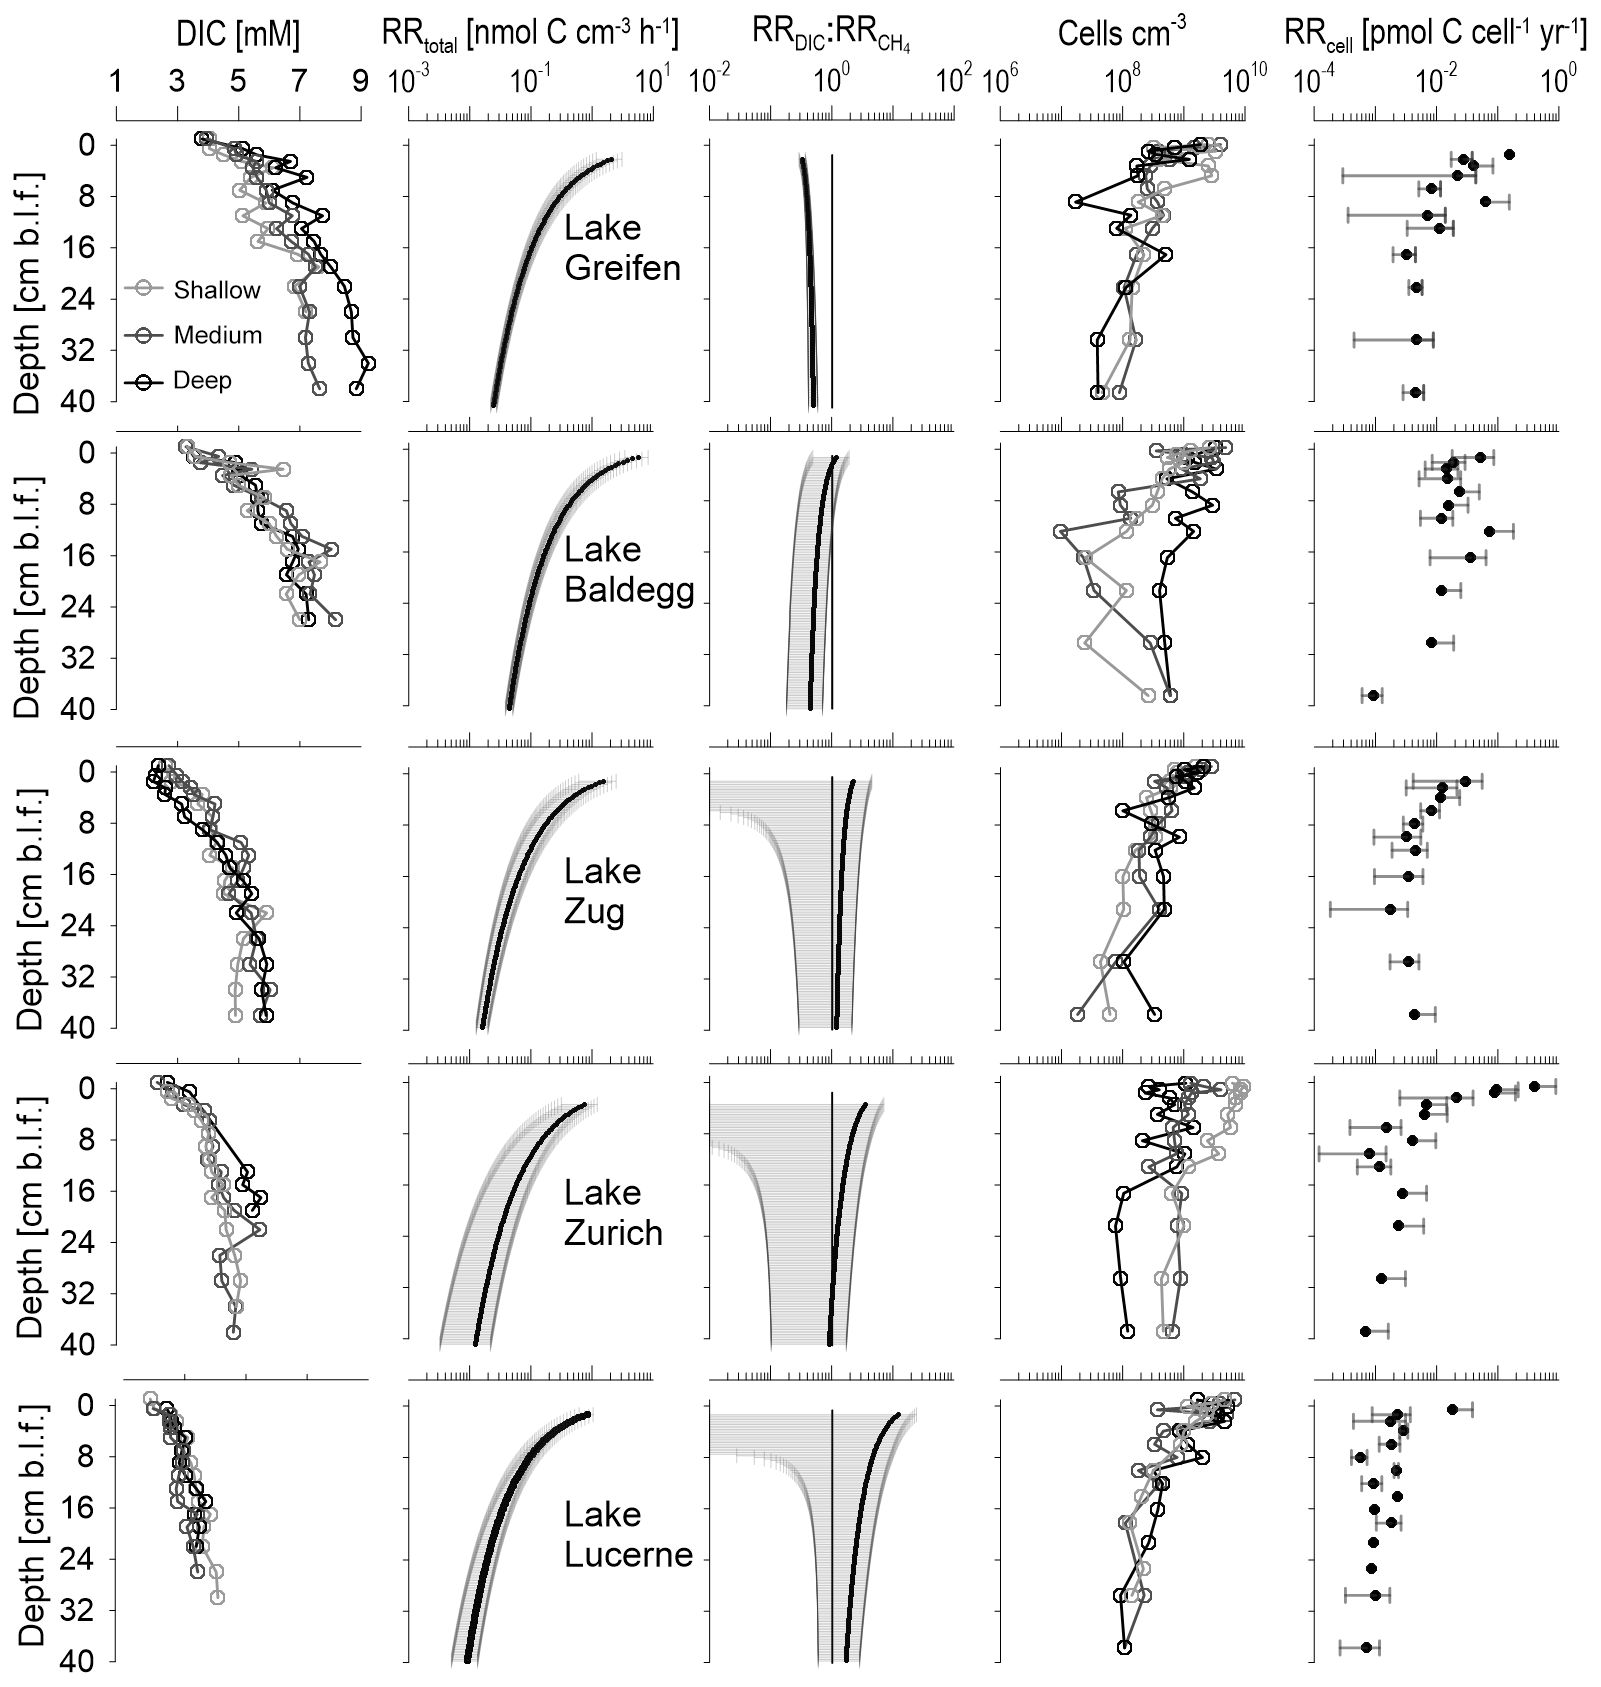
Figure 6Depth profiles of DIC concentrations, total microbial respiration rates (), ratios of DIC production to methanogenesis rates (), cell abundances, and cell-specific respiration rates (RRcell). DIC concentrations and cell counts are shown for each station individually. RRtotal and are lake-specific averages (black line) with standard deviation ranges (grey areas). A 1:1 line indicates . RRcell are averages ± SD for samples with cell count data.
Sediments from Lake Baldegg and Lake Greifen show the highest DIC concentrations, reaching 6–9 mM near the core bottom. With a decrease in trophic state, there is a decrease in DIC accumulation, indicative of lower rates of microbial respiration. Accordingly, DIC maximum concentrations in the core bottoms reach 5–6 mM in Lake Zug, 4–5 mM in Lake Zurich, and 3–4 mM in Lake Lucerne. Similar trends in relation to trophic state are present for concentrations, which are a proxy for the microbial breakdown of N-containing organic matter, such as amino acids and nucleic acids (Fig. S5).
Consistent with the DIC profiles, the modeled RRtotal decrease with depth in all five lakes (Fig. 6, second column). While RRtotal decreases by approximately 2 orders of magnitude in all lakes, sediment horizons from eutrophic lakes have higher average RRtotal than the same sediment depths in oligotrophic lakes. For instance, the mean RRtotal in the shallowest layers is 2.1, 5.8, and 1.6 nmol C cm−3 h−1 in Lake Greifen, Lake Baldegg, and Lake Zug, respectively, compared to ∼1 nmol C cm−3 h−1 in both Lake Zurich and Lake Lucerne. This difference is maintained all the way to the bottom of the cores, where values in Lake Greifen (0.05 nmol cm−3 h−1), Lake Baldegg (0.03 nmol cm−3 h−1), and Lake Zug (0.02 nmol cm−3 h−1) remain higher than in Lake Zurich and Lake Lucerne (both 0.01 cm−3 h−1).
The ratio of indicates a higher contribution of methanogenesis to RRtotal throughout the sediment cores of the three eutrophic lakes (Fig. 6, third column). This difference is most pronounced in surface sediments, where mean values are 0.3 in Lake Greifen, 1.2 in Lake Baldegg, and 2.3 in Lake Zug, compared to 3.5 in Lake Zurich and 12 in Lake Lucerne. With increasing sediment depth, the mean becomes more similar between the lakes. While the remains fairly stable with depth in Lake Greifen, all other lakes display a decrease in with depth, indicating a depth-dependent increase in the contribution of methanogenesis to total respiration.
In all five lakes, microbial cell numbers decrease with depth. Cell counts in surface sediments range from 109 to 1010 cm−3 and decrease to ∼107–109 cm−3 in deeper layers (Fig. 6, fourth column). Cell numbers do not reflect trophic state or RRtotal. On the contrary, though there are strong overlaps between the lakes, the highest average cell counts in surface sediments are from the mesotrophic Lake Zurich and the oligotrophic Lake Lucerne, and the highest average cell counts in deeper layers are from Lake Zurich (Fig. S7). No clear subsurface peaks in cell counts, e.g., as relic signals of periods of peak eutrophication or TOC accumulation, are evident either. Instead, cell numbers show considerable scatter between stations (especially Lake Baldegg and Lake Zurich) and abrupt changes between adjacent sediment intervals (especially Lake Greifen, Lake Baldegg, and the deep station in Lake Zurich). The abrupt drop in cell concentrations in the lower half of the core from the deep station in Lake Zurich matches a lithological shift toward organic-poor, carbonate clay (“Seekreide”) layers, which are turbidites from upslope of the lake (Fig. S3). By comparison, the fluctuations in cell counts in Lake Baldegg and Lake Greifen do not match any measured geochemical or sedimentological parameters.
Reflecting the high variability in cell counts, the RRcell are also highly variable. Nonetheless, there are several clear trends. RRcell are highest at the sediment surface and then decrease, stabilizing within the top 5–10 cm and showing only minor changes throughout the remainder of the cores. Though the mean RRcell of surface sediment is not a good predictor of trophic state, with Lake Zurich having the highest RRcell (0.41 pmol C cell−1 yr−1), the RRcell reflect trophic state below 5–10 cm depth (Lake Greifen: ∼0.005 pmol C cell−1 yr−1; Lake Baldegg: ∼0.01 pmol C cell−1 yr−1; Lake Zug: ∼0.004 pmol C cell−1 yr−1; Lake Zurich: ∼0.002 pmol C cell−1 yr−1; Lake Lucerne: ∼0.0009 pmol C cell−1 yr−1). Based on a paired-sample Wilcoxon test, the average RRcell are not significantly different between Lake Baldegg and Lake Greifen, but are significantly different between Lake Baldegg and Lake Zug (p=0.04), Lake Zug and Lake Zurich (p=0.003), and Lake Zurich and Lake Lucerne (p=0.02).
3.6 Relationships of RRtotal, cell counts, and RRcell with sediment age
Due to differences in sedimentation rates between and within the lakes, analyzing RRtotal, microbial population size, and RRcell in the context of sediment depth alone does not provide reliable insights into the impacts of eutrophication. We therefore subdivided the study period into six time intervals, the pre-eutrophication era (1840–1900), three intervals of the eutrophication era (early: 1900–1940, mid: 1940–1960, peak: 1960–1980), and two intervals of the “post-eutrophication” era (1980–2000, 2000–2016). Within each time interval, we averaged the data from each station (Fig. 7). Due to the high intra-lake and intra-core variability, the standard deviations are high and in many cases overlap. Nonetheless, several insights into the relationships between eutrophication, microbial population size, and microbial respiration rates can be gained.
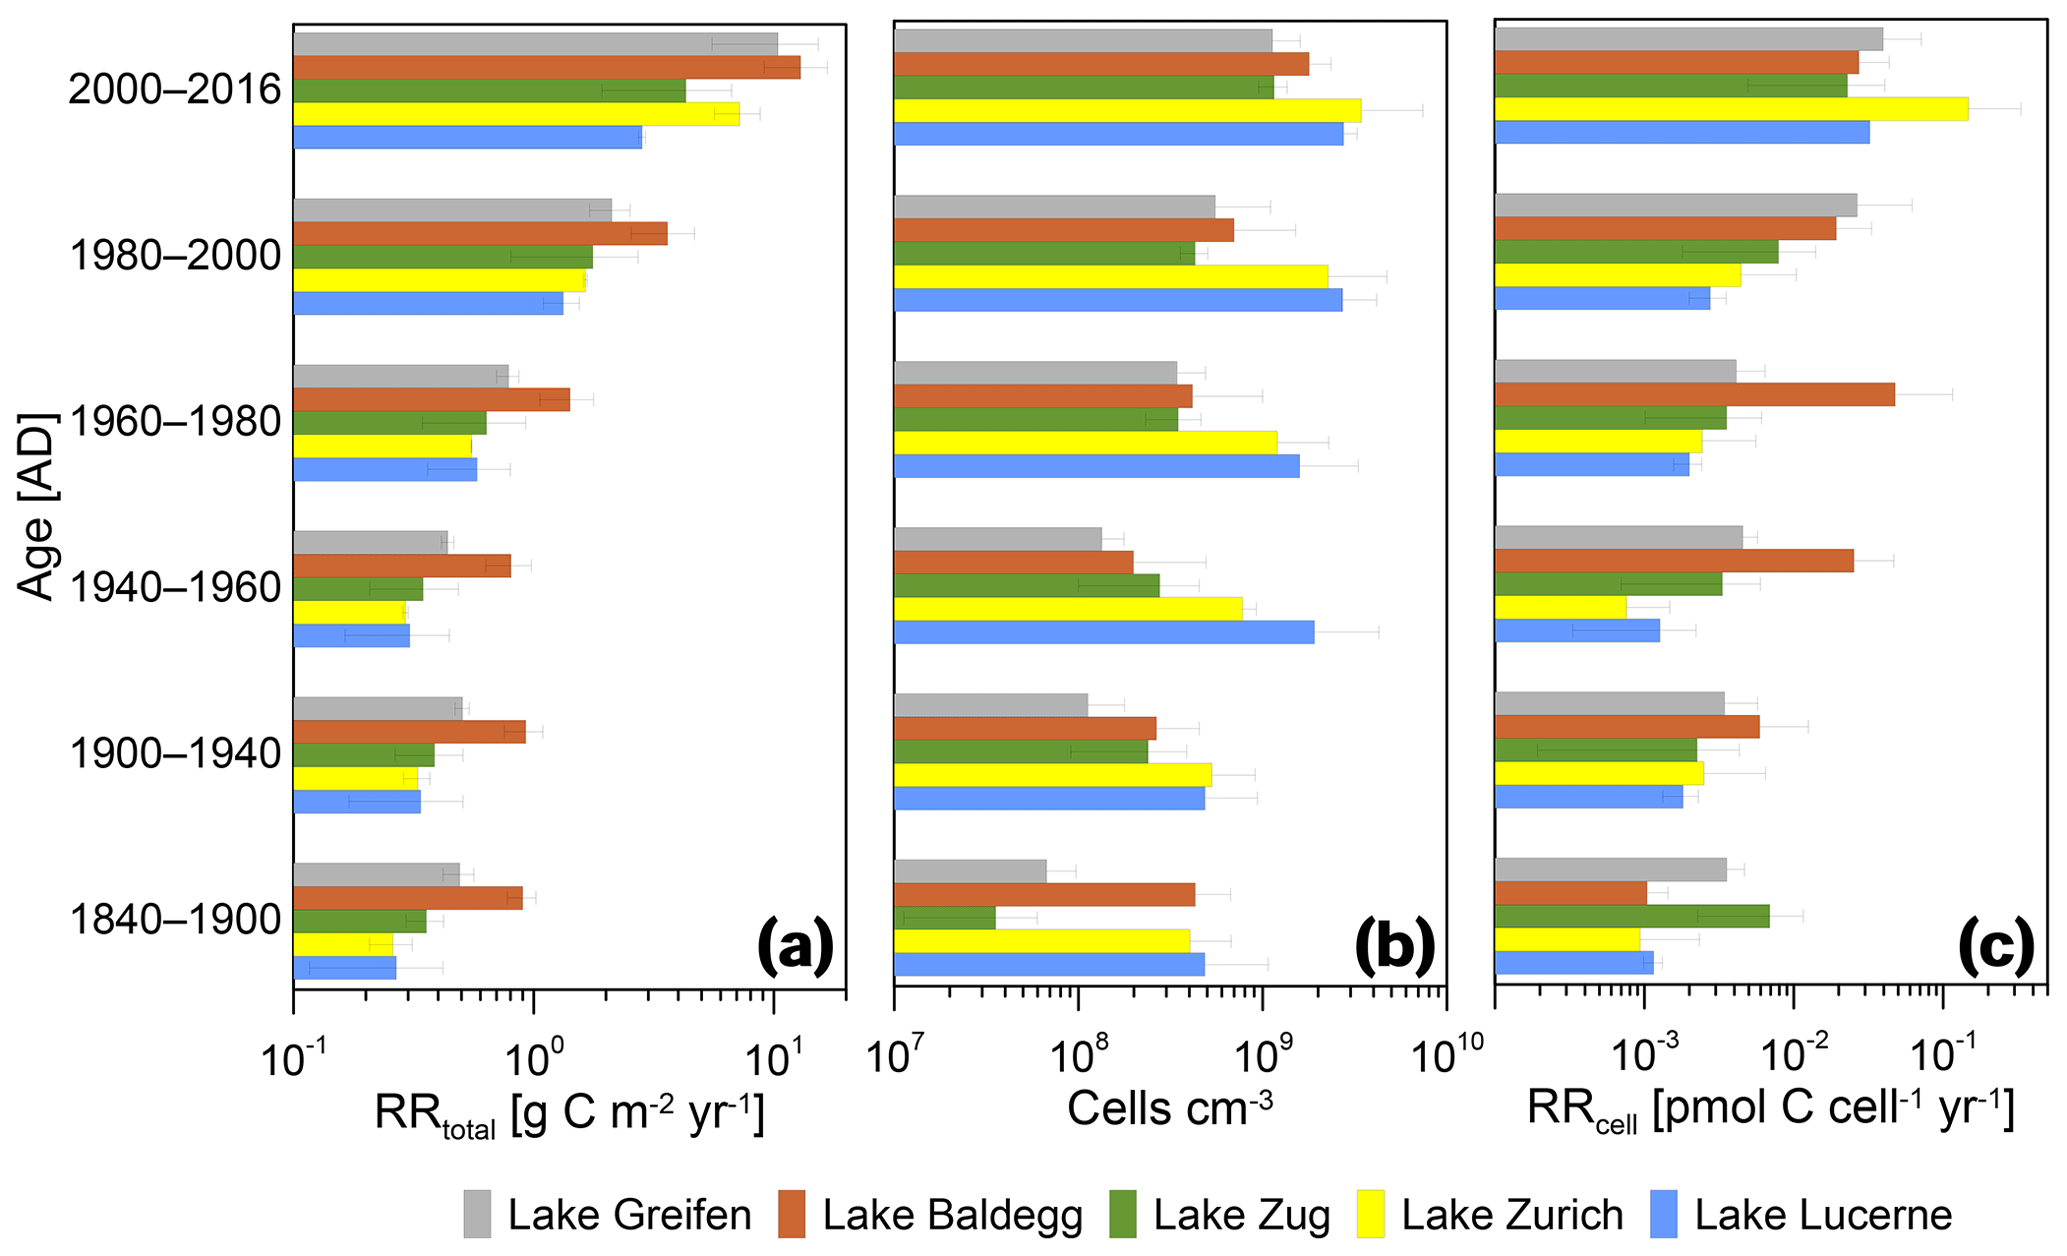
Figure 7Relationships between RRtotal, microbial abundance, and RRcell and sediment age. Error bars indicate standard deviations of averages for the three stations per lake during each time interval.
In all lakes, RRtotal decreases with sediment age in a near-asymptotic way, with a 1 order of magnitude decrease across sediment intervals from the last ∼60 years followed by minor decreases in older layers (Fig. 7a). Thus, sediments deposited during the pre-eutrophication, early eutrophication, and mid-eutrophication periods (i.e., from 1840 to 1960) have similar RRtotal today, even though TOC accumulation rates changed significantly across these periods (Fig. 3).
Cell numbers decrease with sediment age (Fig. 7b). Furthermore, the earlier observation (Fig. 6) that eutrophic lakes do not have higher cell counts than oligotrophic lakes is confirmed. When plotted against age since 1900, Lake Lucerne and Lake Zurich even have consistently higher average cell numbers than the eutrophic lakes. Depth-related decreases in cell numbers are also different between the lakes. The two lakes that went from highly oligotrophic to eutrophic (Lake Greifen, Lake Zug) have ∼20-fold (Lake Greifen) and ∼30-fold (Lake Zug) decreases in average cell numbers from 2000–2016 to 1840–1900. By comparison, cell counts in the other three lakes have smaller changes in cell numbers with sediment age (Lake Baldegg: ∼4-fold; Lake Zurich: ∼8-fold; Lake Lucerne: ∼6-fold).
The RRcell decrease within the first ∼4 decades since deposition, but stabilize in sediments that were deposited before 1980 (Fig. 7c). The only exception is Lake Baldegg, where the RRcell remains stable throughout all layers deposited since 1940 and only decreases in horizons deposited prior to 1940. The decrease in RRcell over time since deposition is approximately 1 order of magnitude in lakes Greifen, Baldegg, Zug, and Lucerne, and 2 orders of magnitude in Lake Zurich.
Our results show that eutrophication of lakes in central Switzerland, driven by anthropogenic input of P, has had a strong impact not only on lake water columns, but also on sediments. While the average TOC content is not a good indicator of trophic state (Table 2), changes in TOCreconstructed with depth indicate a significant impact of eutrophication on the sedimentary TOC sink (Fig. 2), with significant increases in TOC burial and accumulation rates over the last century (Fig. 3). Correlations between TOC accumulation rates and water column P concentrations through time (Fig. 3) suggest that lakes with the highest increases in P concentrations also had the highest increases in TOC accumulation (and burial) rates in their sediments. The relationship between P concentrations and TOC accumulation rates was strongest during the period of rapid P concentration increase in the mid 20th century (Fig. 4). However, even though water column P concentrations in most lakes have decreased close to pre-eutrophication levels since the ∼ 1970s, TOC burial and accumulation rates in eutrophic lakes remain significantly higher than before the eutrophication era (Figs. 3 and 4).
Despite the increase in TOC burial, lake sediments are not a static sink for OC. Increases in TOC accumulation and burial increase mineralization by stimulating microbial respiration (Fig. 6). Water-column-derived electron acceptors, such as O2 and nitrate, are depleted at shallower depths in eutrophic lakes compared to lakes with a lower trophic status (Fig. 5, Table 3). Similarly, the contribution of methanogenesis to total respiration is greater (Fig. 6), and significant rates of methanogenesis occur at shallower sediment depths in the eutrophic lakes (Fig. 5, Table 3). These eutrophication-related changes in respiration rates are, however, not reflected in the vertical zonation of microbial respiration pathways with respect to each other. Such shifts in vertical zonation, e.g., from clear separation to strong overlaps between different microbial respiration reactions, might be expected if eutrophication-related increases in TOC deposition had created a shift from electron donor to electron acceptor limitation of microbial respiration reactions. Instead, the depth intervals of denitrification, Mn(IV) reduction, Fe(III) reduction, sulfate reduction, and methanogenesis show strong overlaps, regardless of lake trophic state (Fig. 5, Table 3). Also, although higher TOC input and respiration rates appear to increase cell-specific respiration rates, they do not result in a higher microbial population size (Fig. 6). Instead, the lakes that were least affected by eutrophication (Lake Zurich, Lake Lucerne) have the highest cell counts in sediments deposited during the period of peak eutrophication from 1940 to 2000 (Fig. 7).
In the following sections, we discuss in detail the (i) response of TOC accumulation and burial to eutrophication, (ii) potential effects of eutrophication mitigation measures on TOC burial and accumulation, (iii) the relationship between zonation and rates of dominant respiration processes and trophic state, and (iv) the relationship between total respiration rates, microbial population size, and trophic state.
4.1 Response of TOC burial to eutrophication
The TOC burial rates in this study match estimates from previous studies. The average annual burial rate of 27 g C m−2 yr−1 for sediments deposited from 1960 to 1990 at the deep station of Lake Baldegg is only slightly lower than the estimate of Teranes and Bernasconi (2000) (∼ 30 g C m−2 yr−1) for the same location and time interval. A recent study on Lake Baldegg determined average OC burial rates of 32.3 g C m−2 yr−1 for the top 2–10 cm of stations from water depths of 23, 40, and 64 m (Steinsberger et al., 2017), which are very similar to the 34 g C m−2 yr−1 for the top 2–10 cm of our three stations. The average TOC burial rates from our study (13.8 to 33.3 g C m−2 yr−1 from 1840 to 2016), moreover, fall within the range of 116 lakes from different ecoregions in Minnesota (3 to 184 g C m−2 yr−1 from 1800 to 2010) (Anderson et al., 2013) and from 93 lakes in 11 countries across Europe (Anderson et al., 2014). The latter study estimated that average burial rates increased on average 2.5-fold from 17 g C m−2 yr−1 in the 19th century to 40 g C m−2 yr−1 in 1900–1950 and again 1.5-fold to 60 g C m−2 yr−1 after 1950 (Anderson et al., 2014). By comparison, we estimate a smaller impact on TOC burial in the five lakes studied. Our average ± SD burial rates (in g C m−2 yr−1) of 14±6 (1900–1940), 17±6 (1840–1900), 22±8 (1940–1960), 27±10 (1960–1980), 27±9 (1980–2000), and 29±8 (2000–2016) only correspond to a doubling in average TOC burial rates from the 19th century to after 1960. Incorporating estimates of TOC loss over time does not change these interpretations. According to the Middelburg power model (Middelburg, 1989), the biggest TOC loss occurs in year 1 after deposition (∼16 %), followed by ∼2 % over the following 15 years (in our case 2000–2015), ∼1 % over the following 20 years (1980–2000), and ∼1.5 % over the following 140 years (1840–1980). Our burial rates and those determined in the other above studies were all determined on sediments that were over 1 year old.
While our data indicate that TOC burial and accumulation rates increase with eutrophic conditions, it is important to distinguish between natural background TOC accumulation rates and increases in TOC accumulation rates above these background rates due to eutrophication. For instance, we estimate that in Lake Greifen and Lake Baldegg TOC accumulation rates were already 2–3 times higher than in Lake Lucerne before the period of eutrophication (Fig. 3). Lake Zug and Lake Zurich also had higher average TOC accumulation rates than Lake Lucerne prior to eutrophication. Presumably variables besides eutrophication, e.g., natural OM inputs from the watershed or surrounding riparian vegetation, and physical factors, e.g., sediment focusing, lake area, water depth, and water residence times, contribute to these natural differences between the five lakes. While we do not have data on OM contributions from land or riparian zones, physical factors may indeed (partially) drive the natural differences in TOC accumulation rates between the five lakes (Fig. S8 and Table S1). In line with previous studies (Dean and Gorham, 1998; Heathcote and Downing, 2012), we observe a strong negative linear relationship between lake area and TOC accumulation rate (Fig. S8a; R2=0.99). This may be (partially) due to dilution effects, as lake volume also shows a strong negative linear relationship with TOC accumulation rates (Fig. S8b; R2=0.91). By contrast, water residence time shows no correlation with TOC accumulation rates (Fig. S8c). Other variables that often drive the distribution of TOC accumulation within lakes, e.g., water depth and sediment focusing (Lehman, 1975; Davis and Ford, 1982; Blais and Kalff, 1995), show no clear trends in relation to TOC accumulation rates (Fig. S8d–e and Text S2).
In spite of pre-existing differences in lake-specific TOC accumulation rates, the clear changes in TOC accumulation (and burial) rates over time, which correlate with water column P concentrations and coincide with anoxic events and algal blooms (Figs. 1, 3, and 4), indicate a strong impact of eutrophication. Similar increases in OC burial and accumulation in lake sediments due to eutrophication have been reported elsewhere (Gorham et al., 1974; Dean and Gorham, 1998; Heathcote and Downing, 2012). A combination of variables may drive this eutrophication-related increase in OC burial. First, the increase in primary production due to lake P fertilization promotes water column biomass production and increases biomass deposition to the lake floor. Increased OM loading then stimulates aerobic OM catabolism, which causes water column anoxia, and further promotes OM preservation and burial (Lehmann et al., 2002; Sobek et al., 2009; Katsev and Crowe, 2015).
4.2 Effects of eutrophication mitigation measures on TOC burial
Since the period of peak eutrophication, water column P concentrations have decreased back to pre-eutrophication levels, mainly as a result of wastewater treatment combined with P precipitation systems and removal of phosphate from detergents (Fig. 1, Text S1). This has coincided with significant decreases in TOC accumulation rates in Lake Greifen (24±11 %) and Lake Zug (22±5 %), but not in Lake Baldegg (6±14 %; discussed later in this section). Presumably, the decreases in Lake Greifen and Lake Zug were mainly driven by reduced primary production. Decreased TOC preservation due to increased O2 exposure time was probably less important, since seasonal water column anoxia continued for decades after the decrease in TOC accumulation rates in Lake Greifen and Lake Zug (Figs. 1 and 3; BAFU, 2013; AquaPlus, 2001, 2004a, b).
Despite the observed decreases in TOC accumulations in two of the three eutrophic lakes, our calculated TOC accumulation rates for the period after peak eutrophication have remained well above those during pre-eutrophication times (Fig. 3). Furthermore, the correlation between P concentrations and TOC accumulation rates has become weaker since the decrease in P concentrations (Fig. 4b–d). A potential reason for the reduced coupling between P concentrations and TOC accumulation rates is remobilization of P, which accumulated in sediments during periods of high P inputs, into overlying water (Rippey and Anderson, 1996; Boyle, 2001; Meals et al., 2010; Giles et al., 2016). Remobilization of P from sediments can sustain high primary productivity and lower water quality for years to decades after substantial decreases in P inputs (Lotter, 2001; Giles et al., 2016).
Our data, furthermore, indicate that artificial mixing does not substantially reduce TOC accumulation and burial, and in fact might counteract reductions in TOC accumulation and burial caused by reduced P inputs. In Lake Baldegg, artificial aeration and oxygenation were implemented in 1982/1983 (Stadelmann and Escher, 2002) and have eliminated bottom water anoxia, thereby increasing the O2 exposure time of most detrital OC from hours, during sinking through the water column (Bloesch and Burns, 1980; Lehmann et al., 2002), by an additional 3–4 months within oxic sediment (notes: (1) O2 exposure time in sediment was estimated by dividing O2 penetration depth by sedimentation rate; (2) there was no strong bioturbation in surface sediment, as chironomid larvae were absent and deposit-feeding oligochaetes were mainly observed at depths > 5 cm b.l.f.). Nonetheless, TOC accumulation and burial rates have not decreased significantly since then, confirming initial observations made by Gächter and Wehrli (1998) after 10 years of artificial aeration. Given that Lake Greifen and Lake Zug, which were not artificially mixed, had significant reductions in TOC accumulation rates, we speculate that water column mixing may even indirectly promote high TOC burial rates in Lake Baldegg. Accordingly, mixing creates an “artificial upwelling” that efficiently transports remobilized P, which has diffused from sediments into bottom water, to the photic zone. In the photic zone, this P is turned over rapidly and sustains high growth rates of photosynthetic organisms. High rates of primary production then sustain the continually high rates of TOC accumulation and burial in lake sediments. If this interpretation is correct, then we would predict TOC burial and accumulation rates in Lake Greifen to remain stable or increase since the beginning of artificial mixing in 2009. Comparing TOC accumulation rate data from 2000 to 2009 to data from 2010 to 2014 suggests this could be the case, as TOC accumulation rates have increased, albeit variably, at all three stations since then by on average 6±5 %.
4.3 Zonation and rates of dominant respiration processes
The vertical distribution of dominant respiration reactions in the five lakes generally matches what would be expected based on differences in total respiration rates. Electron acceptors that diffuse from bottom water into sediment (O2, nitrate, sulfate) are depleted at shallower depths in eutrophic than in the mesotrophic and oligotrophic lakes due to higher respiration rates fueled by higher TOC input. Less reactive solid-phase electron acceptors (Mn(IV), Fe(III)), and electron acceptors that are produced at high rates within sediments (CO2), extend deeper into cores and even throughout cores in the case of Fe(III) and CO2. While Mn reduction rates appear to be mainly controlled by Mn supply, which is driven by geochemical focusing (Schaller and Wehrli, 1996; Naeher et al., 2013), both Fe reduction and methanogenesis rates increase with trophic state, most likely as a result of increased electron donor and acceptor supply from the enhanced breakdown of OM.
In addition to this general effect of eutrophication on microbial respiration rates, a clear vertical separation of respiration reactions involving different electron acceptors is absent, independent of trophic state (Fig. 5). Possible reasons are that electron donor concentrations are not under thermodynamic control (Hoehler et al., 1998) and that free energy yields of all respiration reactions are above previously observed minimum thresholds per reaction (10 to 20 kJ mol−1; Hoehler et al., 2001). This could potentially indicate that respiration reactions in sediments were not in steady state at the time of sampling, e.g., due to temperature changes, redox fluctuations, mortality, and/or bioturbation (Hoehler et al., 1999; Lever and Teske, 2015; Chen et al., 2017). Chemical microenvironments with divergent redox conditions may also enable different respiration reactions to occur physically separated but in close proximity to each other (Anderson and Meadows, 1978; Canfield, 1989; Oda et al., 2008). “Non-competitive” substrates, such as the C1 compounds methanol, dimethylsulfide, and trimethylamine, which are consumed by some methanogens and not by most sulfate reducers and which enable coexistence of these methanogens with sulfate reducers in sulfate-reducing marine sediment (Oremland and Polcin, 1982; Xiao et al., 2017), are also possible. However, previous research on lake sediments indicates that non-competitive substrates only support a small fraction of total methanogenesis (Conrad et al., 2011; Liu et al., 2017). Moreover, research on the five lakes studied here suggests dominance of H2∕CO2-consuming Methanomicrobiales and that methanogenesis from H2∕CO2 is thermodynamically not favorable in most methanogenic horizons (Mark Alexander Lever and Anja Michel, unpublished data). As a working hypothesis, we thus propose that microenvironments with divergent redox conditions explain the strong spatial overlaps in respiration reactions.
4.4 Respiration rates and total microbial population size
Total respiration rates (RRtotal) decrease with sediment depth at all stations, indicating an increase in the OM degradation state over time, as microorganisms selectively mineralize the more reactive OM pools. The higher RRtotal in eutrophic compared to mesotrophic and oligotrophic lakes, even in buried intervals that were deposited around the same time, suggests that the eutrophication-related stimulation of RRtotal persists over many decades, possibly due to the higher amounts of TOC (both reactive and non-reactive) that were initially deposited. Despite this continued OM mineralization, only a small fraction of originally accumulated TOC is mineralized in these older layers (also see the final paragraph of Sect. 4.1).
Overall cell numbers in the range of 108 to 1010 cells cm−3 (Figs. 6 and S7) are in a similar range to other lake sediments (Bostrom et al., 1989; Haglund et al., 2003; Schwarz et al., 2007). Surprisingly, despite the higher TOC burial and RRtotal, the three eutrophic lakes have lower average cell numbers than Lake Zurich and Lake Lucerne (Figs. 6 and S7). Possibly, the shallower depletion of O2, nitrate, sulfate, and Mn(IV) in eutrophic lakes causes a larger fraction of respiring microorganisms to depend on energetically less favorable methanogenesis. Thus, cells in eutrophic lake sediment would have less energy available per cell despite having more available electron donors and higher RRcell. Though possible, this scenario is unlikely given that the vast majority of anaerobic microorganisms in sediment are probably involved in fermentation reactions (Lever, 2013) and that methanogens account for at most a few percent of the microbial populations in cores from this study (Mark Alexander Lever and Anja Michel, unpublished data). Alternative explanations for the lower cell counts in eutrophic lakes might be higher toxic contaminant loads (Pritchard and Bourquin, 1984), higher viral mortality (Fischer and Velimirov, 2002), or enhanced predation by oligochaete worms. The latter were highly abundant to sediment depths of >20 cm in the eutrophic lakes (Annika Fiskal et al., unpublished data).
Based on sedimentary records from five lakes differing in eutrophication history over the last ∼180 years, we demonstrate clear links between human activity on land, water column eutrophication, and OC burial in lake sediment. By combining high-resolution historic data on water column P concentrations with reconstructed past TOC accumulation rates, we show that anthropogenic input of P to lake ecosystems, mainly by increasing water column primary production, is a key driver of TOC input and TOC burial in lake sediment. This relationship between P concentrations in the water and TOC accumulation and burial rates in sediments was strongest during the period leading to the eutrophication peak in the 1970s. Since then, despite reductions in P concentrations by 50 %–90 % across all five lakes, TOC accumulation rates have decreased by ∼ 20 %–25 % in two of the eutrophic lakes (Lake Greifen, Lake Zug) and not significantly in the eutrophic Lake Baldegg, the mesotrophic Lake Zurich, and the oligotrophic Lake Lucerne. This relatively small or absent decrease in TOC accumulation rates is potentially due to the efficient remobilization of sedimentary P by microbial diagenesis and water column mixing. The fact that the highly eutrophic Lake Baldegg, which has been artificially mixed and aerated for >35 years to mitigate water column anoxia, shows no significant decrease in TOC accumulation rates or TOC burial, indicates that water column mixing and aeration is not effective at reducing P release from sediment or at controlling water column primary productivity, but might even have the opposite effect by rapidly transferring this P to the photic zone.
In addition to documenting effects on TOC accumulation and burial, we investigate effects of eutrophication on microbial TOC mineralization processes and microbial population size. We show that eutrophic lakes have higher respiration rates (total and cell-specific) and a higher contribution of methanogenesis to total respiration than lakes with a lower trophic status. However, trophic state does not affect the zonation of microbial respiration reactions, e.g., by resulting in stronger (or weaker) overlaps in distributions of competing respiration reactions. Instead, regardless of trophic state, distributions of dominant respiration reactions overlap strongly. This is evidenced by the fact that low-energy reactions, such as methanogenesis, occur well into layers with more energetically favorable denitrification, manganese reduction, and even aerobic respiration. Despite the higher respiration rates in the eutrophic lakes, we observe equal or even lower cell abundances in eutrophic compared to mesotrophic and oligotrophic lake sediment. This indicates that, for as yet unknown reasons, electron donor supply and/or microbial energy availability are decoupled from microbial biomass in sediments of these five lakes.
The data used in this paper will be made available on PANGAEA after the paper is published.
The supplement related to this article is available online at: https://doi.org/10.5194/bg-16-3725-2019-supplement.
AF, LD, XH, AM, PE, LL, RZ, ND, and MAL helped with sample collection and/or measurements. AF, ND, MHS, SB, MS, and MAL substantially contributed to the interpretation of data. AF and MAL wrote the manuscript. MAL designed the study and acquired the funding for the project. All the authors commented on the manuscript and approved the final version of the manuscript.
The authors declare that they have no conflict of interest.
We thank Madalina Jaggi for sample preparation and measurements. Special thanks to Adrian Gilli (ETHZ) and all the technicians, especially Irene Brunner, Alfred Lück, and Alois Zwyssig from EAWAG, for great help with sampling and downstream analysis. Many thanks to Iso Christl, Rachele Ossola, Joep van Dijk, and Andreas Brand for consulting regarding measurement and analyses. We thank Meret Aeppli and Nicolas Walpen for the introduction to electrochemical analyses. We thank Joachim Hürlimann for kindly providing reconstructed phosphorus data from Lake Greifen and Lake Zug and Andre Lotter for providing reconstructed phosphorus data for Lake Baldegg and Lake Lucerne.
This research has been supported by the Swiss National Science Foundation (grant no. project 205321_163371).
This paper was edited by Gwenaël Abril and reviewed by two anonymous referees.
Anderson, J. G. and Meadows, P. S.: Microenvironments in Marine-Sediments, P. Roy. Soc. Edinb. B, 76, 1–16, 1978.
Anderson, N. J., Dietz, R. D., and Engstrom, D. R.: Land-use change, not climate, controls organic carbon burial in lakes, P. Roy. Soc. B-Biol. Sci., 280, 20131278, https://doi.org/10.1098/rspb.2013.1278, 2013.
Anderson, N. J., Bennion, H., and Lotter, A. F.: Lake eutrophication and its implications for organic carbon sequestration in Europe, Glob. Change Biol., 20, 2741–2751, 2014.
AquaPlus: Entwicklung des Gesamtphosphors im Zugersee anhand der im Sediment eingelagerten Kieselalgen, Bericht zuhanden des Amtes für Umweltschutz des Kantons Zug, 48 pp., 2001.
AquaPlus: Untersuchung der Fliessgewässer und Seen im Kanton Zug und im Einzugsgebiet des Zugersees, Bericht zuhanden des Amtes für Umweltschutz des Kantons Zug, 86 pp., 2004a.
AquaPlus: Entwicklung des Gesamtphosphors im Greifensee anhand der im Sediment eingelagerten Kieselalgen, Bericht zuhanden des Amtes für Abfall, Wasser, Energie und Luft des Kantons Zürich, 2004b.
BAFU: Einzugsgebietsgliederung Schweiz EZGG-CH, Bundesamt für Umwelt, Bern, available at: http://www.bafu.admin.ch/hydrologie/01835/11452/index.html (last access: 18 March 2019), 2013.
Bastviken, D., Cole, J., Pace, M., and Tranvik, L.: Methane emissions from lakes: Dependence of lake characteristics, two regional assessments, and a global estimate, Global Biogeochem. Cy., 18, Gb4009, https://doi.org/10.1029/2004gb002238, 2004.
Battin, T. J., Luyssaert, S., Kaplan, L. A., Aufdenkampe, A. K., Richter, A., and Tranvik, L. J.: The boundless carbon cycle, Nat. Geosci., 2, 598–600, 2009.
Binford, M. W.: Calculation and uncertainty analysis of 210Pb dates for PIRLA project lake sediment cores, J. Paleolimnol., 3, 253–267, 1990.
Blais, J. M. and Kalff, J.: The Influence of Lake Morphometry on Sediment Focusing, Limnol. Oceanogr., 40, 582–588, 1995.
Bloesch, J. and Burns, N. M.: A Critical-Review of Sedimentation Trap Technique, Schweiz. Z. Hydrol., 42, 15–55, 1980.
Bostrom, B., Pettersson, A. K., and Ahlgren, I.: Seasonal Dynamics of a Cyanobacteria-Dominated Microbial Community in Surface Sediments of a Shallow, Eutrophic Lake, Aquat. Sci., 51, 153–178, 1989.
Boyle, J.: Redox remobilization and the heavy metal record in lake sediments: a modelling approach, J. Paleolimnol., 26, 423–431, 2001.
Braunschweig, J., Bosch, J., Heister, K., Kuebeck, C., and Meckenstock, R. U.: Reevaluation of colorimetric iron determination methods commonly used in geomicrobiology, J. Microbiol. Meth., 89, 41–48, 2012.
Breitburg, D.: Effects of hypoxia, and the balance between hypoxia and enrichment, on coastal fishes and fisheries, Estuaries, 25, 767–781, 2002.
Buergi, H. R. and Stadelmann, P.: Change of phytoplankton diversity during long-term restoration of Lake Baldegg (Switzerland), Int. Ver. Theor. Angew., 27, 574–581, 2000.
Burdige, D. J.: Preservation of organic matter in marine sediments: Controls, mechanisms, and an imbalance in sediment organic carbon budgets?, Chem. Rev., 107, 467–485, 2007.
Canfield, D. E.: Reactive Iron in Marine-Sediments, Geochim. Cosmochim. Ac., 53, 619–632, 1989.
Canfield, D. E., Kristensen, E., and Thamdrup, B.: Aquatic Geomicrobiology, Adv. Mar. Biol., 48, 1–640, 2005.
Canfield, D. E. and Thamdrup, B.: Towards a consistent classification scheme for geochemical environments, or, why we wish the term “suboxic” would go away, Geobiology, 7, 385–392, 2009.
Capone, D. G. and Kiene, R. P.: Comparison of Microbial Dynamics in Marine and Fresh-Water Sediments – Contrasts in Anaerobic Carbon Catabolism, Limnol. Oceanogr., 33, 725–749, 1988.
Chen, X. H., Andersen, T. J., Morono, Y., Inagaki, F., Jorgensen, B. B., and Lever, M. A.: Bioturbation as a key driver behind the dominance of Bacteria over Archaea in near-surface sediment, Sci. Rep.-UK, 7, 2400, https://doi.org/10.1038/s41598-017-02295-x, 2017.
Cline, J. D.: Spectrophotometric Determination of Hydrogen Sulfide in Natural Waters, Limnol. Oceanogr., 14, 454, https://doi.org/10.4319/lo.1969.14.3.0454, 1969.
Cole, J. J., Prairie, Y. T., Caraco, N. F., McDowell, W. H., Tranvik, L. J., Striegl, R. G., Duarte, C. M., Kortelainen, P., Downing, J. A., Middelburg, J. J., and Melack, J.: Plumbing the global carbon cycle: Integrating inland waters into the terrestrial carbon budget, Ecosystems, 10, 171–184, 2007.
Conley, D. J., Paerl, H. W., Howarth, R. W., Boesch, D. F., Seitzinger, S. P., Havens, K. E., Lancelot, C., and Likens, G. E.: ECOLOGY Controlling Eutrophication: Nitrogen and Phosphorus, Science, 323, 1014–1015, 2009.
Conrad, R., Noll, M., Claus, P., Klose, M., Bastos, W. R., and Enrich-Prast, A.: Stable carbon isotope discrimination and microbiology of methane formation in tropical anoxic lake sediments, Biogeosciences, 8, 795–814, https://doi.org/10.5194/bg-8-795-2011, 2011.
Correll, D. L.: Phosphorus: A rate limiting nutrient in surface waters, Poultry Sci., 78, 674–682, 1999.
Cubasch, U., Wuebbles, D., Chen, D. L., Facchini, M. C., Frame, D., Mahowald, N., Winther, J. G., Brauer, A., Gates, L., Janssen, E., Kaspar, F., Korper, J., Masson-Delmotte, V., Meinshausen, M., Menne, M., Richter, C., Schulz, M., Schulzweida, U., Stevens, B., Sutton, R., Trenberth, K., Turkes, M., and Ward, D. S.: Climate Change 2013 The Physical Science Basis Working Group I Contribution to the Fifth Assessment Report of the Intergovernmental Panel on Climate Change Introduction, Climate Change 2013: The Physical Science Basis, 2014, 119–158, 2014.
Davis, M. B. and Ford, M. S. J.: Sediment Focusing in Mirror Lake, New-Hampshire, Limnol. Oceanogr., 27, 137–150, 1982.
Dean, W. E. and Gorham, E.: Magnitude and significance of carbon burial in lakes, reservoirs, and peatlands, Geology, 26, 535–538, 1998.
Deng, L., Fiskal, A., Han, X., Dubois, N., Bernasconi, S. M., and Lever, M. A.: Improving the accuracy of flow cytometric quantification of microbial populations in sediments: importance of cell staining procedures, Front Microbiol., 10, 720, https://doi.org/10.3389/fmicb.2019.00720, 2019.
Drake, H. L., Kusel, K., and Matthies, C.: Acetogenic Prokaryotes, Prokaryotes: A Handbook on the Biology of Bacteria, Vol. 2, 3rd Edn., 354–420, https://doi.org/10.1007/0-387-30742-7_13, 2006.
Einsele, G., Yan, J. P., and Hinderer, M.: Atmospheric carbon burial in modern lake basins and its significance for the global carbon budget, Global Planet. Change, 30, 167–195, 2001.
Fischer, U. R. and Velimirov, B.: High control of bacterial production by viruses in a eutrophic oxbow lake, Aquat. Microb. Ecol., 27, 1–12, 2002.
Froelich, P. N., Klinkhammer, G. P., Bender, M. L., Luedtke, N. A., Heath, G. R., Cullen, D., Dauphin, P., Hammond, D., Hartman, B., and Maynard, V.: Early Oxidation of Organic-Matter in Pelagic Sediments of the Eastern Equatorial Atlantic – Suboxic Diagenesis, Geochim. Cosmochim. Ac., 43, 1075–1090, 1979.
Gachter, R. and Muller, B.: Why the phosphorus retention of lakes does not necessarily depend on the oxygen supply to their sediment surface, Limnol. Oceanogr., 48, 929–933, 2003.
Gächter, R. and Wehrli, B.: Ten years of artificial mixing and oxygenation: No effect on the internal phosphorus loading of two eutrophic lakes, Environ. Sci. Technol., 32, 3659–3665, https://doi.org/10.1021/es980418l, 1998.
Giles, C. D., Isles, P. D. F., Manley, T., Xu, Y. Y., Druschel, G. K., and Schroth, A. W.: The mobility of phosphorus, iron, and manganese through the sediment-water continuum of a shallow eutrophic freshwater lake under stratified and mixed water-column conditions, Biogeochemistry, 127, 15–34, 2016.
Gontikaki, E., Polymenakou, P. N., Thornton, B., Narayanaswamy, B. E., Black, K., Tselepides, A., and Witte, U.: Microbial Response to Organic Matter Enrichment in the Oligotrophic Levantine Basin (Eastern Mediterranean), Geomicrobiol. J., 29, 648–655, 2012.
Gorham, E., Lund, J. W. G., Sanger, J. E., and Dean, W. E.: Some Relationships between Algal Standing Crop, Water Chemistry, and Sediment Chemistry in English Lakes, Limnol. Oceanogr., 19, 601–617, 1974.
Gruca-Rokosz, R.: Diffusive Fluxes of CH4 and CO2 at the Sediment-Overlying Water Interface in Reservoir Ecosystems, J. Ecol. Eng., 19, 158–164, 2018.
Haglund, A. L., Lantz, P., Tornblom, E., and Tranvik, L.: Depth distribution of active bacteria and bacterial activity in lake sediment, FEMS Microbiol. Ecol., 46, 31–38, 2003.
Heathcote, A. J. and Downing, J. A.: Impacts of Eutrophication on Carbon Burial in Freshwater Lakes in an Intensively Agricultural Landscape, Ecosystems, 15, 60–70, 2012.
Hebting, Y., Schaeffer, P., Behrens, A., Adam, P., Schmitt, G., Schneckenburger, P., Bernasconi, S. M., and Albrecht, P.: Biomarker evidence for a major preservation pathway of sedimentary organic carbon, Science, 312, 1627–1631, 2006.
Hedges, J. I., Eglinton, G., Hatcher, P. G., Kirchman, D. L., Arnosti, C., Derenne, S., Evershed, R. P., Kogel-Knabner, I., de Leeuw, J. W., Littke, R., Michaelis, W., and Rullkotter, J.: The molecularly-uncharacterized component of nonliving organic matter in natural environments, Org. Geochem., 31, 945–958, 2000.
Hoehler, T. M., Alperin, M. J., Albert, D. B., and Martens, C. S.: Thermodynamic control on hydrogen concentrations in anoxic sediments, Geochim. Cosmochim. Ac., 62, 1745–1756, 1998.
Hoehler, T. M., Albert, D. B., Alperin, M. J., and Martens, C. S.: Acetogenesis from CO2 in an anoxic marine sediment, Limnol. Oceanogr., 44, 662–667, 1999.
Hoehler, T. M., Alperin, M. J., Albert, D. B., and Martens, C. S.: Apparent minimum free energy requirements for methanogenic Archaea and sulfate-reducing bacteria in an anoxic marine sediment, FEMS Microbiol. Ecol., 38, 33–41, 2001.
Holgerson, M. A. and Raymond, P. A.: Large contribution to inland water CO2 and CH4 emissions from very small ponds, Nat. Geosci., 9, 222–226, 2016.
Hyun, J.-H., Kim, S.-H., Mok, J.-S., Cho, H., Lee, T., Vandieken, V., and Thamdrup, B.: Manganese and iron reduction dominate organic carbon oxidation in surface sediments of the deep Ulleung Basin, East Sea, Biogeosciences, 14, 941–958, https://doi.org/10.5194/bg-14-941-2017, 2017.
Jørgensen, B. B. and Kasten, S.: Sulfur cycling and methane oxidation, in: Marine geochemistry, Springer, Berlin, Heidelberg, 271–309, 2006.
Katsev, S. and Crowe, S. A.: Organic carbon burial efficiencies in sediments: The power law of mineralization revisited, Geology, 43, 607–610, 2015.
Kluepfel, L., Keiluweit, M., Kleber, M., and Sander, M.: Redox Properties of Plant Biomass-Derived Black Carbon (Biochar), Environ. Sci. Technol., 48, 5601–5611, 2014.
Klupfel, L., Piepenbrock, A., Kappler, A., and Sander, M.: Humic substances as fully regenerable electron acceptors in recurrently anoxic environments, Nat. Geosci., 7, 195–200, 2014.
Kristensen, E.: Organic matter diagenesis at the oxic/anoxic interface in coastal marine sediments, with emphasis on the role of burrowing animals, Hydrobiologia, 426, 1–24, 2000.
Kristensen, E., Penha-Lopes, G., Delefosse, M., Valdemarsen, T., Quintana, C. O., and Banta, G. T.: What is bioturbation? The need for a precise definition for fauna in aquatic sciences, Mar. Ecol.-Prog. Ser., 446, 285–302, 2012.
Lalonde, K., Mucci, A., Ouellet, A., and Gelinas, Y.: Preservation of organic matter in sediments promoted by iron, Nature, 483, 198–200, 2012.
Lehman, J. T.: Reconstructing Rate of Accumulation of Lake Sediment – Effect of Sediment Focusing, Quaternary Res., 5, 541–550, 1975.
Lehmann, M. F., Bernasconi, S. M., Barbieri, A., and McKenzie, J. A.: Preservation of organic matter and alteration of its carbon and nitrogen isotope composition during simulated and in situ early sedimentary diagenesis, Geochim. Cosmochim. Ac., 66, 3573–3584, 2002.
Lever, M. A.: Functional gene surveys from ocean drilling expeditions a review and perspective, FEMS Microbiol. Ecol., 84, 1–23, 2013.
Lever, M. A. and Teske, A. P.: Diversity of Methane-Cycling Archaea in Hydrothermal Sediment Investigated by General and Group-Specific PCR Primers, Appl. Environ. Microb., 81, 1426–1441, 2015.
Liechti, P.: Der Zustand der Seen in der Schweiz, Bundesamt für Umwelt, Bern, 1994.
Liu, Y. Q., Conrad, R., Yao, T. D., Gleixner, G., and Claus, P.: Change of methane production pathway with sediment depth in a lake on the Tibetan plateau, Palaeogeogr. Palaeocl., 474, 279–286, 2017.
Lotter, A.: The effect of eutrophication on diatom diversity: examples from six Swiss lakes, Lubrecht & Cramer Ltd, ISBN-10 390414426X, 2001.
Lotter, A. F.: The recent eutrophication of Baldeggersee (Switzerland) as assessed by fossil diatom assemblages, Holocene, 8, 395–405, 1998.
Lovley, D. R. and Goodwin, S.: Hydrogen Concentrations as an Indicator of the Predominant Terminal Electron-Accepting Reactions in Aquatic Sediments, Geochim. Cosmochim. Ac., 52, 2993–3003, 1988.
Lovley, D. R. and Phillips, E. J. P.: Rapid Assay for Microbially Reducible Ferric Iron in Aquatic Sediments, Appl. Environ. Microb., 53, 1536–1540, 1987.
Maerki, M., Muller, B., Dinkel, C., and Wehrli, B.: Mineralization pathways in lake sediments with different oxygen and organic carbon supply, Limnol. Oceanogr., 54, 428–438, 2009.
Maerki, M., Wehrli, B., Dinkel, C., and Muller, B.: The influence of tortuosity on molecular diffusion in freshwater sediments of high porosity, Geochim. Cosmochim. Ac., 68, 1519–1528, 2004.
McGlathery, K. J.: Macroalgal blooms contribute to the decline of seagrass in nutrient-enriched coastal waters, J. Phycol., 37, 453–456, 2001.
Meals, D. W., Dressing, S. A., and Davenport, T. E.: Lag Time in Water Quality Response to Best Management Practices: A Review, J. Environ. Qual., 39, 85–96, 2010.
Mendonca, R., Muller, R. A., Clow, D., Verpoorter, C., Raymond, P., Tranvik, L. J., and Sobek, S.: Organic carbon burial in global lakes and reservoirs, Nat. Commun., 8, 1694, https://doi.org/10.1038/s41467-017-01789-6, 2017.
Meysman, F. J. R., Middelburg, J. J., and Heip, C. H. R.: Bioturbation: a fresh look at Darwin's last idea, Trends Ecol. Evol., 21, 688–695, 2006.
Middelburg, J. J.: Reviews and syntheses: to the bottom of carbon processing at the seafloor, Biogeosciences, 15, 413–427, https://doi.org/10.5194/bg-15-413-2018, 2018.
Moosmann, L., Gachter, R., Muller, B., and Wuest, A.: Is phosphorus retention in autochthonous lake sediments controlled by oxygen or phosphorus?, Limnol. Oceanogr., 51, 763–771, 2006.
Müller, G., Ehwald, F., and Hamann, A.: Langzeituntersuchungen über das Verhalten von Phosphor, Stickstoff und Bor bei der mechanisch-biologischen Abwasserreinigung am Beispiel der kommunalen Kläranlagen Bammental und Wiesloch (Rhein-Neckar-Kreis), Univ. Heidelberg, Heidelberg, 1990.
Naeher, S., Gilli, A., North, R. P., Hamann, Y., and Schubert, C. J.: Tracing bottom water oxygenation with sedimentary Mn∕Fe ratios in Lake Zurich, Switzerland, Chem. Geol., 352, 125–133, 2013.
Nedwell, D. B.: The Input and Mineralization of Organic-Carbon in Anaerobic Aquatic Sediments, Adv. Microb. Ecol., 7, 93–131, 1984.
Oda, Y., Larimer, F. W., Chain, P. S. G., Malfatti, S., Shin, M. V., Vergez, L. M., Hauser, L., Land, M. L., Braatsch, S., Beatty, J. T., Pelletier, D. A., Schaefer, A. L., and Harwood, C. S.: Multiple genome sequences reveal adaptations of a phototrophic bacterium to sediment microenvironments, P. Natl. Acad. Sci. USA, 105, 18543–18548, 2008.
Oremland, R. S. and Polcin, S.: Methanogenesis and Sulfate Reduction – Competitive and Noncompetitive Substrates in Estuarine Sediments, Appl. Environ. Microb., 44, 1270–1276, 1982.
Pritchard, P. H. and Bourquin, A. W.: The Use of Microcosms for Evaluation of Interactions between Pollutants and Microorganisms, Adv. Microb. Ecol., 7, 133–215, 1984.
Raymond, P. A., Hartmann, J., Lauerwald, R., Sobek, S., McDonald, C., Hoover, M., Butman, D., Striegl, R., Mayorga, E., Humborg, C., Kortelainen, P., Durr, H., Meybeck, M., Ciais, P., and Guth, P.: Global carbon dioxide emissions from inland waters, Nature, 503, 355–359, 2013.
Rippey, B. and Anderson, N. J.: Reconstruction of lake phosphorus loading and dynamics using the sedimentary record, Environ. Sci. Technol., 30, 1786–1788, 1996.
Sander, M., Hofstetter, T. B., and Gorski, C. A.: Electrochemical Analyses of Redox-Active Iron Minerals: A Review of Nonmediated and Mediated Approaches, Environ. Sci. Technol., 49, 5862–5878, 2015.
Schaller, T. and Wehrli, B.: Geochemical-Focusing of Manganese in Lake Sediments – An Indicator of Deep-Water Oxygen Conditions, Aquat. Geochem., 2, 359–378, 1996.
Schindler, D. W.: Recent advances in the understanding and management of eutrophication, Limnol. Oceanogr., 51, 356–363, 2006.
Schink, B.: Energetics of syntrophic cooperation in methanogenic degradation, Microbiol. Mol. Biol. R., 61, 262–280, 1997.
Schwarz, J. I. K., Eckert, W., and Conrad, R.: Community structure of Archaea and Bacteria in a profundal lake sediment Lake Kinneret (Israel), Syst. Appl. Microbiol., 30, 239–254, 2007.
Sobek, S., Durisch-Kaiser, E., Zurbrugg, R., Wongfun, N., Wessels, M., Pasche, N., and Wehrli, B.: Organic carbon burial efficiency in lake sediments controlled by oxygen exposure time and sediment source, Limnol. Oceanogr., 54, 2243–2254, 2009.
Stadelmann, P. and Escher, M.: 20 Jahre Sanierung und Ueberwachung des Baldeggersees, Naturforschende Gesellschaft, Luzern, 2002.
Steinsberger, T., Schmid, M., Wüest, A., Schwefel, R., Wehrli, B., and Müller, B.: Organic carbon mass accumulation rate regulates the flux of reduced substances from the sediments of deep lakes, Biogeosciences, 14, 3275–3285, https://doi.org/10.5194/bg-14-3275-2017, 2017.
Stookey, L. L.: Ferrozine – a New Spectrophotometric Reagent for Iron, Anal. Chem., 42, 779–781, 1970.
Teranes, J. L. and Bernasconi, S. M.: The record of nitrate utilization and productivity limitation provided by delta N-15 values in lake organic matter – A study of sediment trap and core sediments from Baldeggersee, Switzerland, Limnol. Oceanogr., 45, 801–813, 2000.
Teranes, J. L., McKenzie, J. A., Bernasconi, S. M., Lotter, A. F., and Sturm, M.: A study of oxygen isotopic fractionation during bio-induced calcite precipitation in eutrophic Baldeggersee, Switzerland, Geochim. Cosmochim. Ac., 63, 1981–1989, 1999a.
Teranes, J. L., McKenzie, J. A., and Lotter, A. F.: Stable isotope response to lake eutrophication: Calibration of a high-resolution lacustrine sequence from Baldeggersee, Switzerland, Limnol. Oceanogr., 44, 320–333, 1999b.
Valiela, I., McClelland, J., Hauxwell, J., Behr, P. J., Hersh, D., and Foreman, K.: Macroalgal blooms in shallow estuaries: Controls and ecophysiological and ecosystem consequences, Limnol. Oceanogr., 42, 1105–1118, 1997.
Werne, J. P., Hollander, D. J., Behrens, A., Schaeffer, P., Albrecht, P., and Damste, J. S. S.: Timing of early diagenetic sulfurization of organic matter: A precursor-product relationship in Holocene sediments of the anoxic Cariaco Basin, Venezuela, Geochim. Cosmochim. Ac., 64, 1741–1751, 2000.
Werne, J. P., Lyons, T. W., Hollander, D. J., Schouten, S., Hopmans, E. C., and Damste, J. S. S.: Investigating pathways of diagenetic organic matter sulfurization using compound-specific sulfur isotope analysis, Geochim. Cosmochim. Ac., 72, 3489–3502, 2008.
Witherspoon, P. A. and Saraf, D. N.: Diffusion of Methane Ethane Propane and N-Butane in Water from 25 to 43 Degrees, J. Phys. Chem.-US, 69, 3752–3755, 1965.
Xiao, K. Q., Beulig, F., Kjeldsen, K. U., Jorgensen, B. B., and Risgaard-Petersen, N.: Concurrent Methane Production and Oxidation in Surface Sediment from Aarhus Bay, Denmark, Front Microbiol., 8, 1198, 2017.
Zeebe, R. E.: On the molecular diffusion coefficients of dissolved CO2, , and and their dependence on isotopic mass, Geochim. Cosmochim. Ac., 75, 2483–2498, 2011.