the Creative Commons Attribution 4.0 License.
the Creative Commons Attribution 4.0 License.
 | 07 Oct 2019
Variations in dissolved greenhouse gases (CO2, CH4, N2O) in the Congo River network overwhelmingly driven by fluvial-wetland connectivity
Alberto V. Borges
François Darchambeau
Thibault Lambert
Cédric Morana
George H. Allen
Ernest Tambwe
Alfred Toengaho Sembaito
Taylor Mambo
José Nlandu Wabakhangazi
Jean-Pierre Descy
Cristian R. Teodoru
Steven Bouillon
We carried out 10 field expeditions between 2010 and 2015 in the lowland part of the Congo River network in the eastern part of the basin (Democratic Republic of the Congo), to describe the spatial variations in fluvial dissolved carbon dioxide (CO2), methane (CH4) and nitrous oxide (N2O) concentrations. We investigate the possible drivers of the spatial variations in dissolved CO2, CH4 and N2O concentrations by analyzing covariations with several other biogeochemical variables, aquatic metabolic processes (primary production and respiration), catchment characteristics (land cover) and wetland spatial distributions. We test the hypothesis that spatial patterns of CO2, CH4 and N2O are partly due to the connectivity with wetlands, in particular with a giant wetland of flooded forest in the core of the Congo basin, the “Cuvette Centrale Congolaise” (CCC). Two transects of 1650 km were carried out from the city of Kisangani to the city of Kinshasa, along the longest possible navigable section of the river and corresponding to 41 % of the total length of the main stem. Additionally, three time series of CH4 and N2O were obtained at fixed points in the main stem of the middle Congo (2013–2018, biweekly sampling), in the main stem of the lower Kasaï (2015–2017, monthly sampling) and in the main stem of the middle Oubangui (2010–2012, biweekly sampling). The variations in dissolved N2O concentrations were modest, with values oscillating around the concentration corresponding to saturation with the atmosphere, with N2O saturation level (%N2O, where atmospheric equilibrium corresponds to 100 %) ranging between 0 % and 561 % (average 142 %). The relatively narrow range of %N2O variations was consistent with low (2.3±1.3 µmol L−1) and (5.6±5.1 µmol L−1) levels in these near pristine rivers and streams, with low agriculture pressure on the catchment (croplands correspond to 0.1 % of catchment land cover of sampled rivers), dominated by forests (∼70 % of land cover). The covariations in %N2O, , and dissolved oxygen saturation level (%O2) indicate N2O removal by soil or sedimentary denitrification in low O2, high and low environments (typically small and organic matter rich streams) and N2O production by nitrification in high O2, low and high (typical of larger rivers that are poor in organic matter). Surface waters were very strongly oversaturated in CO2 and CH4 with respect to atmospheric equilibrium, with values of the partial pressure of CO2 (pCO2) ranging between 1087 and 22 899 ppm (equilibrium ∼400 ppm) and dissolved CH4 concentrations ranging between 22 and 71 428 nmol L−1 (equilibrium ∼2 nmol L−1). Spatial variations were overwhelmingly more important than seasonal variations for pCO2, CH4 and %N2O as well as day–night variations for pCO2. The wide range of pCO2 and CH4 variations was consistent with the equally wide range of %O2 (0.3 %–122.8 %) and of dissolved organic carbon (DOC) (1.8–67.8 mg L−1), indicative of generation of these two greenhouse gases from intense processing of organic matter either in “terra firme” soils, wetlands or in-stream. However, the emission rate of CO2 to the atmosphere from riverine surface waters was on average about 10 times higher than the flux of CO2 produced by aquatic net heterotrophy (as evaluated from measurements of pelagic respiration and primary production). This indicates that the CO2 emissions from the river network were sustained by lateral inputs of CO2 (either from terra firme or from wetlands). The pCO2 and CH4 values decreased and %O2 increased with increasing Strahler order, showing that stream size explains part of the spatial variability of these quantities. In addition, several lines of evidence indicate that lateral inputs of carbon from wetlands (flooded forest and aquatic macrophytes) were of paramount importance in sustaining high CO2 and CH4 concentrations in the Congo river network, as well as driving spatial variations: the rivers draining the CCC were characterized by significantly higher pCO2 and CH4 and significantly lower %O2 and %N2O values than those not draining the CCC; pCO2 and %O2 values were correlated to the coverage of flooded forest on the catchment. The flux of greenhouse gases (GHGs) between rivers and the atmosphere averaged 2469 mmol m−2 d−1 for CO2 (range 86 and 7110 mmol m−2 d−1), 12 553 µmol m−2 d−1 for CH4 (range 65 and 597 260 µmol m−2 d−1) and 22 µmol m−2 d−1 for N2O (range −52 and 319 µmol m−2 d−1). The estimate of integrated CO2 emission from the Congo River network (251±46 TgC (1012 gC) yr−1), corresponding to nearly half the CO2 emissions from tropical oceans globally (565 TgC yr−1) and was nearly 2 times the CO2 emissions from the tropical Atlantic Ocean (137 TgC yr−1). Moreover, the integrated CO2 emission from the Congo River network is more than 3 times higher than the estimate of terrestrial net ecosystem exchange (NEE) on the whole catchment (77 TgC yr−1). This shows that it is unlikely that the CO2 emissions from the river network were sustained by the hydrological carbon export from terra firme soils (typically very small compared to terrestrial NEE) but most likely, to a large extent, they were sustained by wetlands (with a much higher hydrological connectivity with rivers and streams).
- Article
(9937 KB) - Full-text XML
-
Supplement
(9093 KB) - BibTeX
- EndNote


Emissions to the atmosphere of greenhouse gases (GHGs) such as carbon dioxide (CO2), methane (CH4) and nitrous oxide (N2O) from inland waters (rivers, lakes and reservoirs) might be quantitatively important for global budgets (Seitzinger and Kroeze, 1998; Cole et al., 2007; Bastviken et al., 2011). Yet, there are very large uncertainties in the estimates of GHGs emission to the atmosphere from rivers, as reflected in the wide range of reported values, between 0.2 and 1.8 PgC (1015 gC) yr−1 for CO2 (Cole et al., 2007; Raymond et al., 2013), 2 and 27 TgCH4 (1012 gCH4) yr−1 for CH4 (Bastviken et al., 2011; Stanley et al., 2016), and 32 and 2100 GgN2O-N (109 gN2O-N) yr−1 for N2O (Kroeze et al., 2010; Hu et al., 2016). This uncertainty is mainly due to the scarcity of data in the tropics that account for the majority of riverine GHG emissions (∼80 % for CO2, Raymond et al., 2013; Borges et al., 2015a, b; Lauerwald et al., 2015, 79 % for N2O, Hu et al., 2016; 70 % for CH4, Sawakushi et al., 2014) but also to scaling procedures of varying complexity that use different input data (Raymond et al., 2013; Borges et al., 2015b; Lauerwald et al., 2015), in addition to uncertainty in the estimate of surface area of rivers (Downing et al., 2012; Raymond et al., 2013; Allen and Pavelsky, 2018) and the parameterization of the gas transfer velocity (k) (Raymond et al., 2012; Huotari et al., 20013; Maurice et al., 2017; Kokic et al., 2018; McDowell and Johnson, 2018; Ulseth et al., 2019). The exchange of CO2 between rivers and the atmosphere is in most cases computed from the air–water gradient of the CO2 concentration and k parameterized as a function of stream morphology (e.g., slope or depth) and water flow (or discharge). However, there can be large errors associated with the computation of the dissolved CO2 concentration from pH and total alkalinity (TA) for low alkalinity waters in particular so that high-quality direct measurements of dissolved CO2 concentration are preferred (Abril et al., 2015), although scarce. In the tropics, research on GHGs in rivers has mainly focussed on South American rivers and on the central Amazon in particular (Richey et al., 1988, 2002; Melack et al., 2004; Abril et al., 2014; Barbosa et al., 2016; Scofield et al., 2016), while until recently African rivers were nearly uncharted with a few exceptions (Koné et al., 2009, 2010).
There is also a lack of understanding of the drivers of the fluvial concentrations of GHGs, hence, ultimately of the drivers of their exchange with the atmosphere. It is unclear to what extent CO2 emissions from rivers are sustained by in situ net heterotrophy and/or by lateral inputs of CO2. The global organic carbon degradation by net heterotrophy of rivers and streams given by Battin et al. (2008) of 0.2 PgC yr−1 is insufficient to sustain global riverine CO2 emissions given by the most recent estimates of 0.7–1.8 PgC yr−1 (Raymond et al., 2013; Lauerwald et al., 2015), suggesting an important role of lateral CO2 inputs in sustaining emissions to the atmosphere from rivers. In a regional study in the US, Hotchkiss et al. (2015) estimated that in-stream organic matter degradation could only sustain 14 % and 39 % of CO2 riverine emissions in small and large systems, respectively. It is also unclear to what extent CO2 and CH4 emissions from rivers are sustained by carbon inputs either from the terrestrial biome (terra firme) or from wetlands (flooded forests and macrophytes) (Abril and Borges, 2019). This difference has large implications for our fundamental understanding of carbon cycling in rivers and their connectivity with respective catchments but also, consequently, for our capacity to predict how GHG emissions from rivers might be modified in response to climate change (warming and modification of the hydrological cycle), water diversion (damming, water abstraction) or land use change on the catchment (e.g., Klaus et al., 2018). In upland areas, low-order stream CO2 emissions are undoubtedly related to soil-water and ground-water CO2 inputs, although CO2 degassing takes place over very short distances from point sources (≤200 m), is highly variable in space and seasonally, and mainly occurs during short-lived high-flow events that promote shallow flow paths (e.g., Duvert et al., 2018). Low-order streams (1–3) might account for about one-third of the global riverine CO2 emissions (Marx et al., 2017). Recently acquired datasets allowed us to show that inputs from riparian wetlands seem to be of paramount importance in sustaining CO2 and CH4 emissions to the atmosphere from large tropical lowland rivers (Abril et al., 2014; Borges et al., 2015a, b). About half of the global surface area of wetlands is located in the tropics and subtropics (33∘ N–33∘ S), the rest are in the Northern Hemisphere (Fluet-Chouinard et al., 2015), and more than half of river surface area is located in the tropics and subtropics (Allen and Pavelsky, 2018).
The Congo River (∼4400 km length, freshwater discharge ∼44 000 m3 s−1) has a large drainage basin (3.7×10⁶ km2) covered by evergreen forest (dense and mosaic) (∼67 %) and savannah (shrubland and grassland) (∼30 %), owing to the tropical climate (annual average precipitation of 1530 mm and air temperature of 23.7 ∘C). The Congo basin accounts for 89 % of African rainforests. These rainforests are spread between the Democratic Republic of the Congo (54 %), Gabon (11 %), Cameroon (10 %) and the Republic of the Congo (10 %), the remaining 15 % being shared by several other countries. The mean above-ground biomass of the rainforests in Central Africa (43 kg dry biomass (db) m−2) is much higher than the mean in Amazonia (29 kgdb m−2) and nearly equals the mean in the notorious high biomass forests of Borneo (44 kgdb m−2) (Malhi et al., 2013). Current estimates of carbon transport from the Congo River close to the mouth rank it as the Earth's second-largest supplier of organic carbon to the oceans (Coynel et al., 2005). Despite its overwhelming importance, our knowledge of carbon and nutrient cycling in the Congo river basin is limited to some transport flux data from the 1980s, reviewed by Laraque et al. (2009) and a number of more recent small-scale studies (Bouillon et al., 2012, 2014; Spencer et al., 2012; Lambert et al., 2016), in sharp contrast to the extensive and sustained work that has been done on the Amazon river basin (Alsdorf et al., 2016). The Congo basin has a wide range of contrasting tributaries (differing in lithology, soil characteristics, vegetation, rainfall patterns, etc.) and extensive flooded forests in its central region, the “Cuvette Centrale Congolaise” (CCC), with an estimated flooded cover of 360 000 km2, for a total surface area of 1 760 000 km2 (Bwangoy et al., 2010). Extensive peat deposits are present beneath the swamp forest of the CCC that store below-ground 31 PgC of organic carbon, a quantity similar to the above-ground carbon stock of the forests of the entire Congo basin (Dargie et al., 2017). The tributaries partly drain semi-humid catchments with alternating dry and wet seasons on both sides of the Equator, resulting in a relatively constant discharge and water level for the main stem Congo River (Runge, 2008). Hence, the CCC is an extended zone of year-round inundation (Bwangoy et al., 2010), in sharp contrast with other large tropical rivers such as the Amazon where floodplain inundation shows clear seasonality (Hamilton et al., 2002).
Data of dissolved GHGs (CH4, N2O and CO2) have been reported in rivers in the western part of the Congo basin in four major river basins in the Republic of the Congo (Alima, Lefini, Sangha, Likouala-Mossaka) (Mann et al., 2014; Upstill-Goddard et al., 2017), and we previously reported GHGs data collected in the eastern part of the basin in the Democratic Republic of the Congo in the framework of a broad synthesis of riverine GHGs at the scale of the African continent (Borges et al., 2015a) and a general comparison of the Congo and the Amazon rivers (Borges et al., 2015b). Here, we describe in more detail the variability of GHGs based on a dataset collected during 10 field expeditions from 2010 to 2015 (Figs. 1 and 2) (Borges and Bouillon, 2019), in particular with regards to spatial and seasonal patterns, as well as with regards to the origin of fluvial CO2 by integrating metabolic measurements (primary production and respiration), stable isotope ratios of dissolved inorganic carbon (DIC) and characteristics of the catchments with regards to the cover of wetlands. Comparison of data obtained in streams within and outside the giant wetland area of the CCC allows a natural large-scale test of the influence of the connectivity of wetlands on CO2 and CH4 dynamics in lowland tropical rivers.

Figure 1Freshwater discharge (m3 s−1) of the Congo River at Kinshasa from 2010 to 2015, with an indication of field expedition duration (thick lines).
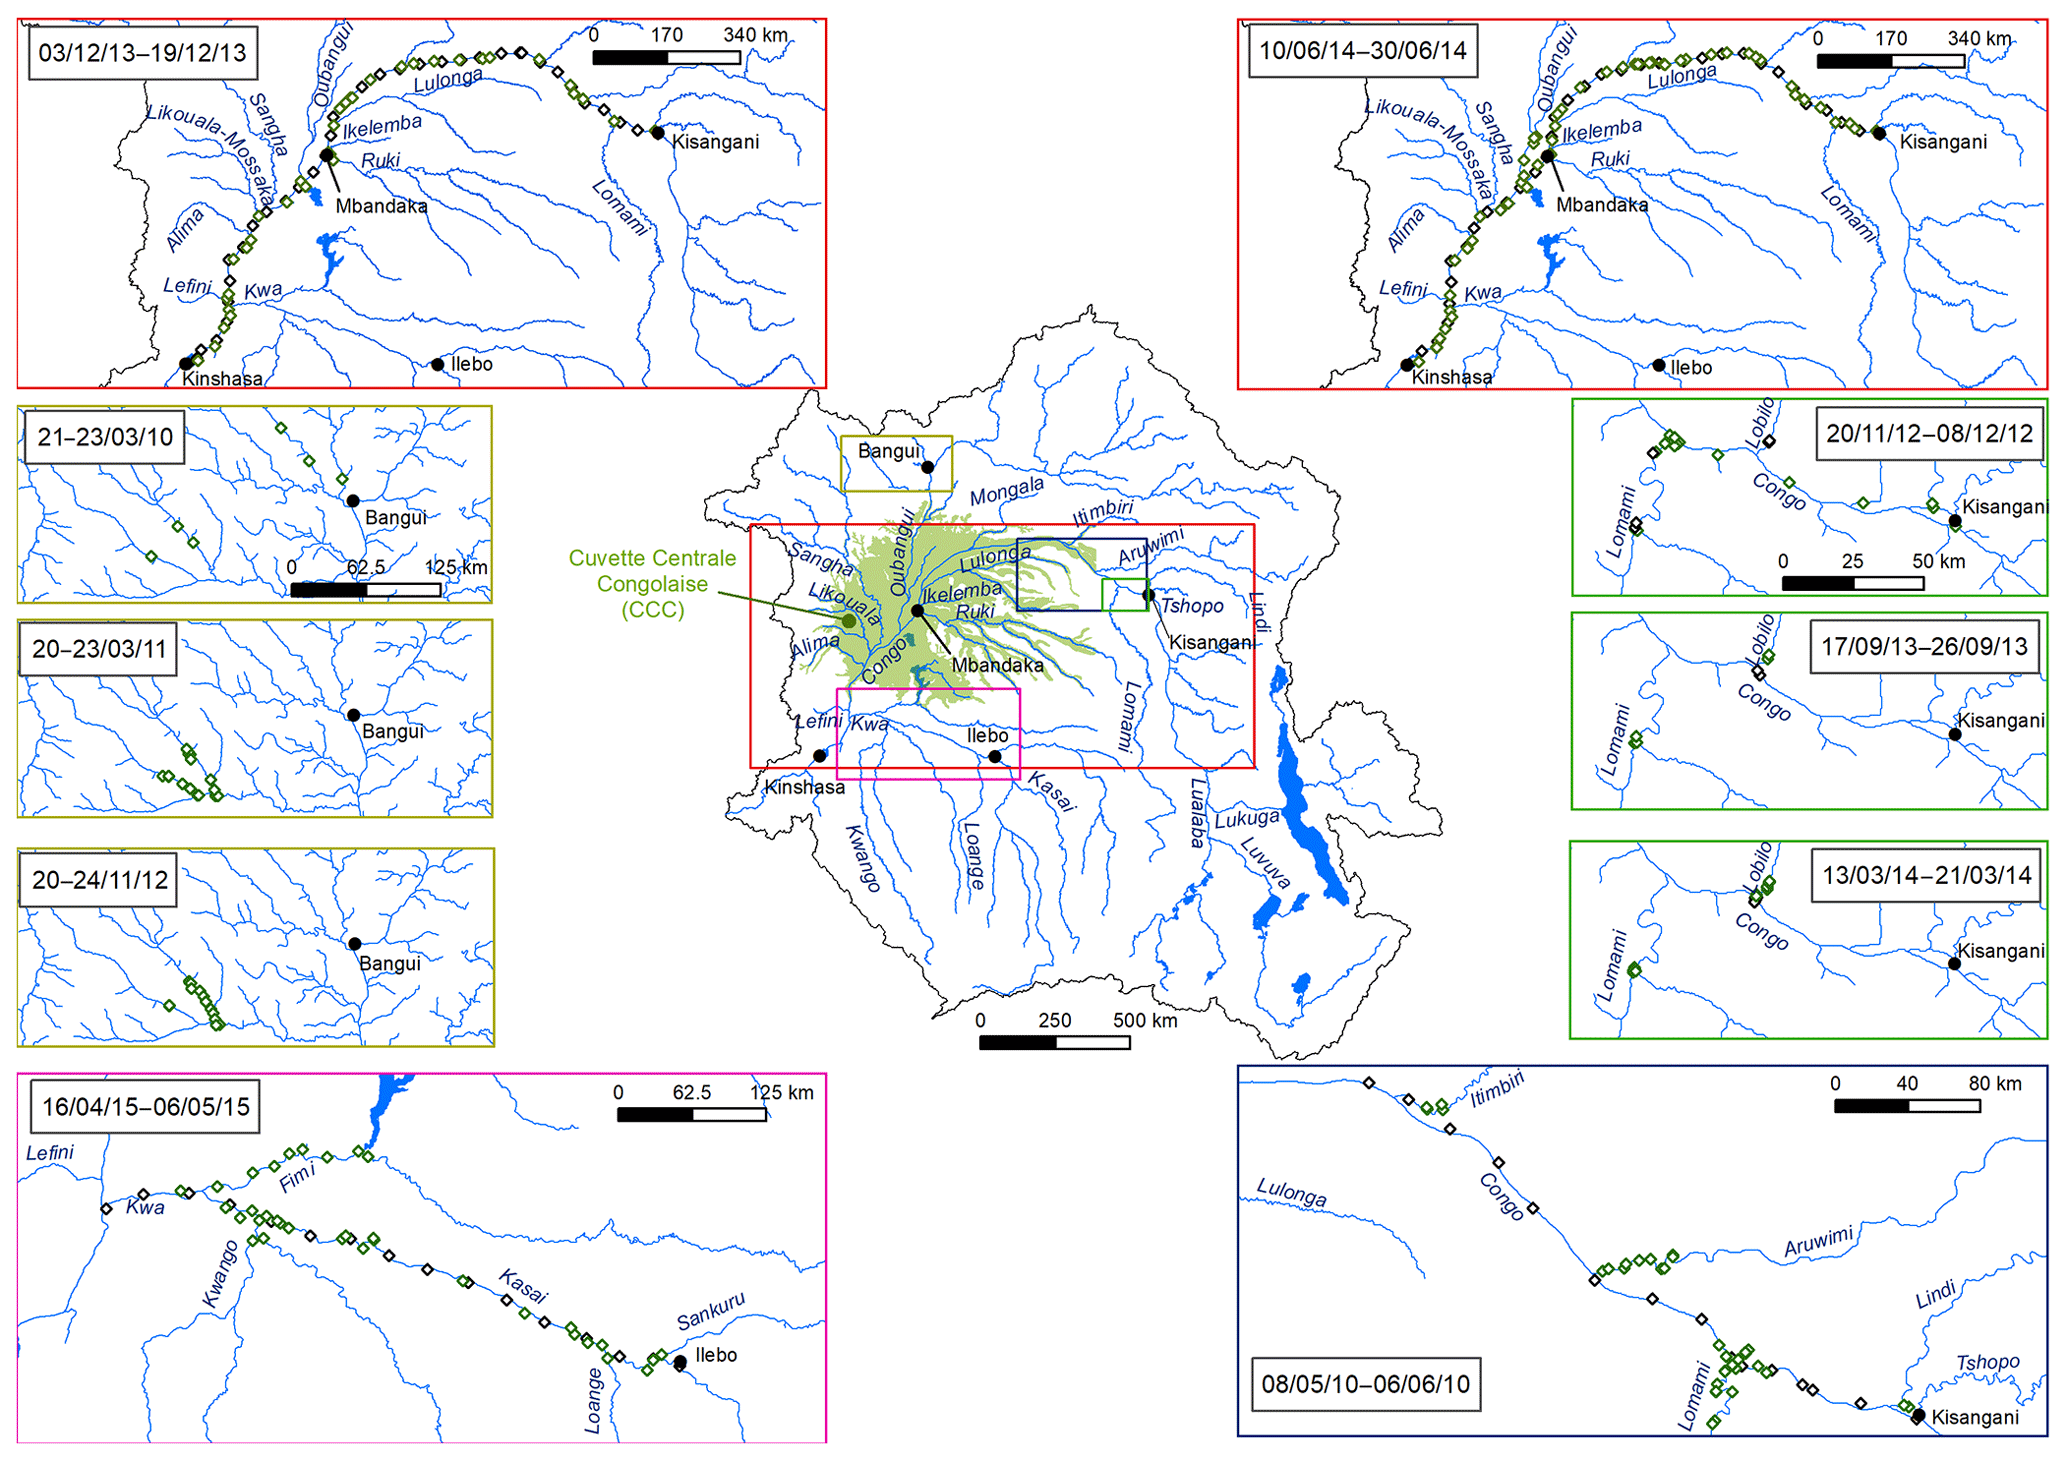
Figure 2Map showing the sampling stations of the 10 field expeditions in the Congo River network.
2.1 Field expeditions and fixed monitoring
Samples were collected during a total of 10 field expeditions (Figs. 1 and 2). Three were done from a medium sized boat (22 m long) on which we deployed the equipment for continuous measurements of the partial pressure of CO2 (pCO2) (total n=30 490) as well as the field laboratory for conditioning water samples. Sampling in the main stem and large tributaries was made from the medium sized boat, while sampling in smaller tributaries was made with a pirogue. These large-scale field expeditions covered the Kisangani–Kinshasa transect twice (3–19 December 2013 and 10–30 June 2014) and the Kwa river up to Ilebo (16 April–6 May 2015). During the other cruises, the field laboratory was installed in a base camp (typically in a village along the river), and traveling and sampling was made with small pirogues on which it was not possible to deploy the apparatus for continuous measurements of pCO2. Three cruises covered the section from Kisangani to the mouth of the Lomami River (20 November–8 December 2012; 17–26 September 2013; 13—21 March 2014), one cruise covered the section from Kisangani to the mouth of the Itimbiri River (8 May–6 June 2010) and three cruises (previously reported by Bouillon et al., 2012, 2014) covered the Oubangui river network around the city of Bangui (21–23 March 2010, 20–23 March 2011, and 20–24 November 2012).
Fixed sampling was carried out in the Congo main stem in proximity of the city of Kisangani (10 December 2012–16 April 2018), the Oubangui main stem in proximity of the city of Bangui (20 March 2010–31 March 2012) and the Kasaï main stem in proximity of the village of Dima, close to the city of Bandundu (14 April 2015–15 May 2017). Sampling was carried out at regular intervals, every 15 d in the Congo and Oubangui main stems and every month in the Kasaï main stem. Data from the Oubangui catchment were previously reported by Bouillon et al. (2012, 2014).
2.2 Continuous measurements
Continuous measurements (1 min interval) of pCO2 were made with an equilibrator designed for turbid waters (Frankignoulle et al., 2001) coupled to a nondispersive infra-red gas analyzer (IRGA) (Li-Cor 840). The equilibrator consisted of a Plexiglas cylinder (height of 70 cm and internal diameter of 7 cm) filled with glass marbles; pumped water flowed from the top to the bottom of the equilibrator at a rate of about 3 L min−1; water residence time within the equilibrator was about 10 s, while 99 % of equilibration was achieved in less than 120 s (Frankignoulle et al., 2001). This type of equilibrator system was shown to be the fastest among commonly used equilibration designs (Santos et al., 2012). In parallel to the pCO2 measurements, water temperature, specific conductivity, pH, dissolved oxygen saturation level (%O2), and turbidity were measured with an YSI multiparameter probe (6600) and position was measured with a Garmin geographical position system (Map 60S) portable probe. Water was pumped to the equilibrator and the multiparameter probe (on deck) with a 12V powered water pump (LVM105) attached on a wooden pole to the side of the boat at about 1 m depth. We did not observe bubble entrainment in water circuit to the equilibrator, as the sailing speed was low (maximum speed 12 km h−1). Instrumentation was powered by 12 V batteries that were recharged in the evening with power generators.
2.3 Discrete sampling
In smaller streams, sampling was done from the side of a pirogue with a 1.7 L Niskin bottle (General Oceanics) for gases (CO2, CH4, N2O) and a 5 L polyethylene water container for other variables. Water temperature, specific conductivity, pH and %O2 were measured in situ with a YSI multiparameter probe (ProPlus). pCO2 was measured with a Li-Cor Li-840 IRGA based on the headspace technique with four polypropylene syringes (Abril et al., 2015). During two cruises (20 November–8 December 2012; 17–26 September 2013, n=38), a PP Systems EGM-4 was used as an IRGA instead of the Li-Cor Li-840. During one of the cruises (13–21 March 2014, n=20) the equilibrated headspace was stored in pre-evacuated 12 mL Exetainer (Labco) vials and analyzed in our home laboratory with a gas chromatograph (GC) (see below). Similarly, the equilibrated headspace was stored in pre-evacuated 12 mL Exetainer (Labco) vials for pCO2 analysis from the fixed sampling in Kisangani. This approach was preferred to the analysis of pCO2 from the samples for CH4 and N2O analysis, as the addition of HgCl2 to preserve the water sample from biological alteration led to an artificial increase in CO2 concentrations most probably related to the precipitation of HgCO3 (Supplement Fig. S1).
Both YSI multiparameter probes were calibrated according to manufacturer's specifications, in air for %O2 and with standard solutions for other variables: commercial pH buffers (4.00 and 7.00), a 1000 µS cm−1 standard for conductivity and a 124 nephelometric turbidity unit (NTU) standard for turbidity. The turbidity data from the YSI 6600 compared satisfactorily with discrete total suspended matter (TSM) measurements (Fig. S2), so hereafter we will refer to TSM for both discrete samples and sensor data. The Li-Cor 840 IRGAs were calibrated before and after each cruise with ultrapure N2 and a suite of gas standards (Air Liquide Belgium), with CO2 mixing ratios of 388, 813, 3788 and 8300 ppm. The overall precision of pCO2 measurements was ±2.0 %.
2.4 Metabolism measurements
Primary production (PP) was measured during 2 h incubations along a gradient of light intensity using 13C- as a tracer, as described in detail by Descy et al. (2017). Data were integrated vertically with PAR profiles made with a Li-Cor Li-193 underwater spherical sensor and at daily scale with surface PAR data measured during the cruises with a Li-190R quantum sensor. In order to extend the number of PP data points we developed a very simple model as a function of chlorophyll a concentration (Chl a) and of Secchi depth (Sd):
where PP is in mmol m−2 d−1, Sd in cm and Chl a in µg L−1
This approach is inspired from empirical models such as the one developed by Cole and Cloern (1987) that accounts for phytoplankton biomass given by Chl a, light extinction given by the photic depth and daily surface irradiance. We use Sd as a proxy for photic depth and, in order to simplify the computations, we did not include in the model daily surface irradiance, since it is nearly constant year round in our study region close to the Equator. The model satisfactorily predicts the PP (Fig. S3), except at very low Chl a values at which the model overestimates PP (due to the Sd term). In order to overcome this, we assumed a zero PP value for Chl a concentrations < 0.3 µg L−1.
Pelagic community respiration (CR) was determined from the decrease in O2 in 60 mL biological oxygen demand bottles (Wheaton) over ∼24 h incubation periods. The bottles were kept in the dark and close to in situ temperature in a cooler filled with in situ water. The O2 decrease was determined from triplicate measurements at the start and the end of the incubation with an optical O2 probe (YSI ProODO). At the end of incubation the sealed samples were homogenized with a magnetic bar prior to the measurement of O2. Depth integration was made by multiplying the CR in surface waters by the depth measured at the station with a portable depth meter (Plastimo Echotest-II).
For methane oxidation measurements, seven 60 mL borosilicate serum bottles (Wheaton) were filled sequentially from the Niskin bottle and immediately sealed with butyl stoppers and crimped with aluminum caps. The butyl stoppers were cleaned of leachable chemicals by boiling in deionized water during 15 min in our home laboratory. The first and the last bottle to be filled were then poisoned with a saturated solution of HgCl2 (100 µL) injected through the butyl stopper with a polypropylene syringe and a steel needle, corresponding to the initial concentration of the incubation (T0). The other bottles were stored in a cooler full of in situ water (to keep samples close to in situ temperature and in the dark) and were poisoned approximately 12 h after T0 (T1) and then approximately every 24 h after T0 (T2, T3, T4 and T5). The difference between the two T0 samples was close to the typical precision of measurements showing that the water was homogeneous within the Niskin bottle with regards to CH4 concentration, and no measurable loss of CH4 occurred when filling the seven vials. Methane oxidation was computed from the linear decrease in CH4 concentration with time.
2.5 Sample conditioning and laboratory analysis
Samples for CH4 and N2O were collected from the Niskin bottle with a silicone tube in 60 mL borosilicate serum bottles (Wheaton), poisoned with 200 µL of a saturated solution of HgCl2 and sealed with a butyl stopper and crimped with aluminum cap. Measurements were made with the headspace technique (Weiss, 1981) and a GC (SRI 8610C) with a flame ionization detector for CH4 (with a methanizer for CO2) and electron capture detector for N2O calibrated with CO2 : CH4 : N2O : N2 gas mixtures (Air Liquide Belgium) with mixing ratios of 1, 10, and 30 ppm for CH4; 404, 1018, and 3961 ppm for CO2; and 0.2, 2.0, and 6.0 ppm for N2O. The precision of measurements based on duplicate samples was ±3.9 % for CH4 and ±3.2 % for N2O. The CO2 concentration is expressed as partial pressure in parts per million (ppm) and CH4 as dissolved concentration (nmol L−1), in accordance with convention in existing topical literature and because both quantities were systematically and distinctly above saturation level (400 ppm and 2–3 nmol L−1, respectively). Variations in N2O were modest and concentrations fluctuated around atmospheric equilibrium, so data are presented as percent of saturation level (%N2O, where atmospheric equilibrium corresponds to 100 %), computed from the global mean N2O air mixing ratios given by the Global Monitoring Division (GMD) of the Earth System Research Laboratory (ESRL) of the National Oceanic and Atmospheric Administration (NOAA) (https://www.esrl.noaa.gov/gmd/hats/combined/N2O.html, last access: 15 August 2018) and using the Henry's constant given by Weiss and Price (1980).
The flux (F) of CO2 (FCO2), CH4 (FCH4) and N2O (FN2O) between surface waters and the atmosphere was computed according to Liss and Slater (1974):
where k is the gas transfer velocity (cm h−1) and ΔG is the air–water gradient of a given gas.
Atmospheric pCO2 data from Mount Kenya station (NOAA ESRL GMD) and a constant atmospheric CH4 partial pressure of 2 ppm were used. Atmospheric mixing ratios given in dry air were converted to water-vapor-saturated air, using the water vapor formulation of Weiss and Price (1982) as a function of salinity and water temperature. The k normalized to a Schmidt number of 600 (k600 in cm h−1) were derived from the parameterization as a function slope and stream water velocity given by Eq. 5 of Raymond et al. (2012):
where V is stream velocity (m s−1) and S is slope (unitless).
We chose this parameterization because it is based on the most exhaustive compilation to date of k values in streams derived from tracer experiments and was used in the global riverine CO2 efflux estimates of Raymond et al. (2013) and Lauerwald et al. (2015). Values of V and S were derived from a geographical information system (GIS), as described in Sect. 2.6.
During the June 2014 field expedition, samples for the stable isotope composition of CH4 (δ13C-CH4) were collected and preserved similarly to those described above for the CH4 concentration. The δ13C-CH4 was determined with a custom developed interface, whereby a 20 mL He headspace was first created and CH4 was flushed out through a double-hole needle, non-CH4 volatile organic compounds were trapped in liquid N2, CO2 was removed with a soda lime trap, H2O was removed with a magnesium perchlorate trap, and the CH4 was quantitatively oxidized to CO2 in an online combustion column similar to that of an elemental analyzer. The resulting CO2 was subsequently pre-concentrated by immersion of a stainless steel loop in liquid N2, passed through a micropacked GC column (Restek HayeSep Q 2 m length, 0.75 mm internal diameter) and finally measured on a Thermo DeltaV Advantage isotope ratio mass spectrometer (IRMS). Calibration was performed with CO2 generated from certified reference standards (IAEA-CO-1 or NBS-19 and LSVEC) and injected in the line after the CO2 trap. Reproducibility of measurements based on duplicate injections of samples was typically better than ±0.5 ‰.
The fraction of CH4 removed by methane oxidation (Fox) was calculated with a closed-system Rayleigh fractionation model (Liptay et al., 1998) according to
where δ13C−CH4_initial is the signature of dissolved CH4 as produced by methanogenesis in sediments, δ13C−CH4 is the signature of dissolved CH4 in situ and α is the fractionation factor.
We used a value of 1.02 for α based on field measurements in a tropical lake (Morana et al., 2015). For δ13C−CH4_initial, we used a value of −60.2 ‰, which we measured in bubbles from the sediment trapped with a funnel on one occasion in a river dominated by Vossia cuspidata wetlands (16 April–6 May 2015). The model we used to compute Fox applies for closed systems, implying that CH4 is assumed not to be exchanged with surroundings in contrast to open-system models. Running river water corresponds to a system that is intermediate between closed and open chemical systems, since it is open to the atmosphere and the sediments, but, on the other hand, the water parcel can be partly viewed as a closed system being transported downstream with the flow. As such, the water parcel receives a certain amount of CH4 from sediments and then is transported downstream away from the initial input of CH4. We also applied two common open-system models to estimate Fox given by Happel et al. (1994) and by Tyler et al. (1997) that have also been applied in lake systems (Bastviken et al., 2002). However, both open-system models gave Fox values > 1 in many cases (data not shown) since the difference between δ13C of the CH4 source and measured δ13C in dissolved CH4 was often much higher than expected from the assumed isotopic fractionation (1.02). The same observation (Fox > 1) was also reported with open-system models in the lakes studied by Bastviken et al. (2002). Since Fox values > 1 are not conceptually possible, we preferred to use the results from the closed-system model instead, although we acknowledge that flowing waters are in fact intermediary systems between closed and open and that, consequently, the computed Fox values are likely underestimated.
Samples for the stable isotope composition of DIC (δ13C-DIC) were collected from the Niskin bottle with a silicone tube in 12 mL Exetainer vials (Labco) and poisoned with 50 µL of a saturated solution of HgCl2. Prior to the analysis of δ13C-DIC, a 2 mL helium headspace was created and 100 µL of phosphoric acid (H3PO4, 99 %) was added in the vial in order to convert and to CO2. After overnight equilibration, up to 1 mL of the headspace was injected with a gastight syringe into a coupled elemental analyzer – IRMS (EA-IRMS, Thermo FlashHT or Carlo Erba EA1110 with DeltaV Advantage). The obtained data were corrected for isotopic equilibration between dissolved and gaseous CO2, as described by Gillikin and Bouillon (2007). Calibration was performed with certified standards (NBS-19 or IAEA-CO-1 and LSVEC). Reproducibility of measurements based on duplicate injections of samples was typically better than ±0.2 ‰.
Water was filtered on Whatman glass fiber filters (GF/F grade, 0.7 µm porosity) for TSM (47 mm diameter), particulate organic carbon (POC) and particulate nitrogen (PN) (25 mm diameter) (precombusted at 450 ∘C for 5 h) and Chl a (47 mm diameter). Filters for TSM and POC were stored dry and filters for Chl a were stored frozen at −20 ∘C. Filters for POC analysis were decarbonated with HCl fumes for 4 h and dried before encapsulation into silver cups; POC and PN concentration and carbon stable isotope composition (δ13C-POC) were analyzed on an EA-IRMS (Thermo FlashHT with DeltaV Advantage), with a reproducibility better than ±0.2 ‰ for stable isotopic composition and better than ±5 % for bulk concentration of POC and PN. Data were calibrated with certified (IAEA-600: caffeine) and in-house standards (leucine and muscle tissue of Pacific tuna) that were previously calibrated versus certified standards. The Chl a samples were analyzed by high-performance liquid chromatography according to Descy et al. (2005), with a reproducibility of ±0.5 % and a detection limit of 0.01 µg L−1. Part of the Chl a data were previously reported by Descy et al. (2017).
The water filtered through GF/F Whatman glass microfiber filters was collected and further filtered through polyethersulfone syringe encapsulated filters (0.2 µm porosity) for stable isotope composition of O of H2O (δ18O-H2O), TA, dissolved organic carbon (DOC), major elements (Na+, Mg2+, Ca2+, K+ and dissolved silicate, Si), nitrate (), nitrite () and ammonium (). Samples for δ18O-H2O were stored at ambient temperature in polypropylene 8 mL vials and measurements were carried out at the International Atomic Energy Agency (IAEA, Vienna), where water samples were pipetted into 2 mL vials and measured twice on different laser water isotope analyzers (Los Gatos Research or Picarro). Isotopic values were determined by averaging isotopic values from the last four out of nine injections, along with memory and drift corrections, with final normalization to the VSMOW/SLAP scales by using two-point lab standard calibrations, as fully described in Wassenaar et al. (2014) and Coplen and Wassenaar (2015). The long-term uncertainty for standard δ18O values was ±0.1 ‰. Samples for TA were stored at ambient temperature in polyethylene 55 mL vials and measurements were carried out by open-cell titration with HCl 0.1 mol L−1 according to Gran (1952), and data quality was checked with certified reference material obtained from Andrew Dickson (Scripps Institution of Oceanography, University of California, San Diego, USA), with a typical reproducibility better than ±3 µmol kg−1. DIC was computed from TA and pCO2 measurements using the carbonic acid dissociation constants for freshwater of Millero (1979) using the “CO2sys” package. Samples to determine DOC were stored at ambient temperature and in the dark in 40 mL brown borosilicate vials with polytetrafluoroethylene (PTFE)-coated septa and poisoned with 50 µL of H3PO4 (85 %), and DOC concentration was determined with a wet oxidation total organic carbon analyzer (IO Analytical Aurora 1030W), with a typical reproducibility better than ±5 %. Part of the DOC data were previously reported by Lambert et al. (2016). Samples for major elements were stored in 20 mL scintillation vials and preserved with 50 µL of HNO3 (65 %). Major elements were measured with inductively coupled plasma MS (ICP-MS; Agilent 7700x) calibrated with the following standards: SRM1640a from National Institute of Standards and Technology, TM-27.3 (lot 0412) and TMRain-04 (lot 0913) from Environment Canada, and SPS-SW2 Batch 130 from Spectrapure Standard. Limit of quantification was 0.5 µmol L−1 for Na+, Mg2+, and Ca2+; 1.0 µmol L−1 for K+; and 8 µmol L−1 for Si. Samples were collected during four cruises (8 May–6 June 2010, 20 November–8 December 2012, 3–19 December 2013, and 16 April–6 May 2015) for , and and were stored frozen (−20 ∘C) in 50 mL polypropylene vials. and were determined with the sulfanilamide, colorimetric was determined with the vanadium reduction method (APHA, 1998) and was determined with the dichloroisocyanurate-salicylate-nitroprussiate colorimetric method (SCA, 1981). Detection limits were 0.3, 0.01 and 0.15 µmol L−1 for , and , respectively. Precisions were ±0.02, ±0.02 and ±0.1 µmol L−1 for , and , respectively.
2.6 GIS
The limits of the river catchments and Strahler order of rivers and streams were determined from the geospatial HydroSHEDS dataset (https://hydrosheds.cr.usgs.gov/, last access: 27 September 2018) using ArcGIS® (10.3.1). Land cover data were extracted from the global land cover (GLC) 2009 dataset (http://due.esrin.esa.int/page_globcover.php, last access: 11 January 2019) from the European Space Agency GlobCover 2009 project for the following classes: croplands, mosaic cropland/vegetation, dense forest, flooded dense forest, open forest/woodland, shrublands, mosaic forest or shrubland/grassland, grasslands, flooded grassland, and water bodies. Shrubland and grassland classes were aggregated for the estimate of savannah. Theoretical contribution of C4 vegetation were extracted based on the vegetation δ13C isoscape for Africa from Still and Powell (2010) but corrected for agro-ecosystems according to the method of Powell et al. (2012).
The geospatial and statistical methods to compute river width, length, Strahler stream order, surface area, slope, flow velocity and discharge throughout the Congo River network are described in detail in the Supplement.
2.7 Statistical analysis
Statistical tests were carried out using GraphPad Prism® software at 0.05 level, and the normality of the distribution was tested with the D'Agostino–Pearson omnibus normality test.
This section starts with the description of the spatial variations in general limnological variables as well as GHGs along the two main transects (Kinsangani–Kinshasa and Kwa) and as a function of stream order and the presence of the CCC. The following parts of this section deal with the seasonal variability and the drivers of CO2 dynamics, based on one hand on the metabolic measurements and on the other hand on stable isotopic composition of DIC. The final part of this section deals with fluxes of GHGs between the river and the atmosphere that are presented and discussed firstly as areal fluxes and finally as integrated fluxes at the scale of the basin and at global scale.
3.1 Spatial variations along the Kisangani–Kinshasa transect of general limnological variables and dissolved GHGs
Figures 3 and 4 show the spatial distribution of variables in surface waters of the main stem Congo River and confluence with tributaries along the Kisangani–Kinshasa transect during high water (HW, December 2013) and falling water (FW, June 2014) periods (Figs. 1 and 2). Numerous variables show a regular pattern in the main stem (increase or decrease) due to the gradual inputs from tributaries with a different (higher or lower) value than the main stem. Specific conductivity, TA, δ13C-DIC, pH, %O2, %N2O, TSM, pH and δ18O-H2O decreased, while pCO2 and DOC increased in the main stem along the Kisangani–Kinshasa transect. Numerous tributaries had black-water characteristics (low conductivity, TA, pH, %O2, TSM and high DOC) while the main stem had generally white-water characteristics. The black-water tributaries were mainly found in the region of the CCC, while tributaries upstream or downstream of the CCC had in general more white-water characteristics. The differences between black-waters and white-waters were apparent in the patterns of continuous measurements of pCO2, showing a negative relationship with %O2, TSM, pH and specific conductivity (Fig. S4).
Specific conductivity in the main stem Congo River decreased from 48.3 (HW) and 78.9 (FW) µS cm−1 in Kisangani to 26.5 (HW) and 32.7 (FW) µS cm−1 in Kinshasa (Figs. 3 and 4). This decreasing pattern was related to a gradual dilution with tributary water with lower conductivities, on average 27.6±9.9 (HW) and 31.9±17.8 (FW) µS cm−1. The lowest specific conductivity was measured in the Lefini River that is part of the Téké Plateau, where rainwater infiltrates into deep aquifers across thick sandy horizons leading to water with a low mineralization (Laraque et al., 1998). TA in the main stem decreased from 344 (HW) and 697 (FW) µmol kg−1 in Kisangani to 195 (HW) and 269 (FW) µmol kg−1 in Kinshasa, with an average in tributaries of 141±119 (HW) and 136±141 (FW) µmol kg−1. δ13C-DIC roughly followed the patterns of TA, decreasing in the main stem from −7.9 (HW) and −13.8 (FW) ‰ in Kisangani to −11.8 (HW) and −17.8 (FW) ‰ in Kinshasa, with an average in tributaries of (HW) and (FW) ‰. TSM in the main stem decreased from 92.9 (HW) and 23.2 (FW) mg L−1 in Kisangani to 45.4 (HW) and 18.2 (FW) mg L−1 in Kinshasa, with an average in tributaries of 9.3±13.4 (HW) and 8.5±9.3 (FW) mg L−1. The highest TSM values were recorded in the Kwa (44.4 (HW) and 15.8 (FW) mg L−1) and in the Nsele, a small stream-draining savannah and flowing into pool Malebo (71.4 [HW] and 34.8 [FW] mg L−1). pH in the main stem decreased from 6.73 (HW) and 7.38 (FW) in Kisangani to 6.11 (HW) and 6.29 (FW) in Kinshasa, with an average in tributaries of 5.44±0.88 (HW) and 4.91±1.05 (FW). %O2 values in the main stem decreased from 89.2 (HW) and 92.6 (FW) % in Kisangani to 57.8 (HW) and 79.7 (FW) % in Kinshasa, with an average in tributaries of 36.7±33.3 (HW) and 43.7±35.8 (LW) %. DOC increased from 5.9 (HW) and 5.1 (FW) mg L−1 in Kisangani to 11.9 (HW) and 9.4 (FW) mg L−1 in Kinshasa, with an average in tributaries of 16.1±10.6 (HW) and 17.9±15.2 (FW) mg L−1. Extremely low pH values were recorded in rivers draining the CCC, with values as low as 3.6, coinciding with nearly anoxic conditions (%O2 down to 0.3 %) in surface waters and very high DOC content (up to 67.8 mg L−1). δ18O-H2O in the main stem decreased from −2.2 (HW) and −1.6 (FW) ‰ in Kisangani to −2.9 (HW) and −2.2 (FW) ‰ in Kinshasa, with an average in the tributaries of (HW) and ‰ (FW). Temperature increased in the main stem from 26.0 (HW) and 27.1 (FW) ∘C in Kisangani to 27.8 (HW) and 27.3 (FW) ∘C in Kinshasa, due to exposure in the uncovered main stem to solar radiation, as temperature was lower in tributaries with an average of 26.0±1.1 (HW) and 26.1±1.7 (FW) ∘C due to more shaded conditions (forest cover).
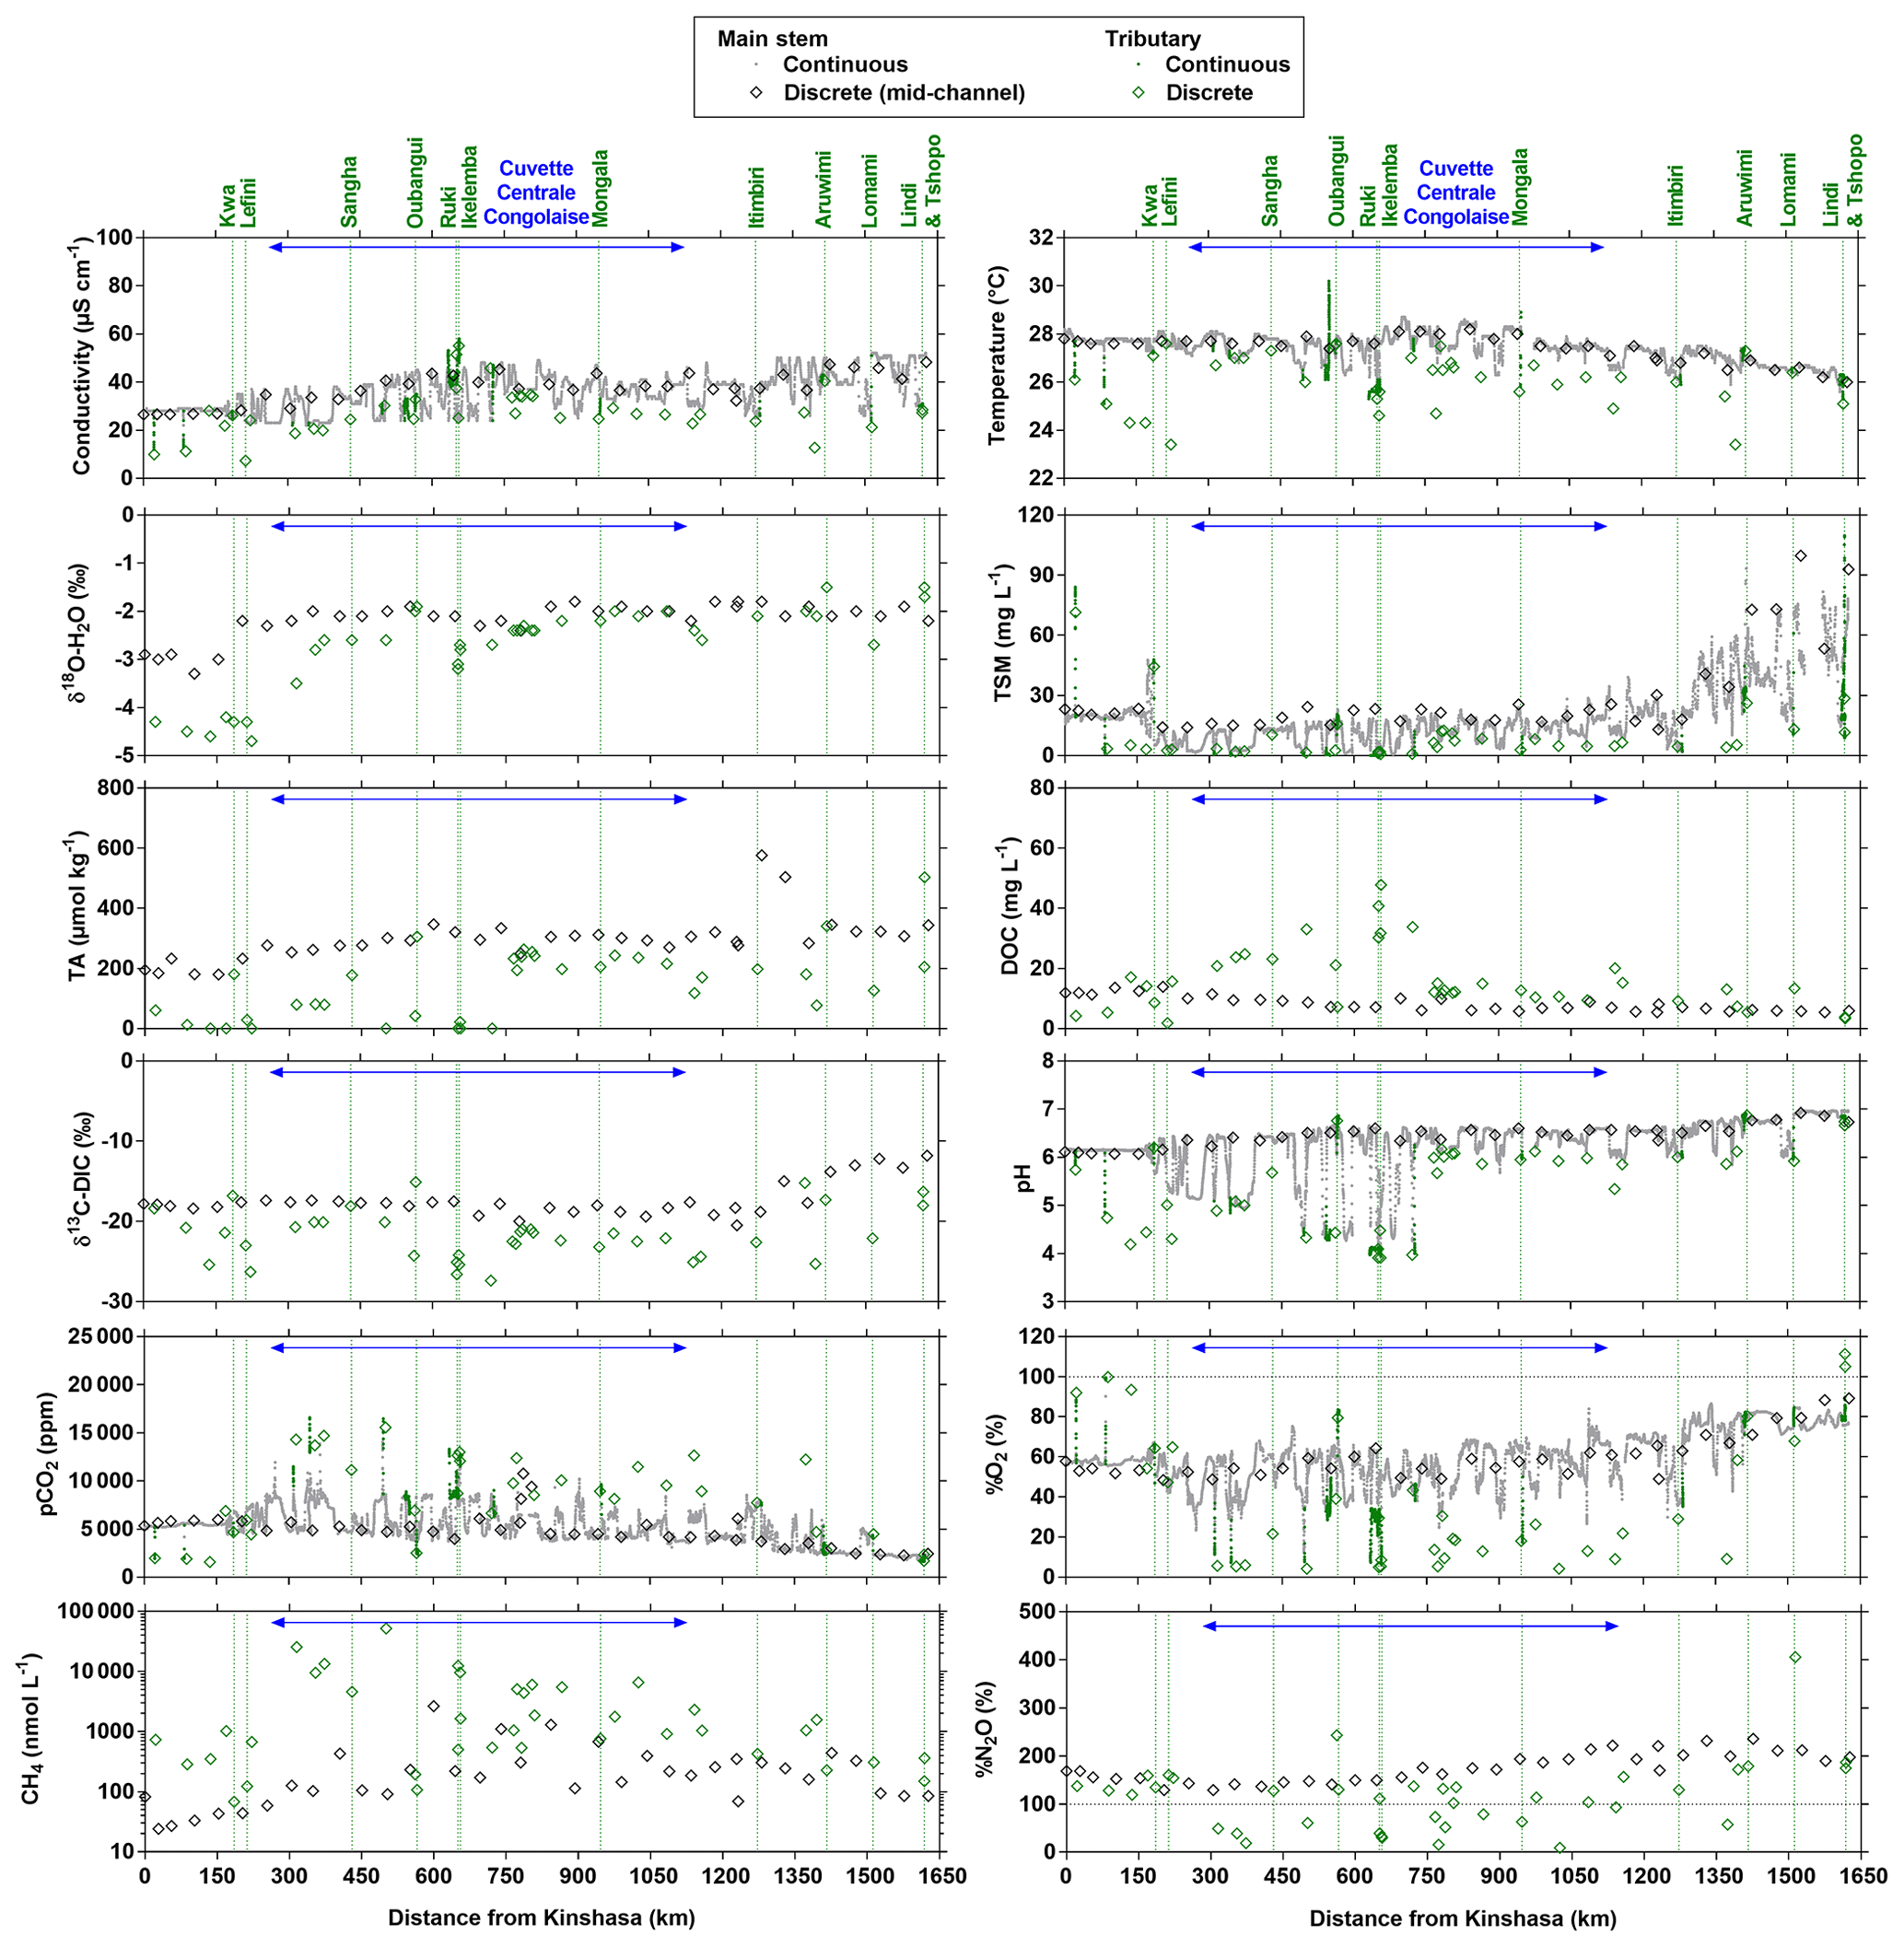
Figure 3Variation in surface waters of the specific conductivity (µS cm−1), water temperature (∘C), oxygen stable isotope composition of H2O (δ18O-H2O in ‰), total suspended matter (TSM in mg L−1), total alkalinity (TA in µmol kg−1), dissolved organic carbon (DOC in mg L−1), carbon stable isotope composition of dissolved inorganic carbon (δ13C-DIC in ‰), pH, partial pressure of CO2 (pCO2 in ppm), dissolved O2 saturation level (%O2 in %), dissolved CH4 concentration (nmol L−1) and dissolved N2O saturation level (%N2O in %) as a function of the distance upstream of Kinshasa along a transect along the Congo River from Kisangani (3–19 December 2013, n=10 505). Grey and black symbols indicate samples from the main stem and green samples from tributaries.
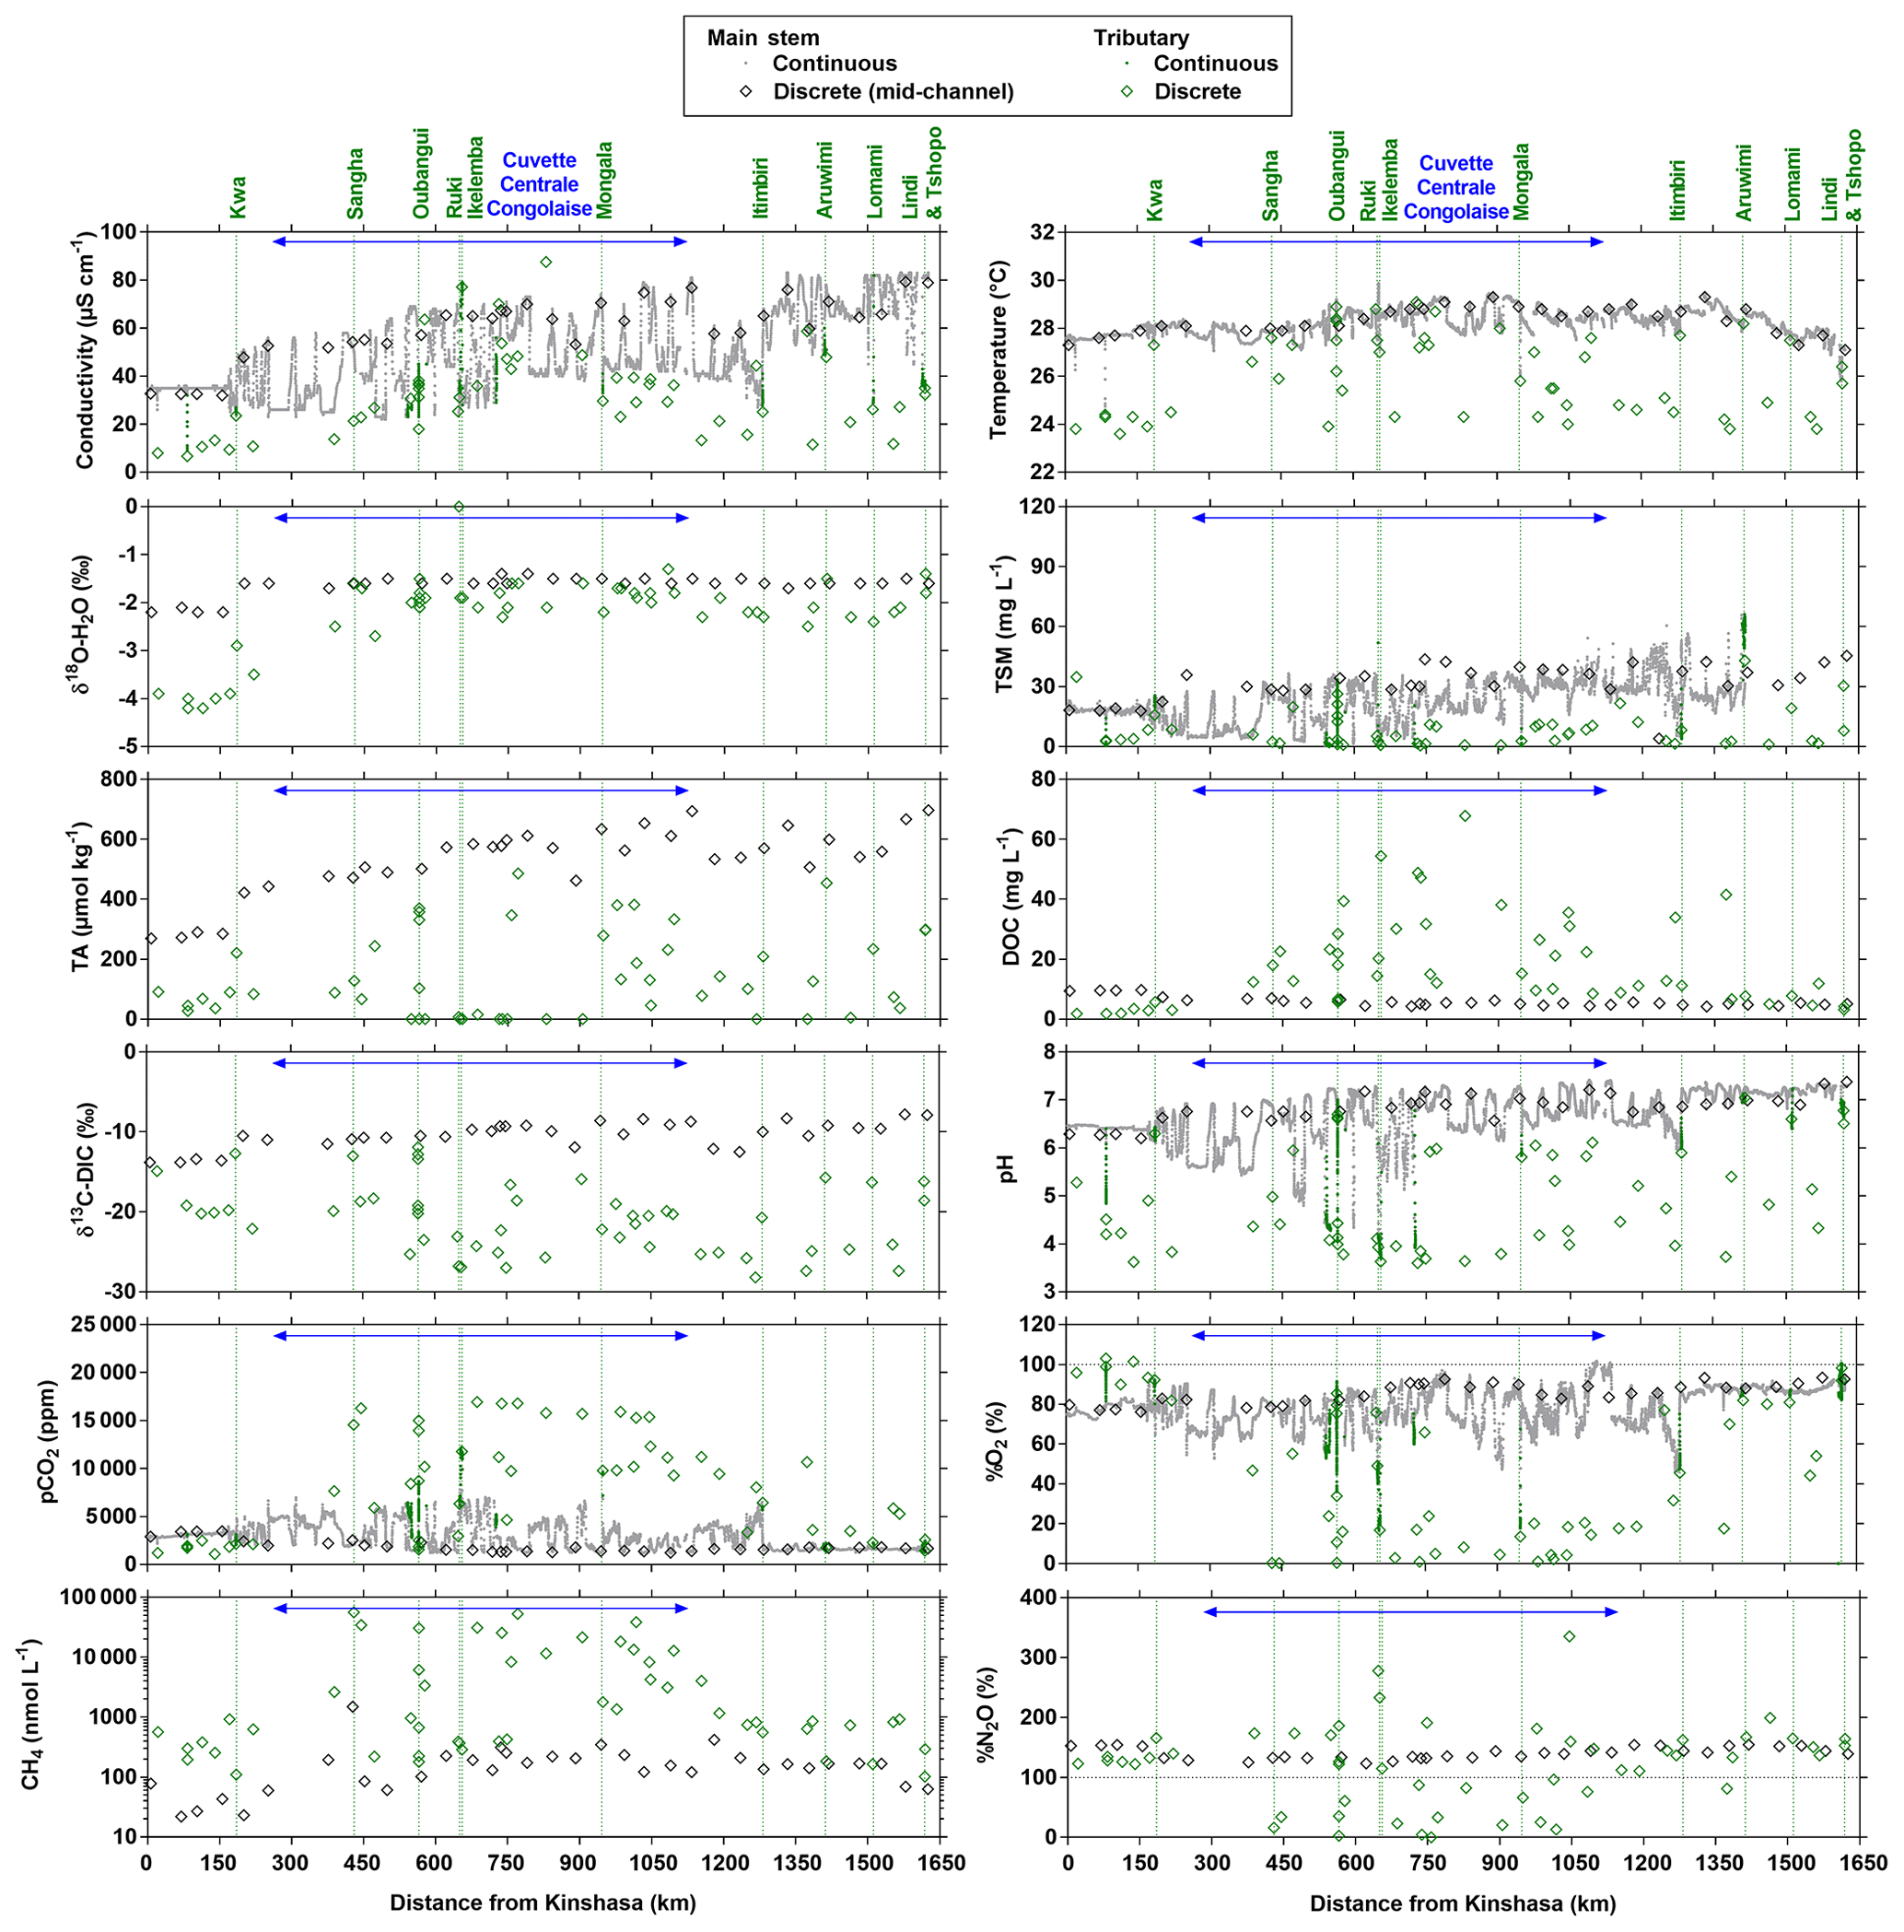
Figure 4Variation in surface waters of the specific conductivity (µS cm−1), water temperature (∘C), oxygen stable isotope composition of H2O (δ18O-H2O in ‰), total suspended matter (TSM in mg L−1), total alkalinity (TA in µmol kg−1), dissolved organic carbon (DOC in mg L−1), carbon stable isotope composition of dissolved inorganic carbon (δ13C-DIC in ‰), pH, partial pressure of CO2 (pCO2 in ppm), dissolved O2 saturation level (%O2 in %), dissolved CH4 concentration (nmol L−1) and dissolved N2O saturation level (%N2O in %) as a function of the distance upstream of Kinshasa along a transect along the Congo River from Kisangani (10–30 June 2014, n=12 968). Grey and black symbols indicate samples from the main stem and green samples from tributaries.
The pCO2 values in the main stem increased from 2424 (HW) and 1670 (FW) ppm in Kisangani to 5343 (HW) and 2896 (FW) ppm in Kinshasa, with an average in tributaries of 8306±4089 (HW) and 8039±5311 (FW) ppm. pCO2 in tributaries was in general higher than in the main stem with a few exceptions, namely in rivers close to Kinshasa (1582 to 1903 [HW] and 1087 to 2483 [FW] ppm), due to degassing at waterfalls upstream of the sampling stations, as the terrain is more mountainous in this area than in more gently sloping catchments upstream and also possibly due to a larger contribution of savannah to the catchment cover. The highest pCO2 values (up to 16 942 ppm) were observed in streams draining the CCC. CH4 in the main stem decreased from 85 (HW) and 63 (FW) nmol L−1 in Kisangani to 24 (HW) and 22 (FW) nmol L−1 just before Kinshasa and then increased again in the Malebo pool (82 [HW] and 78 [FW] nmol L−1), possibly related to the shallowness (∼3 m in Malebo pool versus ∼30 m depth at station just upstream). The general decreasing pattern of CH4 in the main stem resulted from CH4 oxidation, as indicated by 13C-enriched values in the main stem (−38.1 ‰ to −49.4 ‰) with regards to sediment CH4 (−60.2 ‰) and the increasing 13C enrichment along the transect (Fig. 5). The calculated fraction of oxidized CH4 ranged between 0.43 and 0.68 in the main stem and also increased downstream along the transect (Fig. S5). CH4 in the tributaries showed a very large range of CH4 concentration (68 to 51 839 nmol L−1 (HW) and 102 to 56 236 nmol L−1 (FW)). CH4 in the tributaries showed a variable degree of 13C enrichment compared to sediment CH4 (δ13C-CH4 between −19.3 ‰ and −56.3 ‰, Fig. 5), and the calculated fraction of oxidized CH4 ranged between 0.18 and 0.88 (Fig. S5). Unlike the large rivers of the Amazon where a loose negative relation has been reported (Sawakuchi et al., 2016), the δ13C-CH4 values in the Congo River were unrelated to dissolved CH4 concentrations, and a relatively high 13C enrichment (δ13C-CH4 up to −19.3 ‰) was observed even at high CH4 concentrations (correspondingly 3118 nmol L−1) (Fig. 5). This lack of correlation between concentration and isotope composition of CH4 was probably related to spatial heterogeneity of sedimentary (and corresponding water column) CH4 content over a very large and heterogeneous sampling area. The highest CH4 concentrations were observed at the mouths of small rivers in the CCC. At the confluence with the Congo main stem, the flow is slowed down, leading to the development of shallow delta-type systems with very dense coverage of aquatic macrophytes (in majority Vossia cuspidata with a variable contribution of Eichhornia crassipes but also other species, Fig. S6). Such sites are favorable for intense sediment methanogenesis but, due to the stable environment related to near stagnant waters, also very favorable for the establishment of a stable methanotrophic bacterial community in the water column and associated with the root system of floating macrophytes that sustain intense methane oxidation (Yoshida et al., 2014; Kosten et al., 2016). Indeed, we found a very strong relation between CH4 oxidation and CH4 concentration on a limited number of incubations carried out in the Kwa river network in April 2015 (Fig. S7). Such conditions can explain the apparently paradoxical combination of high CH4 concentrations in some cases associated with a high degree of CH4 oxidation. Microbial oxidation of CH4 might also explain the occurrence of samples with extremely 13C depleted POC (δ13C-POC down to −39.0 ‰) observed in low %O2 and high CH4 environments (Fig. 6) located in small streams of the CCC that were also characterized by low POC and TSM values (not shown) and high POC : Chl a ratios (excluding the possibility that in situ PP would be at the basis of the 13C depletion). This suggests that in these environments poor in particles (typical of black-water streams) but with high CH4 concentrations, methanotrophic bacteria that are able to incorporate 13C-depleted CH4 into their biomass contribute substantially to POC. While such patterns have been reported at the oxic–anoxic transition zone of lakes with high hypolimnetic CH4 concentrations such as Lake Kivu (Morana et al., 2015), this has never been reported in surface waters of rivers.
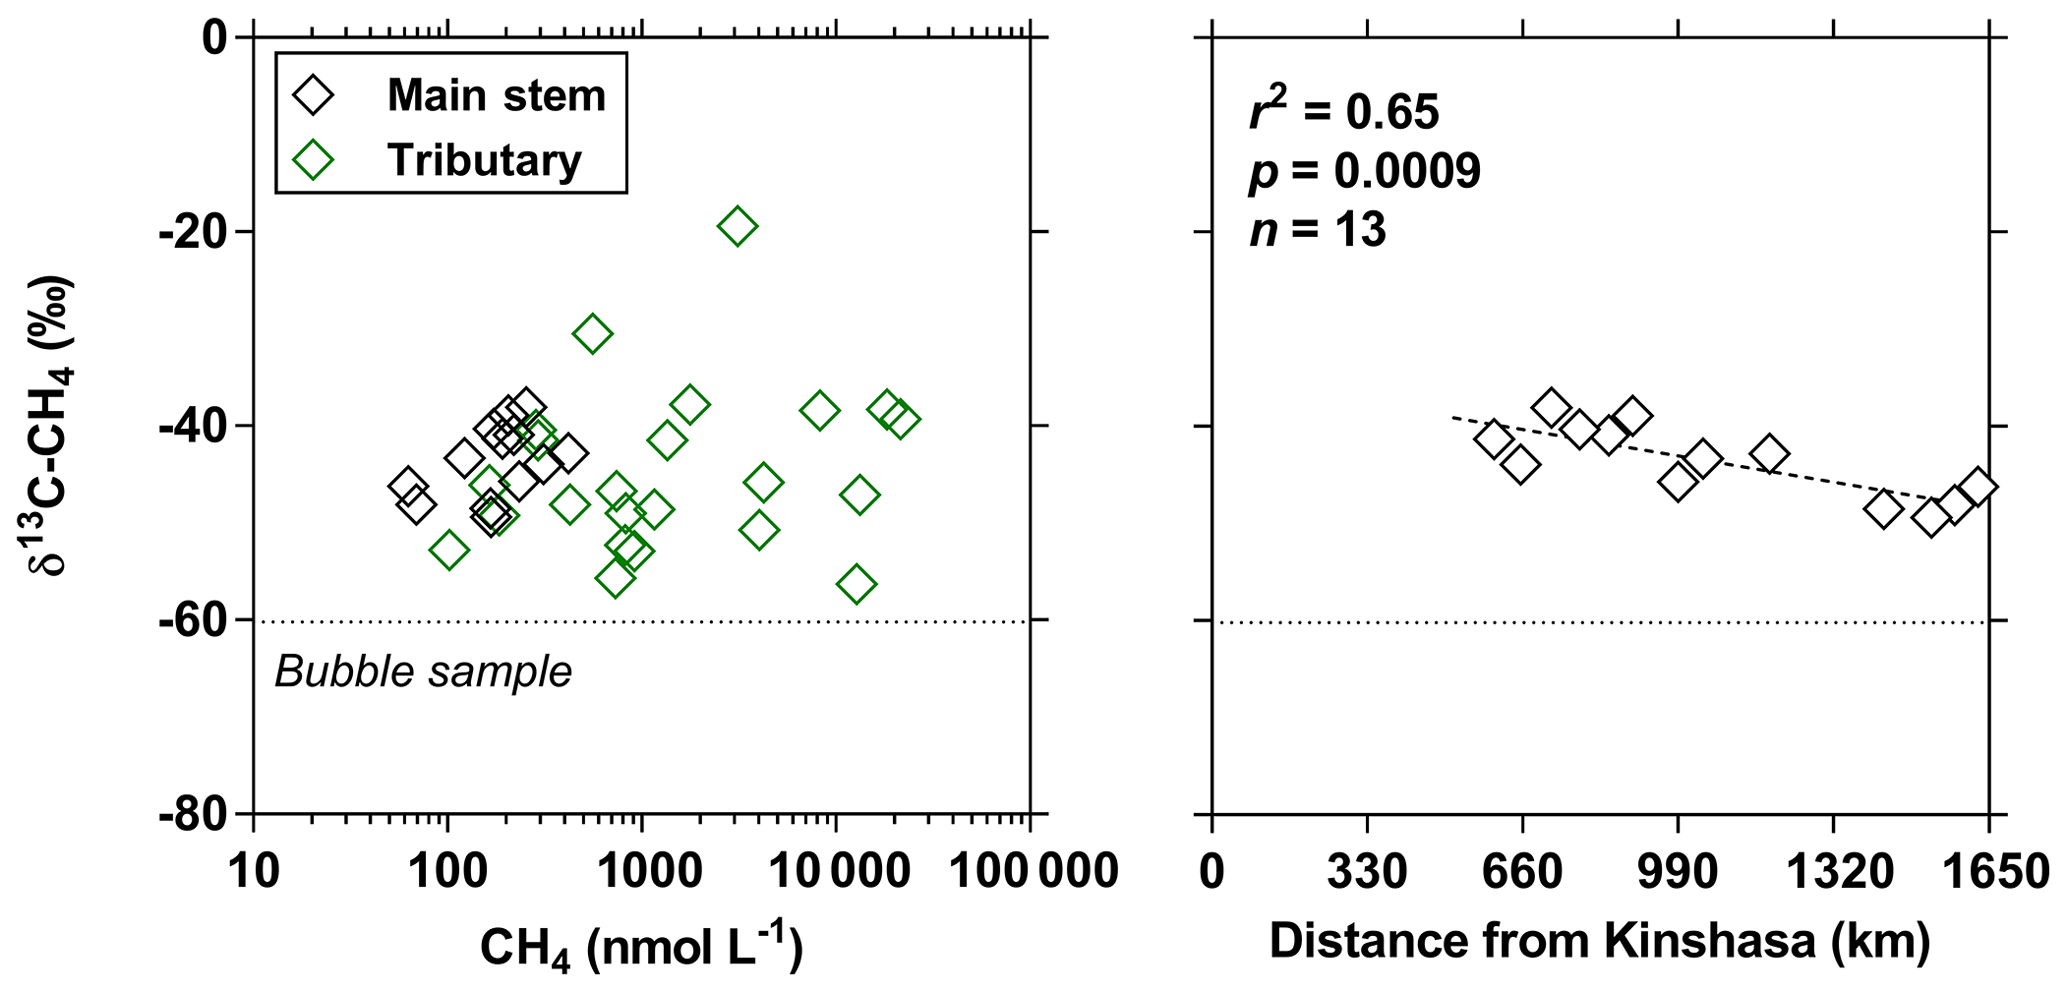
Figure 5Carbon stable isotope composition of CH4 (δ13C-CH4 in ‰) in surface waters of the Congo River main stem (black symbols) and tributaries (green symbols) as a function of dissolved CH4 concentration (nmol L−1) and as a function of the distance upstream of Kinshasa, obtained along a longitudinal transect along the Congo River from Kisangani (10–30 June 2014). The dotted line indicates linear regression.
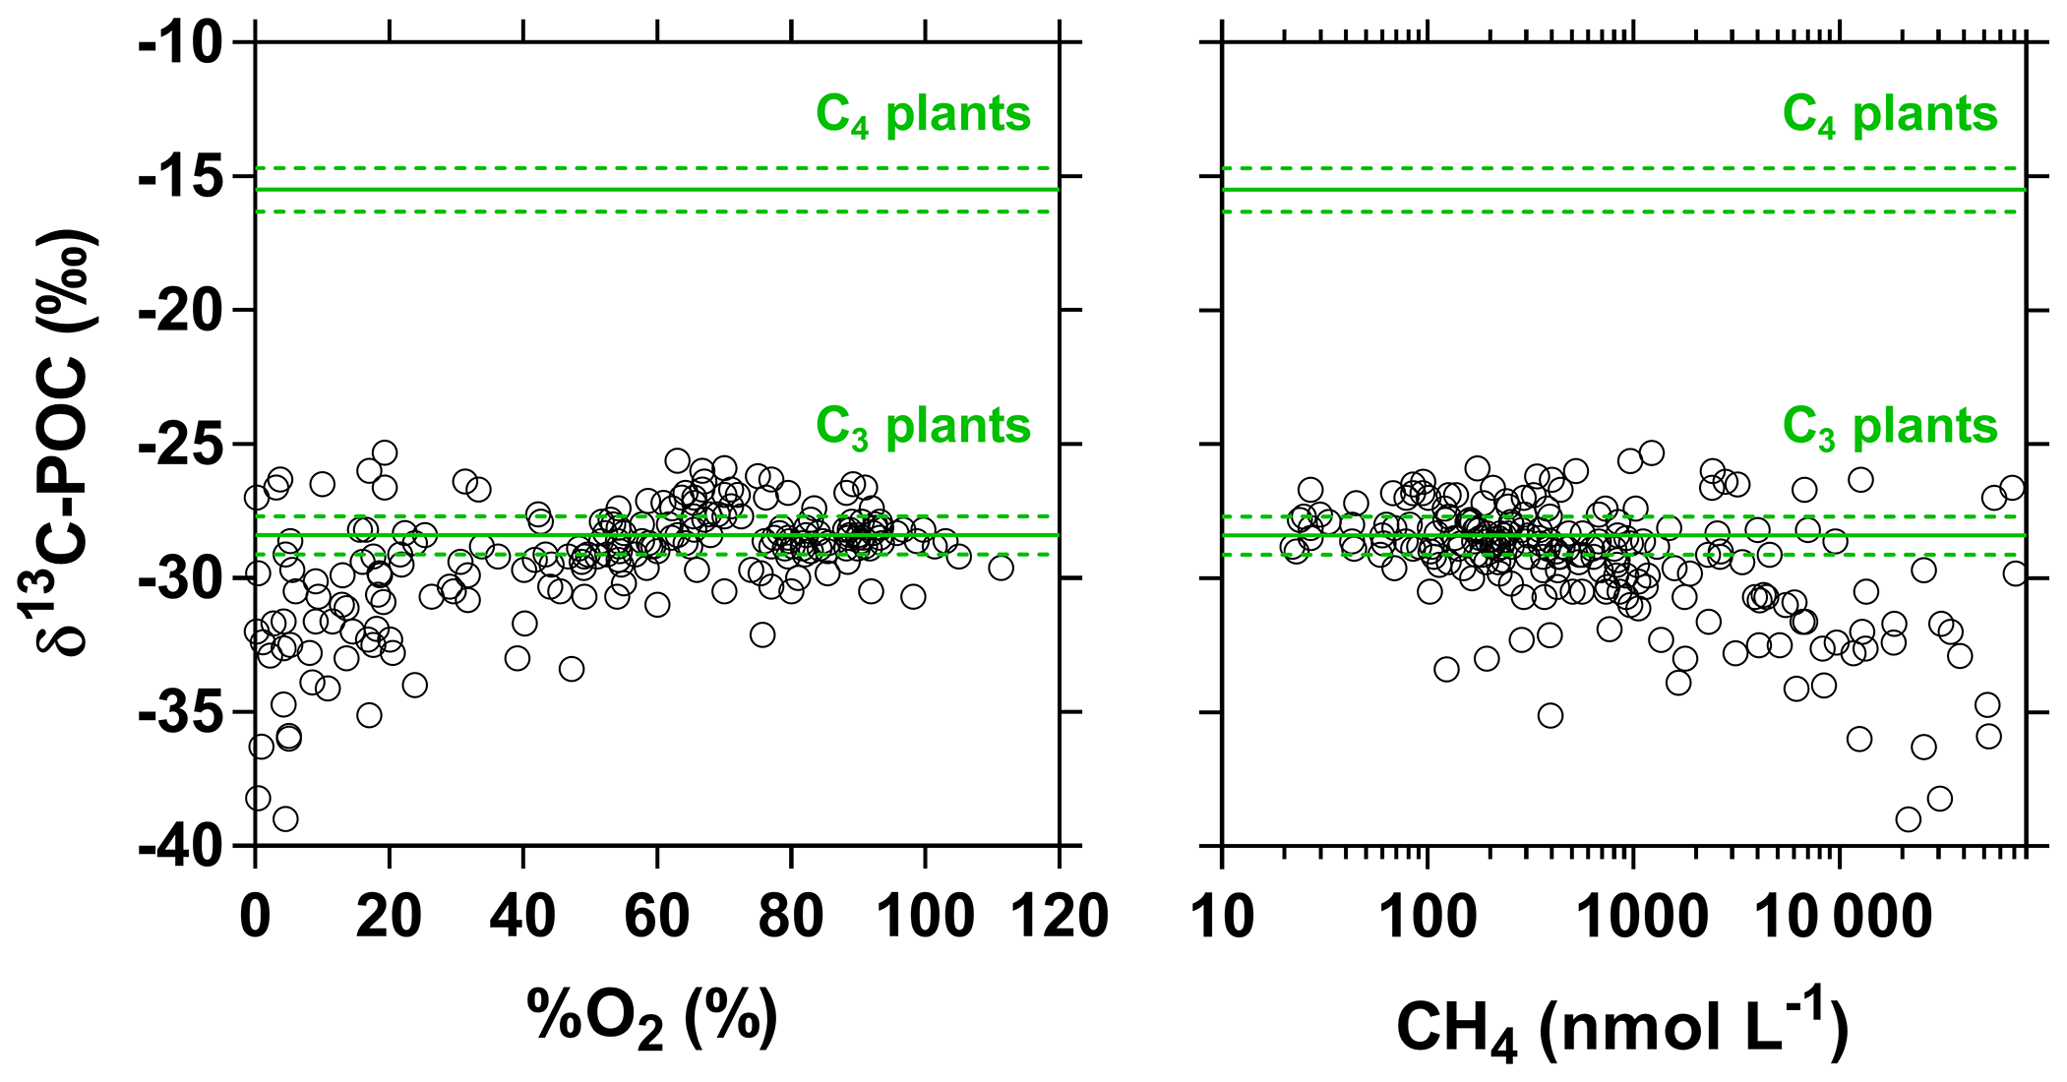
Figure 6Carbon stable isotope composition of particulate organic carbon (δ13C-POC in ‰) in surface waters of the Congo River network as a function of dissolved O2 saturation level (%O2 in %) and dissolved CH4 concentration (nmol L−1). Grey lines indicate average (full line) and standard deviation (dotted lines) of average soil organic carbon stable isotope composition with a dominance of C4 ( ‰) and C3 plants ( ‰) (Bird and Pousai, 1997). Data with δ13C-POC < −30 ‰ were associated with significantly lower %O2 and higher CH4 than data with δ13C-POC > −30 ‰ (Mann–Whitney p<0.0001 for both tests).
%N2O decreased from 198 (HW) and 139 (FW) % in Kisangani to 168 (HW) and 153 (FW) % in Kinshasa, and in most cases %N2O was lower in tributaries, on average 114±73 (HW) and 120±69 (FW) %. The undersaturation in N2O was observed in streams with high DOC, low %O2 and relatively low and is most probably related to denitrification of N2O, as also reported in the Amazon river (Richey et al., 1988) and in temperate rivers (Baulch et al., 2011). Denitrification could have occurred in river sediments or soils, although the lowest %N2O (and %O2) occurred in the CCC dominated by flooded soils in the flooded forest. Indeed, there was a general negative relationship between %N2O and %O2 (Fig. 7), with an average %N2O of 78.5±59.3 % for %O2 < 25 % and an average %N2O of 155.7±57.7 % for %O2 > 25 % (Mann–Whitney p<0.0001). The decreasing pattern of : DIN and increasing pattern of : DIN with %O2 indicated the occurrence of nitrification in oxygenated (typical of high Strahler stream order) rivers and prevalence of in the more reducing and lower oxygenated (typical of low Strahler order) streams draining the CCC in particular, where was probably also removed from the water by sedimentary or soil denitrification (Fig. 7). In addition, in black-water rivers and streams, low pH (down to 4) might have led to the inhibition of nitrification (Le et al., 2019) and also contributed higher :DIN values. Furthermore, the positive relation between %N2O and : DIN and the negative relation between %N2O and : DIN (Fig. 8) support the hypothesis of N2O removal by denitrification in O2-depleted environments (either in stream sediments or soils), while in more oxygenated rivers N2O was produced by nitrification. In the main stem of the Congo, there might, in addition, be a loop of nitrogen recycling (ammonification-nitrification) sustained by phytoplankton growth and decay that contributed to maintain oversaturation of N2O with respect to atmospheric equilibrium, as phytoplankton growth was only observed in the main stem (Descy et al., 2017). The generally low %N2O values in the Congo River network were probably due to the near pristine nature of these systems with low (2.3±1.3 µmol L−1) and (5.6±5.1 µmol L−1) levels, typical of rivers and streams draining a large fraction (∼70 %) of forests. Croplands only represented at most 17 %, on average, of the land cover of the studied river catchments where traditional agriculture is practised with little use of artificial fertilizers. This corresponds to an upper bound of cropland surface area since it was estimated aggregating the “cropland” and “mosaic cropland/vegetation” GLC 2009 categories, the latter corresponding to mixed surfaces with < 50 % of cropland. The “cropland” GLC 2009 category only accounts for 0.1 %, on average, of the land cover of the studied river catchments. Nitrogen inputs from waste water can also sustain N2O production in impacted rivers and streams (Marwick et al., 2014), but the largest cities along the Congo River main stem are of relatively modest size such as Kisangani (1 600 000 habitants) and Mbandaka (350 000 habitants), especially considering the large dilution due to the massive discharge of the main stem (sampling was done upstream of the influence of the megacity of Kinshasa with 11 900 000 habitants).
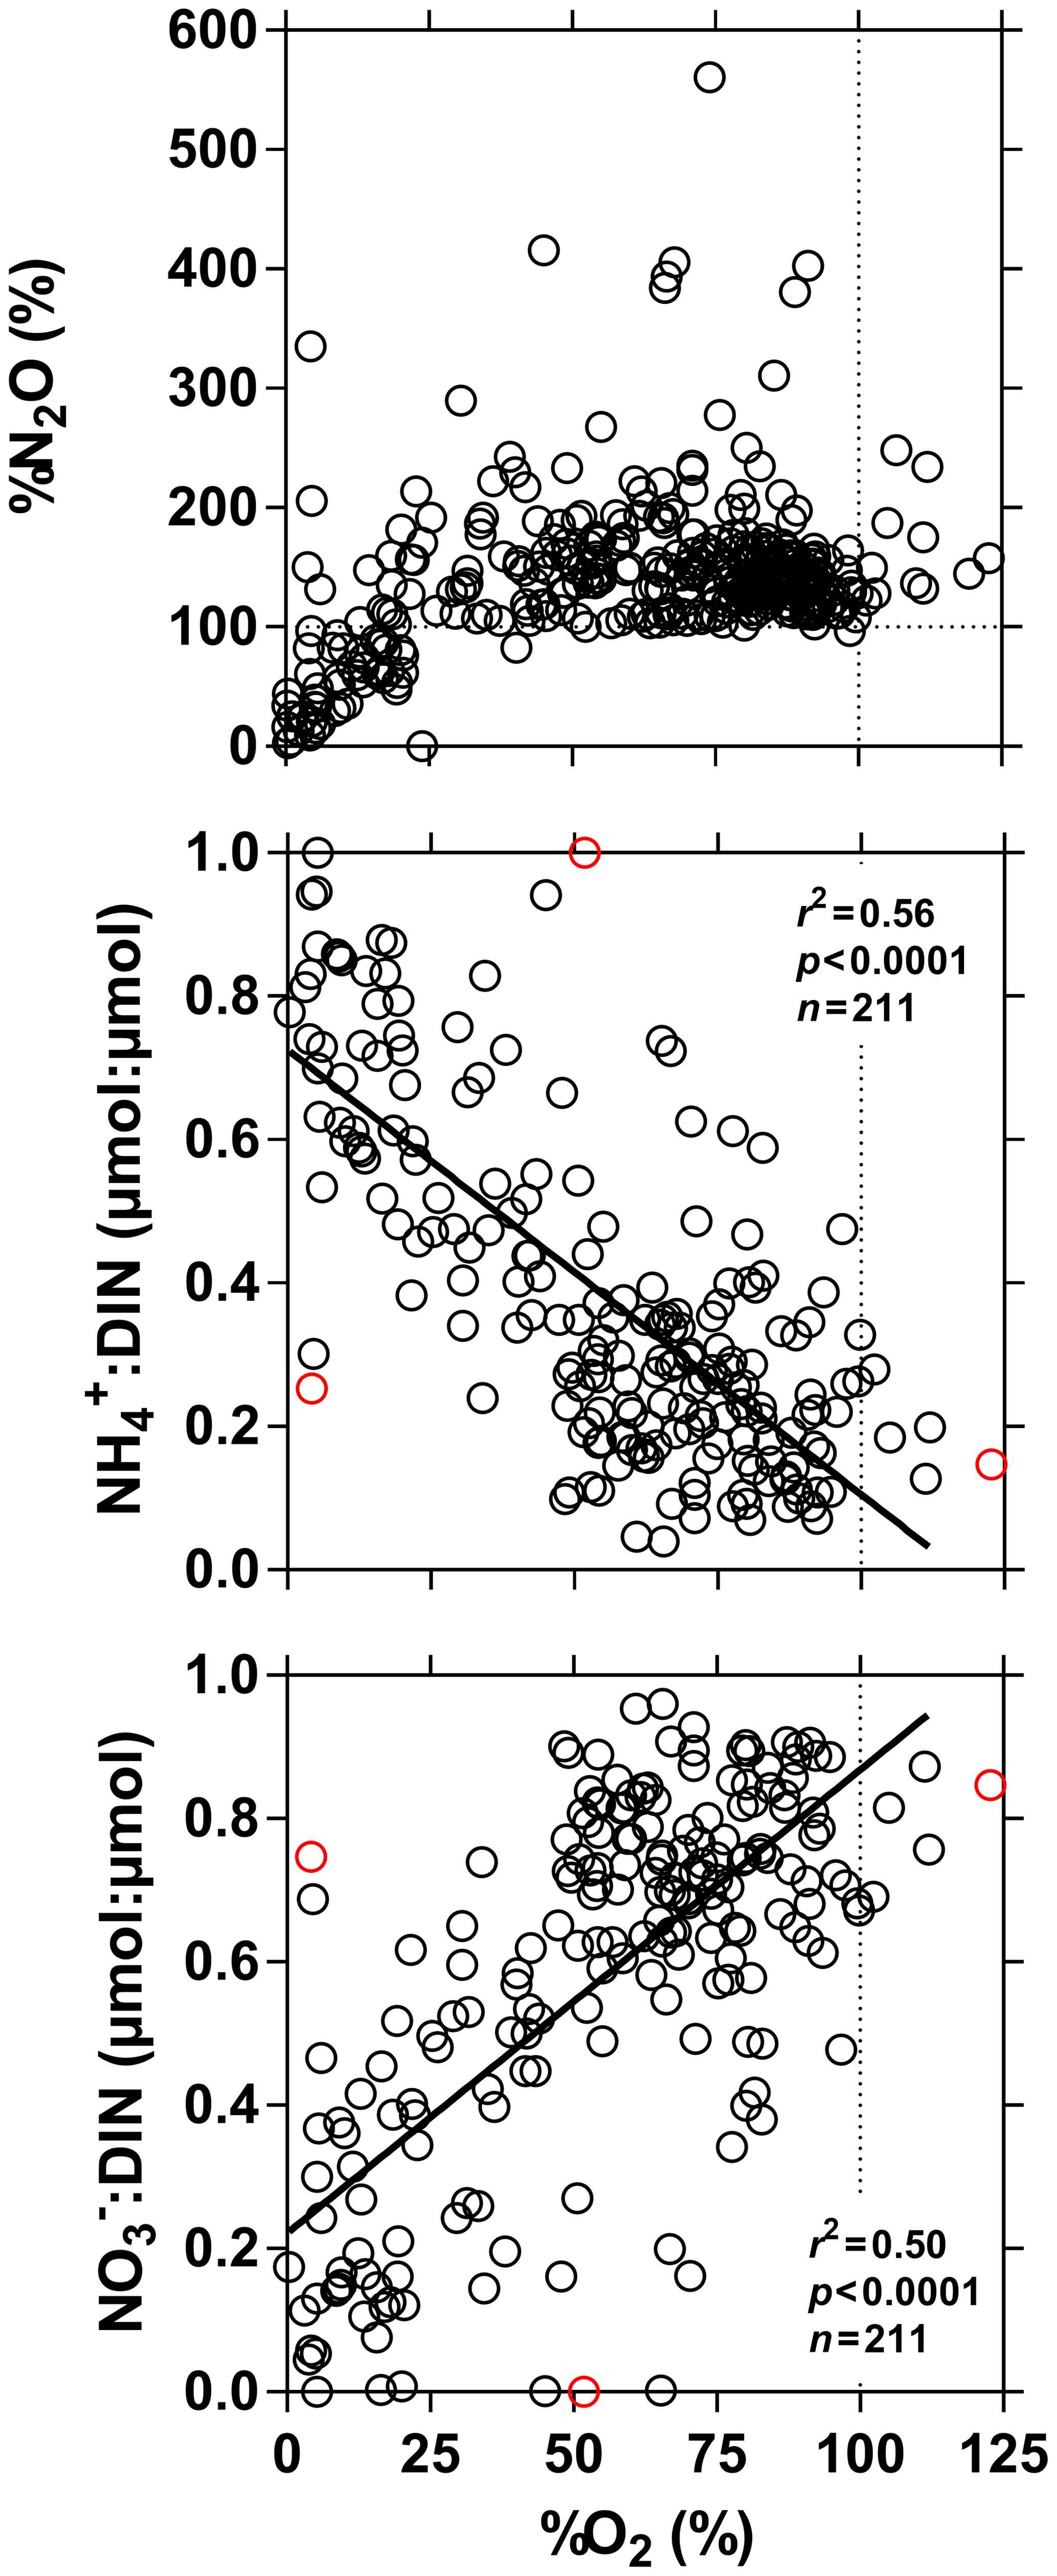
Figure 7Dissolved N2O saturation level (%N2O in %), ratio of to dissolved inorganic nitrogen (DIN = ) (µmol : µmol) and ratio of to DIN (µmol : µmol) in surface waters of the Congo River network as a function of dissolved O2 saturation level (%O2 in %). Outliers (red dots) were identified with a Cook's distance procedure and removed prior to linear regression analysis (solid line).

Figure 8Dissolved N2O saturation level (%N2O in %), as a function of the ratio of to dissolved inorganic nitrogen (DIN = ) (µmol : µmol) and of the ratio of to DIN (µmol : µmol) in surface waters of the Congo River network. Outliers (red dots) were identified with a Cook's distance procedure and removed prior to linear regression analysis (solid line).
The input of the Kwa led to distinct changes of TA, δ18O-H2O (decrease) and TSM (increase) of main stem values (comparing values upstream and downstream of the Kwa mouth) (Figs. 3–4). In the main stem, continuous measurements of pCO2, pH, %O2 and conductivity showed more variability compared to discrete samples acquired in the middle of channel, in particular in the region of CCC (Figs. 3–4). These patterns were related to gradients across the section of channel, as the boat sailed either along the mid-channel or closer to shore. The water from the tributaries flowed along the riverbanks and did not mix with main stem middle channel waters, as visible in natural color remotely sensed images (Fig. S8), leading to strong gradients across the section of main stem channel. During the June 2014 field expedition, this was investigated in more detail by a series of six transects perpendicular to the river main stem channel (Fig. 9). In the upper part (1590 km from Kinshasa), the variables showed little cross section gradients except for a decrease in conductivity towards the right bank due to inputs from the Lindi River that had distinctly lower specific conductivities (27.2 [HW] and 35.1 [FW] µS cm−1) than the main stem (48.3 [HW] and 78.9 [FW] µS cm−1). At 795 km from Kinshasa, marked gradients appeared in all variables, with the presence of black-water characteristics close to the right bank (higher pCO2 and lower %O2, pH, specific conductivity, temperature, and TSM values). This feature was related to inputs from large right-bank tributaries such as the Aruwimi and the Itimbiri (Supplement Table S1). Upstream of this section the only major left-bank tributary is the Lomami, which had white-water characteristics, relatively similar to those of the main stem (Figs. 3–4). The presence of black-water characteristics became apparent also on the left bank, from cross sections at 307 and 254 km upstream of Kinshasa, where the river is particularly wide (> 6 km wide) and received the inputs from the Ruki, the second-largest left-bank tributary (Table S1) with black-water characteristics. The cross section gradients became less marked at 203 km upstream from Kinshasa, as in this region the river becomes more narrow (2 km wide) leading to increased currents and more lateral mixing. The cross section gradients nearly disappeared at 158 km upstream of Kinshasa (and 30 km downstream of the Kwa mouth) due to homogenization by the large Kwa inputs (nearly 20 % of total freshwater discharge from the Congo River, Table S1) into a relatively narrow river section (∼1 km).
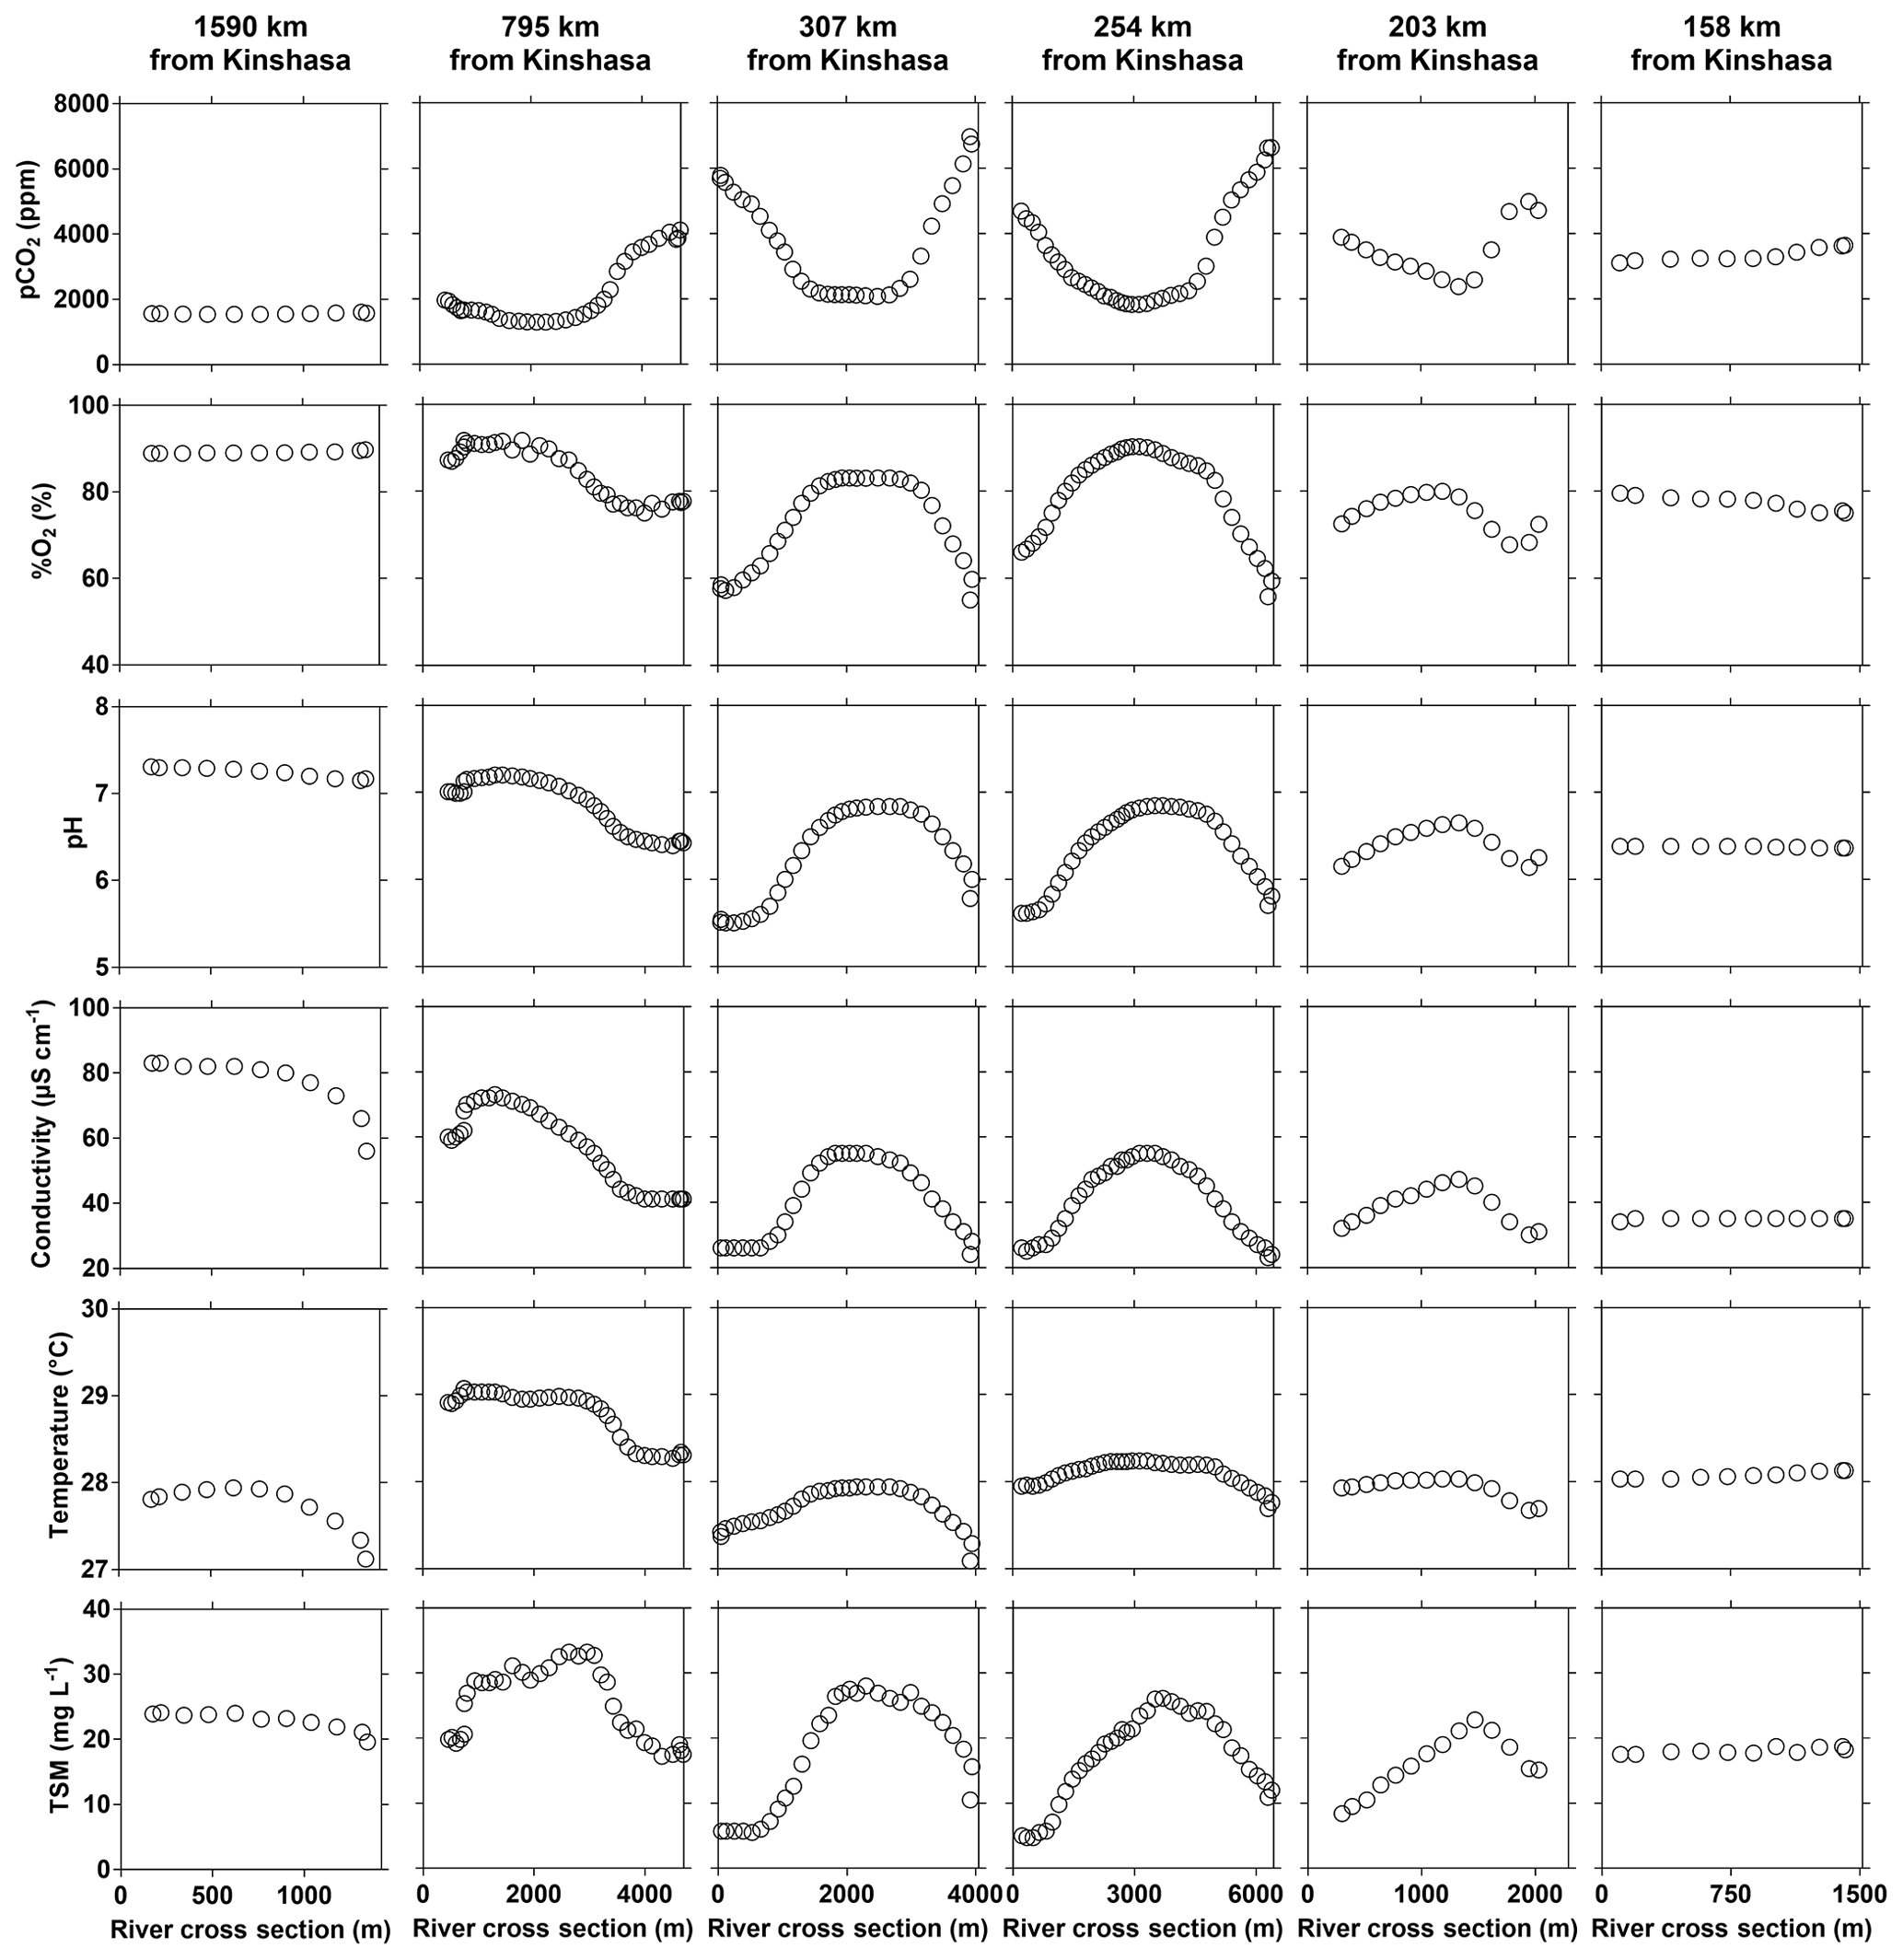
Figure 9Variations in surface water of the partial pressure of CO2 (pCO2 in ppm), dissolved oxygen saturation level (%O2 in %), pH, specific conductivity (µS cm−1), water temperature (∘C) and total suspended matter (TSM in mg L−1) along perpendicular transects to the main stem Congo River as a function of distance from the left bank (m) and at a variable distance from Kinshasa (10–30 June 2014).
3.2 Spatial variations along the Kwa transect
Spatial features of biogeochemical variables along the transect in the Kwa River network (Fig. 10) showed some similarities with two Kisangani–Kinshasa transects along the Congo main stem (Figs. 3–4). The main stem Kwa had a higher specific conductivity than the tributaries (25.1±4.2 versus 21.2±11.5 µS cm−1), higher TA (281±64 versus 119±118 µmol kg−1), higher temperatures (27.7±0.7 versus 26.3±2.2 ∘C), higher TSM (40.1±8.9 versus 15.2±35.1 mg L−1), higher pH (6.1±0.2 versus 4.5±0.7), higher %O2 (67.0±7.0 versus 37.9±26.8 %), higher δ13C-DIC ( versus ‰) and lower DOC (5.2±1.4 versus 13.0±8.5 mg L−1). Unlike the Kisangani–Kinshasa transects along the Congo main stem, the δ18O-H2O was lower in the main stem Kwa ( ‰) than in the tributaries ( ‰). Note that both the main upstream branches of the Kwa (Kasai and Sankuru) had low δ18O-H2O values. The δ18O-H2O values of the upper Kasai and Sankuru (−4.4 ‰ and −4.7 ‰, respectively) were lower than those of the Lualaba (Congo at Kisangani) (−2.2 [HW] and −1.6 [FW] ‰). This difference can be in part explained by the spatial patterns of δ18O-H2O in rainwater, as the annual averages over of river catchments are −3.1 ‰ and −4.2 ‰, for the Lualaba and the Kasai, respectively, based on the global grids of the O isotope composition of precipitation given by Bowen et al. (2005). The river δ18O-H2O was close to those of rain for the Kasai but less depleted in 18O for the Lualaba. This was probably related to the lower evapotranspiration over the catchments of the upper Kasai and Sankuru than those of Lualaba (Bultot, 1972), leading to more 18O-depleted water (e.g., Simpson and Herczeg, 1991). Additionally, the catchment of Kwa has a high fraction of unconsolidated sedimentary (41.4 %) and siliciclastic sedimentary (44.3 %) rocks than the catchment of the Lualaba that is dominated by metamorphic rocks (68.4 %). Unconsolidated sedimentary and siliciclastic sedimentary rocks are more favorable to the infiltration of water and development of aquifers that will minimize evaporation and 18O enrichment, unlike catchments dominated by metamorphic rocks. Note that the tributaries with the lowest δ18O-H2O values were situated downstream of the Kwa and upstream of Kinshasa (Figs. 3–4) and are part of the Téké Plateau. These rivers are fed by deep aquifers derived from infiltration of rain through sandy soils (Laraque et al., 1998).
Figure 10Variation in surface waters of the specific conductivity (µS cm−1), water temperature (∘C), oxygen stable isotope composition of H2O (δ18O-H2O in ‰), total suspended matter (TSM in mg L−1), total alkalinity (TA in µmol kg−1), dissolved organic carbon (DOC in mg L−1), carbon stable isotope composition of dissolved inorganic carbon (δ13C-DIC in ‰), pH, partial pressure of CO2 (pCO2 in ppm), dissolved O2 saturation level (%O2 in %), dissolved CH4 concentration (nmol L−1) and dissolved N2O saturation level (%N2O in %) as a function of the distance upstream of the Kwa mouth along a transect along the Kwa River (16 April–6 May 2015, n=7017). Grey and black symbols indicate samples from the main stem and green samples from tributaries.
Another difference with the Kisangani–Kinshasa transects along the Congo main stem relates to N2O values that were closer to saturation in the Kwa main stem (110.1±8.8 %), while surface waters oscillated from undersaturation to oversaturation in the tributaries (122.4±59.5 %). This difference could be due to variations in biogeochemical cycling or in physical settings leading to changes in k. The latter seems more likely due to the strong flow in the Kwa that probably led to high gas transfer velocities and strong degassing of N2O to the atmosphere. In the Kwa main stem, pCO2 (3473±974 ppm) and CH4 (255±150 nmol L−1) values were lower than in tributaries (8804±5108 ppm, 6783±16 479 nmol L−1). The highest pCO2 and CH4 values of the entire dataset in the Congo River network were observed in a tributary of the Fimi (22 899 ppm and 71 428 nmol L−1) that is bordered by very extensive meadows of the aquatic macrophyte Vossia cuspidata and unrelated to inputs from the shallow Lake Mai Ndombé that showed lower pCO2 and CH4 values (3,143 ppm and 250 nmol L−1, respectively).
3.3 Spatial variations as a function of stream order and as a function of the influence of the CCC
The large differences in pCO2, CH4, %O2 and %N2O (Figs. 3, 4, 10) among the various sampled tributaries of the Congo River can be analyzed in terms of size classes as given by Strahler order (Fig. 11). There were distinct patterns in CH4 and pCO2 versus Strahler order, with a decrease in the central value (median and average) for both quantities as a function of Strahler order in streams draining and not draining the CCC (Fig. 11). For nearly all the stream orders, the streams draining the CCC had significantly higher pCO2 and CH4 values than streams not draining the CCC (Fig. 11). The %O2 values per Strahler order did not show any distinct pattern (increase or decrease) in the streams not draining the CCC, but the streams draining the CCC showed an increasing pattern as a function of Strahler order. The %O2 values were significantly lower in the streams draining the CCC than those not draining the CCC (Fig. 11). For %N2O, the tendency of the central value (median and average) as a function of Strahler order did not show a clear pattern for streams not draining the CCC; however, there was a clear increasing pattern with Strahler order for streams draining the CCC. In addition, the %N2O values were significantly lower for half of the cases, in streams draining the CCC compared to those not draining it (Fig. 11).

Figure 11Box plot as a function of Strahler stream order of the partial pressure of CO2 (pCO2 in ppm), dissolved CH4 concentration (nmol L−1), dissolved N2O saturation level (%N2O in %), and dissolved O2 saturation level ( %O2 in %) for rivers and streams of the Congo River network draining and not draining the Cuvette Centrale Congolaise. The box represents the first and third quartile, the horizontal line corresponds to the median, the cross corresponds to the average, the error bars correspond to the maximum and minimum, and the symbols show all data points. A Mann–Whitney test was used to test statistical differences: ns represents not significant, = p<0.0001; = p<0.001; = p<0.01; * = p<0.05.
In US rivers, a decreasing pattern as a function of Strahler order has previously been reported for pCO2 (Butman and Raymond, 2001; Liu and Raymond, 2018). This has been interpreted as reflecting inputs of soil-water enriched in terrestrial respired CO2 that have a stronger impact in smaller and lower Strahler order systems, in particular headwater streams, followed by degassing of CO2 in higher Strahler order rivers (Hotchkiss et al., 2015), although soil-water CO2 inputs in headwater streams are seasonally variable and spatially heterogeneous (Duvert et al., 2018). Nevertheless, all of the low-Strahler-order streams we sampled were in lowlands, so the decreasing pattern of pCO2 as a function of Strahler order could alternatively reflect the stronger influence of riparian wetlands on smaller streams, rather than larger systems. The mechanism remains the same, a high ratio of lateral inputs to water volume in small streams that is related to soil-water in temperate streams such as in the US but related in addition to riparian wetlands in tropical systems such as those sampled in the Congo River network.
The influence of riparian wetlands on stream pCO2, CH4 and %N2O can be also highlighted when data were separated into rivers draining or not draining the CCC but aggregating into systems smaller or larger than Strahler order 5 to account simultaneously for the effect of stream size (Fig. 12). The pCO2 values were statistically higher in rivers draining the CCC than those not draining it, with median values more than 2-fold higher in both small and large rivers. Conversely, %O2 levels were statistically lower in rivers draining the CCC than those not draining it, with median values 11-fold and 2-fold lower in small and large rivers, respectively. Additional evidence on the influence of the connectivity of wetlands with rivers in sustaining high pCO2 and low %O2 values was provided by the positive relationship between pCO2 and flooded dense forest cover and the converse negative relationship between %O2 and flooded dense forest cover (Fig. 13). These patterns were also consistent with the positive relation between DOC concentration and flooded dense forest reported by Lambert et al. (2016). Note that aquatic macrophytes (Vossia cuspidata) also most probably strongly contributed, in addition to flooded forest, to high pCO2 and low %O2 levels, based on visual observations of dense coverage (Fig. S9), although macrophytes have not been systematically mapped and GIS data are unavailable (as for flooded dense forest).
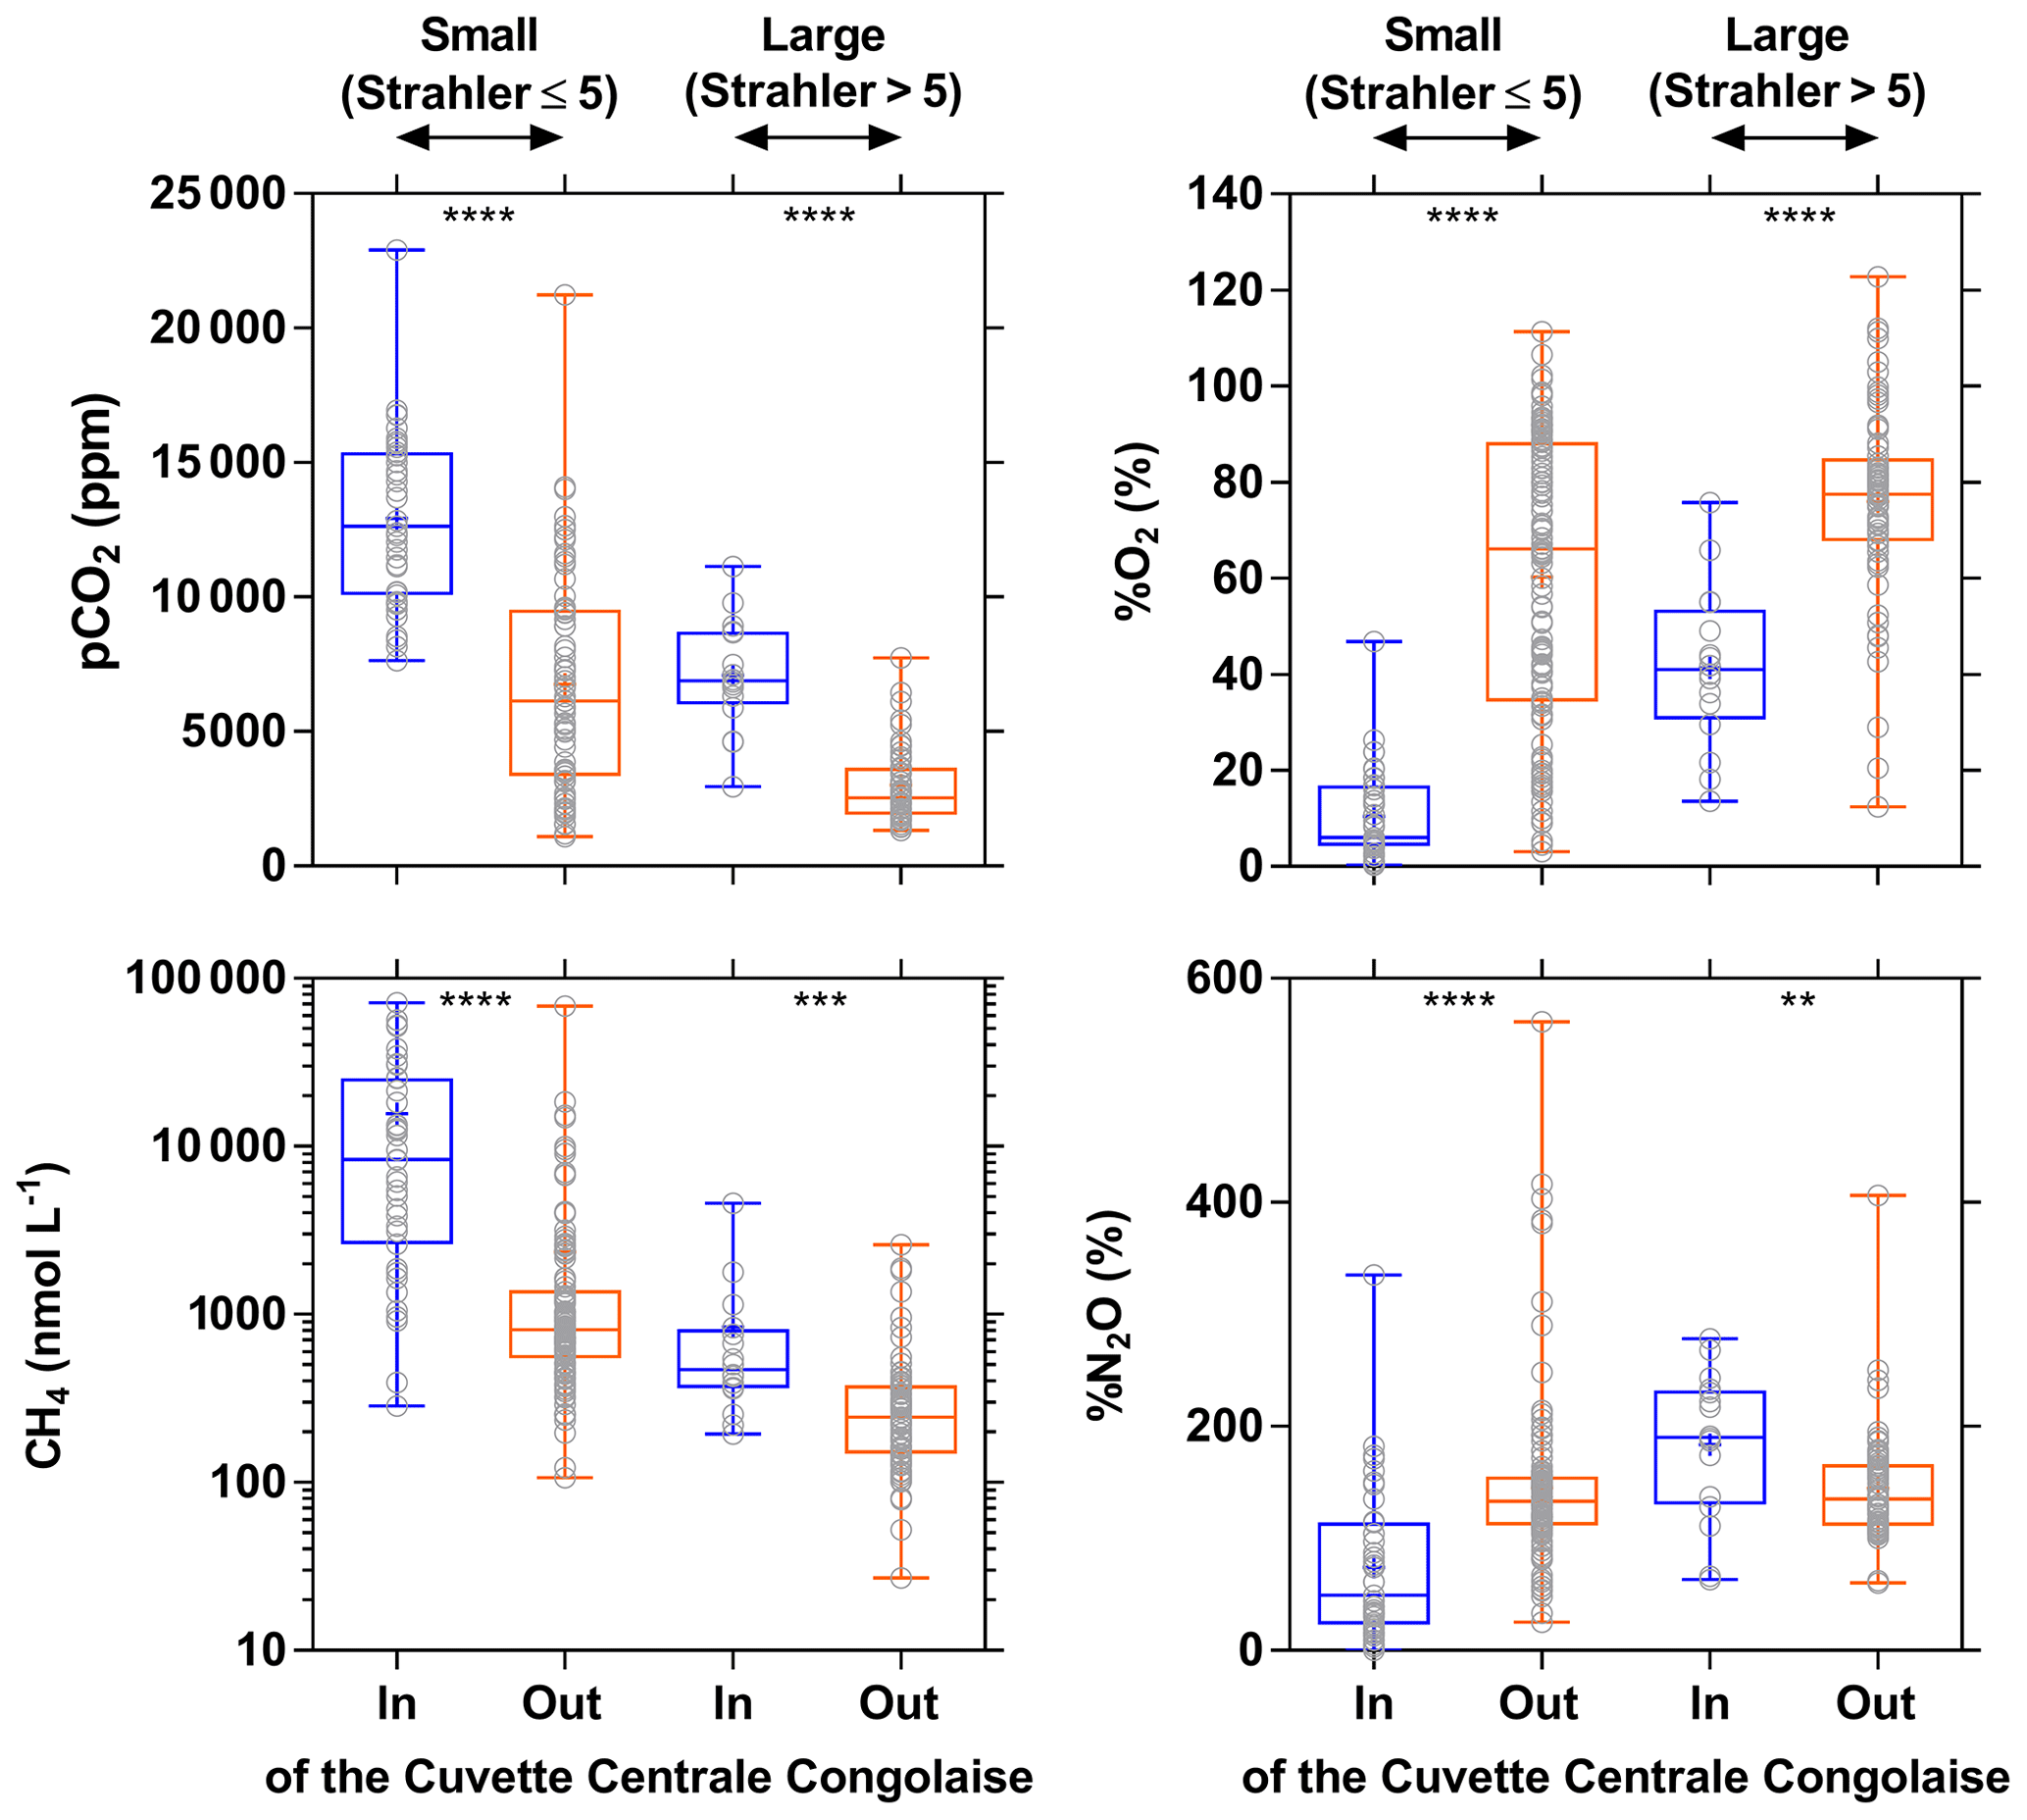
Figure 12Box plot of the partial pressure of CO2 (pCO2 in ppm), dissolved O2 saturation level (%O2 in %), dissolved CH4 concentration (nmol L−1), and dissolved N2O saturation level (%N2O in %) in surface waters of rivers and streams of the Congo river network draining and not draining the Cuvette Centrale Congolaise for small and large systems (Strahler stream order 5≤ and > 5, respectively) (3–19 December 2013; 10–30 June 2014). The box represents the first and third quartile, the horizontal line corresponds to the median, the cross corresponds to the average, the error bars correspond to the maximum and minimum, and the symbols show all data points. A Mann–Whitney test was used to test statistical differences: = p<0.0001; = p<0.001; = p<0.01.
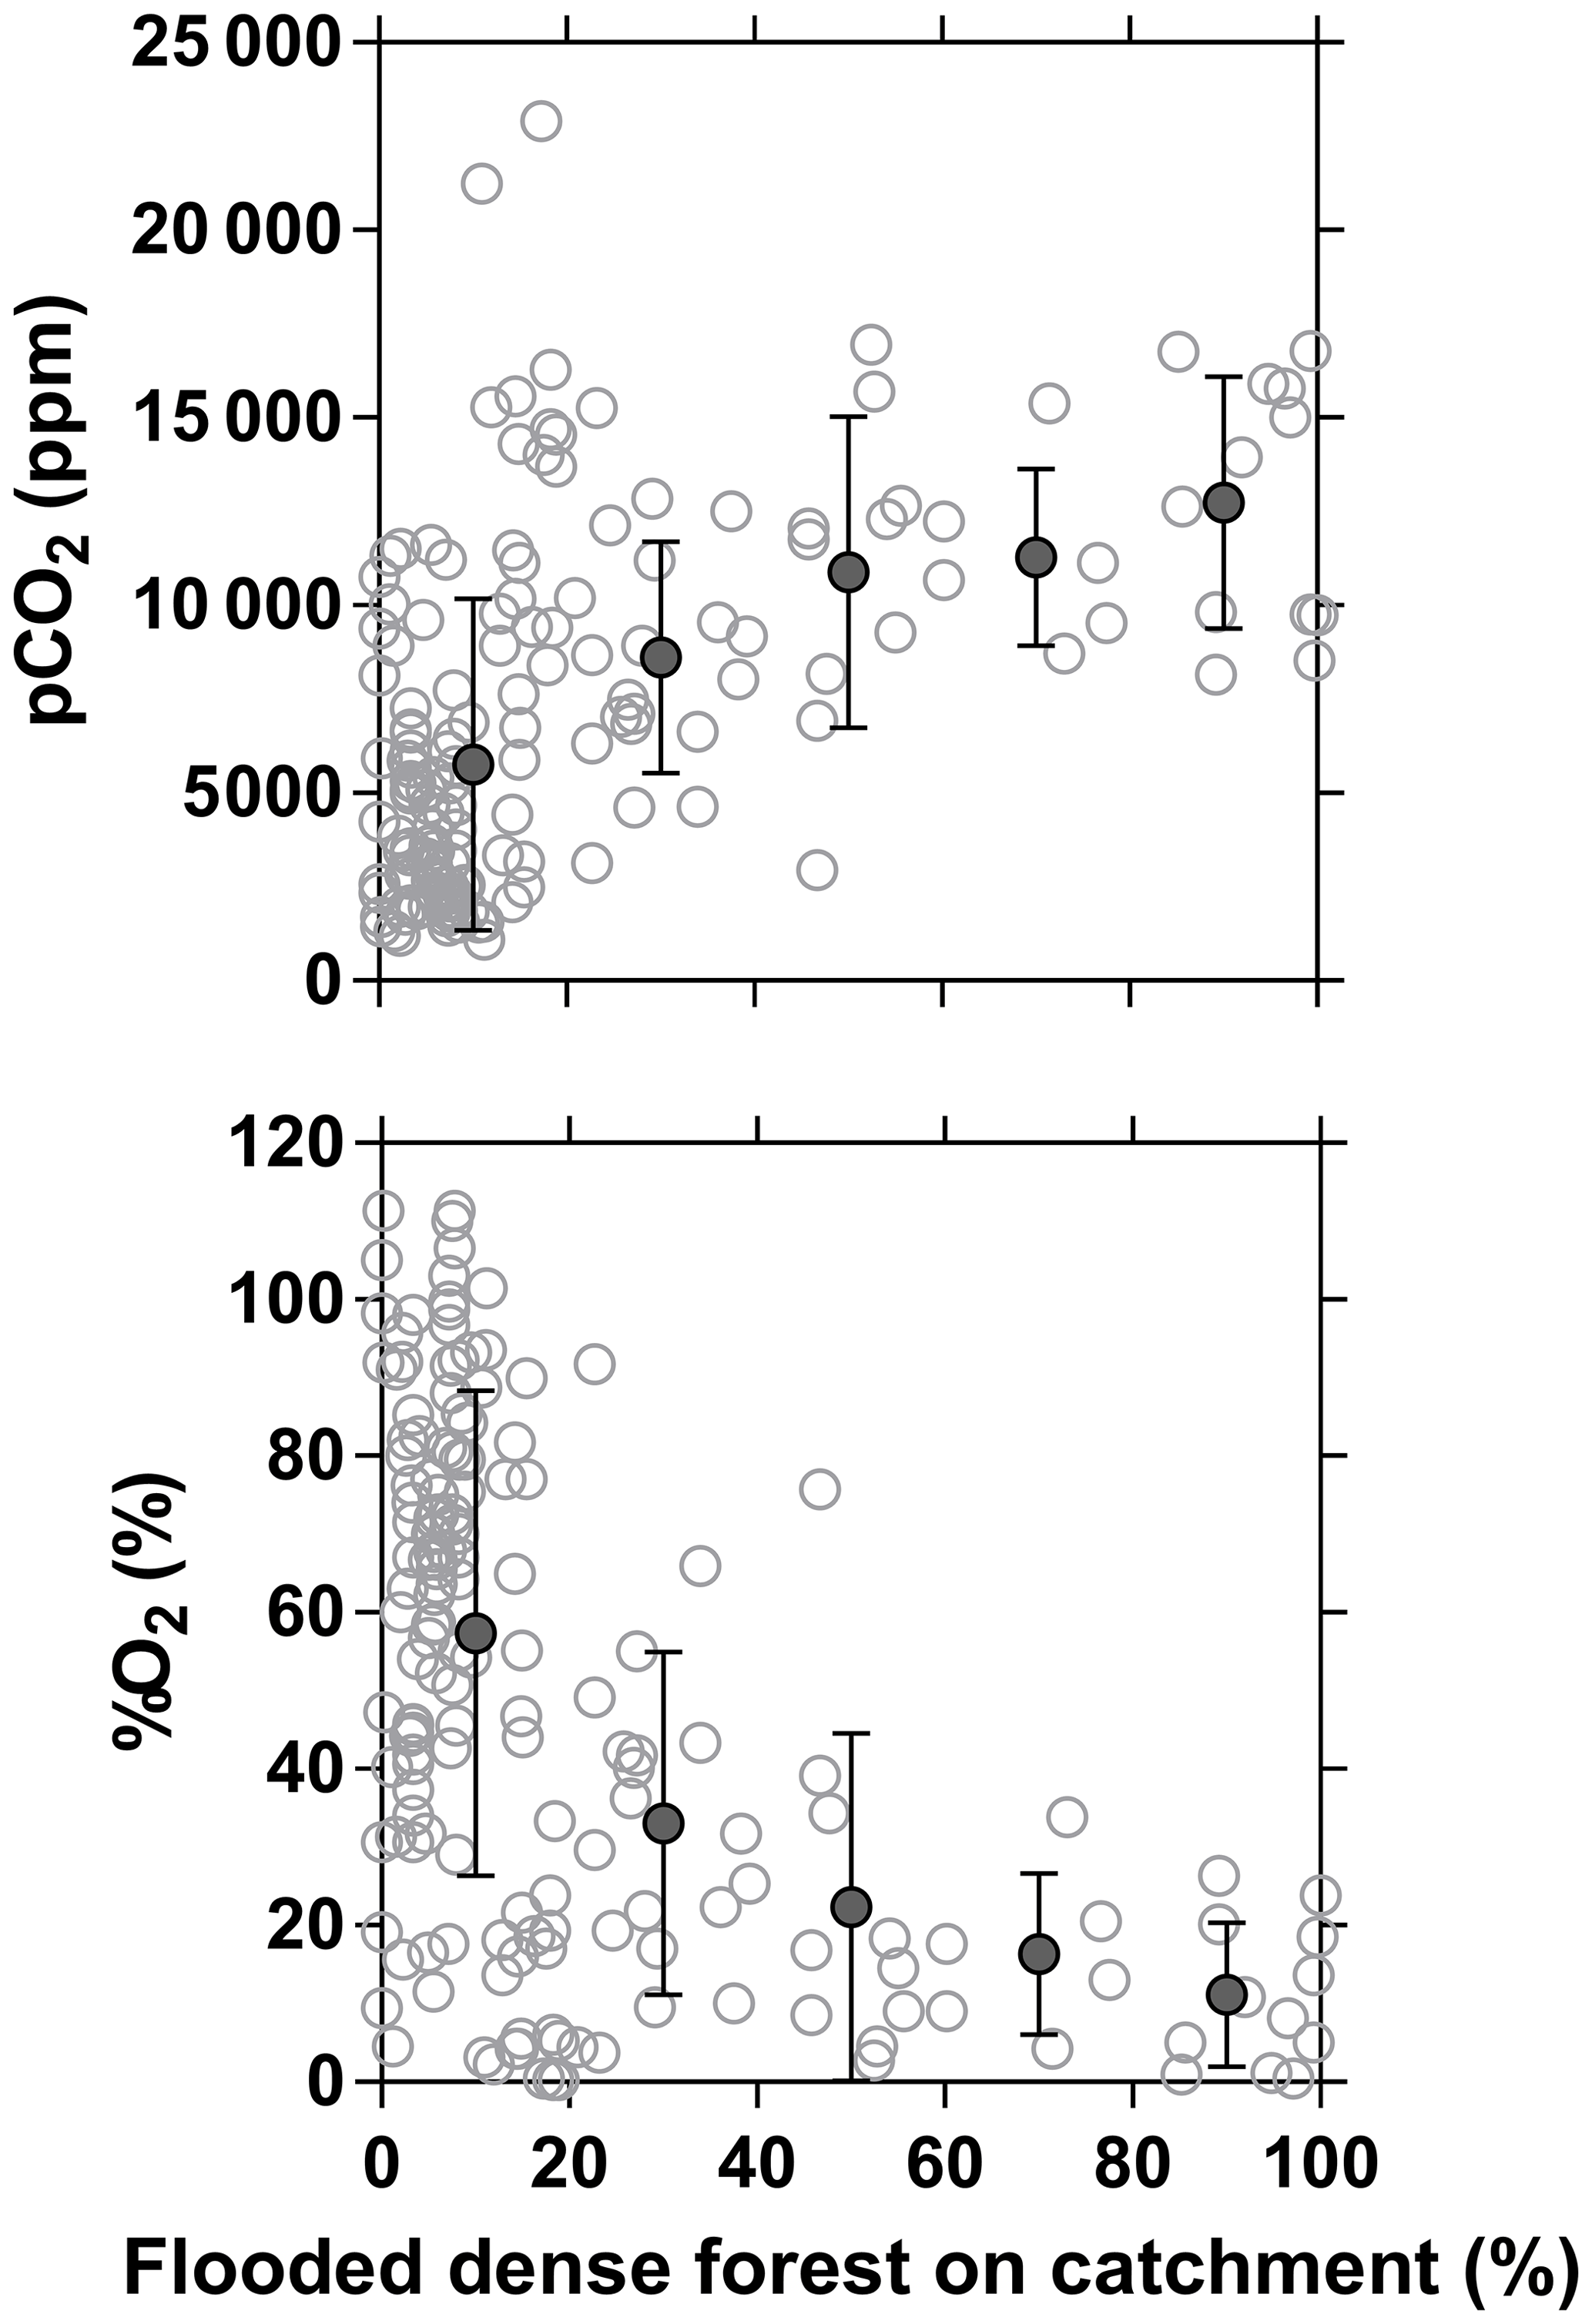
Figure 13Partial pressure of CO2 (pCO2 in ppm) and dissolved O2 saturation level (%O2 in %) in surface waters of rivers and streams of the Congo River network as a function of the flooded dense forest over the respective catchment (GLC, 2009). Grey open dots are individual data points, and black full dots are binned averages (± standard deviation) by intervals of 20 %.
Wetlands coverage had also a major importance on CH4 distribution, as the CH4 values were statistically higher in rivers draining the CCC than those not draining it (Fig. 12), with median values 10-fold and 2-fold higher in small and large rivers, respectively. %N2O was also statistically lower in rivers draining the CCC than those not draining it, with median values 2.7-fold lower in small rivers but 1.4-fold higher in large rivers. The pattern of %N2O followed the one of %O2, and the very low to null N2O values were observed in the systems draining the CCC where the lowest %O2 values (close to 0) were also observed due to sedimentary or soil organic matter degradation, leading to a decrease in O2 and N2O in surface waters (consumption of N2O by denitrification).
The CH4 : CO2 molar ratio ranged between 0.0001 and 0.1215, with a mean of 0.0097±0.018. Such ratios were distinctly higher than those typically observed in marine waters (0.0005) and in the atmosphere (0.005). The CH4 : CO2 molar ratio strongly increased with the decrease in %O2 and was significantly higher in small rivers draining the CCC (Fig. 14). These patterns were probably related to inputs of organic matter from wetlands and in particular aquatic macrophytes that lead to important organic matter transfer to sediments and high sedimentary degradation of organic matter. This led to %O2 decrease in surface waters and a large fraction of organic matter degradation by anaerobic processes compared to aerobic degradation, leading to an increase in the CH4 : CO2 ratio. The decrease in O2 and increase in CO2 in the water in presence of floating macrophytes was probably in part also related to autotrophic root respiration and not fully related to microbial heterotrophic respiration.
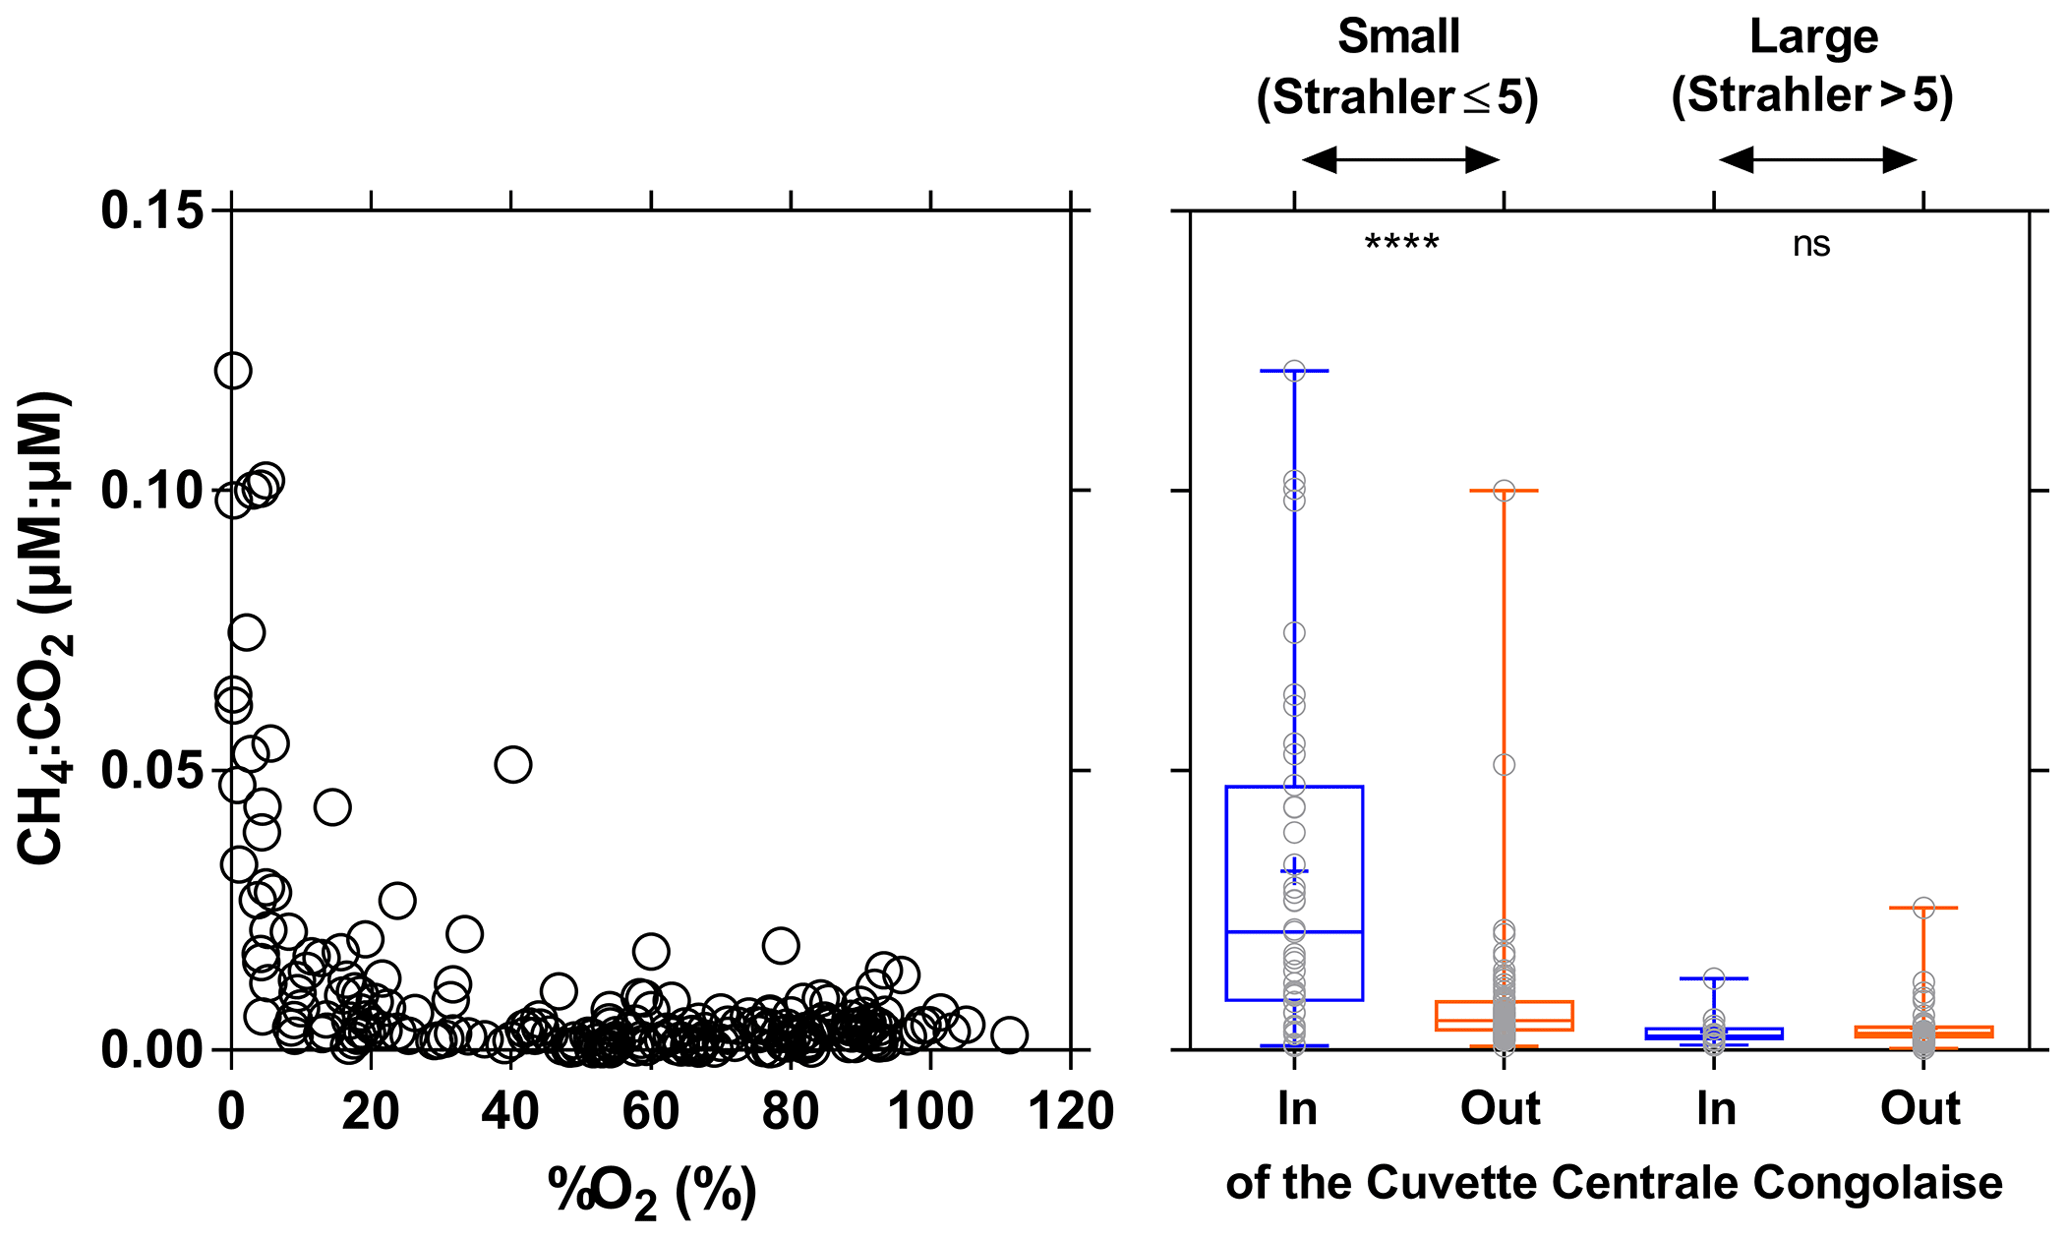
Figure 14Ratio of dissolved CH4 and CO2 concentration (µmol:µmol) plotted as a function of O2 saturation level (%O2 in %) and plotted in box plots draining and not draining the Cuvette Centrale Congolaise for small and large systems (Strahler stream order 5≤ and > 5, respectively) (3–19 December 2013; 10–30 June 2014). The box represents the first and third quartile, the horizontal line corresponds to the median, the cross corresponds to the average, the error bars correspond to the maximum and minimum, and the symbols show all data points. A Mann–Whitney test was used to test statistical differences: ns=not significant; = p<0.0001.

Figure 15Primary production (measured and modeled) (mmol m−2 d−1) as a function of community respiration (mmol m−2 d−1) and air–water CO2 fluxes (FCO2 in mmol m−2 d−1) as a function of community respiration (mmol m−2 d−1) and net community production (mmol m−2 d−1) in surface waters of rivers and streams of the Congo River network. Insets show the data on a linear scale (instead of a log–log scale).
3.4 Drivers of CO2 dynamics – metabolic measurements and daily variations in CO2
We compared the balance of depth-integrated planktonic PP to water column CR and compared it to FCO2 to test if in situ net heterotrophy was sufficient to sustain the emissions of CO2 to the atmosphere (Fig. 15), or if alternatively fluvial CO2 had a lateral origin (soils or wetlands). A detailed description of spatial and seasonal variations in PP as well as main phytoplankton communities is given by Descy et al. (2017). In brief, phytoplankton biomass was mainly confined to the main stem and was low in most tributaries. The PP values in the Congo River ranged between 0.0 and 57.5 mmol m−2 d−1 and were higher than previously reported in tropical river channels, whereas in other tropical rivers phytoplankton production mainly occurred in the floodplain lakes. This is due to generally lower TSM values in the Congo and to its relative shallowness that allows net phytoplankton growth in the mainstream unlike other deeper and more turbid tropical rivers such as the Amazon. Measured CR was lower than PP 3 out of 49 times, and on average the PP : CR ratio was 0.28. Volumetric rates of CR ranged between 0.7 and 46.6 mmol m−3 d−1, while integrated rates of CR ranged between 3.1 and 790.4 mmol m−2 d−1. CR was unrelated to TSM, POC, and Chl a but showed a positive relation with DOC after binning the data (Fig. S10). The same pattern emerged when using modeled PP, to extend the number of data points, with PP higher than CR 2 out of 169 times and a PP : CR ratio of 0.15 on average. This indicates that a generalized and strongly net heterotrophic metabolism was encountered in the sampled sites. Yet, in 174 out of 187 cases, FCO2 was higher than CR, and in 162 out of 169 cases, FCO2 was higher than net community production (NCP). CR averaged 81 mmol m−2 d−1, NCP averaged −75 mmol m−2 d−1 and the corresponding average FCO2 was 740 mmol m−2 d−1. The FCO2 : CR ratio was higher in lower-order streams than in higher-order streams, with median values ranging between 21 and 139 in stream orders 2–5 and between 3 and 17 in stream orders 6–10 (Fig. 16). This indicates a prevalence of lateral CO2 inputs either from soil-water or riparian wetlands in sustaining FCO2 in lower-order streams over higher-order streams where in-stream CO2 production from net heterotrophy is more important. These patterns are in general agreement with the conceptual framework developed by Hotchkiss et al. (2015), although lateral CO2 inputs were exclusively attributed by these authors to soil-water or ground-water inputs and riparian wetlands were not considered. These patterns are also in agreement with the results reported by Ward et al. (2018), who show that in large high-order rivers of the lower Amazon, in-stream production of CO2 from respiration is sufficient to sustain CO2 emissions to the atmosphere.
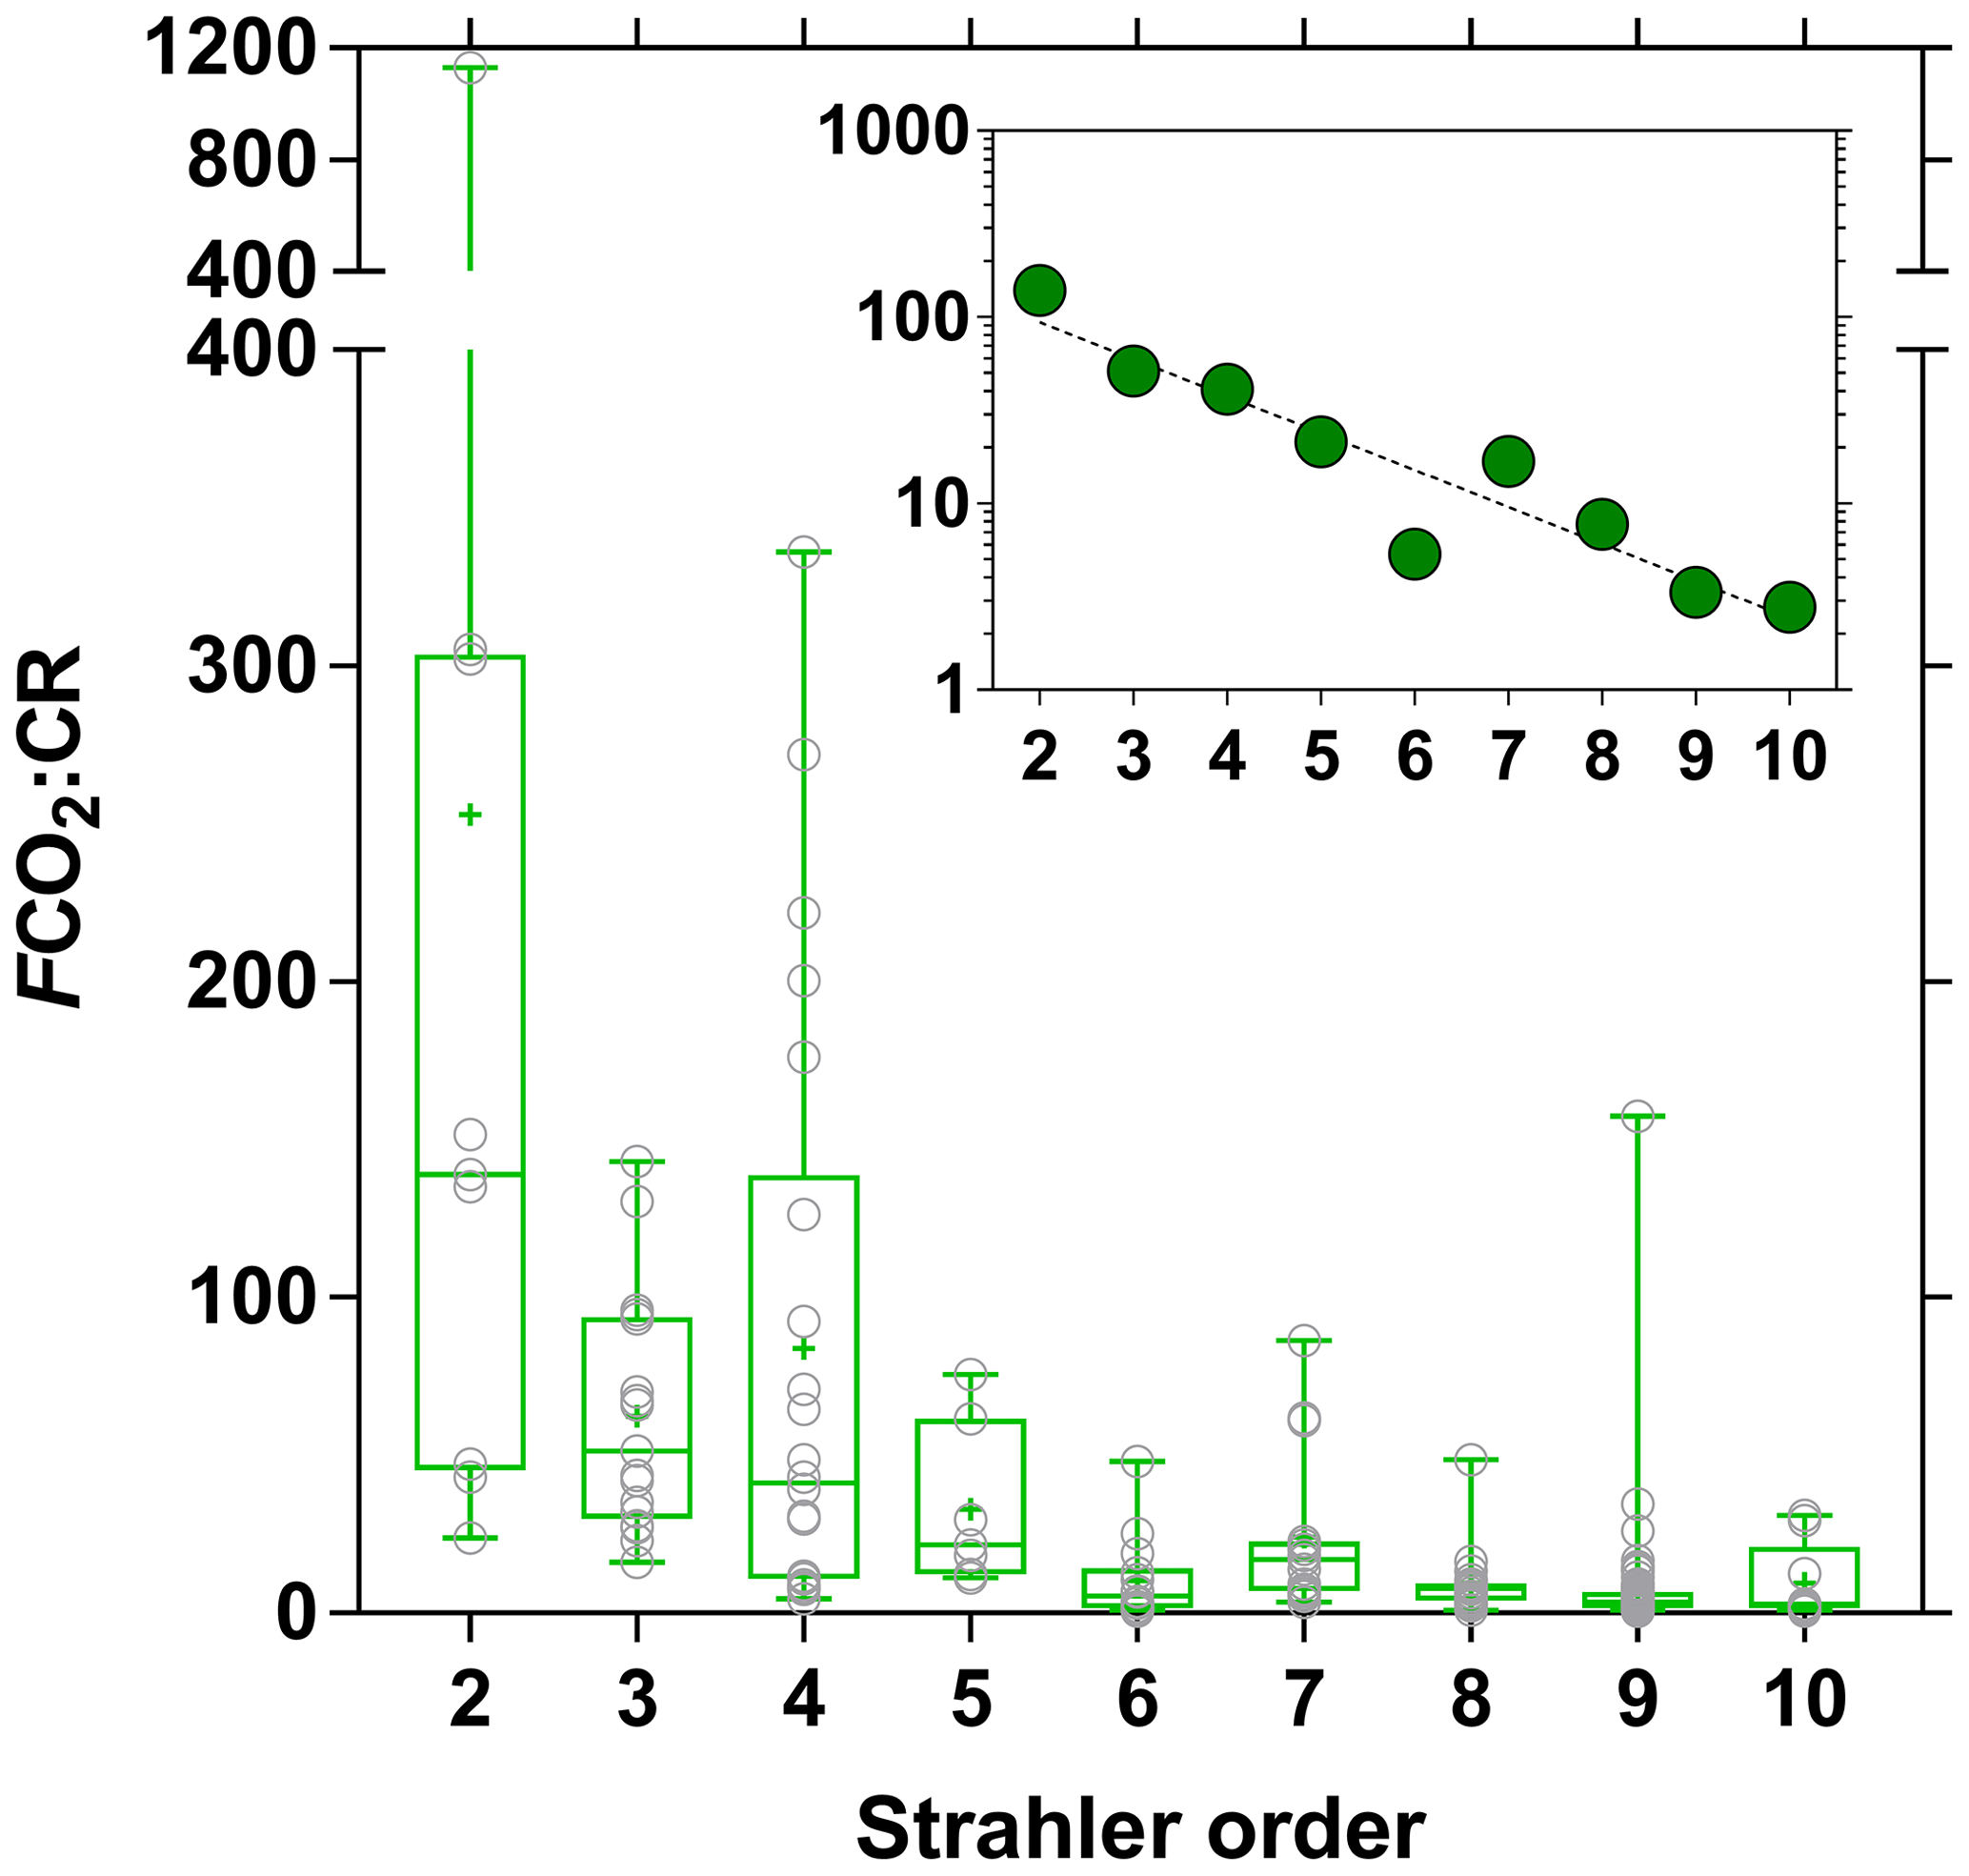
Figure 16Ratio of air–water CO2 fluxes (FCO2 in mmol m−2 d−1) and community respiration (mmol m−2 d−1) as a function of Strahler stream order for rivers and streams of the Congo River network. The box represents the first and third quartile, the horizontal line corresponds to the median, the cross corresponds to the average, the error bars correspond to the maximum and minimum, and the symbols show all data points. Inset shows on a log scale the median of FCO2 : CR and an exponential fit (r2=0.88).
CR was estimated from measurements of O2 concentration decrease in bottles that were not rotated, and this has been shown to lead to an underestimation of CR up to a factor of 2 (Richardson et al., 2013; Ward et al., 2018). The underestimation of our CR measurements due to the absence of rotation is most likely not as severe as in the Richardson et al. (2013) and Ward et al. (2018) studies, as the organic matter in our samples was mostly in dissolved form (median DOC of 8.6 mg L−1), with a low particulate load (median TSM of 14 mg L−1 and POC of 1.3 mg L−1), while the median of TSM at the sites studied by Ward et al. (2018) in the Amazon was higher (28.5 mg L−1 based on data reported by Ward et al., 2015). We acknowledge that our CR measurements might be underestimated due to bottle effects and lack of rotation up to a factor of 2 based on the studies of Richardson et al. (2013) and Ward et al. (2018); nevertheless, it seems unrealistic to envisage an underestimation of CR by a factor of 10 that would allow reconciling the CR (and NCP) estimates with those of FCO2. Although we did not measure sediment respiration, the average value reported by Cardoso et al. (2014) of 21 mmol m−2 d−1 for tropical rivers and streams does not allow accounting for the imbalance between FCO2 and NCP. This then suggests that the emission of CO2 from the Congo lowland river network is to a large extent sustained by lateral inputs rather than by in-stream production of CO2 by net heterotrophy. It remains to be determined to what extent this lateral input of CO2 is sustained by riparian wetlands or soil-groundwater from terra firme.
The low PP : CR ratio of 0.15 to 0.28 on average, and generally low PP values (on average 12 mmol m−2 d−1) were also reflected in the low diurnal variations in pCO2. We did not carry out dedicated 24 h cycles to look at the day–night variability of pCO2, due to lack of opportunity given the important navigation time to cover large distances, but we compared the data acquired at the anchoring site on shore (typically around 17:00 universal time, UT, just before dusk) with the data on the same spot the next day (typically around 04:30 UT, just after dawn) (Fig. S11). Unsurprisingly, water temperature measured just before dusk was significantly higher than just after dawn (on average 0.5 ∘C higher), while specific conductivity was not significantly different, indicating that the same water mass was sampled at dusk and dawn (Fig. S11). The pCO2 and O2 concentration measured just before dusk were not significantly different than just after dawn, showing that daily variability in these variables was low (Fig. S11). The difference between pCO2 at dusk and dawn ranged between −2307 and 1186 ppm and averaged 39 ppm (n=39). The wide range of values of the difference of pCO2 at dusk and at dawn might reflect occasional small-scale variability of pCO2, as the boat anchored for the night close to shore, frequently in close proximity to riparian vegetation. Nevertheless, the average difference is not of the expected sign (in the case of a strong diurnal change of pCO2 due to PP and CR, pCO2 should have been lower at dusk than dawn, so the difference should have been negative). This difference was also very small compared to the overall range of spatial variations in pCO2 (1087 to 22 899 ppm). Day–night variations in pCO2 have been reported in temperate headwater and low-order streams and in one lowland river with an amplitude from ∼50 to ∼700 ppm (Lynch et al., 2010; Dinsmore et al., 2013; Peter et al., 2014; Crawford et al., 2017; Reiman and Xu, 2019), although daily signals of pCO2 were not systematically observed and were absent for instance in streams covered by forest canopy (Crawford et al., 2017). In a low turbidity and very shallow low-order stream of the Tana River network, Tamooh et al. (2013) reported on one occasion day–night variation in pCO2 with an amplitude of ∼400 ppm, and in the Zambezi river, during the dry season, corresponding to very low TSM values (< 10 mg L−1), Teodoru et al. (2015) reported day–night pCO2 variation in the range of 475 ppm. In both cases, the day–night variations were also small compared to spatial variations of 300 to 5204 ppm in the Tana and 300 to 14 004 ppm in the Zambezi. In floodplain lakes of the Amazon, daily variations in pCO2 can be intense (with an amplitude up to ∼2000 ppm) during cyanobacterial blooms (Abril et al., 2013; Amaral et al., 2018) but have not been documented in the river channels of the Amazon. Our data show that in nutrient-poor and light-limited lowland tropical rivers such as the Congo River, where pelagic PP is low, day–night variations in pCO2 were negligible compared to spatial variations in pCO2. We conclude that accounting for day–night variations in pCO2 should not lead to a dramatic revision of global CO2 emissions, unlike the recent claim based on data from a lowland temperate river by Reiman and Xu (2019), given that tropical rivers account for 80 % of CO2 emissions (Raymond et al., 2013; Borges et al., 2015a, b; Lauerwald et al., 2015).
3.5 Drivers of CO2 dynamics – stable isotope composition of DIC
The stable isotope composition of DIC can provide information on the origin of CO2, although the signal depends on the combination of the biological processes that remove or add CO2 to the water column (CR and PP), rock weathering that adds , and outgassing, which removes CO2 that is 13C-depleted relative to . The variable contribution to DIC in time and in space of CO2 relative to complicates the interpretation of δ13C-DIC data. The stable isotope composition of DIC due to rock weathering will depend on the type of rock (silicate or carbonate) and on the origin of the CO2 involved in rock dissolution (either CO2 from the atmosphere or from respiration of soil organic matter). The stable isotopic composition of DIC due to the degradation of organic matter will depend in part on whether the organic matter is derived from terrestrial vegetation following the C3 photosynthetic pathway (woody plants and trees, temperate grasses; δ13C ‰) compared to the less fractionating C4 photosynthetic pathway (largely tropical and subtropical grasses; δ13C ‰) (Hedges et al., 1986; Bird et al., 1994). Spatial and temporal changes of δ13C are related to the change of the relative abundance of over CO2. The degassing of CO2 to the atmosphere and the addition of from rock weathering lead to δ13C-DIC values becoming dominated by those related to . Since CO2 is isotopically depleted relative to , CO2 degassing leads to a gradual enrichment of the remaining DIC pool (e.g., Doctor et al., 2008; Deirmendjian and Abril, 2018). The combination of these processes can lead to spatial changes of δ13C-DIC that covary with CO2 and concentrations. For instance, in the Tana River network, an altitudinal gradient of δ13C-DIC was attributed to a downstream accumulation of due to rock weathering combined to CO2 degassing (Bouillon et al., 2009; Tamooh et al., 2003). Figure 17 shows δ13C-DIC as a function of the TA : DIC ratio in the rivers and streams of the Congo, with a general increase in δ13C-DIC from TA : DIC = 0 (all of the DIC is in the form of CO2) towards TA : DIC = 1 (nearly all of the DIC is in the form of ). This pattern reflects the mixing of two distinct types of rivers and streams: the lowland systems draining the CCC with low rock weathering due to dominance of deep organic soils (low ) and high CO2 from respiration leading to TA : DIC close to 0 with low δ13C-DIC and the systems draining highland regions (Lualaba and Kasaï) with high rock weathering and lower generation of CO2 from respiration and/or higher CO2 degassing leading to TA : DIC close to 1 with high δ13C-DIC. The plots of and versus (Fig. 18) showed aggregation of data close to what would be expected for silicate rock weathering based on the average values proposed by Gaillardet et al. (1999). This is in agreement with the dominance of silicate rocks over carbonate rocks in the Congo basin (Nkounkou and Probst, 1987). Note that TA values from the Congo are generally very low compared to other large rivers globally (Meybeck, 1987), due to the large proportion of relatively insoluble rocks on the catchment (70 % of metamorphic rocks) and a small proportion of low soluble rocks such as siliciclastic sedimentary rocks (10 % mainly as sand stone), unconsolidated sediments (17 % as sand and clays) and a very small proportion of highly soluble volcanic rocks (1 %). The high TA values in the Lualaba are due to a larger proportion of volcanic rocks in high-altitude areas, such as the Virunga region, which is rich in volcanic rocks (including basalts) and has been shown to be a hotspot of chemical weathering (Balagizi et al., 2015).
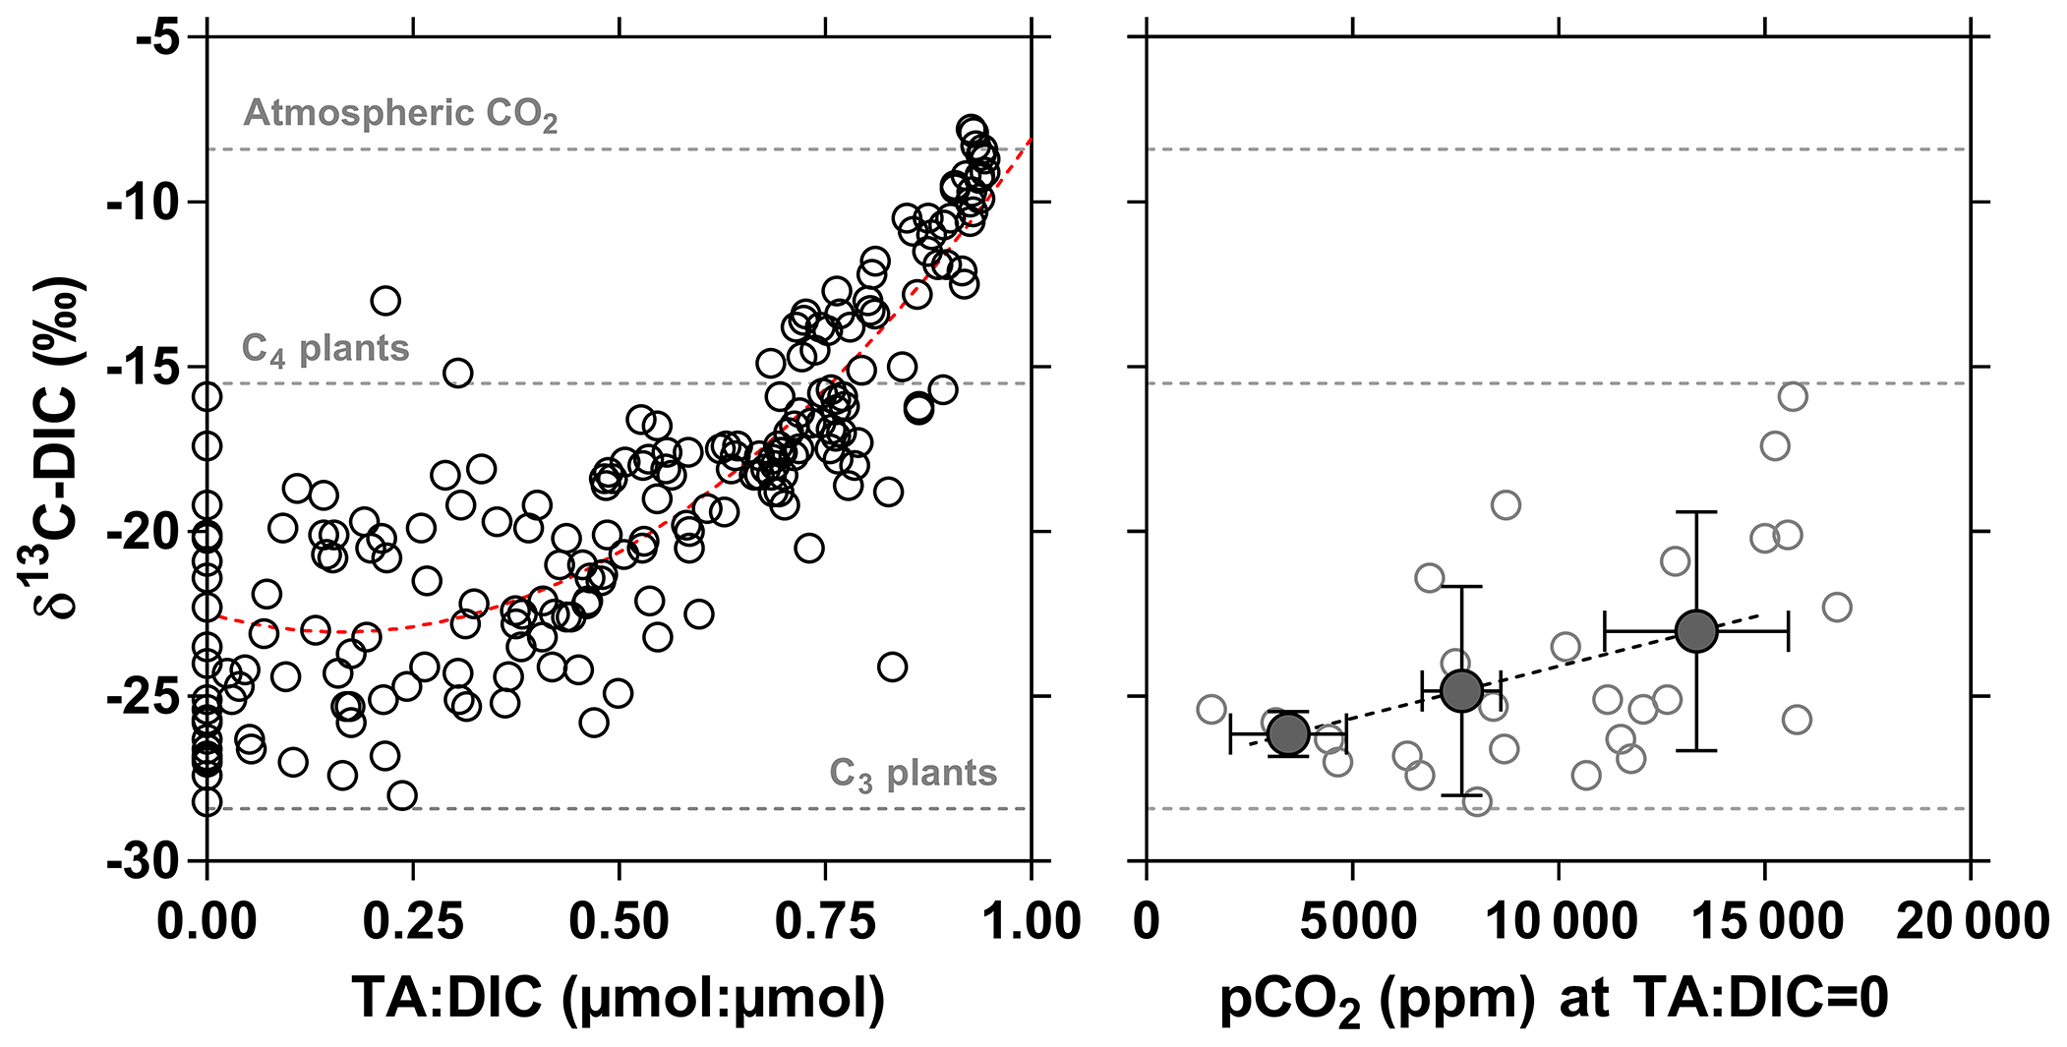
Figure 17Carbon stable isotope composition of dissolved inorganic carbon (DIC) (δ13C-DIC in ‰) as a function of the total alkalinity (TA) to DIC ratio (µmol : µmol) and as a function of the partial pressure of CO2 (pCO2 in ppm) for a TA:DIC ratio equal to zero in surface waters of rivers and streams of the Congo River network. Open dots indicate individual data points, full dots indicate binned averages (± stand deviation) (bins < 5000, 5000–10 000 and > 10 000 ppm). Horizontal dotted lines indicate the δ13C values of atmospheric CO2 and of average soil organic carbon stable isotope composition with a dominance of C4 ( ‰) and C3 plants ( ‰) (Bird and Pousai, 1997). Dotted red line provides polynomial fit (δ13C-DIC = TA : DIC (TA : DIC)2, r2=0.76).

Figure 18Total alkalinity (TA) and Mg2+ as a function of Ca2+ of the surface waters of rivers and streams of the Congo River network, in Na+ normalized plots (µmol : µmol) showing the composition fields for rivers draining different lithologies from a global compilation of the 60 largest rivers in the world (Gaillardet et al., 1999).
At TA : DIC = 0, the δ13C-DIC values are exclusively related to those of CO2 and might be indicative of the source of mineralized organic matter. The δ13C-DIC values ranged between −28.2 ‰ and −15.9 ‰ and averaged −24.1 ‰ (Fig. 17) indicating that CO2 was produced from the degradation of mixture of organic matter from C3 and C4 origin. Furthermore, δ13C-DIC was positively related to pCO2 (Fig. 17), indicating that in the streams with high pCO2 values, the CO2 was generated from the degradation organic matter with a higher contribution from C4 plants. The δ13C-DIC values were unrelated to the contribution of C4 vegetation on the catchment (terra firme), as modeled by Still and Powell (2010), and the cover by savannah on the catchment given by GLC2009 (Fig. S12). Further, the most enriched δ13C-DIC values (> −21 ‰), corresponded on average to a low contribution of C4 vegetation on the catchment (7.4 %) and low contribution of savannah cover on the catchment (0.8 %). These patterns are inconsistent with an origin from terra firme of the C4 material that led to high pCO2 in streams (Fig. 17) but is rather more consistent with a larger contribution of degradation of C4 aquatic macrophyte material in high CO2 streams.
3.6 Seasonal variations
The difference between the HW and FW in the main stem along the Kisangani–Kinshasa transects (Figs. 3 and 4) were relatively modest with higher specific conductivity, TA, δ13C-DIC, and TSM (at Kisangani); biogeochemical signatures of higher surface run-off during the HW sampling (December 2013); and water flows from deeper soil horizons (or ground-water) during the FW sampling (June 2014). The comparison of tributaries that were sampled during both HW and FW periods along the Kisangani–Kinshasa transects shows that pCO2 was significantly higher (Wilcoxon match-pairs signed rank test p=0.078) during HW for large systems (freshwater discharge ≥300 m3 s−1, Table S1) but not significantly different for small systems (freshwater discharge < 300 m3 s−1), irrespective of whether it was from the left or right bank (Fig. 19). However, no significant differences among the HW and FW periods occurred in %O2, CH4 and %N2O for either small of large systems, irrespective of whether they were taken from the left or right bank (Fig. 19). This indicates that across the basin, spatial differences among tributaries are more important than seasonal variations within a given tributary. The average difference for large rivers between HW and FW was on average only 1745 ppm for pCO2 when the respective range of variation for the whole dataset was from 1087 to 22 899 ppm.

Figure 19Comparison of the partial pressure of CO2 (pCO2 in ppm), dissolved CH4 concentration (nmol L−1), dissolved O2 saturation level (%O2 in %), and dissolved N2O saturation level (%N2O in %) in surface waters of the Congo River tributaries sampled during both high water (3–19 December 2013) and falling water periods (10–30 June 2014). Tributaries were separated into left and right bank, as well as into large and small systems, with a freshwater discharge (Q) <and ≥300 m3 s−1, respectively.
Yearly cycles of CH4 and N2O were established on the Lualaba (6 years), the Oubangui (2 years) and the Kasaï (2 years) (Figs. 20 and 21), while pCO2 is only available during 2 years in the Lualaba. In the Oubangui and the Kasaï, CH4 concentration peaked with the onset of rising water and decreased as water level continued to increase. The decrease in CH4 as discharge peaked in the Oubangui and the Kasaï is most probably related to dilution by surface runoff, as also testified by the decrease in specific conductivity and TA (not shown). The increase at the onset of rising water could be related to initial flushing of soil atmosphere enriched in CH4 as rain penetrates superficial layers of soils. In the Lualaba the CH4 seasonal variations seem to follow more closely those of freshwater discharge (for instance in 2014). Unlike the Kasaï and the Oubangui, the Lualaba has very extensive permanent marshes and swamps such as the Upemba wetland system (inundated area of 18 000 km2) and the Luama swamps (inundated area of 6000 km2) (Hughes and Hughes, 1992). Yet, it remains to be determined if the seasonality of CH4 observed in Lualaba can be attributed to higher inputs during high water from these major wetlands located, respectively, 1000 and 600 km upstream of Kisangani. Even so, there are numerous more modest marshes and swamps that border upstream tributaries of the Lualaba closer to Kisangani (Hughes and Hughes, 1992). The seasonal amplitude of dissolved CH4 in the Oubangui was about 10 times higher than in the Kasaï and the Oubangui, and the seasonal amplitude of CH4 in these three rivers seemed to be related to the relative seasonal amplitude of freshwater discharge, as indicated by the positive relation with the ratio of maximum and minimum of freshwater discharge (Fig. 22).
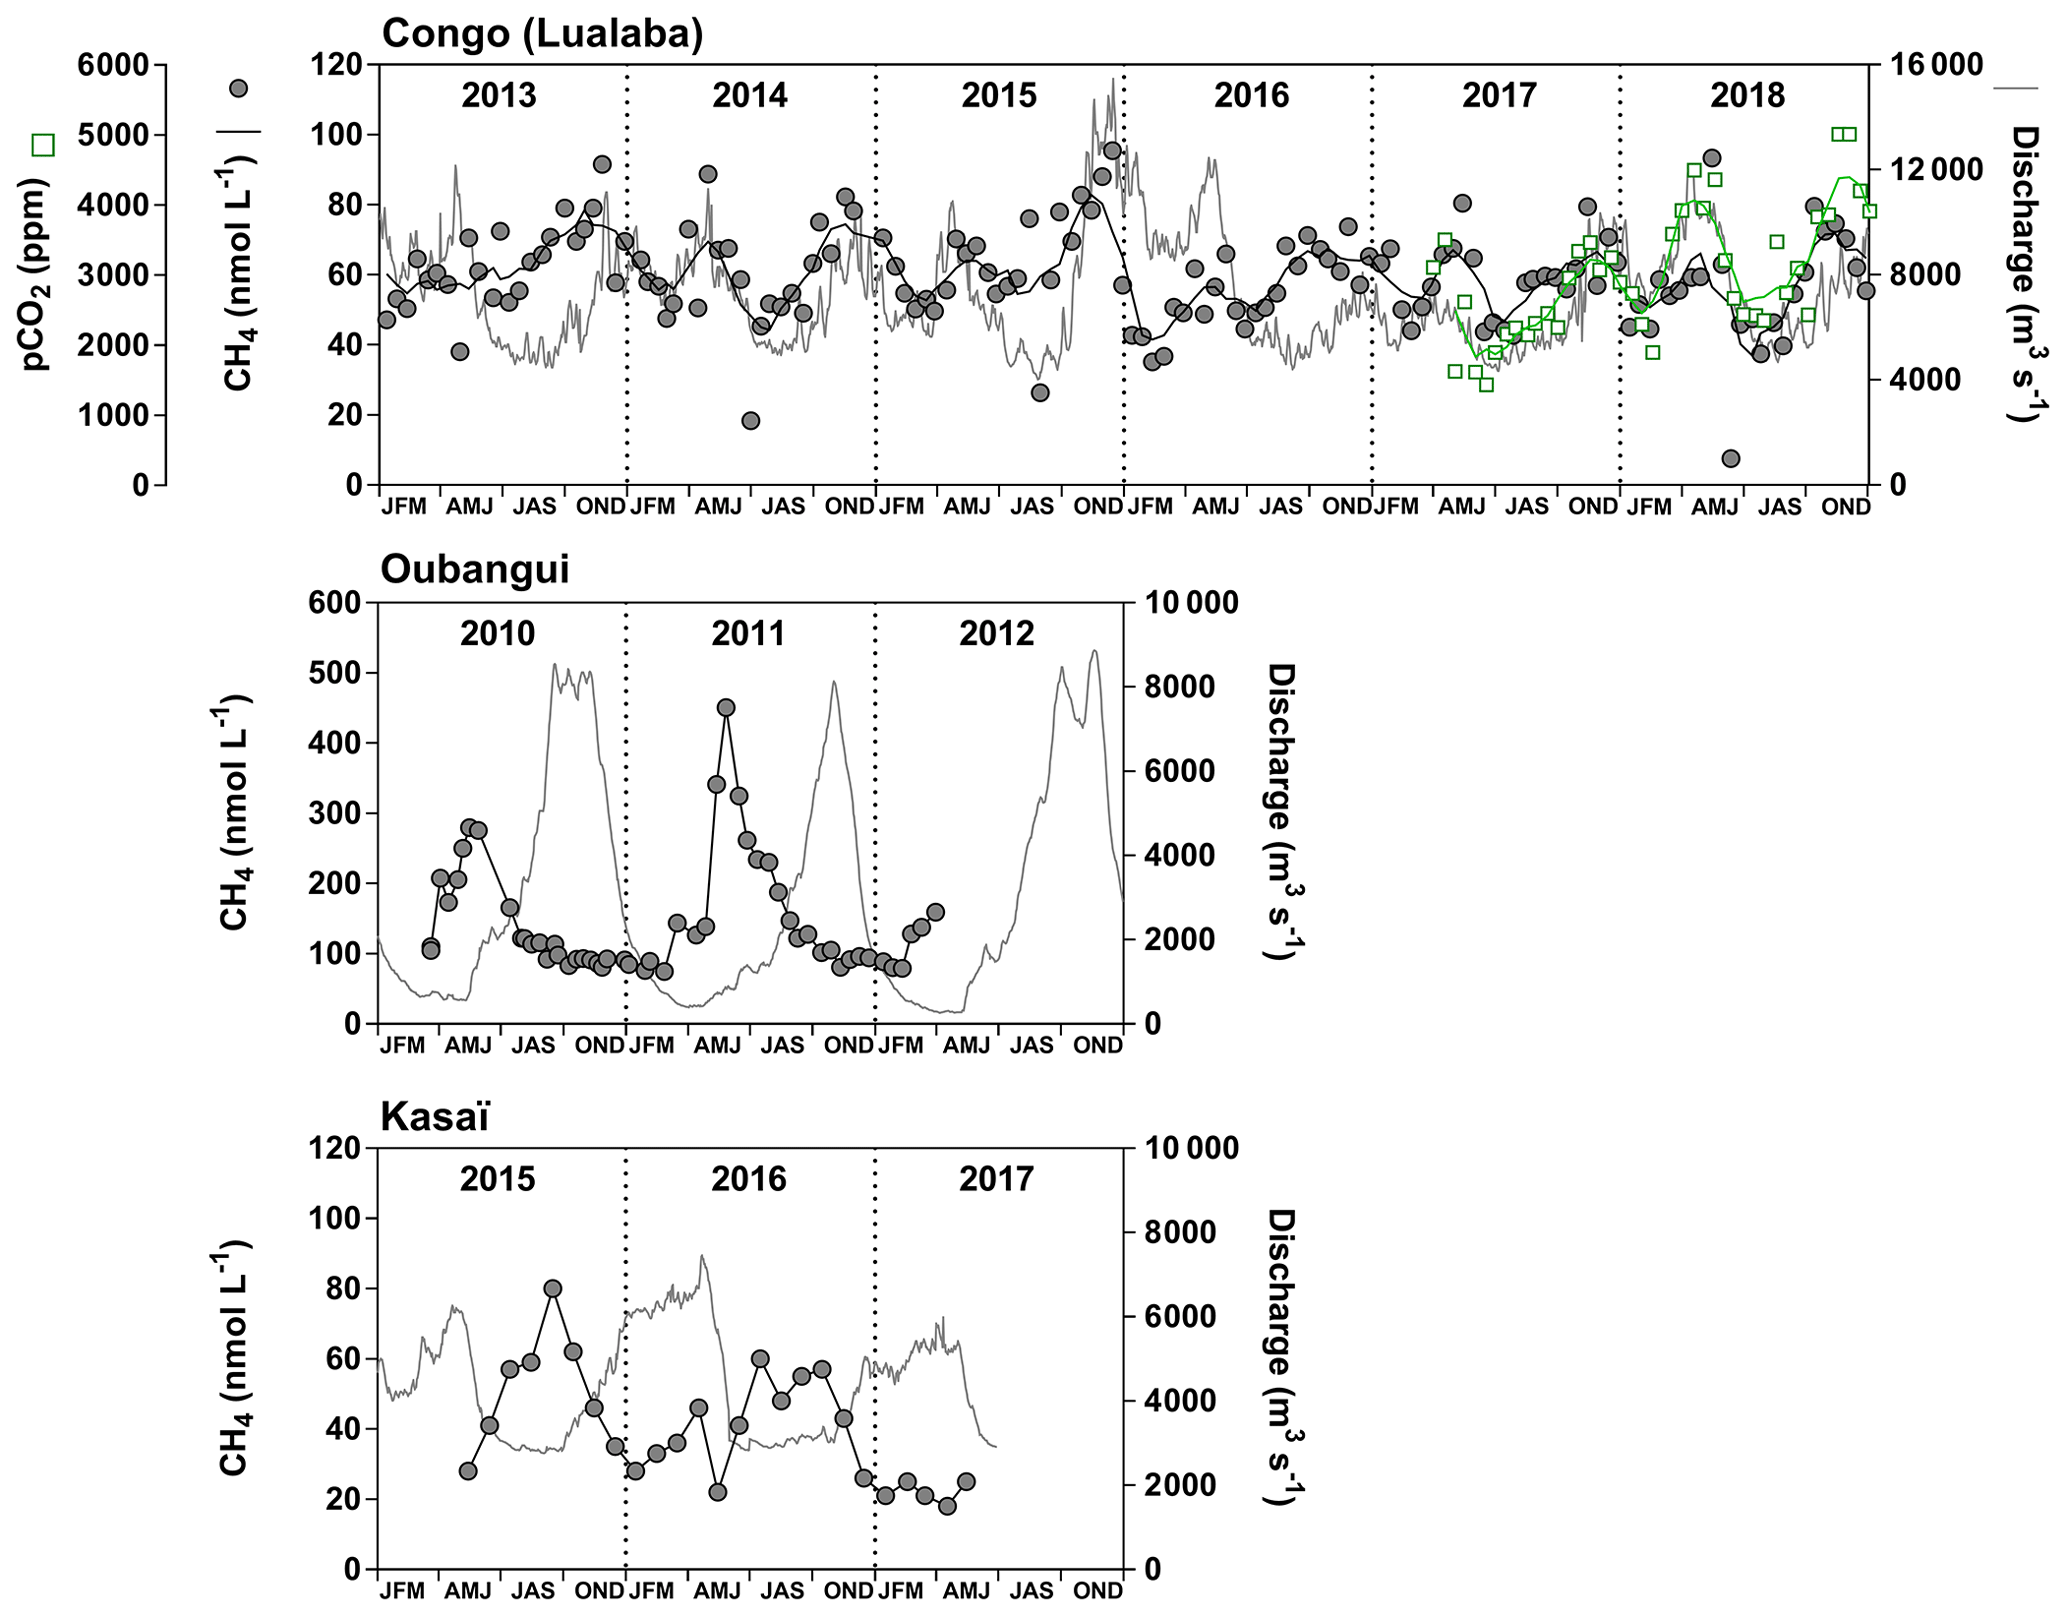
Figure 20Time series of dissolved CH4 concentration (nmol L−1) in surface waters and freshwater discharge (grey line) in the Congo (at Kisangani, 2013–2018), the Oubangui (at Bangui, 2010–2012) and the Kasaï (at Dima, 2015–2017) rivers. The black line shows a five sample running average. Time series of the partial pressure of CO2 (pCO2 in ppm) in surface waters was also obtained in the Congo River (at Kisangani, 2017–2018). Data in the Oubangui were previously reported by Bouillon et al. (2012, 2013).
The seasonal cycles of %N2O show patterns that were consistent with those CH4, with a loose parallelism of %N2O and discharge in the Lualaba, an inverse relation in the Kasaï, and peak of %N2O during rising waters (although delayed with respect to the CH4 peak) in the Oubangui. In addition to the seasonal cycle there seemed to be a longer-term decrease in the annual average of N2O in the Lualaba (Fig. S13). There were no significant long-term changes of the annual average of other variables such as POC and PN (not shown). So the observed decrease in annual N2O is probably unrelated to changes in terrestrial productivity (Zhou et al., 2014) or nitrogen content of terrestrial vegetation (Craine et al., 2018) that act at longer timescales (several decades) and seem to be related to long-term changes in climate (precipitation). Freshwater discharge showed an increasing pattern during the time period (Fig. S13). An increasing discharge could lead to increased gas transfer velocities and a loss of N2O to the atmosphere. Water temperature in the Congo River is already close to the optimum of denitrification (∼27 ∘C, Canion et al., 2014), so an enhancement of denitrification with increase in temperature is unlikely. Water temperature did not show a clear pattern, but freshwater discharge increased during the 2013–2018 period, excluding the year 2017. It is likely that the decreasing trend in N2O during the 2013–2018 period is a transient feature in response to inter-annual fluctuations in hydrology that led to a period of sustained increase in freshwater discharge.
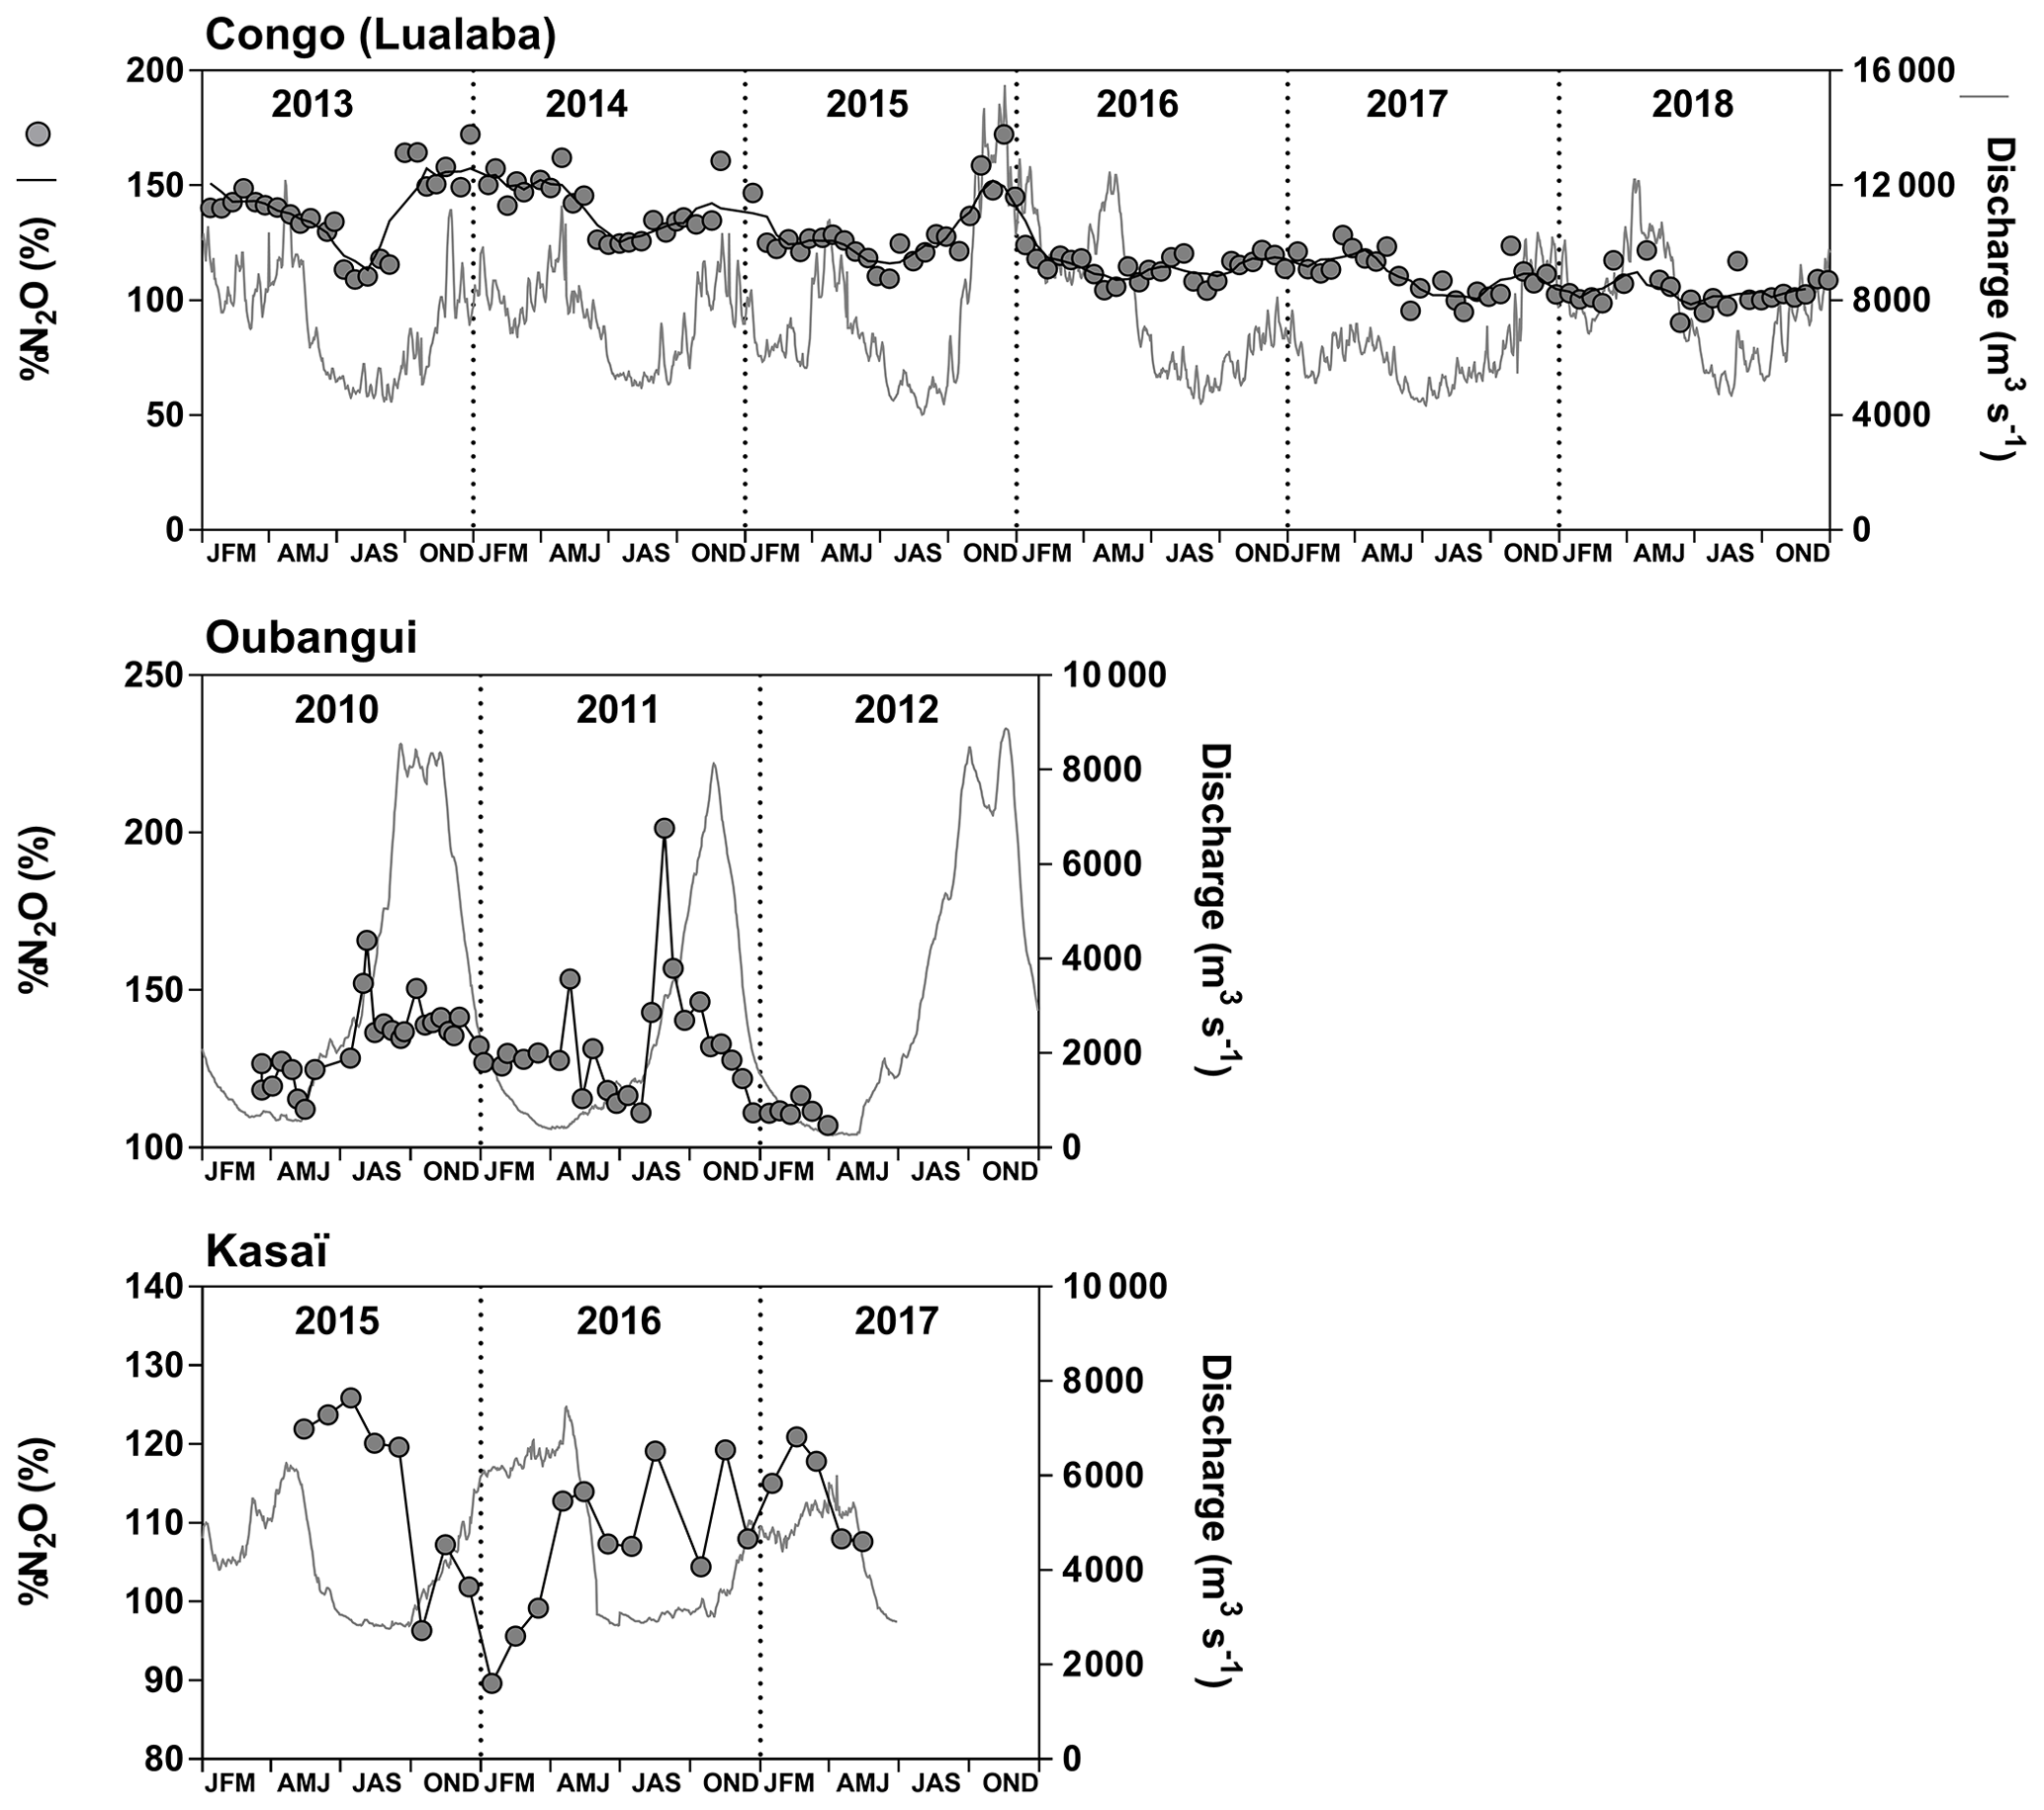
Figure 21Time series of dissolved N2O saturation level (%N2O in %) in surface waters and freshwater discharge (grey line) in the Congo (at Kisangani, 2013–2018), the Oubangui (at Bangui, 2010–2012) and the Kasaï (at Dima, 2015–2017) rivers. The black line shows a five sample running average. Data in the Oubangui were previously reported by Bouillon et al. (2012, 2013).
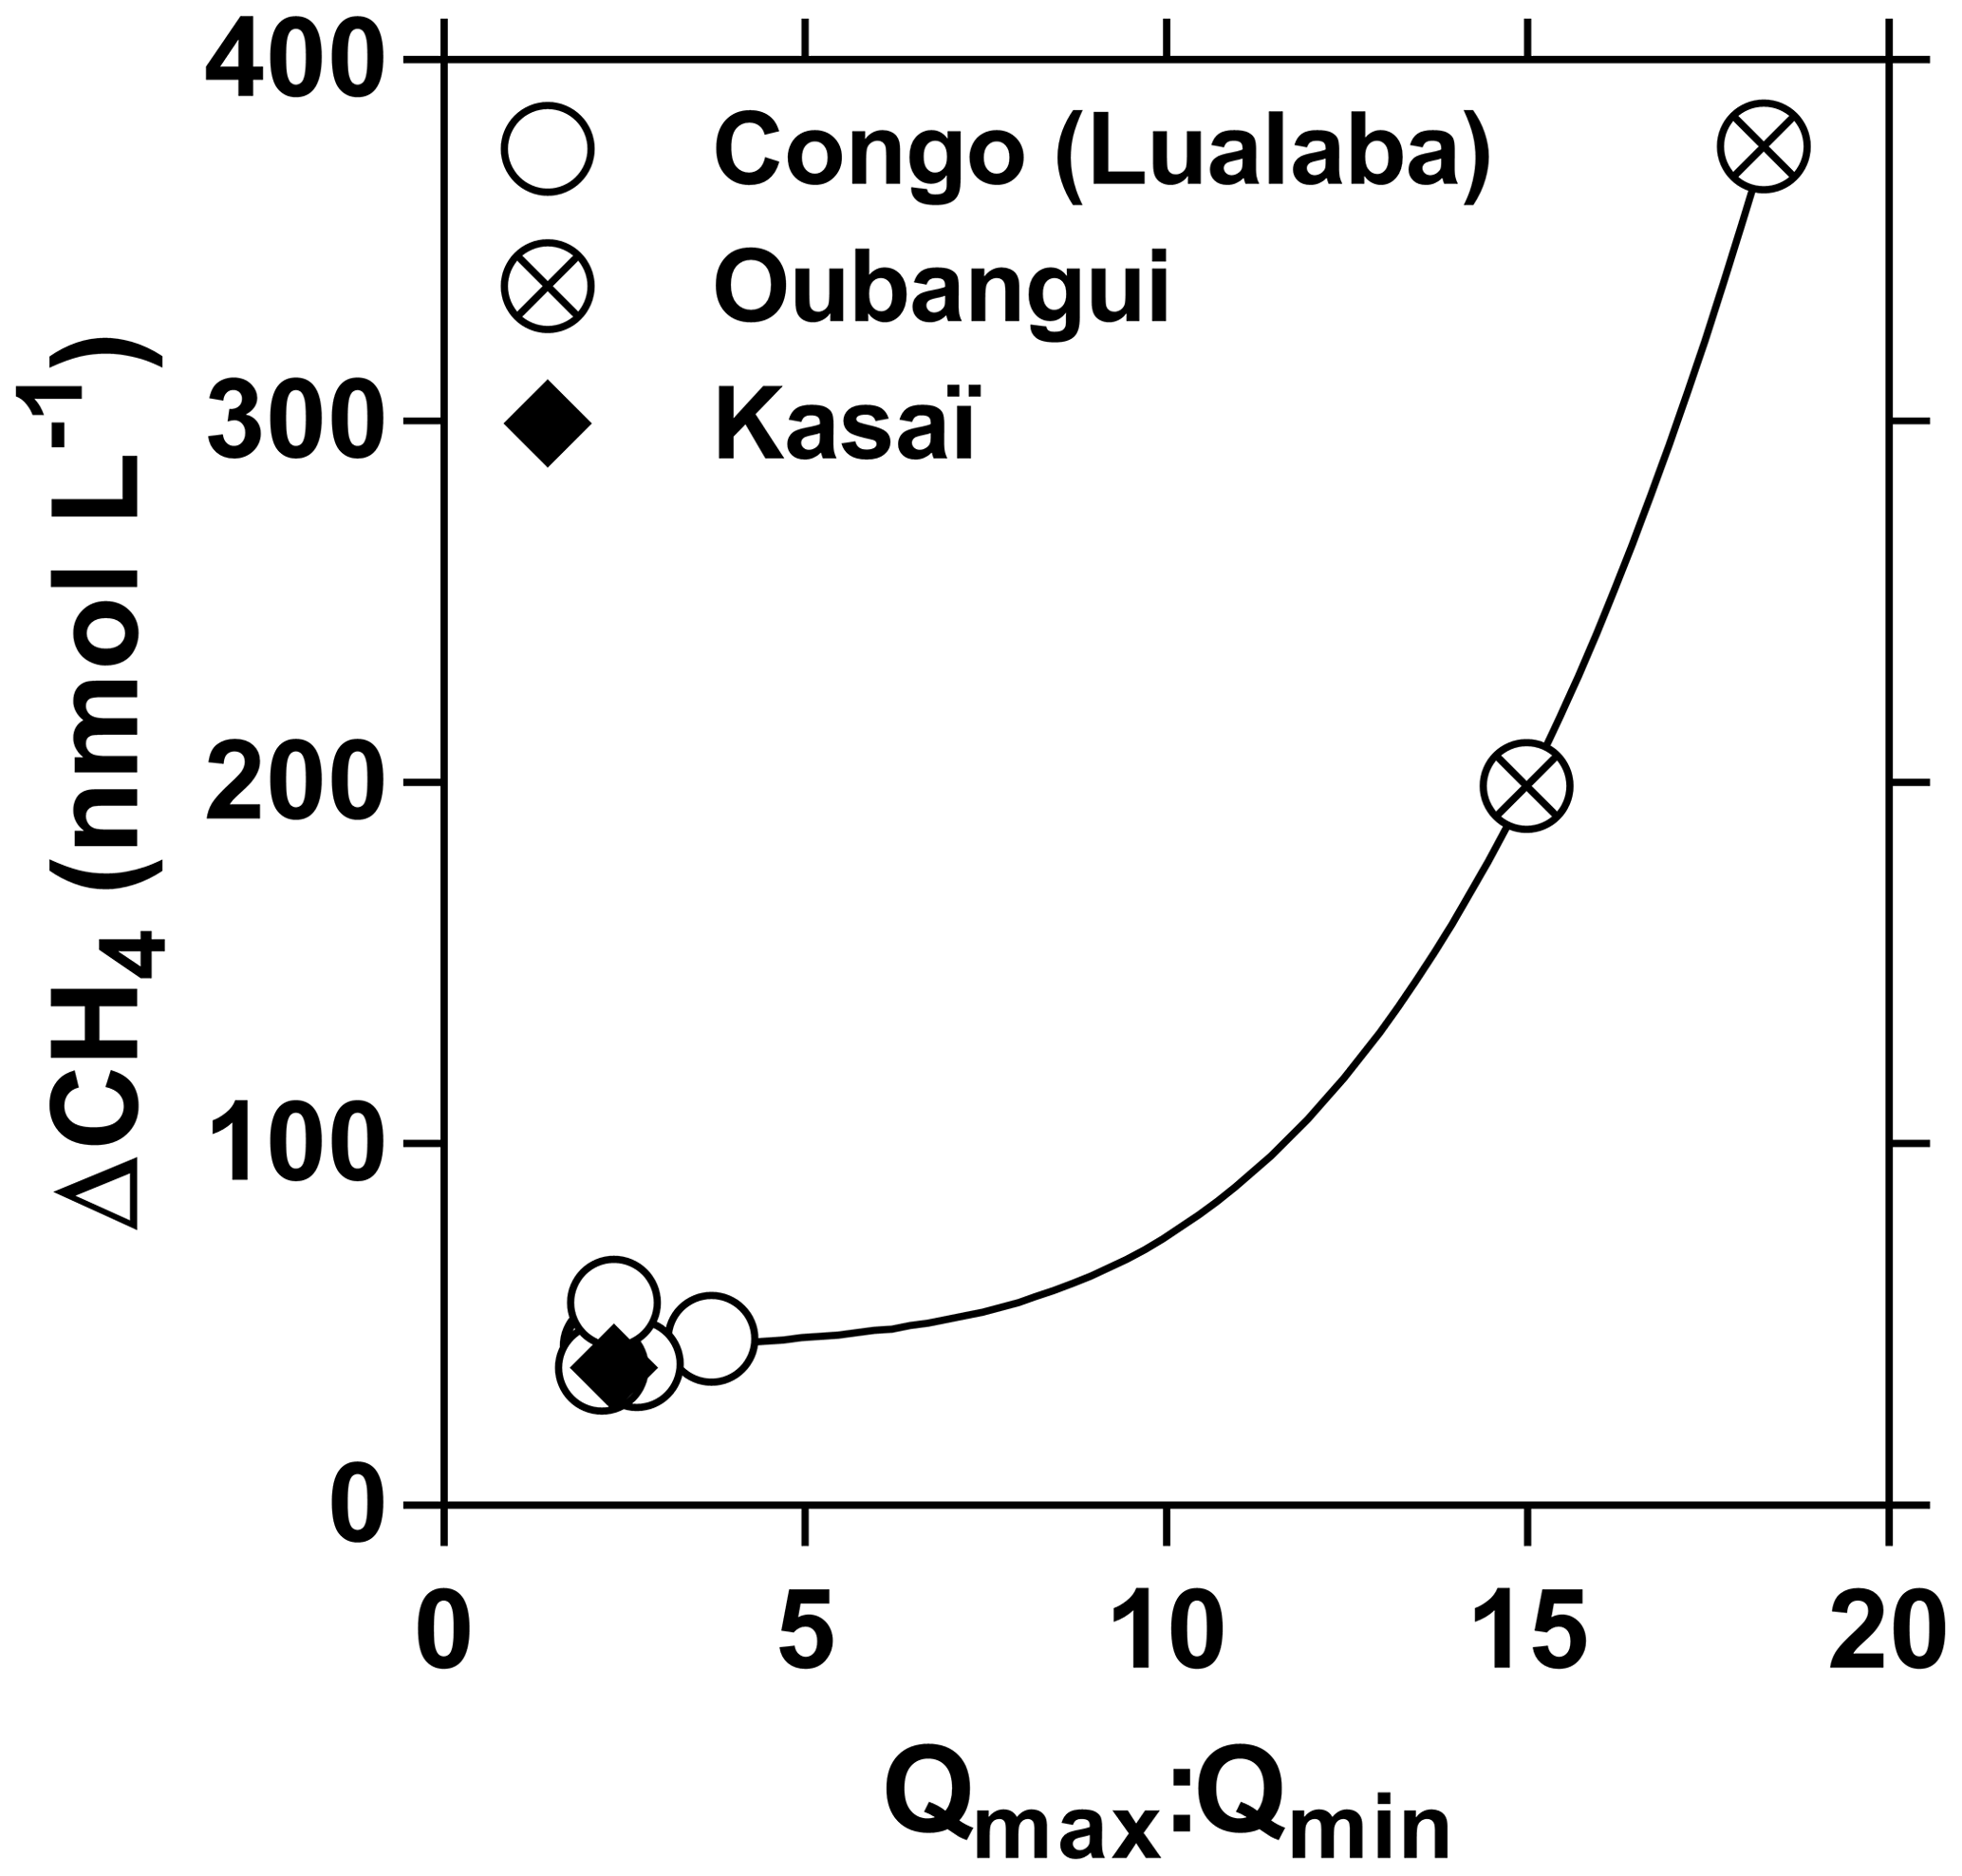
Figure 22Seasonal amplitude of dissolved CH4 concentration (ΔCH4 in nmol L−1) in surface waters as a function of the ratio of seasonal maximum and minimum of freshwater discharge (Qmax:Qmin) in the Congo (at Kisangani, 2013–2018), the Oubangui (at Bangui, 2010–2012) and the Kasaï (at Dima, 2015–2017) rivers (Fig. 20).
The pCO2 time series in the Lualaba at Kisangani is shorter than for CH4, but a general positive relationship between pCO2 and discharge was observed (Fig. S14). A similar positive relationship between pCO2 and discharge was also observed in the Oubangui (Bouillon et al., 2012) and the Madeira River (Almeida et al., 2017), as well in several rivers in the Amazon (Richey et al., 2002) based on pCO2 calculated from pH and TA. Such pCO2 discharge patterns were interpreted as resulting from higher connectivity during high water between the river main stem and the floodplains and wetlands. In large temperate rivers, a negative relationship between pCO2 and discharge was observed in the Meuse (Borges et al., 2018) and in more than half of the US rivers analyzed by Liu and Raymond (2018). The difference in the relationship of pCO2 versus discharge between tropical and temperate large rivers might be related to lower interactions between river and floodplains in temperate rivers, particularly in highly human-impacted and channelized rivers such as the Meuse. This is in agreement with the analysis of Aho and Raymond (2019), who reported, in the Salmon River network, positive relationships between pCO2 and flow in water watersheds with a high presence of wetlands and negative relationships between pCO2 and flow in watersheds with low presence of wetlands. Also, in temperate rivers, temperature covaries strongly with discharge in temperate rivers, so that the warmer months that promote biological production of CO2 are also characterized by lower discharge (Borges et al., 2018).
The seasonal amplitude of CH4 (∼50 nmol L−1 in the Kasaï and the Congo, versus 200–400 nmol L−1 in the Oubangui) and %N2O (20 %–90 % in the 3 rivers) was overall much lower than the spatial gradients across the basin of 22 and 71 428 nmol L−1 for CH4 and 0 and 561 % for N2O.
3.7 Variability of GHG fluxes in the Congo river network
Since pCO2 and CH4 and N2O concentrations followed distinct patterns as a function of Strahler stream order (Fig. 11) we used k600 and stream surface area as a function of Strahler stream order (Fig. S15) to compute the air–water GHG fluxes and to integrate them at basin scale. This was done separating data for streams draining and not draining the CCC since pCO2 and CH4 and N2O patterns were very different (Figs. 11 and 12). The stream surface area decreased regularly with increasing Strahler stream order but showed a large increase for Strahler stream order 9 (Fig. S15). The latter mainly corresponds to the Congo main stem that downstream of Kisangani is characterized by anastomosing river channels with extended sand bars and numerous islands (Runge, 2008; O'Loughlin et al., 2013). In particular along the about 500 km long section between the Mbandaka and Kwa mouths, the main stem river channel undergoes a general expansion and width increases from ∼4 to ∼10 km. This corresponds to the area of CCC depression with a corresponding decrease in the slope from 6 to 3 cm km−1 (O'Loughlin et al., 2013). The calculated k600 decreased regularly with increasing Strahler stream order, as previously reported (Butman and Raymond, 2011; Raymond et al., 2012; Deirmendjian and Abril, 2018; Liu and Raymond, 2018), due to higher turbulence in low-order streams associated with higher stream flow due to steeper slopes. HydroSHEDS stream order classification is missing at least 1 stream order because small streams are not correctly represented (Benstead and Leigh, 2012; Raymond et al., 2013). Hence, to correct this bias, we added 1 to stream orders determined by HydroSHEDS, meaning that the lowest stream order to which GHG were attributed was 2. We then extrapolated pCO2 and CH4 and N2O concentrations to stream order 1, separating streams draining and not draining the CCC, using a linear regression with higher orders or by using the same value as for order 2 (Fig. S16).
An error analysis on the GHG flux computation and upscaling was carried out by error propagation of the GHG concentration measurements, the k value estimates and the estimate of surface areas of river channels to scale the areal fluxes, using a Monte Carlo simulation with 1000 iterations. The uncertainty in the GHG concentrations led to an uncertainty of areal fluxes of ±1.2 %, ±2.3 % and ±7.1 % for CO2, CH4 and N2O, respectively. The uncertainty in k derived from tracer experiments is typically ±30.0 % (Ulseth et al., 2019). This leads to a cumulated uncertainty of areal fluxes of ±17.6 %, ±17.9 % and ±19.0 % for CO2, CH4 and N2O, respectively. The uncertainty of the river and stream surface areas based on GIS analysis of Allen and Pavelsky (2018) is estimated to ±10 % leading to an overall uncertainty of integrated fluxes of ±18.3 %, ±18.3 % and ±19.6 % for CO2, CH4 and N2O, respectively.
The calculated FCO2 ranged between 86 and 7110 mmol m−2 d−1, averaging 2469±435 mmol m−2 d−1 (weighted by surface area of Strahler stream order), encompassing the range FCO2 reported by Mann et al. (2014) (312 to 1429 mmol m−2 d−1) in 25 sites during a single period (November 2010) from four major river basins in the Republic of the Congo (Alima, Lefini, Sangha, Likouala-Mossaka). The pCO2 values ranged between 1087 and 22 899 ppm, also encompassing the values reported by Mann et al. (2014) (2600 to 15 802 ppm) that were not measured directly but computed from pH and DIC measurements, although pH measurements in black-water rivers can be biased by the presence of humic-dissolved organic matter (Abril et al., 2015) and the addition of HgCl2 seems to alter the CO2 content of samples (Fig. S1). The calculated FCH4 ranged between 65 and 597 260 µmol m−2 d−1, averaging 12 553±2247 µmol m−2 d−1 (weighted by surface area of Strahler order), encompassing the range FCH4 reported by Upstill-Goddard et al. (2017) (33 to 48 705 µmol m−2 d−1) in 41 sites draining the Congo basin in the Republic of the Congo (November 2010 and August 2011) in the same four river basins sampled by Mann et al. (2014). The CH4 values ranged between 22 and 71 428 nmol L−1, also encompassing the values reported by Upstill-Goddard et al. (2017) (11 to 9553 nmol L−1). The calculated FN2O ranged between −52 and 319 µmol m−2 d−1, averaging 22±4 µmol m−2 d−1 (weighted by surface area of Strahler order), encompassing the range FN2O reported by Upstill-Goddard et al. (2017) (−19 to 67 µmol m−2 d−1). The %N2O values ranged between 0 % and 561 %, also encompassing the values reported by Upstill-Goddard et al. (2017) (6 % to 266 %). The wider ranges of GHGs and respective fluxes we report compared to those of Mann et al. (2014) and Upstill-Goddard et al. (2017) reflect the larger number of river systems sampled over a wider geographical area (n=25 versus n=278 for pCO2 and n=41 versus n=367 for CH4 and N2O), hence, representing a wider range of river types, morphologies, catchment characteristics and wetland densities.
Information on the seasonal variability of concurrent FCO2, FCH4 and FN2O values was only available in the Lualaba (at Kisangani), where the three GHGs were measured simultaneously (Fig. S17). FCO2, FCH4 and FN2O were loosely positively correlated with freshwater discharge, as the seasonal variations in k600 were small (ranging between 23.4 and 30.3 cm h−1), and although pCO2 was correlated to freshwater discharge (Fig. S14) this was not the case for CH4 and N2O concentrations (Figs. 20 and 21). The range of seasonal variations at Kisangani of FCO2 (234 and 948 mmol m−2 d−1), FCH4 (116 and 876 µmol m−2 d−1) and FN2O (−2 and 40 µmol m−2 d−1) was small compared to the range of spatial variations in FCO2 (86 and 7,110 mmol m−2 d−1), FCH4 (65 and 597 260 µmol m−2 d−1) and FN2O (−52 and 319 µmol m−2 d−1).
3.8 Significance of integrated GHG fluxes at basin and global scales
The FCO2 and FCH4 decreased with increasing Strahler order, as given by surface area, and also when integrated by surface area of the streams (Table 1). Strahler orders 1-2 accounted for nearly 80 % of the integrated FCO2 (79.6 %) and FCH4 (77.0 %), while Strahler orders 1–4 accounted for > 90 % of the integrated FCO2 (90.7 %) and FCH4 (91.9 %). Strahler orders 5–10 only accounted for 9.3 % of integrated FCO2 and 8.1 % of integrated FCH4. The rivers draining the CCC contributed to 6 % of the basin-wide emissions for CO2 and 22 % for CH4, although the contribution in stream surface area was only 11 %. The low contribution of FCO2 from the CCC to the basin-wide emissions was due to the lower k600 values, although pCO2 values were higher than the rest of the basin (Table 1). In the case of FCH4, the much higher CH4 concentrations in the CCC overcome the lower k600 values. FN2O per surface area in rivers and streams outside the CCC were relatively similar for Strahler orders 10 to 3 and increased for Strahler orders 1 and 2 (Table 1). FN2O per surface area in rivers and streams draining the CCC steadily decreased from Strahler order 8 to 1, with rivers of orders 5, 3, 2 and 1 acting as sinks for N2O. Consequently, the relative contribution per Strahler order of integrated FN2O was less skewed than for integrated FCO2 and FCH4. Strahler orders 1–4 contributed 69.9 % of integrated FN2O compared to > 90 % for FCO2 and FCH4.
Table 1Partial pressure of CO2 (pCO2 in ppm); dissolved CH4 concentration (nmol L−1); dissolved N2O saturation level (%N2O in %); gas transfer velocity (k600 in cm h−1); air–water fluxes of CO2 (FCO2 in mmol m−2 d−1 and in TgC yr−1), CH4 (FCH4 in µmol m−2 d−1 and in TgCH4 yr−1), and N2O (FN2O in µmol m−2 d−1 and in GgN2O-N yr−1); stream surface area (S.A. in km2); and as a function of Strahler stream order (S.O.) in the Congo River network for rivers and streams draining and not draining the Cuvette Centrale Congolaise. Values in italic were extrapolated to stream order 1, using a linear regression with higher orders or by using the same value as for stream order 2 (Fig. S16).
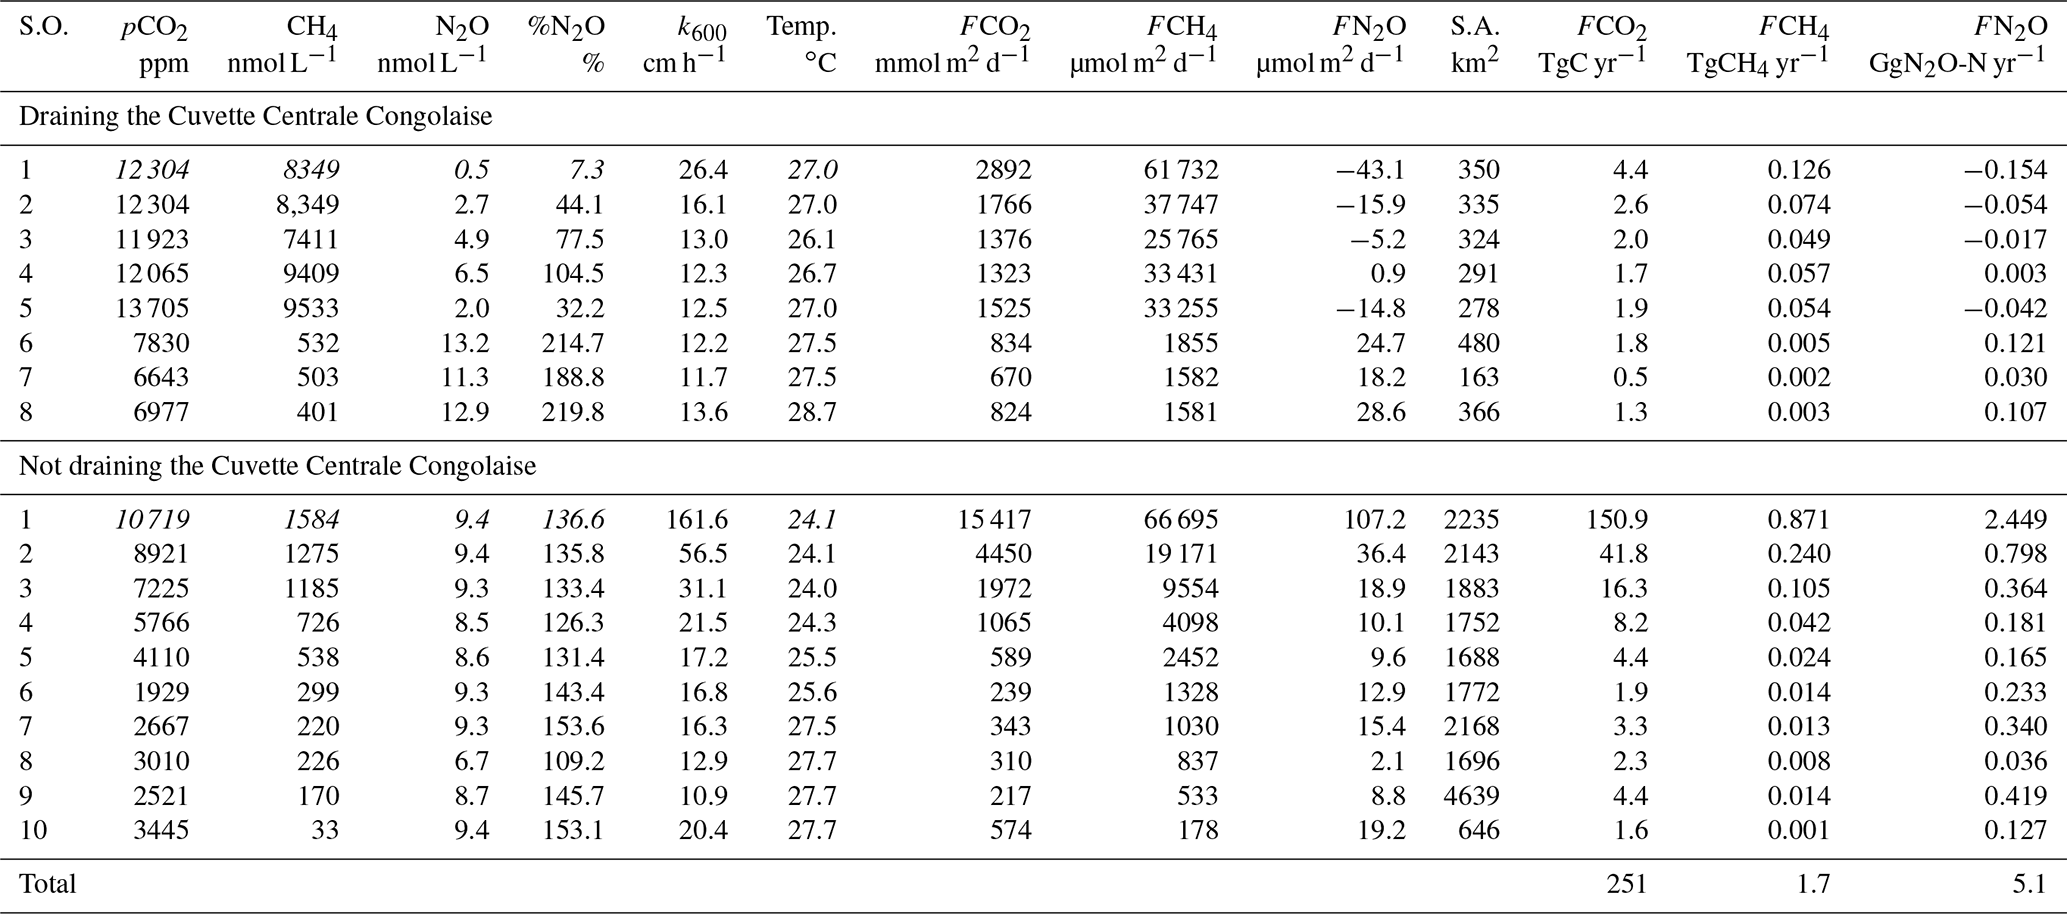
The rivers and streams draining the CCC were a very small sink of atmospheric N2O (−0.01 GgN2O-N yr−1) while the rivers and streams outside the CCC were a source of N2O (5.1 GgN2O-N yr−1). The integrated FN2O for the Congo River network was 5.1±1.0 GgN2O-N yr−1 corresponded to 14 %–17 % of total riverine emissions of N2O reported by Hu et al. (2016). Note that the N2O riverine emissions computed by Hu et al. (2016) were indirectly computed from data on global nitrogen deposition on catchments and on emission factors rather than derived from direct measurements of dissolved N2O concentrations. The estimates given by Hu et al. (2016) are more conservative than older estimates (e.g., Kroeze et al., 2010) because they are based on revised emission factors and converge with a similar more recent study by Maavara et al. (2018). Our estimate of the integrated FN2O is consistent with the range of N2O emissions of 3.8 to 4.3 GgN2O-N yr−1 given by Maavara et al. (2018) for the Congo river network, also based on an indirect calculation based on nitrogen deposition and emission factors.
The integrated FCH4 for the Congo River network of 1.7±0.3 TgCH4 yr−1 is nearly 2 times higher than the estimate given by Bastviken et al. (2011) for all tropical rivers and corresponds to 6 % of the global emission of CH4 from rivers given by Stanley et al. (2016), while the surface area of the Congo River network corresponds to a lower proportion (3 %) of the global riverine surface area (773 000 km2, Allen and Pavelsky). Note that the meta-analysis of Stanley et al. (2016) includes part of our dataset from the Congo River, as published by Borges et al. (2015a). The integrated FCH4 we report for the Congo River network is also more than 3 times higher than the estimate of CH4 emissions for Amazonian large rivers reported by Sawakuchi et al. (2014) (0.49 TgCH4 yr−1). The integrated FCH4 we report for the Congo River network corresponds to 7 % of the emission from the Congo wetlands inferred from remotely sensed atmospheric CH4 data (Bloom et al., 2010) (25.7 TgCH4 yr−1). However, the top-down estimate given by Bloom et al. (2011) includes the CH4 emission from all ecosystems over the Congo basin and should also include the fluvial emissions. Note that the CH4 emissions we report for the Congo River basin only include the diffusive flux component, when the ebullitive CH4 emission component represents the majority of CH4 emissions from inland waters (Bastviken et al., 2011), which would be consistent with the gap between our emission estimates and those from atmospheric CH4 inventories. Finally, note that the CH4 emissions were only calculated and integrated for the rivers and streams draining the CCC but not for the actual wetland flooded area of the CCC. The emission of CH4 from actual wetland flooded area of the CCC can be estimated to a massive 51 TgCH4 yr−1 by extrapolating the area averaged FCH4 from the streams (24 468 µmol m−2 d−1, Table 1) to the flooded extent (360 000 km2, Bwangoy et al., 2010). This corresponds to about 29 % of the CH4 emissions from natural wetlands (∼180 TgCH4 yr−1, Saunois et al., 2010) and would in this case be higher than the estimate of CH4 emissions from the Congo wetlands inferred from remotely sensed atmospheric CH4 data (Bloom et al., 2010).
The integrated FCO2 for the Congo River network is 251±46 TgC yr−1 and is equivalent to the CO2 emission value for rivers globally given by Cole et al. (2007) and to 14 % and 39 % of the CO2 emission value for rivers globally given by Raymond et al. (2013) (18 000 TgC yr−1) and Lauerwald et al. (2015) (650 TgC yr−1), respectively. The integrated CO2 emission from the Congo River network corresponds to 44 % of the CO2 emissions from tropical (24∘ N–24∘ S) oceans globally (565 TgC yr−1) and 183 % of CO2 emissions from the tropical Atlantic Ocean (137 TgC yr−1), based on the Takahashi et al. (2002) FCO2 climatology. The terrestrial net ecosystem exchange (NEE) of the watershed of the Congo River can be estimated based on the NEE estimate of 23 gC m−2 d−1 for savannahs given by Ciais et al. (2011) and of 20 gC m−2 d−1 for forests given by Fisher et al. (2013) and based on the respective land cover from GLC2009 (30 % savannah and 70 % forest). The corresponding terrestrial NEE of 77 TgC yr−1 is more than 3 times lower than the riverine CO2 emission from the Congo River. This is extremely surprising since the hydrological export from terra firme forests of DOC and DIC that are assumed to sustain fluvial emissions are typically 2 %–3 % compared to terrestrial NEE (Kindler et al., 2011; Deirmendjian et al., 2018). Hydrological carbon export is higher compared to NEE in European grasslands (on average 22 %) (Kindler et al., 2011). We ignore if this is transposable to tropical grasslands, such as savannahs, although they only occupy 30 % of the Congo catchment surface. Accordingly, the CO2 emission from the Congo River network should have been an order of magnitude lower than the estimates of terrestrial NEE from terra firme biomes rather than more than 3 times higher. However, in wetlands such as peatlands in Europe, the hydrological export of DOC and DIC represent 109 % of NEE and is enough to sustain the riverine CO2 emission that represents 17 % of NEE (Billett et al., 2004). Indeed, the carbon export from flooded forests to riverine waters of the Congo basin can be roughly estimated to 396 TgC yr−1 and is in excess of the integrated FCO2 (calculated from the export per surface area of flooded forest of 1100 gC m−2 yr−1 reported by Abril et al., 2014, for the central Amazon and surface area of flooded forest of the CCC, 360 000 km−2, Bwangoy et al., 2010). Altogether, this would then strongly suggest that the CO2 emission from the lowland Congo River network is to a large extent sustained by another source of carbon than from the terrestrial terra firme biome. The most likely alternative source would be wetlands (flooded forest and aquatic macrophytes), in agreement with the analysis in the central Amazon River by Abril et al. (2013).
Net heterotrophy in rivers and lakes sustained by inputs of organic matter from the terrestrial vegetation on the catchments is the prevailing paradigm to explain oversaturation of CO2 in inland surface waters and corresponding emissions to the atmosphere, based on process studies, the earliest in the Amazon (Wissmar et al., 1981) and boreal systems (Del Giorgio et al., 1999; Prairie et al., 2002), and then generalized at global scales for lakes (Cole et al., 1994) and rivers (Cole and Caraco, 2001). Yet, the comparison of 169 measurements of aquatic NCP and FCO2 estimates in the central Congo River network covering a wide range of size and type of rivers and streams shows that the aquatic NCP cannot account for fluvial FCO2. This implies that lateral inputs of CO2 sustain a large part of the CO2 emissions from rivers and streams in the Congo River network.
The comparison of the integrated CO2 emission from the Congo River network with terrestrial terra firme NEE shows that it unlikely that fluvial CO2 emissions are sustained by lateral hydrological transfer of carbon from terra firme. Indeed, integrated FCO2 from the river network was more than 3 times higher than terrestrial NEE, when forests typically only export a very small fraction of NEE as carbon to rivers that can sustain fluvial CO2 emissions. It is then likely that the fluvial CO2 emissions from the central Congo River are sustained by organic matter inputs as well as direct CO2 inputs from extensive riparian wetlands (flooded forest and aquatic floating macrophytes). This is consistent with the stable isotopic signature of DIC, the differences in the spatial distribution of dissolved CO2, %O2 and CH4 between rivers and streams draining or not draining the CCC, a large wetland region in the core of the basin, and based on the correlation between pCO2 levels and the cover of flooded forest in the catchment. Indeed, the calculated export of carbon from the CCC to the riverine network is sufficient to sustain the fluvial CO2 emission from the Congo.
The fact that fluvial CO2 emissions in lowland rivers are to a large extent sustained by carbon inputs from wetlands in addition to those from terra firme has consequences for the conceptualization of statistical and mechanistic models of carbon cycling in river networks. While progress has been made in integrating wetland connectivity in mechanistic regional models (Lauerwald et al., 2017), this has not been the case so far for statistical global models that rely on terrestrial (terra firme) productivity (Lauerwald et al., 2015). The comparison of the output of such a statistical model for the Congo River with observational data (Fig. S18) shows that the model fails to represent spatial gradients and the higher pCO2 values of streams and rivers draining the CCC in particular. This illustrates how ignoring the river–wetland connectivity can lead to the misrepresentation of pCO2 dynamics in river networks, in particular tropical ones that account for the vast majority (80 %) of global riverine CO2 emissions.
Full dataset is available at https://zenodo.org/record/3413449 (Borges and Bouillon, 2019).
The supplement related to this article is available online at: https://doi.org/10.5194/bg-16-3801-2019-supplement.
AVB and SB conceived the study. AVB, FD, TL, ET, ATS, TB, JB, CRT and SB collected field samples. AVB, FD, TL, CM, CRT, JPD and SB made laboratory analysis. GHA and TL carried out GIS analysis. AVB drafted the manuscript with substantial inputs from SB. All authors contributed to the manuscript.
The authors declare that they have no conflict of interest.
We thank the Isotope Hydrology Laboratory of IAEA for analyses of water stable isotope ratios, which contribute to the Coordinated Research Project CRPF33021 (Application and development of isotope techniques to evaluate human impacts on water balance and nutrient dynamics of large river basins) implemented by the IAEA, Jonathan Richir (University of Liège) for advice about the statistical analysis, Sandro Petrovic and Marc-Vincent Commarieu (University of Liège), Bruno Leporcq (UNamur) and Zita Kelemen (KU Leuven) for analytical assistance, the Régie des Voies Fluviales (RVF, Kinshasa) for providing water height data, and the two anonymous reviewers for their comments on the previous version of the paper. Publication costs were partly covered by European Geosciences Union as part of the 2018 Outstanding Reviewer Award to Alberto V. Borges. Alberto V. Borges is a senior research associate at the FNRS.
This research has been supported by the European Research Council (grant no. 240002), the Fonds National de la Recherche Scientifique (grant no. 14711103), the Belgian Federal Science Policy (BELSPO, grant no. COBAFISH SD/AR/05A), the Research Foundation Flanders (FWO-Vlaanderen), the Research Council of the KU Leuven and the Fonds Leopold-III pour l'Exploration et Conservation de la Nature. The Boyekoli-Ebale-Congo 2010 Expedition was funded by the Belgian Development Cooperation, BELSPO and Belgian National Lottery.
This paper was edited by Ji-Hyung Park and reviewed by two anonymous referees.
Abril, G. and Borges, A. V.: Carbon leaks from flooded land: do we need to re-plumb the inland water active pipe?, Biogeosciences, 16, 769–784, https://doi.org/10.5194/bg-16-769-2019, 2019.
Abril, G., Martinez, J.-M., Artigas, L. F., Moreira-Turcq, P., Benedetti, M. F., Vidal, L., Meziane, T., Kim, J.-H., Bernardes, M. C., Savoye, N., Deborde, J., Albéric, P., Souza, M. F. L., Souza, E. L., and Roland, F.: Amazon river carbon dioxide outgassing fuelled by wetlands, Nature, 505, 395–398, https://doi.org/10.1038/nature12797, 2014.
Abril, G., Bouillon, S., Darchambeau, F., Teodoru, C. R., Marwick, T. R., Tamooh, F., Omengo, F. O., Geeraert, N., Deirmendjian, L., Polsenaere, P., and Borges A. V.: Technical note: Large overestimation of pCO2 calculated from pH and alkalinity in acidic, organic-rich freshwaters, Biogeosciences, 12, 67–78, https://doi.org/10.5194/bg-12-67-2015, 2015.
Aho, K. S. and Raymond, P. A.: Differential response of greenhouse gas evasion to storms in forested and wetland streams, J. Geophys. Res., 124, 649–662, https://doi.org/10.1029/2018JG004750, 2019.
Allen, G. H. and Pavelsky, T. M.: Global extent of rivers and streams, Science, 28, eaat0636, https://doi.org/10.1126/science.aat0636, 2018.
Almeida, R. M., Pacheco, F. S., Barros, N., Rosi, E., and Roland, F.: Extreme floods increase CO2 outgassing from a large Amazonian river, Limnol. Oceanogr., 62, 989–999, https://doi.org/10.1002/lno.10480, 2017.
Alsdorf, D., Beighley, E., Laraque, A., Lee, H., Tshimanga, R., O'Loughlin, F., Mahé, G., Dinga, B., Moukandi, G., and Spencer, R. G. M.: Opportunities for hydrologic research in the Congo Basin, Rev. Geophys., 54, 378–409, https://doi.org/10.1002/2016RG000517, 2016.
Amaral, J. H. F., Borges, A. V., Melack, J. M., Sarmento, H., Barbosa, P. M., Kasper, D., Melo, M. L., de Fex Wolf, D., da Silva, J. S., and Forsberg, B. R.: Influence of plankton metabolism and mixing depth on CO2 dynamics in an Amazon floodplain lake, Sci. Total Environ., 630, 1381–1393, https://doi.org/10.1016/j.scitotenv.2018.02.331, 2018.
APHA: Standard methods for the examination of water and wastewater, American Public Health Association, 1325 pp., 1998.
Balagizi, C. M., Darchambeau, F., Bouillon, S., Yalire, M. M., Lambert, T., and Borges, A. V.: River geochemistry, chemical weathering and atmospheric CO2 consumption rates in the Virunga Volcanic Province (East Africa), Geochem. Geophy. Geosy., 16, 2637–2660, https://doi.org/10.1002/2015GC005999, 2015.
Barbosa, P. M., Melack, J. M., Farjalla, V. F., Amaral, J. H. F., Scofield, V., and Forsberg, B. R.: Diffusive methane fluxes from Negro, Solimões and Madeira rivers and fringing lakes in the Amazon basin, Limnol. Oceanogr., 61, S221–S237, https://doi.org/10.1002/lno.10358, 2016.
Bastviken, D., Ejlertsson, J., and Tranvik, L.: Measurement of methane oxidation in lakes: A comparison of methods, Environ. Sci. Technol., 36, 3354–3361, https://doi.org/10.1021/es010311p, 2002.
Bastviken, D., Tranvik, L. J., Downing, J. A., Crill, P. M., and Enrich-Prast, A. :, Freshwater methane emissions offset the continental carbon sink, Science, 331, p. 50, https://doi.org/10.1126/science.1196808, 2011.
Battin, T. J., Kaplan, L. A., Findlay, S., Hopkinson, C. S., Marti, E., Packman, A. I., Newbold, J. D., and Sabater, F.: Biophysical controls on organic carbon fluxes in fluvial networks, Nat. Geosci., 1, 95–100, https://doi.org/10.1038/ngeo101, 2008.
Baulch, H. M., Schiff, S. L., Maranger, R., and Dillon, P. J.: Nitrogen enrichment and the emission of nitrous oxide from streams, Global Biogeochem. Cy., 25, GB4013, https://doi.org/10.1029/2011GB004047, 2011.
Benstead, J. P. and Leigh, D. S.: An expanded role for river networks, Nat. Geosci., 5, 678–679, https://doi.org/10.1038/ngeo1593, 2012.
Billett, M. F., Palmer, S. M., Hope, D., Deacon, C., Storeton-West, R., Hargreaves, K. J., Flechard, C., and Fowler, D.: Linking land-atmosphere-stream carbon fluxes in a lowland peatland system, Global Biogeochem. Cy., 18, GB1024, https://doi.org/10.1029/2003GB002058, 2004.
Bird, M. I. and Pousai, P.: Variations of δ13C in the surface soil organic carbon pool, Global Biogeoch. Cy., 11, 313–322, https://doi.org/10.1029/97GB01197, 1997.
Bird, M. I., Giresse, P., and Chivas, A. R.: Effect of forest and savanna vegetation on the carbon-isotope composition from the Sanaga River, Cameroon, Limnol. Oceanogr., 39, 1845–1854, https://doi.org/10.4319/lo.1994.39.8.1845, 1994.
Bowen, G. J., Wassenaar, L. I., and Hobson, K. A.: Global application of stable hydrogen and oxygen isotopes to wildlife forensics, Oecologia, 143, 337–348, https://doi.org/10.1007/s00442-004-1813-y, 2005.
Bloom, A. A., Palmer, P. I., Fraser, A., Reay, D. S., and Frankenberg, C.: Large-scale controls of methanogenesis inferred from methane and gravity spaceborne data, Science, 327, 322–325, https://doi.org/10.1126/science.1175176, 2010.
Borges, A. V., Darchambeau, F., Teodoru, C. R., Marwick, T. R., Tamooh, F., Geeraert, N., Omengo, F. O., Guérin, F., Lambert, T., Morana, C., Okuku, E., and Bouillon, S.: Globally significant greenhouse gas emissions from African inland waters, Nat. Geosci., 8, 637–642, https://doi.org/10.1038/NGEO2486, 2015a.
Borges, A. V., Abril, G., Darchambeau, F., Teodoru, C. R., Deborde, J., Vidal, L. O., Lambert, T., and Bouillon, S.: Divergent biophysical controls of aquatic CO2 and CH4 in the World's two largest rivers, Sci. Rep., 5, 15614, https://doi.org/10.1038/srep15614, 2015b.
Borges, A. V., Darchambeau, F., Lambert, T., Bouillon, S., Morana, C., Brouyère, S., Hakoun, V., Jurado, A., Tseng, H.-C., Descy, J.-P., and Roland, F. A. E.: Effects of agricultural land use on fluvial carbon dioxide, methane and nitrous oxide concentrations in a large European river, the Meuse (Belgium), Sci. Total Environ., 610/611, 342–355, https://doi.org/10.1016/j.scitotenv.2017.08.047, 2018.
Borges, A. V. and Bouillon, S.: Data-base of CO2, CH4, N2O and ancillary data in the Congo River, available at: https://zenodo.org/record/3413449#.XYm2eUYzaUk, last access: 24 September 2019.
Bouillon, S., Abril, G., Borges, A. V., Dehairs, F., Govers, G., Hughes, H. J., Merckx, R., Meysman, F. J. R., Nyunja, J., Osburn, C., and Middelburg, J. J.: Distribution, origin and cycling of carbon in the Tana River (Kenya): a dry season basin-scale survey from headwaters to the delta, Biogeosciences, 6, 2475–2493, https://doi.org/10.5194/bg-6-2475-2009, 2009.
Bouillon, S., Yambélé, A., Spencer, R. G. M., Gillikin, D. P., Hernes, P. J., Six, J., Merckx, R., and Borges, A. V.: Organic matter sources, fluxes and greenhouse gas exchange in the Oubangui River (Congo River basin), Biogeosciences, 9, 2045–2062, https://doi.org/10.5194/bg-9-2045-2012, 2012.
Bouillon, S., Yambélé, A., Gillikin, D. P., Teodoru, C., Darchambeau, F., Lambert, T., and Borges, A. V.: Contrasting biogeochemical characteristics of right-bank tributaries and a comparison with the mainstem Oubangui River, Central African Republic (Congo River basin), Sci. Rep., 4, 5402, https://doi.org/10.1038/srep05402, 2014.
Bultot, F.: Atlas Climatique du Bassin Congolais Publications de L'Institut National pour L'Etude Agronomique du Congo (I.N.E.A.C.), Troisieme Partie, Temperature et Humidite de L'Air, Rosee, Temperature du Sol, 253 pp., 1972.
Butman, D. and Raymond, P. A.: Significant efflux of carbon dioxide from streams and rivers in the United States, Nat. Geosci., 4, 839–842, https://doi.org/10.1038/NGEO1294, 2011.
Bwangoy, J.-R. B., Hansen, M. C., Roy, D. P., De Grandi, G., and Justice, C. O.: Wetland mapping in the Congo Basin using optical and radar remotely sensed data and derived topographical indices, Remote Sens. Environ., 114, 73–86, https://doi.org/10.1016/j.rse.2009.08.004, 2010.
Canion, A., Overholt, W. A., Kostka, J. E., Huettel, M., Lavik, G., and Kuypers, M. M. M.: Temperature response of denitrification and anaerobic ammonium oxidation rates and microbial community structure in Arctic fjord sediments, Environ. Microbiol., 16, 3331–3344, https://doi.org/10.1111/1462-2920.12593, 2014.
Cardoso, S. J., Enrich-Prast, A., Pace, M. L., and Roland, F.: Do models of organic carbon mineralization extrapolate to warmer tropical sediments? Limnol. Oceanogr., 59, 48–54, https://doi.org/10.4319/lo.2014.59.1.0048, 2014.
Ciais, P., Bombelli, A., Williams, M., Piao, S. L., Chave, J., Ryan, C. M., Henry, M., Brender, P., and Valentini, R.: The carbon balance of Africa: synthesis of recent research studies, Philos. T. R. Soc. A, 369, 2038–2057, https://doi.org/10.1098/rsta.2010.0328, 2013.
Coplen, T. B. and Wassenaar, L. I.: LIMS for Lasers 2015 for achieving long-term accuracy and precision of δ2H, δ17O, and δ18O of waters using laser absorption spectrometry, Rapid Commun. Mass Spectr., 29, 2122–2130, https://doi.org/10.1002/rcm.7372,2015.
Cole, B. E. and Cloern, J. E.: An empirical model for estimating phytoplankton productivity in estuaries, Mar. Ecol. Prog. Ser., 36, 299–305, https://doi.org/10.3354/meps036299, 1987.
Cole, J. J. and Caraco, N. F.: Carbon in catchments: connecting terrestrial carbon losses with aquatic metabolism, Mar. Fresh. Res., 52, 101–110, https://doi.org/10.1071/MF00084, 2001.
Cole, J. J., Caraco, N. F., Kling, G. W., and Kratz, T. K.: Carbon dioxide supersaturation in the surface waters of lakes, Science, 265, 1568–1570, https://doi.org/10.1126/science.265.5178.1568, 1994.
Cole, J. J., Prairie, Y. T., Caraco, N. F., McDowell, W. H., Tranvik, L. J., Striegl, R. G. , Duarte, C. M., Kortelainen, P., Downing, J. A., Middelburg, J. J., and Melack, J.: Plumbing the global carbon cycle: Integrating inland waters into the terrestrial carbon budget, Ecosystems, 10, 171–184, https://doi.org/10.1007/s10021-006-9013-8, 2007.
Coynel, A., Seyler, P., Etcheber, H., Meybeck, M., and Orange, D.: Spatial and seasonal dynamics of total suspended sediment and organic carbon species in the Congo River, Global Biogeochem. Cy., 19, GB4019, https://doi.org/10.1029/2004GB002335, 2005.
Craine J. M., Elmore, A. J., Wang, L., Aranibar, J., Bauters, M., Boeckx, P., Crowley, B. E., Dawes, M. A., Delzon, S., Fajardo, A., Fang, Y., Fujiyoshi, L., Gray, A., Guerrieri, R., Gundale, M. J., Hawke, D.J., Hietz, P., Jonard, M., Kearsley, E., Kenzo, T., Makarov, M., Marañón-Jiménez, S., McGlynn, T. P., McNeil, B. E., Mosher, S. G., Nelson, D. M., Peri, P. L., Roggy, J. C., Sanders-DeMott, R., Song, M., Szpak, P., Templer, P. H., Van der Colff, D., Werner, C., Xu, X., Yang, Y., Yu, G., and Zmudczyńska-Skarbek, K.: Isotopic evidence for oligotrophication of terrestrial ecosystems, Nat. Ecol. Evol., 2, 1735–1744, https://doi.org/10.1038/s41559-018-0694-0, 2018.
Crawford J. T., Stanley, E. H., Dornblaser, M., and Striegl, R. G.: CO2 time series patterns in contrasting headwater streams of North America, Aquat. Sci., 79, 473–486, https://doi.org/10.1007/s00027-016-0511-2, 2017.
Dargie, G. C., Lewis, S. L., Lawson, I. T., Mitchard, E. T. A., Page, S. E., Bocko, Y. E., and Ifo, S. A.: Age, extent and carbon storage of the central Congo Basin peatland complex, Nature, 542, 86–90, https://doi.org/10.1038/nature21048, 2017.
Deirmendjian, L. and Abril, G.: Carbon dioxide degassing at the groundwater-stream-atmosphere interface: isotopic equilibration and hydrological mass balance in a sandy watershed, J. Hydrol., 558, 129–143, 2018.
Deirmendjian, L., Loustau, D., Augusto, L., Lafont, S., Chipeaux, C., Poirier, D., and Abril, G.: Hydro-ecological controls on dissolved carbon dynamics in groundwater and export to streams in a temperate pine forest, Biogeosciences, 15, 669–691, https://doi.org/10.5194/bg-15-669-2018, 2018.
Dinsmore, K. J., Wallin, M. B., Johnson, M. S., Billett, M. F., Bishop, K., Pumpanen, J., and Ojala, A.: Contrasting CO2 concentration discharge dynamics in headwater streams: a multi-catchment comparison, J. Geophys. Res., 118, 445–461, https://doi.org/10.1002/jgrg.20047, 2013.
Del Giorgio, P. A., Cole, J. J., Caraco, N. F., and Peters, R. H.: Linking planktonic biomass and metabolism to net gas fluxes in northern temperate lakes, Ecology, 80, 1422–1431, https://doi.org/10.1890/0012-9658(1999)080[1422:LPBAMT]2.0.CO;2, 1999.
Descy, J.-P., Hardy, M.-A., Sténuite, S., Pirlot, S., Leporcq, B., Kimirei, I., Sekadende, B., Mwaitega, S. R., and Sinyenza, D.: Phytoplankton pigments and community composition in Lake Tanganyika, Freshwater Biol., 50, 668–684, https://doi.org/10.1111/j.1365-2427.2005.01358.x, 2005.
Descy, J.-P., Darchambeau, F., Lambert, T., Stoyneva, M. P., Bouillon, S., and Borges, A. V.: Phytoplankton dynamics in the Congo River, Freshwater Biol., 62, 87–101, https://doi.org/10.1111/fwb.12851, 2017.
Doctor, D. H., Kendall, C., Sebestyen, S. D., Shanley, J. B., Ohte, N., and Boyer, E. W.: Carbon isotope fractionation of dissolved inorganic carbon (DIC) due to outgassing of carbon dioxide from a headwater stream, Hydrol. Process., 22, 2410–2423, https://doi.org/10.1002/hyp.6833, 2008.
Downing, J. A., Cole, J. J., Duarte, C. M., Middelburg, J. J., Melack, J. M., Prairie, Y. T., Kortelainen, P., Striegl, R. G., McDowell, W. H., and Tranvik, L. J.: Global abundance and size distribution of streams and rivers, Inland Waters, 2, 229–236, https://doi.org/10.5268/IW-2.4.502, 2012.
Duvert, C., Butman, D. E., Marx, A., Ribolzi, O., and Hutley, L. B.: CO2 evasion along streams driven by groundwater inputs and geomorphic controls, Nat. Geosci., 11, 813–818, https://doi.org/10.1038/s41561-018-0245-y, 2018.
Fisher, J. B., Sikka, M., Sitch, S., Ciais, P., Poulter, B., Galbraith, D., Lee, J.-E., Huntingford, C., Viovy, N., Zeng, N., Ahlström, A., Lomas, M. R., Levy, P. E., Frankenberg, C., Saatchi, S., and Malhi, Y.: African tropical rainforest net carbon dioxide fluxes in the twentieth century, Philos. T. R. Soc. B, 368, 20120376, https://doi.org/10.1098/rstb.2012.0376, 2013.
Fluet-Chouinard, E., Lehner, B., Rebelo, L.-M., Papa, F., and Hamilton, S. K.: Development of a global inundation map at high spatial resolution from topographic downscaling of coarse-scale remote sensing data, Remote Sens. Environ., 158, 348–361, https://doi.org/10.1016/j.rse.2014.10.015, 2015.
Frankignoulle, M., Borges, A., and Biondo R.: A new design of equilibrator to monitor carbon dioxide in highly dynamic and turbid environments, Water Res., 35, 1344–1347, https://doi.org/10.1016/S0043-1354(00)00369-9, 2001.
Gaillardet, J., Dupré, B., Louvat, P., and Allègre C. J.: Global silicate weathering and CO2 consumption rates deduced from the chemistry of large rivers, Chem. Geol., 159, 3–30, https://doi.org/10.1016/S0009-2541(99)00031-5, 1999.
Gillikin, D. P. and Bouillon, S.: Determination of δ18O of water and δ13C of dissolved inorganic carbon using a simple modification of an elemental analyzer – isotope ratio mass spectrometer (EA-IRMS): an evaluation, Rapid Commun. Mass Spectr., 21, 1475–1478, https://doi.org/10.1002/rcm.2968, 2007.
Gran, G.: Determination of the equivalence point in potentiometric titrations Part II, The Analyst, 77, 661–671, https://doi.org/10.1039/AN9527700661, 1952.
Hamilton, S. K., Sippel, S. J., and Melack J. M.: Comparison of inundation patterns among major South American floodplains, J. Geophys. Res., 107, LBA 5-1-LBA 5-14, https://doi.org/10.1029/2000JD000306, 2002.
Happell, J., Chanton, J. P., and Showers, W.: The influence of methane oxidation on the stable isotopic composition of methane emitted from Florida Swamp forests, Geochim. Cosmochim. Ac., 58, 4377–4388, https://doi.org/10.1016/0016-7037(94)90341-7, 1994.
Hedges, J. I., Clark, W. A., Quay, P. D., Richey, J. E., Devol, A. H., and de M. Santos, U.: Compositions and fluxes of particulate organic material in the Amazon River, Limnol Oceanogr., 31, 717–738, https://doi.org/10.4319/lo.1986.31.4.0717, 1986.
Hotchkiss, E. R., Hall Jr, R. O., Sponseller, R. A., Butman, D., Klaminder, J., Laudon, H., Rosvall, M., and Karlsson, J.: Sources of and processes controlling CO2 emissions change with the size of streams and rivers, Nat. Geosci., 8, 696–699, https://doi.org/10.1038/ngeo2507, 2015.
Hu, M., Chen, D., and Dahlgren, R. A.: Modeling nitrous oxide emission from rivers: a global Assessment, Glob. Change Biol., 22, 3566–3582, https://doi.org/10.1111/gcb.13351, 2016.
Hughes, R. H. and Hughes, J. S.: A directory of African wetlands, IUCN, ISBN 2-88032-949-3, 820 pp., 1992.
Huotari, J., Haapanala, S., Pumpanen, J., Vesala, T., and Ojala, A.: Efficient gas exchange between a boreal river and the atmosphere, Geophys. Res. Lett., 40, 5683–5686, https://doi.org/10.1002/2013GL057705, 2013.
Kindler, R., Siemens, J., Kaiser, K., Walmsley, D. C., Bernhofer, C., Buchmann, N., Cellier, P., Eugster, W., Gleixner, G., Grunwald, T., Heim, A., Ibrom, A., Jones, S. K., Jones, M., Klumpp, K., Kutsch, W., Steenberg Larsen, K., Lehuger, S., Loubet, B., McKenzie, R., Moors, E., Osborne, B., Pilegaard, K., Rebmann, C., Saunders, M., Schmidt, M. W. I., Schrumpf, M., Seyfferth, J., Skiba, U., Soussana, J.-F., Sutton, M. A.; Tefs, C., Vowinckel, B., Zeeman, M. J., and Kaupenjohann, M.: Dissolved carbon leaching from soil is a crucial component of net ecosystem carbon balance, Glob. Change Biol., 17, 1167–1185, https://doi.org/10.1111/j.1365-2486.2010.02282.x, 2011.
Klaus, M., Geibrink, E., Jonsson, A., Bergström, A.-K., Bastviken, D., Laudon, H., Klaminder, J., and Karlsson, J.: Greenhouse gas emissions from boreal inland waters unchanged after forest harvesting, Biogeosciences, 15, 5575–5594, https://doi.org/10.5194/bg-15-5575-2018, 2018.
Kokic, J., Sahlée, E., Sobek, S., Vachon, D., and Wallin, M. B.: High spatial variability of gas transfer velocity in streams revealed by turbulence measurements, Inland Waters, 8, 461–473, https://doi.org/10.1080/20442041.2018.1500228, 2018.
Koné, Y. J. M., Abril, G., Kouadio, K. N., Delille, B., and Borges, A. V.: Seasonal variability of carbon dioxide in the rivers and lagoons of Ivory Coast (West Africa), Estuar. Coast., 32, 246–260, https://doi.org/10.1007/s12237-008-9121-0, 2009.
Koné, Y. J. M., Abril, G., Delille, B., and Borges, A. V.: Seasonal variability of methane in the rivers and lagoons of Ivory Coast (West Africa), Biogeochemistry, 100, 21–37, https://doi.org/10.1007/s10533-009-9402-0, 2010.
Kosten, S., Piñeiro, M., de Goede, E., de Klein, J., Lamers, L. P. M., and Ettwig, K.: Fate of methane in aquatic systems dominated by free-floating plants, Water Res., 104, 200–207, 2016.
Kroeze, C., Dumont, E., and Seitzinger, S. P.: Future trends in emissions of N2O from rivers and estuaries, J. Integr. Environ. Sc., 7, 71–78, https://doi.org/10.1080/1943815X.2010.496789, 2010.
Lambert, T., Bouillon, S., Darchambeau, F., Massicotte, P., and Borges, A.V.: Shift in the chemical composition of dissolved organic matter in the Congo River network, Biogeosciences, 13, 5405–5420, https://doi.org/10.5194/bg-13-5405-2016, 2016.
Laraque, A., Mietton, M. Olivry, J. C., and Pandi, A.: Impact of lithological and vegetal covers on flow discharge and water quality of Congolese tributaries from the Congo river, Rev. Sci. Eau., 11, 209–224, 1998.
Laraque, A., Bricquet, J. P., Pandi, A., and Olivry, J. C.: A review of material transport by the Congo River and its tributaries, Hydrol. Process., 23, 3216–3224, https://doi.org/10.1002/hyp.7395, 2009.
Lauerwald, R., Laruelle, G. G., Hartmann, J., Ciais, P., and Regnier, P. A. G.: Spatial patterns in CO2 evasion from the global river network, Global Biogeochem. Cy., 29, 534–554, https://doi.org/10.1002/2014GB004941, 2015.
Lauerwald, R., Regnier, P., Camino-Serrano, M., Guenet, B., Guimberteau, M., Ducharne, A., Polcher, J., and Ciais, P.: ORCHILEAK (revision 3875): a new model branch to simulate carbon transfers along the terrestrial–aquatic continuum of the Amazon basin, Geosci. Model Dev., 10, 3821–3859, https://doi.org/10.5194/gmd-10-3821-2017, 2017.
Le, T. T. H., Fettig, J., and Meon, G.: Kinetics and simulation of nitrification at various pH values of a polluted river in the tropics, Ecohydrol. Hydrobiol., 19, 54–65, 2019.
Liptay, K., Chanton, J., Czepiel, P., and Mosher, B.: Use of stable isotopes to determine methane oxidation in landfill cover soils, J. Geophys. Res., 103, 8243–8250, https://doi.org/10.1029/97JD02630, 1998.
Liss, P. S. and Slater, P. G.: Flux of gases across the air sea interface, Nature, 247, 181–184, https://doi.org/10.1038/247181a0, 1974.
Liu, S. and Raymond, P. A.: Hydrologic controls on pCO2 and CO2 efflux in US streams and rivers, Limnol. Oceanogr. Lett., 3, 428–435, https://doi.org/10.1002/lol2.10095, 2018.
Lynch, J. K., Beatty, C. M., Seidel, M. P., Jungst, L. J., and DeGrandpre, M. D.: Controls of riverine CO2 over an annual cycle determined using direct, high temporal resolution pCO2 measurements, J. Geophys. Res., 115, G03016, https://doi.org/10.1029/2009JG001132, 2010.
Maavara, T., Lauerwald, R., Laruelle, G.G., Akbarzadeh, Z., Bouskill, N. J., Van Cappellen, P., and Regnier, P.: Nitrous oxide emissions from inland waters: Are IPCC estimates too high?, Glob. Change Biol., 25, 473–488, https://doi.org/10.1111/gcb.14504, 2018.
Malhi, Y., Adu-Bredu, S., Asare, R. A., Lewis, S. L., and Mayaux, P.: African rainforests: past, present and future, Philos. T. R. Soc. B, 368, 20120312, https://doi.org/10.1098/rstb.2012.0312, 2013.
Mann, P. J., Spencer, R. G. M., Dinga, B. J., Poulsen, J. R., Hernes, P. J., Fiske, G., Salter, M. E., Wang, Z. A., Hoering, K. A., Six, J., and Holmes R. M.: The biogeochemistry of carbon across a gradient of streams and rivers within the Congo Basin, J. Geophys. Res.-Biogeo., 119, 687–702, https://doi.org/10.1002/2013JG002442, 2014.
Maurice, L., Rawlins, B. G., Farr, G., Bell, R., and Gooddy, D. C.: The influence of flow and bed slope on gas transfer in steep streams and their implications for evasion of CO2, J. Geophys. Res.-Biogeo., 122, 2862–2875, https://doi.org/10.1002/2017JG004045, 2017.
Marwick, T. R., Tamooh, F., Ogwoka, B., Teodoru, C., Borges, A. V., Darchambeau, F., and Bouillon, S.: Dynamic seasonal nitrogen cycling in response to anthropogenic N loading in a tropical catchment, Athi–Galana–Sabaki River, Kenya, Biogeosciences, 11, 1–18, https://doi.org/10.5194/bg-11-1-2014, 2014.
Marx, A., Dusek, J., Jankovec, J., Sanda, M., Vogel, T., van Geldern, R., Hartmann, J., and Barth, J. A. C.: A review of CO2 and associated carbon dynamics in headwater streams: A global perspective, Rev. Geophys., 55, 560–585, https://doi.org/10.1002/2016RG000547, 2017.
McDowell, M. J. and Johnson, M. S.: Gas transfer velocities evaluated using carbon dioxide as a tracer show high streamflow to be a major driver of total CO2 evasion flux for a headwater stream, J. Geophys. Res.-Biogeo., 123, 2183–2197, https://doi.org/10.1029/2018JG004388, 2018.
Melack, J. M., Hess, L. L., Gastil, M., Forsberg, B. R., Hamilton, S. K., Lima, I. B. T., and Novo, E. M. L. M.: Regionalization of methane emissions in the Amazon Basin with microwave remote sensing, Glob. Change Biol., 10, 530–544, https://doi.org/10.1111/j.1365-2486.2004.00763.x, 2004.
Meybeck, M.: Global chemical weathering of surficial rocks estimated from river dissolved loads, Am. J. Sci., 287, 401–428, https://doi.org/10.2475/ajs.287.5.401, 1987.
Millero, F. J.: The thermodynamics of the carbonate system in seawater, Geochem. Cosmochem. Ac., 43, 1651–1661, https://doi.org/10.1016/0016-7037(79)90184-4,1979.
Morana, C., Borges, A. V., Roland, F. A. E., Darchambeau, F., Descy, J.-P., and Bouillon, S.: Methanotrophy within the water column of a large meromictic, tropical lake (Lake Kivu, East Africa), Biogeosciences, 12, 2077–2088, https://doi.org/10.5194/bg-12-2077-2015, 2015.
Nkounkou, R. R. and Probst, J. L.: Hydrology and geochemistry of the Congo river system, Mitt. Geol–Palaont. Inst. Univ. Hamburg, SCOPE/UNEP, 64, 483–508, 1987.
O'Loughlin, F., Trigg, M. A., Schumann, G. J.-P., and Bates, P. D.: Hydraulic characterization of the middle reach of the Congo River, Water Resour. Res., 49, 5059–5070, https://doi.org/10.1002/wrcr.20398, 2013.
Peter, H., Singer, G. A., Preiler, C., Chifflard, P., Steniczka, G., and Battin, T. J.: Scales and drivers of temporal pCO2 dynamics in an Alpine stream, J. Geophys. Res.-Biogeo., 119, 1078–1091, https://doi.org/10.1002/2013JG002552, 2014.
Powell, R. L., Yoo, E.-H., and Still, C. J.: Vegetation and soil carbon-13 isoscapes for South America: integrating remote sensing and ecosystem isotope measurements, Ecosphere, 3, 1–25, https://doi.org/10.1890/ES12-00162.1, 2012.
Prairie, Y. T., Bird, D. F., and Cole, J. J.: The summer metabolic balance in the epilimnion of southeastern Quebec lakes, Limnol. Oceanogr., 47, 316–321, https://doi.org/10.4319/lo.2002.47.1.0316, 2002.
Raymond, P. A., Zappa, C. J., Butman, D., Bott, T. L., Potter, C., Mulholland, P., Laursen, A. E., McDowell, W. H., and Newbold, D.: Scaling the gas transfer velocity and hydraulic geometry in streams and small rivers, Limnol. Oceanogr. Fluids Environ., 2, 41–53, https://doi.org/10.1215/21573689-1597669, 2012.
Raymond, P. A., Hartmann, J., Lauerwald, R., Sobek, S., McDonald, C., Hoover, M., Butman, D., Striegl, R., Mayorga, E., Humborg, C., Kortelainen, P., Dürr, H., Meybeck, M., Ciais, P., and Guth, P.: Global carbon dioxide emissions from inland waters, Nature, 503, 355–359, https://doi.org/10.1038/nature12760, 2013.
Reiman, J. H. and Xu, J. Y.: Diel variability of pCO2 and CO2 outgassing from the Lower Mississippi River: Implications for riverine CO2 outgassing estimation, Water, 11, 1–15, https://doi.org/10.3390/w11010043, 2019.
Richardson, D. C., Newbold, J. D., Aufdenkampe, A. K., Taylor, P. G., and Kaplan, L. A.: Measuring heterotrophic respiration rates of suspended particulate organic carbon from stream ecosystems, Limnol. Oceanogr.-Method., 11, 247–261, https://doi.org/10.4319/lom.2013.11.247, 2013.
Richey, J. E., Devol, A. H., Wofy, S. C., Victoria, R., and Riberio, M. N. G.: Biogenic gases and the oxidation and reduction of carbon in Amazon River and floodplain waters, Limnol. Oceanogr., 33, 551–561, https://doi.org/10.4319/lo.1988.33.4.0551, 1988.
Richey, J. E., Melack, J. M., Aufdenkampe, A. K., Ballester, V. M., and Hess, L.: Outgassing from Amazonian rivers and wetlands as a large tropical source of atmospheric CO2, Nature, 416, 617–620, https://doi.org/10.1038/416617a, 2002.
Runge, J.: Large Rivers: Geomorpholgy and Management, edited by: Gupta, A., John Wiley & Sons., 293–309, 2008.
Santos, I. R., Maher, D. T., and, Eyre B. D.: Coupling automated radon and carbon dioxide measurements in coastal waters, Environ. Sci. Technol., 46, 7685–7691, https://doi.org/10.1021/es301961b, 2012.
Saunois, M., Bousquet, P., Poulter, B., Peregon, A., Ciais, P., Canadell, J. G., Dlugokencky, E. J., Etiope, G., Bastviken, D., Houweling, S., Janssens-Maenhout, G., Tubiello, F. N., Castaldi, S., Jackson, R. B., Alexe, M., Arora, V. K., Beerling, D. J., Bergamaschi, P., Blake, D. R., Brailsford, G., Brovkin, V., Bruhwiler, L., Crevoisier, C., Crill, P., Kovey, K., Curry, C., Frankenberg, C., Gedney, N., Höglund-Isaksson, L., Ishizawa, M., Ito, A., Joos, F., Kim, H.-S., Kleinen, T., Krummel, P., Lamarque, J.-F., Langenfelds, R., Locatelli, R., Machida, T., Maksyutov, S., McDonald, K. C., Marshall, J., Melton, J. R., Morino, I., Naik, V., O'Doherty, S., Parmentier, F.-J. W., Patra, P. K., Peng, C., Peng, S., Peters, G., Pison, I., Prigent, C., Prinn, R., Ramonet, M., Riley, W. J., Saito, M., Sanyini, M., Schroeder, R., Simpson, I. J., Spahni, R., Steele, P., Takizawa, A., Thornton, B. F., Tian, H., Tohjima, Y., Viovy, N., Voulgarakis, A., van Weele, M., van der Werf, G., Weiss, R., Wiedinmyer, C., Wilton, D. J., Wiltshire, A., Worthy, D., Wunch, D. B., Xu, X., Yoshida, Y., Zhang, B., Zhang, Z., and Zhu, Q.: The global methane budget, Earth Syst. Sci. Data, 8, 697–751, https://doi.org/10.5194/essd-8-697-2016, 2016.
Sawakuchi, H. O., Bastviken, D., Sawakuchi, A. O., Krusche, A. V., Ballester, M. V. R., and Richey, J. E.: Methane emissions from Amazonian Rivers and their contribution to the global methane budget, Glob. Change Biol., 20, 2829–2840, https://doi.org/10.1111/gcb.12646, 2014.
Sawakuchi, H. O., Bastviken, D., Sawakuchi, A. O., Ward, N. D., Borges, C. D., Tsai, S. M., Richey, J. E., Ballester, M. V. R. and Krusche, A. V.: Oxidative mitigation of aquatic methane emissions in large Amazonian rivers, Glob. Change Biol., 22, 1075–1085, https://doi.org/10.1111/gcb.13169, 2016.
Scofield, V., Melack, J. M., Barbosa, P. M., Amaral, J. H. F., Forsberg, B. R., and Farjalla, V. F.: Carbon dioxide outgassing from Amazonian aquatic ecosystems in the Negro River basin, Biogeochemistry, 129, 77–91, https://doi.org/10.1007/s10533-016-0220-x, 2016.
Seitzinger, S. P. and Kroeze, C.: Global distribution of nitrous oxide production and N inputs in freshwater and coastal marine ecosystems, Global Biogeochem. Cy., 12, 93–113, https://doi.org/10.1029/97GB03657, 1998.
Simpson, H. and Herczeg, A.: Stable isotopes as an indicator of evaporation in the River Murray, Australia, Water Resour. Res., 27, 1925–1935, https://doi.org/10.1029/91WR00941, 1991.
Spencer, R. G. M., Hernes, P. J., Aufdenkampe, A. K., Baker, A., Gulliver, P., Stubbins, A., Aiken, G. R., Dyda, R. Y., Butler, K. D., Mwamba, V. L., Mangangu, A. M., Wabakanghanzi, J. N., and Six, J.: An initial investigation into the organic matter biogeochemistry of the Congo River, Geochim. Cosmochim. Ac., 84, 614–627, https://doi.org/10.1016/j.gca.2012.01.013, 2012.
SCA (Standing committee of Analysts): Ammonia in waters. Methods for the examination of waters and associated materials, 16 pp., 1981.
Stanley, E. H., Casson, N. J., Christel, S. T., Crawford, J. T., Loken, L. C., and Oliver, S. K.: The ecology of methane in streams and rivers: patterns, controls, and global significance, Ecol. Monogr., 86, 146–171, https://doi.org/10.1890/15-1027, 2016.
Still, C. J. and Powell, R. L.: Continental-scale distributions of vegetation stable carbon isotope ratios, edited by: West, J. B., Bowen, G. J., Dawson, T. E., Tu, K. P., Isoscapes, the Netherlands, Springer Netherlands, 179–193, 2010.
Takahashi, T., Sutherland, S. C., Wanninkhof, R., Sweeney, C., Feely, R. A., Chipman, D. W., Hales, B., Friederich, G., Chavez, F., Sabine, C., Watson, A., Bakker, D. C. E., Schuster, U., Metzl, N., Yoshikawa-Inoue, H.I., Ishii, M., Midorikawa, T., Nojiri, Y., Körtzinger, A., Steinhoff, T., Hoppema, M., Olafsson, J., Arnarson, T. S., Tilbrook, B., Johannessen, T., Olsen, A., Bellerby, R., Wong, C. S., Delille, B., Bates, N. R., and de Baar, H. J. W.: Climatological mean and decadal change in surface ocean pCO2, and net sea-air CO2 flux over the global oceans, Deep-Sea Res. Pt. II, 56, 554–577, https://doi.org/10.1016/j.dsr2.2008.12.009, 2009.
Tamooh, F., Borges, A. V., Meysman, F. J. R., Van Den Meersche, K., Dehairs, F., Merckx, R., and Bouillon, S.:Dynamics of dissolved inorganic carbon and aquatic metabolism in the Tana River basin, Kenya, Biogeosciences, 10, 6911–6928, https://doi.org/10.5194/bg-10-6911-2013, 2013
Teodoru, C. R., Nyoni, F. C., Borges, A. V., Darachambeau, F., Nyambe, I., and Bouillon, S.: Spatial variability and temporal dynamics of greenhouse gas (CO2, CH4, N2O) concentrations and fluxes along the Zambezi River mainstem and major tributaries, Biogeosciences, 12, 2431–2453, https://doi.org/10.5194/bg-12-2431-2015, 2015.
Tyler, S. C., Bilek, R. S., Sass, R. L., and Fisher, F. M.: Methane oxidation and pathways of production in a Texas paddy field deduced from measurements of flux, δ13C, and δD of CH4, Global Biogeochem. Cy., 11, 323–348, https://doi.org/10.1029/97GB01624, 1997.
Ulseth, A. J., Hall Jr, R. O., Canadell, M. B., Madinger, H. L., Niayifar, A., and Battin, T. J.: Distinct air–water gas exchange regimes in low- and high-energy streams, Nat. Geosci., 12, 259–263, https://doi.org/10.1038/s41561-019-0324-8, 2019
Upstill-Goddard, R. C., Salter, M. E., Mann, P. J., Barnes, J., Poulsen, J., Dinga, B., Fiske, G. J., and Holmes, R. M.: The riverine source of CH4 and N2O from the Republic of Congo, western Congo Basin, Biogeosciences, 14, 2267–2281, https://doi.org/10.5194/bg-14-2267-2017, 2017.
Ward, N. D., Krusche, A. V., Sawakuchi, H. O., Brito, D. C., Cunha, A. C., Sousa Moura, J. M., da Silva, R., Yager, P. L., Keil, R. G., and Richey, J. E.: The compositional evolution of dissolved and particulate organic matter along the lower Amazon River–Óbidos to the ocean, Mar. Chem., 177, 244–256, https://doi.org/10.1016/j.marchem.2015.06.013, 2015.
Ward N. D., Sawakuchi, H. O., Neu, V., Less, D. F. S., Valerio, A. M., Cunha, A. C., Kampel, M., Bianchi, T. S., Krusche, A. V., Richey, J. E., and Keil, R. G.: Velocity-amplified microbial respiration rates in the lower Amazon River, Limnol. Oceanogr. Lett., 3, 265–274, https://doi.org/10.1002/lol2.10062, 2018.
Wassenaar, L. I., Coplen, T. B., and Aggarwal, P. K.: Approaches for achieving long-term accuracy and precision of δ18O and δ2H for waters analyzed using laser absorption spectrometers, Environ. Sci. Technol., 48, 1123–1131, https://doi.org/10.1021/es403354n, 2014.
Weiss, R. F.: Determinations of carbon dioxide and methane by dual catalyst flame ionization chromatography and nitrous oxide by electron capture chromatography, J. Chromatogr. Sci., 19, 611–616, https://doi.org/10.1093/chromsci/19.12.611, 1981.
Weiss, R. F. and Price, B. A.: Nitrous oxide solubility in water and seawater, Mar. Chem., 8, 347–359, https://doi.org/10.1016/0304-4203(80)90024-9, 1980.
Wissmar, R. C., Richey, J. E., Stallard, R. F., and Edmond, J. M.: Plankton metabolism and carbon processes in the Amazon river, its tributaries, and floodplain waters, Peru-Brazil, May–June 1977, Ecology, 62, 1622–1633, https://doi.org/10.2307/1941517, 1981.
Yoshida, N., Iguchi, H., Yurimoto, H., Murakami, A., and Sakai, Y.: Aquatic plant surface as a niche for methanotrophs, Front. Microbiol., 30, 1–9, https://doi.org/10.3389/fmicb.2014.00030, 2014.
Zhou, L., Tian, Y., Myneni, R. B., Ciais, P., Saatchi, S. L., Yi Y., Shilong, P., Chen, H., Vermote, E. F., Song, C., and Hwang, T.: Widespread decline of Congo rainforest greenness in the past decade, Nature, 509, 86–90, https://doi.org/10.1038/nature13265, 2014.