the Creative Commons Attribution 4.0 License.
the Creative Commons Attribution 4.0 License.
 | 07 Oct 2019
Rapid environmental responses to climate-induced hydrographic changes in the Baltic Sea entrance
Laurie M. Charrieau
Karl Ljung
Frederik Schenk
Ute Daewel
Emma Kritzberg
Helena L. Filipsson
The Öresund (the Sound), which is a part of the Danish straits, is linking the marine North Sea and the brackish Baltic Sea. It is a transition zone where ecosystems are subjected to large gradients in terms of salinity, temperature, carbonate chemistry, and dissolved oxygen concentration. In addition to the highly variable environmental conditions, the area is responding to anthropogenic disturbances in, e.g., nutrient loading, temperature, and pH. We have reconstructed environmental changes in the Öresund during the last ca. 200 years, and especially dissolved oxygen concentration, salinity, organic matter content, and pollution levels, using benthic foraminifera and sediment geochemistry. Five zones with characteristic foraminiferal assemblages were identified, each reflecting the environmental conditions for the respective period. The largest changes occurred around 1950, when the foraminiferal assemblage shifted from a low diversity fauna dominated by the species Stainforthia fusiformis to higher diversity and abundance and dominance of the Elphidium species. Concurrently, the grain-size distribution shifted from clayey to sandier sediment. To explore the causes of the environmental changes, we used time series of reconstructed wind conditions coupled with large-scale climate variations as recorded by the North Atlantic Oscillation (NAO) index as well as the ECOSMO II model of currents in the Öresund area. The results indicate increased changes in the water circulation towards stronger currents in the area after the 1950s. The foraminiferal fauna responded quickly (<10 years) to the environmental changes. Notably, when the wind conditions, and thereby the current system, returned in the 1980s to the previous pattern, the foraminiferal assemblage did not rebound. Instead, the foraminiferal faunas displayed a new equilibrium state.
- Article
(7721 KB) - Full-text XML
-
Supplement
(155 KB) - BibTeX
- EndNote


The Öresund (the Sound) is one part of the Danish straits between Sweden and Denmark. Together with the Great and Little belts, they link the open-ocean waters of the North Sea and the brackish waters of the Baltic Sea. The confluence of the water masses creates a north–south gradient as well as a strong vertical stratification of the water in terms of salinity, carbonate chemistry, and dissolved oxygen concentration ([O2]) (Leppäranta and Myrberg, 2009). The depth of the halocline mainly depends of the outflows from the Baltic Sea; a strong thermocline develops during spring and summer, which further strengthens the vertical stratification. Thus, the ecosystems in the Öresund are exposed – and adapted – to a unique transitional environment. The region is also characterized by intense human activities, with 4 million people living in the vicinity of the Öresund and 85 million people living in the catchment area of the Baltic Sea (HELCOM, 2009). Discharge from agriculture, industry, and urban areas on both the Swedish and Danish sides of the strait and the considerable impact of marine traffic – the strait is one of the busiest waterways in the world – generate pollution and eutrophication of the water (HELCOM, 2009; ICES 2010). Since the 1980s, the implementation of efficient wastewater treatment and measures in agriculture contributed to markedly reducing the amount of nutrients coming from river run-off (Nausch et al., 1999; Carstensen et al., 2006; Rydberg et al., 2006). However, these efforts in decreasing nutrient loads have not resulted in improved water quality, due to the long timescales of biogeochemical cycles in reaching equilibrium in the Baltic Sea region (Gustafsson et al., 2012). The Öresund, like most of the Baltic Sea, is still assessed to be eutrophic, and hypoxic events are frequent (Rosenberg et al., 1996; Conley et al., 2007, 2011; HELCOM, 2009; Wesslander et al., 2016). Moreover, increasing temperatures and declining pH, linked to global climate change and ocean acidification, have been reported for surface and bottom waters in the area (Andersson et al., 2008; Göransson, 2017). As a result, ecosystems in the Öresund are currently under the combined impact of natural and anthropogenic stressors (Henriksson, 1969; Göransson et al., 2002; HELCOM, 2009; ICES, 2010). The multiple stressors currently affecting the environment make this region particularly interesting to study and also highlight the need to obtain records of decadal and centennial environmental changes. As noted above, both recent human-induced impacts and climate variability have been substantial in the region. Therefore the question arises whether these factors have affected the benthic environment. Furthermore, sediment records of past environmental changes can provide a crucial context for ongoing and future predicted changes in the Öresund and Baltic Sea regions.
We used the marine sediment record and its contents of foraminifera as well as sediment geochemistry to obtain records of decadal environmental changes. Benthic foraminifera are widely used for environmental reconstructions, based on their rapid response to environmental changes, broad distribution, high densities, and often well-preserved tests (shells) in the sediment (e.g., Sen Gupta, 1999b; Murray, 2006). For instance, distributions of benthic foraminifera have been used for historical environmental reconstructions of fjords on decadal to centennial timescales on the Swedish western coast (Nordberg et al., 2000; Filipsson and Nordberg, 2004a, b; Polovodova Asteman and Nordberg, 2013; Polovodova Asteman et al., 2015) and in the Kattegat (Seidenkrantz, 1993; Christiansen et al., 1996). In the Öresund, living foraminiferal assemblages have been studied (Hansen, 1965; Charrieau et al., 2018), but to the best of our knowledge, no studies of past foraminiferal assemblages have been performed. The objective of this study was to reconstruct the environmental conditions of benthic systems during the last 2 centuries in the Öresund by using foraminiferal fauna analysis in combination with sediment geochemistry and grain size. Furthermore, we analyzed long time series of wind conditions in the area to evaluate the coupling between local changes in ecosystem variables and variations in atmospheric and subsequent hydrographic conditions, and a possible link with large-scale variations expressed through the North Atlantic Oscillation (NAO) index. Finally, we compared our data with the ECOSMO II model (Daewel and Schrum, 2013, 2017) of currents and water circulation changes in the Öresund area during the period 1948–2013.
The Öresund is a 118 km long narrow strait (Fig. 1). The water depth in the northern part is on average 24 m, but it reaches 53 m south of the island of Ven. The Öresund is an important link between the North Sea, Skagerrak, Kattegat, and the Baltic Sea (Fig. 1), and up to 30 % of the water exchange in the region goes through the Öresund (Sayin and Krauß, 1996; Leppäranta and Myrberg, 2009). The remaining part goes through the Great and Little belts. The width of the Öresund varies between 4 and 28 km, and the water has overall high current velocities, up to 1.5 m s−1 at the upper water layer in the northern part (Nielsen, 2001). The fully marine Skagerrak consists of water masses from the North Sea and the North Atlantic and in general a thin surface layer with water originating from the Baltic Sea and rivers draining into the sea; the water circulation forms a cyclonic gyre (cf. Erbs-Hansen et al., 2012). Parts of the Skagerrak waters reach the Kattegat and the Baltic Sea, where they are successively diluted with the large amounts of freshwater (around 15 000 m3 s−1, Bergström and Carlsson, 1994) draining into the Baltic Sea from numerous large rivers. The low-saline Baltic Sea surface water is transported by the Baltic Current, which is typically confined along the Swedish western coast in the Kattegat but which may cover a larger surface area towards the west, depending on wind direction. The Baltic Current later joins the Norwegian Coastal Current in the Skagerrak (Fig. 1). The large freshwater input and the subsequent large salinity difference between the Kattegat and Baltic Sea result in a two-layer structure in the Öresund (Fig. 2) (She et al., 2007; Leppäranta and Myrberg, 2009). The water stratification is influenced by the surface water from the Arkona Basin (salinity 7.5–8.5), the surface water from the Kattegat upper layer (salinity 18–26), and the lower layer of the Kattegat (salinity 32–34).
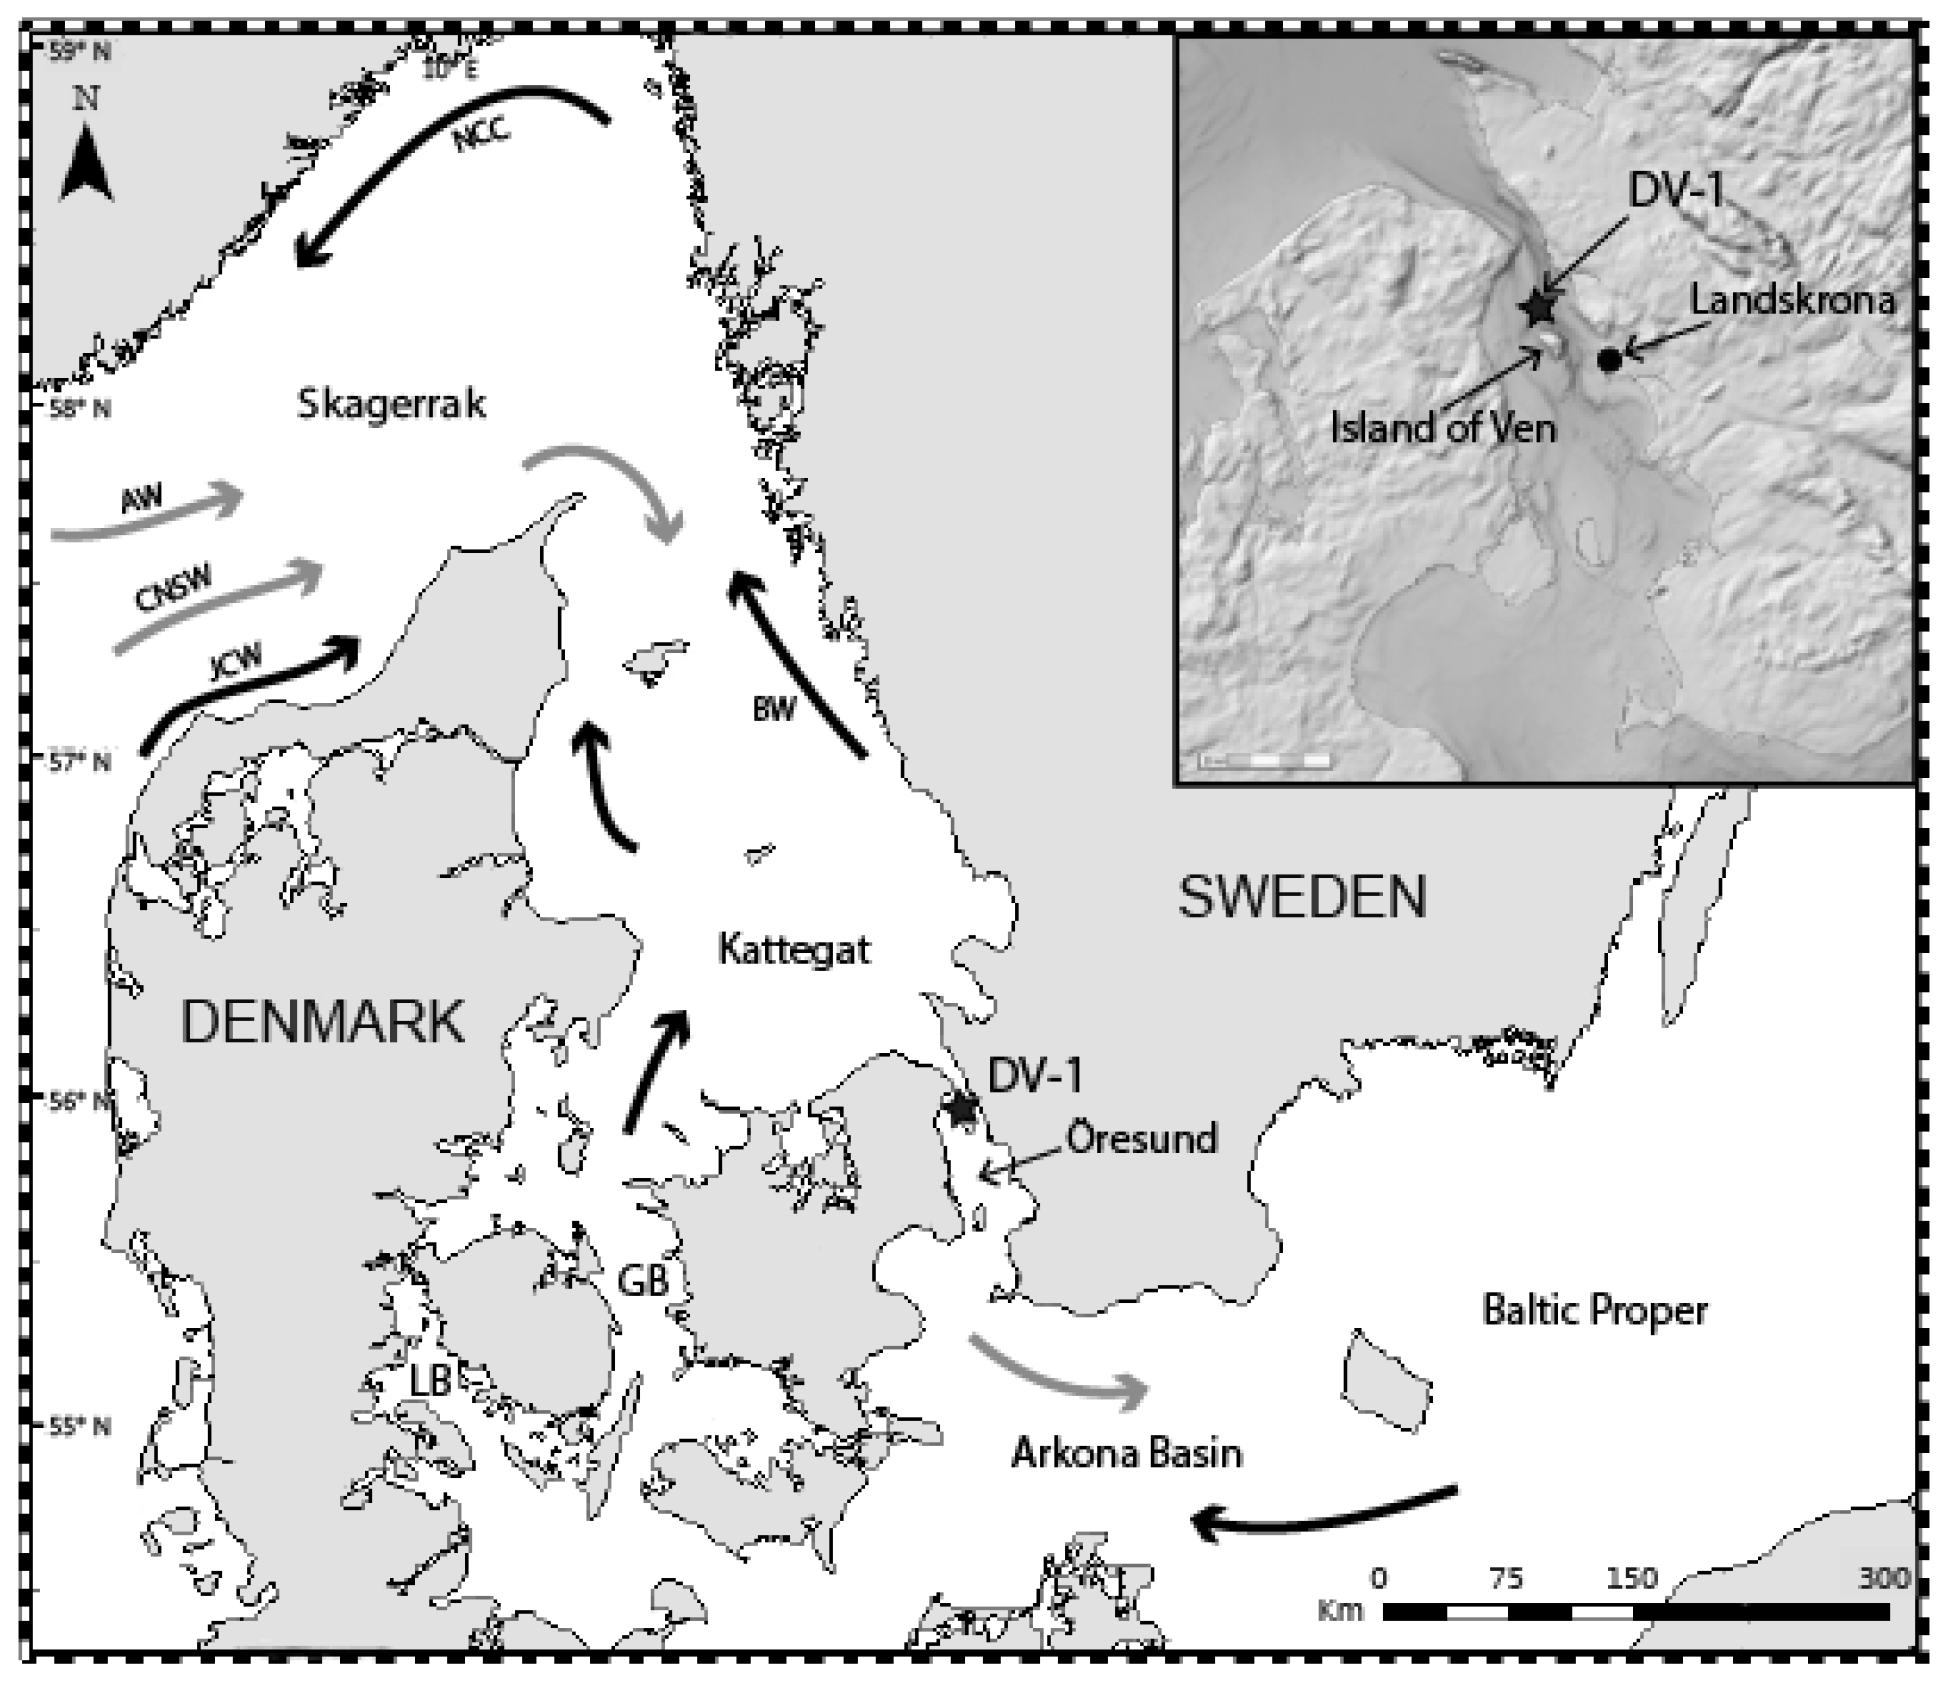
Figure 1Map of the studied area. The star shows the focused station of this study. General water circulation: main surface currents (black arrows) and main deep currents (grey arrows). GB: Great Belt; LB: Little Belt; AW: Atlantic Water; CNSW: Central North Sea Water; JCW; Jutland Coastal Water; NCC: Norwegian Coastal Current; BW: Baltic Water. Insert source: ©BSHC.
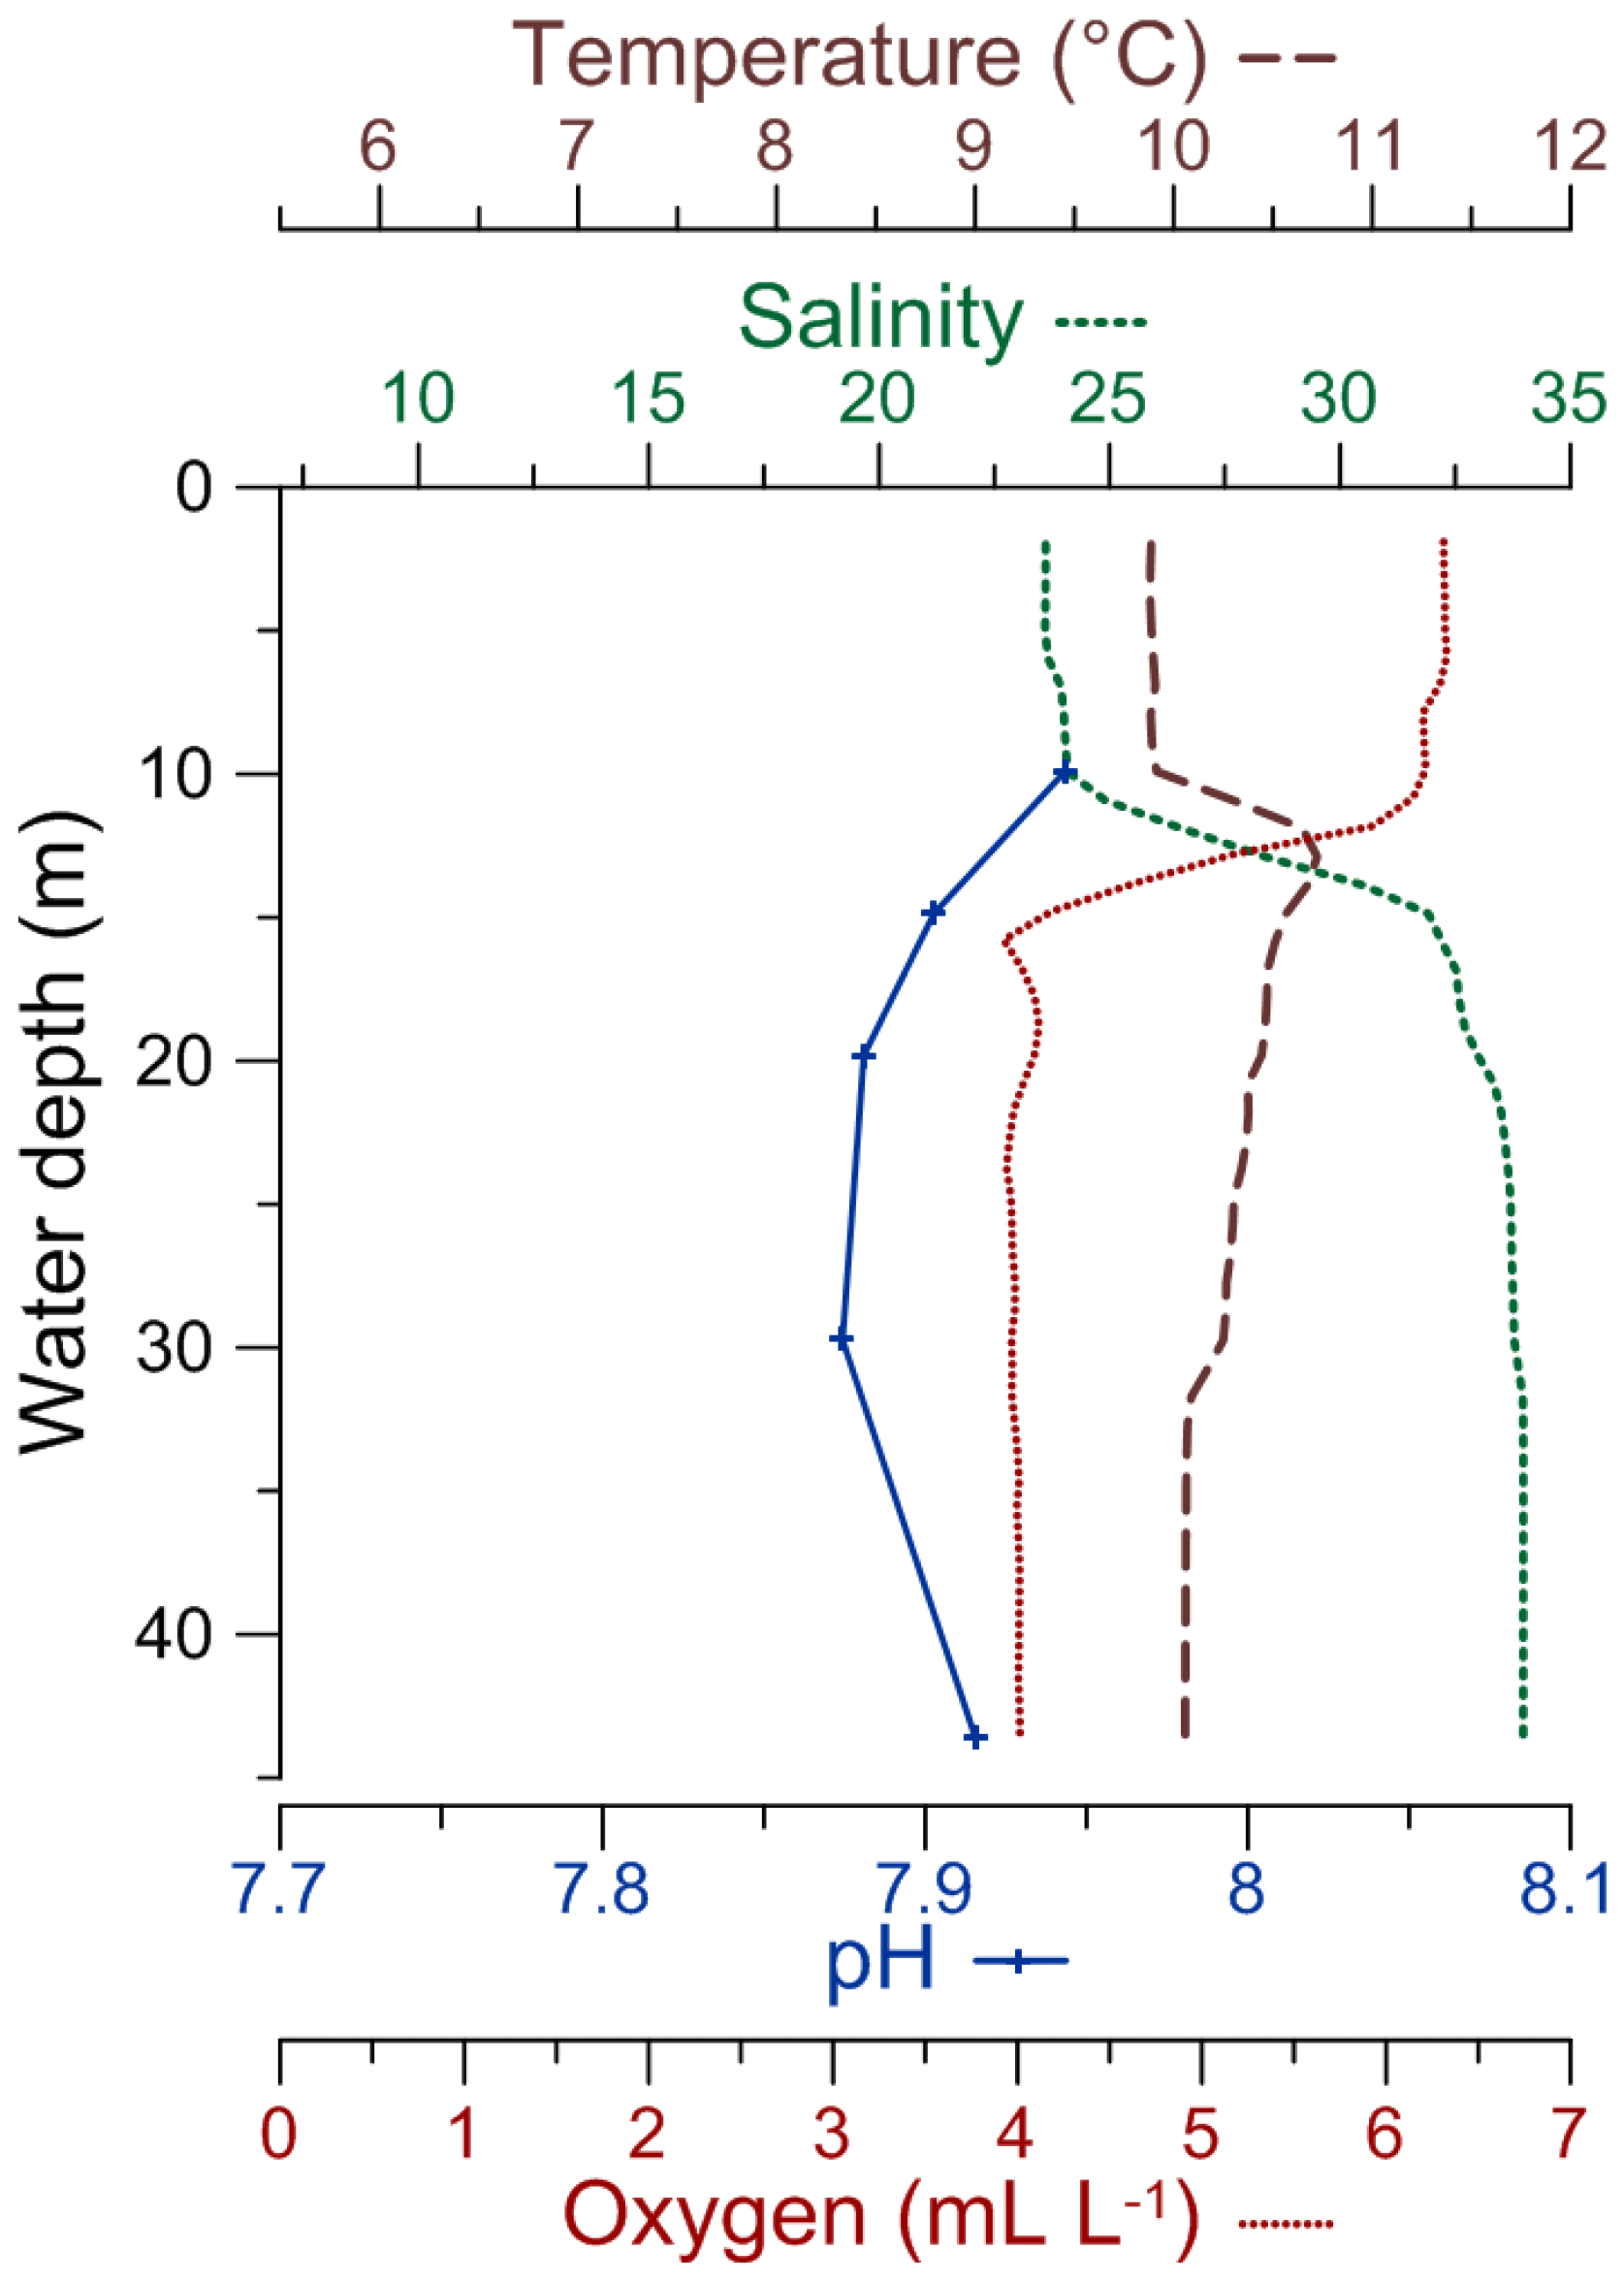
Figure 2CTD profiles of temperature, salinity, pH, and dissolved oxygen concentration in the water column for the DV-1 station (modified from Charrieau et al., 2018).
Salinity, temperature, pH, [O2], and nutrient content, here represented by dissolved inorganic nitrogen concentration [DIN] (nitrate + nitrite + ammonium), in the surface and bottom waters of the Öresund vary seasonally (Fig. 3, Supplement Fig. S1). At the surface and bottom water, salinity ranges between ∼8 and ∼18 and between ∼29 and ∼34, respectively, and it is more stable between April and July, when the stratification is strongest (Fig. 3). Temperature ranges between ∼1 ∘C in February and ∼19 ∘C in July in the surface water, while in the bottom water, the lowest temperature is found in March–April with ∼5∘C, and the highest temperature in October–November with ∼13 ∘C. The pH varies between ∼8.1 and ∼8.6 in the surface water, and between ∼7.8 and ∼8.6 in the bottom water, without a clear seasonal pattern (Fig. 3). [O2] in the bottom water reaches ∼7 mL L−1 in January, and it is typically below 2 mL L−1 in October, approaching hypoxic values. In the surface water, [DIN] can reach ∼7 µmol L−1 in January, and it is ∼0 µmol L−1 between April and August (Fig. 3).
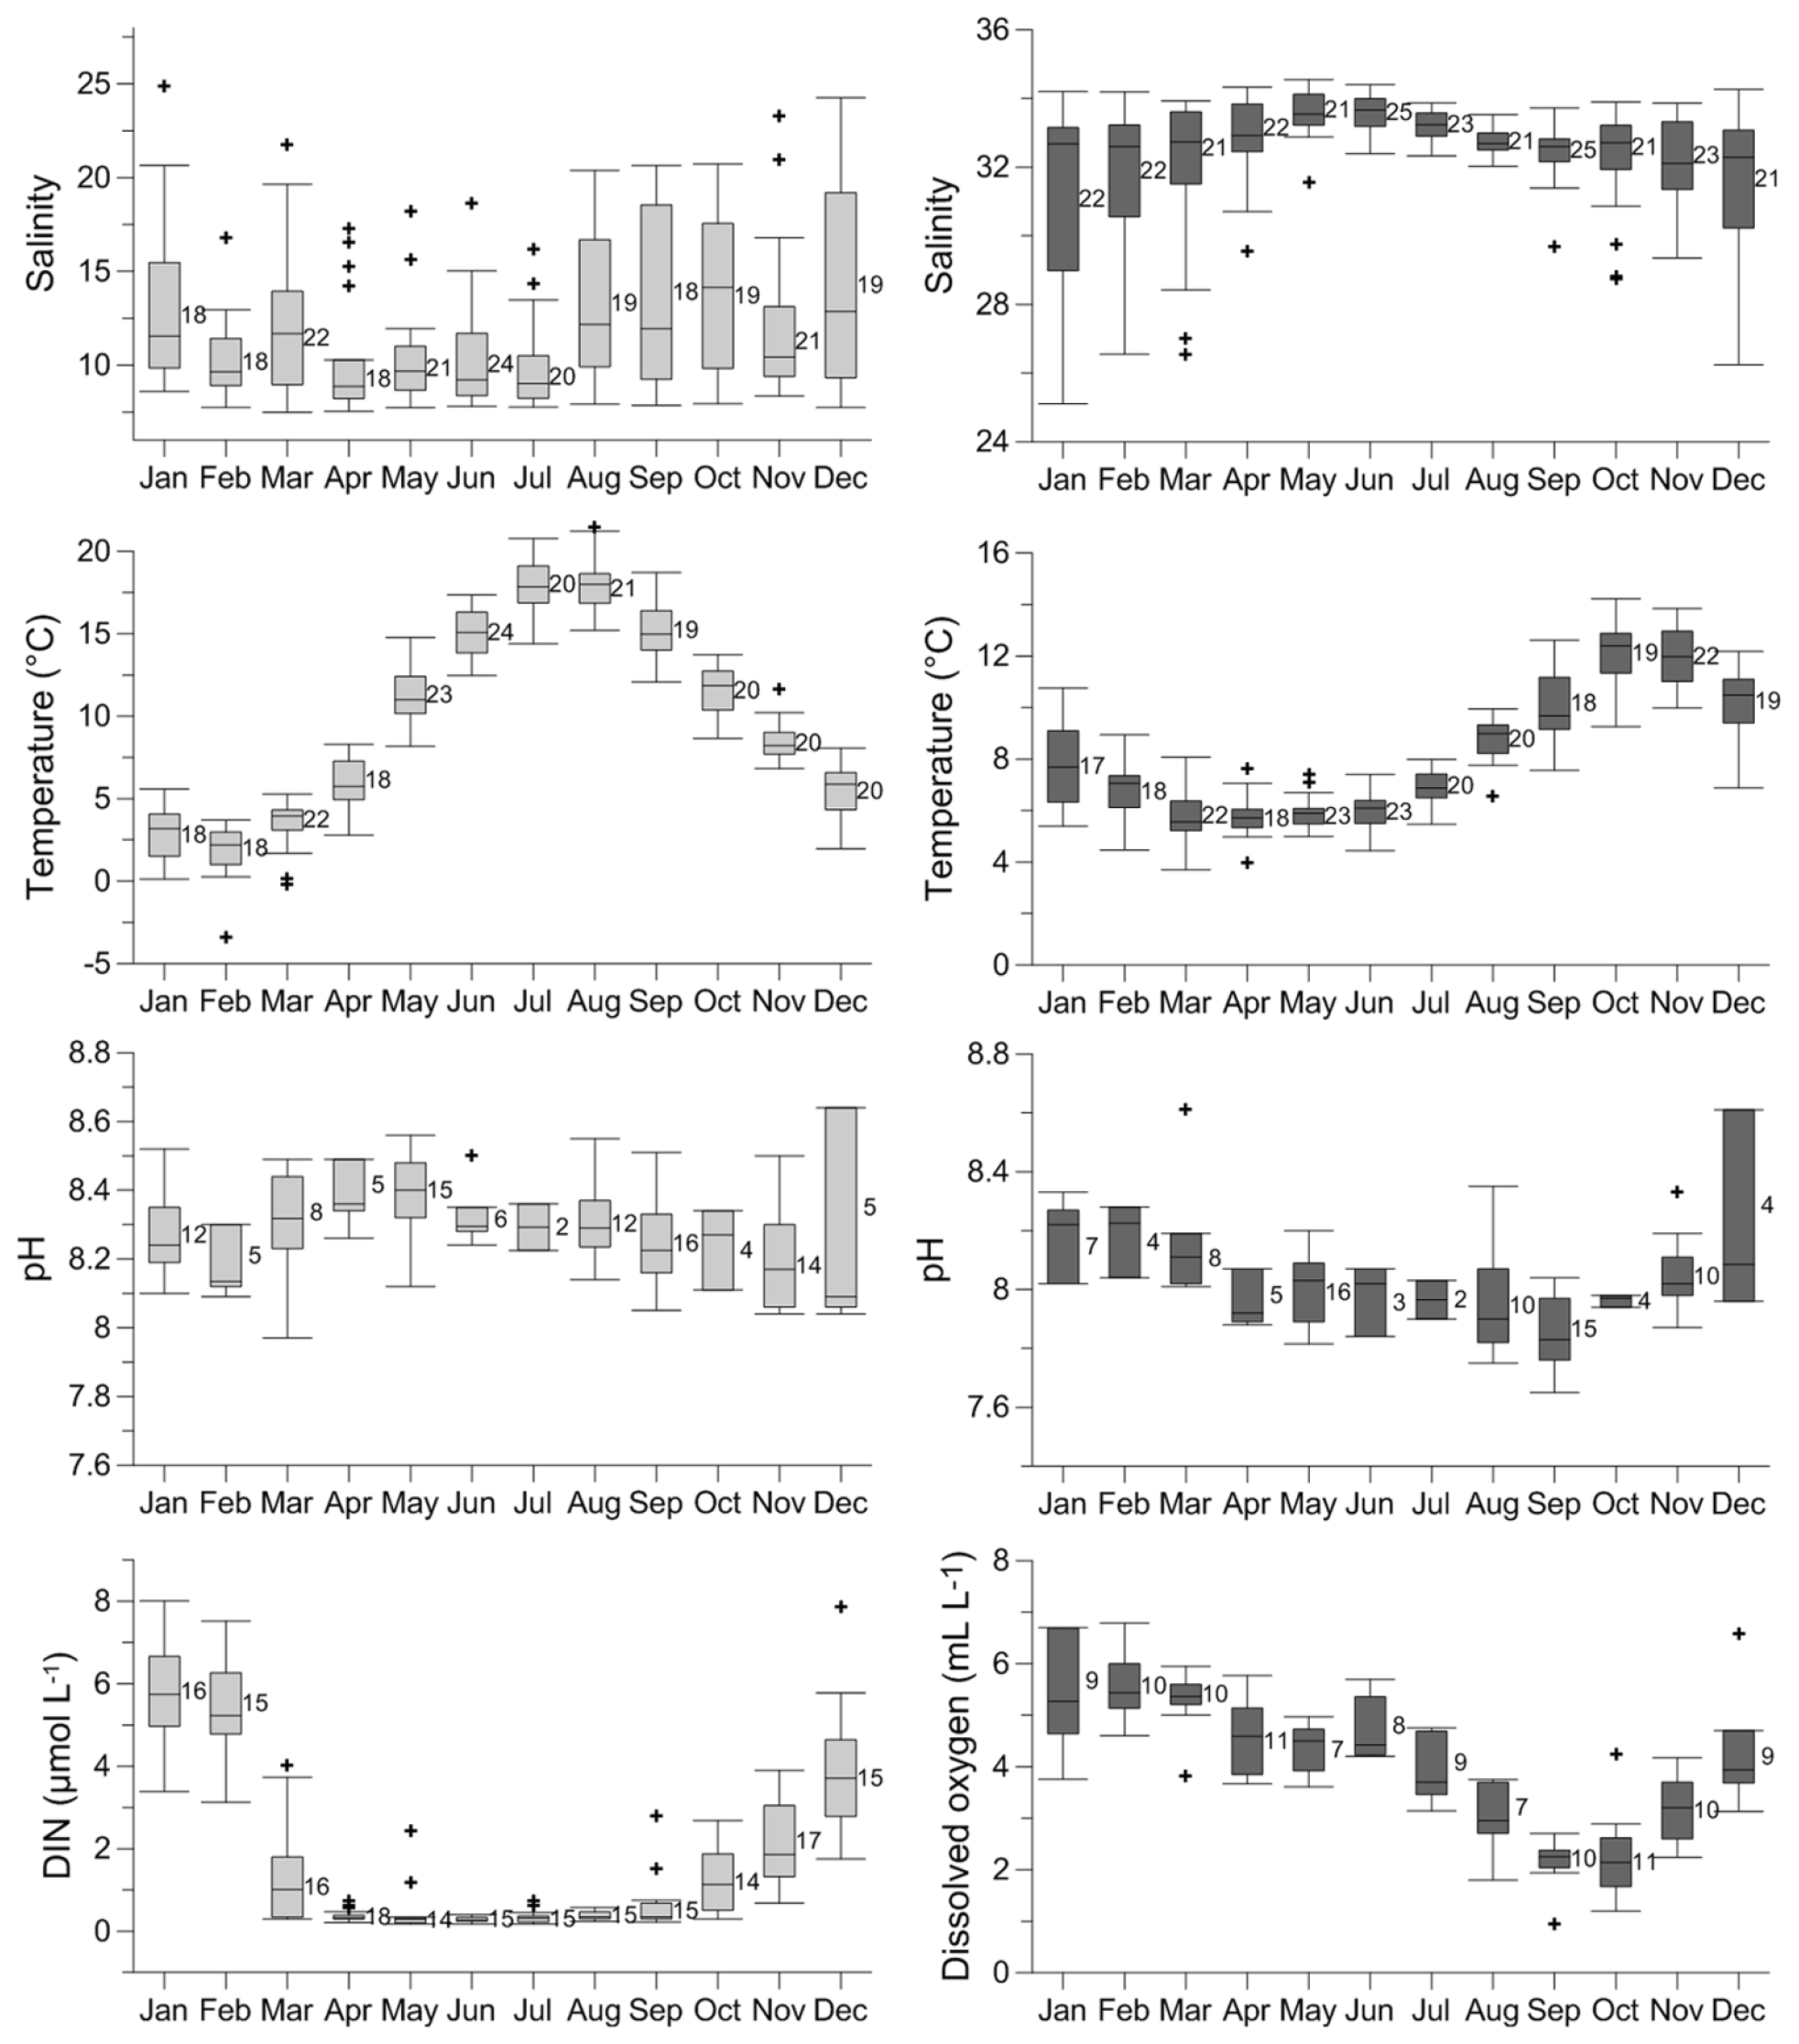
Figure 3Seasonal variability of salinity, temperature, pH, and dissolved inorganic nitrogen (DIN) concentration at the surface water (light grey), and seasonal variability of salinity, temperature, pH, and dissolved oxygen concentration at the bottom water (40–50 m) (dark grey) of the Öresund. The data were measured between 1965 and 2016 by the SMHI (Swedish Meteorological and Hydrological Institute) at station W LANDSKRONA. The number of measurements is indicated for each month.
3.1 Sampling
A suite of sediment cores, as well as water samples from the water column, were collected in November 2013 during a cruise with R/V Skagerak. Here we present the data from two sediment cores sampled at Öresund station DV-1 (55∘55.59′ N, 12∘42.66′ E) (Fig. 1), north of the island of Ven. The water depth was 45 m, and CTD (conductivity, temperature, depth) casts were taken to measure salinity, temperature, and [O2] in the water column. Water samples were collected at 10, 15, 20, 30, and 43 m from the Niskin bottles for carbonate chemistry analyses. The CTD and carbonate chemistry data are presented in Charrieau et al. (2018). In general, it is challenging to obtain sediment cores in the Öresund, due to the high current velocities up to 1.5 m s−1 (Nielsen, 2001), human-induced disturbances, and limited areas of recent sediment deposition (Lumborg, 2005), but our site north of Ven represents an accumulation area. The cores (9 cm inner diameter) were collected using a GEMAX twin-barrel corer. The corer allowed sampling of 30 and 36 cm long sediment cores (referred to in this study as cores DV1-G and DV1-I, respectively), which were sliced into 1 cm sections. The samples from the DV1-G core were analyzed for carbon and nitrogen content and grain size distribution, and were dated using Gamma spectroscopy. The samples from the DV1-I core were analyzed with respect to foraminiferal fauna and carbon and nitrogen content. The distinct carbon content profiles, measured on both cores, were used to correlate the 210Pb dated DV1-G core with the DV1-I core used for foraminiferal analyses.
3.2 Chronology
The age–depth model was established using 210Pb and 137Cs techniques on samples from the DV1-G core. The samples were measured with an ORTEC HPGe (High-Purity Germanium) Gamma Detector at the Department of Geology at Lund University, Sweden. Corrections for self-absorption were made for 210Pb following Cutshall et al. (1983). The instruments were calibrated against in-house standards and the maximum error was 0.5 years in the measurements. Excess (unsupported) 210Pb was measured down to 23 cm and the age model was calculated based on the Constant Rate of 210Pb Supply (CRS) model (Appleby, 2001).
3.3 Foraminifera analyses
Approximately 10 g of freeze-dried sediment per sample was wet-sieved thought a 63 µm mesh screen and dried on filter paper at room temperature. Subsequently, the samples were dry-sieved through 100 and 500 µm mesh screens and separated into the fractions 100–500 µm and > 500 µm. The foraminifera from every second centimeter of the core – plus from additional centimeters around key zones – were picked and sorted under a Nikon microscope (22 samples in total). A minimum of 300 specimens per sample were picked and identified, as recommended by Patterson and Fishbein (1989). If necessary the samples were split with an Otto splitter (Otto, 1933). For taxonomy at the genus level, we mainly followed Loeblich and Tappan (1964) with some updates from the more recent literature, e.g., Tappan and Loeblich (1988). For taxonomy at the species level, we mainly used Feyling-Hanssen (1964), Feyling-Hanssen et al. (1971), and Murray and Alve (2011). For original descriptions of the species, see Ellis and Messina (1942 and supplements up to 2013).
Recently, the eastern Pacific morphospecies Nonionella stella has been presented as an invasive species in the Skagerrak–Kattegat region (Asteman and Schönfeld, 2016). However, a comparison of N. stella DNA sequences from the Santa Barbara Basin (USA) (Bernhard et al., 1997) with the Swedish western coast specimens demonstrates that they represent two closely related species but are not conspecific (Deldicq et al., 2019). Therefore, we have referred to the species found here as Nonionella sp. T1, following Deldicq et al. (2019). The species Verneuilina media (here referred to as the genus Eggerelloides), which has often been reported in previous studies from the Skagerrak–Kattegat area (e.g., Conradsen et al., 1994), was morphologically close to Eggerelloides scabrus in the present material, and these two species have been grouped as E. medius/scabrus. The taxon Elphidium excavatum forma clavata (cf. Feyling-Hanssen, 1972) was referred to as Elphidium clavatum following Darling et al. (2016). Elphidium clavatum and Elphidium selseyense (Heron-Allen and Earland, 1911) were morphologically difficult to separate in this region, as transitional forms occur. The dominant species was E. clavatum, but we acknowledge that a few individuals of E. selseyense could have been included in the counts. The taxon Ammonia beccarii was referred to as Ammonia batava, following recent molecular work done on the taxon Ammonia in the Kattegat region (Groeneveld et al., 2018; Bird et al., 2019).
Foraminiferal density was calculated and normalized to the number of specimens per 50 cm3. Data of densities for the first 2 cm of the core are from Charrieau et al. (2018). Some specimens displayed decalcified tests; however, the inner organic linings were preserved. These inner organic linings were reported separately and not included in the total foraminiferal counts. Benthic foraminiferal accumulation rates were calculated as follows:
where BF is the number of benthic foraminifera per cm3 and SAR is the sediment accumulation rate (cm yr−1). Foraminiferal species that accounted for > 5 % of the total fauna in at least one of the samples were considered major species, and their density was used in statistical analysis. The Shannon index was calculated to describe the foraminiferal diversity. To determine foraminiferal zones, stratigraphically constrained cluster analysis was performed, using the size-independent Morisita index to account for the large differences in the densities between samples (e.g., Krebs, 1998). A dendrogram was then constructed based on arithmetic averages with the UPGMA method (unweighted pair group method with arithmetic mean). Correspondence analysis was also performed to determine significant foraminiferal species in each zone. Statistical analyses were performed using the PAST software (Hammer et al., 2001).
3.4 Organic matter analyses
Total organic carbon (TOC) and total nitrogen (TN) contents were measured for both DV1-G and DV1-I. Approximately 8 mg of freeze-dried sediment was homogenized for each centimeter and placed in silver capsules. Removal of inorganic carbon was carried out by the in situ acidification (2M HCl) method based on Brodie et al. (2011). TOC and TN contents were analyzed on a Costech ECS 4010 Elemental Analyzer at the Department of Geology, Lund University. The instrument was calibrated against in-house standards. The analytical precisions showed a reproducibility of 0.2 % and 0.03 % for TOC and TN contents, respectively. The molar C∕N ratio was calculated.
3.5 Grain-size analyses
Grain-size analyses were performed on core DV1-G using 3.5 to 5 g of freeze-dried sediment for each centimeter. Organic matter was removed by adding 15 mL of 30 % H2O2 and heating during 3 to 4 min until the reaction ceased. After the samples had cooled down, 10 mL of 10 % HCl was added to remove carbonates; thereafter the sediment was washed with milli-Q until its pH was neutral. In the last step, biogenic silica was removed by boiling the sediment in 100 mL 8 % NaOH and then washed until neutral pH was reached. The sand fraction (> 63 µm) was separated by sieving and the mass fraction of sand of each sample was calculated. Grain sizes < 63 µm were analyzed by laser diffraction using a Sedigraph III Particle Size Analyzer at the Department of Geology, Lund University. The data were categorized into three size groups, < 4 µm (clay), 4–63 µm (silt), and 63–2000 µm (sand).
3.6 Climate data and numerical modeling
Data from the High Resolution Atmospheric Forcing Fields (HiResAFF) dataset covering the time period 1850–2008 (Schenk and Zorita, 2012; Schenk, 2015) were used to study the variations of near-surface (10 m) wind conditions during the winter half of the year (October to March). The daily dataset can be downloaded from WDC Climate (Schenk, 2017). Wind conditions over the Öresund are represented by the closest grid point of HiResAFF at 55∘ N and 12.5∘ E. The North Atlantic Oscillation (NAO) index as defined by Jones et al. (1997) for boreal winter (December to March) was used, with updates taken from the Climate Research Unit (CRU, https://crudata.uea.ac.uk/cru/data/nao/, last access: January 2019). To allow comparison, the NAO and wind data were normalized relative to the period 1850–2008. Changes in the currents through the Öresund and the Kattegat were taken from the ECOSMO II fully coupled physical biogeochemical model (Daewel and Schrum, 2013, 2017), which was forced by NCEP/NCAR reanalysis data and covers the period 1950–2013. In model ECOSMO II, the simulated south–north currents are represented as the VAV (vertically averaged V component) and the simulated west–east currents as the UAV (vertically averaged U component).
4.1 Age model
The unsupported 210Pb showed a decreasing trend with depth in the DV1-G core (Fig. 4a, b). The peak observed in the 137Cs around 9 cm corresponds to the Chernobyl accident in 1986 (Fig. 4c). The unsupported 210Pb allowed direct dating of the core between 2013 and 1913. The sedimentation rate ranged between 1 and 5.6 mm yr−1, with an average of 2.2 mm yr−1, and decreased with depth. The ages of the lower part of the sediment record were deduced by linear extrapolation based on a sedimentation rate of 1.4 mm yr−1, corresponding to the linear mean sedimentation rate between the years 1913 and 1946 (Fig. 4d).
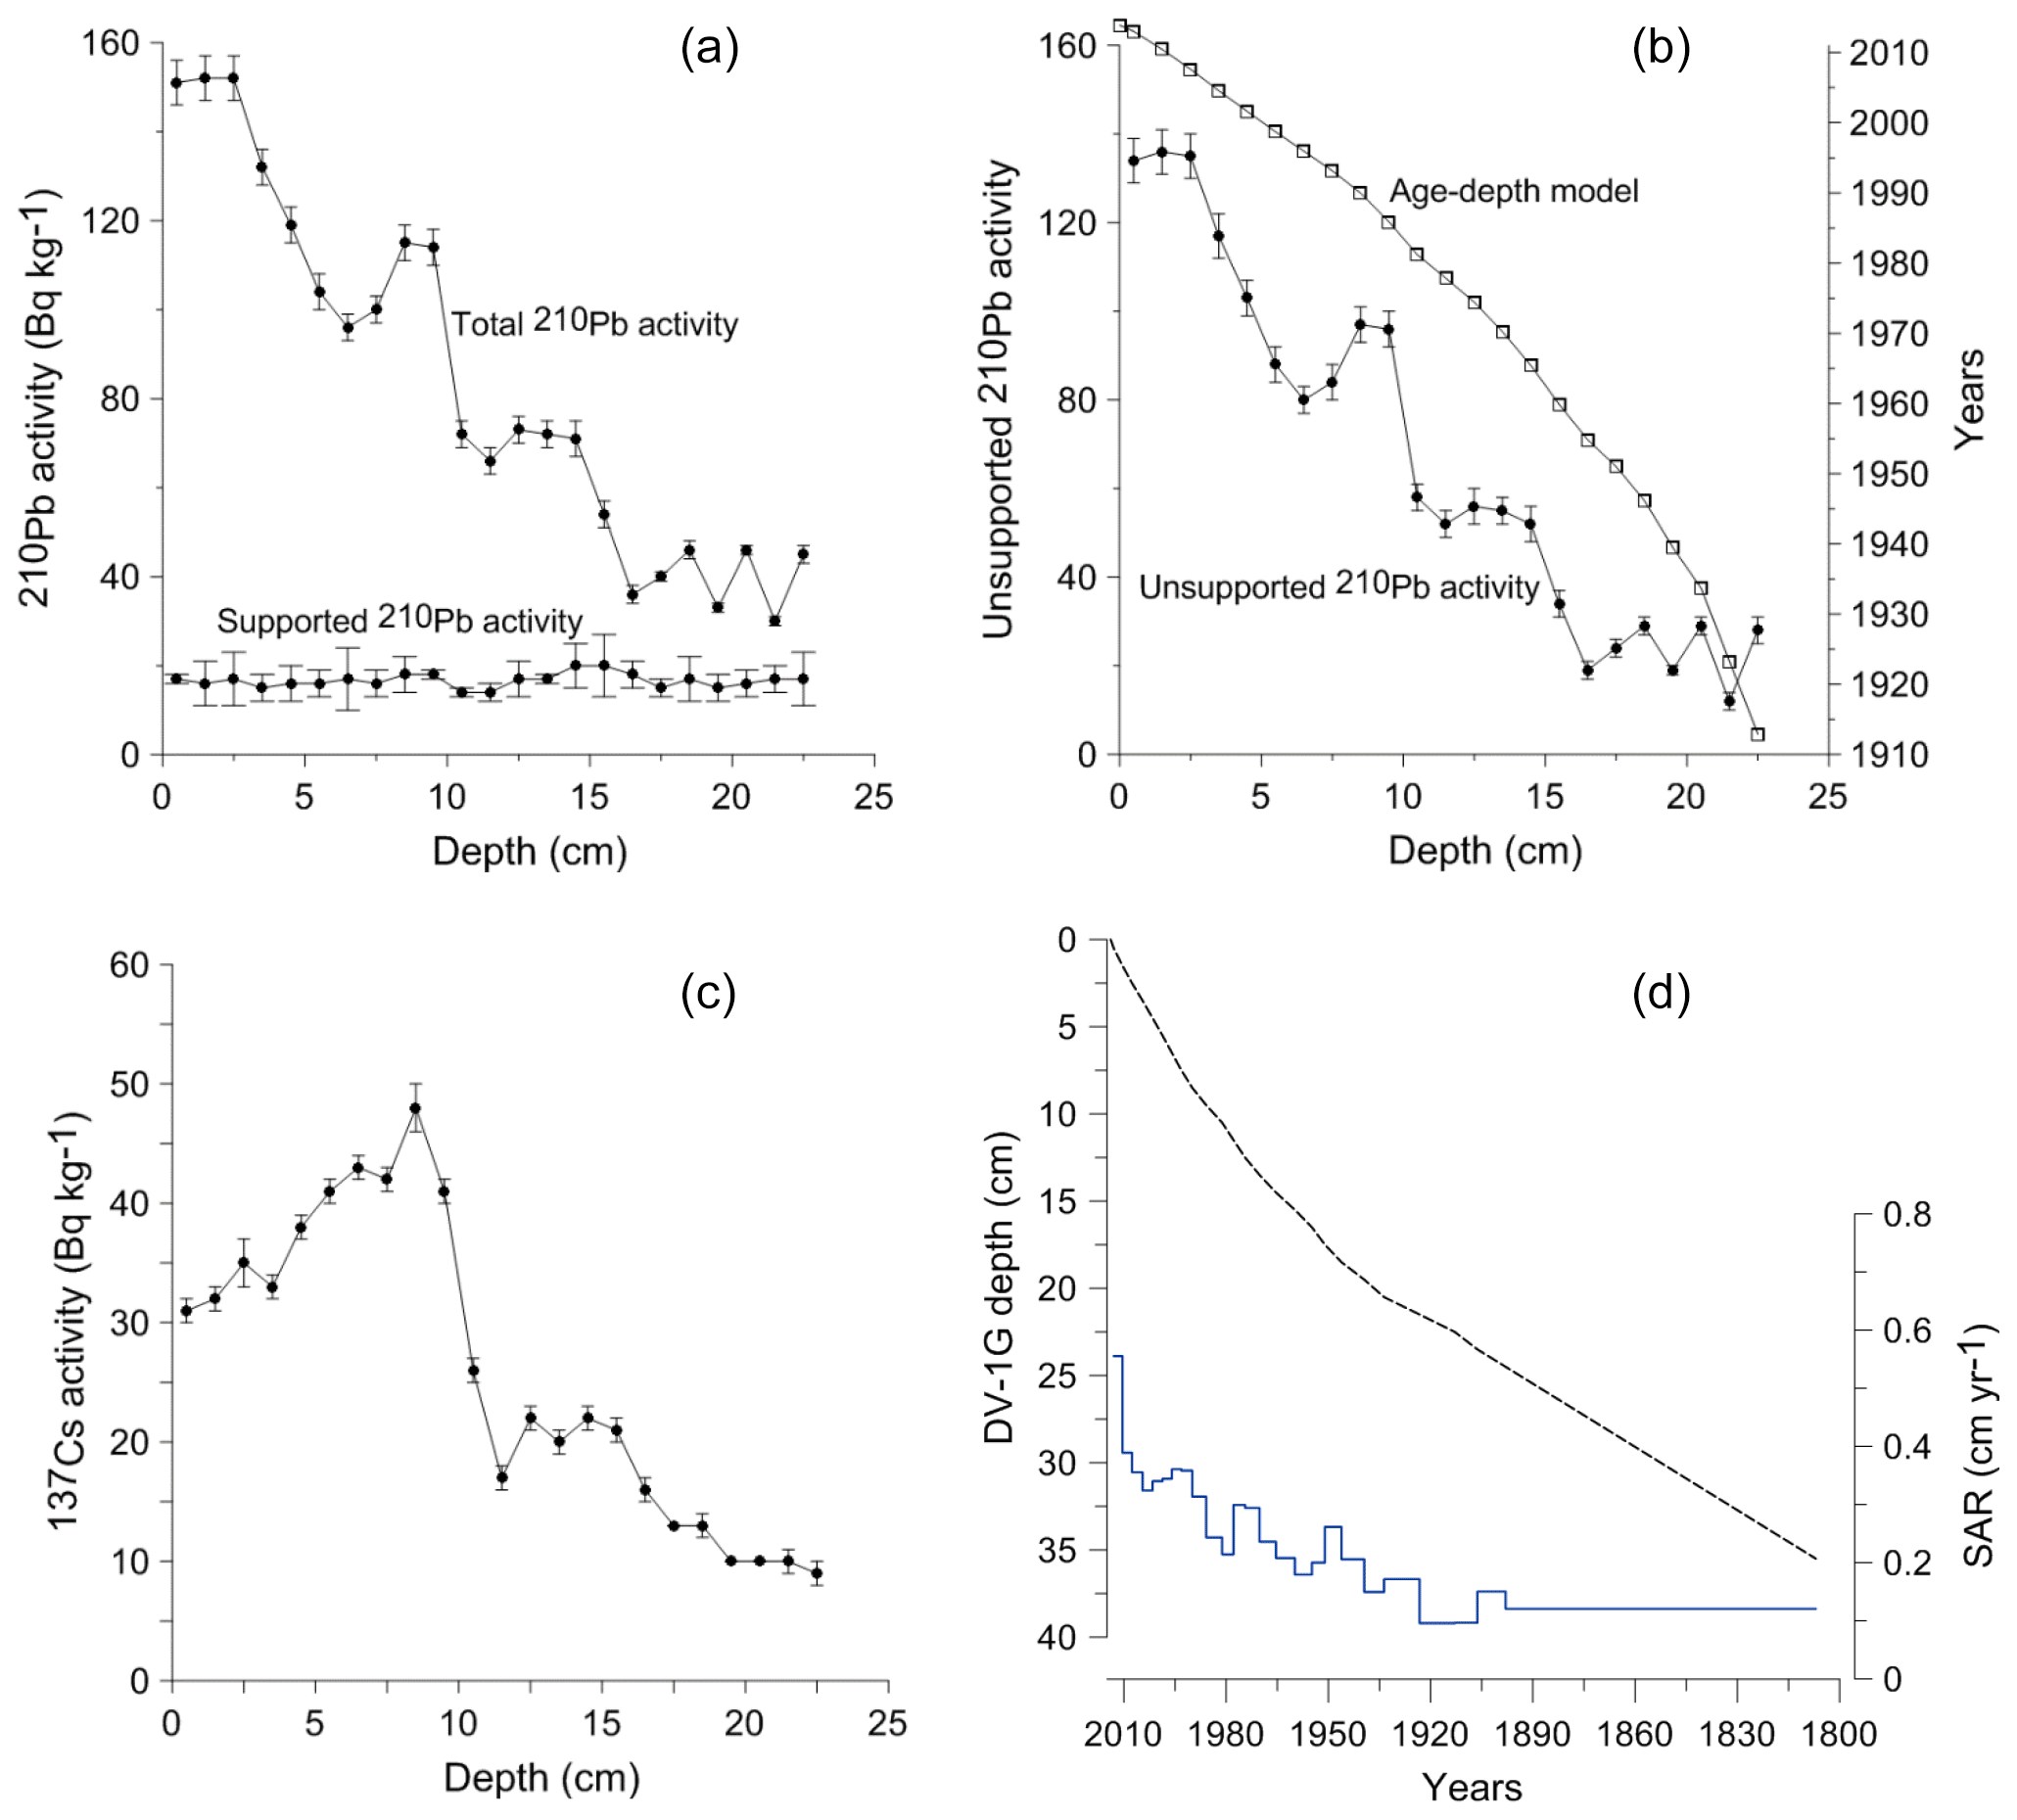
Figure 4Age–depth calibration for the sediment sequence from the Öresund (DV-1). (a) Total and supported 210Pb activity. (b) Unsupported 210Pb activity and the associated age model. (c) 137Cs activity. The peak corresponds to the Chernobyl reactor accident in 1986. (d) Age–depth model for the whole sediment sequence based on 210Pb dates and calculated sediment accumulation rates (SARs).
4.2 Foraminiferal assemblages and sediment features
The foraminiferal assemblages were composed of 76 species from the porcelaneous, hyalines, and agglutinated forms (0.3 %, 54.5 %, and 45.2 %, respectively) (Supplement Table S1). Eleven foraminiferal species had relative abundance higher than 5 % in at least one sample and were considered major species (Plate 1, Fig. 5).
The cluster analysis revealed three main foraminiferal zones (FOR-A, FOR-B, and FOR-C) (Figs. 5, 6). The correspondence analysis resulted in three factors explaining 92 % of the variance, and in assemblages consisting of seven significant species, presented in order of contribution: Nonionella sp. T1, Nonionoides turgida, Ammonia batava, Stainforthia fusiformis, Elphidium albiumbilicatum, E. clavatum, and Elphidium magellanicum (Table 1). Based on both the cluster and the correspondence analyses, five subzones could be separated to which we assigned dates according to the age model: FOR-A1 (1807–1870), FOR-A2 (1870–1953), FOR-B1 (1953–1998), FOR-B2 (1998–2009), and FOR-C (2009–2013) (Figs. 5, 6).
Table 1Significant foraminiferal species and scores according to the correspondence analysis.
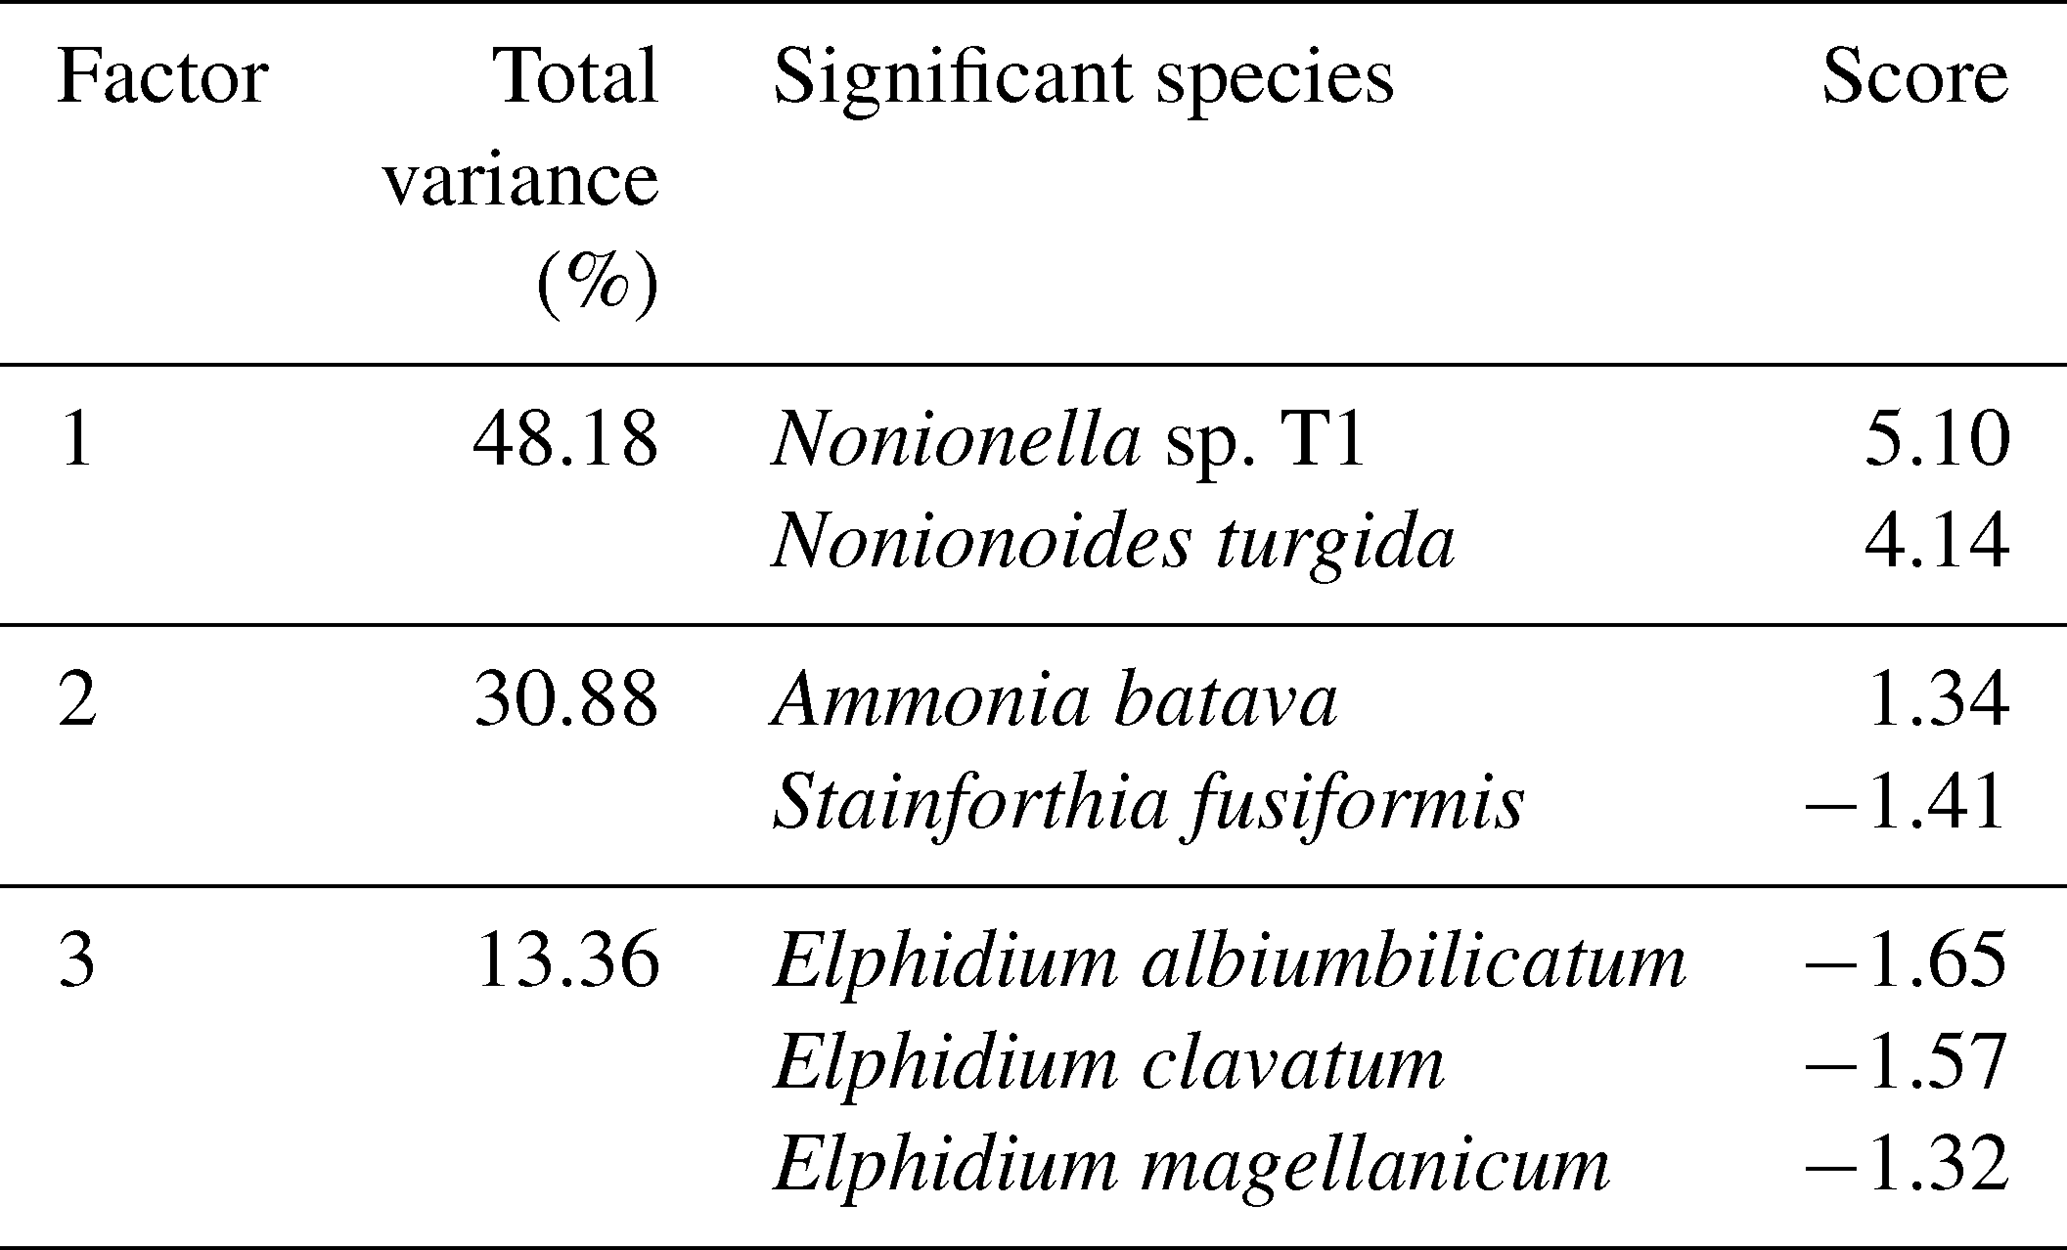
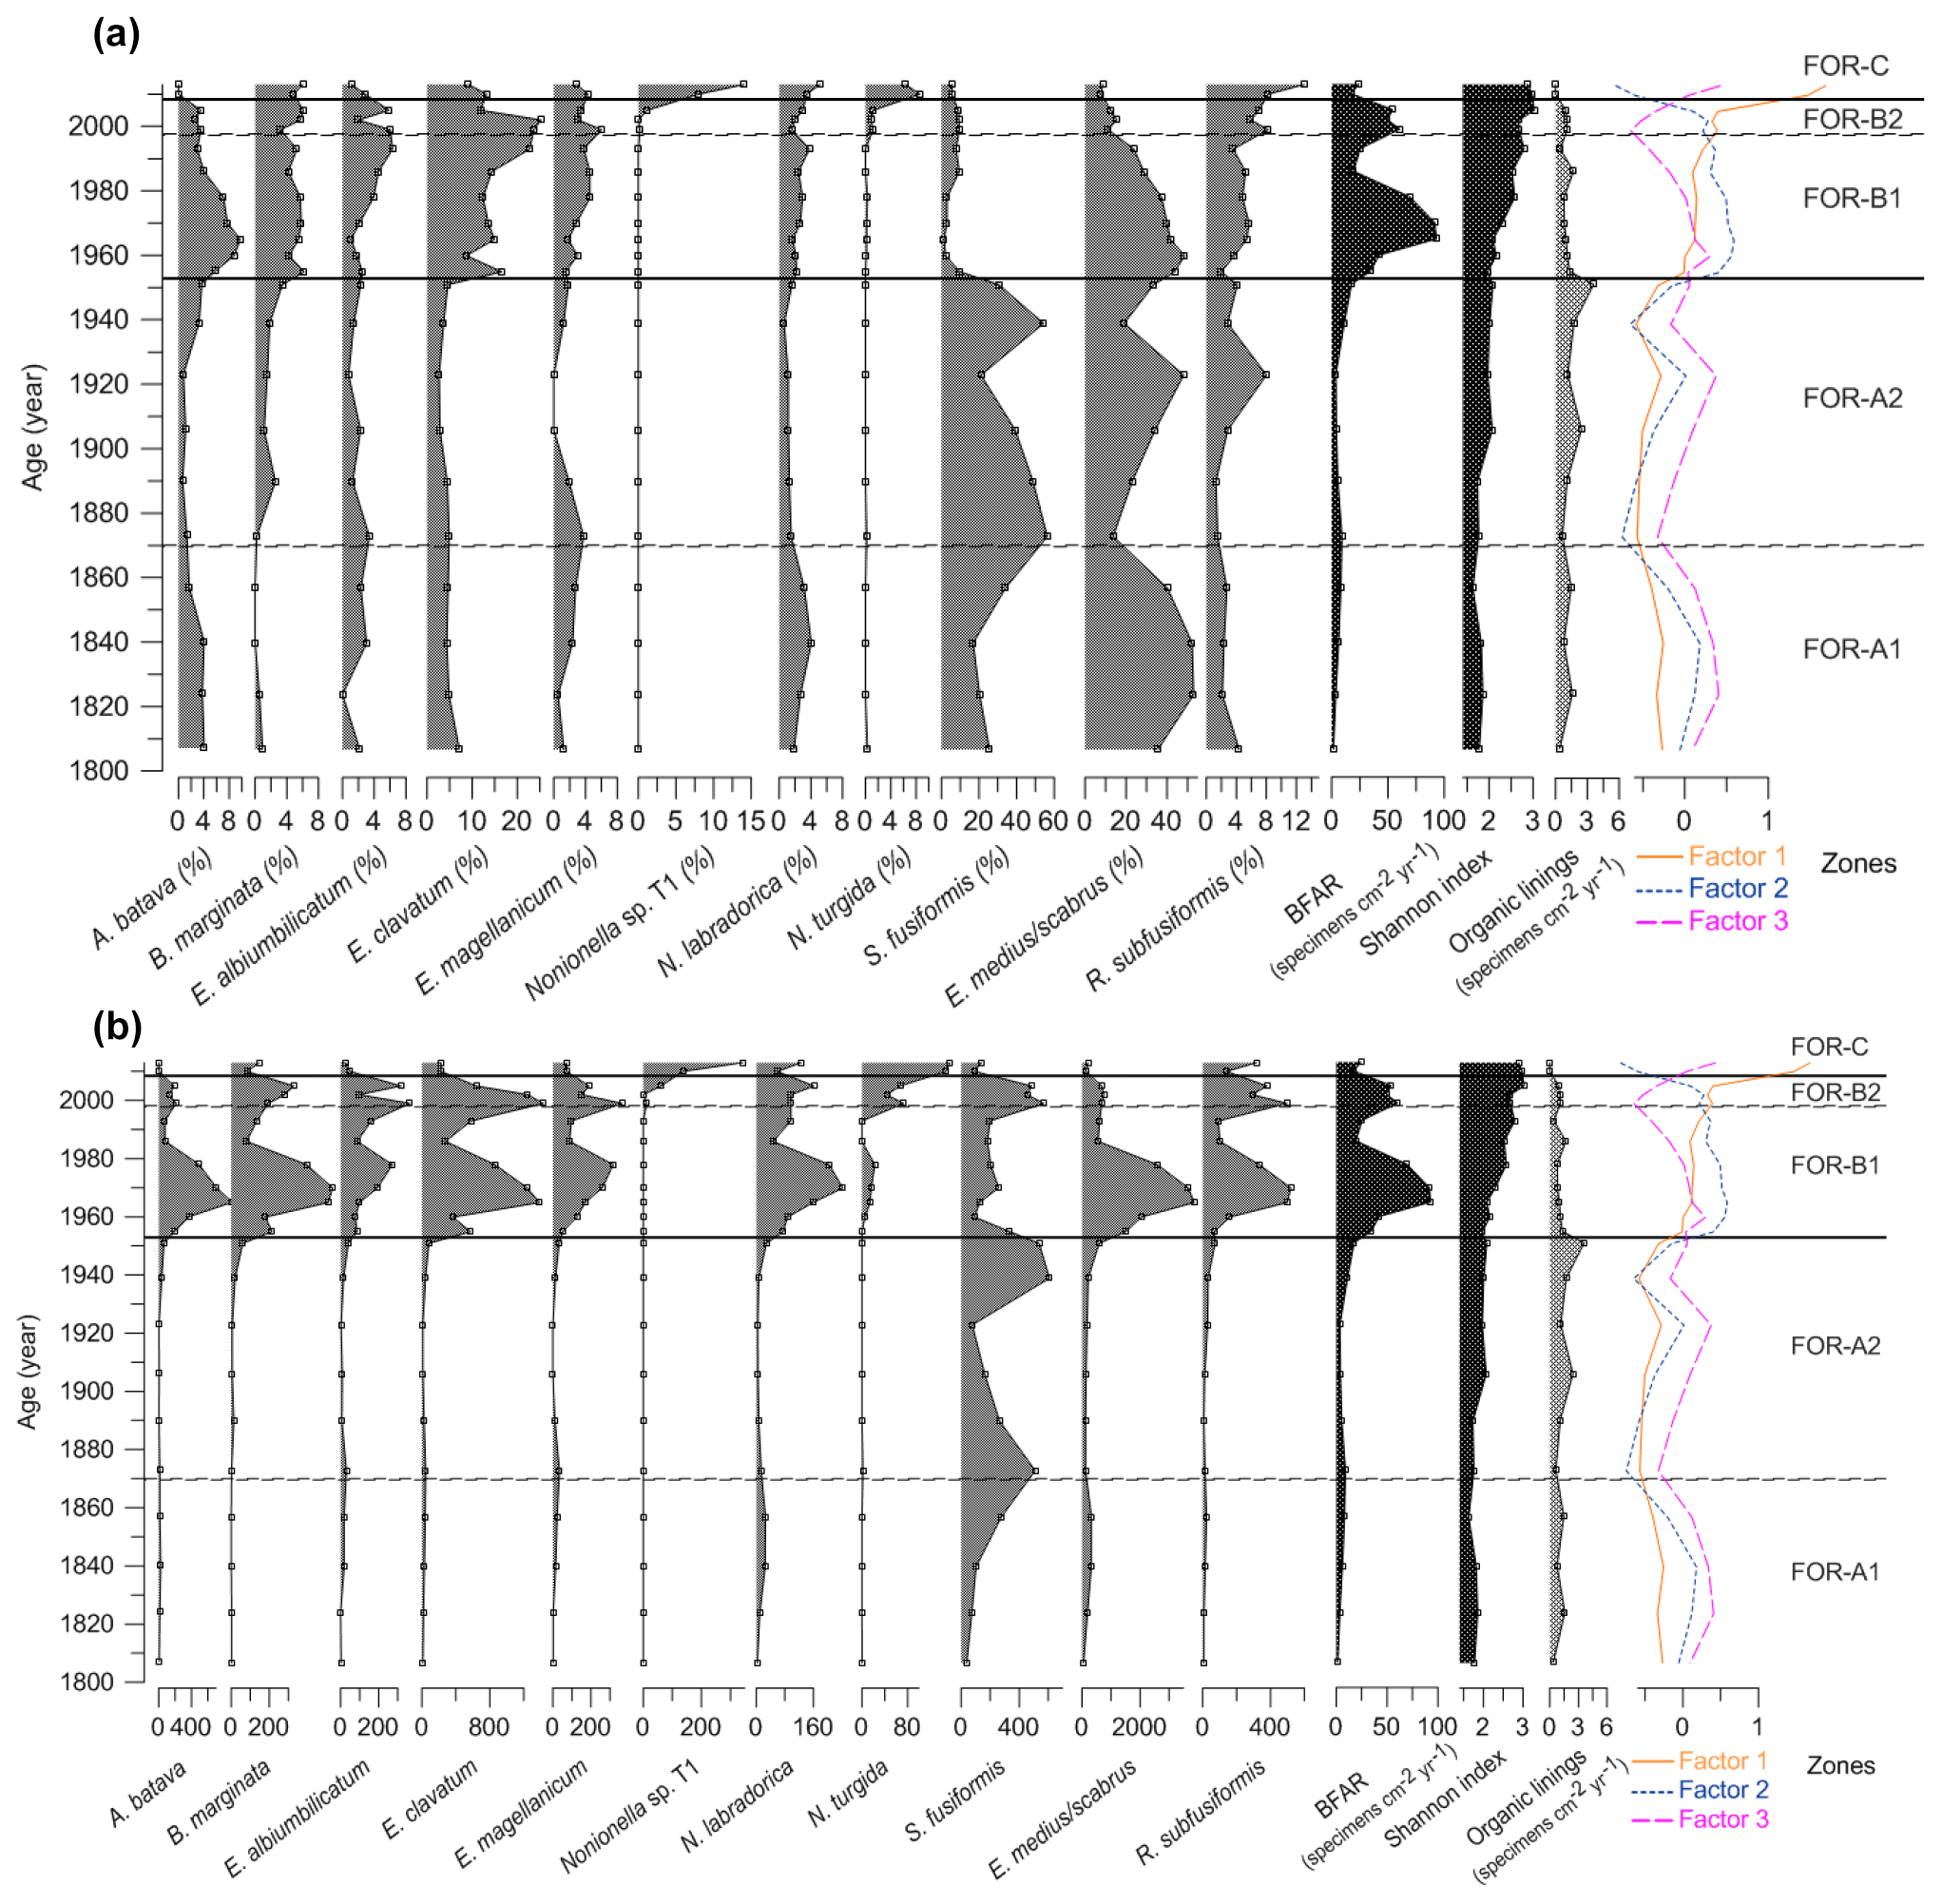
Figure 5(a) Relative abundances (%) of the foraminiferal major species (> 5 %), benthic foraminiferal accumulation rate (BFAR, specimens cm−2 yr−1), Shannon index, organic linings (specimens cm−2 yr−1), and factors from the correspondence analysis. (b) Benthic foraminiferal accumulation rates (specimens cm−2 yr−1) of the major species (> 5 %), BFAR (specimens cm−2 yr−1), Shannon index, organic linings (specimens cm−2 yr−1), and factors from the correspondence analysis. Foraminiferal zones based on cluster and correspondence analysis. Note the different scale on the x axes.
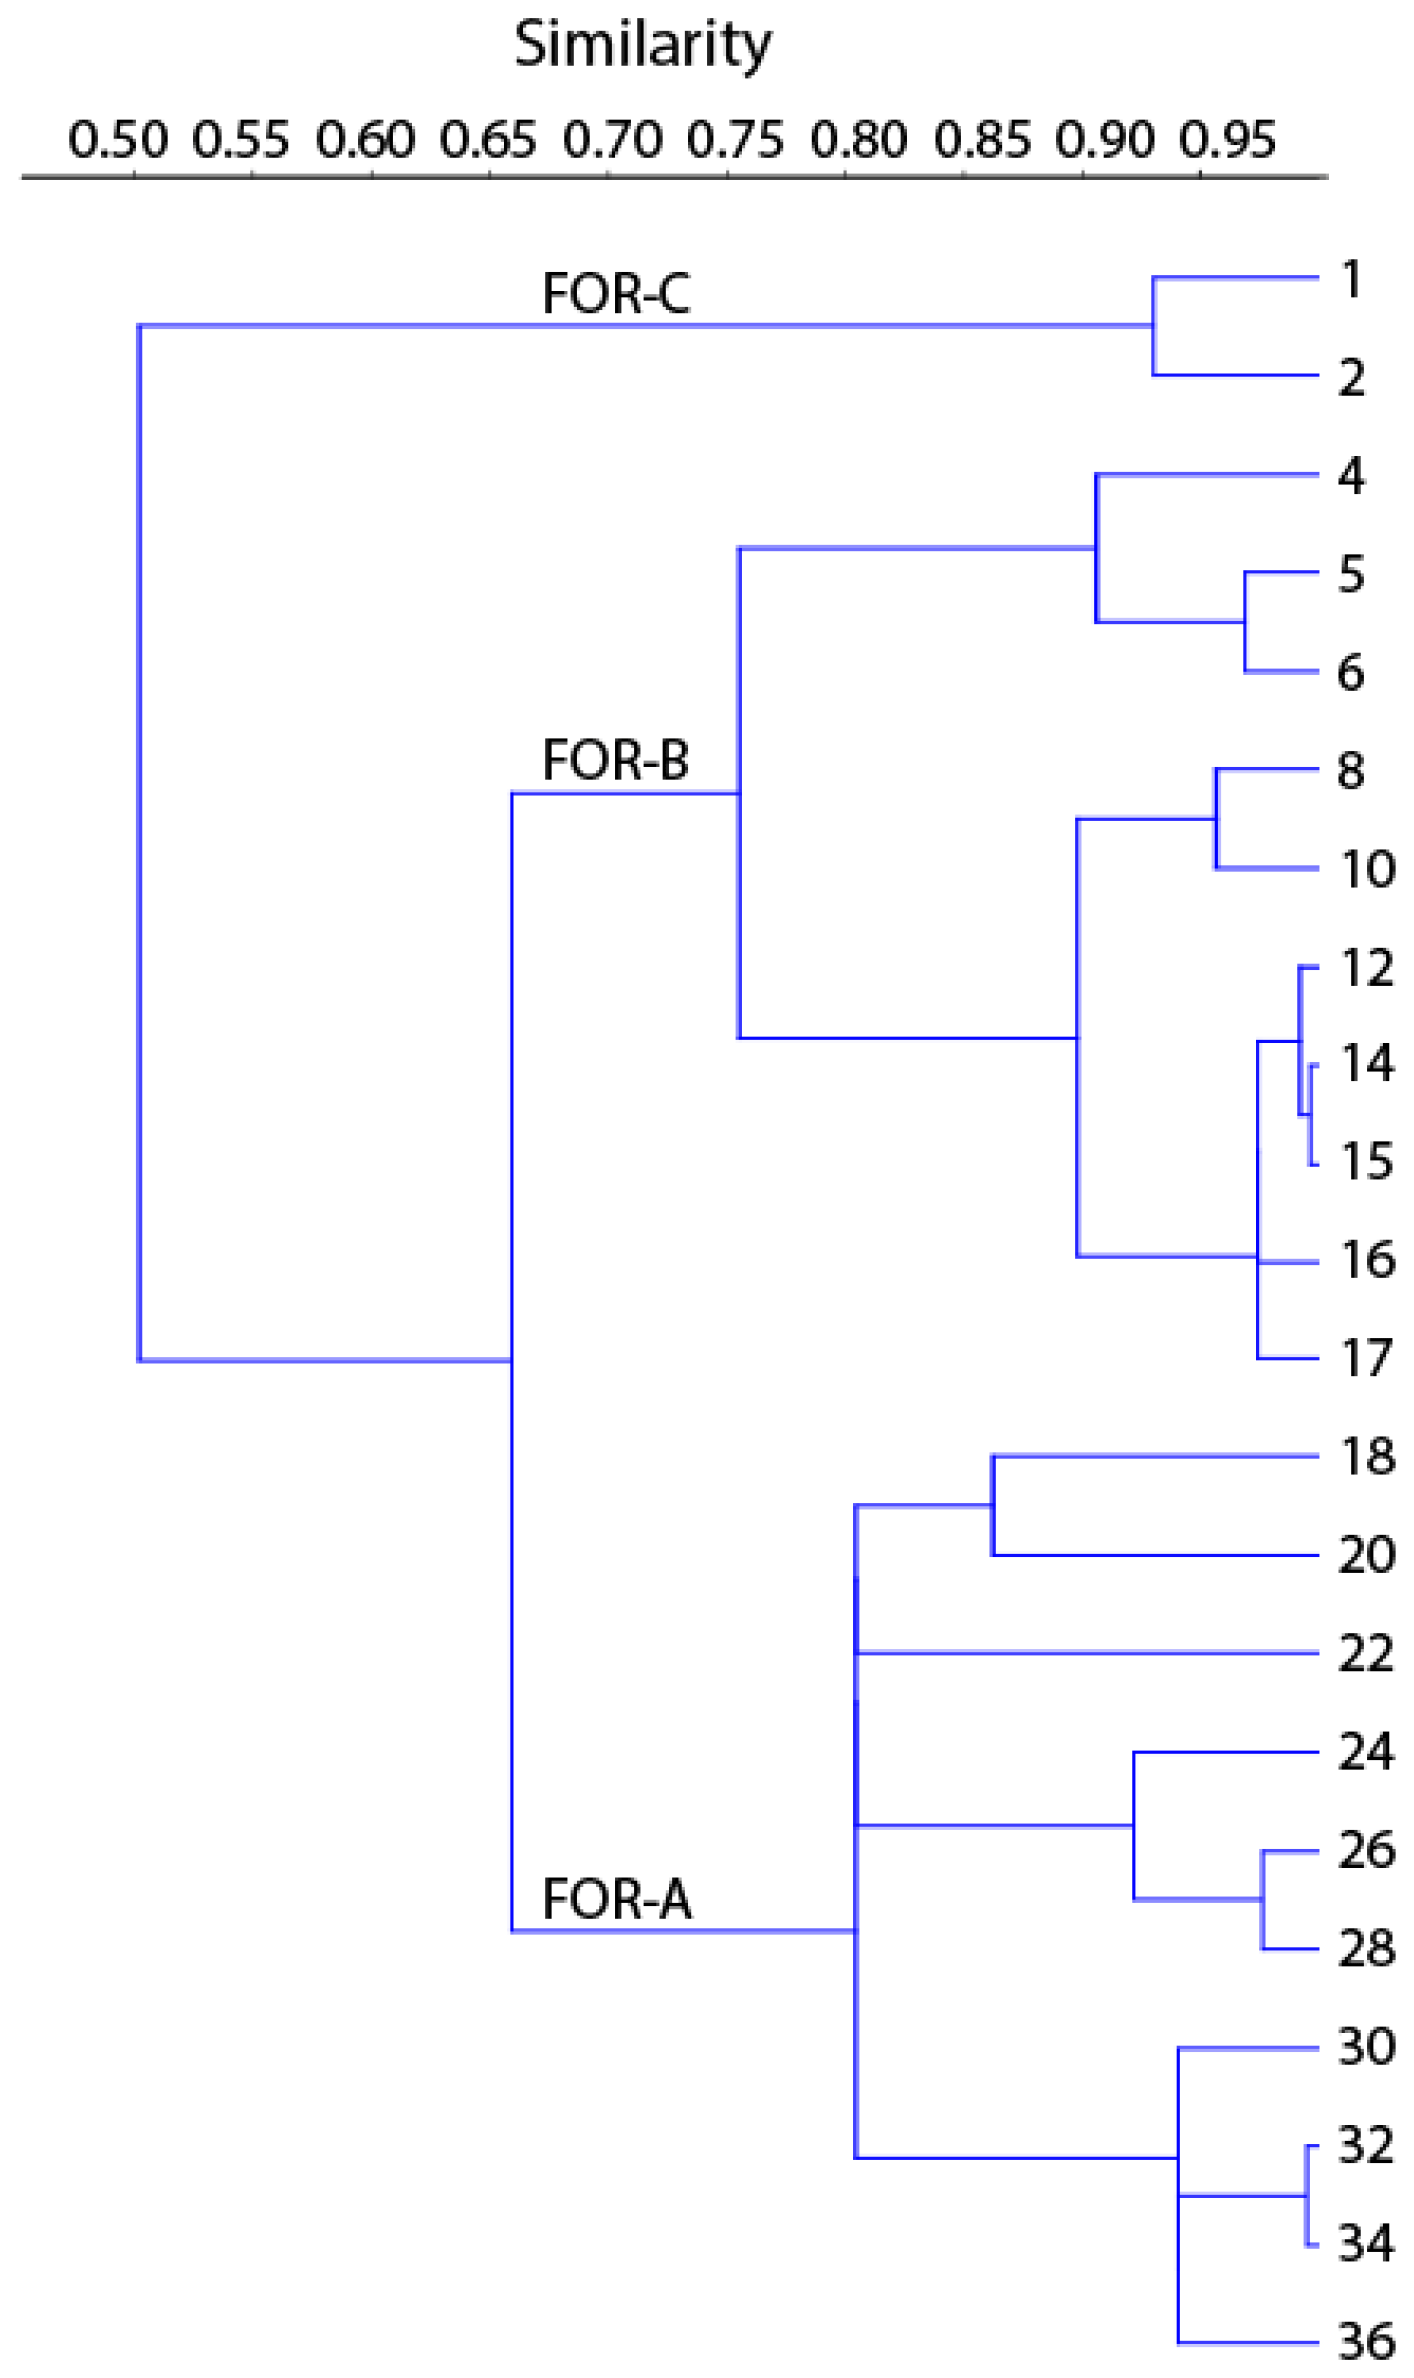
Figure 6Dendrogram produced by the cluster analysis based on the Morisita index and the UPGMA clustering method.
4.2.1 Zone FOR-A1 (1807–1870)
The foraminiferal accumulation rate (BFAR) was on average 5±3 specimens cm−2 yr−1 in zone FOR-A1 (Fig. 5). The Shannon index was stable and low, around 1.77±0.1 (Fig. 5). The agglutinated species Eggerelloides medius/scabrus and the hyaline species Stainforthia fusiformis made major contributions to the assemblages (relative abundances up to 53 % and 34 %, respectively; Fig. 5a). Ammonia batava, the three Elphidium species (E. albiumbilicatum, E. clavatum, and E. magellanicum), Nonionellina labradorica, and the agglutinated species Reophax subfusiformis were also major species, with abundances up to 7 %. The TOC and C∕N values in this period were stable and were on average 3.36 % and 8.8 %, respectively (Fig. 7). The clay size fraction dominated the sediment at the end of this period with a mean value of 63 %, and the sand content was around 7 % (Fig. 7).

Figure 7Sediment parameters of cores DV-1I and DV-1G (210Pb dated): total organic carbon content (Corg) (%), C∕N ratio, and grain size (%). Foraminiferal zones indicated.
4.2.2 Zone FOR-A2 (1870–1953)
The BFAR was on average 9±5 specimens cm−2 yr−1 in zone FOR-A2 (Fig. 5). The Shannon index was stable and low, around 1.94±0.15 (Fig. 5). Stainforthia fusiformis dominated the assemblage with relative abundances up to 56 % and a BFAR up to 608 specimens cm−2 yr−1 (Fig. 5a, b), which is the highest BFAR observed for this species along the core. Egerelloides medius/scabrus was still very abundant, up to 48 % (Fig. 5a). Ammonia batava, the three Elphidium species, and N. labradorica were present, but with lower abundances than in zone FOR-A1 (maximum 5 %). Bulimina marginata started to be more abundant, with an average relative abundance of 2 % in the zone. Reophax subfusiformis was still a part of the assemblage and ranged between 1 % and 8 %. The TOC and C∕N values were stable and were on average 3.5 % and 8.74 %, respectively (Fig. 7). The clay size fraction dominated the sediment during this period with a mean value of 63 %, and the sand content was around 6 % (Fig. 7).
4.2.3 Zone FOR-B1 (1953–1998)
The BFAR increased massively during zone FOR-B1, with on average 54±31 specimens cm−2 yr−1 and with a peak at 93 specimens cm−2 yr−1 around 1965 (Fig. 5). It is lower during the second part of the zone. The Shannon index was higher than in previous zones, and it progressively increased towards the top of the zone (Shannon index average 2.34±0.3) (Fig. 5). The highest BFARs along the core were observed for all the dominant species of the previous zone, FOR-A2, except for S. fusiformis (Fig. 5b). The zone was then also characterized by a drastic drop in the relative abundance of S. fusiformis from 31 % to 2 % (Fig. 5a). Eggerrelloides medius/scabrus gradually decreased in the zone, with relative abundances from 49 % to 24 %. The highest relative abundance of A. batava for the entire record was in this zone, but it was slowly decreasing as well, from 10 % to 3 %. The Elphidium species were more abundant than in the FOR-A zones and their relative abundance was increasing, especially for E. clavatum (increasing up to 23 %). Bulimina marginata, N. labradorica, and R. subfusiformis had a relative abundance between 2 % and 6 %. A period of lower TOC values was observed during zone FOR-B1 between 1953 and 1981, with an average of 2.38 % (Fig. 7). In the same period, the sand content showed a pronounced increase, with an average of 24 % (Fig. 7).
4.2.4 Zone FOR-B2 (1998–2009)
In zone FOR-B2 the BFAR was still high, on average 55±6 specimens cm−2 yr−1 (Fig. 5). The Shannon index was high, with an average of 2.8±0.2 (Fig. 5). The dominant species in the zone were E. clavatum (up to 25 %) and Eggerelloides medius/scabrus (up to 15 %; Fig. 5a). The other two Elphidium species reached their highest relative abundances over the core (up to 6 %). Nonionella sp. T1, which had not occurred in the record until now, appeared in this zone with a relative abundance of 1 %. Nonionoides turgida, which was present in very low abundances along the core, had a mean abundance of 1 % in the zone (Fig. 6a). Stainforthia fusiformis was present with up to 9 % in relative abundance and a BFAR higher than in zone FOR-B1 (up to 570 specimens cm−2 yr−1). Ammonia batava, B. marginata, N. labradorica, and R. subfusiformis were present and ranged between 2 % and 8 %. The TOC values were increasing, with on average 3.05 % (Fig. 7). The sediment was dominated by the clay fraction that was increasing (mean value of 58 %), and the sand content was around 17 % (Fig. 7).
4.2.5 Zone FOR-C (2009–2013)
The BFAR was lower than in the previous zones FOR-B1 and FOR-B2, with on average 21±5 specimens cm−2 yr−1 (Fig. 5). The Shannon index was highest during FOR-C (Shannon index average 2.93±0.07) (Fig. 5). Nonionella sp. T1 was a dominant species in the zone, with a strong increase in relative abundance (from 1 % to 14 %) and in BFAR (from 61 to 137 specimens cm−2 yr−1) (Fig. 5a, b). Elphidium clavatum and R. subfusiformis were also dominant species, with abundances up to 13 %. Nonionoides turgida had its highest relative abundance and BFAR over the core during the zone, with up to 9 % and 342 specimens cm−2 yr−1, respectively (Fig. 5a, b). Eggerelloides medius/scabrus had its lowest relative abundance over the core (up to 9 %). Bulimina marginata, the other two Elphidium species, N. labradorica and S. fusiformis, were still present (between 1 % and 6 %), while Ammonia batava was absent during the zone. The TOC and C∕N values were on average 3.71 % and 8.17 %, respectively (Fig. 7). The clay size fraction dominated the sediment with a mean value of 66 %, and the sand fraction was 7 % (Fig. 7).
4.2.6 Inner organic linings
Decalcified specimens were few and ranged between 0 and 4 specimens cm−2 yr−1 with an average of 1 specimen cm−2 yr−1 (Fig. 5). They were observed throughout the core and especially during zone FOR-B2, and the morphology of the remaining inner organic linings allowed the identification of the taxon Ammonia (Plate 1).

Plate 1SEM pictures of the major foraminiferal species (> 5 %). (1) Stainforthia fusiformis; (2) Nonionellina labradorica; (3) Nonionella sp. T1; (4) Nonionoides turgida; (5) Eggerelloides medius/scabrus; (6) Bulimina marginata; (7) Ammonia batava; (8) Reophax subfusiformis; (9) Elphidium magellanicum; (10) Elphidium clavatum; (11)–(12) Ammonia sp.
4.3 Simulated data from the ECOSMO II model
The VAV (vertically averaged south–north current velocity) through the Öresund from the ECOSMO II model showed a reversed pattern compared to the UAV (vertically averaged west–east current velocity) through the Kattegat (Fig. 8). Thus, higher VAV through the Öresund translates to an increase in the east-to-west flow in the Kattegat (lower UAV), suggesting a stronger outflow from the Baltic Sea. The VAV through the Öresund had the lowest values around 1955 (Fig. 8), followed by a shift to very high values, which dominated throughout 1960–1970. A comparable period with increased outflow from the Baltic into the Kattegat re-occurred during the period 1993–2000.
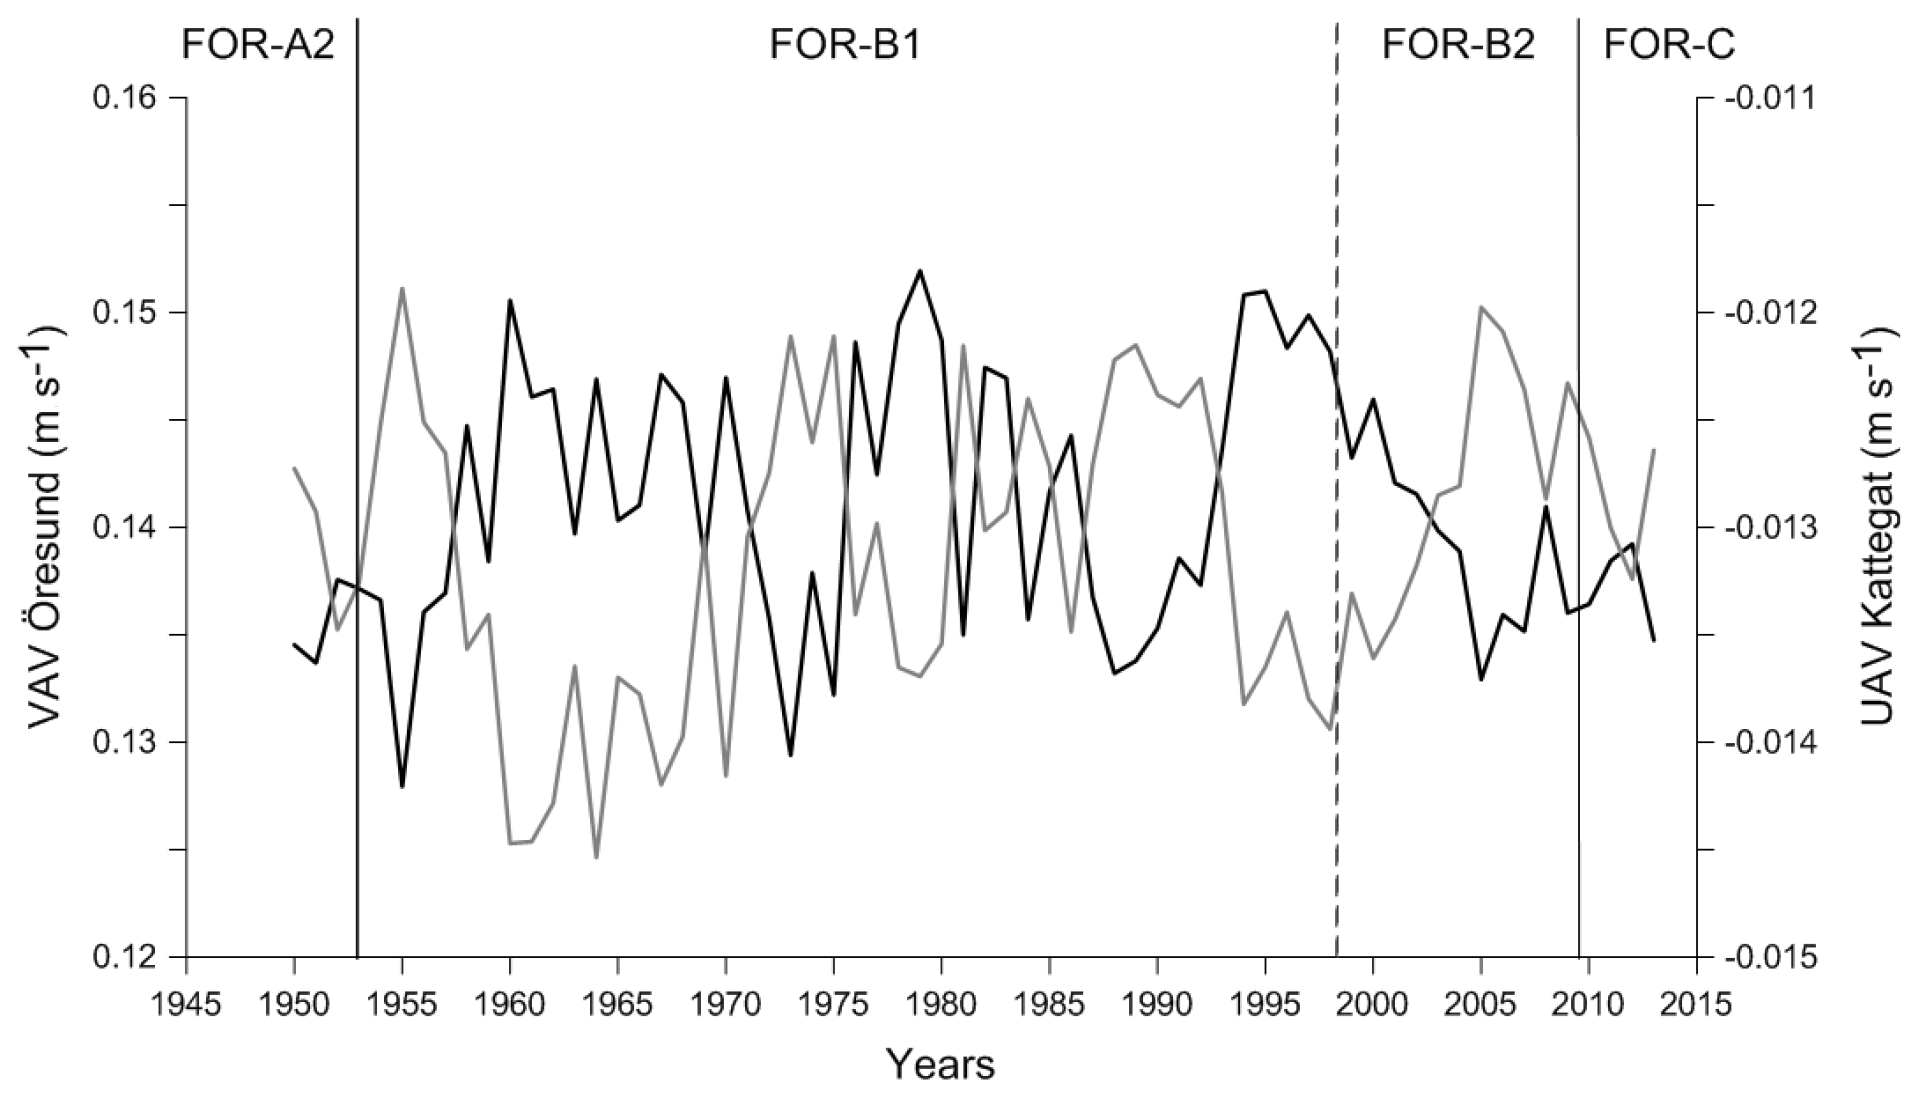
Figure 8South–north flow (VAV) in the Öresund (dark line) and west–east flow (UAV) in the Kattegat (light line) between 1950 and 2013. Foraminiferal zones indicated.
Our environmental interpretations of the foraminiferal assemblages were based on the ecological characteristics of each major species (Table 2). Based on our environmental reconstructions, we could infer environmental changes regarding [O2], salinity, organic matter content, and pollution levels. Furthermore, we linked local environmental changes to larger atmospheric and hydrographic conditions.
Table 2Ecological significance of the benthic foraminiferal assemblages (major species).

5.1 1807–1870
All the major species found in this period are tolerant to low-oxygen conditions, especially the two main species: S. fusiformis and E. medius/scabrus (Table 2). Stainforthia fusiformis is an opportunistic species used to hypoxic and potentially anoxic conditions (Alve, 1994), and E. medius/scabrus specimens have been found alive down to 10 cm in the sediment, where no oxygen was available (Cesbron et al., 2016). Stainforthia fusiformis and N. labradorica are also able to denitrify (Piña-Ochoa et al., 2010). The fact that species tolerant to low-oxygen conditions dominated, and the presence of species that have the capacity to denitrify, suggest that low-oxygen conditions were prevailing during this period. Furthermore, S. fusiformis prefers organic-rich substrate and clayey sediment, which was measured in our core during this time period (Fig. 7). The low species diversity, as indicated by the low Shannon index in this section of the core, can sometimes be linked with low salinity (Sen Gupta, 1999a). Most of the major species found during this period, such as the Elphidium species R. subfusiformis and A. batava, tolerate lower salinities and are typical of brackish environments (Table 2). The low occurrence of B. marginata, a typical marine species, also suggests a salinity lower than in the open ocean. However, the salinity was probably not below ∼30, which is the lower limit for N. labradorica and S. fusiformis, which were present throughout the period (Fig. 5, Table 2). In summary, this period appears to have been characterized by low [O2], high organic matter content, and salinity around 30.
5.2 1870–1953
Stainforthia fusiformis largely dominated the assemblage during this period, which may suggest even lower oxygen conditions than during the previous period. This would also go along with the low species diversity, which is sometimes linked to low salinity. In the Öresund, low salinity can be caused by less influence of more saline marine waters from the Kattegat, and changes in the water transport through the strait are a possible explanation for both lower salinity and oxygen levels. However, the occurrence of the marine species B. marginata suggests that the salinity was at least ∼30 (Table 2). Low oxygen can also be associated with high organic matter contents, since oxygen is consumed during remineralization of organic matter. However, the TOC levels observed in our core in this zone were high, but not higher than in the previous zone (Fig. 7). At the time of the industrial revolution, the Öresund, like the Baltic Sea in general, was used as a sewage recipient for a mixture of domestic and industrial wastes, industrial cooling water, and drainage water (Henriksson, 1968), and the amount of marine traffic increased considerably during this time period. Across the Baltic Sea, this notably caused increased deposition of heavy metals (Borg and Jonsson, 1996). This diverse type of pollution could have modified the water properties, for example regarding the carbonate chemistry and pH. Indeed, this zone is characterized by the presence of organic linings in the core (see also Sect. 5.6). Moreover, heavy metals, fuel ash (black carbon), and pesticides have been demonstrated to generally have a negative effect on foraminiferal abundance and diversity (Yanko et al., 1999; Geslin et al., 2002). Pollution and low oxygen concentration could explain the low species BFAR and diversity as well as the dissolution of tests during this period. Some species that were present, i.e., the agglutinated species E. medius/scabrus and R. subfusiformis, are known to be tolerant to various kinds of pollution (Table 2).
5.3 1953–1998
The large increase in general BFAR from 1953 suggests either more favorable growth conditions or significant deposition of transported specimens into the area. The coarser grain size observed during this period indicates possible changes in the current system, which could affect both growing conditions and transport of specimens (Fig. 7). However, the dating of our core showed continuous sediment accumulation without any interruption during this period (Fig. 4). Moreover, all the new dominating species were already present in the core, even if in lower relative abundances (Fig. 5a). This indicates that the BFAR increase is most likely not due to specimen transport, but rather is a result of a change in substrate and environmental conditions that became favorable for a different foraminiferal assemblage. The higher foraminiferal diversity compared to previous periods and the decrease in the relative abundance of S. fusiformis may indicate more oxic conditions. Elphidium clavatum has been found in coarse sediment in the area (Bergsten et al., 1996), and other species that tolerate sandy environments and varying TOC dominated the assemblage, such as A. batava, the other species in the Elphidium species, B. marginata, and E. medius/scabrus. Furthermore, anthropogenic activities such as agricultural practices were intensified during this period until the 1980s, which resulted in increased nutrient loads and resulting eutrophication (i.e., Rydberg et al., 2006). The increase in organic matter may have been beneficial for foraminifera as a food source. Food webs and species interaction like intra- and inter-competition might also have been modified, giving the advantage to some species such as the Elphidium species to develop in these new environmental conditions.
The temporal coincidence with the shifts seen in the sediment record and the anomalous wind conditions suggest a notable change in the currents through the Öresund (Figs. 8, 9). The simulated currents through the Öresund confirm such an abrupt change characterized by a shift from very limited outflow from the Baltic to the Kattegat before ∼1960 to more than a decade of high relative outflow (high VAV) from the Öresund to the Kattegat and high current velocities (Fig. 8). While the simulation only covers the period after 1950, the analysis of wind conditions and the NAO index suggest that the anomalies in the current and sediment pattern from ∼ mid 1950s might have been unprecedented since at least the middle of the 19th century (Fig. 9). The shift in local sediment properties and the shift to higher BFAR and species diversity suggest a combination of anomalous currents during a period of unusually negative NAO index and the abrupt first advection of anthropogenic eutrophication from the Baltic Sea towards the Kattegat. Consistent with our findings, long-term variations in large volume changes in the Baltic Sea (LVC, Lehmann and Post, 2015; Lehmann et al., 2017), which are calculated from > 29 cm (∼100 km3) daily sea-level changes at Landsort (58.74∘ N; 17.87∘ E) for 1887–2015, show an unusual cluster of both more frequent and also larger LVCs during the 1970s to 1980s relative to the entire time period. Notably, this period coincides with the most dramatic shift in foraminiferal BFAR and species diversity as well as an increase in sand content. The period before the “regime shift” of the 1950s to 1960s is dominated by very infrequent and few large LVC events. After the shift, the 1990s show also very few or partly no LVC events with generally record-low Major Baltic Inflow events.
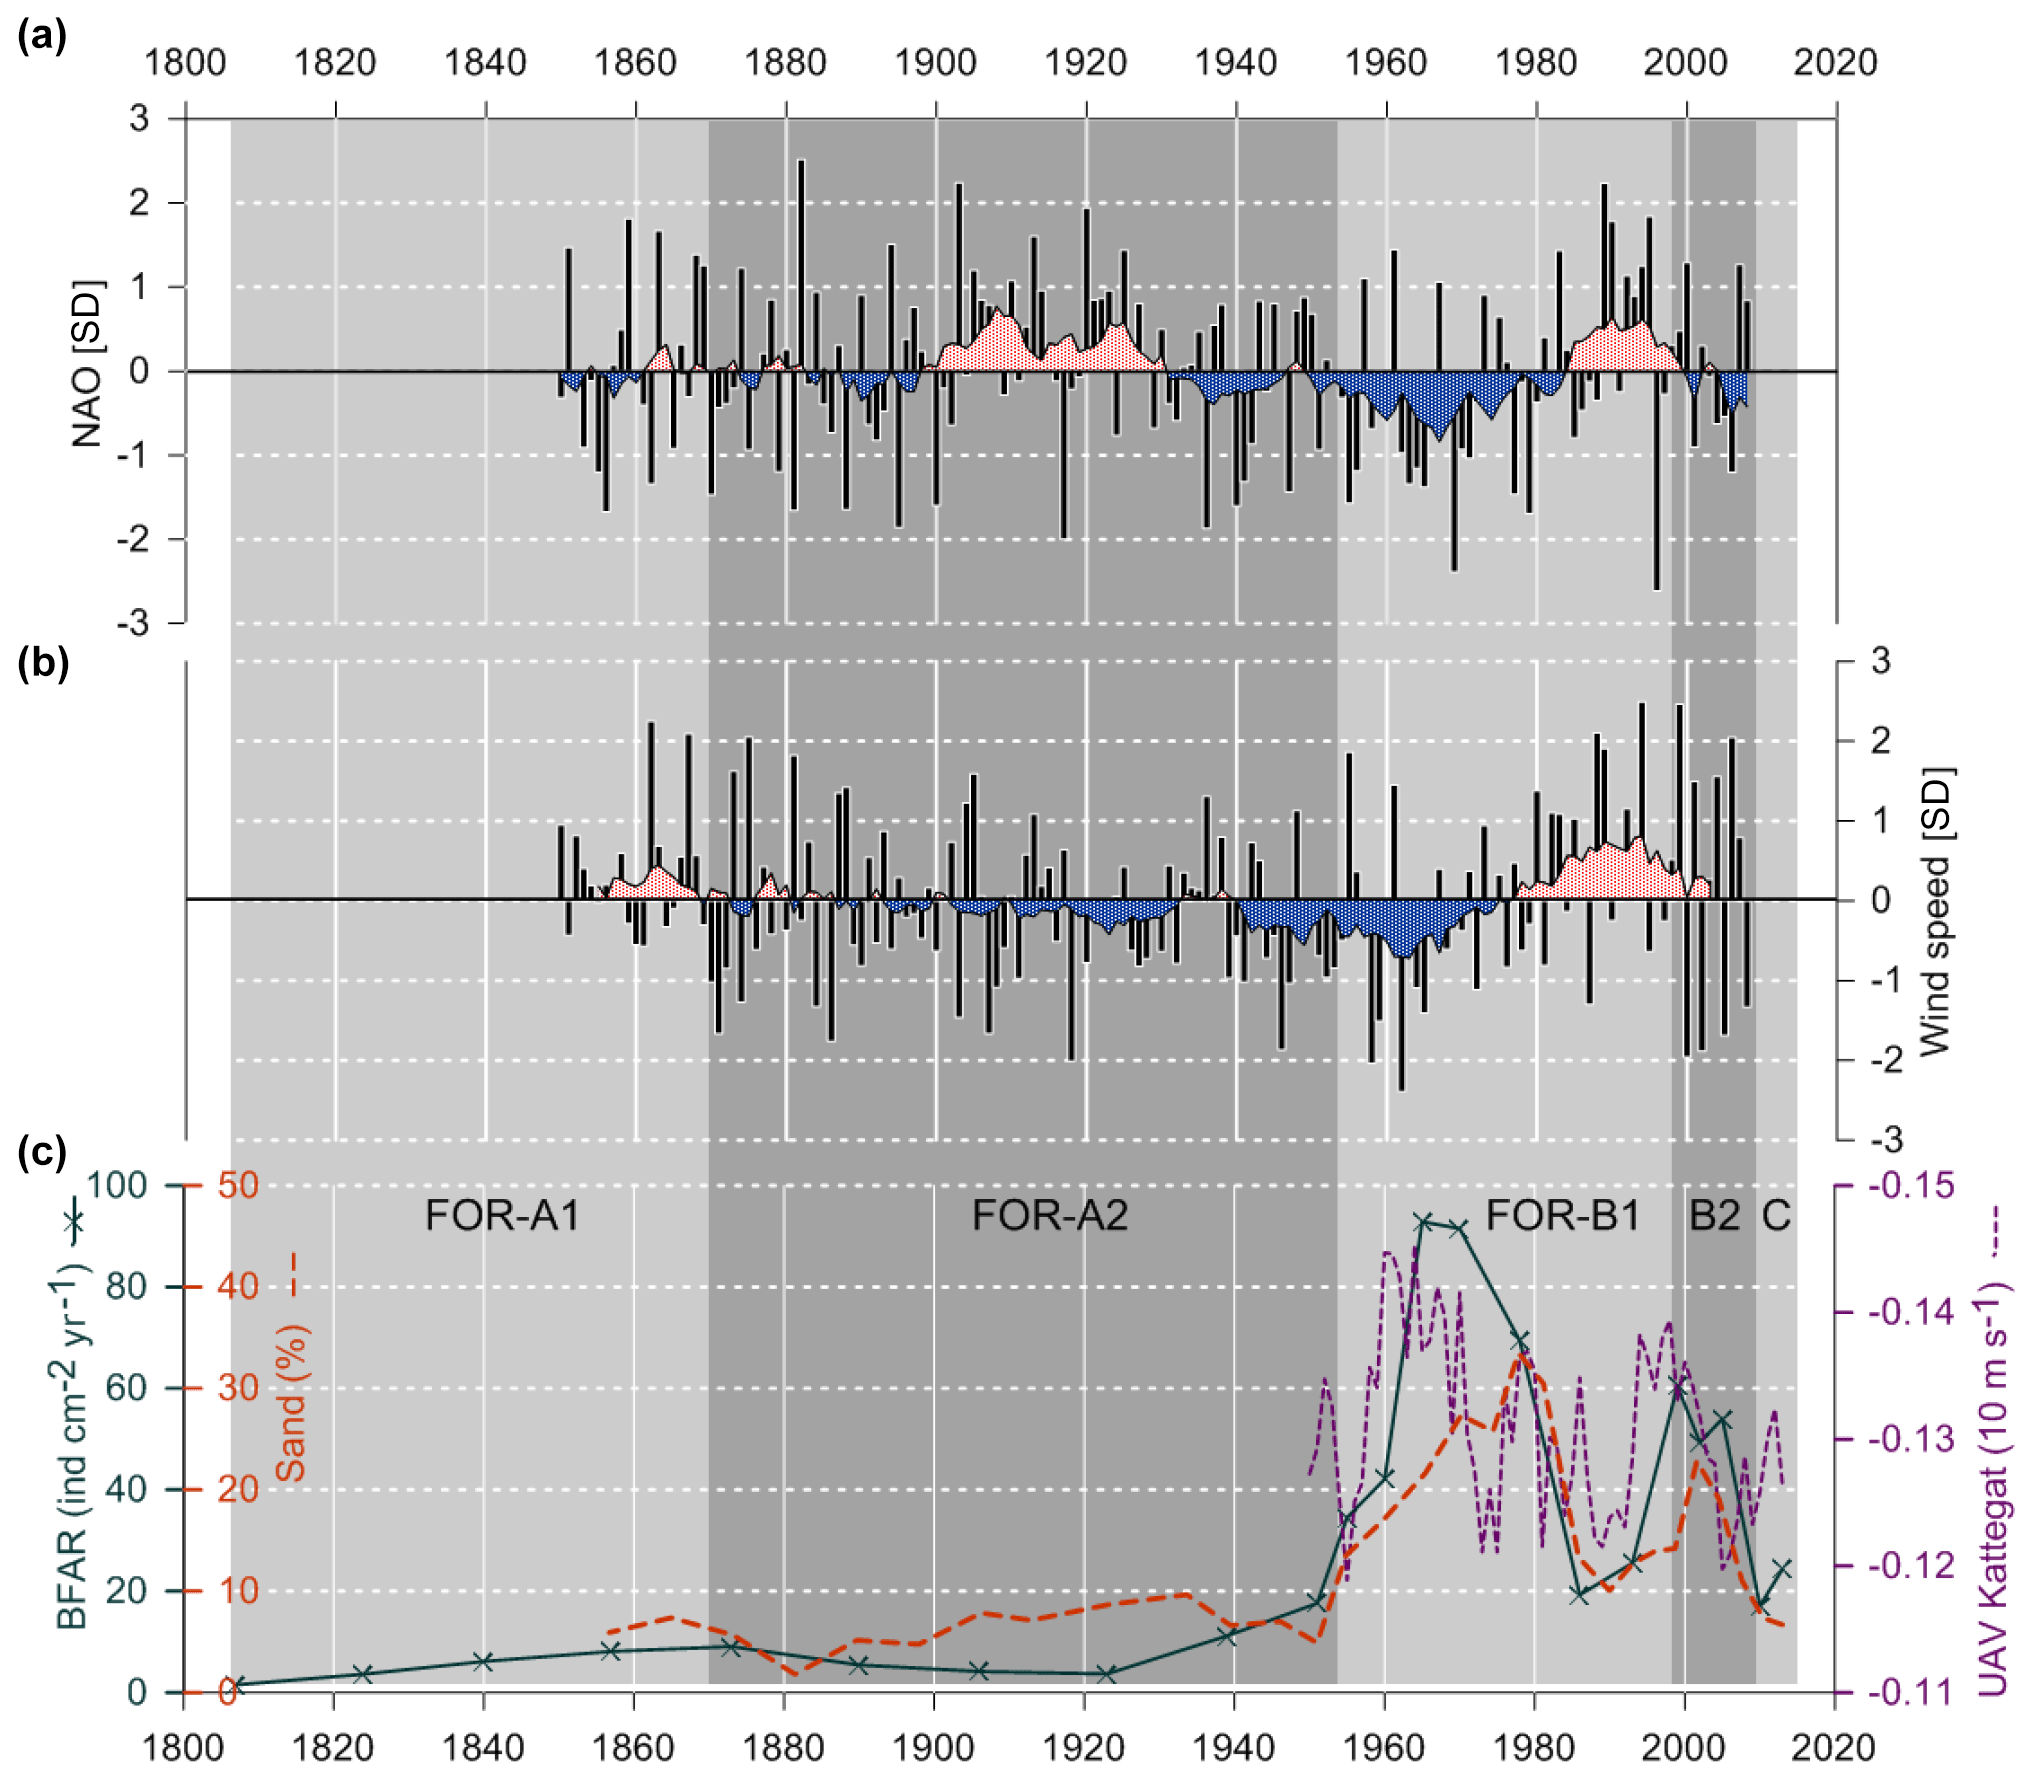
Figure 9(a) NAO index for boreal winter (December to March), data from Jones et al. (1997). (b) Variations of near-surface (10 m) wind conditions (October to March), data from Schenk and Zorita (2012). Both NAO index and wind speed data are normalized on the period 1850–2008 and show running decadal means. (c) BFAR, percentage of sand fraction and west–east flow (UAV) in the Kattegat. Foraminiferal zones indicated.
Thus, during this period, the ecosystems were affected by both climatic effects through sedimentation changes and human impact. At the end of the period, after ∼1980, the general BFAR was lower during a short time (Figs. 5, 9). This could be linked to the measures that were taken in agriculture and water treatments in order to reduce the nutrient discharge (Carstensen et al., 2006; Conley et al., 2007), which could have reduced the food input. Interestingly, when the sedimentation pattern changes again and the sand content decreases markedly (Fig. 7), the new species in the foraminiferal fauna do not return to previous relative abundances as one could have expected (Fig. 5a). This suggests that once the foraminiferal fauna was established in the Öresund area after the ∼1953 shift, it created a new state of equilibrium.
5.4 1998–2009
The foraminiferal assemblage in this zone was similar to the previous one, with high BFAR, high diversity, and the Elphidium species as dominating species. This period is, however, characterized by the appearance of two new major species: N. turgida and Nonionella sp. T1. Nonionella sp. T1 is suggested to be an invasive species in the region which arrived by ship ballast tanks around 1985 and rapidly expanded to the Kattegat and Öresund (Asteman and Schönfeld, 2016). According to our dated core, the species arrived in the Öresund ∼2000 CE (Fig. 5). The species has also been present on the southern coast of Norway since ∼2009 (Deldicq et al., 2019), but additional genetic analyses are necessary to have a better overview of the species' origin and expansion. Nonionoides turgida is an opportunistic species that prefers high levels of organic matter in the sediment, as observed in our core during this period (Fig. 7). The increase in the S. fusiformis BFAR suggests lower [O2] than in the previous zone, which was indeed a general trend in the Danish waters during this time period (Conley et al., 2007). The salinity was probably marine during this period, as suggested by the high occurrence of the marine species B. marginata (Fig. 5). This period was then characterized by low [O2], high organic matter content, and open ocean salinity.
5.5 2009–2013
The ability of Nonionella sp. T1 to denitrify and its tolerance of varying environments may explain its rapid increase during this period. The increase in N. turgida also suggests higher levels of organic matter in the sediment. The dominance of these two species and the lower BFAR compared to previous periods suggest low oxygen levels. This period is thus characterized by low [O2], high organic matter content, and open ocean salinity.
5.6 Dissolution
The inner organic linings of the taxon Ammonia were observed (in low numbers, < 5 units) along the whole core, except in the top 2 cm (Fig. 5). Inner organic linings of the taxa Ammonia and/or Elphidium were noticed in previous studies among dead fauna in the region (Jarke, 1961; Hermelin, 1987: Baltic Sea; Christiansen et al., 1996; Murray and Alve, 1999: Kattegat and Skagerrak; Filipsson and Nordberg, 2004b: Koljö Fjord). Dissolution of calcareous foraminiferal tests has been considered a taphonomic process, affecting the test of the specimens after their death (Martin, 1999; Berkeley et al., 2007). However, living decalcified foraminifera have been observed in their natural environment in the southern Baltic Sea (Charrieau et al., 2018) and Arcachon Bay, France (Cesbron et al., 2016), proving that test dissolution can also occur while the specimens live. In any case, low pH and low calcium carbonate saturation are suggested as involved in the observed dissolution (Jarke, 1961; Christiansen, et al., 1996; Murray and Alve, 1999; Cesbron et al., 2016; Charrieau et al., 2018). Test dissolution may occur in all calcitic species, but only the organic linings of Ammonia were found in our study, probably because these were more robust to physical stress such as abrasion.
In this study, we described an environmental record from the Öresund, based on benthic foraminifera and geochemical data, and we link the results with reconstructed wind data, NAO index, and currents from a hydrodynamic model. Five foraminiferal zones were differentiated and associated with environmental changes in terms of salinity, [O2], and organic matter content. The main event is a major shift in the foraminiferal assemblage ∼1950, when the BFAR massively increased and S. fusiformis stopped dominating the assemblage. This period also corresponds to an increase in grain size, resulting in a higher sand content. The grain-size distribution suggests changes in the current velocities which are confirmed by simulated current velocity through the Öresund. Human activities through increased eutrophication also influenced the foraminiferal fauna changes during this period. Organic linings of Ammonia were observed throughout the core, probably linked to low pH and calcium carbonate saturation, affecting test preservation.
The long-term reconstruction of sediment and ecosystem parameters since ∼1807 suggests that the onset of increased anthropogenic eutrophication of the eastern Kattegat started with an abrupt shift ∼1960 during a period of a strongly negative NAO index. With unusually calm wind conditions during the winter half and increased easterly winds, the conditions were ideal for larger Baltic outflow events, which is a prerequisite for more frequent and stronger major Baltic inflow events (Lehmann et al., 2017), as calculated from LVC events during this period. Our high-resolution sediment record points towards the importance of considering also large Baltic outflow events for the Kattegat environment. Since the Baltic Sea is much more eutrophic, less oxygenated, and less saline, large outflow events may have a significant impact also on the Kattegat ecosystem. Periods with a negative NAO or conditions with intense atmospheric blocking over Scandinavia like in 2018 may also increase the influence of the Baltic Sea's environmental problems on the Kattegat region.
The climate and numerical modeling data are accessible as described in the methods section. The foraminiferal data are available in Table S1. The hydrographic data used in the projected are collected from SMHI's SHARK database. The SHARK data collection is organized by the environmental monitoring program.
Figure S1, with time series of salinity, temperature, and dissolved oxygen concentration at the bottom water of the Öresund, and Table S1, with total foraminiferal faunas normalized to 50 cm3 along the DV core, are available in the online version of the article. The supplement related to this article is available online at: https://doi.org/10.5194/bg-16-3835-2019-supplement.
HLF conceived and planned the work. HLF, LMC, and KL collected and analyzed the data. FS and UD carried out the simulations. LMC took the lead in writing the manuscript and creating the figures. All the authors provided critical feedback and helped shape the research, analysis, and manuscript.
The authors declare that they have no conflict of interest.
We would like to thank the captain and the crew of R/V Skagerak. We acknowledge Git Klintvik Ahlberg for the assistance in the laboratory, Yasmin Bokhari Friberg and Åsa Wallin for the help with the grain-size analysis, and Guillaume Fontorbe for help with the age model.
The SHARK data collection is funded by the Swedish Environmental Protection Agency. This research has been supported by the Swedish Research Council, FORMAS (grant nos. 2012-2140 and 217-2010-126), the Royal Physiographic Society, and the Oscar and Lili Lamm Foundation.
This paper was edited by Markus Kienast and reviewed by two anonymous referees.
Alve, E.: Opportunistic features of the foraminifer Stainforthia fusiformis (Williamson): evidence from Frierfjord, Norway, J. Micropalaeontol., 13, 24–24, https://doi.org/10.1144/jm.13.1.24, 1994.
Andersson, P., Håkansson, B., Håkansson, J., and Sahlsten, E.: SMHI Report: Marine Acidification – On Effects and Monitoring of Marine Acidification in the Seas Surrounding Sweden, Report Oceanography No. 92, 2008.
Appleby, P. G.: Chronostratigraphic techniques in recent sediments, in: Tracking Environmental Change Using Lake Sediments, edited by: Last, W. M. and Smol, J. P., Vol. 1, Springer Netherlands, 2001.
Asteman, I. P. and Schönfeld, J.: Recent invasion of the foraminifer Nonionella stella Cushman & Moyer, 1930 in northern European waters: evidence from the Skagerrak and its fjords, J. Micropalaeontol., 35, 20–25, https://doi.org/10.1144/jmpaleo2015-007, 2016.
Bergsten, H., Nordberg, K., and Malmgren, B.: Recent benthic foraminifera as tracers of water masses along a transect in the Skagerrak, North-Eastern North Sea, J. Sea Res., 35, 111–121, https://doi.org/10.1016/S1385-1101(96)90740-6, 1996.
Bergström, S. and Carlsson, B.: River runoff to the Baltic Sea – 1950–1990, Ambio, 23, 280–287, 1994.
Berkeley, A., Perry, C. T., Smithers, S. G., Horton, B. P., and Taylor, K. G.: A review of the ecological and taphonomic controls on foraminiferal assemblage development in intertidal environments, Earth-Sci. Rev., 83, 205–230, https://doi.org/10.1016/j.earscirev.2007.04.003, 2007.
Bernhard, J. M., Sen Gupta, B. K., and Borne, P. F.: Benthic foraminiferal proxy to estimate dysoxic bottom-water oxygen concentrations; Santa Barbara Basin, U.S. Pacific continental margin, J. Foramin. Res., 27, 301–310, https://doi.org/10.2113/gsjfr.27.4.301, 1997.
Bird, C., Schweizer, M., Roberts, A., Austin, W. E. N., Knudsen, K. L., Evans, K. M., Filipsson, H. L., Sayer, M. D. J., Geslin, E., and Darling, K. F.: The genetic diversity, morphology, biogeography, and taxonomic designations of Ammonia (Foraminifera) in the Northeast Atlantic, Mar. Micropaleontol., https://doi.org/10.1016/j.marmicro.2019.02.001, in press, 2019.
Borg, H. and Jonsson, P.: Large-scale metal distribution in Baltic Sea sediments, Mar. Pollut. Bull., 32, 8–21, https://doi.org/10.1016/0025-326X(95)00103-T, 1996.
Brodie, C. R., Leng, M. J., Casford, J. S. L., Kendrick, C. P., Lloyd, J. M., Yongqiang, Z., and Bird, M. I.: Evidence for bias in C and N concentrations and δ13C composition of terrestrial and aquatic organic materials due to pre-analysis acid preparation methods, Chem. Geol., 282, 67–83, https://doi.org/10.1016/j.chemgeo.2011.01.007, 2011.
Carstensen, J., Conley, D. J., Andersen, J. H., and Ærtebjerg, G.: Coastal eutrophication and trend reversal: A Danish case study, Limno. Oceanogr., 51, 398–408, https://doi.org/10.4319/lo.2006.51.1_part_2.0398, 2006.
Cesbron, F., Geslin, E., Jorissen, F. J., Delgard, M. L., Charrieau, L., Deflandre, B., Jézéquel, D., Anschutz, P., and Metzger, E.: Vertical distribution and respiration rates of benthic foraminifera: Contribution to aerobic remineralization in intertidal mudflats covered by Zostera noltei meadows, Estuar. Coast. Shelf Sci., 179, 23–38, https://doi.org/10.1016/j.ecss.2015.12.005, 2016.
Charrieau, L. M., Filipsson, H. L., Ljung, K., Chierici, M., Knudsen, K. L., and Kritzberg, E.: The effects of multiple stressors on the distribution of coastal benthic foraminifera: A case study from the Skagerrak-Baltic Sea region, Mar. Micropaleontol., 139, 42–56, https://doi.org/10.1016/j.marmicro.2017.11.004, 2018.
Christiansen, C., Kunzendorf, H., Laima, M. J. C., Lund-Hansen, L. C., and Pedersen, A. M.: Recent changes in environmental conditions in the southwestern Kattegat, Scandinavia, NGU Bull., 430, 137–144, 1996.
Conley, D. J., Cartensen, J., Ærtebjerg, G., Christensen, P. B., Dalsgaard, T., Hansen, J. L. S., and Josefson, A. B.: Long-term changes and impacts of hypoxia in Danish coastal waters, Ecol. Appl., 17, S16584, https://doi.org/10.1890/05-0766.1, 2007.
Conley, D. J., Carstensen, J., Aigars, J., Axe, P., Bonsdorff, E., Eremina, T., Haahti, B.-M., Humborg, C., Jonsson, P., Kotta, J., Lännegren, C., Larsson, U., Maximov, A., Medina, M. R., Lysiak-Pastuszak, E., Remeikaitė-Nikienė, N., Walve, J., Wilhelms, S., and Zillén, L.: Hypoxia is increasing in the coastal zone of the Baltic Sea, Environ. Sci. Technol., 45, 6777–6783, https://doi.org/10.1021/es201212r, 2011.
Conradsen, K., Bergsten, H., Knudsen, K. L., Nordberg, K., and Seidenkrantz, M.-S.: Recent benthic foraminiferal distribution in the Kattegat and the Skagerrak, Scandinavia, Cushman Foundation Special Publication No. 32, 5368, 1994.
Cutshall, N. H., Larsen, I. L., and Olsen, C. R.: Direct analysis of 210Pb in sediment samples: Self-absorption corrections, Nuc. Instrum. Methods, 206, 309–312, https://doi.org/10.1016/0167-5087(83)91273-5, 1983.
Daewel, U. and Schrum, C.: Simulating long-term dynamics of the coupled North Sea and Baltic Sea ecosystem with ECOSMO II: Model description and validation, J. Mar. Syst., 119–120, 30–49, https://doi.org/10.1016/j.jmarsys.2013.03.008, 2013.
Daewel, U. and Schrum, C.: Low-frequency variability in North Sea and Baltic Sea identified through simulations with the 3-D coupled physical–biogeochemical model ECOSMO, Earth Syst. Dynam., 8, 801–815, https://doi.org/10.5194/esd-8-801-2017, 2017.
Darling, K. F., Schweizer, M., Knudsen, K. L., Evans, K. M., Bird, C., Roberts, A., Filipsson, H. L., Kim, J.-H., Gudmundsson, G., Wade, C. M., Sayer, M. D. J., and Austin, W. E. N.: The genetic diversity, phylogeography and morphology of Elphidiidae (Foraminifera) in the Northeast Atlantic, Mar. Micropaleontol., 129, 1–23, https://doi.org/10.1016/j.marmicro.2016.09.001, 2016.
Deldicq, N., Alve, E., Schweizer, M., Polovodova Asteman, I., Hess, S., Darling, K., and Bouchet, V.: History of the introduction of a species resembling the benthic foraminifera Nonionella stella in the Oslofjord (Norway): morphological, molecular and paleo-ecological evidences, Aquat. Invas., 14, 182–205, https://doi.org/10.3391/ai.2019.14.2.03, 2019.
Ellis, B. F. and Messina, A. R.: Catalogue of Foraminifera, New York, Micropaleontology Press, The American Museum of Natural History, 1942.
Erbs-Hansen, D. R., Knudsen, K. L., Gary, A. C., Gyllencreutz, R., and Jansen, E.: Holocene climatic development in Skagerrak, Eastern North Atlantic: Foraminiferal and stable isotopic evidence, The Holocene, 22, 301–312, https://doi.org/10.1177/0959683611423689, 2012.
Feyling-Hanssen, R. W.: Foraminifera in Late Quaternary Deposits from the Oslofjord Area, Vol. 225 of Skrifter (Norges geologiske undersøkelse), Universitetsforlaget, 1964.
Feyling-Hanssen, R. W.: The Foraminifer Elphidium excavatum (Terquem) and its variant forms, Micropaleontology, 18, 337–354, https://doi.org/10.2307/1485012, 1972.
Feyling-Hanssen, R. W., Jørgensen, J. A., Knudsen, K. L., and Andersen, A.-L. L.: Late Quaternary Foraminifera from Vendsyssel, Denmark and Sandnes, Norway, Bull. Geol. Soc. Denmark, Dansk geologisk forening, 21, 67317, 1971.
Filipsson, H. L. and Nordberg, K.: Climate variations, an overlooked factor influencing the recent marine environment. An example from Gullmar Fjord, Sweden, illustrated by benthic foraminifera and hydrographic data, Estuaries, 27, 867–881, https://doi.org/10.1007/BF02912048, 2004a.
Filipsson, H. L. and Nordberg, K.: A 200-year environmental record of a low-oxygen fjord, Sweden, elucidated by benthic foraminifera, sediment characteristics and hydrographic data, J. Foramin. Res., 34, 277–293, https://doi.org/10.2113/34.4.277, 2004. 2004b.
Geslin, E., Debenay, J.-P., Duleba, W., and Bonetti, C.: Morphological abnormalities of foraminiferal tests in Brazilian environments: comparison between polluted and non-polluted areas, Mar. Micropaleontol., 45, 151–168, https://doi.org/10.1016/S0377-8398(01)00042-1, 2002.
Göransson, P.: Changes of benthic fauna in the Kattegat – An indication of climate change at mid-latitudes?, Estuar. Coast. Shelf Sci., 194, 276–285, https://doi.org/10.1016/j.ecss.2017.06.034, 2017.
Göransson, P., Angantyr, L. A., Hansen, J. B., Larsen, G., and Bjerre, F.: Öresunds bottenfauna, Öresundsvattensamarbetet, 57 pp., 2002.
Groeneveld, J., Filipsson, H. L., Austin, W. E. N., Darling, K., McCarthy, D., Quintana Krupinski, N. B., Bird, C., and Schweizer, M.: Assessing proxy signatures of temperature, salinity, and hypoxia in the Baltic Sea through foraminifera-based geochemistry and faunal assemblages, J. Micropalaeontol., 37, 403–429, https://doi.org/10.5194/jm-37-403-2018, 2018.
Gustafsson, B. G., Schenk, F., Blenckner, T., Eilola, K., Meier, H. E. M., Müller-Karulis, B., Neumann, T., Ruoho-Airola, T., Savchuk, O. P., and Zorita, E.: Reconstructing the development of Baltic Sea eutrophication 1850–2006, Ambio, 41, 534–548, https://doi.org/10.1007/s13280-012-0318-x, 2012.
Hammer, Ø., Harper, D. A. T., and Ryan, P. D.: PAST: Paleontological statistics software package for education and data analysis, Palaeontol. Electron., 4, 9 pp., 2001.
Hansen, H. J.: On the sedimentology and the quantitative distribution of living foraminifera in the northern part of the Øresund, Ophelia, 2, 323–331, https://doi.org/10.1080/00785326.1965.10409608, 1965.
HELCOM: Eutrophication in the Baltic Sea – An integrated thematic assessment of the effects of nutrient enrichment and eutrophication in the Baltic Sea region, Balt. Sea Environ. Proc. B, 115, 152 pp., 2009.
Henriksson, R.: The bottom fauna in polluted areas of the Sound, Oikos, 19, 11125, https://doi.org/10.2307/3564736, 1968.
Henriksson, R.: Influence of pollution on the bottom fauna of the Sound (Öresund), Oikos, 20, 507–523, https://doi.org/10.2307/3543212, 1969.
Hermelin, J. O. R.: Distribution of Holocene benthic foraminifera in the Baltic Sea, J. Foramin. Res., 17, 62–73, https://doi.org/10.2113/gsjfr.17.1.62, 1987.
Heron-Allen, E. and Earland, A.: On the recent and fossil foraminifera of the shore-sands of Selsey Bill, Sussex, Journal of the Royal Microscopical Society, 436–448, https://www.biodiversitylibrary.org/item/18914#page/516/mode/1up (last access: 27 September 2019), 1911.
ICES: Integrated Ecosystem Assessments of Seven Baltic Sea Areas Covering the Last Three Decades, International council for the exploration of the sea, cooperative research report No. 302, 2010.
Jarke, J.: Beobachtungen über Kalkauflösung an Schalen von Mikrofossilien in Sedimenten der westlichen Ostsee, Deutsche Hydrografische Zeitschrift, 14, 6–11, https://doi.org/10.1007/BF02226819, 1961.
Jones, P. D., Jonsson, T., and Wheeler, D.: Extension to the North Atlantic oscillation using early instrumental pressure observations from Gibraltar and South-West Iceland, Int. J. Climatol., 17, 1433–1450, https://doi.org/10.1002/(SICI)1097-0088(19971115)17:13<1433::AID-JOC203>3.0.CO;2-P, 1997.
Krebs, C. J.: Ecological Methodology, 2nd Edn., University of British Colombia, Pearson, 624 pp., 1998.
Lehmann, A. and Post, P.: Variability of atmospheric circulation patterns associated with large volume changes of the Baltic Sea, Adv. Sci. Res., 12, 219–225, https://doi.org/10.5194/asr-12-219-2015, 2015.
Lehmann, A., Höflich, K., Post, P., and Myrberg, K.: Pathways of deep cyclones associated with large volume changes (LVCs) and major Baltic inflows (MBIs), J. Mar. Syst., 167, 11–18, https://doi.org/10.1016/j.jmarsys.2016.10.014, 2017.
Leppäranta, M. and Myrberg, K.: Physical Oceanography of the Baltic Sea, Berlin, Heidelberg, Springer Berlin Heidelberg, 378 pp., 2009.
Loeblich, A. R. and Tappan, H.: Part C, Protista 2, Sarcodina, Chiefly “Thecamoebians” and Foraminiferida, in: Treatise on Invertebrate Paleontology, edited by: Moore, R. C., The Geological Society of America and the University of Kansas, 900 pp., 1964.
Lumborg, U.: Modelling the deposition, erosion, and flux of cohesive sediment through Øresund, J. Mar. Syst., 56, 179–193, https://doi.org/10.1016/j.jmarsys.2004.11.003, 2005.
Martin, R. E.: Taphonomy and temporal resolution of foraminiferal assemblages, in: Modern Foraminifera, 28198, Springer Netherlands, https://doi.org/10.1007/0-306-48104-9_16, 1999.
Murray, J. W.: Ecology and Applications of Benthic Foraminifera, Cambridge University Press, 426 pp., 2006.
Murray, J. W. and Alve, E.: The distribution of agglutinated foraminifera in NW European seas: Baseline data for the interpretation of fossil assemblages, Palaeontol. Electron., 14, 41 pp., 2011.
Murray, J. W. and Alve, E.: Taphonomic experiments on marginal marine foraminiferal assemblages: how much ecological information is preserved?, Palaeogeogr. Palaeocl., 149, 183–197, https://doi.org/10.1016/S0031-0182(98)00200-4, 1999.
Nausch, G., Nehring, D., and Aertebjerg, G.: Anthropogenic nutrient load of the Baltic Sea, Limnologica – Ecology and Management of Inland Waters, 29, 233–241, https://doi.org/10.1016/S0075-9511(99)80007-3, 1999.
Nielsen, M. H.: Evidence for internal hydraulic control in the northern Øresund, J. Geophys. Res., 106, 14055–14068, https://doi.org/10.1029/2000JC900162, 2001.
Nordberg, K., Gustafsson, M., and Krantz, A.-L.: Decreasing oxygen concentrations in the Gullmar Fjord, Sweden, as confirmed by benthic foraminifera, and the possible association with NAO, J. Mar. Syst., 23, 303–316, https://doi.org/10.1016/S0924-7963(99)00067-6, 2000.
Otto, G. H.: Comparative tests of several methods of sampling heavy mineral concentrates, J. Sediment. Res., 3, 3039, https://doi.org/10.1306/D4268E3C-2B26-11D7-8648000102C1865D, 1933.
Patterson, R. T. and Fishbein, E.: Re-examination of the statistical methods used to determine the number of point counts needed for micropaleontological quantitative research, J. Paleontol., 63, 245–248, 1989.
Piña-Ochoa, E., Høgslund, S., Geslin, E., Cedhagen, T., Revsbech, N. P., Nielsen, L. P., Schweizer, M., Jorissen, F., Rysgaard, S., and Risgaard-Petersen, N.: Widespread occurrence of nitrate storage and denitrification among Foraminifera and Gromiida, P. Natl. Acad. Sci. USA, 107, 1148–1153, https://doi.org/10.1073/pnas.0908440107, 2010.
Polovodova Asteman, I. and Nordberg, K.: Foraminiferal fauna from a deep basin in Gullmar Fjord: The influence of seasonal hypoxia and North Atlantic Oscillation, J. Sea Res., 79, 40–49, https://doi.org/10.1016/j.seares.2013.02.001, 2013.
Polovodova Asteman, I., Hanslik, D., and Nordberg, K.: An almost completed pollution-recovery cycle reflected by sediment geochemistry and benthic foraminiferal assemblages in a Swedish-Norwegian Skagerrak fjord, Mar. Pollut. Bull., 95, 126–140, https://doi.org/10.1016/j.marpolbul.2015.04.031, 2015.
Rosenberg, R., Cato, I., Förlin, L., Grip, K., and Rodhe, J.: Marine environment quality assessment of the Skagerrak – Kattegat, J. Sea Res., 35, 1–8, https://doi.org/10.1016/S1385-1101(96)90730-3, 1996.
Rydberg, L., Ærtebjerg, G., and Edler, L.: Fifty years of primary production measurements in the Baltic entrance region, trends and variability in relation to land-based input of nutrients, J. Sea Res., 56, 1–16, https://doi.org/10.1016/j.seares.2006.03.009, 2006.
Sayin, E. and Krauß, W.: A numerical study of the water exchange through the Danish Straits, Tellus, 48, 324–341, https://doi.org/10.1034/j.1600-0870.1996.t01-1-00009.x, 1996.
Schenk, F.: The analog-method as statistical upscaling tool for meteorological field reconstructions over Northern Europe since 1850, Dissertation, University of Hamburg, available at: http://ediss.sub.uni-hamburg.de/volltexte/2015/7156/, last access: 3 February 2015.
Schenk, F.: The long-term dataset of high resolution atmospheric forcing fields (HiResAFF) for Northern Europe since 1850, World Data Center for Climate (WDCC) at DKRZ, https://doi.org/10.1594/WDCC/HiResAFF, 2017.
Schenk, F. and Zorita, E.: Reconstruction of high resolution atmospheric fields for Northern Europe using analog-upscaling, Clim. Past, 8, 1681–1703, https://doi.org/10.5194/cp-8-1681-2012, 2012.
Seidenkrantz, M.-S.: Subrecent changes in the foraminiferal distribution in the Kattegat and the Skagerrak, Scandinavia: Anthropogenic influence and natural causes, Boreas, 22, 383–395, https://doi.org/10.1111/j.1502-3885.1993.tb00201.x, 1993.
Sen Gupta, B. K.: Foraminifera in marginal marine environments, in: Modern Foraminifera, 14159, Springer Netherlands, https://doi.org/10.1007/0-306-48104-9_9, 1999a.
Sen Gupta, B. K.: Modern Foraminifera, Springer Science & Business Media, 368 pp., 1999b.
She, J., Berg, P., and Berg, J.: Bathymetry impacts on water exchange modelling through the Danish Straits, Journal of Marine Systems, Marine Environmental Monitoring and Prediction, 65, 450–459, https://doi.org/10.1016/j.jmarsys.2006.01.017, 2007.
Tappan, H. and Loeblich, A. R.: Foraminiferal evolution, diversification, and extinction, J. Paleontol., 62, 695–714, https://www.jstor.org/stable/1305391 (last access: 27 September 2019), 1988.
Wesslander, K., Andersson, L., Axe, P., Johansson, J., Linders, J., Nixelius, N., and Skjevik, A.-T.: SMHI Report: Swedish national report on eutrophication status in the Skagerrak, Kattegat and the Sound, Report Oceanography No. 54, 160 pp., 2016.
Yanko, V., Arnold, A. J., and Parker, W. C.: Effects of marine pollution on benthic foraminifera, in: Modern Foraminifera, 21735, Springer Netherlands, https://doi.org/10.1007/0-306-48104-9_13, 1999.